
An Application of the DHI Methodology for a Comparison of SARS-CoV-2 Epidemic Hazards in Customer Delivery Services of Smart Cities


Abstract
:1. Introduction
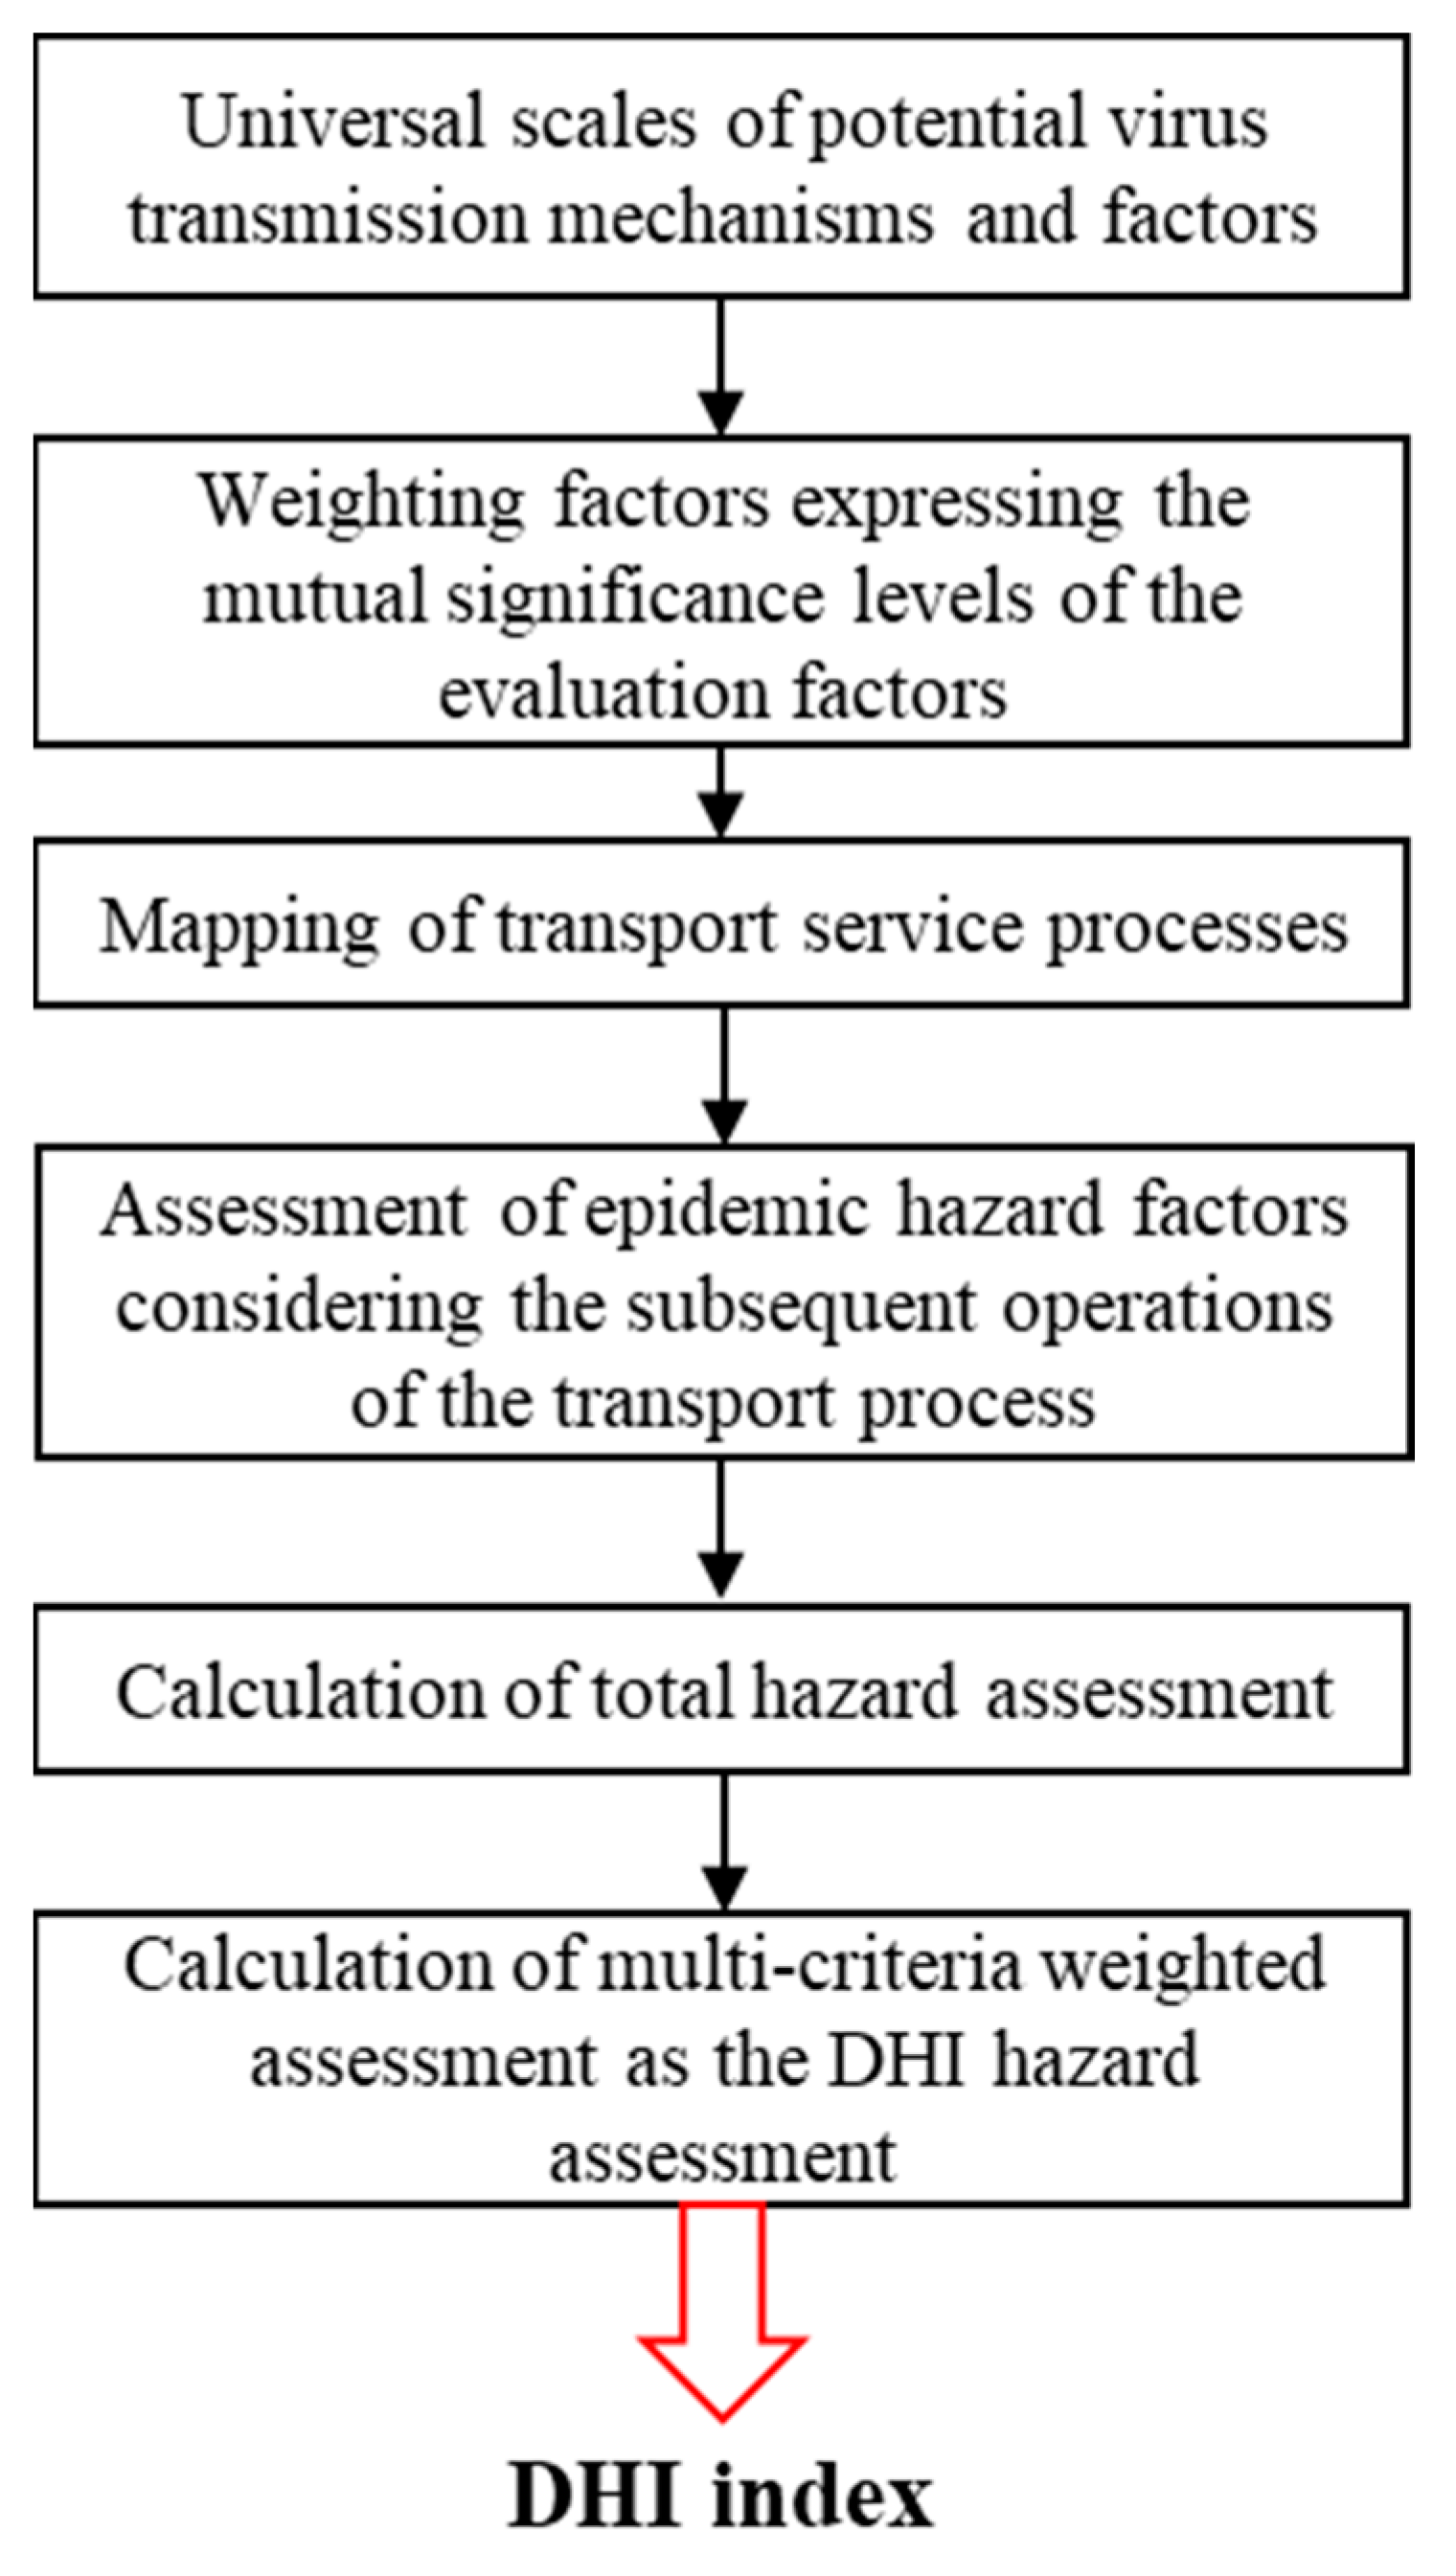
2. Materials and Methods
- −
- development of universal scales to evaluate potential virus transmission mechanisms and factors,
- −
- calculation of weighting factors expressing the mutual significance levels of the evaluation factors,
- −
- algorithm of transport service processes,
- −
- identification and assessment (score) of epidemic hazard factors considering the subsequent operations of the transport process,
- −
- calculation of total hazard assessment (score),
- −
- calculation of multi-criteria weighted assessment as the DHI hazard assessment.
3. Results
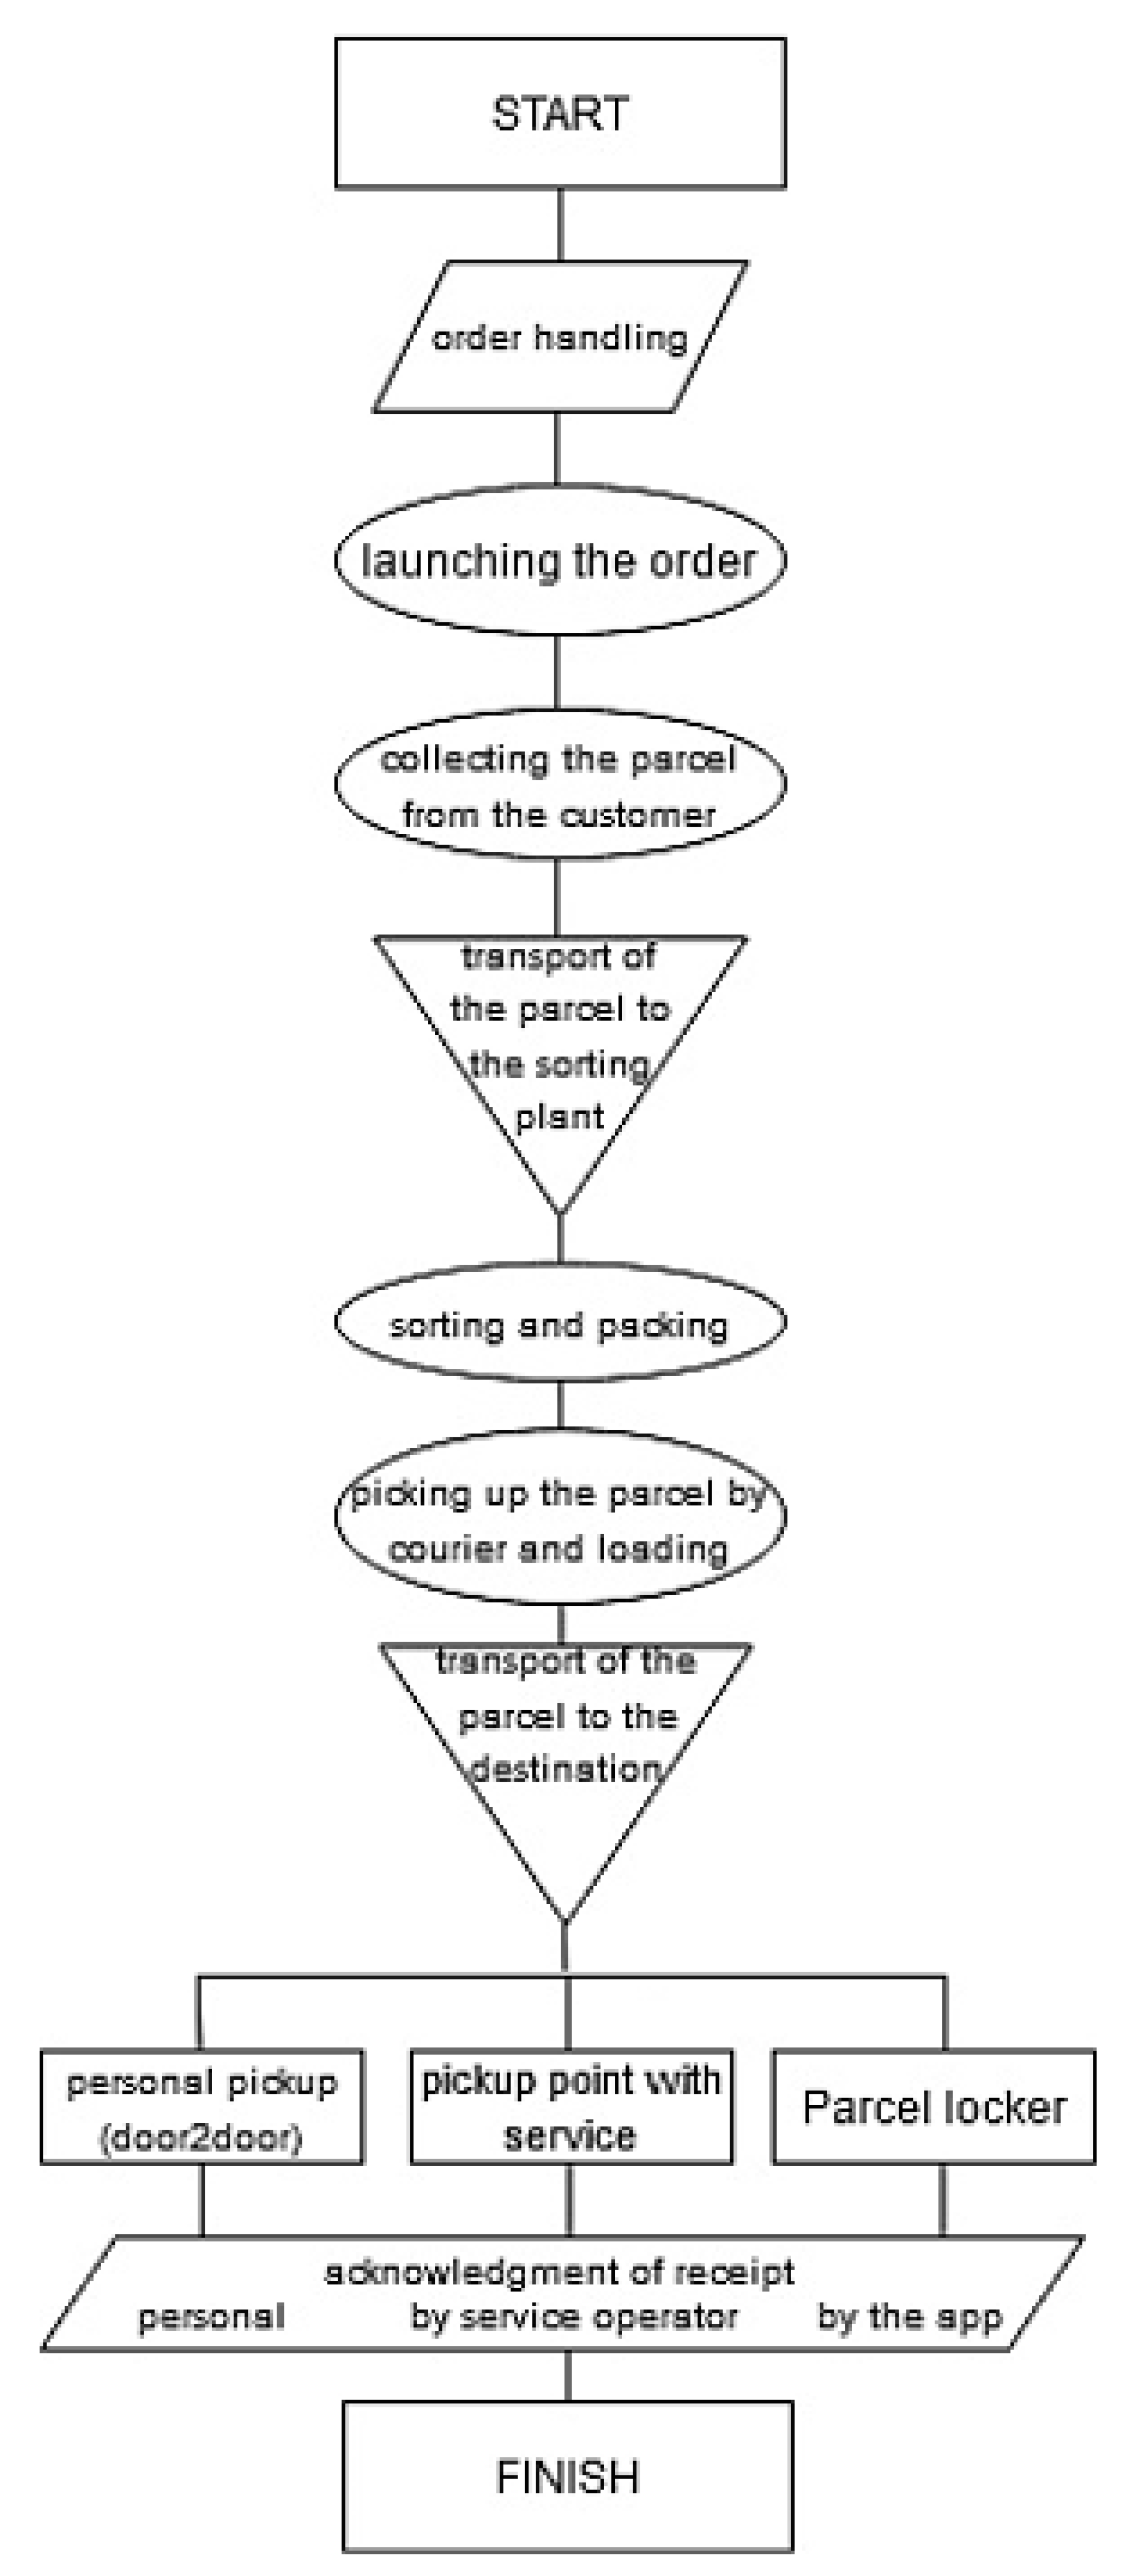
3.1. Case Study on Courier Parcel Services
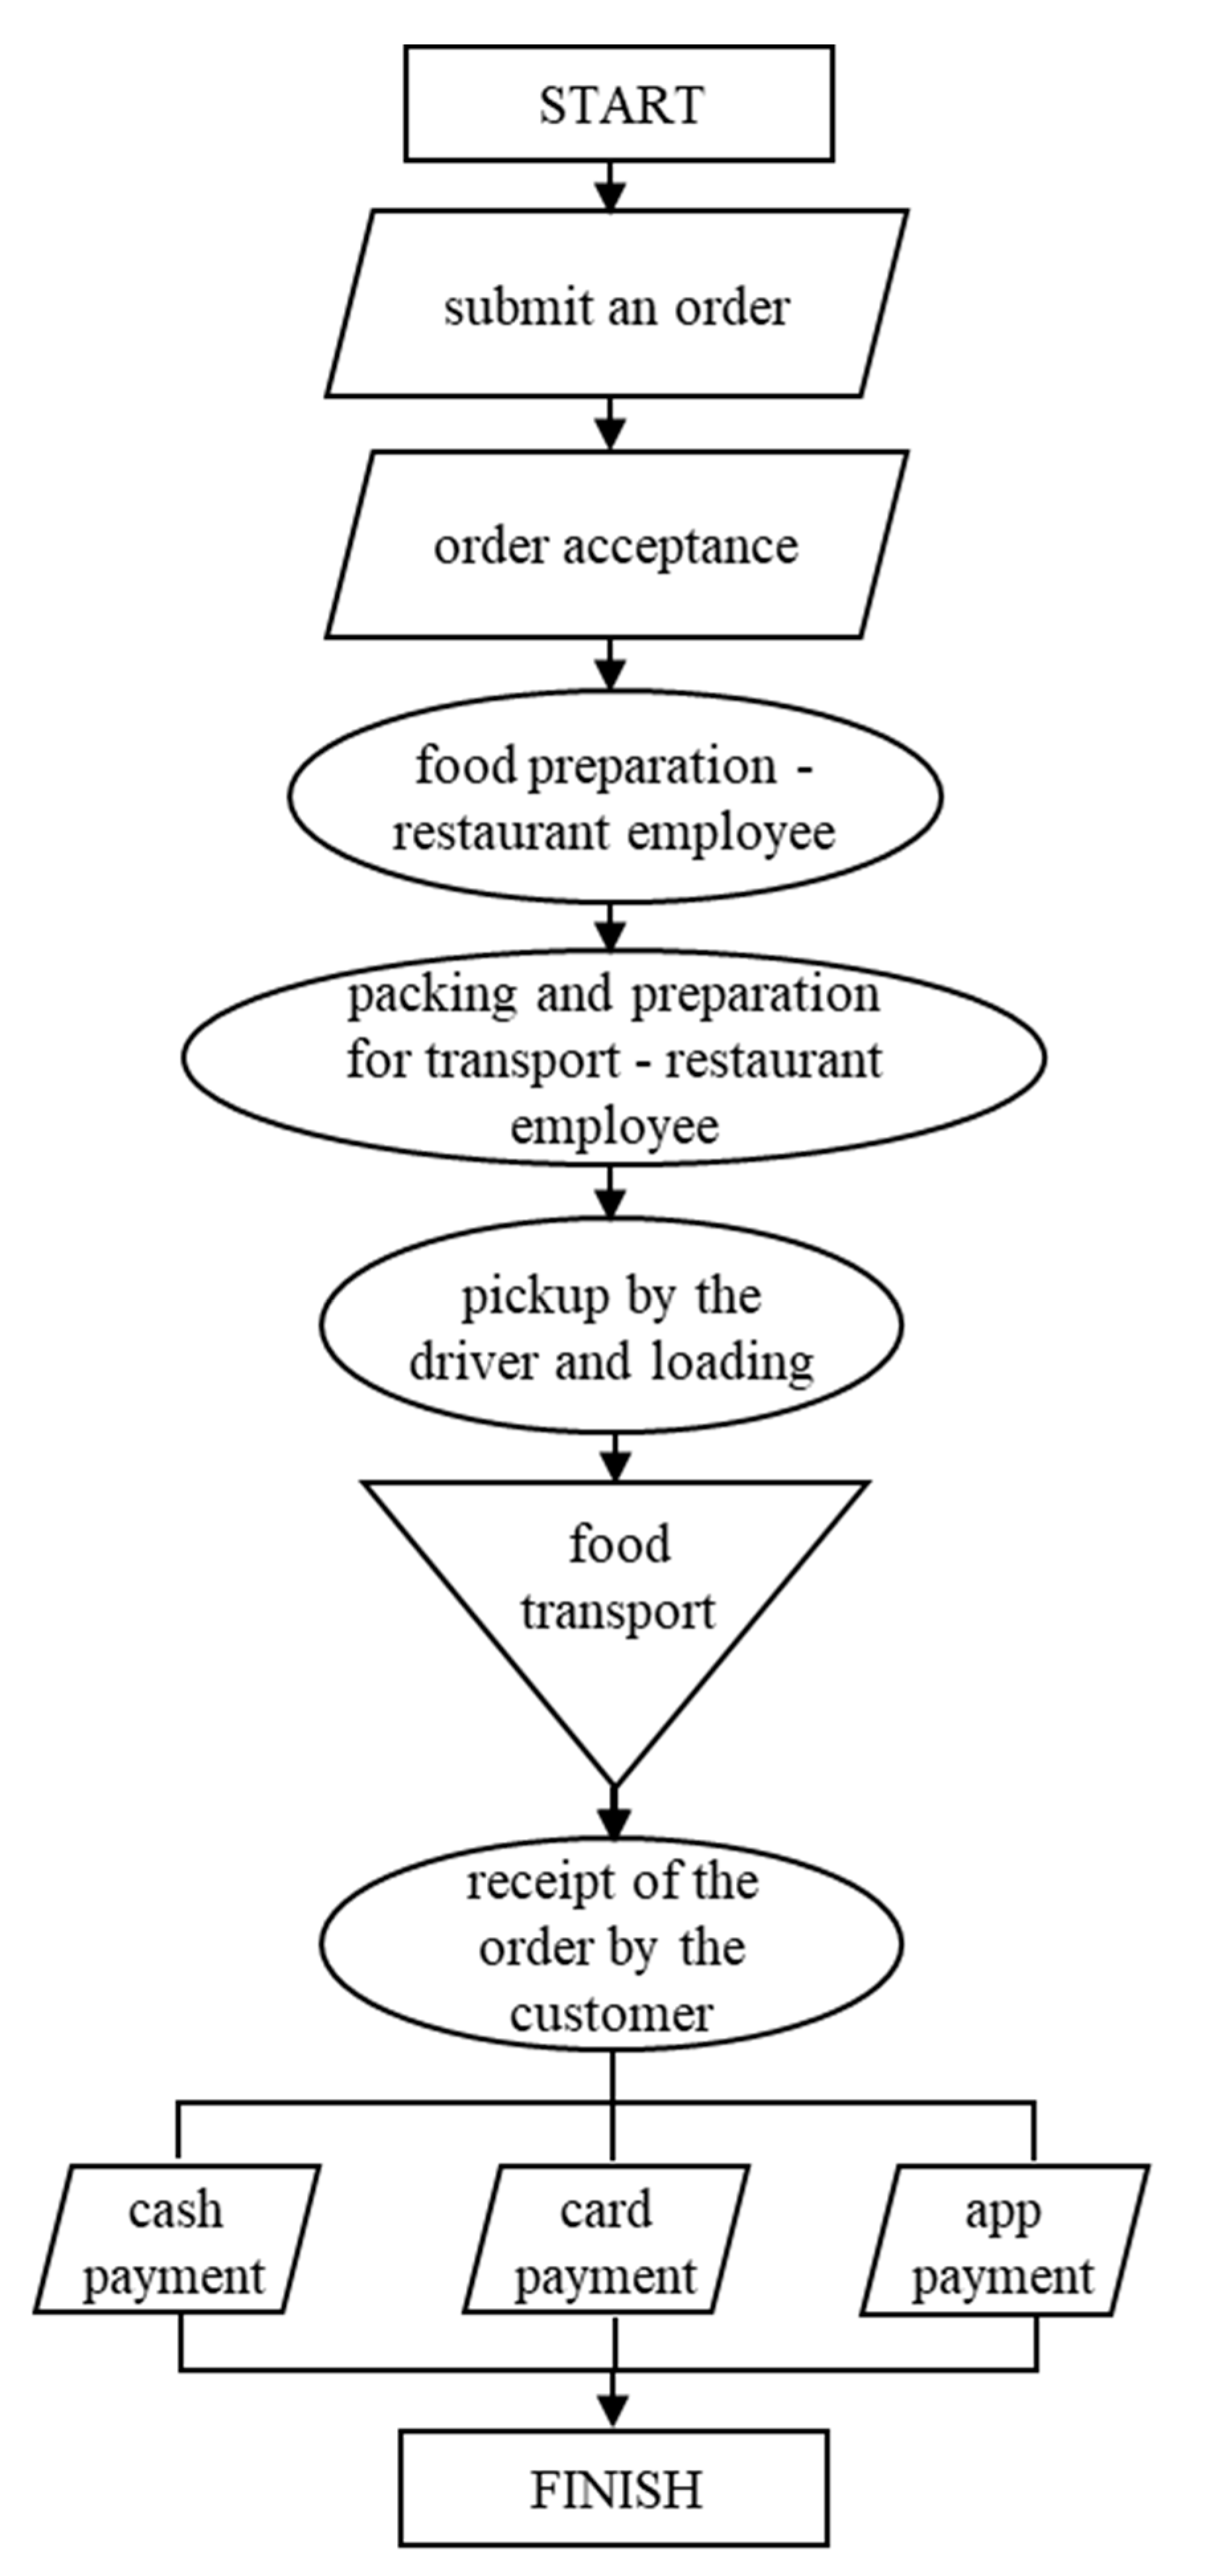
3.2. Case Study on Catering Delivery
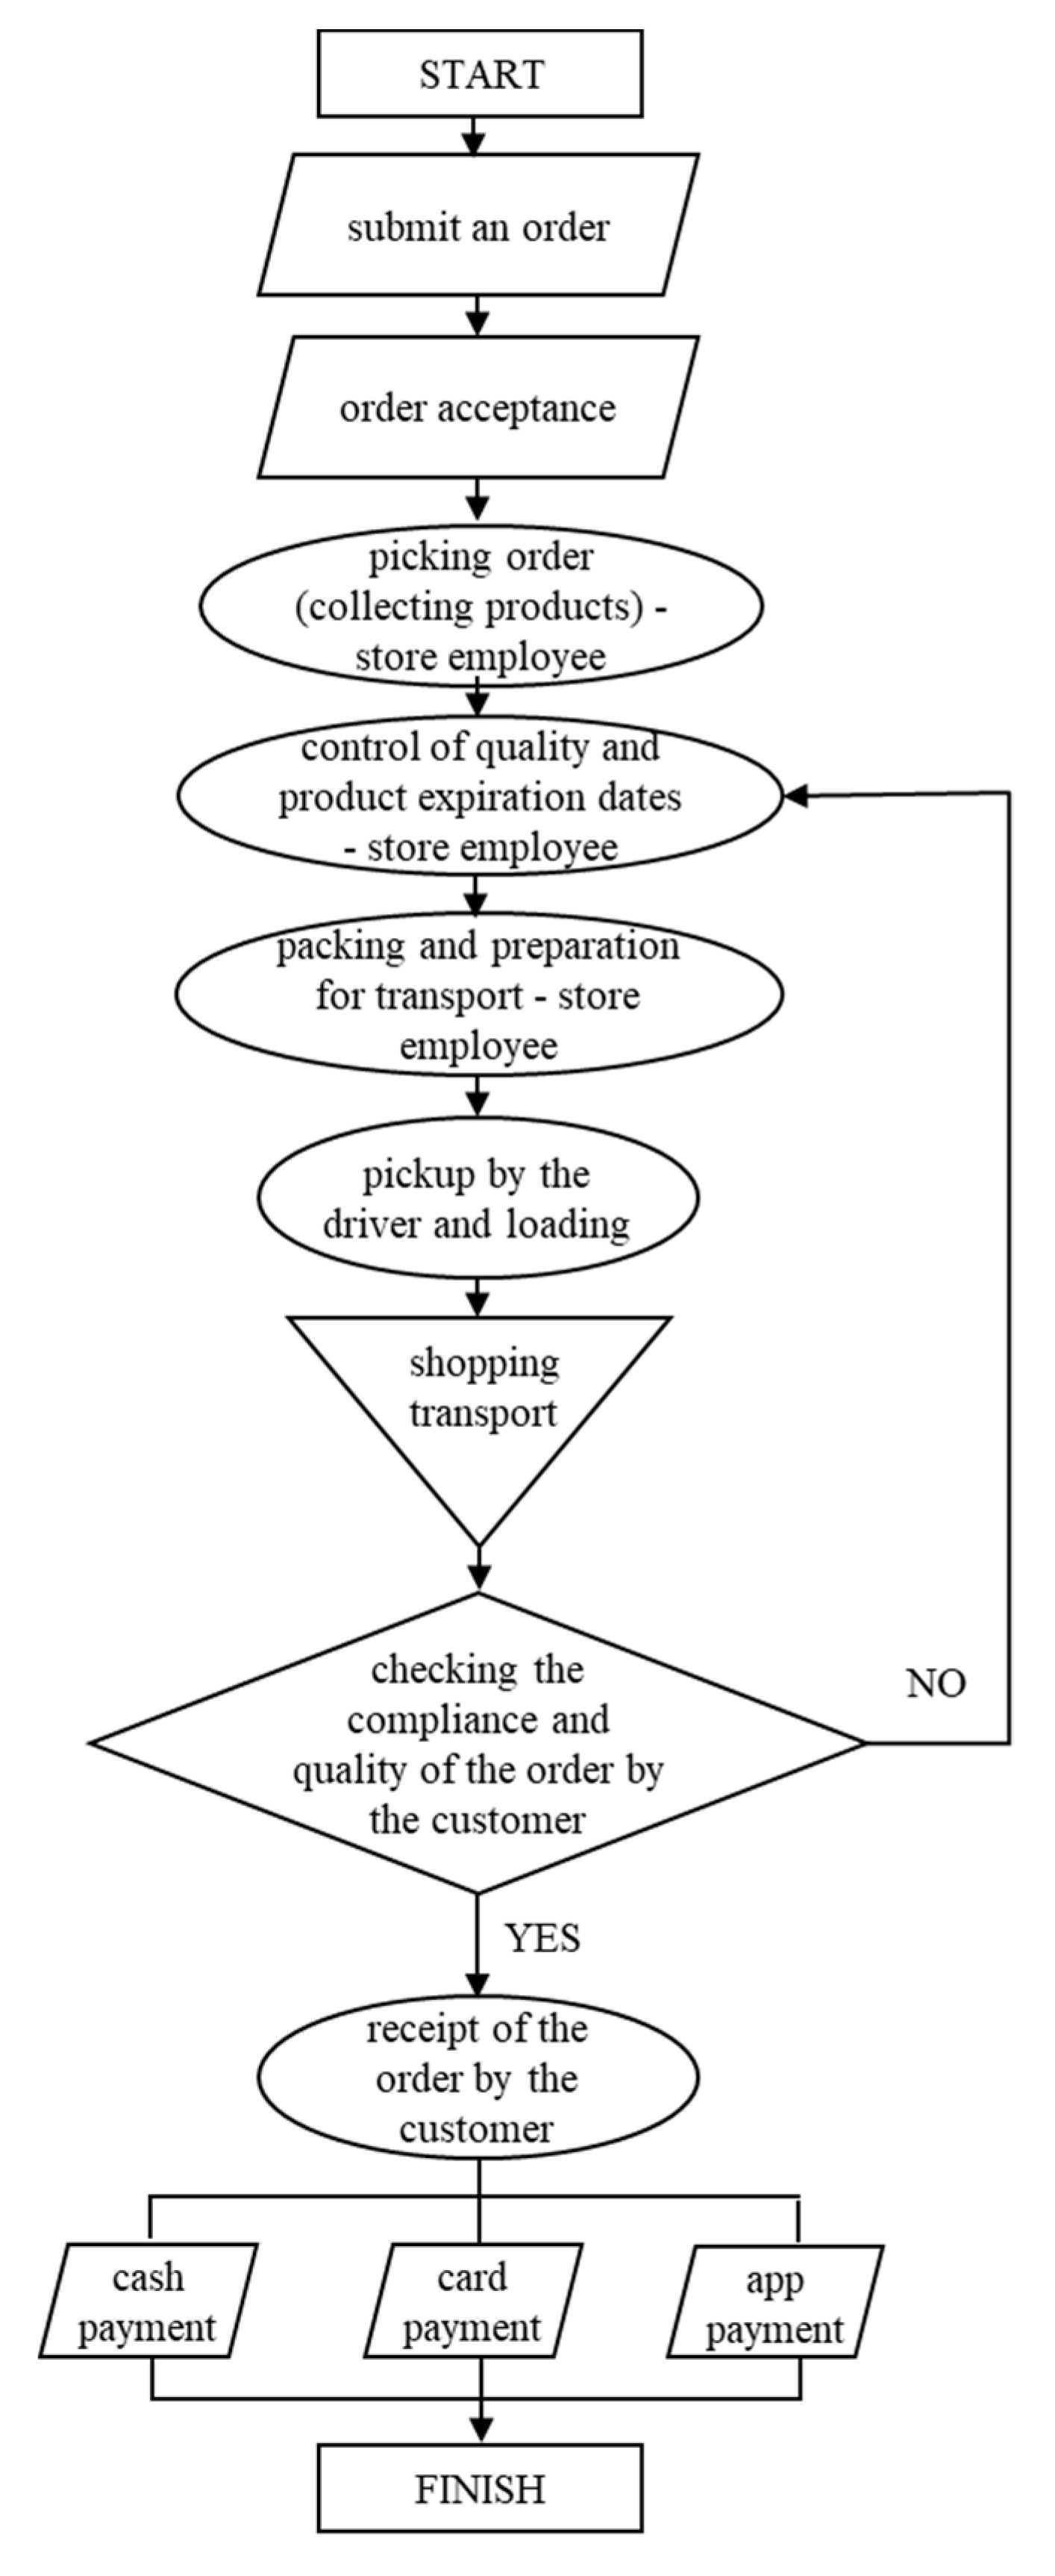
3.3. Case Study on Shopping Delivery
4. Discussion
5. Conclusions
Supplementary Materials
Funding
Data Availability Statement
Conflicts of Interest
References
- Kulisiewicz, T. Transformacja Miasta w Miasto Inteligentne–Wyzwania Dla Administracji Publicznej. Rocz. Kol. Anal. Ekon. /Szkoła Główna Handlowa 2019, 56, 133–147. [Google Scholar]
- Zysińska, M.; Krysiuk, C.; Zakrzewski, B. Smart Cities with Respect to Intelligent Transportation Systems. Logistyka 2014, 6, 11969–11982. [Google Scholar]
- Deuszkiewicz, P.; Dziurdź, J.; Fabiś, P. Modeling the Influence of Engine Dynamics on Its Indicator Diagram. Sensors 2021, 21, 7885. [Google Scholar] [CrossRef] [PubMed]
- Mrowicki, A.; Krukowski, M.; Turoboś, F.; Kubiak, P. Determining Vehicle Pre-Crash Speed in Frontal Barrier Crashes Using Artificial Neural Network for Intermediate Car Class. Forensic. Sci. Int. 2020, 308, 110179. [Google Scholar] [CrossRef]
- Xie, C.; Wang, Y.; Zhu, H.; Wang, J.; Cui, L.; Cao, M. Nonlinear Dynamic Behavior Analysis of Bridge Pier Impacted by a Moving Barge. J. Meas. Eng. 2022, 10, 140–149. [Google Scholar] [CrossRef]
- Paluch, W.; Klaczynski, M. Analysis of Acoustic Propagation of Automotive Cooler during Run up and Run Down. Diagnostyka 2021, 22, 3–8. [Google Scholar] [CrossRef]
- Graba, M.; Bieniek, A.; Prażnowski, K.; Hennek, K.; Mamala, J.; Burdzik, R.; Śmieja, M. Analysis of Energy Efficiency and Dynamics during Car Acceleration. Eksploat. I Niezawodn. Maint. Reliab. 2023, 25. [Google Scholar] [CrossRef]
- Jiang, J.C.; Kantarci, B.; Oktug, S.; Soyata, T. Federated Learning in Smart City Sensing: Challenges and Opportunities. Sensors 2020, 20, 6230. [Google Scholar] [CrossRef]
- Paś, J.; Rosiński, A.; Wetoszka, P.; Białek, K.; Klimczak, T.; Siergiejczyk, M. Assessment of the Impact of Emitted Radiated Interference Generated by a Selected Rail Traction Unit on the Operating Process of Trackside Video Monitoring Systems. Electronics 2022, 11, 2554. [Google Scholar] [CrossRef]
- Toma, C.; Alexandru, A.; Popa, M.; Zamfiroiu, A. IoT Solution for Smart Cities’ Pollution Monitoring and the Security Challenges. Sensors 2019, 19, 3401. [Google Scholar] [CrossRef] [Green Version]
- Damadam, S.; Zourbakhsh, M.; Javidan, R.; Faroughi, A. An Intelligent IoT Based Traffic Light Management System: Deep Reinforcement Learning. Smart Cities 2022, 5, 1293–1311. [Google Scholar] [CrossRef]
- Al-Turjman, F.; Lemayian, J.P. Intelligence, Security, and Vehicular Sensor Networks in Internet of Things (IoT)-Enabled Smart-Cities: An Overview. Comput. Electr. Eng. 2020, 87, 106776. [Google Scholar] [CrossRef]
- Zhang, H.; Babar, M.; Tariq, M.U.; Jan, M.A.; Menon, V.G.; Li, X. SafeCity: Toward Safe and Secured Data Management Design for IoT-Enabled Smart City Planning. IEEE Access 2020, 8, 145256–145267. [Google Scholar] [CrossRef]
- Rodas, J.; Azpeitia, D.; Ochoa-Zezzatti, A.; Camarena, R.; Olivier, T. Use of GVRP as a Model of Two Specific Real World Problems and Its Bioinspired Solution. In Handbook of Research on Military, Aeronautical, and Maritime Logistics and Operations; IGI Global: Hershey, PA, USA, 2016; pp. 451–469. [Google Scholar]
- Kaluarachchi, Y. Implementing Data-Driven Smart City Applications for Future Cities. Smart Cities 2022, 5, 455–474. [Google Scholar] [CrossRef]
- Mak, H.W.L. From COVID-19 Pandemic of Five Selected East Asian Cities to Assessment of Data Openness and Integration for Future City Development; Joint Lab on Future Cities (JLFC) Report No. 2; JLFC: Hong Kong, China, 2021. [Google Scholar]
- Benevolo, C.; Dameri, R.P.; D’Auria, B. Empowering Organizations. Lecture Notes in Information Systems and Organisation, Smart Mobility in Smart City; Torre, T., Braccini, A., Spinelli, R., Eds.; Springer: Cham, Switzerland, 2016; Volume 11, pp. 13–28. [Google Scholar] [CrossRef]
- Orlowski, A.; Romanowska, P. Smart Cities Concept: Smart Mobility Indicator. Cybern. Syst. 2019, 50, 118–131. [Google Scholar] [CrossRef]
- Dameri, R.P.; Benevolo, C.; Veglianti, E.; Li, Y. Understanding Smart Cities as a Glocal Strategy: A Comparison between Italy and China. Technol. Soc. Chang. 2019, 142, 26–41. [Google Scholar] [CrossRef]
- Chu, Z.; Cheng, M.; Yu, N.N. A Smart City Is a Less Polluted City. Technol. Soc. Chang. 2021, 172, 121037. [Google Scholar] [CrossRef]
- Gholizadeh, H.; Goh, M.; Fazlollahtabar, H.; Mamashli, Z. Modelling Uncertainty in Sustainable-Green Integrated Reverse Logistics Network Using Metaheuristics Optimization. Comput. Ind. Eng. 2022, 163, 107828. [Google Scholar] [CrossRef]
- Costa, D.G.; Peixoto, J.P.J. COVID-19 Pandemic: A Review of Smart Cities Initiatives to Face New Outbreaks. IET Smart Cities 2020, 2, 64–73. [Google Scholar] [CrossRef]
- Moreno, C.; Allam, Z.; Chabaud, D.; Gall, C.; Pratlong, F. Introducing the “15-Minute City”: Sustainability, Resilience and Place Identity in Future Post-Pandemic Cities. Smart Cities 2021, 4, 93–111. [Google Scholar] [CrossRef]
- Vodák, J.; Šulyová, D.; Kubina, M. Advanced Technologies and Their Use in Smart City Management. Sustainability 2021, 13, 5746. [Google Scholar] [CrossRef]
- Troisi, O.; Kashef, M.; Visvizi, A. Managing Safety and Security in the Smart City: Covid-19, Emergencies and Smart Surveillance. In Managing Smart Cities; Springer International Publishing: Cham, Switzerland, 2022; pp. 73–88. [Google Scholar]
- Kakderi, C.; Oikonomaki, E.; Papadaki, I. Smart and Resilient Urban Futures for Sustainability in the Post Covid-19 Era: A Review of Policy Responses on Urban Mobility. Sustainability 2021, 13, 6486. [Google Scholar] [CrossRef]
- Niewczas, A.; Mórawski, Ł.; Rymarz, J.; Dębicka, E.; Hołyszko, P. Operational Risk Assessment Model for City Buses. Eksploat. I Niezawodn. Maint. Reliab. 2023, 25. [Google Scholar] [CrossRef]
- Sharifi, A.; Khavarian-Garmsir, A.R. The COVID-19 Pandemic: Impacts on Cities and Major Lessons for Urban Planning, Design, and Management. Sci. Total Environ. 2020, 749, 142391. [Google Scholar] [CrossRef]
- Burdzik, R. Epidemic Risk Analysis and Assessment in Transport Services; CRC Press: New York, NY, USA, 2021; ISBN 9781003204732. [Google Scholar]
- Sharifi, A.; Khavarian-Garmsir, A.R.; Kummitha, R.K.R. Contributions of Smart City Solutions and Technologies to Resilience against the Covid-19 Pandemic: A Literature Review. Sustainability 2021, 13, 8018. [Google Scholar] [CrossRef]
- Saaty, T.L. Theory and Applications of the Analytic Network Process: Decision Making with Benefits, Opportunities, Costs, and Risks; RWS Publisher: Pittsburgh, PA, USA, 2005. [Google Scholar]
- Librantz, A.F.H.; dos Santos, F.C.R.; Dias, C.G.; da Cunha, A.C.A.; Costa, I.; de Mesquita Spinola, M. AHP Modelling and Sensitivity Analysis for Evaluating the Criticality of Software Programs. In Advances in Production Management Systems. Initiatives for a Sustainable World; IFIP Advances in Information and Communication Technology; Springer: Cham, Switzerland, 2016; Volume 488. [Google Scholar] [CrossRef] [Green Version]
- Nosal, K.; Solecka, K. Application of AHP Method for Multi-Criteria Evaluation of Variants of the Integration of Urban Public Transport. Transp. Res. Procedia 2014, 3, 269–278. [Google Scholar] [CrossRef] [Green Version]
- Chen, C.F. Applying the Analytical Hierarchy Process (AHP) Approach to Convention Site Selection. J. Travel Res. 2006, 45, 167–174. [Google Scholar] [CrossRef]
- Gompf, K.; Traverso, M.; Hetterich, J. Using Analytical Hierarchy Process (AHP) to Introduce Weights to Social Life Cycle Assessment of Mobility Services. Sustainability 2021, 13, 1258. [Google Scholar] [CrossRef]
- Chi, Y.L.; Mak, H.W.L. From Comparative and Statistical Assessments of Liveability and Health Conditions of Districts in Hong Kong towards Future City Development. Sustainability 2021, 13, 8781. [Google Scholar] [CrossRef]


| No | Hazard Factor |
|---|---|
| (1) | - social distance of contact with another person for the mechanism of infection by droplets |
| (2) | - the number of people per unit time who may touch the same surfaces as the means of transport for the infection by surface contact mechanism |
| (3) | - the time of exposure of the loads in the immediate vicinity of the potentially infected person |
| (4) | - methods of disinfecting the loads or the time of isolating the loads |
| (5) | - exposure time and number of people exposed |
| (6) | - time interval between successive vehicle users |
| (7) | - exposure time and distance of the operator of the process from the potentially infected person |
| (8) | - transport time, |
| (9) | - distance between seats or free space per person in transport mean |
| (10) | - time between consecutive stops in passenger transport |
| (11) | - type of air circulation and exchange in the means of transport |
| (12) | - time and number of people involved in loading/unloading activities |
| (13) | - participation of people during activities related to securing cargo during transport |
| (14) | - type of document flow in transport |
| (15) | - type and form of receipt (delivery) of loads in transport |
| Hazard Score | Description |
|---|---|
| 1 | Direct contact with another person at a distance of more than 6.5 m. |
| 2 | Direct contact with another person from 3 m to 6.5 m. |
| 3 | Direct contact with another person from 1.5 m to 3 m. |
| 4 | Direct contact with another person within 0.5 m to 1.5 m. |
| 5 | Direct contact with another person within 0.5 m. |
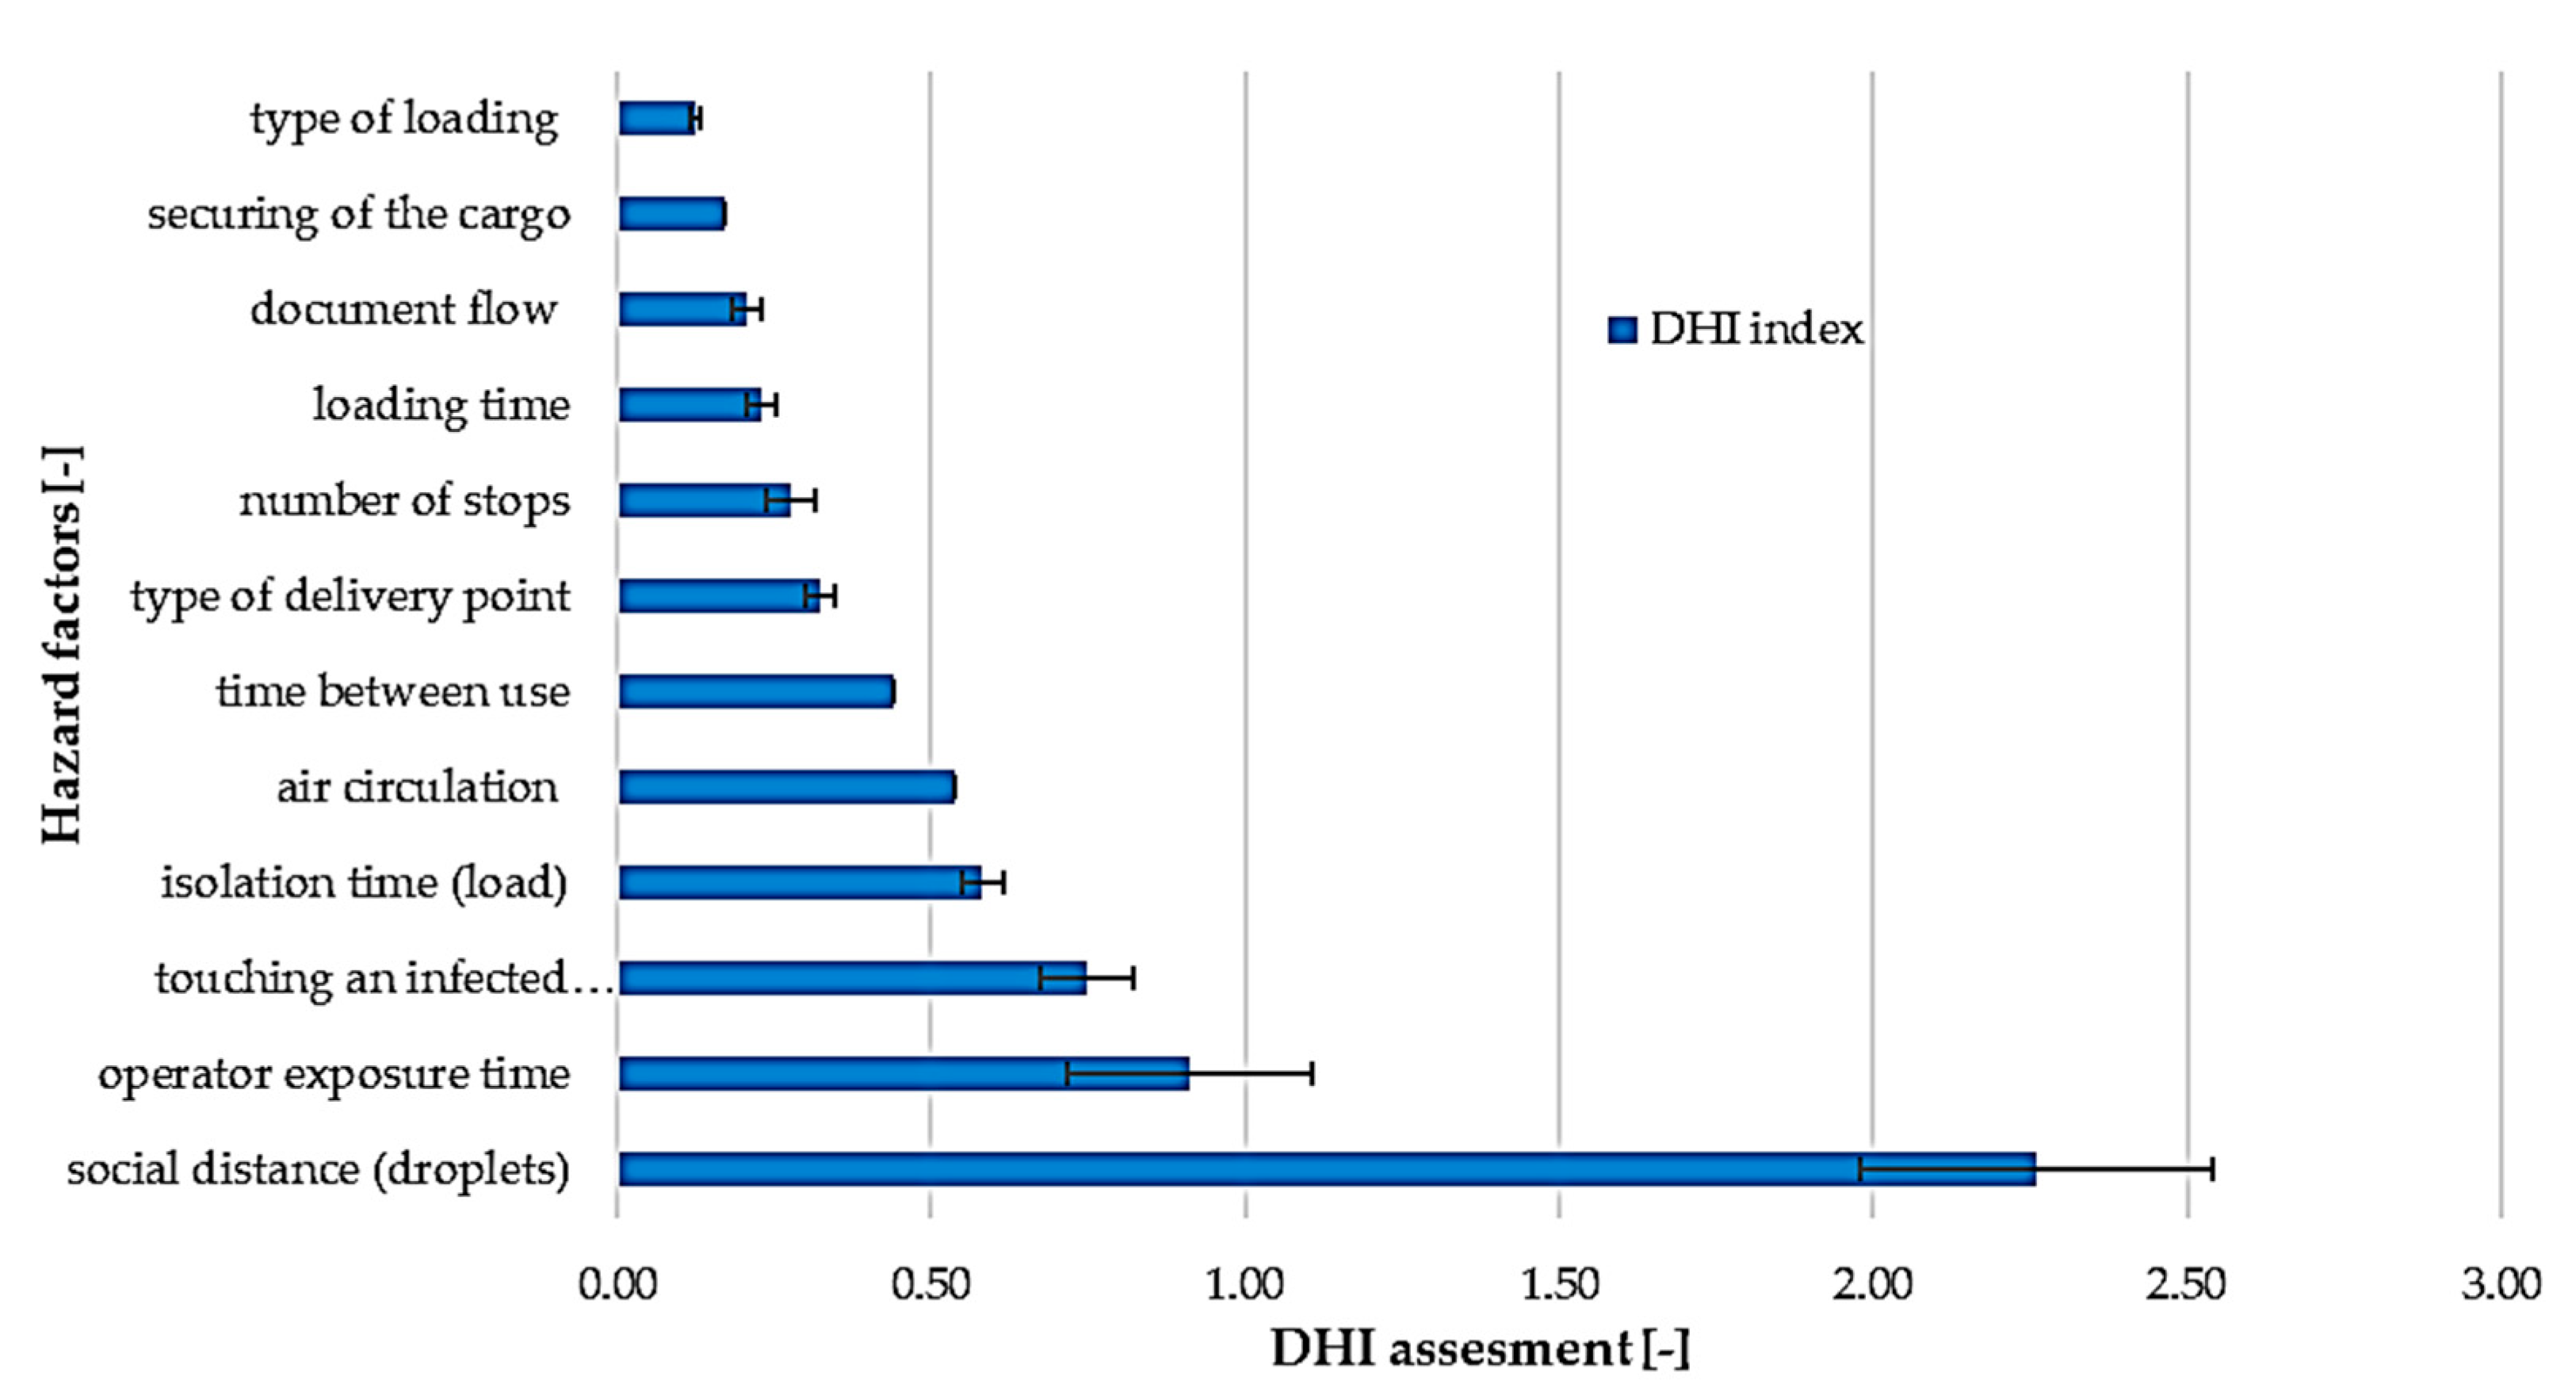
| Factor Number | Factor Name | Weighting Factors |
|---|---|---|
| 1 | social distance (droplets) | 0.16 |
| 2 | touching an infected surface | 0.07 |
| 3 | loading time | 0.02 |
| 4 | isolation time (load) | 0.03 |
| 5 | time between use | 0.02 |
| 6 | exposure time and number of people | 0.19 |
| 7 | operator exposure time | 0.13 |
| 8 | transportation time | 0.10 |
| 9 | distance between the seats | 0.10 |
| 10 | number of stops | 0.04 |
| 11 | air circulation | 0.07 |
| 12 | type of loading | 0.01 |
| 13 | securing of the cargo | 0.01 |
| 14 | document flow | 0.02 |
| 15 | type of delivery point | 0.02 |
| SUM: | 1.00 |
| Hazard Factor | Description | Hazard Assessment |
|---|---|---|
| social distance (droplets) | hazards—social distance from another person for the mechanism of infection by droplets: There may be direct contact between employees of the courier company, but currently the contact between the courier and the customer has been virtually eliminated. Only in the case of direct collection of the parcel, which in the current situation is estimated at 10–15%, but still in safe contact with a protective mask (for the personal delivery it can even—score 5); overall assessment: 1. | 1 (5) |
| touching an infected surface | hazards—threats attributable to touching a contaminated surface in means of transport: Several employees (up to 10) at the reloading point have direct contact with the shipment. Contact of loads with elements inside the vehicle, including the cargo area. The vehicle is usually used within an hour or even a whole day by one employee (score 2). For the personal delivery there is close contact with the customer when sending, receiving (score 4); overall assessment: 2. | 2 (4) |
| loading time | hazards—time during which cargo (goods) remains in a close distance from a potentially infected person: From the moment of collection from the sender, the loads are in contact with the courier upon receipt, delivery to the reloading point, picking up from the reloading point and delivering the shipment to the collection point. Assuming that each of these activities takes on average up to 2 min (picking up, putting away, and scanning the barcode), the display of the loads takes less than 10 min (for the personal delivery it can be 10–15 min—score 3); overall assessment: 2. | 2 (3) |
| isolation time (load) | hazards—time during which cargo in transport remains without contact with a potential source of infection: The time from the receipt of the goods from the transshipment point to the release to the collection point is usually closed within 12 h. In the case of parcel machines, the delivery time is usually 48 h (score 3). Therefore, it is possible to isolate the goods from harmful factors, but it depends on the customer’s will. For direct pickup, pickup is immediate (score 5); overall assessment: 3 (5). | 3 (5) |
| time between use | hazards—time between consecutive uses of means of transport after contact with a potential source of infection: The car has many plastic elements on which the virus can survive the longest (up to 72 h), posing a threat. After the entire working day, the vehicle is handed over to another employee or handed over to the employee who used the vehicle that day. It is not subject to disinfection and insulation after each user; overall assessment: 5. | 5 |
| operator exposure time | hazards—potential infection depending on worker (operator) exposure time: The courier may have a short-term contact with the employees when being released to the reloading point and picked up from the reloading point or in the event of personal collection with customers at the distance less than 2 m. Assuming that each of these activities takes up to 2 min on average (picking up, putting away and scanning the barcode and issuing the parcel), the employee’s total exposure ranges from 10 min to 30 min but always shorter than 2 min; overall assessment: 1. | 1 |
| number of delivery stops | hazards –frequency and number of stops (delivery points): In the case of non-contact delivery (parcel lockers), the number of stops does not matter as there is no risk of the courier becoming infected (score 1). In the case of direct deliveries, it can be even a dozen people (every 30 min), but in a very short contact with precautionary measures (masks) (score 3); overall assessment: 1 (3). | 1 (3) |
| air circulation | hazards—possible infection depending on air circulation and exchange, as well as air conditioning: In vehicles, it is possible to exchange air in an open circuit, through ventilation and opening windows; overall assessment: 2. | 2 |
| type of loading | hazards—potential infection depending on the type of loading and unloading: Sending the parcel by the customer takes place in a parcel locker without contact. The courier picks up and delivers the package on its own, without contact. There is no contact with the service/customer, but there is contact with the loads (score 2). In the case of personal delivery, sending the parcel by the customer takes place through contact. The courier picks up and delivers the package himself. There is contact with the customer and the loads (score 3); overall assessment: 2 (3). | 2 (3) |
| securing of the cargo | hazards—potential infection conditioned by cargo preparing and securing: The courier collects the goods from the parcel locker and secures them on the vehicle himself. In the sorting plant, the goods are also secured (packed) by 1 employee; overall assessment: 3. | 3 |
| document flow | hazards—potential infection depending on the document flow system and driver involvement: The majority of courier services are dominated by fully electronic data interchange (score 1). However, when delivering goods to the address, there is an electronic signature of the documents (score 4); overall assessment: 1 (4) | 1 (4) |
| type of delivery point | hazards—potential infection depending on the delivery point type: Contactless delivery takes place to a parcel locker. So the courier has no contact with the other person, but has contact with the infrastructure of a given facility. (score 2). Contact delivery takes place to the recipient’s address. The driver has direct contact with the recipient, but the pickup is carried out by one person (score 4); overall assessment: 2 (4) | 2 (4) |
| Total score: | 25 (42) | |
| Hazard Factor | Description | Hazard Assessment |
|---|---|---|
| social distance (droplets) | hazards—social distance from another person for the mechanism of infection by droplets: There may be direct contact between employees of the restaurant (cook, helper, packing person); mostly direct contact between the deliverer (driver) and the customer during order checking; if the payment is in cash or card direct contact with deliverer (driver)—the distance during contact is approximately 0.5–1.5 m; overall assessment: 4. | 4 |
| touching an infected surface | hazards—threats attributable to touching a contaminated surface in means of transport: Close contact with the order by cooks and employees responsible for preparing for transport, contact of packaging with the driver, direct contact between the deliverer (driver) and the customer when checking the order and paying the fee (cash or card); contact of packaging and products with the customer checking the status of the order; on the other hand, less than 10 people have contact with the vehicle, infrastructure and packaging within an hour; overall assessment: 2. | 2 |
| loading time | hazards—time for which cargo (goods) remains in a close distance from a potentially infected person: Estimated time for delivery of the order is about an hour of waiting. During this time, dishes are prepared, packed and delivered. The product stays for more than 30 min in the close vicinity of a potentially infected person; overall assessment: 5. | 5 |
| isolation time (load) | hazards—time for which cargo in transport remains without contact with a potential source of infection: In the case of catering services, the shortest possible delivery time is expected. There is no disinfection, isolation of product; overall assessment: 5. | 5 |
| time between use | hazards—time between consecutive uses of means of transport after contact with a potential source of infection: The car has many plastic elements on which the virus can survive the longest (up to 72 h) creating a threat. After a whole day of work, the vehicle is handed over to another employee or handed over again to the employee who used the vehicle on a given day. It is not disinfected and isolated after each user; overall assessment: 5. | 5 |
| operator exposure time | hazards—potential infection depending on worker (operator) exposure time: The deliverer has contact with the customer when giving and paying for the order. Customer exposure is less than 10 min; overall assessment: 1. | 1 |
| number of delivery stops | hazards–frequency and number of stops (delivery points): Most often, there are no additional delivery stops during the catering delivery; overall assessment: 1. | 1 |
| air circulation | hazards—possible infection depending on air circulation and exchange, as well as air conditioning: In vehicles, it is possible to exchange air in an open circuit, through ventilation and opening windows; overall assessment: 2. | 2 |
| type of loading | hazards—potential infection depending on the type of loading and unloading: The restaurant staff hand over the load to the driver. Loading and unloading is contactless (driver only). The driver is responsible for unloading and loading and only he has contact with the product; overall assessment: 2. | 2 |
| securing of the cargo | hazards—potential infection conditioned by cargo preparing and securing: The deliverer collects the products from the staff and secures them on the vehicle himself.; overall assessment: 3. | 3 |
| document flow | hazards—potential infection depending on the document flow system and driver involvement: In the case of catering services, only a document confirming the sale of the service (receipt) is issued; overall assessment: 3. | 3 |
| type of delivery point | hazards—potential infection depending on the delivery point type: Contact delivery takes place to the recipient’s address. The deliverer has direct contact with the recipient, but the pickup is carried out by one person; overall assessment: 4. | 4 |
| Total score: | 37 | |
| Hazard Factor | Description | Hazard Assessment |
|---|---|---|
| social distance (droplets) | hazards—social distance from another person for the mechanism of infection by droplets: There may be direct contact between employees of the shop during collecting products; mostly direct contact between the deliverer (driver) and the customer during order checking; if the payment is in cash or card direct contact with deliverer (driver)—the distance during contact is approximately 0.5–1.5 m; overall assessment: 4. | 4 |
| touching an infected surface | hazards—threats attributable to touching a contaminated surface in means of transport: Close contact with the order by employees responsible for collecting products and preparing for transport, contact of packaging with the driver, direct contact between the deliverer (driver) and the customer when checking the order and paying the fee (cash or card); contact of packaging and products with the customer checking the status of the order; on the other hand, less than 10 people have contact with the vehicle, infrastructure and packaging within an hour; overall assessment: 2. | 2 |
| loading time | hazards—time for which cargo (goods) remains in a close distance from a potentially infected person: From the moment of accepting the order, depending on the size and type of the order, it is carried out in different time periods. On the other hand, the products are constantly in the shop hall to which every customer has access, therefore the exposure of the products to hazard factors is more than 30 min; overall assessment: 5. | 5 |
| isolation time (load) | hazards—time for which cargo in transport remains without contact with a potential source of infection: Products from the moment of accepting the order to the start of its implementation and delivery takes place without the isolation process. There is no disinfection, isolation of product; overall assessment: 5. | 5 |
| time between use | hazards—time between consecutive uses of means of transport after contact with a potential source of infection: The car has many plastic elements on which the virus can survive the longest (up to 72 h) creating a threat. After a whole day of work, the vehicle is handed over to another employee or handed over again to the employee who used the vehicle on a given day. It is not disinfected and isolated after each user; overall assessment: 5. | 5 |
| operator exposure time | hazards—potential infection depending on worker (operator) exposure time: The deliverer has contact with the customer when giving, controlling and paying for the order. Customer exposure time is approximately 10–15 min at distance less than 2 m; overall assessment: 4. | 4 |
| number of delivery stops | hazards–frequency and number of stops (delivery points): Most often, there may be several delivery points during the delivery of purchases, but the time between them is over 30 min; overall assessment: 2. | 2 |
| air circulation | hazards—possible infection depending on air circulation and exchange, as well as air conditioning: In vehicles, it is possible to exchange air in an open circuit, through ventilation and opening windows; overall assessment: 2. | 2 |
| type of loading | hazards—potential infection depending on the type of loading and unloading: The shop staff hand over the load to the driver. Loading and unloading is contactless (driver only). The driver is responsible for unloading and loading and only he has contact with the product; overall assessment: 3. | 3 |
| securing of the cargo | hazards—potential infection conditioned by cargo preparing and securing: The deliverer collects the products from the staff and secures them on the vehicle himself.; overall assessment: 3. | 3 |
| document flow | hazards—potential infection depending on the document flow system and driver involvement: In the case of shopping delivery, only a document confirming the sale of the service (receipt) is issued, in addition, the customer often signs the confirmation of receipt of the goods; overall assessment: 4. | 4 |
| type of delivery point | hazards—potential infection depending on the delivery point type: Contact delivery takes place to the recipient’s address. The deliverer has direct contact with the recipient, but the pickup is carried out by one person; overall assessment: 4. | 4 |
| Total score: | 43 | |
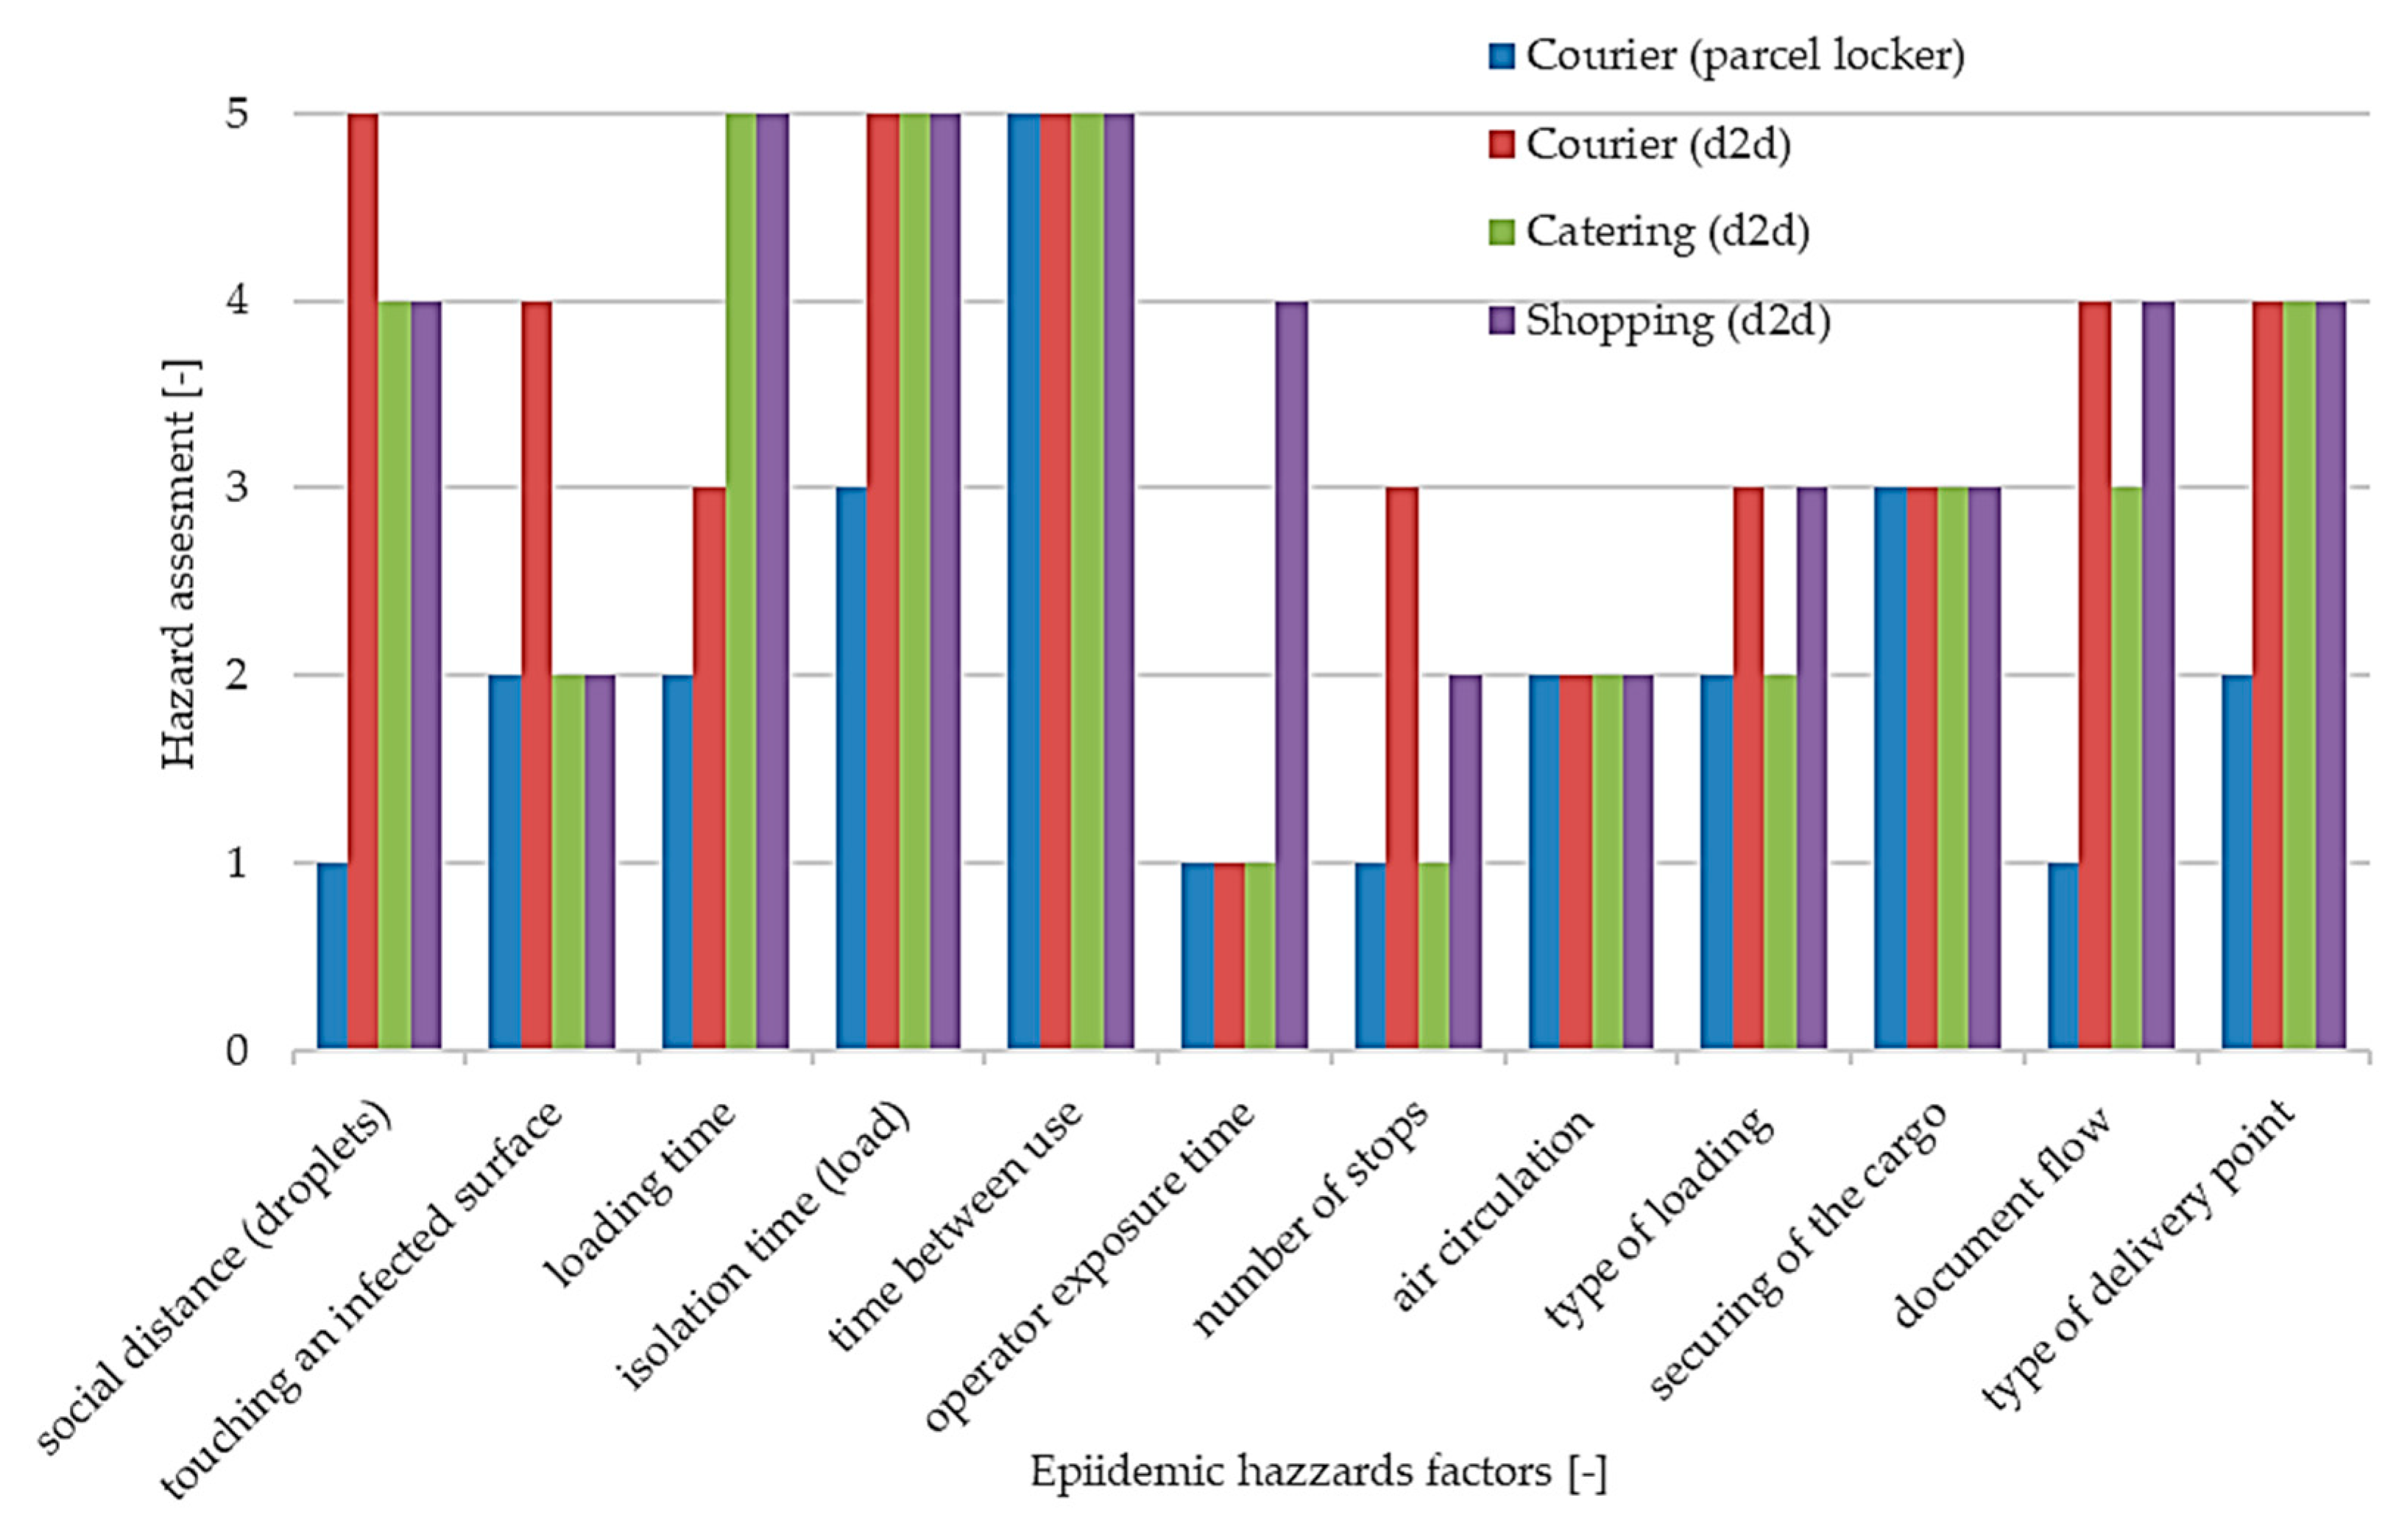
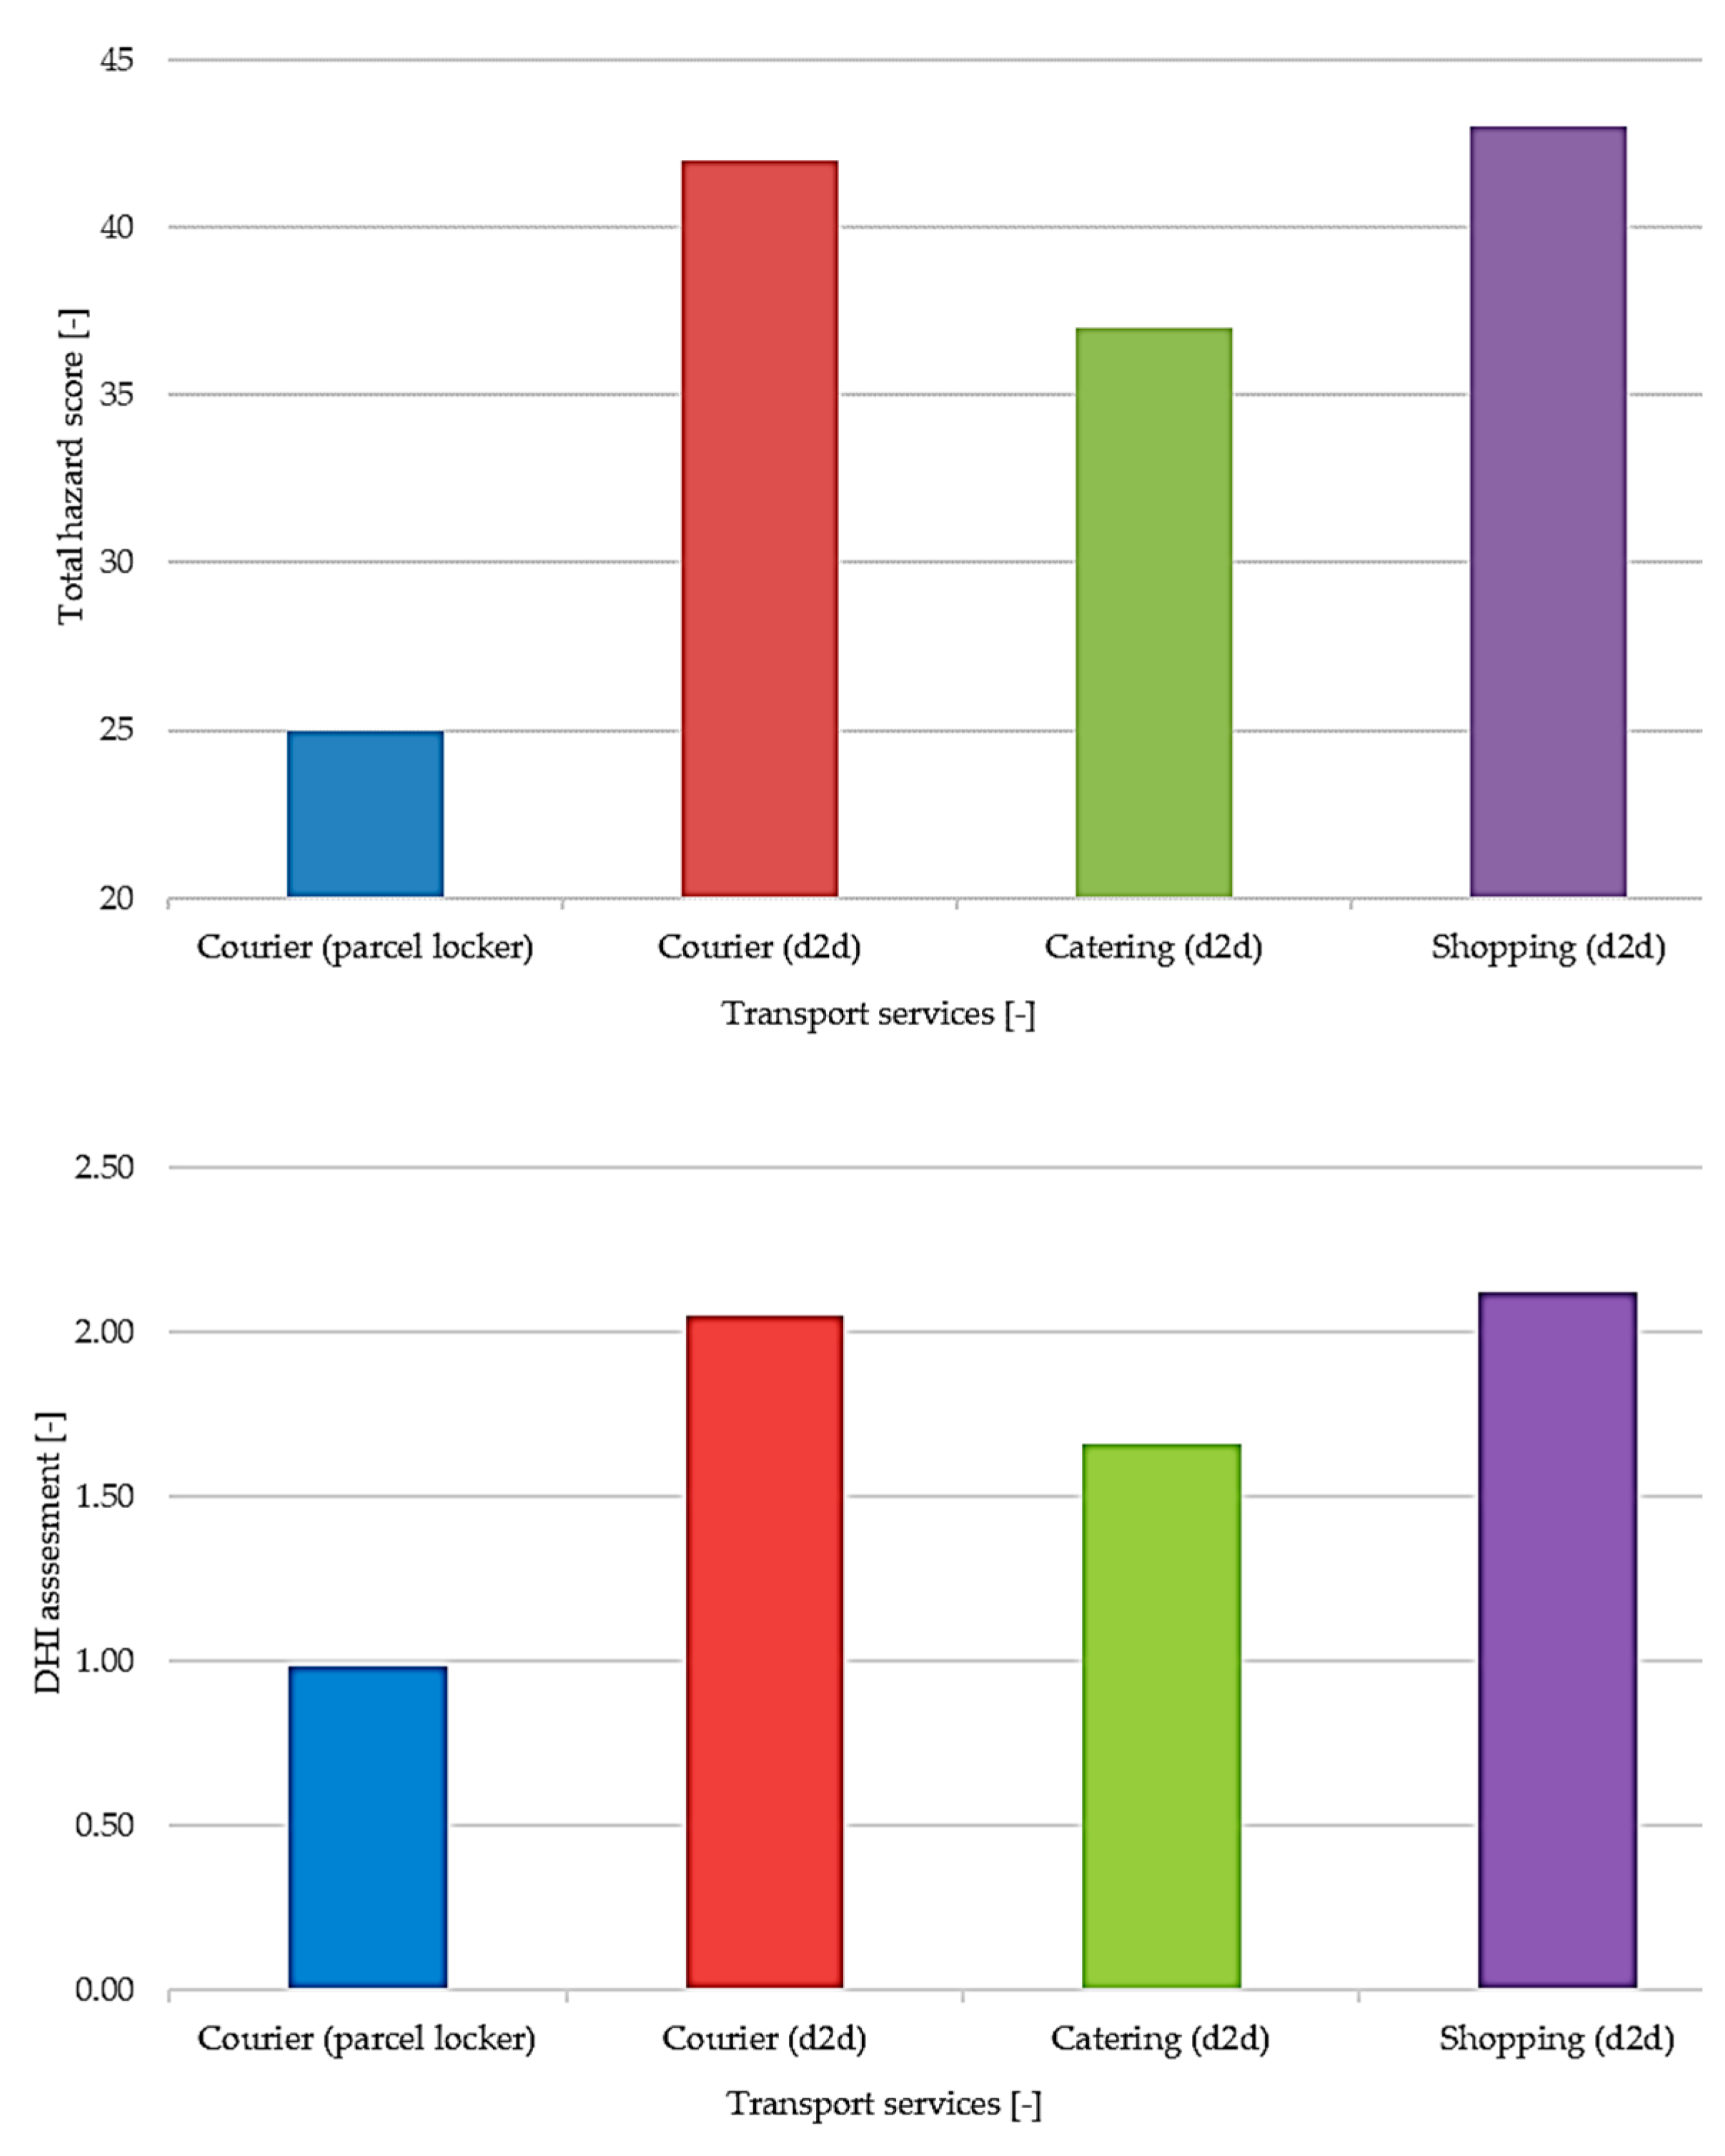
| Hazard Factor | Courier (Parcel Locker)—Score | Courier (Parcel Locker)—Weighting Score | Courier (d2d)—Score | Courier (d2d)—Weighting score | Catering (d2d)—score | Catering (d2d)—Weighting Score | Shopping (d2d)—Score | Shopping (d2d)—Weighting Score |
|---|---|---|---|---|---|---|---|---|
| social distance (droplets) | 1 | 0.16 | 5 | 0.81 | 4 | 0.65 | 4 | 0.65 |
| touching a surface | 2 | 0.15 | 4 | 0.30 | 2 | 0.15 | 2 | 0.15 |
| loading time | 2 | 0.03 | 3 | 0.05 | 5 | 0.08 | 5 | 0.08 |
| isolation time (load) | 3 | 0.10 | 5 | 0.16 | 5 | 0.16 | 5 | 0.16 |
| time between use | 5 | 0.11 | 5 | 0.11 | 5 | 0.11 | 5 | 0.11 |
| operator exposure time | 1 | 0.13 | 1 | 0.13 | 1 | 0.13 | 4 | 0.52 |
| number of stops | 1 | 0.04 | 3 | 0.12 | 1 | 0.04 | 2 | 0.08 |
| air circulation | 2 | 0.13 | 2 | 0.13 | 2 | 0.13 | 2 | 0.13 |
| type of loading | 2 | 0.02 | 3 | 0.04 | 2 | 0.02 | 3 | 0.04 |
| securing of the cargo | 3 | 0.04 | 3 | 0.04 | 3 | 0.04 | 3 | 0.04 |
| document flow | 1 | 0.02 | 4 | 0.07 | 3 | 0.05 | 4 | 0.07 |
| type of delivery point | 2 | 0.05 | 4 | 0.09 | 4 | 0.09 | 4 | 0.09 |
| SUM: | 25 | 0.98 | 42 | 2.05 | 37 | 1.66 | 43 | 2.12 |
Disclaimer/Publisher’s Note: The statements, opinions and data contained in all publications are solely those of the individual author(s) and contributor(s) and not of MDPI and/or the editor(s). MDPI and/or the editor(s) disclaim responsibility for any injury to people or property resulting from any ideas, methods, instructions or products referred to in the content. |
© 2023 by the author. Licensee MDPI, Basel, Switzerland. This article is an open access article distributed under the terms and conditions of the Creative Commons Attribution (CC BY) license (https://creativecommons.org/licenses/by/4.0/).
Share and Cite
Burdzik, R. An Application of the DHI Methodology for a Comparison of SARS-CoV-2 Epidemic Hazards in Customer Delivery Services of Smart Cities. Smart Cities 2023, 6, 965-986. https://doi.org/10.3390/smartcities6020047
Burdzik R. An Application of the DHI Methodology for a Comparison of SARS-CoV-2 Epidemic Hazards in Customer Delivery Services of Smart Cities. Smart Cities. 2023; 6(2):965-986. https://doi.org/10.3390/smartcities6020047
Chicago/Turabian StyleBurdzik, Rafał. 2023. "An Application of the DHI Methodology for a Comparison of SARS-CoV-2 Epidemic Hazards in Customer Delivery Services of Smart Cities" Smart Cities 6, no. 2: 965-986. https://doi.org/10.3390/smartcities6020047