

Assessing the Energy and Climate Sustainability of European Union Member States: An MCDM-Based Approach

Abstract
:1. Introduction
- ➢
- Filling of the research gap due to the lack of a multi-criteria price of sustainable energy and climate development of EU countries in the perspective of a decade (2010–2020);
- ➢
- Development of a universal approach in the form of a new research methodology for assessing the energy–climate sustainability of EU countries, allowing a transparent and unambiguous comparative assessment of the countries under study, taking into account multiple factors;
- ➢
- Development and formulation of recommendations on the use of the MCDM methodology for assessing the energy–climate sustainability of a group of countries.
2. Literature Studies
3. Materials and Methods
3.1. Materials
- ➢
- Relevance to the objectives of EU energy and climate policy related to the Europe 2020 Strategy and the UN Sustainable Development Goals (Agenda 2030);
- ➢
- Simplicity in the construction of indicators;
- ➢
- Simplicity of interpretation of the indicators as a basic tool for analysis;
- ➢
- Comparability;
- ➢
- The potential for use in econometric models, forecasting models and other data analytics issues;
- ➢
- Low degree of correlation of variables among themselves;
- ➢
- The value of the coefficient of variation above 10%;
- ➢
- Accessibility.
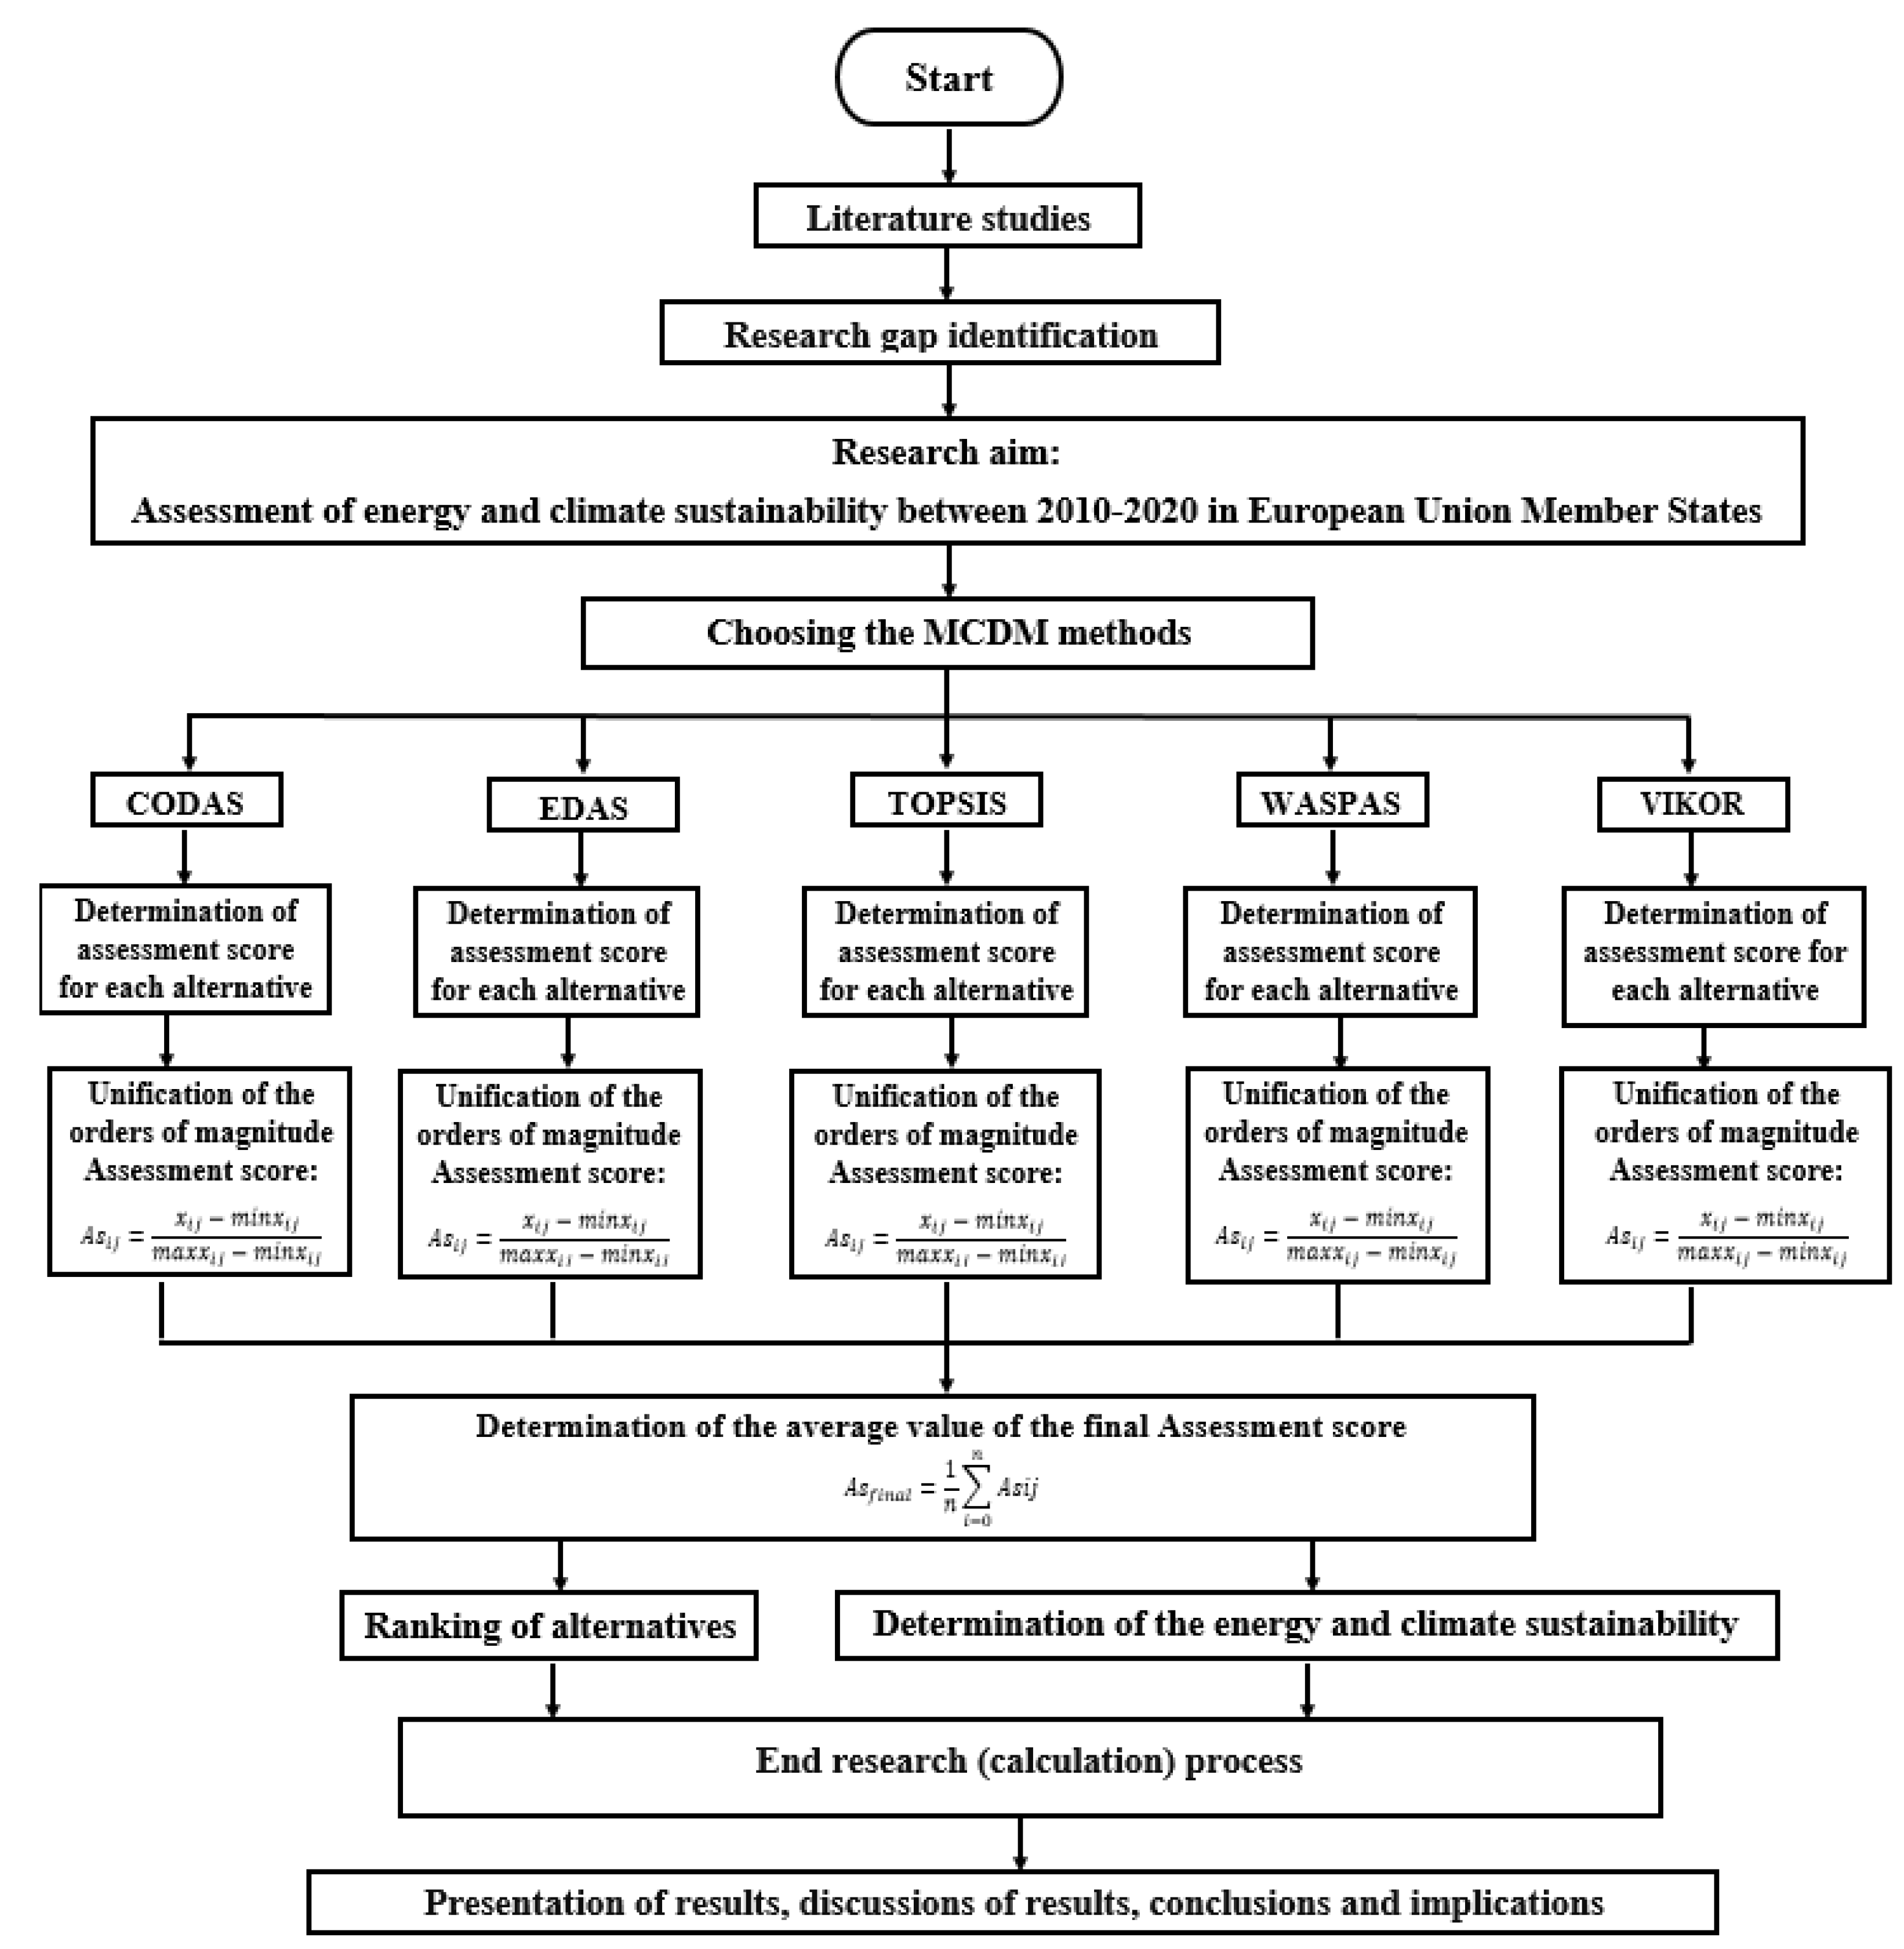
3.2. Methods
3.2.1. Combinative Distance-Based Assessment (CODAS) Method
- (1)
- Create a new decision matrix.
- (2)
- Determine a normalized decision matrix based on the normalization procedure:
- (3)
- Determine a weighted normalized decision matrix:
- (4)
- Determine a negative-ideal solution from Equations (3) and (4):
- (5)
- Calculate the Euclidean (Ei) (Equation (5)) and Taxicab (Ti) (Equation (6)) distances of alternatives from the negative-ideal solution:
- (6)
- Calculate the relative evaluation matrix of alternatives:
- (7)
- Determine the evaluation measure of each alternative:
- (8)
- Order the alternatives in terms of evaluation value in descending order.
3.2.2. Evaluation Based on Distance from Average Solution (EDAS) Method
- (1)
- Create a new initial decision-making matrix.
- (2)
- Calculate the value of the average solution based on all evaluation criteria, as follows:
- (3)
- Based on the value of the average solution (AV), determine a positive distance from the average (PDA) and negative distance from the average (NDA) using formulas:
- (4)
- To determine weighted sums of PDA and NDA for all alternatives, as follows:
- (5)
- Normalize SP and SN values:
- (6)
- Determine the Appraisal Score (ASi) index for each alternative:
- (7)
- Rank the alternatives according to ASi values in descending order. The alternative with the highest ASi value is the best choice among all alternatives (the alternative with the largest value of ASi index is the best one).
3.2.3. Technique for Order of Preference by Similarity to Ideal Solution (TOPSIS) Method
- (1)
- Create a new initial decision-making matrix.
- (2)
- Normalize the new decision matrix according to the equation:
- (3)
- Determine a weighted normalized decision matrix:
- (4)
- After creating a weighted normalized edit matrix, a positive ideal solution and a negative ideal solution are determined using the equations:
- (5)
- The distance of each alternative from the positive ideal and negative ideal solutions is obtained using the equations:
- (6)
- Determine the relative proximity (Pi) of an alternative to the optimal solution according to Equation (28):
- (7)
- Finally, the alternatives are ranked according to the Pi values of the relative proximity (the higher value, the better the alternative).
3.2.4. VlseKriterijuska Optimizacija I Komoromisno Resenje (VIKOR) Method
- (1)
- Create a new initial decision-making matrix.
- (2)
- Determine the best () and the worst () values in all the studied criteria based on the equations:
- (3)
- Determine the values of Si and Ri using Equations (34) and (35), with wj being the weight of the criteria, which determines their relative importance:
- (4)
- Determine the value of Qi using the equation:
- (5)
- The value of v is a weight reflecting the importance of the strategy of most criteria (from Equation (37)):
- (6)
- Create a ranking of alternatives based on Qi values. For this purpose, the determined values are arranged in descending order. The best alternative has the smallest value.
3.2.5. The Weighted Aggregated Sum Product Assessment (WASPAS) Method
- (1)
- Create a new initial decision-making matrix.
- (2)
- Determine the normalized decision matrix of positive criteria (stimulants) and negative criteria (destimulants) according to Equations (39)–(40):
- (3)
- Determine the relative additive validity of the normalized values of each alternative:
- (4)
- Determine the multiplicative relative additive validity of the normalized values of each alternative:
- (5)
- Determine the generalized evaluation criterion (Q), called the weighted total product evaluation method:
- 6)
- Create a ranking of alternatives based on Qi values.
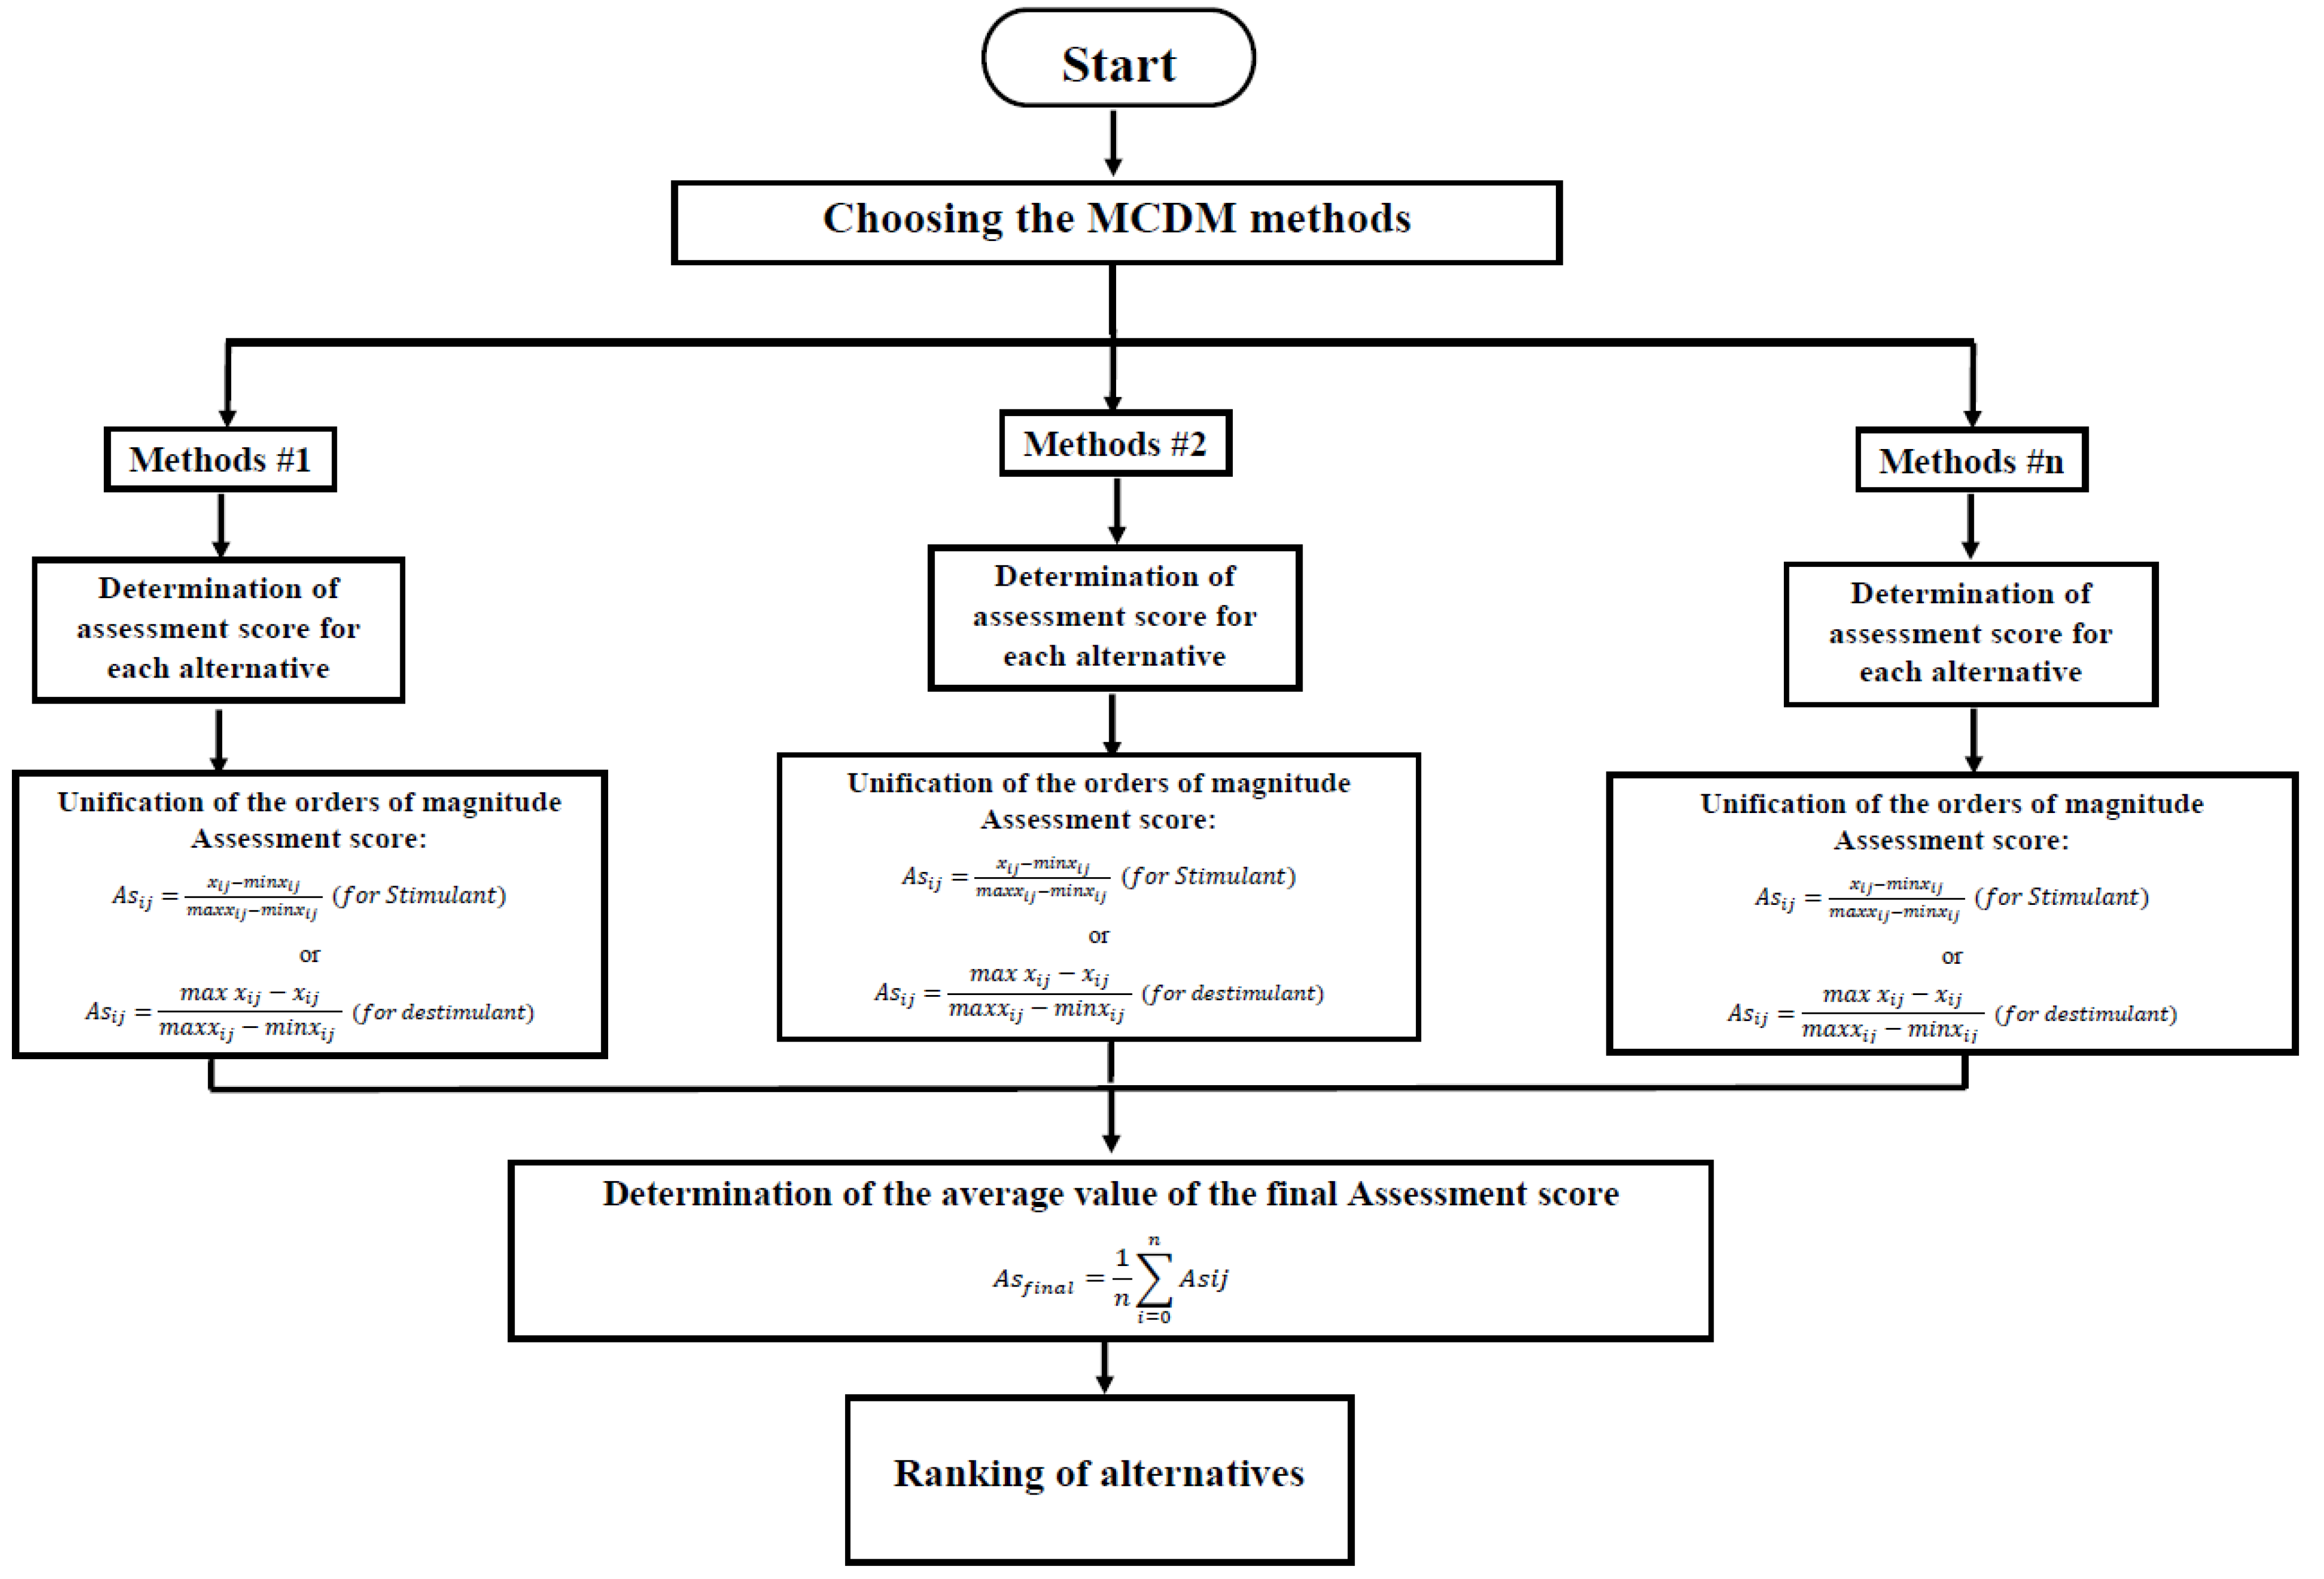
3.2.6. The New Methodology: Integrated Multiple-Criteria Decision-Making Approach
- (1)
- Unify the orders of magnitude of the Assessment Score values obtained in each MCDM method used for each alternative according to the zero-order unitization equations:
- and
- (2)
- Determine the average Assessment Score from all used MCDM methods for a given alternative:
- (3)
- Make a ranking of alternatives based on the values of the final Assessment Score () (the highest value of final Assessment Score is position 1, the lowest value-the last position).

4. Results
4.1. Descriptive Statistics
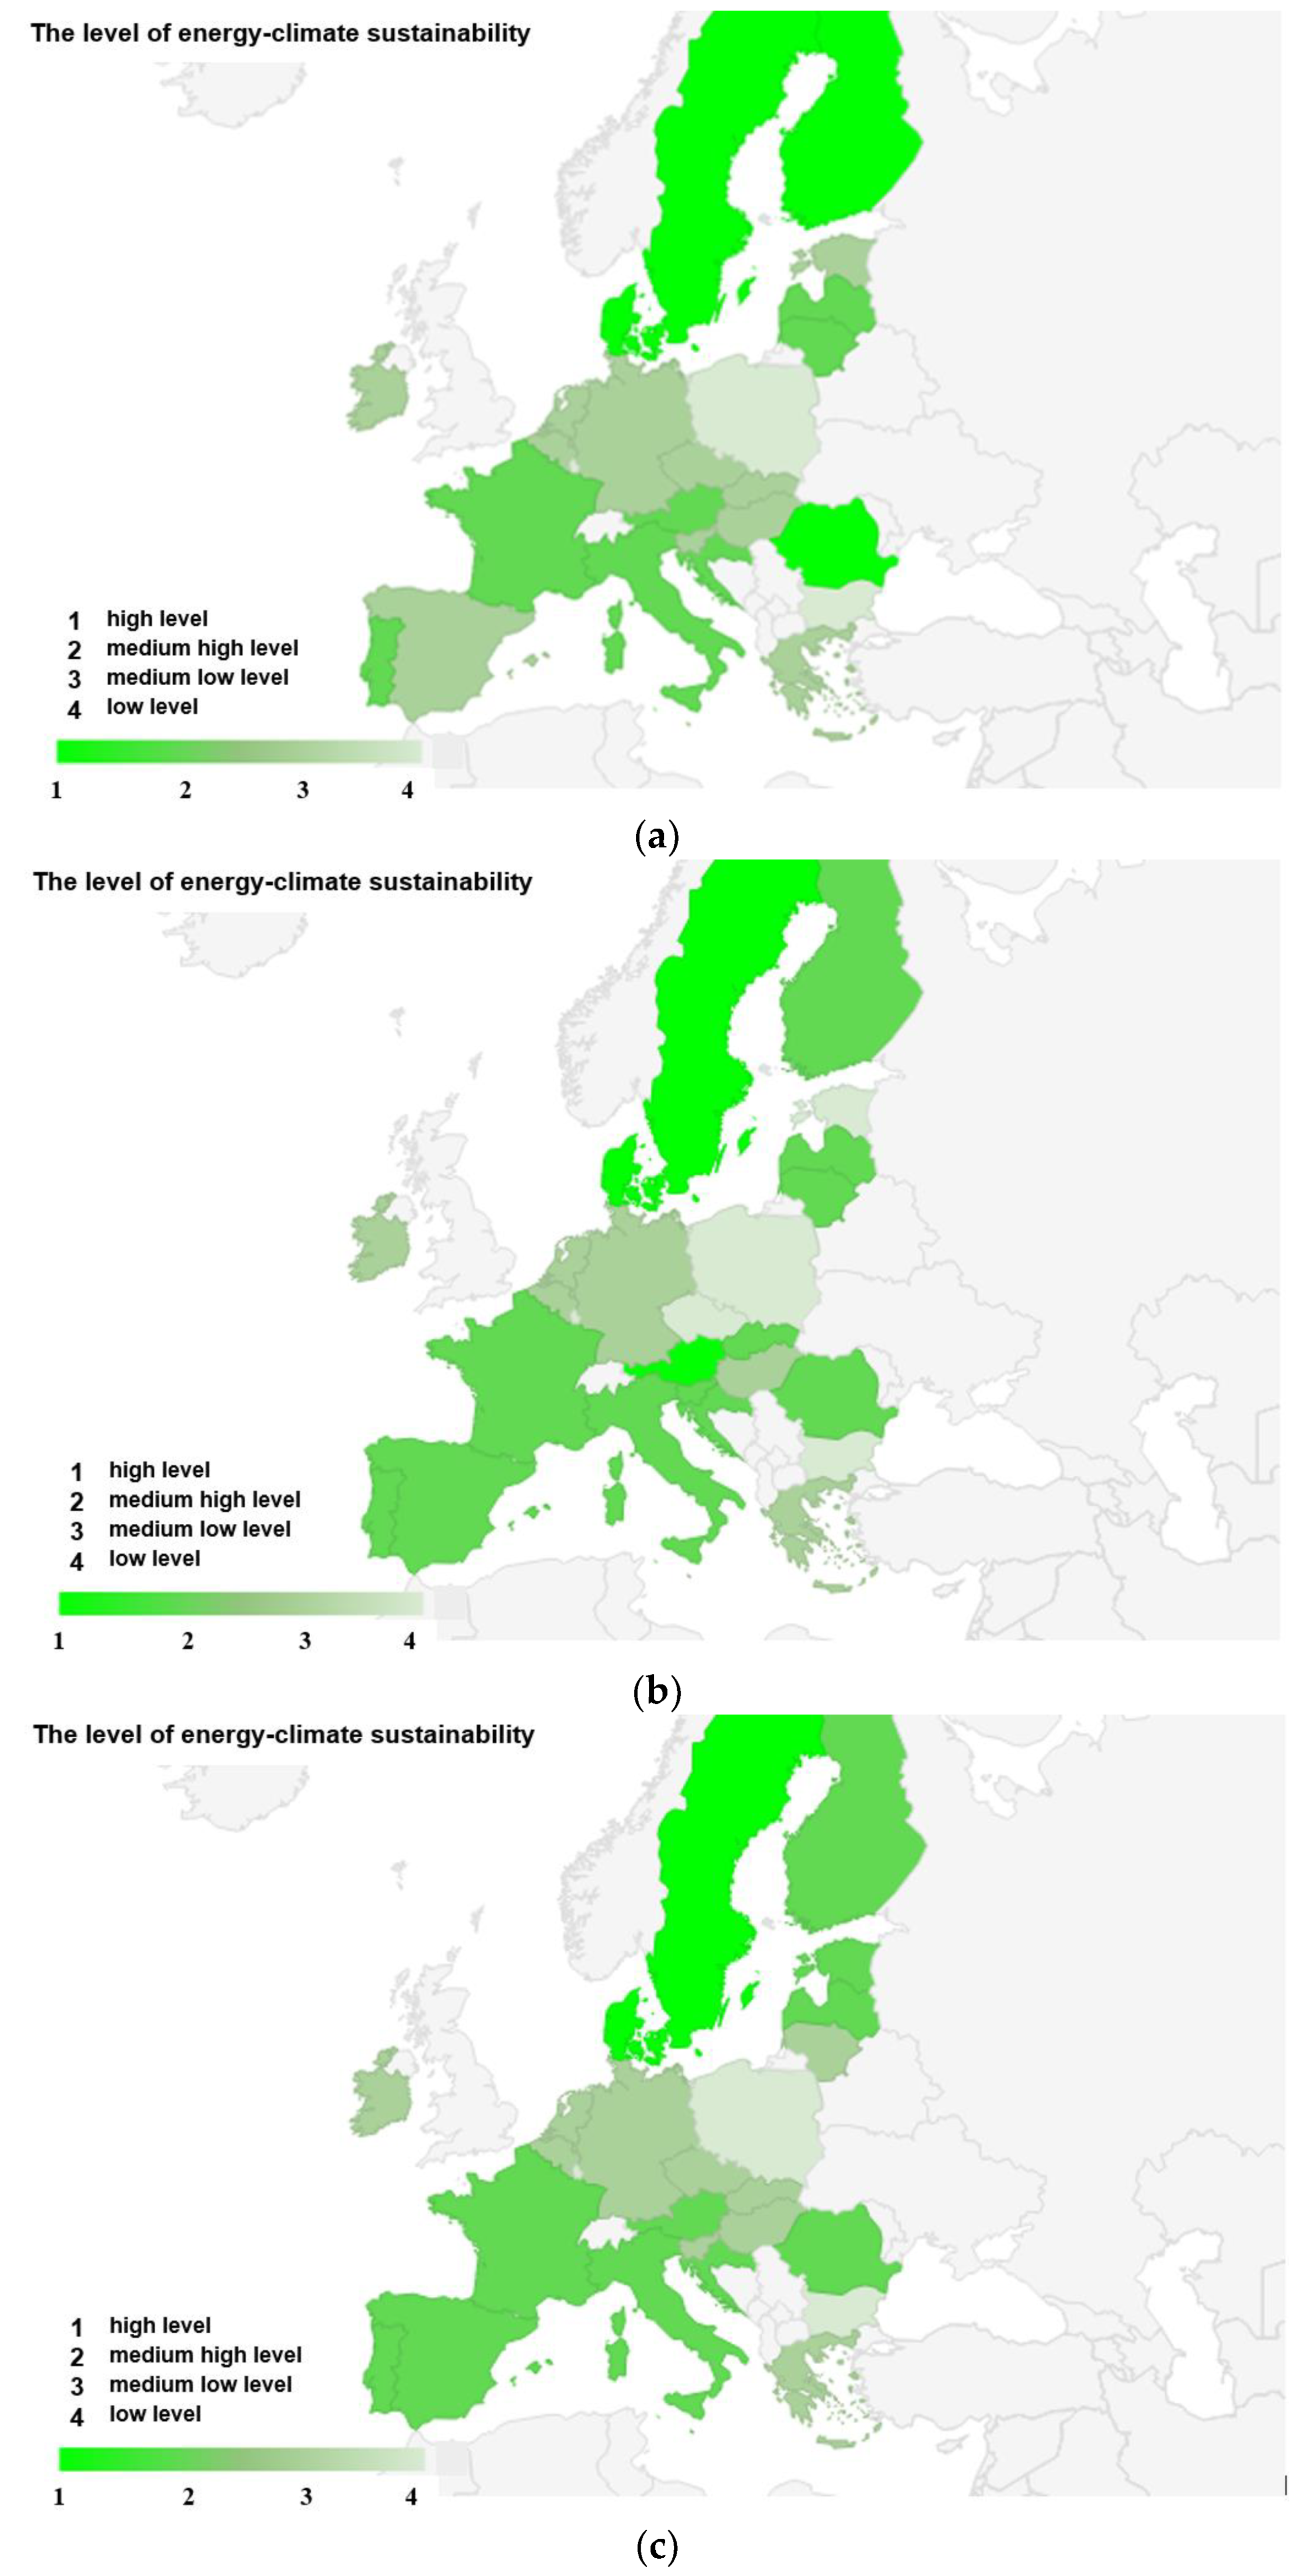
4.2. Comparison of Alternative Rankings Using Different MCDM Methods
- (1)
- Group 1: High level
- (2)
- Group 2: Medium-high level
- (3)
- Group 3: Medium-low level
- (4)
- Group 4: Low level
5. Discussion
6. Conclusions
- ➢
- EU-27 member states between 2010 and 2020 have, for the most part, significantly improved indicators relating to the achievement of energy and climate goals. Of particular note is the improvement in energy efficiency as measured by primary and final energy consumption per capita. Average primary energy consumption in the EU-27 fell by 15%, and final consumption by 10%. By contrast, renewable energy consumption increased to the greatest extent, by 211% overall for the entire community. A particular increase in the use of renewable energy occurred in the transport sector, where, for the EU-27 as a whole, it was 410%. The result of these changes is a 19% reduction in greenhouse gas emissions in 2020 compared to 2010.
- ➢
- The EU-27 countries are marked with significant variations in energy and climate sustainability, which, however, did not change significantly during the period under consideration (i.e., 2010, 2015, and 2020). In addition, the compositions of groups with similar levels of sustainability in 2010 and 2020 changed slightly.
- ➢
- The highest position in the ranking of EU-27 countries in terms of energy and climate sustainability in the three periods analyzed, i.e., 2010, 2015, and 2020, was achieved by Sweden. Cyprus, on the other hand, was in last place.
- ➢
- High levels of energy and climate sustainability throughout the period under review were found in two Scandinavian countries, Sweden and Denmark. These countries should be considered undisputed leaders in the process of implementing a sustainable economy in the EU-27.
- ➢
- Low levels of energy and climate sustainability throughout the analyzed period were observed in Cyprus, Luxembourg, Bulgaria, and Poland.
- ➢
- It is noticeable that the level of sustainability varies between groups of countries of the so-called “new EU-14” and “old EU-13”.
Author Contributions
Funding
Institutional Review Board Statement
Informed Consent Statement
Data Availability Statement
Conflicts of Interest
References
- Chen, W.-H.; Budzianowski, W.; Lee, K.T. Preface—Sustainable Biofuels. Energy Convers. Manag. 2017, 141, 1. [Google Scholar] [CrossRef]
- Singh, N.; Nyuur, R.; Richmond, B. Renewable Energy Development as a Driver of Economic Growth: Evidence from Multivariate Panel Data Analysis. Sustainability 2019, 11, 2418. [Google Scholar] [CrossRef] [Green Version]
- Agbede, E.A.; Bani, Y.; Azman-Saini, W.; Naseem, N.M. The impact of energy consumption on environmental quality: Empirical evidence from the MINT countries. Environ. Sci. Pollut. Res. 2021, 28, 54117–54136. [Google Scholar] [CrossRef]
- Dzikuć, M.; Wyrobek, J.; Popławski, Ł. Economic Determinants of Low-Carbon Development in the Visegrad Group Countries. Energies 2021, 14, 3823. [Google Scholar] [CrossRef]
- Marks-Bielska, R.; Bielski, S.; Pik, K.; Kurowska, K. The importance of Renewable Energy Sources in Poland’s energy mix. Energies 2020, 13, 4624. [Google Scholar] [CrossRef]
- Piwowar, A.; Dzikuś, M. Development of Renewable Energy Sources in the Context of Threats Resulting from Low-Altitude Emissions in Rural Areas in Poland: A Review. Energies 2019, 12, 3558. [Google Scholar] [CrossRef] [Green Version]
- Tucki, K.; Orynycz, O.; Dudziak, A. The Impact of the Available Infrastructure on the Electric Vehicle Market in Poland and in EU Countries. Int. J. Environ. Res. Public Health 2022, 19, 16783. [Google Scholar] [CrossRef]
- Lenarczyk, A.; Jaskólski, M.; Bućko, P. The Application of a Multi-Criteria Decision-Making for Indication of Directions of the Development of Renewable Energy Sources in the Context of Energy Policy. Energies 2022, 15, 9629. [Google Scholar] [CrossRef]
- Siksnelyte-Butkiene, I.; Zavadskas, E.K.; Dalia, S.; Streimikiene, D. the Assessment of Renewable Energy Technologies in a Household: A Review. Energies 2020, 13, 1164. [Google Scholar] [CrossRef] [Green Version]
- Ghouchani, M.; Taji, M.; Cheheltani, A.S.; Chehr, M.S. Developing a perspective on the use of renewable energy in Iran. Technol. Forecast. Soc. Chang. 2021, 172, 121049. [Google Scholar] [CrossRef]
- Zhang, Y.; Abbas, M.; Iqbal, W. Perceptions of GHG emissions and renewable energy sources in Europe, Australia and the USA. Environ. Sci. Pollut. Res. 2022, 29, 5971–5987. [Google Scholar] [CrossRef]
- Vasylieva, T.; Lyulyov, O.; Bilan, Y.; Streimikiene, D. Sustainable economic development and greenhouse gas emissions: The dynamic impact of renewable energy consumption, GDP, and corruption. Energies 2019, 12, 3289. [Google Scholar] [CrossRef] [Green Version]
- Gökgöz, F.; Güvercin, M.T. Energy security and renewable energy efficiency in EU. Renew. Sustain. Energy Rev. 2018, 96, 226–239. [Google Scholar] [CrossRef]
- Azzuni, A.; Aghahosseini, A.; Ram, M.; Bogdanov, D.; Caldera, U.; Breyer, C. Energy Security Analysis for a 100% Renewable Energy Transition in Jordan by 2050. Sustainability 2020, 12, 4921. [Google Scholar] [CrossRef]
- Siuta-Tokarska, B.; Thier, A.; Hornicki, K. The Concept of Extended Producer Responsibility in the Field of Packaging Industry and the Energy Sector in the Light of the Circular Economy—The Example of Poland. Energies 2022, 15, 9060. [Google Scholar] [CrossRef]
- Bąk, I.; Wawrzyniak, K.; Oesterreich, M. Competitiveness of the Regions of the European Union in a Sustainable Knowledge-Based Economy. Sustainability 2022, 14, 378. [Google Scholar] [CrossRef]
- The European Green Deal COM/2019/640. Communication from the Commission to the European Parliament, the European Council, the Council, the European Economic and Social Committee and the Committee of the Regions. Available online: https://eur-lex.europa.eu/legal-content/EN/TXT/uriCOM3A20193A6403AFIN(COM(2019)640 (accessed on 27 December 2021).
- United Nations. Available online: https://sdgs.un.org/goals (accessed on 27 December 2022).
- Sustainable Development Goals. Available online: https://sustainabledevelopment.un.org/content/documents/Agenda21.pdf (accessed on 27 December 2021).
- Bórawski, P.; Bełdycka-Bórawska, A.; Holden, L.; Rokicki, T. The Role of Renewable Energy Sources in Electricity Production in Poland and the Background of Energy Policy of the European Union at the Beginning of the COVID-19 Crisis. Energies 2022, 15, 8771. [Google Scholar] [CrossRef]
- Zakeri, B.; Paulavets, K.; Barreto-Gomez, L.; Echeverri, L.G.; Pachauri, S.; Boza-Kiss, B.; Zimm, C.; Rogelj, J.; Creutzig, F.; Ürge-Vorsatz, D.; et al. Pandemic, War, and Global Energy Transitions. Energies 2022, 15, 6114. [Google Scholar] [CrossRef]
- Siksnelyte-Butkiene, I.; Karpavicius, T.; Streimikiene, D.; Balezentis, T. The Achievements of Climate Change and Energy Policy in the European Union. Energies 2022, 15, 5128. [Google Scholar] [CrossRef]
- European Commission. REPowerEU: Joint European Action for More Affordable, Secure and Sustainable Energy. Communication from the Commission to the European Parliament, the European Council, the Council, the European Economic and Social Committee and the Committee of the Regions. Strasbourg, 8 March 2022, COM (2022) 108 Final. Available online: https://eur-lex.europa.eu/legal-content/EN/TXT/?uri=celex:52022DC0108 (accessed on 27 December 2022).
- Directive 2009/28/EC of 23 April 2009 on the promotion of the use of energy from renewable sources and amending and subsequently repealing Directives 2001/77/EC and 2003/30/EC. Off. J. Eur. Union L 2009, 140, 16–47.
- Directive 2003/30/EC of the European Parliament and of the Council of 8 May 2003 on the promotion of the use of biofuels or other renewable fuels for transport. Off. J. Eur. Union L 2003, 123.
- Europe 2020. A European Strategy for Smart, Sustainable and Inclusive Growth. Available online: https://ec.europa.eu/eu2020/pdf/COMPLET%20EN%20BARROSO%20%20%20007%20-%20Europe%202020%20-%20EN%20version.pdf (accessed on 27 December 2022).
- Simionescu, M.; Strielkowski, W.; Tvaronaviciene, M. Renewable energy in final energy consumption and income in the EU-28 countries. Energies 2020, 13, 2280. [Google Scholar] [CrossRef]
- Brożyna, J.; Strielkowski, W.; Fomina, A.; Nikitina, N. Renewable Energy and EU 2020 Target for Energy Efficiency in the Czech Republic and Slovakia. Energies 2020, 13, 965. [Google Scholar] [CrossRef] [Green Version]
- Włodarczyk, B.; Firoiu, D.; Ionescu, G.H.; Ghiocel, F.; Szturo, M.; Markowski, L. Assessing the Sustainable Development and Renewable Energy Sources Relationship in EU Countries. Energies 2021, 14, 2323. [Google Scholar] [CrossRef]
- Proskurina, S.; Sikkema, R.; Heinimö, J.; Vakkilainen, E. Five years left—How are the EU member states contributing to the 20% target for EU’s renewable energy consumption; the role of woody biomass. Biomass Bioenergy 2016, 95, 64–77. [Google Scholar] [CrossRef]
- Kryk, B.; Guzowska, M.K. Implementation of Climate/Energy Targets of the Europe 2020 Strategy by the EU Member States. Energies 2021, 14, 2711. [Google Scholar] [CrossRef]
- Sikkema, R.; Proskurina, S.; Banja, M.; Vakkilainen, E. How can solid biomass contribute to the EU’s renewable energy targets in 2020, 2030 and what are the GHG drivers and safeguards in energy- and forestry sectors? Renew. Energy 2021, 165, 758–772. [Google Scholar] [CrossRef]
- Fura, B.; Wojnar, J.; Kasprzyk, B. Ranking and Classification of EU Countries Regarding their Levels of Implementation of the Europe 2020 Strategy. J. Clean. Prod. 2017, 165, 968–979. [Google Scholar] [CrossRef]
- Štreimikienė, D.; Balezentis, T. Kaya identity for analysis of the main drivers of GHG emissions and feasibility to implement EU “20–20–20” targets in the Baltic States. Renew. Sustain. Energy Rev. 2016, 58, 1108–1113. [Google Scholar] [CrossRef]
- Alola, A.A.; Akadiri, S.S.; Usman, O. Domestic material consumption and greenhouse gas emissions in the EU-28 countries: Implications for environmental sustainability targets. Sustain. Dev. 2021, 29, 388–397. [Google Scholar] [CrossRef]
- Peña, J.I.; Rodríguez, R. Are EU’s Climate and Energy Package 20-20-20 targets achievable and compatible? Evidence from the impact of renewables on electricity prices. Energy 2019, 183, 477–486. [Google Scholar] [CrossRef]
- Çolak, M.S.; Ege, A. An Assessment of EU 2020 Strategy: Too Far to Reach? Soc. Indic. Res. 2013, 110, 659–680. [Google Scholar] [CrossRef]
- Kryk, B. Ensuring Sustainable Energy as A Sign of Environmental Responsibility and Social Justice in European Union Members. Ekon. I Srodowisko-Econ. Environ. 2019, 4, 138–162. [Google Scholar]
- Becker, W.; Norlen, H.; Dijkstra, L.; Athanasoglou, S. Wrapping up the Europe 2020 strategy: A multidimensional indicator analysis. Environ. Sustain. Indic. 2020, 8, 100075. [Google Scholar] [CrossRef]
- Fedajev, A.; Stanujkic, D.; Karabasevic, D.; Brauers, W.K.M.; Zavadskas, E.K. Assessment of progress towards Europe 2020 strategy targets by using the MULTIMOORA method and the Shannon Entropy Index. J. Clean. Prod. 2020, 244, 118895. [Google Scholar] [CrossRef]
- Eurostat. Available online: https://ec.europa.eu/eurostat/data/database (accessed on 27 October 2022).
- Pamucar, D.; Görçün, Ö.F.; Küçükönder, H. Evaluation of the route selection in international freight transportation by using the CODAS technique based on interval-valued Atanassov intuitionistic sets. Soft Comput. 2022. [Google Scholar] [CrossRef]
- Pamucar, D.; Žižović, M.; Đuričić, D. Modification of the CRITIC method using fuzzy rough numbers. Modification of the CRITIC method using fuzzy rough numbers. Decis. Mak. Appl. Manag. Eng. 2022, 5, 362–371. [Google Scholar] [CrossRef]
- Vassoney, E.; Mammoliti Mochet, A.; Desiderio, E.; Negro, G.; Pilloni, M.G.; Comoglio, C. Comparing Multi-Criteria Decision-Making Methods for the Assessment of Flow Release Scenarios from Small Hydropower Plants in the Alpine Area. Front. Environ. Sci. 2021, 9, 635100. [Google Scholar] [CrossRef]
- Ishizaka, A.; Siraj, S. Are multi-criteria decision-making tools useful? An experimental comparative study of three methods. Eur. J. Oper. Res. 2018, 264, 462–471. [Google Scholar] [CrossRef] [Green Version]
- Zavadskas, E.K.; Turskis, Z. Multiple criteria decision making (MCDM) methods in economics: An overview. Technol. Econ. Dev. Econ. 2011, 17, 397–427. [Google Scholar] [CrossRef] [Green Version]
- Keshavarz-Ghorabaee, M.; Zavadskas, E.K.; Turskis, Z.; Antucheviciene, J. A new combinative distance-based assessment (CODAS) method for multi-criteria decision-making. Econ. Comput. Econ. Cybern. Stud. Res. 2016, 50, 25–44. [Google Scholar]
- Chen, L.; Gou, X. The application of probabilistic linguistic CODAS method based on new score function in multi-criteria decision-making. Comp. Appl. Math. 2022, 41, 11. [Google Scholar] [CrossRef]
- Stanujkic, D.; Zavadskas, E.K.; Ghorabaee, M.K.; Turskis, Z. An extension of the EDAS method based on the use of interval grey numbers. Stud. Inform. Control 2017, 26, 5–12. [Google Scholar] [CrossRef]
- Stevic, Z.; Tanackov, I.; Vasiljevic, M.; Veskovic, S. Evaluation in logistics using combined AHP and EDAS method. In Proceedings of the XLIII International Symposium on Operational Research, Belgrade, Serbia, 20–23 September 2016; pp. 309–313. [Google Scholar]
- Zavadskas, E.K.; Stevic, Z.; Turskis, Z.; Tomašević, M. A Novel Extended EDAS in Minkowski Space (EDAS-M) Method for Evaluating Autonomous Vehicle. Stud. Inform. Control 2019, 28, 255–264. [Google Scholar] [CrossRef]
- Hwang, C.L.; Yoon, K. Multiple Attributes Decision Making Methods and Application; Lecture Notes in Economics and Mathematical Systems; Springer: Berlin/Heidelberg, Germany, 1981. [Google Scholar]
- Hajduk, S.; Jelonek, D. A decision-making approach based on topsis method for ranking smart cities in the context of urban energy. Energies 2021, 14, 2691. [Google Scholar] [CrossRef]
- Yuan, J.; Luo, X. Regional energy security performance evaluation in China using MTGS and SPA-TOPSIS. Sci. Total Environ. 2019, 696, 133817. [Google Scholar] [CrossRef]
- Vavrek, R.; Chovancová, J. Assessment of economic and environmental energy perfor-mance of EU countries using CV-TOPSIS technique. Ecol. Indic. 2019, 106, 105519. [Google Scholar] [CrossRef]
- Opricovic, S. Multicriteria optimization of civil engineering systems. Fac. Civ. Eng. Belgrade 1998, 2, 5–21. [Google Scholar]
- Kim, J.; Ahn, B. The Hierarchical VIKOR Method with Incomplete Information: Supplier Selection Problem. Sustainability 2020, 12, 9602. [Google Scholar] [CrossRef]
- Akman, G. Evaluating suppliers to include green supplier development programs via fuzzy c-means and VIKOR methods. Comput. Ind. Eng. 2015, 86, 68–82. [Google Scholar] [CrossRef]
- Zavadskas, E.K.; Kalibatas, D.; Kalibatiene, D. A multi-attribute assessment using WASPAS for choosing an optimal indoor environment. Arch. Civ. Mech. Eng. 2016, 16, 76–85. [Google Scholar] [CrossRef]
- Stojić, G.; Stević, Ž.; Antuchevičienė, J.; Pamučar, D.; Vasiljević, M. A Novel Rough WASPAS Approach for Supplier Selection in a Company Manufacturing PVC Carpentry Products. Information 2018, 9, 121. [Google Scholar] [CrossRef] [Green Version]
- Zavadskas, E.K.; Turskis, Z.; Antucheviciene, J.; Zakarevicius, A. Optimization of weighted aggregated sum product assessment. Elektron. Elektrotechnika 2012, 122, 3–6. [Google Scholar] [CrossRef]
- Liao, Q.; Wang, X.; Ling, D.; Xiao, Z.; Huang, H. Equipment reliability analysis based on the Mean-rank method of two-parameter Weibull distribution. In Proceedings of the 2011 International Conference on Quality, Reliability, Risk, Maintenance, and Safety Engineering, Xi’an, China, 17–19 June 2011; pp. 361–364. [Google Scholar]
- Yu, X.H.; Zhang, L.B.; Wang, C.H. Reliability life analysis of the equipment based on new Weibull distribution parameter estimation method. J. Mech. Strength 2007, 29, 932–936. [Google Scholar]
- Lu, H.F.; Ma, X.; Ma, M.D. Impacts of the COVID-19 pandemic on the energy sector. J. Zhejiang Univ. Sci. A 2021, 22, 941–956. [Google Scholar] [CrossRef]
- Cruciani, M. The energy Transition in Sweden. Available online: https://www.ifri.org/sites/default/files/atoms/files/etude_suede_gd_ok-db2_complet.pdf (accessed on 31 October 2022).
- Guo, W.; Pan, J.; Liang, L.; Kuusisto, J.; Ma, Y. A Synthesis of Energy Transition Policies in Finland, China. Carbon Policy 2022, 36, 2022002. [Google Scholar] [CrossRef]
- Lipiäinen, S.; Sermyagina, E.; Kuparinen, K.; Vakkilainen, E. Future of forest industry in carbon-neutral reality: Finnish and Swedish visions. Energy Rep. 2022, 8, 2588–2600. [Google Scholar] [CrossRef]
- Karmellos, M.; Kopidou, D.; Diakoulaki, D. A decomposition analysis of the driving factors of CO2 (Carbon dioxide) emissions from the power sector in the European Union countries. Energy 2016, 94, 680–692. [Google Scholar] [CrossRef]
- Baležentis, T.; Streimikiene, D.; Zhang, T.; Liobikiene, G. The role of bioenergy in greenhouse gas emission reduction in EU countries: An Environmental Kuznets Curve modelling. Resour. Conserv. Recycl. 2019, 142, 225–231. [Google Scholar] [CrossRef]
- Lyeonov, S.; Pimonenko, T.; Bilan, Y.; Štreimikienė, D.; Mentel, G. Assessment of Green Investments’ Impact on Sustainable Development: Linking Gross Domestic Product Per Capita, Greenhouse Gas Emissions and Renewable Energy. Energies 2019, 12, 3891. [Google Scholar] [CrossRef] [Green Version]
- Chudy-Laskowska, K.; Pisula, T. An Analysis of the Use of Energy from Conventional Fossil Fuels and Green Renewable Energy in the Context of the European Union’s Planned Energy Transformation. Energies 2022, 15, 736. [Google Scholar] [CrossRef]
- Rabbi, M.; Popp, J.; Mate, D.; Kovacs, S. Energy Security and Energy Transition to Achieve Carbon Neutrality. Energies 2022, 15, 8126. [Google Scholar] [CrossRef]
- Andreas, J.J.; Burns, C.; Touza, J. Overcoming energy injustice? Bulgaria’s renewable energy transition in times of crisis. Energy Res. Soc. Sci. 2018, 42, 44–52. [Google Scholar] [CrossRef] [Green Version]
- Halkos, G.; Gkampoura, E. Evaluating the effect of economic crisis on energy poverty in Europe. Renew. Sustain. Energy Rev. 2021, 144, 110981. [Google Scholar] [CrossRef]
- Dobbins, A.; Fuso Nerini, F.; Deane, P.; Pye, S. Strengthening the EU response to energy poverty. Nat. Energy 2019, 4, 2–5. [Google Scholar] [CrossRef]
- Bouzarovski, S.; Thomson, H.; Cornelis, M. Confronting Energy Poverty in Europe: A Research and Policy Agenda. Energies 2021, 14, 858. [Google Scholar] [CrossRef]
- Maxim, A.; Mihai, C.; Apostoaie, C.-M.; Popescu, C.; Istrate, C.; Bostan, I. Implications and Measurement of Energy Poverty across the European Union. Sustainability 2016, 8, 483. [Google Scholar] [CrossRef] [Green Version]
- Orynycz, O.; Tucki, K.; Dudziak, A. Total Productive Maintenance Approach to an Increase of the Energy Efficiency of a Hotel Facility and Mitigation of Water Consumption. Energies 2021, 14, 1706. [Google Scholar] [CrossRef]
- Belaïd, F. Implications of poorly designed climate policy on energy poverty: Global reflections on the current surge in energy prices. Energy Res. Soc. Sci. 2022, 92, 102790. [Google Scholar] [CrossRef]


| Indicator | Designation | Stimulant/Destimulant |
|---|---|---|
| Primary energy use, tonnes of oil equivalent per capita | X1 | D |
| Primary energy use, 1990 = 100% | X2 | S |
| Energy efficiency (final energy use), tonnes of oil equivalent per capita | X3 | D |
| Energy efficiency (final energy use), 1990 = 100% | X4 | S |
| Final energy use in households per capita, kg of oil equivalent | X5 | D |
| Energy productivity, euros per kilogram of oil equivalent | X6 | S |
| Share of renewable energy in gross final energy use, % | X7 | S |
| Share of renewable energy sources in transport, % | X8 | S |
| Share of renewable energy sources in electricity, % | X9 | S |
| Share of renewable energy sources in heating and cooling, % | X10 | S |
| Energy imports, % | X11 | D |
| Energy poverty, % of population | X12 | D |
| Net greenhouse gas (GHG) emissions, 1990 = 100% | X13 | D |
| Greenhouse gas emissions, tonnes per capita | X14 | D |
| GHG intensity of energy, kg carbon dioxide equivalent/tonnes of oil equivalent | X15 | D |
| Total GHG–GDP intensity, tonnes of carbon dioxide equivalent/million EUR | X16 | D |
| Average carbon dioxide emissions per km from new passenger cars, grams of carbon dioxide per km | X17 | D |
| Indicator | Mean | Minimum Value | Maximum Value | Coefficient of Variation (CV) | Coefficient of Asymmetry (CA) |
|---|---|---|---|---|---|
| 2010 | |||||
| X1 | 3.48 | 1.63 (Romania) | 9.09 (Luxembourg) | 45.91 | 1.94 |
| X2 | 97.80 | 76.60 (Lithuania) | 110.40 (Estonia) | 7.34 | −0.65 |
| X3 | 2.55 | 1.11 (Romania) | 8.54 (Luxembourg) | 57.55 | 2.85 |
| X4 | 99.00 | 87.10 (Bulgaria) | 113.30 (Poland) | 5.89 | 0.15 |
| X5 | 637.15 | 167.00 (Malta) | 1084.00 (Finland) | 36.59 | −0.15 |
| X6 | 5.91 | 2.13 (Bulgaria) | 11.55 (Denmark) | 43.44 | 0.49 |
| X7 | 16.35 | 0.98 (Malta) | 46.10 (Sweden) | 65.77 | 0.86 |
| X8 | 4.06 | 0.00 (Malta) | 10.71 (Austria) | 65.26 | 0.66 |
| X9 | 20.99 | 0.03 (Malta) | 66.36 (Austria) | 80.31 | 1.06 |
| X10 | 22.16 | 3.1 (Netherlands) | 57.07 (Sweden) | 63.85 | 0.62 |
| X11 | 55.99 | −16.01 (Denmark) | 100.64 (Cyprus) | 50.38 | −0.43 |
| X12 | 11.98 | 0.50 (Luxembourg) | 66.5 (Bulgaria) | 114.40 | 2.68 |
| X13 | 87.66 | 24.5 (Lithuania) | 166.90 (Cyprus) | 34.09 | 0.30 |
| X14 | 9.40 | 2.50 (Sweden) | 26.5 (Luxembourg) | 51.57 | 1.64 |
| X15 | 143.49 | 126.2 (Denmark) | 162.0 (Latvia) | 7.44 | −0.06 |
| X16 | 2967.00 | 1321.78 (Sweden) | 4272.36 (Greece) | 23.16 | −0.01 |
| X17 | 544.49 | 163.05 (Sweden) | 1406.11 (Bulgaria) | 57.98 | 1.32 |
| 2015 | |||||
| X1 | 3.121 | 1.55 (Romania) | 7.27 (Luxembourg) | 40.660 | 1.600 |
| X2 | 89.511 | 72.00 (Greece) | 105.90 (Estonia) | 7.688 | −0.097 |
| X3 | 2.340 | 1.10 (Romania) | 7.00 (Luxembourg) | 50.760 | 2.614 |
| X4 | 93.470 | 78.80 (Greece) | 124.60 (Malta) | 9.339 | 1.700 |
| X5 | 554.963 | 179.00 (Malta) | 904.00 (Finland) | 33.689 | −0.040 |
| X6 | 6.930 | 2.18 (Bulgaria) | 16.18 (Ireland) | 46.984 | 1.257 |
| X7 | 20.350 | 4.99 (Luxembourg) | 52.22 (Sweden) | 57.990 | 0.846 |
| X8 | 6.576 | 0.41 (Estonia) | 24.56 (Finland) | 81.973 | 2.232 |
| X9 | 28.463 | 4.31 (Malta) | 71.49 (Austria) | 65.221 | 0.760 |
| X10 | 27.140 | 5.28 (Netherlands) | 63.24 (Sweden) | 59.634 | 0.541 |
| X11 | 56.819 | 11.18 (Estonia) | 97.32 (Malta) | 44.630 | −0.088 |
| X12 | 11.222 | 0.90 (Luxembourg) | 39.20 (Bulgaria) | 93.037 | 1.313 |
| X13 | 80.274 | 29.70 (Lithuania) | 145.80 (Cyprus) | 34.467 | 0.387 |
| X14 | 8.411 | 1.80 (Sweden) | 19.90 (Luxembourg) | 44.853 | 1.076 |
| X15 | 120.93 | 101.2 (Netherlands) | 137.20 (Estonia) | 8.089 | −0.326 |
| X16 | 2948.577 | 1194.59 (Sweden) | 4420.68 (Ireland) | 26.181 | 0.006 |
| X17 | 465.308 | 123.38 (Sweden) | 1350.58 (Bulgaria) | 61.532 | 1.451 |
| 2020 | |||||
| X1 | 2.88 | 1.44 (Malta) | 6.25 (Luxembourg) | 37.31 | 1.60 |
| X2 | 84.74 | 65.00 (Greece) | 109.80 (Poland) | 9.45 | 0.56 |
| X3 | 2.21 | 1.05 (Malta) | 6.04 (Luxembourg) | 45.81 | 2.43 |
| X4 | 91.04 | 68.20 (Greece) | 121.40 (Poland) | 13.14 | 0.84 |
| X5 | 561.52 | 204.00 (Malta) | 957.00 (Finland) | 30.47 | −0.05 |
| X6 | 7.87 | 2.47 (Bulgaria) | 22.61 (Ireland) | 54.71 | 1.91 |
| X7 | 24.36 | 10.71 (Malta) | 60.12 (Sweden) | 47.09 | 1.41 |
| X8 | 10.39 | 5.34 (Greece) | 31.85 (Sweden) | 46.11 | 3.59 |
| X9 | 35.25 | 9.49 (Malta) | 78.20 (Austria) | 54.43 | 0.68 |
| X10 | 30.96 | 6.26 (Ireland) | 66.38 (Sweden) | 55.12 | 0.52 |
| X11 | 58.02 | 10.50 (Estonia) | 97.56 (Malta) | 36.42 | 0.00 |
| X12 | 7.82 | 1.50 (Austria) | 27.50 (Bulgaria) | 91.32 | 1.54 |
| X13 | 70.09 | 20.60 (Sweden) | 147.60 (Cyprus) | 37.85 | 0.69 |
| X14 | 7.27 | 0.70 (Sweden) | 16.50 (Luxembourg) | 44.89 | 0.88 |
| X15 | 111.14 | 82.3 (Netherlands) | 133.0 (Bulgaria) | 10.38 | −0.53 |
| X16 | 2751.92 | 1078.00 (Sweden) | 4214.55 (Ireland) | 24.49 | −0.09 |
| X17 | 388.73 | 108.10 (Sweden) | 1093.92 (Bulgaria) | 56.22 | 1.44 |
| Country | Indicator, % | ||||||||||||||||
|---|---|---|---|---|---|---|---|---|---|---|---|---|---|---|---|---|---|
| X1 | X2 | X3 | X4 | X5 | X6 | X7 | X8 | X9 | X10 | X11 | X12 | X13 | X14 | X15 | X16 | X17 | |
| Belgium | 78 | 82 | 83 | 88 | 78 | 127 | 217 | 230 | 343 | 126 | 99 | 73 | 80 | 75 | 81 | 96 | 77 |
| Bulgaria | 106 | 99 | 116 | 108 | 114 | 116 | 167 | 608 | 191 | 153 | 94 | 41 | 84 | 91 | 84 | 89 | 78 |
| Czechia | 86 | 88 | 95 | 97 | 94 | 133 | 165 | 180 | 197 | 167 | 153 | 42 | 94 | 92 | 81 | 93 | 71 |
| Denmark | 73 | 77 | 81 | 85 | 82 | 148 | 145 | 844 | 200 | 168 | −280 | 158 | 67 | 64 | 76 | 85 | 61 |
| Germany | 82 | 83 | 89 | 90 | 89 | 133 | 166 | 155 | 245 | 123 | 106 | 140 | 77 | 76 | 75 | 95 | 75 |
| Estonia | 78 | 78 | 95 | 95 | 92 | 174 | 122 | 2809 | 275 | 136 | 72 | 87 | 79 | 78 | 75 | 86 | 50 |
| Ireland | 83 | 91 | 86 | 94 | 80 | 205 | 281 | 409 | 250 | 146 | 82 | 49 | 91 | 84 | 80 | 99 | 55 |
| Greece | 75 | 72 | 78 | 75 | 95 | 109 | 216 | 279 | 291 | 171 | 119 | 111 | 61 | 64 | 75 | 89 | 87 |
| Spain | 84 | 85 | 81 | 82 | 84 | 116 | 154 | 190 | 144 | 144 | 88 | 145 | 74 | 72 | 82 | 92 | 81 |
| France | 78 | 82 | 81 | 85 | 82 | 126 | 151 | 140 | 168 | 145 | 91 | 118 | 80 | 76 | 75 | 93 | 77 |
| Croatia | 93 | 88 | 95 | 90 | 87 | 119 | 124 | 587 | 143 | 112 | 115 | 69 | 87 | 92 | 88 | 93 | 76 |
| Italy | 79 | 79 | 80 | 80 | 86 | 115 | 156 | 218 | 190 | 128 | 89 | 72 | 73 | 72 | 82 | 93 | 81 |
| Cyprus | 77 | 82 | 76 | 82 | 101 | 126 | 274 | 371 | 866 | 197 | 92 | 77 | 88 | 82 | 80 | 101 | 83 |
| Latvia | 103 | 94 | 104 | 94 | 89 | 137 | 139 | 169 | 127 | 140 | 100 | 31 | 110 | 120 | 74 | 95 | 71 |
| Lithuania | 112 | 101 | 123 | 110 | 100 | 129 | 136 | 145 | 272 | 155 | 95 | 92 | 143 | 156 | 79 | 90 | 71 |
| Luxembourg | 69 | 85 | 71 | 88 | 78 | 143 | 410 | 601 | 367 | 268 | 95 | 720 | 77 | 62 | 82 | 95 | 75 |
| Hungary | 100 | 97 | 106 | 103 | 92 | 126 | 109 | 188 | 168 | 98 | 99 | 39 | 90 | 94 | 79 | 97 | 75 |
| Malta | 64 | 80 | 87 | 108 | 122 | 125 | 1094 | - | 29,653 | 316 | 99 | 50 | 71 | 58 | 77 | 86 | 49 |
| Netherlands | 78 | 81 | 78 | 82 | 71 | 131 | 357 | 372 | 275 | 260 | 241 | 104 | 77 | 73 | 61 | 98 | 76 |
| Austria | 85 | 90 | 87 | 93 | 89 | 115 | 117 | 96 | 118 | 113 | 93 | 39 | 89 | 83 | 78 | 96 | 84 |
| Poland | 100 | 100 | 107 | 107 | 96 | 133 | 173 | 99 | 248 | 187 | 135 | 22 | 94 | 94 | 85 | 91 | 69 |
| Portugal | 89 | 86 | 85 | 83 | 104 | 110 | 141 | 175 | 143 | 123 | 87 | 58 | 83 | 86 | 77 | 97 | 89 |
| Romania | 98 | 94 | 110 | 104 | 104 | 147 | 107 | 625 | 143 | 93 | 132 | 50 | 81 | 85 | 78 | 101 | 68 |
| Slovenia | 85 | 87 | 85 | 87 | 77 | 129 | 119 | 350 | 109 | 109 | 93 | 60 | 89 | 87 | 79 | 94 | 73 |
| Slovakia | 90 | 91 | 88 | 90 | 117 | 130 | 191 | 175 | 130 | 246 | 87 | 130 | 72 | 71 | 82 | 92 | 70 |
| Finland | 82 | 84 | 86 | 89 | 88 | 121 | 136 | 306 | 145 | 131 | 86 | 129 | 56 | 55 | 67 | 77 | 66 |
| Sweden | 78 | 87 | 83 | 91 | 79 | 129 | 130 | 331 | 134 | 116 | 88 | 129 | 31 | 28 | 62 | 82 | 66 |
| UE-27 average | 85 | 87 | 90 | 92 | 92 | 132 | 211 | 410 | 1316 | 158 | 91 | 105 | 81 | 80 | 78 | 92 | 72 |
| Country | MCDM Method | |||||||||
|---|---|---|---|---|---|---|---|---|---|---|
| CODAS | EDAS | TOPSIS | VIKOR | WASPAS | ||||||
| Assessment Score Hi | Rank | Assessment Score Asi | Rank | Assessment Score Pi | Rank | Assessment Score Qi | Rank | Assessment Score Qi | Rank | |
| Belgium | −0.541 | 23 | 0.364 | 23 | 0.552 | 19 | 0.335 | 22 | 0.610 | 20 |
| Bulgaria | −0.139 | 14 | 0.227 | 26 | 0.433 | 27 | 0.319 | 21 | 0.608 | 21 |
| Czechia | −0.972 | 27 | 0.427 | 18 | 0.559 | 17 | 0.308 | 20 | 0.568 | 26 |
| Denmark | 1.573 | 1 | 0.665 | 3 | 0.628 | 3 | 0.120 | 4 | 0.707 | 3 |
| Germany | −0.318 | 19 | 0.518 | 15 | 0.585 | 10 | 0.255 | 16 | 0.631 | 16 |
| Estonia | −0.599 | 25 | 0.459 | 17 | 0.557 | 18 | 0.359 | 24 | 0.551 | 27 |
| Ireland | −0.230 | 16 | 0.378 | 22 | 0.546 | 21 | 0.307 | 19 | 0.618 | 19 |
| Greece | −0.320 | 20 | 0.426 | 19 | 0.545 | 22 | 0.255 | 15 | 0.620 | 18 |
| Spain | −0.027 | 12 | 0.584 | 10 | 0.590 | 9 | 0.143 | 7 | 0.672 | 7 |
| France | −0.148 | 15 | 0.587 | 9 | 0.604 | 5 | 0.141 | 6 | 0.672 | 6 |
| Croatia | 0.063 | 10 | 0.632 | 6 | 0.602 | 6 | 0.137 | 5 | 0.664 | 10 |
| Italy | −0.073 | 13 | 0.542 | 12 | 0.580 | 12 | 0.160 | 9 | 0.666 | 8 |
| Cyprus | −0.520 | 22 | 0.239 | 25 | 0.497 | 26 | 0.455 | 26 | 0.589 | 24 |
| Latvia | 0.190 | 8 | 0.647 | 4 | 0.593 | 7 | 0.197 | 12 | 0.665 | 9 |
| Lithuania | 0.784 | 3 | 0.521 | 13 | 0.549 | 20 | 0.180 | 10 | 0.682 | 5 |
| Luxembourg | 0.528 | 5 | 0.102 | 27 | 0.522 | 25 | 0.500 | 27 | 0.604 | 22 |
| Hungary | −0.235 | 17 | 0.518 | 14 | 0.571 | 14 | 0.207 | 13 | 0.637 | 13 |
| Malta | 0.157 | 9 | 0.323 | 24 | 0.533 | 24 | 0.356 | 23 | 0.635 | 15 |
| Netherlands | −0.893 | 26 | 0.415 | 20 | 0.571 | 15 | 0.298 | 18 | 0.601 | 23 |
| Austria | 0.781 | 4 | 0.776 | 2 | 0.638 | 2 | 0.106 | 3 | 0.702 | 4 |
| Poland | −0.596 | 24 | 0.393 | 21 | 0.535 | 23 | 0.388 | 25 | 0.576 | 25 |
| Portugal | 0.436 | 6 | 0.635 | 5 | 0.562 | 16 | 0.071 | 2 | 0.710 | 2 |
| Romania | 0.241 | 7 | 0.593 | 8 | 0.576 | 13 | 0.145 | 8 | 0.657 | 11 |
| Slovenia | −0.308 | 18 | 0.600 | 7 | 0.609 | 4 | 0.190 | 11 | 0.636 | 14 |
| Slovakia | −0.381 | 21 | 0.514 | 16 | 0.581 | 11 | 0.238 | 14 | 0.622 | 17 |
| Finland | 0.042 | 11 | 0.550 | 11 | 0.593 | 8 | 0.272 | 17 | 0.640 | 12 |
| Sweden | 1.553 | 2 | 0.932 | 1 | 0.714 | 1 | 0.000 | 1 | 0.781 | 1 |
| Country | MCDM Method | |||||||||
|---|---|---|---|---|---|---|---|---|---|---|
| CODAS | EDAS | TOPSIS | VIKOR | WASPAS | ||||||
| Assessment Score Hi | Rank | Assessment Score Asi | Rank | Assessment Score Pi | Rank | Assessment Score Qi | Rank | Assessment Score Qi | Rank | |
| Belgium | −0.911 | 27 | 0.312 | 24 | 0.528 | 17 | 0.369 | 24 | 0.612 | 23 |
| Bulgaria | −0.246 | 15 | 0.239 | 25 | 0.431 | 27 | 0.367 | 23 | 0.608 | 24 |
| Czechia | −0.776 | 26 | 0.381 | 18 | 0.518 | 20 | 0.336 | 20 | 0.593 | 26 |
| Denmark | 0.715 | 4 | 0.715 | 2 | 0.617 | 2 | 0.086 | 2 | 0.730 | 2 |
| Germany | −0.573 | 22 | 0.462 | 14 | 0.551 | 8 | 0.311 | 18 | 0.629 | 19 |
| Estonia | 0.474 | 7 | 0.403 | 17 | 0.520 | 19 | 0.346 | 21 | 0.620 | 21 |
| Ireland | −0.187 | 13 | 0.368 | 20 | 0.531 | 16 | 0.347 | 22 | 0.634 | 17 |
| Greece | −0.264 | 16 | 0.330 | 23 | 0.483 | 24 | 0.266 | 15 | 0.637 | 16 |
| Spain | −0.290 | 17 | 0.468 | 13 | 0.540 | 12 | 0.235 | 11 | 0.657 | 13 |
| France | −0.361 | 18 | 0.538 | 8 | 0.573 | 5 | 0.218 | 9 | 0.672 | 9 |
| Croatia | 0.121 | 12 | 0.583 | 7 | 0.548 | 9 | 0.169 | 4 | 0.675 | 6 |
| Italy | −0.227 | 14 | 0.512 | 9 | 0.545 | 10 | 0.212 | 7 | 0.671 | 10 |
| Cyprus | −0.767 | 25 | 0.189 | 26 | 0.470 | 26 | 0.439 | 26 | 0.597 | 25 |
| Latvia | 0.233 | 10 | 0.596 | 6 | 0.539 | 13 | 0.215 | 8 | 0.673 | 7 |
| Lithuania | 0.586 | 5 | 0.435 | 16 | 0.497 | 23 | 0.241 | 13 | 0.672 | 8 |
| Luxembourg | 0.533 | 6 | 0.105 | 27 | 0.516 | 21 | 0.500 | 27 | 0.617 | 22 |
| Hungary | −0.500 | 21 | 0.455 | 15 | 0.536 | 15 | 0.285 | 16 | 0.631 | 18 |
| Malta | 0.186 | 11 | 0.359 | 21 | 0.524 | 18 | 0.332 | 19 | 0.670 | 11 |
| Netherlands | −0.628 | 23 | 0.376 | 19 | 0.541 | 11 | 0.293 | 17 | 0.626 | 20 |
| Austria | 0.376 | 8 | 0.632 | 5 | 0.581 | 4 | 0.220 | 10 | 0.687 | 5 |
| Poland | −0.670 | 24 | 0.345 | 22 | 0.509 | 22 | 0.393 | 25 | 0.590 | 27 |
| Portugal | 0.323 | 9 | 0.492 | 11 | 0.474 | 25 | 0.200 | 6 | 0.663 | 12 |
| Romania | 0.831 | 2 | 0.647 | 4 | 0.571 | 6 | 0.125 | 3 | 0.722 | 3 |
| Slovenia | −0.472 | 20 | 0.488 | 12 | 0.538 | 14 | 0.256 | 14 | 0.638 | 15 |
| Slovakia | −0.385 | 19 | 0.507 | 10 | 0.553 | 7 | 0.240 | 12 | 0.638 | 14 |
| Finland | 0.782 | 3 | 0.673 | 3 | 0.591 | 3 | 0.184 | 5 | 0.696 | 4 |
| Sweden | 2.156 | 1 | 0.925 | 1 | 0.702 | 1 | 0.000 | 1 | 0.828 | 1 |
| Country | MCDM Method | |||||||||
|---|---|---|---|---|---|---|---|---|---|---|
| CODAS | EDAS | TOPSIS | VIKOR | WASPAS | ||||||
| Assessment Score Hi | Rank | Assessment Score Asi | Rank | Assessment Score Pi | Rank | Assessment Score Qi | Rank | Assessment Score Qi | Rank | |
| Belgium | −0.730 | 27 | 0.327 | 21 | 0.524 | 19 | 0.380 | 22 | 0.612 | 23 |
| Bulgaria | −0.308 | 19 | 0.180 | 25 | 0.426 | 27 | 0.403 | 24 | 0.608 | 24 |
| Czechia | −0.297 | 18 | 0.304 | 23 | 0.504 | 22 | 0.400 | 23 | 0.593 | 26 |
| Denmark | 0.648 | 4 | 0.710 | 2 | 0.615 | 2 | 0.147 | 2 | 0.730 | 2 |
| Germany | −0.542 | 22 | 0.450 | 14 | 0.540 | 10 | 0.322 | 17 | 0.629 | 19 |
| Estonia | 0.626 | 5 | 0.505 | 12 | 0.529 | 16 | 0.281 | 13 | 0.620 | 21 |
| Ireland | 0.122 | 9 | 0.415 | 17 | 0.552 | 7 | 0.350 | 19 | 0.634 | 17 |
| Greece | −0.018 | 11 | 0.383 | 20 | 0.484 | 24 | 0.282 | 14 | 0.637 | 16 |
| Spain | −0.195 | 15 | 0.499 | 13 | 0.536 | 12 | 0.252 | 7 | 0.657 | 13 |
| France | −0.347 | 20 | 0.529 | 9 | 0.562 | 4 | 0.239 | 4 | 0.672 | 9 |
| Croatia | −0.090 | 13 | 0.552 | 5 | 0.536 | 13 | 0.250 | 6 | 0.675 | 6 |
| Italy | −0.272 | 17 | 0.531 | 8 | 0.550 | 8 | 0.246 | 5 | 0.671 | 10 |
| Cyprus | −0.614 | 24 | 0.145 | 26 | 0.442 | 26 | 0.462 | 25 | 0.597 | 25 |
| Latvia | 0.058 | 10 | 0.566 | 3 | 0.533 | 14 | 0.256 | 9 | 0.673 | 7 |
| Lithuania | −0.130 | 14 | 0.316 | 22 | 0.477 | 25 | 0.353 | 20 | 0.672 | 8 |
| Luxembourg | −0.528 | 21 | 0.097 | 27 | 0.513 | 20 | 0.500 | 27 | 0.617 | 22 |
| Hungary | −0.642 | 26 | 0.394 | 19 | 0.526 | 17 | 0.356 | 21 | 0.631 | 18 |
| Malta | 0.427 | 6 | 0.399 | 18 | 0.525 | 18 | 0.332 | 18 | 0.670 | 11 |
| Netherlands | −0.074 | 12 | 0.420 | 16 | 0.541 | 9 | 0.298 | 15 | 0.626 | 20 |
| Austria | 0.912 | 2 | 0.556 | 4 | 0.554 | 6 | 0.270 | 12 | 0.687 | 5 |
| Poland | −0.629 | 25 | 0.242 | 24 | 0.495 | 23 | 0.480 | 26 | 0.590 | 27 |
| Portugal | 0.253 | 7 | 0.544 | 7 | 0.511 | 21 | 0.196 | 3 | 0.663 | 12 |
| Romania | 0.194 | 8 | 0.512 | 11 | 0.532 | 15 | 0.261 | 10 | 0.722 | 3 |
| Slovenia | −0.227 | 16 | 0.552 | 6 | 0.555 | 5 | 0.264 | 11 | 0.638 | 15 |
| Slovakia | −0.588 | 23 | 0.445 | 15 | 0.537 | 11 | 0.320 | 16 | 0.638 | 14 |
| Finland | 0.697 | 3 | 0.525 | 10 | 0.563 | 3 | 0.254 | 8 | 0.696 | 4 |
| Sweden | 2.351 | 1 | 0.928 | 1 | 0.686 | 1 | 0.000 | 1 | 0.828 | 1 |
| CODAS | EDAS | TOPSIS | VIKOR | WASPAS | |
|---|---|---|---|---|---|
| CODAS | 1.000 | 0.559 | 0.364 | 0.605 | 0.803 |
| EDAS | 0.559 | 1.000 | 0.893 | 0.910 | 0.831 |
| TOPSIS | 0.364 | 0.893 | 1.000 | 0.786 | 0.683 |
| VIKOR | 0.605 | 0.910 | 0.786 | 1.000 | 0.911 |
| WASPAS | 0.803 | 0.831 | 0.683 | 0.911 | 1.000 |
| Note: Statistically significant values are marked in bold. | |||||
| CODAS | EDAS | TOPSIS | VIKOR | WASPAS | |
|---|---|---|---|---|---|
| CODAS | 1.000 | 0.542 | 0.336 | 0.580 | 0.743 |
| EDAS | 0.542 | 1.000 | 0.832 | 0.933 | 0.871 |
| TOPSIS | 0.336 | 0.832 | 1.000 | 0.701 | 0.709 |
| VIKOR | 0.580 | 0.933 | 0.701 | 1.000 | 0.914 |
| WASPAS | 0.743 | 0.871 | 0.709 | 0.914 | 1.000 |
| Note: Statistically significant values are marked in bold. | |||||
| CODAS | EDAS | TOPSIS | VIKOR | WASPAS | |
|---|---|---|---|---|---|
| CODAS | 1.000 | 0.628 | 0.439 | 0.615 | 0.685 |
| EDAS | 0.628 | 1.000 | 0.767 | 0.913 | 0.798 |
| TOPSIS | 0.439 | 0.767 | 1.000 | 0.684 | 0.617 |
| VIKOR | 0.615 | 0.913 | 0.684 | 1.000 | 0.803 |
| WASPAS | 0.685 | 0.798 | 0.617 | 0.803 | 1.000 |
| Note: Statistically significant values are marked in bold. | |||||
| Country | MCDM Method | Asfinal | Rank | ||||
|---|---|---|---|---|---|---|---|
| CODAS | EDAS | TOPSIS | VIKOR | WASPAS | |||
| Assessment Score Hi | Assessment Score Asi | Assessment Score Pi | Assessment Score Qi | Assessment Score Qi | |||
| Belgium | 0.169 | 0.316 | 0.424 | 0.330 | 0.255 | 0.299 | 21 |
| Bulgaria | 0.327 | 0.150 | 0.000 | 0.362 | 0.247 | 0.217 | 26 |
| Czechia | 0.000 | 0.391 | 0.447 | 0.384 | 0.074 | 0.259 | 22 |
| Denmark | 1.000 | 0.678 | 0.694 | 0.760 | 0.678 | 0.762 | 2 |
| Germany | 0.257 | 0.501 | 0.542 | 0.490 | 0.346 | 0.427 | 15 |
| Estonia | 0.146 | 0.430 | 0.439 | 0.281 | 0.000 | 0.259 | 22 |
| Ireland | 0.291 | 0.332 | 0.401 | 0.386 | 0.291 | 0.340 | 19 |
| Greece | 0.256 | 0.390 | 0.399 | 0.491 | 0.301 | 0.367 | 17 |
| Spain | 0.371 | 0.580 | 0.560 | 0.714 | 0.527 | 0.550 | 9 |
| France | 0.324 | 0.584 | 0.609 | 0.718 | 0.527 | 0.552 | 8 |
| Croatia | 0.407 | 0.638 | 0.601 | 0.725 | 0.492 | 0.573 | 5 |
| Italy | 0.353 | 0.530 | 0.522 | 0.680 | 0.500 | 0.517 | 11 |
| Cyprus | 0.177 | 0.165 | 0.228 | 0.090 | 0.164 | 0.165 | 27 |
| Latvia | 0.457 | 0.656 | 0.568 | 0.606 | 0.496 | 0.557 | 7 |
| Lithuania | 0.690 | 0.504 | 0.413 | 0.640 | 0.568 | 0.563 | 6 |
| Luxembourg | 0.590 | 0.000 | 0.315 | 0.000 | 0.230 | 0.227 | 25 |
| Hungary | 0.290 | 0.501 | 0.491 | 0.587 | 0.374 | 0.449 | 14 |
| Malta | 0.444 | 0.266 | 0.355 | 0.288 | 0.365 | 0.344 | 18 |
| Netherlands | 0.031 | 0.377 | 0.491 | 0.403 | 0.216 | 0.304 | 20 |
| Austria | 0.689 | 0.812 | 0.730 | 0.787 | 0.659 | 0.735 | 3 |
| Poland | 0.148 | 0.350 | 0.361 | 0.225 | 0.109 | 0.239 | 24 |
| Portugal | 0.553 | 0.642 | 0.459 | 0.859 | 0.692 | 0.641 | 4 |
| Romania | 0.477 | 0.592 | 0.509 | 0.709 | 0.461 | 0.550 | 10 |
| Slovenia | 0.261 | 0.599 | 0.625 | 0.621 | 0.371 | 0.495 | 12 |
| Slovakia | 0.232 | 0.496 | 0.526 | 0.523 | 0.307 | 0.417 | 16 |
| Finland | 0.399 | 0.539 | 0.567 | 0.455 | 0.386 | 0.469 | 13 |
| Sweden | 0.992 | 1.000 | 1.000 | 1.000 | 1.000 | 0.998 | 1 |
| Country | MCDM Method | Asfinal | Rank | ||||
|---|---|---|---|---|---|---|---|
| CODAS | EDAS | TOPSIS | VIKOR | WASPAS | |||
| Assessment Score Hi | Assessment Score Asi | Assessment Score Pi | Assessment Score Qi | Assessment Score Qi | |||
| Belgium | 0.000 | 0.251 | 0.359 | 0.261 | 0.092 | 0.193 | 23 |
| Bulgaria | 0.217 | 0.163 | 0.000 | 0.265 | 0.076 | 0.144 | 26 |
| Czechia | 0.044 | 0.335 | 0.323 | 0.328 | 0.013 | 0.209 | 22 |
| Denmark | 0.530 | 0.743 | 0.686 | 0.828 | 0.588 | 0.675 | 2 |
| Germany | 0.110 | 0.435 | 0.444 | 0.378 | 0.164 | 0.306 | 18 |
| Estonia | 0.452 | 0.363 | 0.328 | 0.309 | 0.126 | 0.316 | 16 |
| Ireland | 0.236 | 0.321 | 0.368 | 0.307 | 0.185 | 0.283 | 19 |
| Greece | 0.211 | 0.274 | 0.194 | 0.468 | 0.197 | 0.269 | 21 |
| Spain | 0.202 | 0.443 | 0.403 | 0.530 | 0.282 | 0.372 | 12 |
| France | 0.179 | 0.528 | 0.526 | 0.564 | 0.345 | 0.428 | 8 |
| Croatia | 0.337 | 0.583 | 0.431 | 0.663 | 0.357 | 0.474 | 6 |
| Italy | 0.223 | 0.496 | 0.420 | 0.576 | 0.340 | 0.411 | 9 |
| Cyprus | 0.047 | 0.102 | 0.144 | 0.121 | 0.029 | 0.089 | 27 |
| Latvia | 0.373 | 0.598 | 0.401 | 0.570 | 0.349 | 0.458 | 7 |
| Lithuania | 0.488 | 0.402 | 0.246 | 0.517 | 0.345 | 0.400 | 10 |
| Luxembourg | 0.471 | 0.000 | 0.316 | 0.000 | 0.113 | 0.180 | 24 |
| Hungary | 0.134 | 0.426 | 0.386 | 0.430 | 0.172 | 0.310 | 17 |
| Malta | 0.358 | 0.310 | 0.344 | 0.336 | 0.336 | 0.337 | 15 |
| Netherlands | 0.092 | 0.330 | 0.406 | 0.415 | 0.151 | 0.279 | 20 |
| Austria | 0.420 | 0.643 | 0.555 | 0.560 | 0.408 | 0.517 | 5 |
| Poland | 0.079 | 0.292 | 0.288 | 0.215 | 0.000 | 0.175 | 25 |
| Portugal | 0.402 | 0.472 | 0.161 | 0.601 | 0.307 | 0.389 | 11 |
| Romania | 0.568 | 0.661 | 0.518 | 0.750 | 0.555 | 0.610 | 3 |
| Slovenia | 0.143 | 0.467 | 0.395 | 0.489 | 0.202 | 0.339 | 14 |
| Slovakia | 0.172 | 0.489 | 0.449 | 0.521 | 0.202 | 0.367 | 13 |
| Finland | 0.552 | 0.692 | 0.589 | 0.631 | 0.445 | 0.582 | 4 |
| Sweden | 1.000 | 1.000 | 1.000 | 1.000 | 1.000 | 1.000 | 1 |
| Country | MCDM Method | Asfinal | Rank | ||||
|---|---|---|---|---|---|---|---|
| CODAS | EDAS | TOPSIS | VIKOR | WASPAS | |||
| Assessment Score Hi | Assessment Score Asi | Assessment Score Pi | Assessment Score Qi | Assessment Score Qi | |||
| Belgium | 0.000 | 0.277 | 0.377 | 0.240 | 0.092 | 0.197 | 22 |
| Bulgaria | 0.137 | 0.100 | 0.000 | 0.194 | 0.076 | 0.101 | 26 |
| Czechia | 0.141 | 0.249 | 0.300 | 0.200 | 0.013 | 0.181 | 23 |
| Denmark | 0.447 | 0.738 | 0.727 | 0.706 | 0.588 | 0.641 | 2 |
| Germany | 0.061 | 0.425 | 0.438 | 0.356 | 0.164 | 0.289 | 18 |
| Estonia | 0.440 | 0.491 | 0.396 | 0.438 | 0.126 | 0.378 | 11 |
| Ireland | 0.277 | 0.383 | 0.485 | 0.300 | 0.185 | 0.326 | 15 |
| Greece | 0.231 | 0.344 | 0.223 | 0.436 | 0.197 | 0.286 | 19 |
| Spain | 0.174 | 0.484 | 0.423 | 0.496 | 0.282 | 0.372 | 13 |
| France | 0.124 | 0.520 | 0.523 | 0.522 | 0.345 | 0.407 | 9 |
| Croatia | 0.208 | 0.548 | 0.423 | 0.500 | 0.357 | 0.407 | 8 |
| Italy | 0.149 | 0.522 | 0.477 | 0.508 | 0.340 | 0.399 | 10 |
| Cyprus | 0.038 | 0.058 | 0.062 | 0.076 | 0.029 | 0.053 | 27 |
| Latvia | 0.256 | 0.564 | 0.412 | 0.488 | 0.349 | 0.414 | 7 |
| Lithuania | 0.195 | 0.264 | 0.196 | 0.294 | 0.345 | 0.259 | 20 |
| Luxembourg | 0.066 | 0.000 | 0.335 | 0.000 | 0.113 | 0.103 | 24 |
| Hungary | 0.029 | 0.357 | 0.385 | 0.288 | 0.172 | 0.246 | 21 |
| Malta | 0.376 | 0.363 | 0.381 | 0.336 | 0.336 | 0.358 | 14 |
| Netherlands | 0.213 | 0.389 | 0.442 | 0.404 | 0.151 | 0.320 | 16 |
| Austria | 0.533 | 0.552 | 0.492 | 0.460 | 0.408 | 0.489 | 3 |
| Poland | 0.033 | 0.174 | 0.265 | 0.040 | 0.000 | 0.102 | 25 |
| Portugal | 0.319 | 0.538 | 0.327 | 0.608 | 0.307 | 0.420 | 6 |
| Romania | 0.300 | 0.499 | 0.408 | 0.478 | 0.555 | 0.448 | 5 |
| Slovenia | 0.163 | 0.548 | 0.496 | 0.472 | 0.202 | 0.376 | 12 |
| Slovakia | 0.046 | 0.419 | 0.427 | 0.360 | 0.202 | 0.291 | 17 |
| Finland | 0.463 | 0.515 | 0.527 | 0.492 | 0.445 | 0.488 | 4 |
| Sweden | 1.000 | 1.000 | 1.000 | 1.000 | 1.000 | 1.000 | 1 |
| CODAS | EDAS | TOPSIS | VIKOR | WASPAS | |
|---|---|---|---|---|---|
| CODAS | 0.714 | 0.687 | 0.791 | 0.731 | 0.714 |
| EDAS | 0.933 | 0.888 | 0.938 | 0.920 | 0.933 |
| TOPSIS | 0.802 | 0.811 | 0.744 | 0.786 | 0.802 |
| VIKOR | 0.949 | 0.824 | 0.906 | 0.893 | 0.949 |
| WASPAS | 0.951 | 0.840 | 0.883 | 0.891 | 0.951 |
| Note: Statistically significant values are marked in bold. | |||||
Disclaimer/Publisher’s Note: The statements, opinions and data contained in all publications are solely those of the individual author(s) and contributor(s) and not of MDPI and/or the editor(s). MDPI and/or the editor(s) disclaim responsibility for any injury to people or property resulting from any ideas, methods, instructions or products referred to in the content. |
© 2023 by the authors. Licensee MDPI, Basel, Switzerland. This article is an open access article distributed under the terms and conditions of the Creative Commons Attribution (CC BY) license (https://creativecommons.org/licenses/by/4.0/).
Share and Cite
Brodny, J.; Tutak, M. Assessing the Energy and Climate Sustainability of European Union Member States: An MCDM-Based Approach. Smart Cities 2023, 6, 339-367. https://doi.org/10.3390/smartcities6010017
Brodny J, Tutak M. Assessing the Energy and Climate Sustainability of European Union Member States: An MCDM-Based Approach. Smart Cities. 2023; 6(1):339-367. https://doi.org/10.3390/smartcities6010017
Chicago/Turabian StyleBrodny, Jarosław, and Magdalena Tutak. 2023. "Assessing the Energy and Climate Sustainability of European Union Member States: An MCDM-Based Approach" Smart Cities 6, no. 1: 339-367. https://doi.org/10.3390/smartcities6010017