1. Introduction
The positive effects of applying intelligent transportation solutions in the city are felt by all city users. Relieving traffic congestion by promoting alternative modes of transportation, as well as the application of a modern traffic control system allows for to reduce of emissions of exhaust fumes and other air pollutants (low-emission transport), improving traffic flow and thus increasing the comfort of movement (among other things, by reducing travel time), as well as the level of traffic safety [
1,
2,
3].
The use of bicycle transportation for travel whether within a city or between cities is an important factor that has a positive impact on the quality of life of residents, particularly in the aspect related to the environmental friendliness of transportation [
4,
5,
6]. Also, it is an important part of the quality of life in the Smart City because of not only the ability to move to work, store, etc., but also the extensive network of bicycle paths provides many opportunities for leisure activities [
7,
8,
9,
10].
The very important scope of this paper is to give an analysis of why the bike road system is important for the smart city concept. Generally, mobility is one of the major factors connected with a smart city [
11]. In his paper, Namiot and Sneps-Sneppe point out that bicycles are now an important element of smart mobility systems [
12]. We can observe the rise in the world cities of usage of bikes as an important component of transport [
13].
To use bikes in cities we need to prepare an extensive bike road system because without it the broad usage of bikes is difficult [
14]. The roads should be both within the cities and between them.
The smart city concept consists of six key areas: Smart Government, Smart Economy, Smart Environment, Smart Living, Smart Mobility and Smart People [
15,
16,
17]. The usage of bikes in the city is a part of the Smart Mobility area.
Many smart city models include indicators connected with bike usage and this is proof that bike usage is an important concept connected with the modern smart city. For example, Orłowski and Romanowska describe travelling by bike as one of the indicators used in their smart mobility indicator [
18]. Also, Dudych and Piątkowski in their analysis of smart mobility solutions describe the usage of bikes and especially bike-sharing systems as an important factor connected Smart Mobility concept [
19]. The authors of the report from Deloitte point out that bike commuting is a very important part of smart mobility [
19]. According to them: investing in bike infrastructure, building smart biking infrastructure and encouraging bike-sharing programs are the main factors to improve Smart Mobility in modern cities.
In another paper about Smart Mobility in Smart City [
20] authors also use travelling by bike as one of the factors of Smart Mobility. They also use the bicycle routes as one of the sub-indicators in technical infrastructure indicators in their concept of Smart Mobility measurement.
A city without an extensive system of bike roads can’t be smart because it can’t use new concepts of bike sharing and other smart solutions. A bike-sharing system is a service in which bikes are available for individual users to share on a very short-term basis. In the newfangled bike-sharing solution there is a special smartphone application to monitor the system. Those bike-sharing systems can be also very beneficial for the cities [
21]. The extensive bike road system is the first step to building bike-sharing facilities. After in particular area will be enough amount of bike lanes the local authorities can start to build a system of bike sharing [
22].
Based on cited literature it can be observed that the bike road system is an important part of Smart Mobility. The amount of bicycle roads can be seen as one of the technical-infrastructure indicators used to measure the potential of the Smart Mobility system. Taking this into account the analysis of the development of bike roads in particular provinces of Poland, which is conducted in this paper is a contribution to the knowledge about Smart Cities in the area of Smart Mobility.
Taking into account the experience of leading European cities such as Copenhagen [
23] in terms of the implementation of various aspects of a Smart City, it can be concluded that it is difficult to say that a city is Smart if it does not have a developed network of bicycle paths both within the city itself and between cities. It is clear that a network of bicycle paths alone is not enough, it is also necessary to invest in, for example, a system of city bicycles, etc., tools supporting the frequent use of bicycle transportation. However, without a sufficiently extensive network of well-designed bicycle paths, it is difficult to talk about the construction of an urban bicycle system, because even if it is developed, residents will not use it often [
24,
25,
26].
The other problem very important of the bicycle network in a smart city is the maintenance of bicycle roads. The building of the bicycle road is a costly process but the road should be also preserved which needs effort and money. The amount of international analysis on cycling infrastructure maintenance is very limited. But there are some exemplary studies to analyse the cost of building and maintenance of bicycle roads with the competition of benefits. Anna Garet on the example of the Dutch bike road system [
27] points out that cycling makes society richer. Especially when we try to compare the use of cars in which travel below 3 people and bike it can be observed that there is an economic benefit by one kilometre cycled [
27].
To decrease the cost of maintenance of bicycle roads the designer should think about the maintenance of it when planning the concept of the road. Also, the special types of bicycle facilities such for example bike lanes or bike trials may require special, enhanced maintenance equipment [
28]. We can observe that some reports say [
29] that there is no consistent maintenance standard for bike roads [
30]. The problem in the case of bike road maintenance cost analysis is also observed in Canadian reports about bike roads. In this report, the authors say that maintenance costs are not included in the cost estimation which was provided in the report but should be taken into account when the local government will analyze the life cycle cost of bicycle infrastructure [
30].
An analysis of publications collected in the Scopus and Web of Science databases on Smart City issues allowed us to conclude that there is a research gap in terms of a comprehensive analysis of the development of the bicycle network in Poland in recent years, and to examine whether and to what extent the expansion of the bicycle network depends on the level of wealth of individual provinces.
Based on the identified research gap, the following research objectives were set:
C1: To investigate what is the amount of bicycle roads in Poland and how it changed between 2012 and 2021.
C2: To investigate what is the amount of bicycle roads in Poland per capita.
C3: Investigate whether the number of bicycle roads in each province is related to the wealth of the population as measured by the level of GDP per capita.
To realize those goals we formulated the following scientific hypothesis:
H1. The length of bicycle paths in a province is correlated with the GDP per capita in that province.
H2. The length of bicycle paths per 10,000 inhabitants in a given province is correlated with the GDP per capita in that province.
H3. The length of bicycle paths per 100 km2 of the area in a given province is correlated with the GDP per capita in that province.
2. Literature Review
Cities, and the idea of many people functioning together in a relatively small space, are some of humanity’s greatest achievements. Urban life, although full of challenges and sacrifices, has been one of the most significant catalysts for continuous human development. Decision-making, scientific and economic centres were concentrated in cities [
31,
32,
33]. The coexistence and cooperation of human individuals trigger new dependencies and produce the exchange of ideas and new reactions [
34,
35,
36]. However, cities must constantly evoke and adapt to the changing needs of their inhabitants, hence the evolution of innovation was usually cities, which in turn essentially supported the development of their states [
37].
A smart city can be defined as a well-functioning forward-looking city created by the above six areas and based on the active participation of informed, independent and decisive citizens [
38,
39,
40,
41]. The essential element distinguishing this concept from previous models of sustainable development is the presence of “mobility” as a separate, important dimension defining communication accessibility, ICT infrastructure and innovative and safe transportation systems [
42]. Smart cities are emerging because of the intelligent use of digital information in areas such as health care, mobility, energy consumption, education, knowledge transfer and urban management [
37,
43].
The most important goals of the smart city include [
44,
45,
46]:
improving the quality of life of citizens,
ensuring economic growth,
improving the well-being of residents by ensuring the availability of social and social services,
ensuring better service delivery and infrastructure expansion,
improving the ability to solve problems related to climate change and the environment,
ensuring effective regulatory mechanisms based on do-good urban management practices.
The use of bikes can be very beneficial for smart cities nowadays in the era of many interconnected devices usage and decision making based on extensive data analysis [
47]. In the future smart city, we will observe an increase in more developed infrastructure useful for bikes and cyclists like pedal-powered filters that can be useful in the air pollution cleaning process, smart lights useful to prevent possible accidents, or cycle-based sensors useful to report the condition of the traffic in the city [
48,
49]. A very useful concept which can bring many benefits in the case of management of bicycle roads system is a smart tire, This concept can help the vehicles (among them bikes) to communicate the friction level to increase the driver’s safety. This is very important because it can increase the level of safety among bikers and safety is one of the important concepts in the smart city. Using a smart sensing system with a potential data acquisition platform can bring a practical resilient and cost-effective solution to increase the safety of bikers and bike road longevity [
50,
51]. Using those smart sensors can be very important for smart city concept implementation and can give real-time information and a system of proper alerts for adjusting the biker’s behaviour. For now, smart tires are used in cars but the technology can be also used in bikes. This concept of smart tire usage can be very beneficial from the sustainability of the smart city point of view and is useful for the bicycle industry and bicycle infrastructure engineering and maintenance [
52,
53,
54].
A very important factor which has an impact on the transformation of smart cities towards more usage of bikes is connected with the environmental problems connected with too big usage of traditional transport [
55,
56]. Climate change and environmental problems connected with pollution are European and global concerns. Because of that one of the important goals of The Agenda for Sustainable Development is connected with making cities and human settlements as safe, resilient and inclusive as possible [
57]. One of the most important factors of it is connected with mobility [
58,
59].
One of the components of a modern smart city is smart mobility. For Polish cities, the implementation of smart mobility solutions is necessary primarily because of the high rate of air pollution from automobile exhaust fumes, the long downtime in traffic congestion, and the high number of car accidents that negatively affect the sense of safety of city residents [
60,
61].
A balanced approach, combining innovative technologies and the needs of city residents, is needed to achieve maximum impact when introducing the various elements of smart mobility [
62,
63]. Smart mobility should integrate technologies, systems, infrastructure and capabilities, in which innovation is a means, not a goal [
63].
An important way to advance the concept of smart mobility is to use alternative modes of transportation, such as bicycles, scooters, etc. Commuting to work by bicycle or scooter is a good option because of the lack of traffic stoppage, lack of emissions and improved physical fitness [
64,
65]. It also has a positive impact on environmental issues by reducing the number of greenhouse gases emitted by cars [
66,
67,
68].
When cycling will increase in popularity, cities will include new technology and bike-sharing systems as a part of their strategy to become more interconnected and smart. The concept of increasing the usage of bikes in urban transport is promoted in many cities for example Warsaw, Paris, Copenhagen and Barcelona [
34,
35,
69]. Those cities can use bike-related eco-friendly solutions and are engaged in the promotion of bike usage and bike sharing among citizens [
36].
The decision to regulate bicycle transportation in Copenhagen was made by the city government in the early 2000s. In 2002, the assumptions of a comprehensive city policy called Cycle Policy 2002–2012 were published [
70,
71]. Confirmation of the continuity of these efforts is the current document Good, Better, Best: The City of Copenhagen’s Bicycle Strategy 2011–2025 [
72]. The primary goals are to increase the share of bicycles in transportation to work and school to 50% of all trips and to make Copenhagen free of CO
2 emissions from transportation by 2025. Specific tools and actions to achieve this are described in the main axes of Copenhagen’s bicycle strategy for 2011–2025, which are: travel time, sense of security, comfort, and lifestyle and image [
73].
An extensive network of bicycle paths is undoubtedly an important element of a modern Smart City, and it is also a very important factor in the greening of the economy. Especially now that the European Union is introducing a policy of decarbonization, it seems that a significant reduction in exhaust emissions and car traffic can be achieved by improving public transportation and expanding bicycle paths [
74,
75,
76,
77]. Many researchers dealing with smart city issues point out the possibility of the pro-environmental impact of the application of smart mobility—including the expansion of the bicycle path network [
63,
73,
78,
79]. Most Polish cities have urban bicycle and scooter (including electric) rental systems [
44]. The main factor influencing the potential increase in the number of people using this type of transportation is the improvement of road safety. The expansion of bicycle paths, intersections with dedicated bicycle lights, and the possibility to rent bicycles and scooters can contribute to the popularization of smart biking [
78,
79,
80,
81,
82,
83].
3. Methodology
To analyze aspects connected with bikes’ role in Smart Mobility the proper indicators are needed. In this publication, the main concept of division of Smart mobility indicator was used on the basis of Wawer and all [
20]. They divided Smart Mobility indicators into groups and one of these groups is a technical-infrastructure indicator. In this group, one of the sub-indicators is—bicycle routes. This concept was used as a starting point for the analysis in the presented paper. On the basis of this, the system of indicators to measure in the paper was prepared.
On the basis of the literature studies analysis following research premises can be observed:
The lack of studies analyzing the changes in bicycle road systems in the last decade.
Lack of analysis trying to find out the relations between wealth measure using GDP indicator and the bike road system.
The analysis of geographical differences in Poland between bike road systems between particular provinces.
This publication uses data on the operation of bicycle roads in Poland from 2012 to 2021 for analysis. It uses data collected by the Polish Central Statistical Office, which are collected in databases at:
https://bdl.stat.gov.pl/bdls/start (accessed on 7 January 2023) [
84]. The analysis covered the last 10 years. The latest data that are currently available in terms of complete statistics are from 2021, and it was decided to end the conducted analysis on this year. The indicator connected with the bicycle length is proper because it can measure the bike path system in objective ways and also the data are collected by mentioned Polish Central Offices and can give the possibility to analyze it by ten years.
We analyzed data for all Polish 16 provinces: Lower Silesia, Kuyavia-Pomerania, Lublin Province, and Lubusz Province. Lodz Province, Lesser Poland, Masovia, Opole Province, Sub-carpatia, Podlasie Province, Pomerania, Silesia, Holy Cross, Warmia-Masuria, Greater Poland, West Pomerania.
In the analysis, we have used data about the length of bicycle routes in individual provinces within Poland.
Because it can be supposed that the building bicycle road is a costly process it is interesting to analyze relations between length of bike roads and the wealth of the particular province. The wealth can be best measure using GDP. The reasons why the GDP is a good measure of economic well-being is described for example by Dynan and Sheiner [
85] or Bizkova et al. [
86].
When we try to analyze the relations between GDP and bicycle road system it should be taken into accounts that particular provinces vary in population number and area. Because of that it is not enough compare only data about total length of bicycle roads. It would be useful to analyze the data with regards to number of inhabitant and the area of the province.
To prepare the analysis the data about the indicators of GDP per capita in individual provinces, the area of the provinces and the population of the individual provinces were used.
On the basis of the collected data, indicators of saturation of provinces with bicycle paths were calculated; the following formulas were used here:
where:
BpI—length of bicycle paths per 10,000 inhabitants
Bp—length of bicycle paths
I—number of inhabitans
where:
BpA—length of bicycle paths per 100 km2 of area
Bp—length of bicycle paths
A—area in km2
The indicators were prepared according to the set of rules on how to develop indicators in social sciences [
87,
88,
89].
The STATISCICA-13.3 software was used to analyze the collected data. All correlation coefficients were calculated at the α = 0.05 level of statistical significance.
4. Results
In this chapter, there will be the presentation of the main results of the paper. The results will be discussed in the next chapter.
Table 1 and
Table 2 contain data on the total length of bicycle roads in Poland over the years 2011–2021 in the whole country as well as by individual provinces.
Table 1 collects data for 2017–2021 and
Table 2 for 2012–2016.
The road for bicycles (bicycle path)—a road or a part thereof intended for the movement of single-track bicycles, marked with appropriate road signs (the Law on Road Traffic of 20 June 1997 [
90]. The data include the length of roads for bicycles under the jurisdiction of the municipality, county and marshal’s office, respectively (excluding the length of bicycle routes), i.e.,: stand-alone roads for bicycles (located in the lane of the road); roads separated from the roadway; roads separated from the sidewalk; roads included in pedestrian and bicycle paths. The length of roads for bicycles is considered to be the length of roads running in one direction. The length of roads located on two sides of the road is counted separately. Included are roads used mainly for transportation purposes and not for tourist purposes, the so-called bicycle routes (e.g., located in the forest).
The collected data shows that in 2021 there were a total of 18,509.9 km of bicycle roads in Poland. The largest number was in the capital province of Masovia—2709.8 km, followed by Greater Poland province with 2338.7 km and Pomerania with 1549.9 km. The least developed network of bicycle paths has the following provinces: Holy Cross 418.8 km; Opole Province—582.3 km; Subcarpatia—719.3 km; Warmia-Masuria—743.6 and Lubusz Province 744.2 km.
In
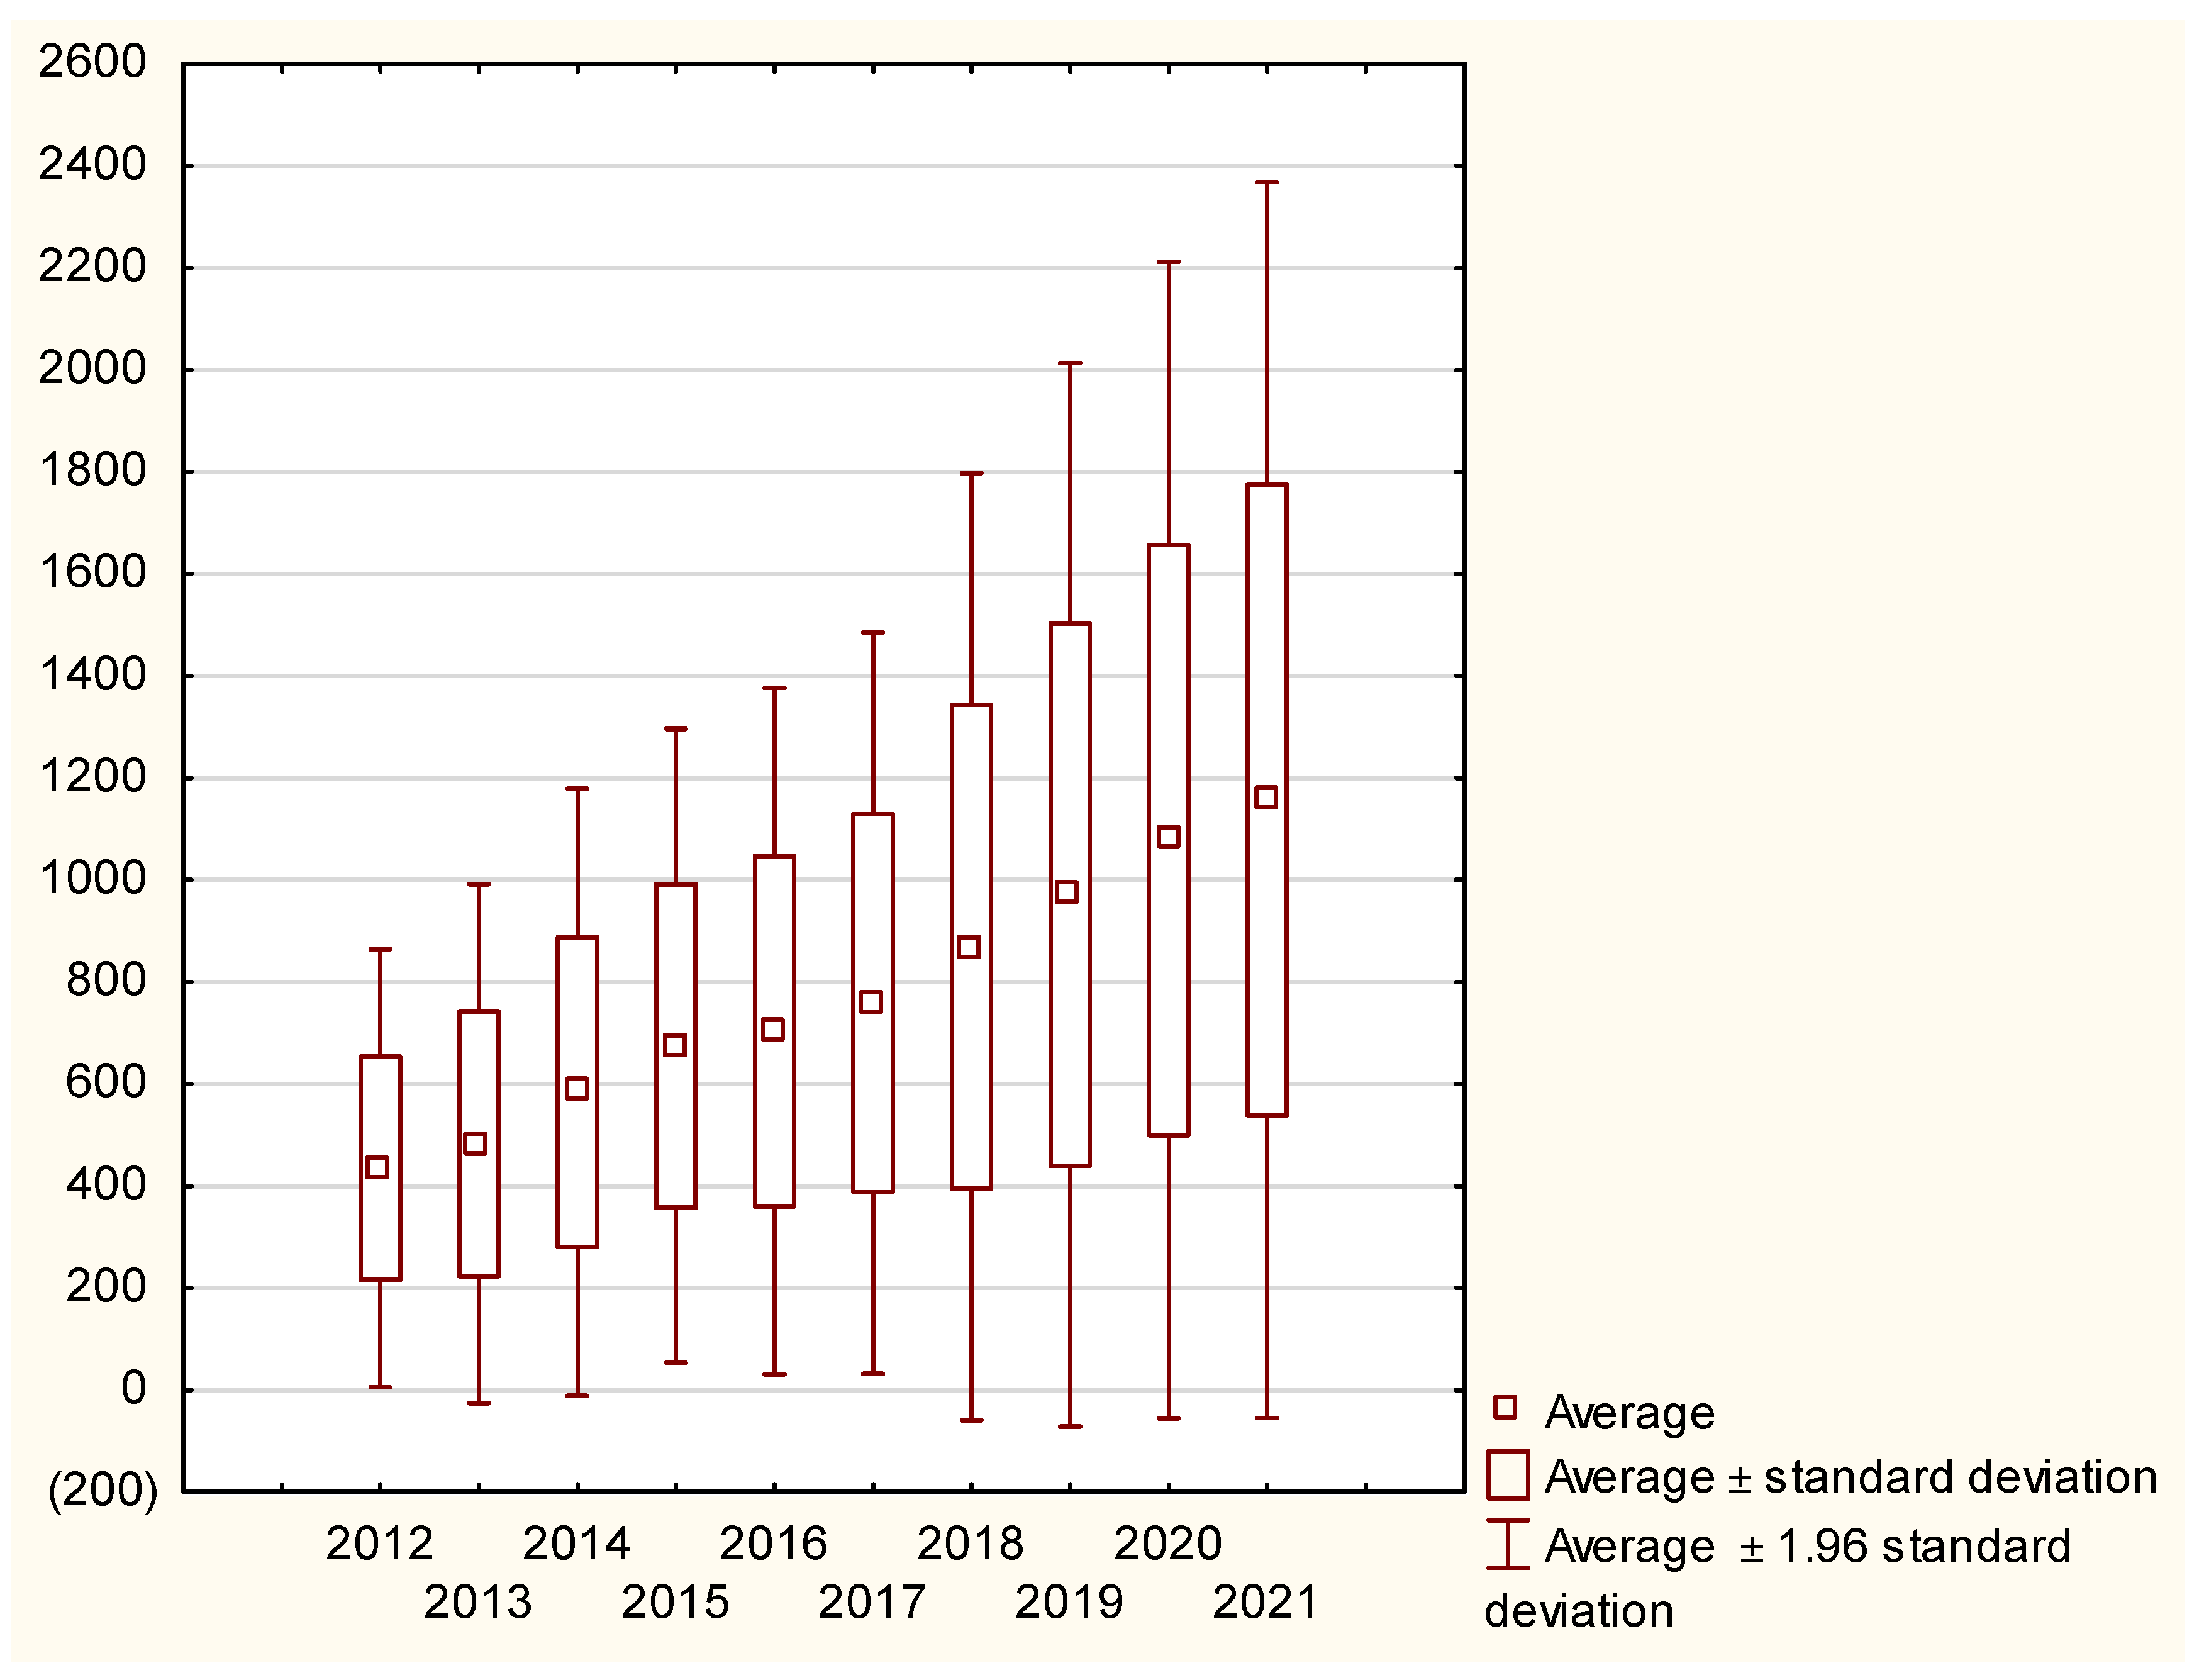
Table 3 there is and juxtaposition of basic descriptive statistics for the variability of bike road lengths in the following years from 2012 to 2021. In the table, there are data about the average value, median, minimum value, maximum value and standard deviation.
Figure 1 is a box plot to illustrate statistical variability. We can observe that the standard deviation is increasing year by year because of the increasing total amount of bicycle road lengths between 2012–2021. In the year 2012 the average bicycle length was 434,7 km per province in 2021 the average increased to 1159,9 km. The total amount of bicycle road length between 2012–2021 was 266%.
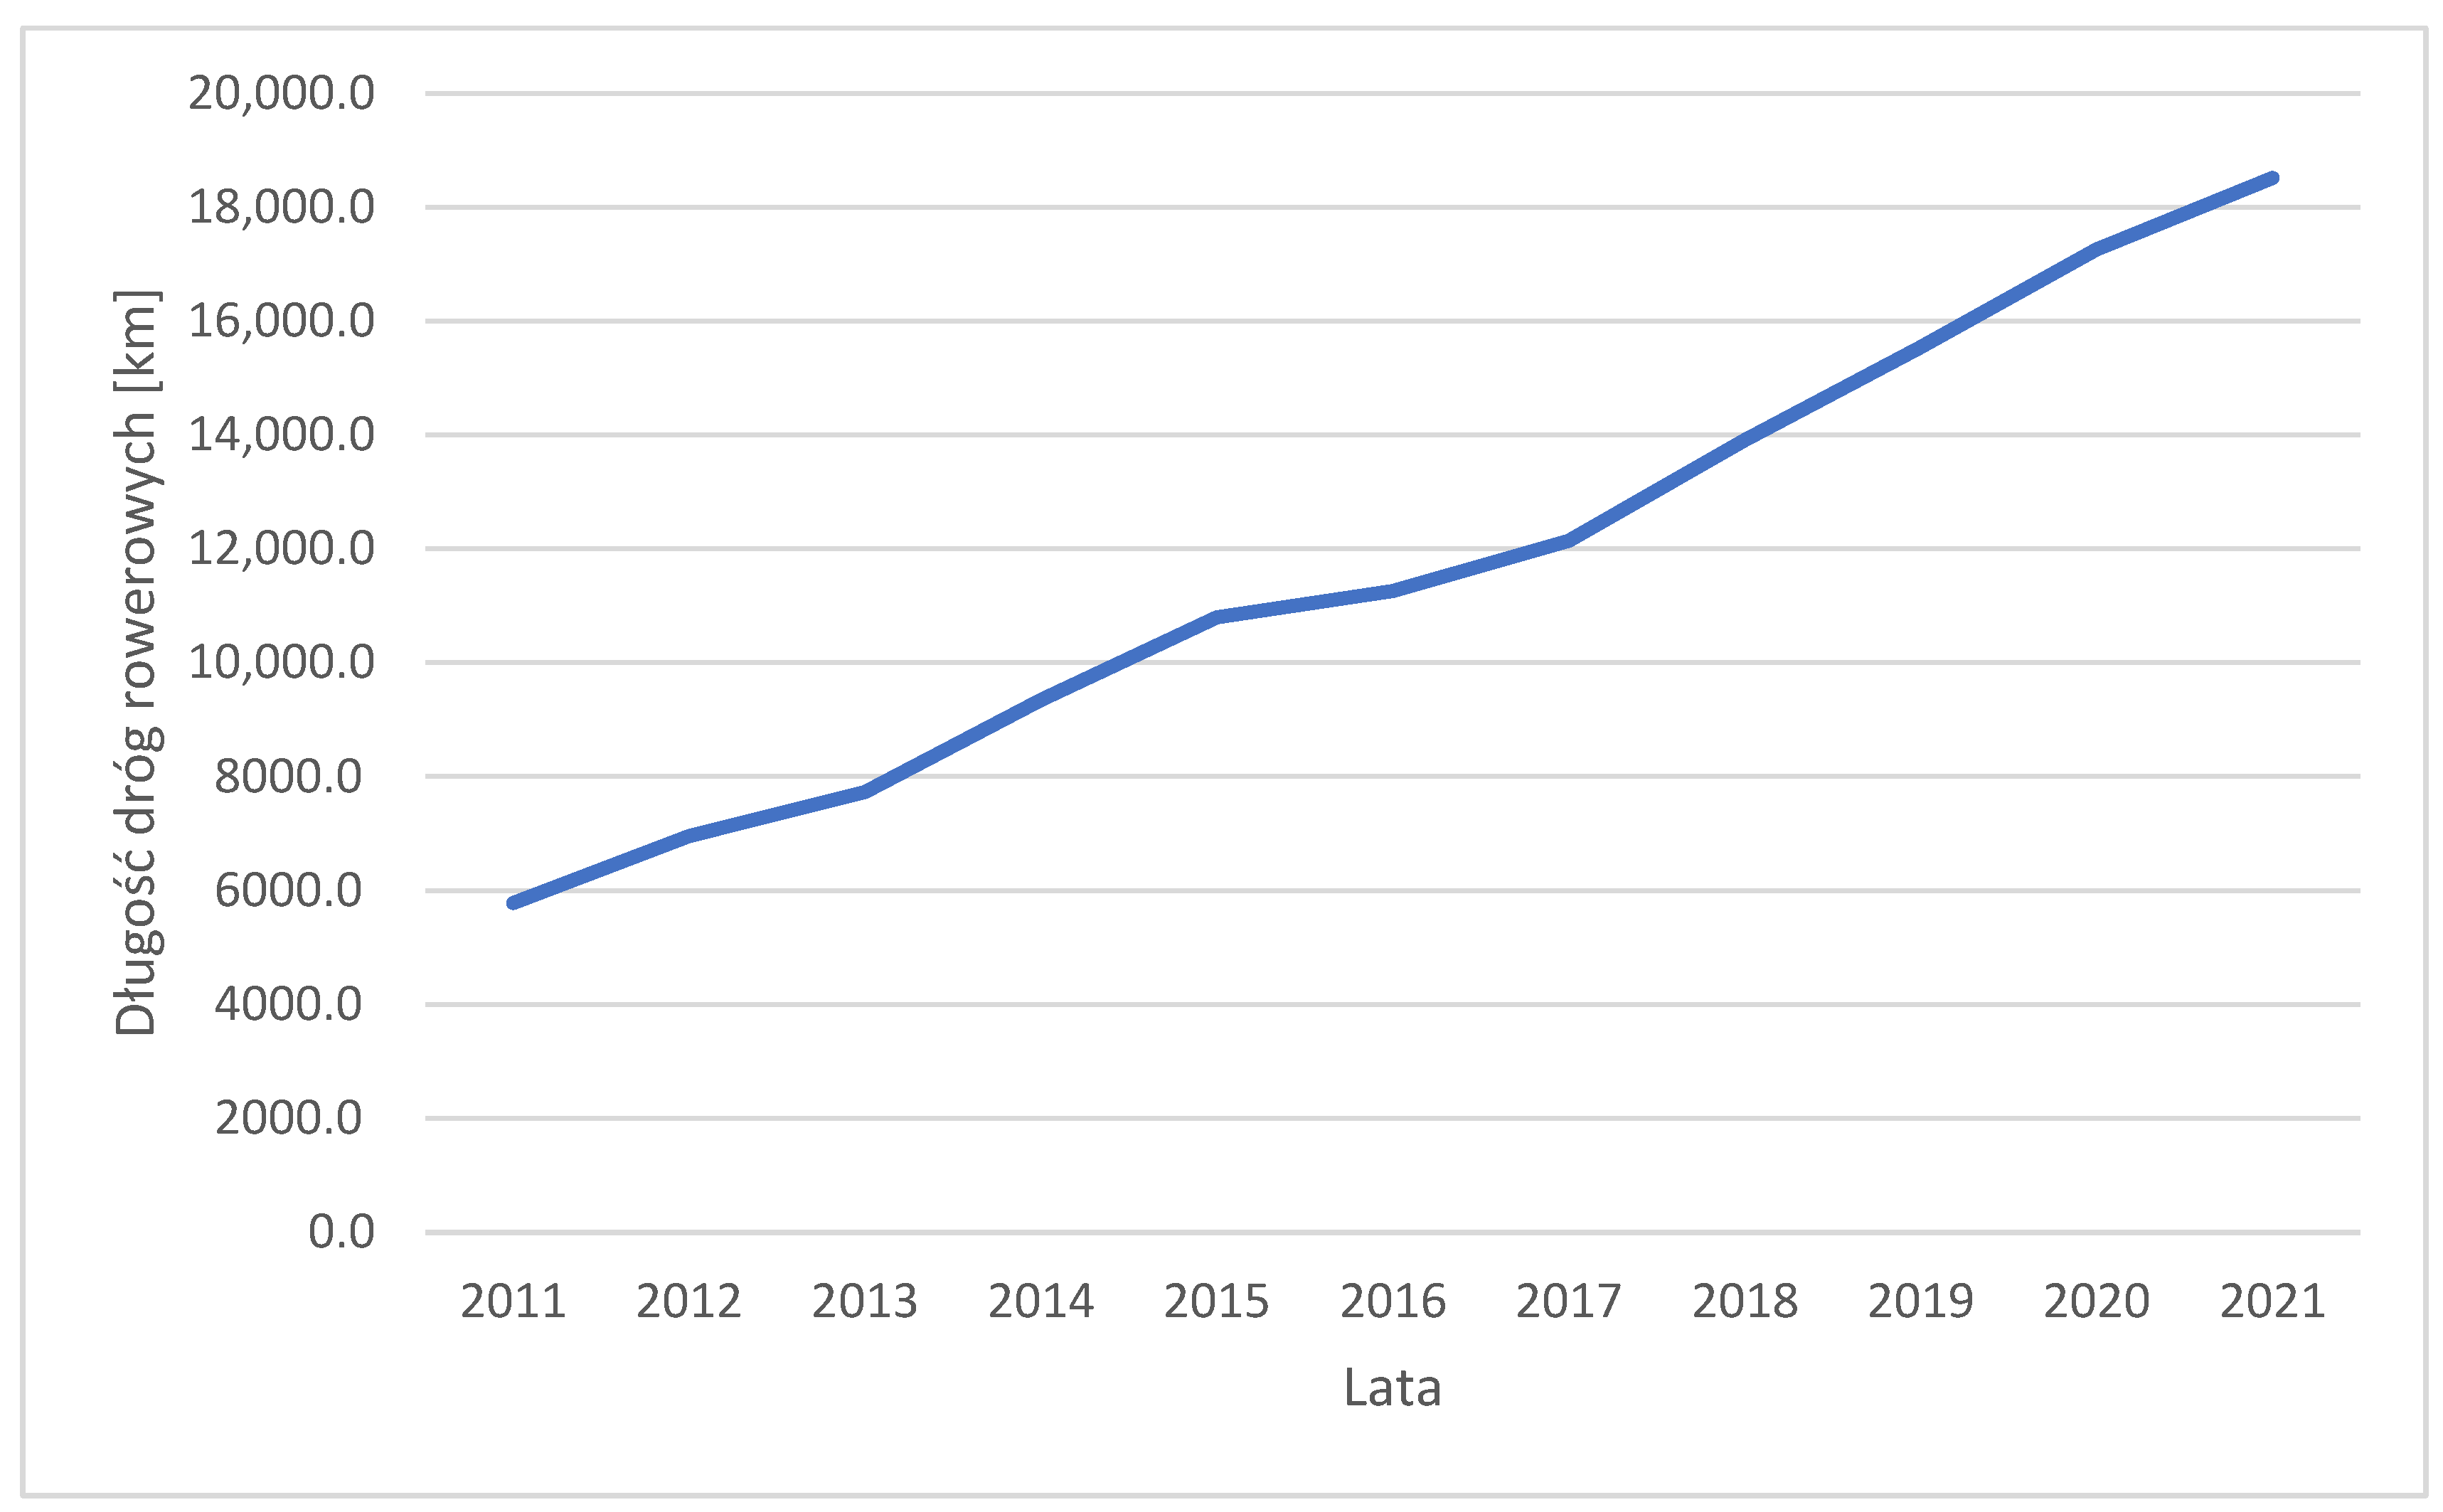
Figure 2 shows the number of bicycle paths in Poland from 2012 to 2021. The figure shows that in the last decade, there has been a linear growth rate in the number of kilometres of bicycle paths in Poland. Only in the years 2015–2017, a slight slowdown in the trend can be observed, but after 2017 the growth of the length of bicycle paths in Poland returned to its earlier level. World experience [
39] proves that the construction of an advanced system of bicycle roads is the basis for promoting the idea of using bicycle transportation in the field of smart mobility.
The next
Figure 3, shows the trends in the change in the length of bicycle roads in Poland by province. Analysis of the figure allows us to identify trends in the development of bicycle roads in individual provinces of Poland. An upward trend can be seen in terms of all the provinces studied, with the dynamics of this growth varying greatly. In particular, in the case of Holy Cross and Opole Province, the growth is very slow. In the case of two provinces, Masovia and Greater Pomerania, a significant increase can be seen after 2017, when the construction of bicycle roads in these provinces accelerated. As of 2018, both provinces are increasing their lead over the third province, Pomerania. In the case of Silesia, a faster increase in the length of paths has occurred since 2019, however, given the large distance to the leading provinces in this regard as well as the small size of the province, it is unlikely that Silesia could be higher in the ranking.
Another important issue is to determine the saturation of individual provinces with bicycle paths, which is important because they differ significantly both in size and area. For this purpose, it was decided to use two ratios, discussed in the methodological part: the length of bicycle paths per 10,000 inhabitants and the length of bicycle paths per 100 km2 of area.
Table 4 and
Table 5 provide data on the length of bicycle paths in each province of Poland per 10,000 residents. In
Table 3, the summary covers the years 2017–2021 and in
Table 4 the years 2012–2016. The data shows that the total length of bicycle roads in Poland per 1 inhabitant is 4.88 in 2021. The highest values are found for the following provinces: Lubusz Province—7.55 km, Podlasie Province—6.85, Kuyavia-Pomerania—6.85 and Pomerania—6.57. The last places are occupied by Lesser Poland—2.44; Silesia—3.13; Subcarpatia—3.45.
Five years earlier in 2016 we get similar results: in first place is Lubusz Province—5.12 in second place Pomerania—4.77, and in third place Kuyavia-Pomerania—4.48. The last three places were occupied in 2016 respectively: Lesser Poland—1.21; Silesia—1.72 and Holy Cross—1.84. The average for Poland was 4.88 km per 10,000 inhabitants.
For the first year included in the analysis—2012—the top three places were: Lubusz Province—5.67; Pomerania—5.0 and Kuyavia-Pomerania—4.59. The least developed network of bicycle paths per 10,000 residents was in the case of provinces such as Lesser Poland—1.46; Silesia—1.81 and Holly Cross—1.92.
In
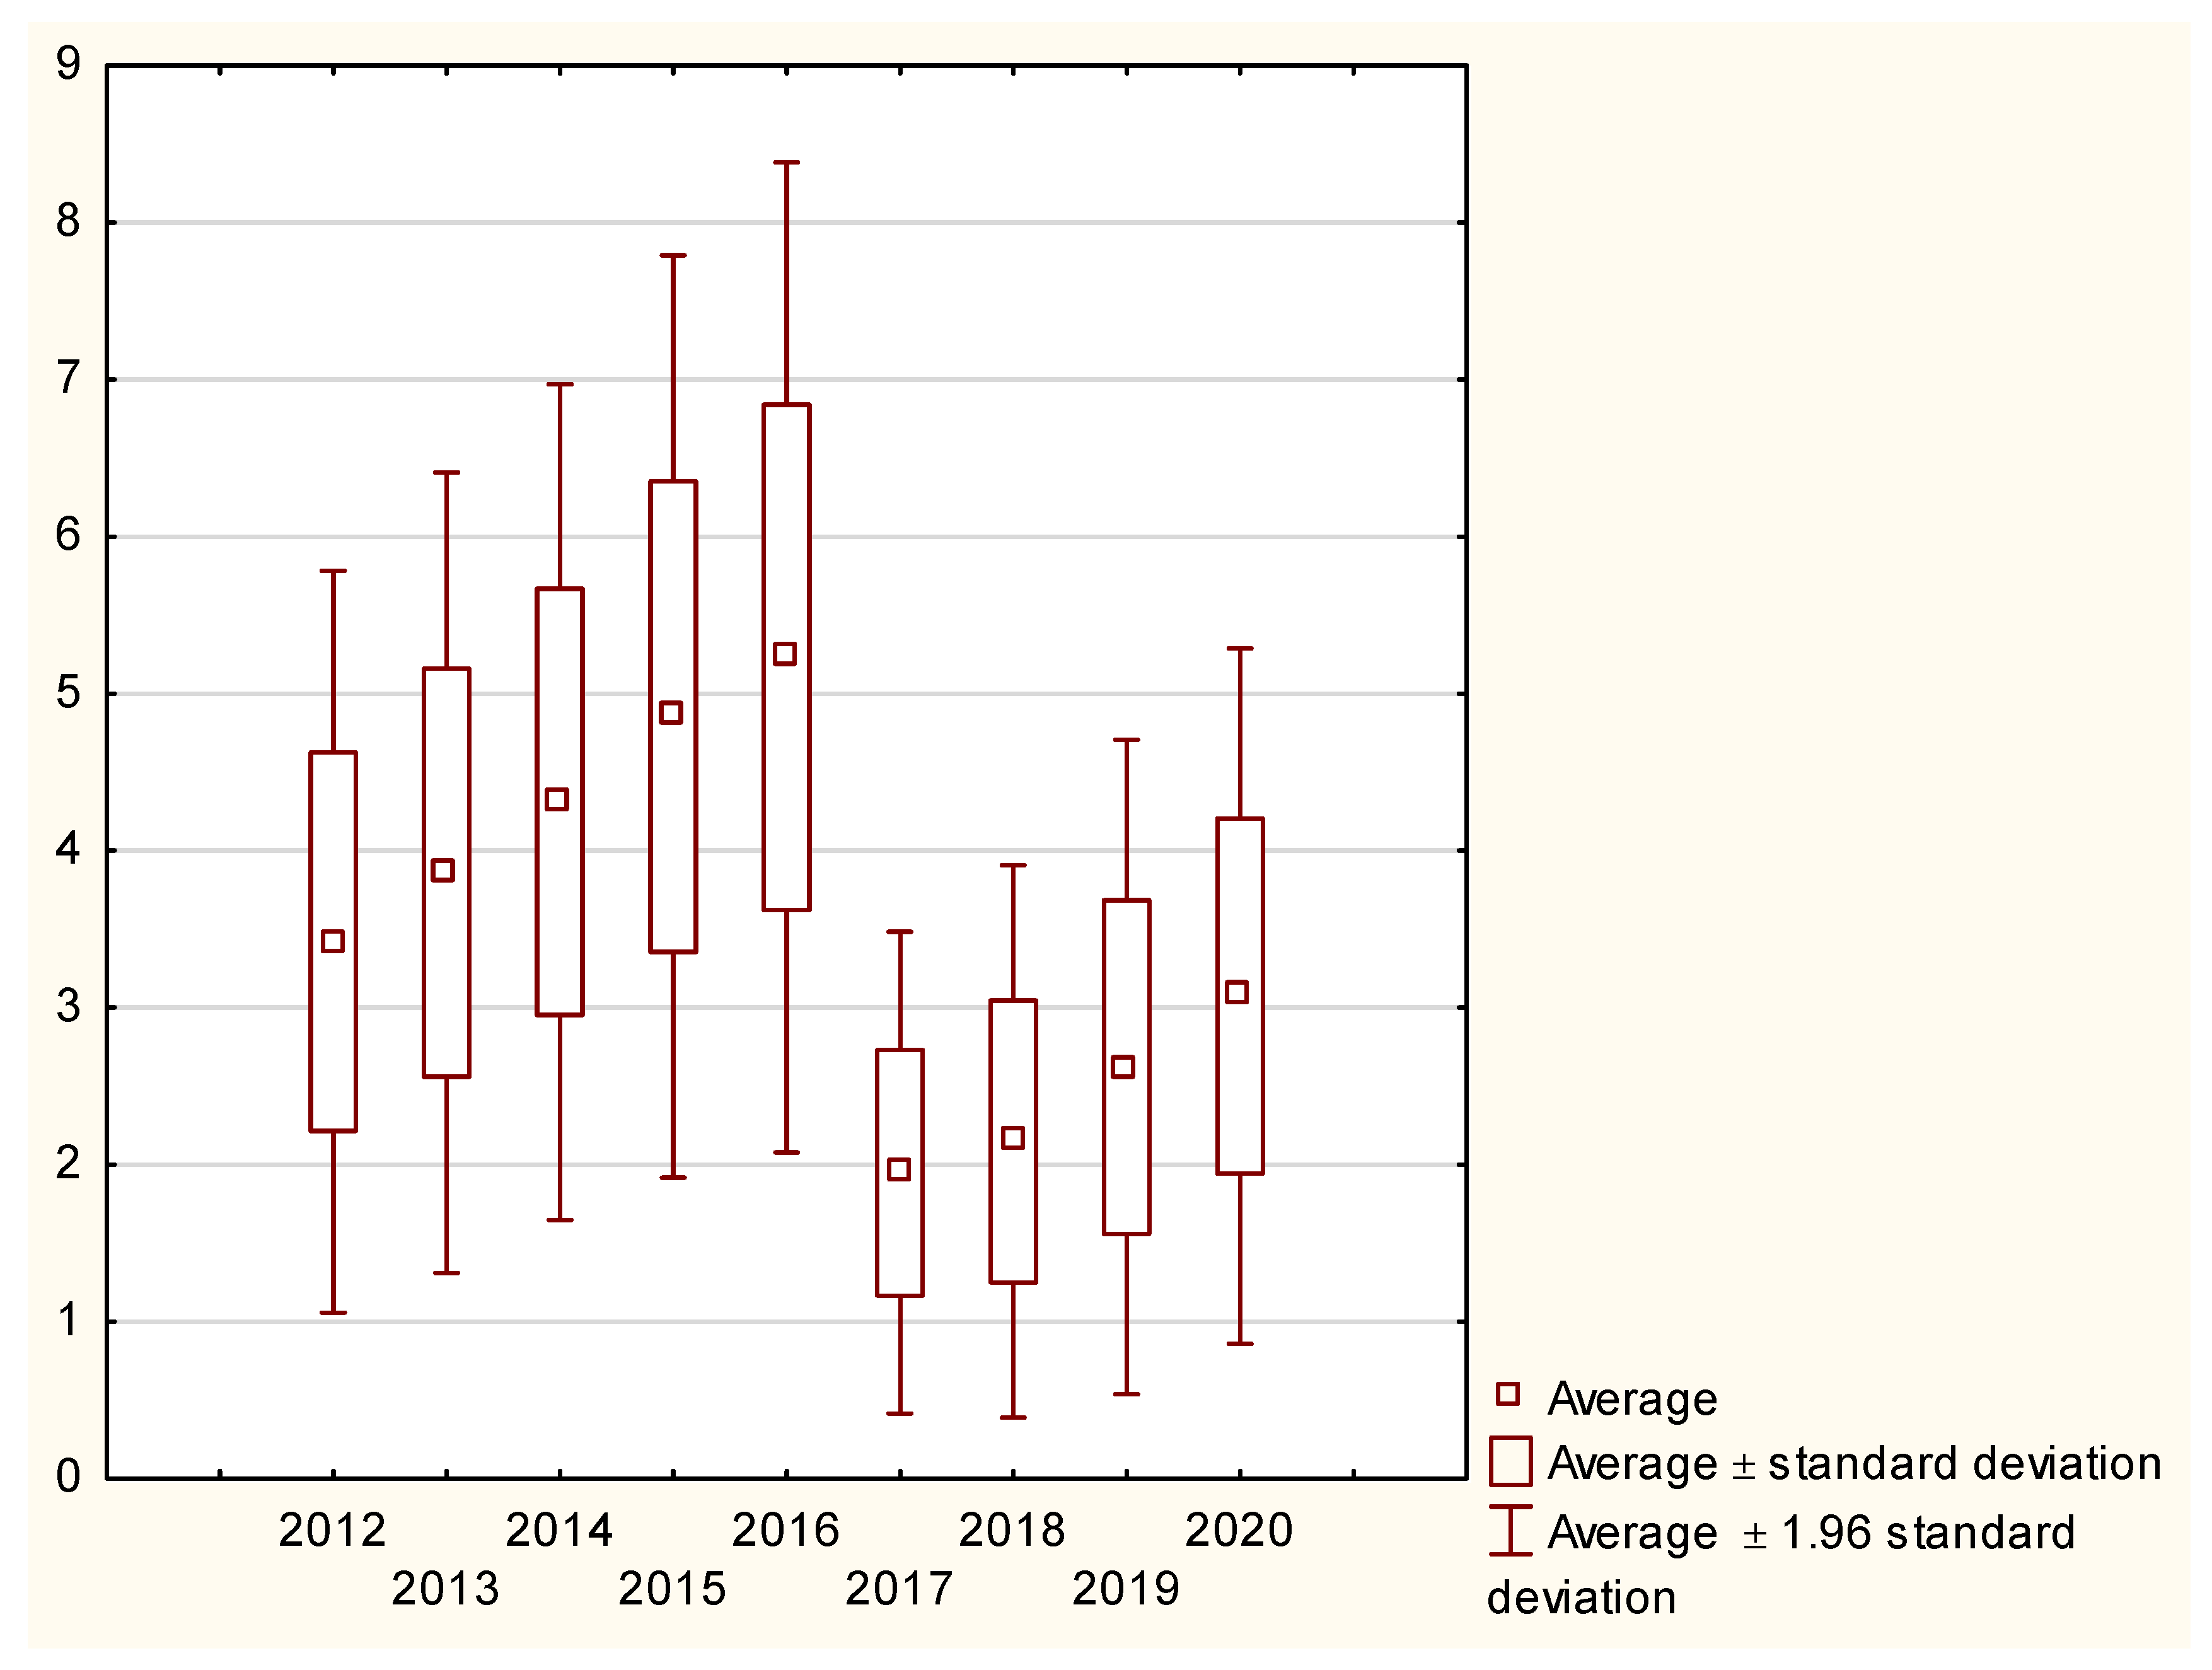
Table 6 there is and juxtaposition of basic descriptive statistics for the variability of bicycle road lengths per 10,000 inhabitants in the following years from 2012 to 2021. In the table, there are data about the average value, median, minimum value, maximum value and standard deviation. In
Figure 4 there is a box-plot for the variability of bicycle road lengths per 1000 inhabitants. We can observe that the lowest standard deviation was in the years 2016–2017—in those years the differences between polish provinces were lowest. The highest value of standard deviation in the case of bike road lengths per 1000 inhabitants was in the years 2013–2014 where the differences between the provinces were highest.
An analysis of trends over the studied 10 years in Poland’s provinces allows us to conclude that during the studied period the increase in bicycle roads occurs relatively evenly, while one can see deepening differences between individual provinces. Those provinces that showed the highest values of the indicator of the length of bicycle paths per 10,000 inhabitants in 2012 show it in 2021, similarly, there is not much change in the case of provinces in the last places.
The next coefficient analyzed in the publication is the length of bicycle roads in the studied provinces in Poland per area—in this case, the coefficient of the length of bicycle roads in km per 100 km
2 area was used. The data are placed in
Table 7 and
Table 8.
For 2021, the average length of bicycle roads in Poland per 100 km2 area is 5.92. The highest values of the coefficient are found in the case of Silesia—11.1; Greater Poland—7.84; Kuyavia-Pomerania—7.69; Masovia—7.62. The lowest coefficients for the length of bicycle roads in Poland per 100 km2 of surface area occur for: Warmia-Masuria—3.08; Holly Cross—3.58 and Podlasie Province—3.9.
For 2016, the average for Poland was 3.60. The indicator for the length of bicycle roads per 100 km2 area was the highest for the following provinces: Silesia—6.35; Pomerania—6.35 and Kuyavia-Pomerania—5.19. The lowest value of the indicator was in the case of the following provinces: Holy Cross—1.97; Warmia-Masuria—2.10 and Podlasie Province—2.30.
In the first year of the analysis—2012, for the whole of Poland, the examined indicator was 2.22. In terms of the length of bicycle paths in relation to area, the leading places were occupied by: Silesia—5.07; Pomerania—3.29 and Opole Province—3.14. The last three places were in 2012: Holy Cross—0.9; Warmia-Masuria—1.04; Podlasie Province—1.12.
Analyzing the changes in the positions of individual provinces, it can be seen that there are no major changes between them. The provinces for which there is a high saturation of bicycle paths per 100 km2 area throughout the studied period increase their advantage over those for which the value of the indicator is small. No abrupt changes in trends are observed in any of the Polish provinces over the last 10 years.
In the next stage of the research, it was decided to see to what extent the length of bicycle paths is related to the amount of gross GDP per capita for a particular province. In the case of the analysis for 2021, the research shows that GDP per capita in a given province is correlated with the length of bicycle paths for that province. The correlation coefficient between the variables is high and statistically significant at the level of statistical significance α = 0.05. The correlation coefficient is 0.83, which means that the length of bicycle paths in a given province is significantly dependent on the wealth of that province. The wealthier the province, the more bicycle paths it builds.
To test whether this coefficient changes over time, the correlation coefficient of GDP with the length of bicycle paths was calculated for the consecutive years 2012–2021. For all years, it is statistically significant at the level of statistical significance α = 0.05 and ranges from 0.73–0.85. The results presented support hypothesis H1, which reads-Length of bicycle paths in a given province is correlated with GDP per capita in that province.
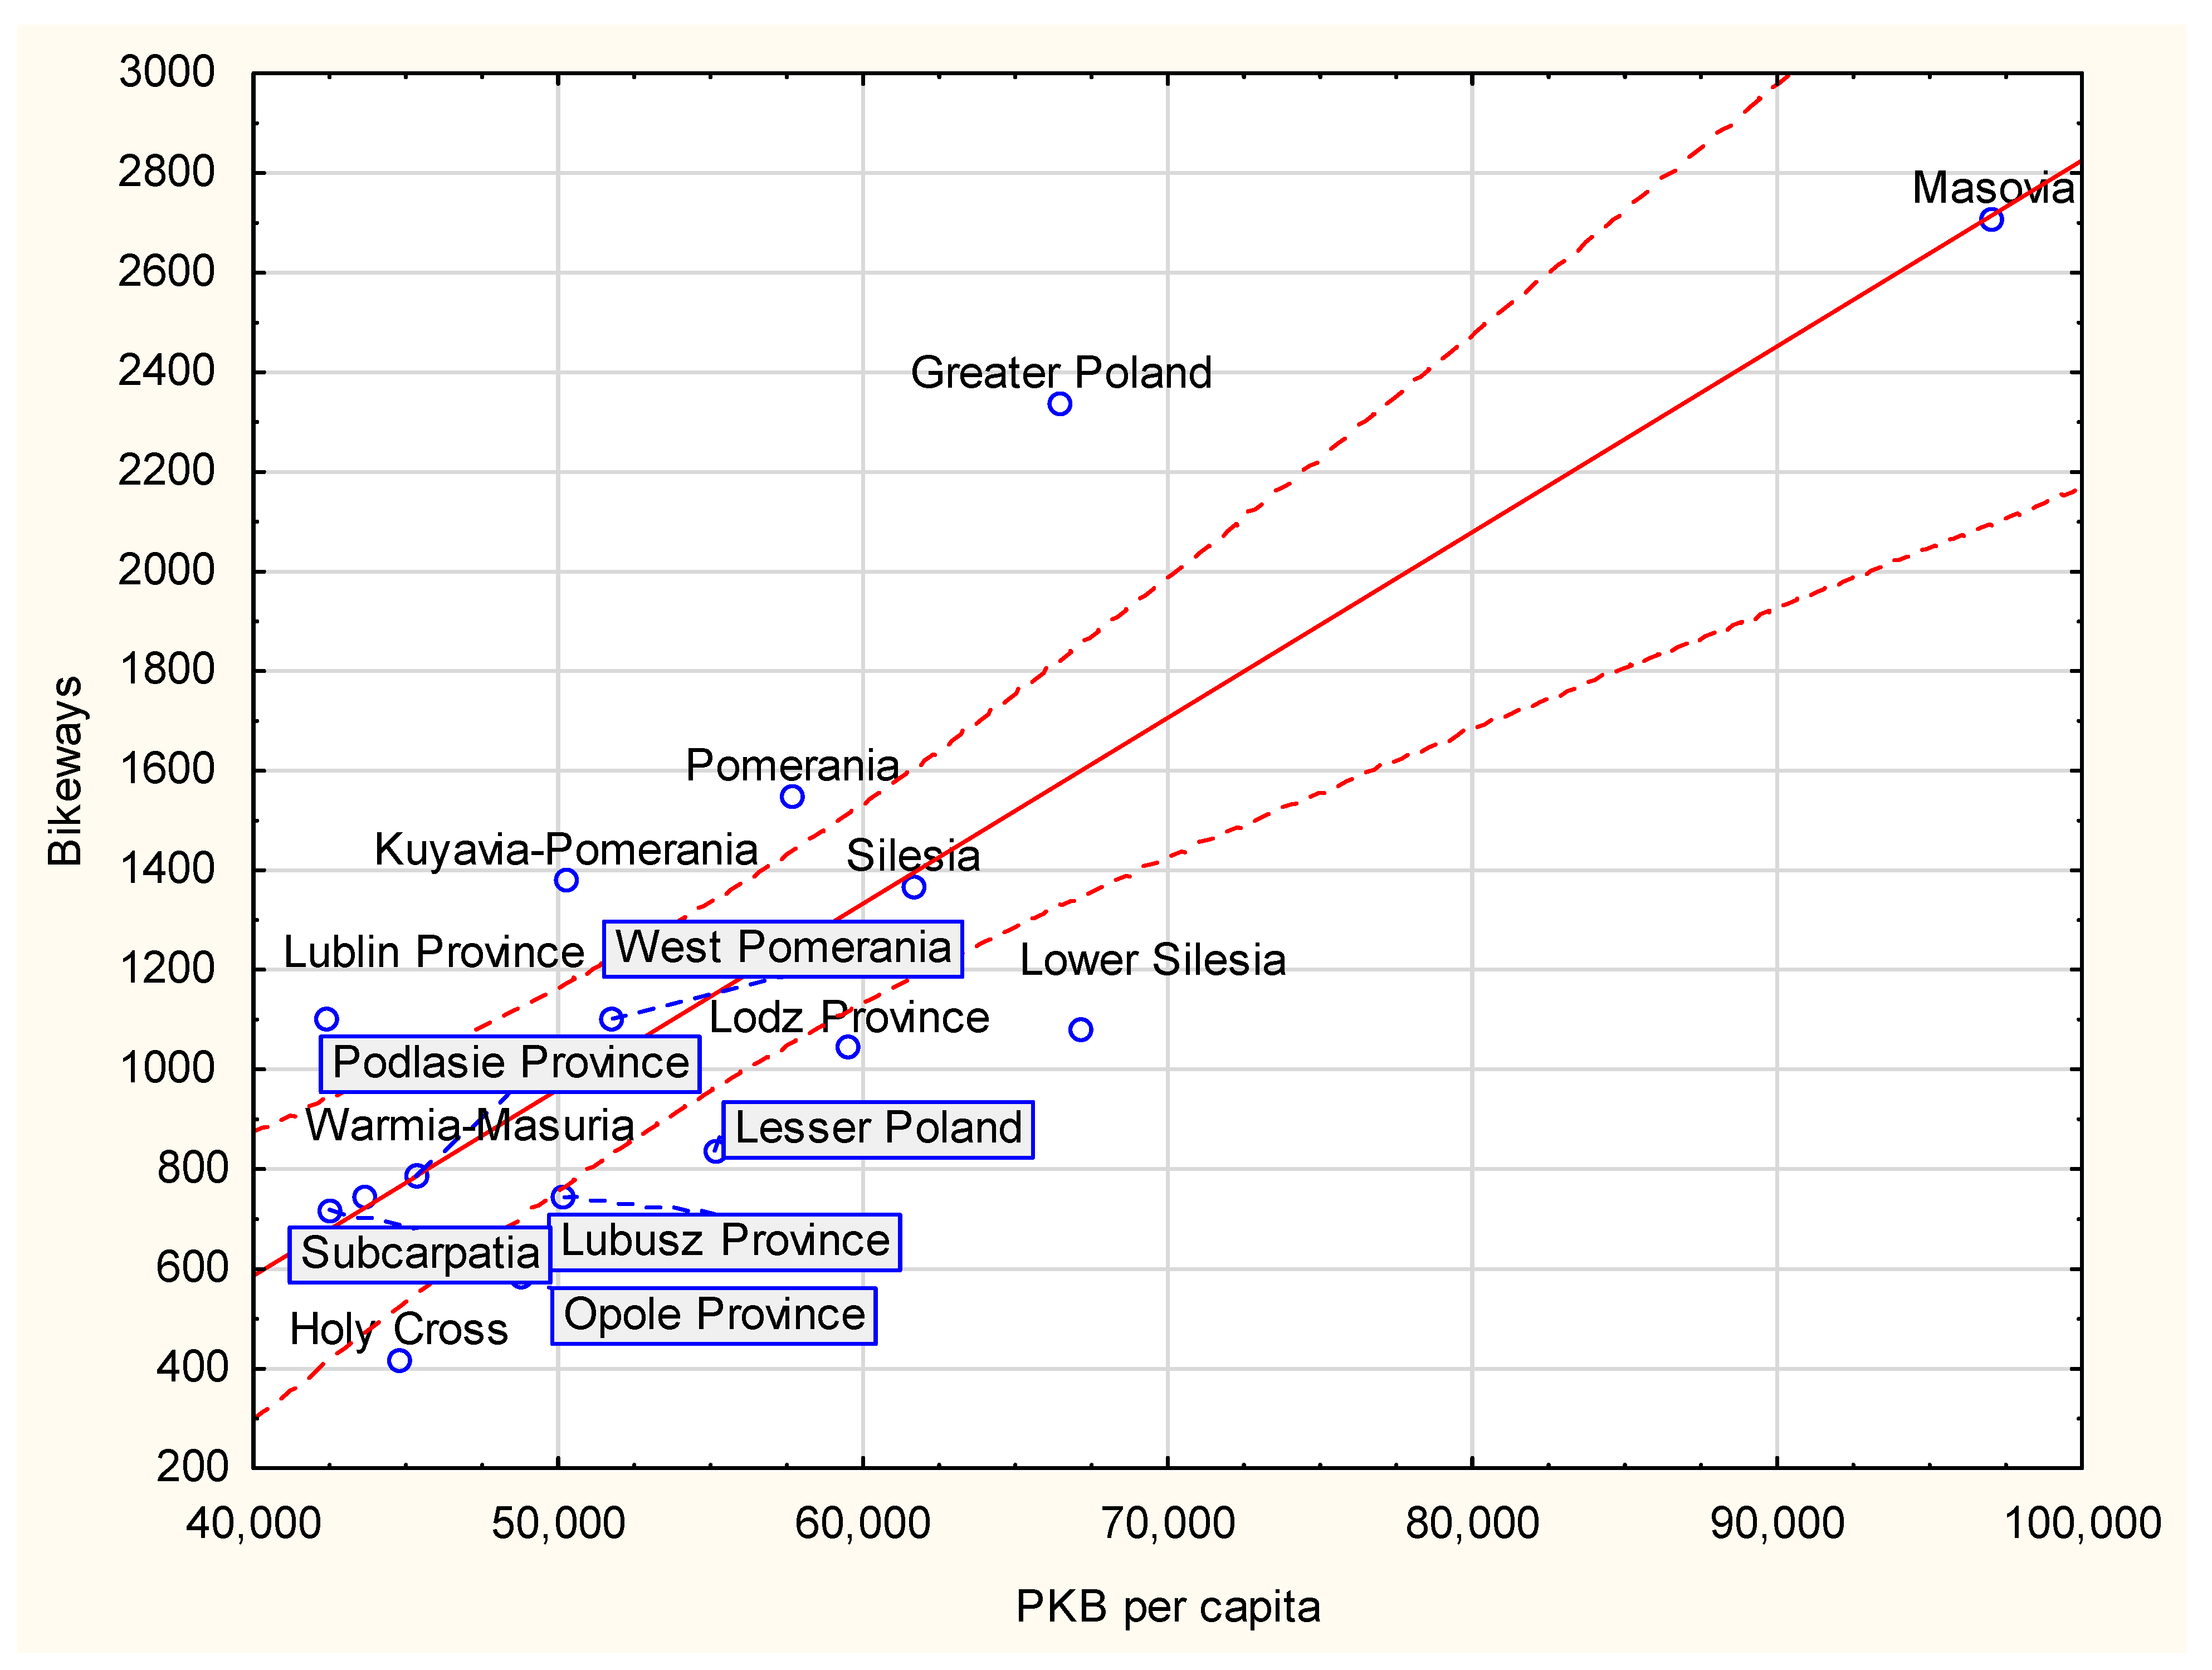
For 2021, the relationship between the length of bicycle paths in a given province and GDP per capita can be expressed by the following equation.
Length of bicycle paths = −905.42 + 0.037 × PKB per capita
The scatter plot between the variables is shown in
Figure 5. The figure indicates confidence intervals of 0.95. The figure shows that most of the surveyed provinces fall within the confidence interval of 0.95 for the relationship between the variables GDP per capita and the length of bicycle paths. It is worth noting the 2 groups of provinces that are above and below the confidence interval:
In the case of four provinces, Greater Poland, Pomerania, Kuyavia-Pomerania and Lublin Province, they are above the confidence interval, which means that the amount of bicycle paths in these provinces is greater than the wealth of the population would suggest. Except for Lublin Province, the remaining provinces are located in the northwestern part of Poland.
In the case of Lower Silesia, Lodz Province, Lesser Poland, Opole Province and Holly Cross provinces, the amount of bicycle paths is less than what the wealth of the province’s residents would suggest. The provinces are located in the southwestern part of Poland (except Lodz Province located in central Poland).
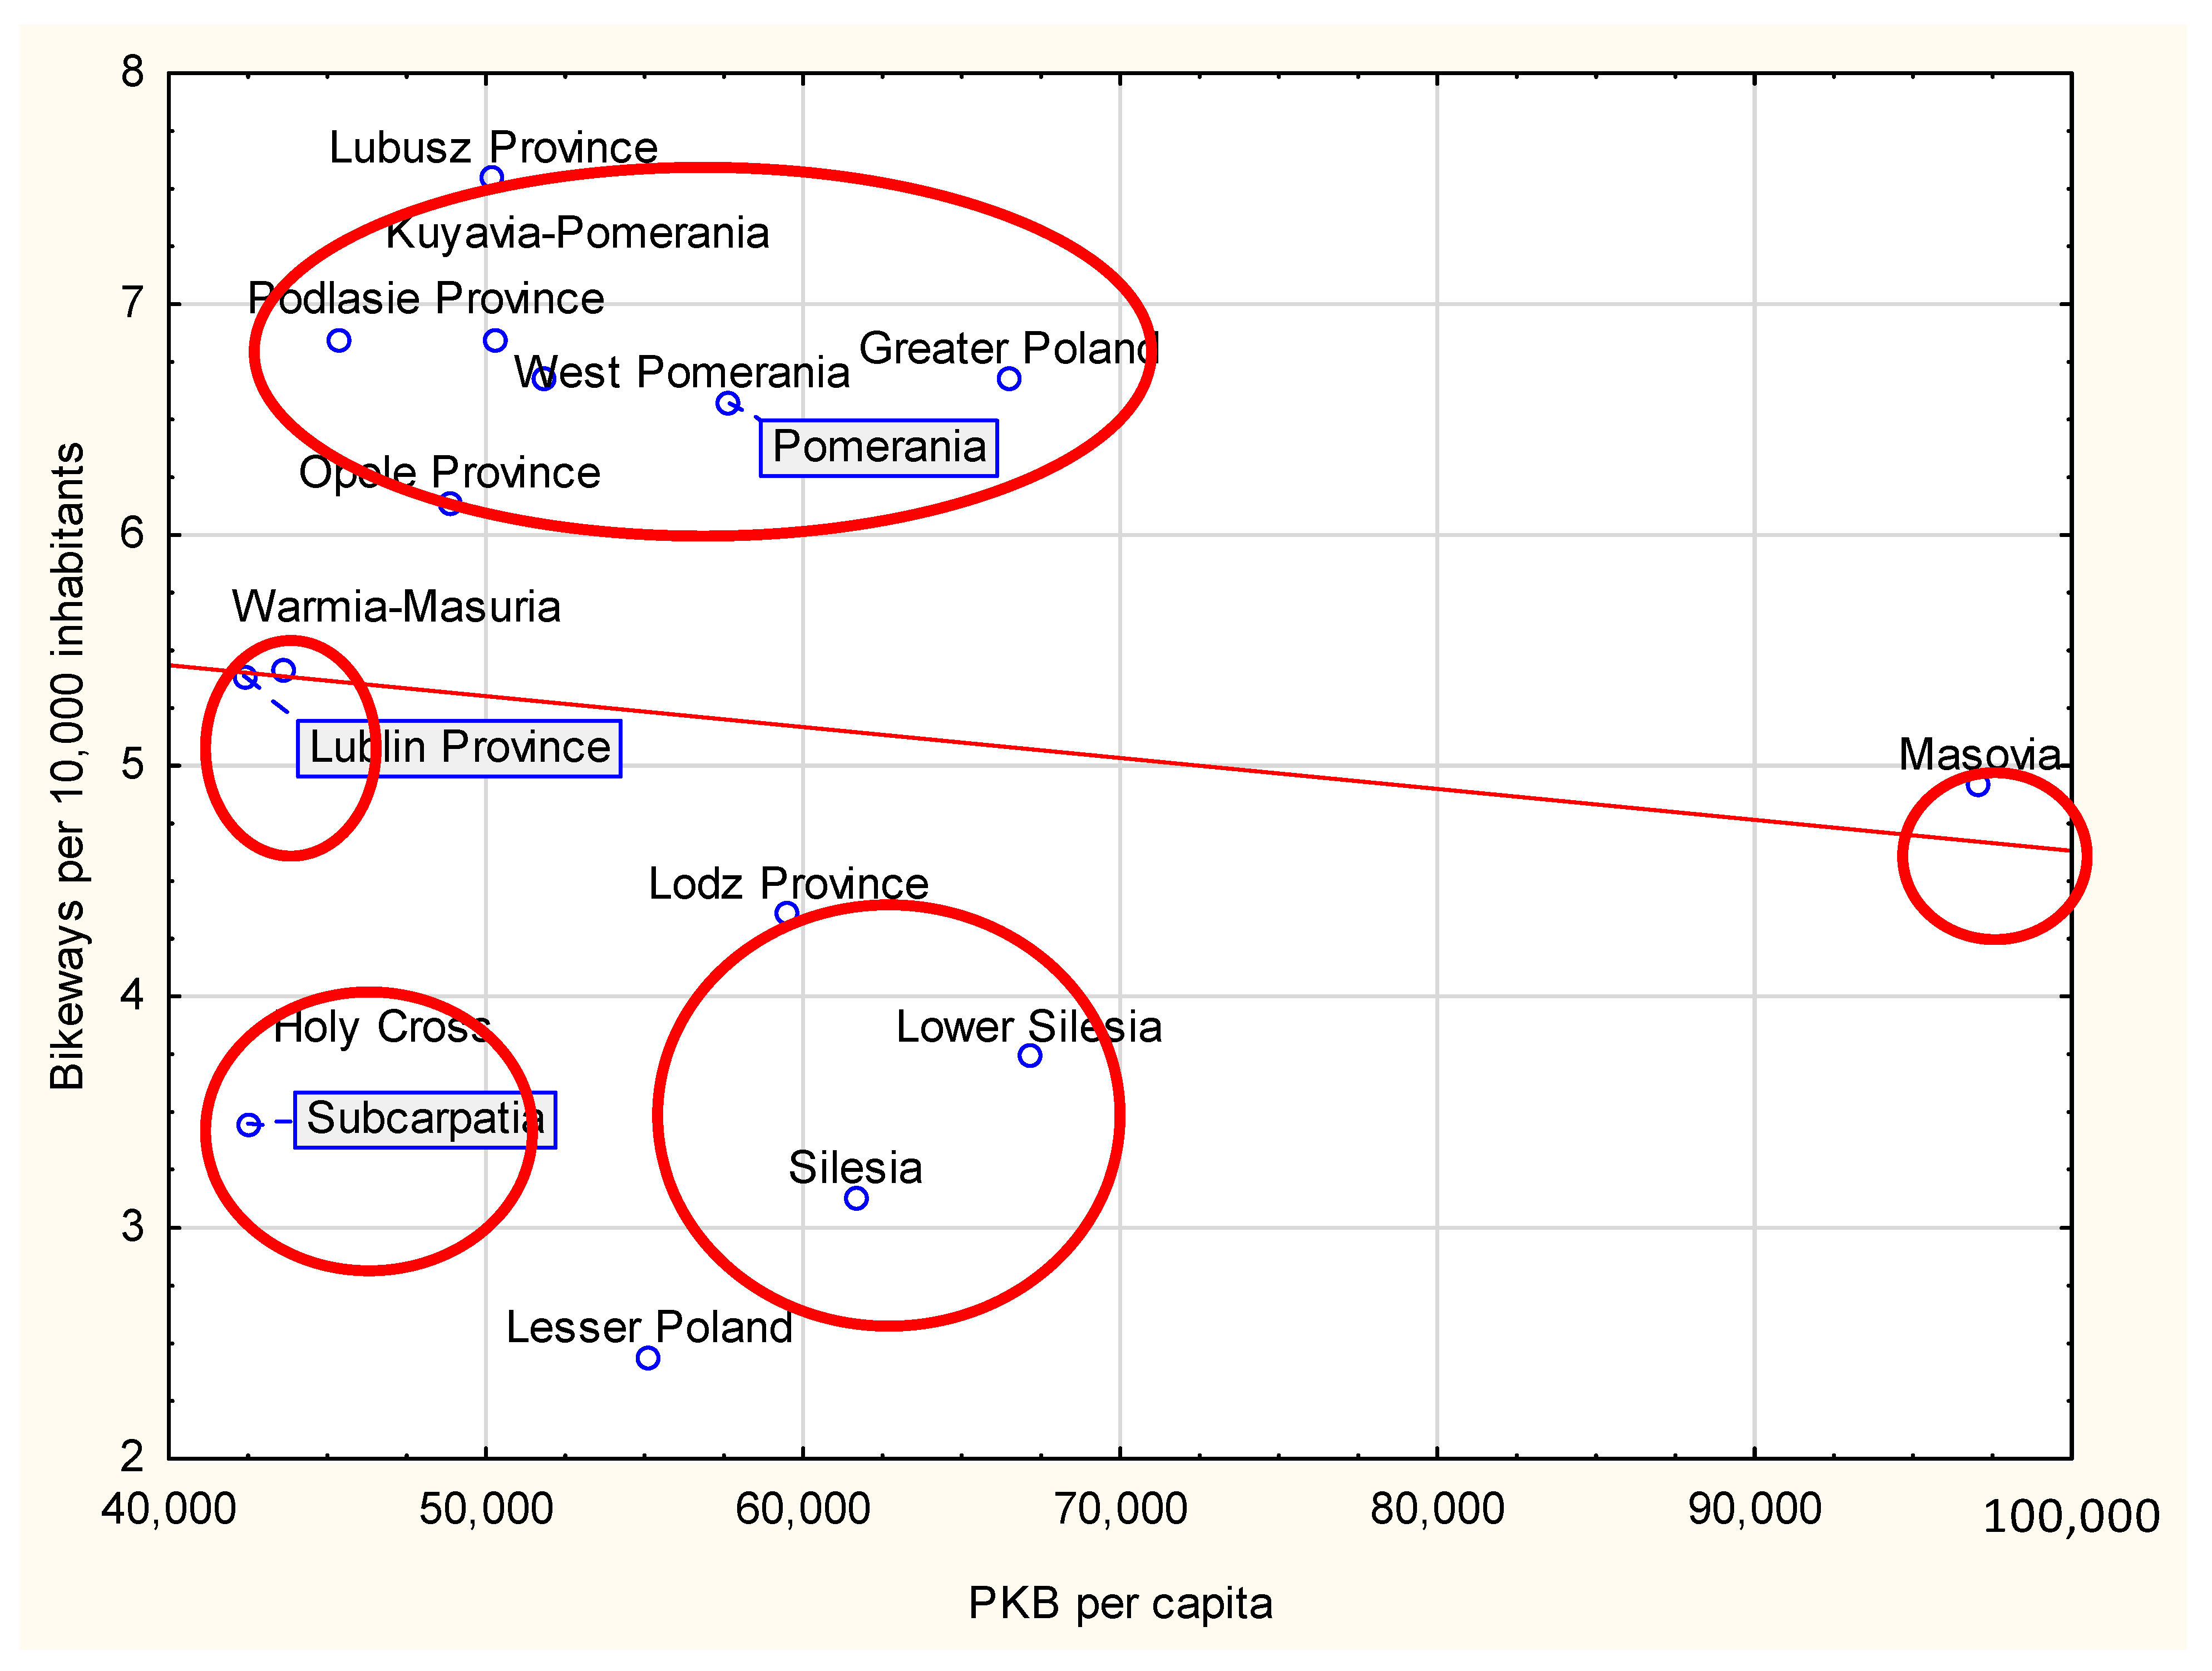
Analyzing the relationship between GDP per capita and the number of bicycle paths per 10,000 residents, no statistically significant correlation was identified. The analysis of the results does not support the H2 hypothesis in that the length of bicycle paths per 10,000 residents in a province is correlated with GDP per capita in that province.
Figure 6 shows a graph of the relationship between the variables. Based on
Figure 6, the following groups can be distinguished among the studied provinces: Holy Cross and Subcarpatia—small indigent provinces characterized by very low saturation of bicycle paths per 10,000 inhabitants—the provinces are located in central Poland.
Silesia, Lower Silesia and Lodz Province—provinces with medium wealth and low saturation of bicycle paths per 10,000 inhabitants.
Warmia-Masuria and Lublin Province—indigent provinces with an average saturation of bicycle paths per 1000 inhabitants. Both provinces are located in eastern Poland.
Masovia—the capital, the wealthiest province in Poland, located in central Poland characterized by an average level of saturation with bicycle paths.
Lubusz Province, Kuyavia-Pomerania, Podlasie Province, West Pomerania, Pomerania, Greater Poland—Provinces characterized by a low to medium level of affluence and a high saturation of bicycle paths per 10,000 inhabitants. Most of the provinces in this group are located in western and northwestern Poland.
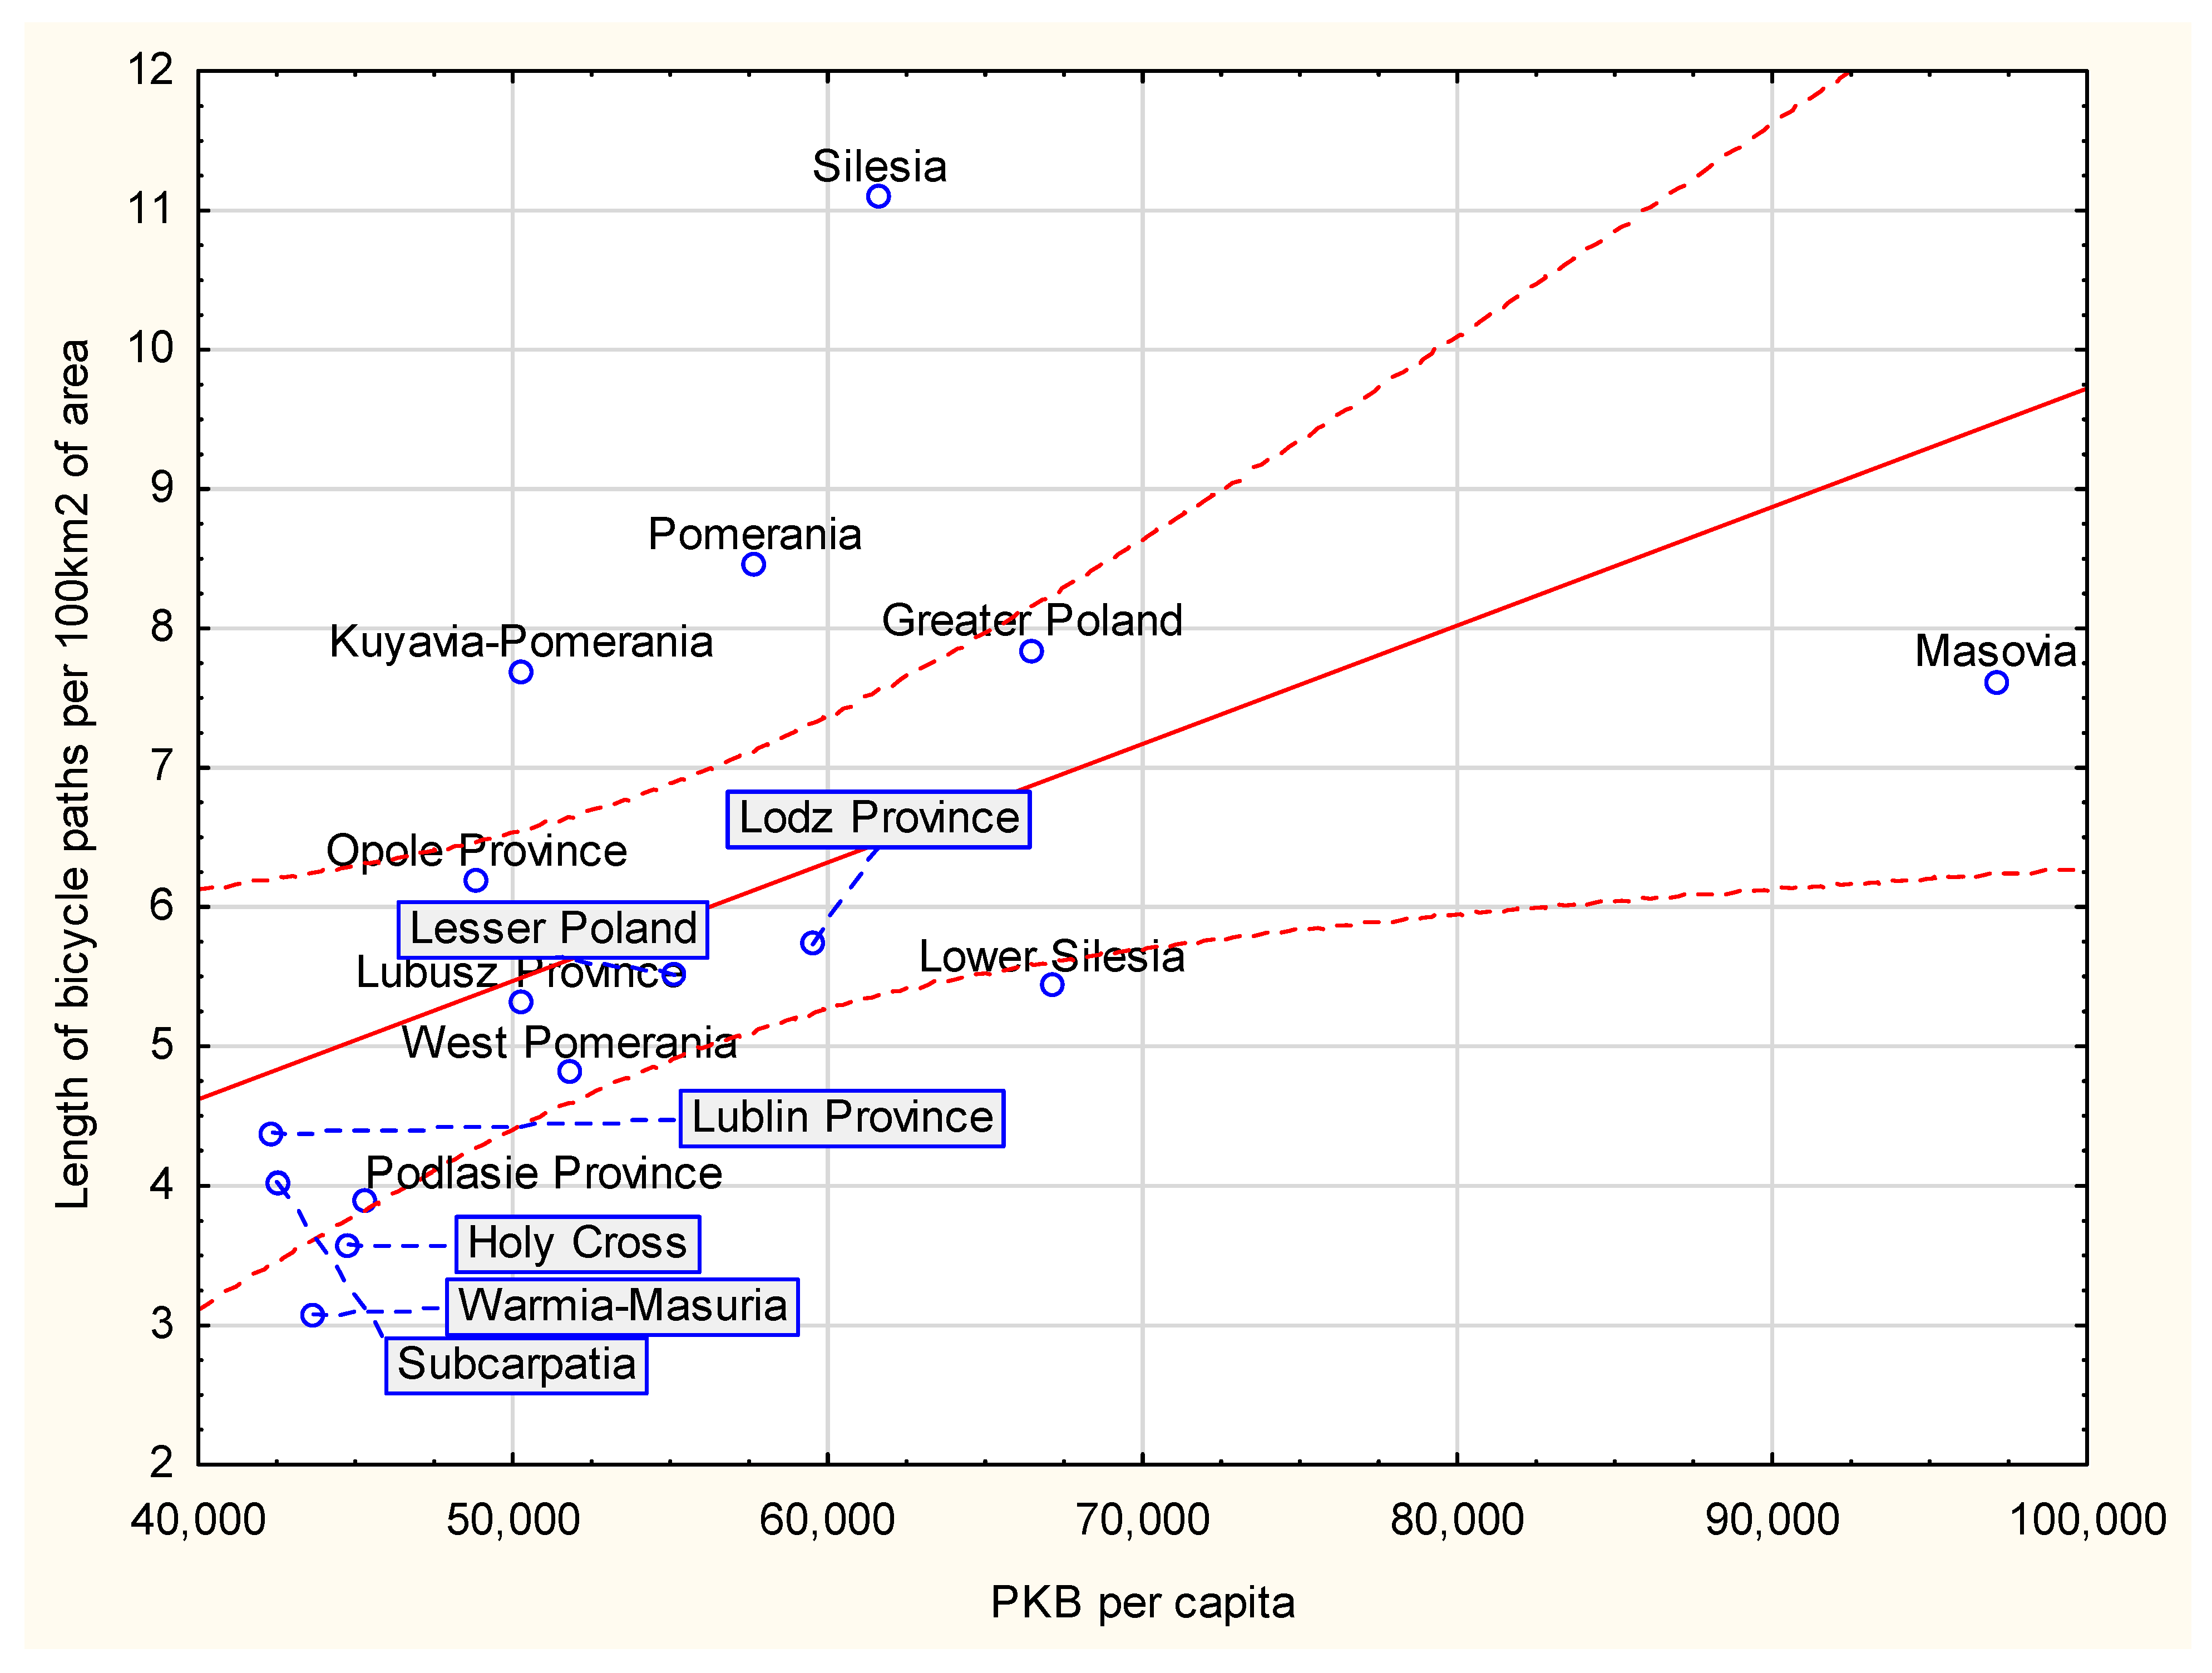
The next stage of the study analyzed the relationship between the number of bicycle roads in each province per 100 km2 of the area and the wealth of the province as calculated by the GDP per capita index. For 2021, there is a co-correlation between the variables at an average level of 0.55 (it is statistically significant at α = 0.05). The data shows that the larger the area of a given province, the longer the network of road paths is in its case. The results of the analysis support hypothesis H3 as follows—the length of bicycle paths per 100 km2 area in a given province is correlated with GDP per capita in the province.
The relationship between the length of bicycle paths per 100 km2 area and GDP per capita can be expressed by the formula:
Length of bicycle paths per 100 km2 surface area = 1.22 + 8507 − 5 × PKB per capita
Analyzing the correlation coefficients for the studied phenomenon over the 2012–2012 period, it can be seen that the correlations have a higher value and are statistically significant starting from 2018. Previously, the correlations below 0.5 were not statistically significant at the level of significance adopted in the study.
In the case of provinces characterized by a higher level of wealth measured by the GDP per capita index, there is much more investment in new bicycle routes, and the length of bicycle routes in these provinces is growing rapidly from year to year.
Figure 7 shows a graph of the relationship between the length of bicycle paths per 100 km
2 of area and GDP per capita in a given province. Most of the surveyed provinces of Poland fall within the confidence interval. The others can be divided into 2 groups:
Provinces characterized by higher saturation of bicycle paths per 100 km2 of an area than their wealth would suggest—Silesia, Pomerania and Kuyavia-Pomerania.
Provinces characterized by lower saturation of bicycle paths per 100 km2 of area than their wealth would suggest—Subcarpatia, Holy Cross, Lower Silesia.
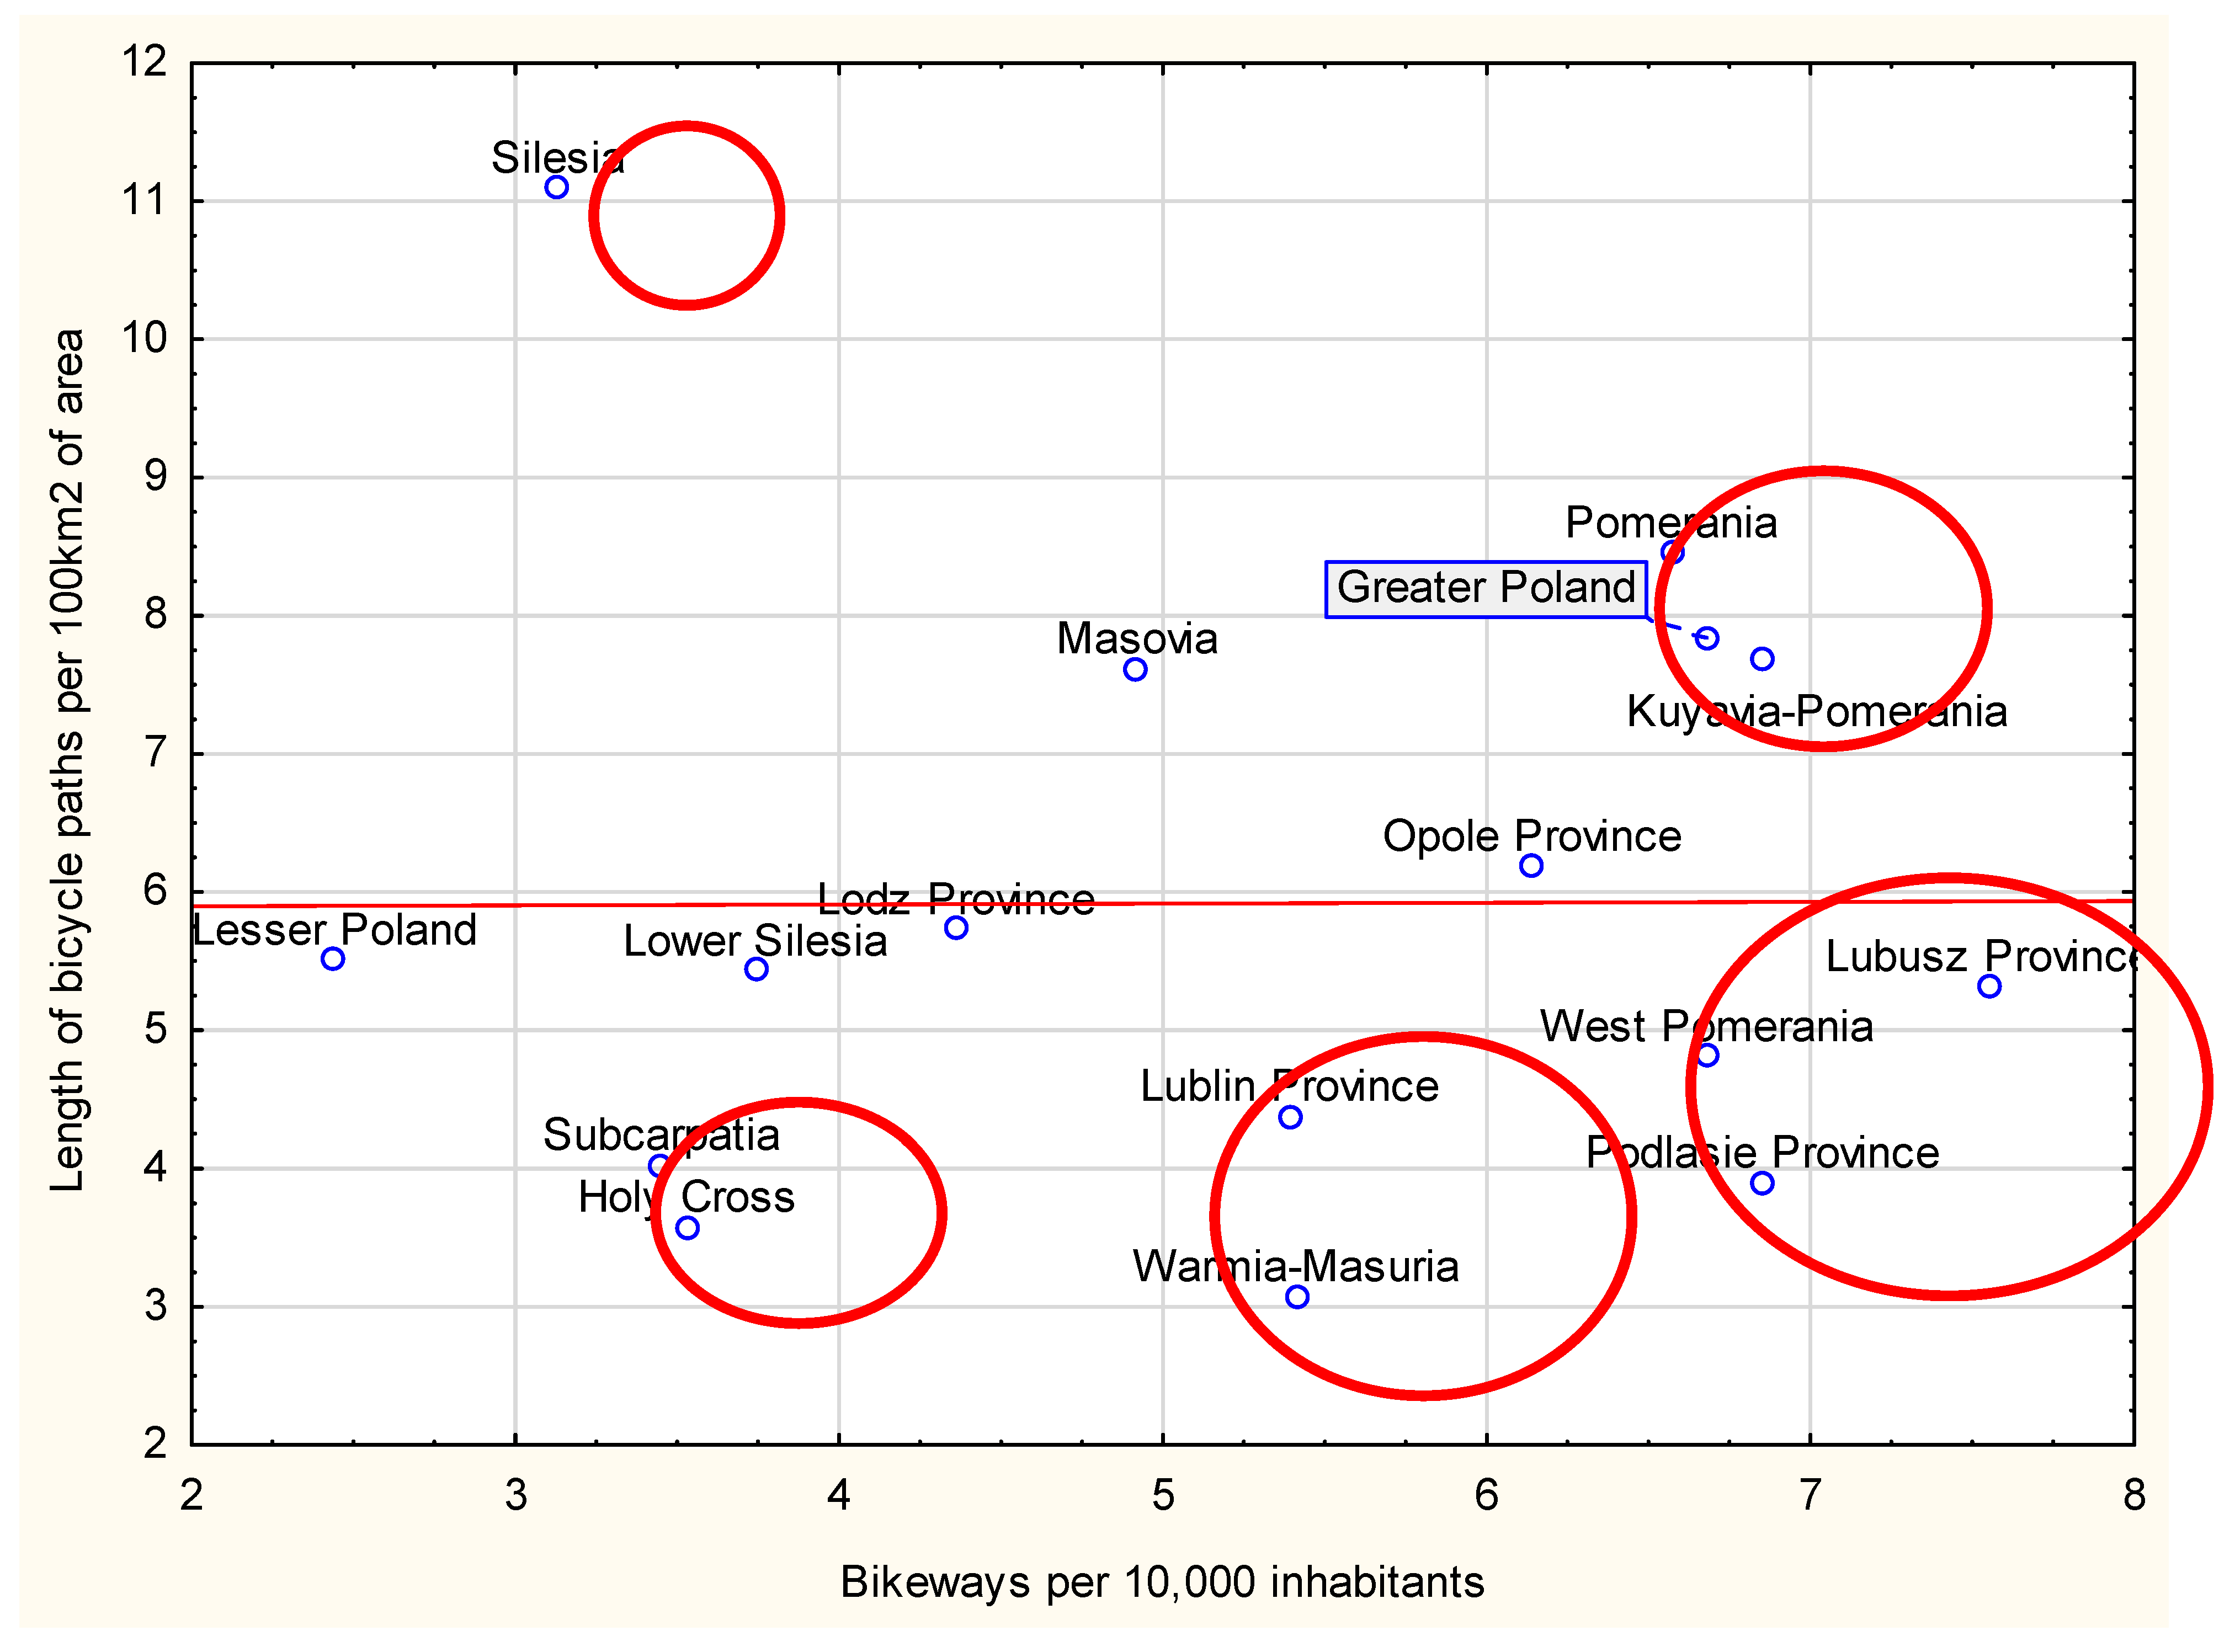
The last stage of the study was to check the relationship between the saturation of individual Polish provinces with bicycle paths by area (length of bicycle paths per 100 km
2) and population (length of bicycle paths per 10,000 population). The scatter plot is shown in
Figure 8. Four groups of provinces can be observed in the figure:
Silesia—province with high, (highest in Poland) saturation of bicycle paths in relation to area and very low saturation of bicycle paths in relation to population.
Subcarpatia and Holy Cross—provinces with very low saturation of bicycle paths in relation to both area and population.
Pomerania Greater Poland and Kuyavia-Pomerania—provinces with high saturation of bicycle routes in relation to population and very high saturation in relation to area.
Lubusz Province, West Pomerania, Podlasie Province—provinces characterized by high saturation of bicycle routes in relation to population and low saturation in relation to area.
Lublin Province and Warmia-Masuria—provinces characterized by medium saturation with bicycle routes in relation to population and low saturation in relation to area.
5. Discussion
The development of bicycle transportation is undoubtedly an important element in the development of smart mobility and thus modern smart cities. A prerequisite for the use of bike sharing, applications to facilitate the use of bicycles or modern IT solutions is the existence of sufficient lengths of bicycle routes of sufficient quality, which allow comfortable use of bicycle transportation. In order to ensure the widespread use of the bicycle as a means of transportation, there must be a network of bicycle connections not only within individual cities but also between cities.
It is worth mentioning that numerous smart city strategies include queries on smart mobility, bike sharing or the construction of bicycle routes [
66,
91]. A very good example of this kind of activity is Copenhagen, which has a strategy for the development of bicycle transportation until 2025 [
72] and which is one of the most advanced cities in the world in the use of bicycles as an alternative means of smart transportation [
23,
70,
71,
72]. This means bicycle roads are a very important part of the Smart Mobility concept.
The study showed that there is an extensive bicycle network of 18509.9 km in 2021. Between the individual sixteen provinces studied, there are large differences in this regard starting from 2709.8 km in Masovia Province to 582.3 km in Opole Province. In particular, as of 2017, two provinces, Masovia and Greater Pomerania are rapidly expanding their network of bicycle paths each year, widening the gap compared to the other provinces. The opposite situation is true for Holy Cross and Opole Province, where the rate of construction of bicycle paths is significantly lower than in the other provinces.
Since the individual provinces differ significantly in size and population, two indicators were introduced: the length of bicycle paths in relation to 10,000 inhabitants and the length of bicycle paths per 100 km2 of area.
For the indicator of the length of bicycle paths per 10,000 inhabitants, the three best provinces are Lubusz Province, Podlasie Province and Kuyavia-Pomerania; while the three worst are Lesser Poland, Silesia and Subcarpatia.
In the case of indicator per 100 km
2 area, the top three provinces are Silesia, Greater Poland and Kuyavia-Pomerania. In contrast, the three worst are Warmia-Masuria, Holly Cross and Podlasie Province. In order to combine the analysis of the two indicators,
Figure 6 shows a scatter plot between them. From the graph, it can be observed that there are significant differences between the indicators—provinces that are populous and have a small area like Silesia have a high value of the indicator of the length of bicycle paths per 100 km
2 of the area while a low one in relation to 100,000 inhabitants. The opposite situation occurs in provinces that are large in area and have relatively few residents like Podlasie Province, Lubusz Province, and West Pomerania—for these provinces there are high values of the indicator of the length of bicycle paths per 10,000 residents, but they are low in relation to 100 km
2 of area.
The worst group includes two provinces: Subcarpatia and Holy Cross in this case both indicators—both per 10,000 inhabitants and per 100 km2 area are very low. The best group are the provinces for which there are high indicators of bicycle path length per 10,000 residents combined with values above average for the indicator of bicycle path length per 100 km2 of area. This includes three provinces: Greater Poland, Pomerania and Kuyavia-Pomerania.
The study found a statistically significant correlation between GDP per capita and the length of bicycle paths in a given province. The correlation is 0.83. The results support hypothesis H1 as follows—the length of bicycle paths in a given province is correlated with the GDP per capita in that province. Based on the data, an equation expressing the model of the length of bicycle paths on the basis of GDP per capita in Poland was built: Length of bicycle paths = −905.42 + 0.037 × GDP per capita.
On the one hand, this is good from the perspective of Smart city development, because wealthy provinces are provinces in which there are large cities, and therefore it is clear that it is particularly in those areas where such cities operate that large investments in the expansion of bicycle infrastructure are taking place. The expansion of this infrastructure will allow residents to use the bicycle more often as a means of transportation and enable more environmentally friendly transportation.
On the other hand, however, this is dangerous, as it may lead to a situation where regions of the rich with large cities will become more and more friendly places to live, attracting the population from poorer areas. In particular, this may affect young, well-educated people for whom the issue of bicycle paths is important. This may eventually lead to a situation in which poorer provinces, as a result of depopulation and in particular the lack of highly skilled labour, will become even poorer.
Also, studies conducted in other countries confirm [
92,
93] that the construction of bicycle paths requires the commitment of significant resources that individual cities cannot always afford when they are located in less affluent provinces. The high cost of building a system of bikeways with facilities is indicated, for example, by US analyses [
94].
The research did not show a statistically significant correlation between the length of bicycle paths per 10,000 inhabitants and GDP per capita. The results do not support hypothesis H2 as follows—the length of bicycle paths per 10,000 inhabitants in a province is correlated with GDP per capita in a province.
The analysis found a statistically significant correlation between the length of bicycle paths per 100 km2 of area and GDP per capita. The correlation is 0.55. The results support hypothesis H3 as follows—the length of bicycle paths per 100 km2 area in a given province is correlated with GDP per capita in a given province.
It is worth noting that the correlation between the length of bicycle paths per 100 km
2 area and GDP is lower than the correlation between the total length of bicycle paths in a province and its GDP. The high correlation coefficient found in the latter case suggests that a province’s wealth has a significant impact on the construction of new bicycle routes. The construction of new bicycle routes is expensive and requires considerable investment. The expense of constructing new bicycle paths was pointed out in many international studies for example Garret [
69], Benni et al. [
30], and Rich et al. [
95]. For this reason, less wealthy provinces have trouble finding enough funds to build new bicycle routes.
When building bicycle routes in order to effectively use limited funds, city authorities should pay attention to good planning of the process of creating bicycle routes. They should be of good quality and planned from the beginning to form a coherent system, which can also serve for inter-city communication and for connecting metro-bike, bus-bike, and car-bike transportation [
12,
96]. It is worth referring here to the world experience in this regard, for example, Barcelona [
35], Copenhagen [
33,
70,
71,
72], or Vancouver [
65].
Analysis of the correlations between the variables in
Figure 3,
Figure 4 and
Figure 5 allows us to conclude that more is invested in bicycle paths in the provinces located in northwestern Poland than would result from the wealth of the province as measured by GDP per capita. In particular, this is the case in Greater Poland, Pomerania, and Kuyavia-Pomerania.
By contrast, in central and southwestern Poland, investments in bicycle paths in individual provinces are smaller than their wealth level would suggest. This situation is particularly the case in Opole Province, Lesser Poland, Lower Silesia, Subcarpatia, and Holy Cross. For these provinces in particular, it should be recommended to accelerate the construction of new bicycle roads, which will have a positive impact on the quality of life of residents in smart cities as well as ecology.
The development of bicycle transportation is certainly very important from the point of view of the quality of life of residents, the implementation of smart city ideas as well as the implementation of current climate policy goals. A study by Rojas-Ruedy et al. [
96] shows that the implementation of smart mobility and smart biking will have a positive impact on the environment and the health of city residents. In this context, it is worth promoting the idea of using bicycles as a means of transportation for which the first step is to build a good, extensive system of bicycle paths that can be used by cyclists.


