1. Introduction and Overview
X-ray photoelectron spectroscopy (XPS) [
1] is a powerful tool extensively used in materials science and surface chemistry. It is renowned for its capacity to provide information about the elemental composition, chemical state, and electronic structure of materials. However, the interpretation of XPS data can be a challenging task, as it often involves addressing overlapping peaks, diverse chemical states, and noise present in the spectra [
2].
Traditionally, the analysis of XPS data has required significant expertise, with researchers relying on knowledge of chemical shifts, energy levels, and peak characteristics. While various software tools are available to aid in the curve-fitting process, e.g., CasaXPS (Casa Software Ltd., Teignmouth, Devon, UK), KolXPD (Kolibrik.net, s.r.o., Žďár nad Sázavou, Czech Republic), PeakFit (Systat Software Inc., San José, CA, USA), or Igor Pro (Wavemetrics, Lake Oswego, OR, USA), their efficacy is still heavily dependent on the user’s expert knowledge and judgment.
In recent years, advancements in artificial intelligence (AI) have prompted a shift in how we approach complex data interpretation tasks. Large language models (LLMs) [
3,
4,
5,
6], trained on diverse datasets, have demonstrated an impressive ability to generate human-like text, answer questions, and even provide insights on complex problems. These models mainly build on the Transformer architecture [
7,
8,
9] and advanced training mechanisms to accomplish convergence with billions of hyperparameters [
10]. This study explores the utilization of OpenAI’s Generative Pre-trained Transformer (GPT), in particular GPT-3.5 Turbo [
11,
12], an advanced LLM, to facilitate the analysis of XPS data.
The objective of this study is two-fold. First, we aim to enhance the curve-fitting process of XPS data obtained from the CIRCE-NAPP beamline at the CELLS ALBA Synchrotron facility in Cerdanyola del Vallès, addressing the challenges posed by overlapping peaks, diverse chemical states, and noise. Second, we seek to incorporate the LLM into the data interpretation process, thereby aiding researchers in extracting meaningful insights from the fitted parameters. The goal is to improve human expertise, enabling a more streamlined and efficient process for data analysis.
This paper further explores the strengths and limitations of using an LLM for such a purpose, and highlights the potential of AI in transforming the way we conduct and interpret scientific research. We also describe the integration of this functionality within the TANGO control system used at the CELLS ALBA Synchrotron. By integrating AI into the workflow, we open up new avenues for accelerated scientific discovery, and bring a fresh perspective to the existing methodologies of data interpretation in material science research. This study also highlights the value of ongoing collaboration between AI development and the scientific community to ensure the optimal utilization of these advanced models.
We envision a future wherein AI, particularly LLMs, play a significant role in the analysis and interpretation of scientific data, augmenting human expertise and enabling more researchers to leverage the power of techniques like XPS. As we continue to explore the interface between AI and scientific research, it becomes increasingly evident that the marriage of these two fields holds considerable promise.
The remainder of this paper is structured as follows:
Section 2 delves into the relevant literature and prior studies, presenting a comprehensive review of the works that have contributed to the current state of knowledge in the field. In
Section 3, we provide an overview of XPS, delineating its core principles, instrumentation, and applications. This is further refined in
Section 3.1, where APXPS, a specific variant of XPS, is elucidated, emphasizing its unique capabilities and significance.
Section 4 articulates our research methodology, giving emphasis to the materials, techniques, and procedures adopted throughout the study.
Section 5 introduces some use cases at the CELLS ALBA Synchrotron facility.
Section 6 presents the framework for integration of both LLM and scientist analysis into the workflow and
Section 7 describes the particularities of integrating the functionality into the TANGO control system. Transitioning toward the final
Section 8 and
Section 9, which encapsulate our primary findings, we highlight the implications of our research, and chart out potential avenues for future exploration in the domain.
2. Related Works
The application of XPS [
2] in the field of materials science has a well-established history, with extensive literature documenting methodologies for data acquisition, analysis, and interpretation. However, the integration of artificial intelligence (AI) into this field is a relatively novel concept, presenting an array of potential enhancements to traditional approaches.
In the realm of XPS data analysis, a wealth of literature focuses on the use of conventional curve-fitting techniques. Seminal works such as those in [
13,
14] provide comprehensive overviews of these techniques, discussing in depth the challenges related to peak overlap, the presence of noise, and the interpretation of chemical states. These papers underscore the need for expert judgment and the importance of careful peak parameter selection, shaping much of the contemporary thinking in this field.
Recently, more sophisticated curve-fitting methods, including iterative and machine learning (ML)-based techniques, have begun to emerge. Studies such as the one in [
15] propose the use of ML algorithms for automatic peak detection, demonstrating promising results in terms of precision and computational efficiency.
The usage of AI, and more specifically LLMs [
11,
12], in the scientific field has seen a surge in recent years. OpenAI’s GPT-3, the predecessor to GPT-3.5 Turbo, has been utilized in various scientific domains [
16,
17,
18,
19]. These studies highlight the capability of LLMs to generate informative, contextually relevant content, and suggest the potential for their application in more specialized scientific tasks [
20,
21,
22].
The integration of AI into XPS data analysis, however, remains relatively unexplored. Golze et al., 2022 [
23], put forth an innovative ML model that merges density functional theory (DFT) with GW (a theory named after the physicists Lars Hedin’s Green function (G) and screened Coulomb interaction (W)) [
24]; the GW method is a post-Hartree–Fock [
25] approach for the many-body treatment of electron–electron interactions. It is widely used for the calculation of the electronic properties of systems, particularly in the field of condensed matter physics. As already introduced, the “G” in GW refers to Green’s function, which describes the propagation of electrons in a material, while “W” denotes the screened Coulomb interaction between these electrons. This method is of utmost importance in the field of many-body physics and is widely recognized by its conventional designation “GW”. In [
26], they introduced an AI ab initio framework specifically tailored for predicting XPS data for the solid electrolyte interphase (SEI) of lithium–metal batteries. To the best of our knowledge, this study represents the first attempt to leverage an LLM like GPT-3.5 Turbo in the interpretation of XPS spectra, marking a unique contribution to both the field of materials science and AI applications in scientific research.
It is worth noting that, while the literature provides ample evidence of the potential benefits of AI in scientific data analysis, it also underscores the challenges and limitations inherent to these methods. The need for extensive training data, the risks of over-reliance on AI interpretations, and the occasional opacity of AI decision-making processes, are just a few of the issues highlighted in previous works. As such, while this study seeks to explore the potential of LLMs in XPS data interpretation, we acknowledge and address these challenges throughout our research.
3. X-ray Photoelectron Spectroscopy
XPS, also referred to as electron spectroscopy for chemical analysis (ESCA), is a powerful and versatile technique widely utilized for surface analysis [
27,
28]. Its principle lies in the photoelectric effect, where a material absorbs X-ray photons and consequently emits photoelectrons. The kinetic energy of these emitted photoelectrons and their relative number is meticulously measured to provide critical information about the elemental composition, chemical state, and electronic state of the material under investigation.
XPS functions on the basis that the kinetic energy of an electron emitted from a material is a function of the binding energy of the electron within the atom and the energy of the incident X-ray. This relationship can be formulated as follows:
where
denotes the kinetic energy of the photoelectron,
is the energy of the incident X-ray,
is the binding energy of the electron, and
is the work function of the electron energy analyzer that accounts for energy losses related to the spectrometer itself.
A typical XPS spectrum is a plot of the number of electrons detected (usually represented as counts/s) versus the binding energy of the electrons, measured in electron volts (eV). Each chemical element originates a set of specific XPS peaks in the spectrum, and their binding energies are also modulated by the atomic local bonding environment. The area under each peak is directly proportional to the amount of the corresponding element present in the surface region of the material.
XPS analysis is particularly beneficial due to its capability of detecting all elements (with special conditions required for detection of hydrogen and helium), its sensitivity (can detect elements present at the 0.1 atomic % level), its ability to provide information about the chemical state of the elements present, and its surface sensitivity, down to a few atomic layers.
While the method of curve fitting in XPS data analysis has been widely applied, the process of interpreting the curve-fitted peaks—representing different chemical states—often requires substantial domain expertise. This paper presents an approach to leverage the abilities of LLMs to assist in the interpretation of curve-fitted XPS data, providing a valuable tool to enhance the efficiency and accessibility of XPS analysis.
3.1. Ambient Pressure X-ray Photoelectron Spectroscopy
Following our discussion on XPS, it is crucial to delve into a more specialized variant of this technique which is the focus of our study: ambient pressure X-ray photoelectron spectroscopy, commonly abbreviated as APXPS [
29]. The evolution from conventional XPS to APXPS embodies our relentless pursuit of enhancing our investigative tools, facilitating experiments under conditions closer to reality.
XPS operates in ultra-high vacuum (UHV) conditions. While this ensures high precision and clarity in our measurements by reducing contamination and spectral interference, it somewhat limits the scope of conditions under which materials can be studied. Often, real-world conditions, especially in heterogeneous catalysis, energy storage, and environmental science, involve interactions occurring at non-vacuum conditions. This discrepancy between UHV conditions of XPS and ambient conditions of practical scenarios necessitated an adaptation.
APXPS bridges the gap by allowing researchers to perform XPS measurements at elevated pressures, extending from UHV up to atmospheric conditions, and sometimes even higher. This transition is not merely a trivial escalation in pressure; it signifies a monumental leap. By probing materials under conditions where actual reactions take place, APXPS provides insights that are directly translatable to real-world applications. For instance, in situ investigations of catalytic processes can be observed as they occur, paving the way for groundbreaking discoveries in reaction mechanisms.
Key to the success of APXPS is the differential pumping system, which maintains the X-ray source and detectors in UHV while the sample is subjected to higher pressures. This ensures the X-rays’ integrity and prevents contamination of the sensitive equipment. The capability to vary pressure allows researchers to mimic a plethora of environments, from the gas–solid interfaces in fuel cells to the liquid–solid boundaries in biological systems.
In essence, while XPS laid the foundation of surface science investigations with its prowess to determine elemental composition and chemical states, APXPS has expanded this frontier. It ensures that our experimental conditions are not just a mere approximation, but rather a true reflection of practical environments.
4. Materials and Methodology
This section presents the details of the materials and methodologies employed for this study. Our synthetic dataset consists of simulated XPS spectra from a hypothetical sample, created to represent typical complexities encountered in real XPS data, including peak overlaps and noise. The analysis is a two-step process, starting off with a curve fitting procedure, followed by interpreting the output using OpenAI’s GPT-3.5 Turbo [
30].
The synthetic XPS spectra generated for this study include the addition of simulated noise to closely mimic the characteristics of real-world experimental data. The noise in XPS spectra typically arises from various sources, including instrumental factors, environmental fluctuations, and inherent variations in the sample. To replicate these conditions, we have employed a noise simulation approach as follows:
In our synthetic spectral data, noise was introduced to simulate the inherent fluctuations present in experimental measurements. The noise was generated as a normally distributed random variable, normally referred to as Gaussian noise, with a mean of zero and a standard deviation of 0.1. This choice of standard deviation was made to reflect typical signal-to-noise ratios encountered in real XPS data. We applied this noise uniformly across the entire energy range of the synthetic spectra. Specifically, the np.random.normal function was used to create a noise array of the same size as the energy range, ensuring that each data point had a unique, random deviation from the true signal. This process was controlled using a fixed seed (seed = 0) for the random number generator, which ensures reproducibility of the noise for consistent comparison of results.
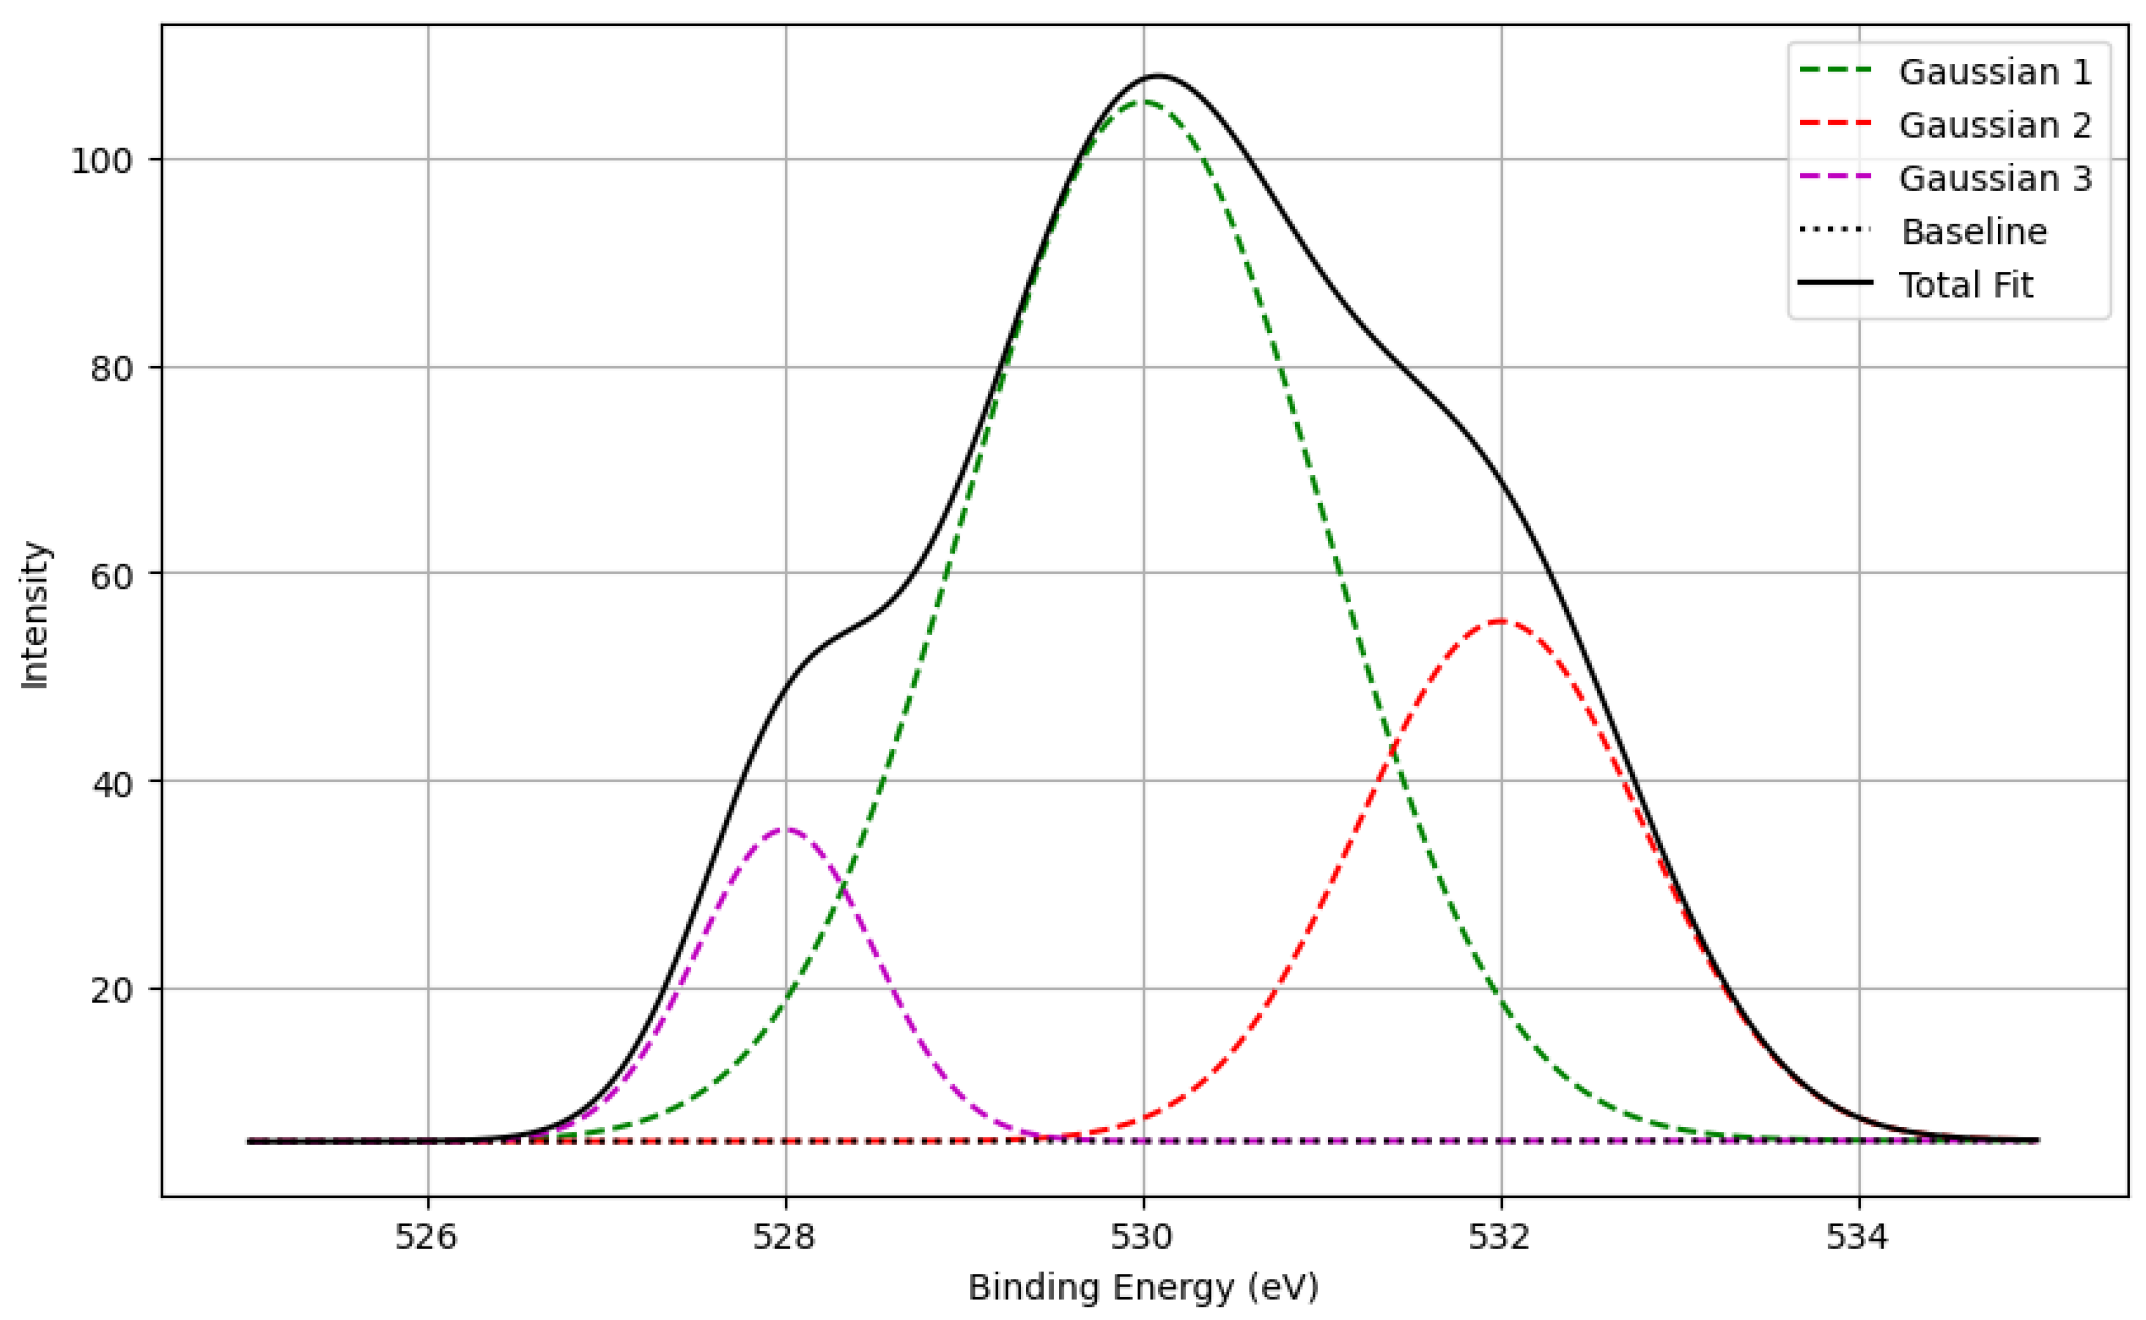
Figure 1 and
Figure 2 illustrate the resulting synthetic spectra with this superimposed noise, which visually manifests as small, random fluctuations around the simulated peak intensities.
4.1. Curve Fitting
To effectively analyze the XPS data, we first perform a curve-fitting procedure. Our synthetic data contain several Gaussian distributions corresponding to different energy levels. Each Gaussian peak is defined as follows:
where
A is the height of the curve’s peak;
is the position of the center of the peak;
is the standard deviation which determines the width of the peak.
Our task is to fit a series of Gaussian distributions to the raw data to approximate the observed peaks, and, in the process, estimate the parameters (A, , ) for each distribution.
We employ the algorithm Levenberg–Marquardt [
31,
32] implemented in the library
lmfit [
33] for the curve-fitting procedure. This algorithm is widely used in curve-fitting problems, offering robustness in handling nonlinear least-square problems. The objective of this step is to minimize the sum of the squared residuals, defined as follows:
where
are the observed values,
are the corresponding energy levels, and
is the fitted Gaussian curve. Levenberg–Marquardt iteratively refines the parameters (
A,
,
) to reach a minimum for
S.
Figure 1 provides a visual representation of a synthetic XPS data for Oxygen 1s, illustrating the contribution of multiple Gaussian peaks, and a linear baseline to the overall spectrum.
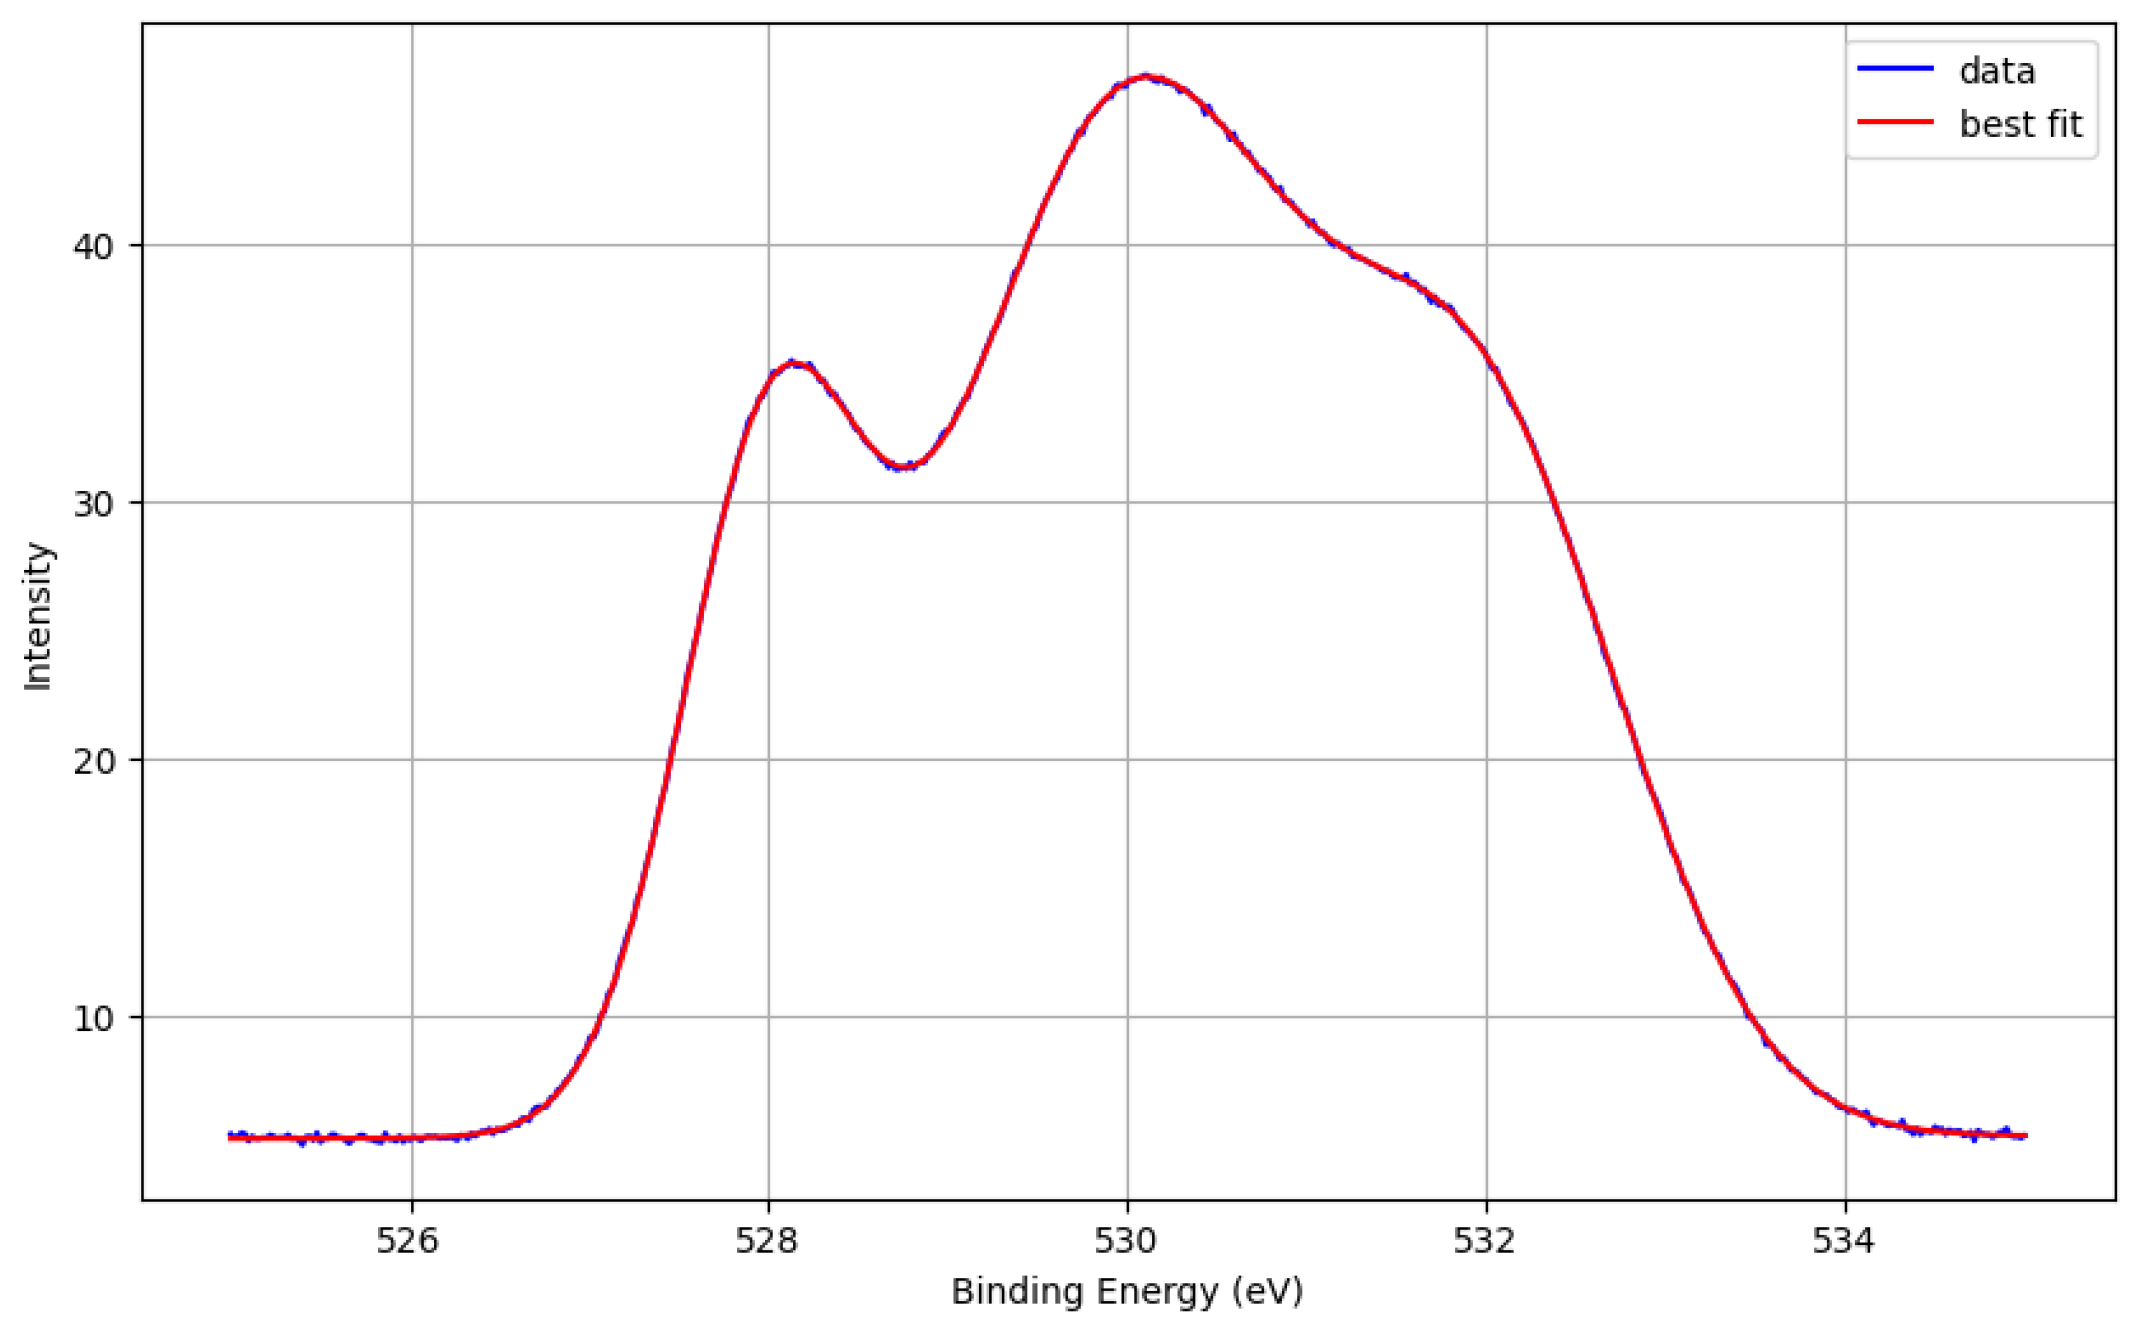
In
Figure 2, we showcase the results of the curve-fitting process applied to our synthetic oxygen XPS data. The initial guesses for peak centers, amplitudes, and sigma (widths) were carefully chosen within a reasonable range based on prior XPS data and domain expertise. These initial conditions were utilized to fit the Gaussian models to our synthetic data. The plot in the figure displays the original synthetic data in blue, and the best fit result obtained from the curve fitting process in red. The close overlap between these two lines indicates a successful curve fitting, providing meaningful peak information from the synthetic data. The robustness of this approach further emphasizes its potential applicability for real-world XPS data analysis.
In our approach, the number of components (or peaks) for the fittings is determined using the continuous wavelet transform (CWT), and the optimization uses the python library lmfit.
The fitting results for model Voigt [
34] yielded specific parameters for each peak, such as center, amplitude, and sigma. The pseudocode is presented in Algorithm 1.
| Algorithm 1 Extract peak parameters from fitting. |
- 1:
function ExtractParameters() - 2:
- 3:
- 4:
while True do - 5:
RegexSearch - 6:
RegexSearch - 7:
RegexSearch - 8:
RegexSearch - 9:
RegexSearch - 10:
RegexSearch - 11:
if and and and and and then - 12:
Append(parameters, {’center’: , ’centerError’: , …}) - 13:
- 14:
else - 15:
break - 16:
end if - 17:
end while - 18:
return - 19:
end function
|
4.2. LLM-Informed XPS Analysis
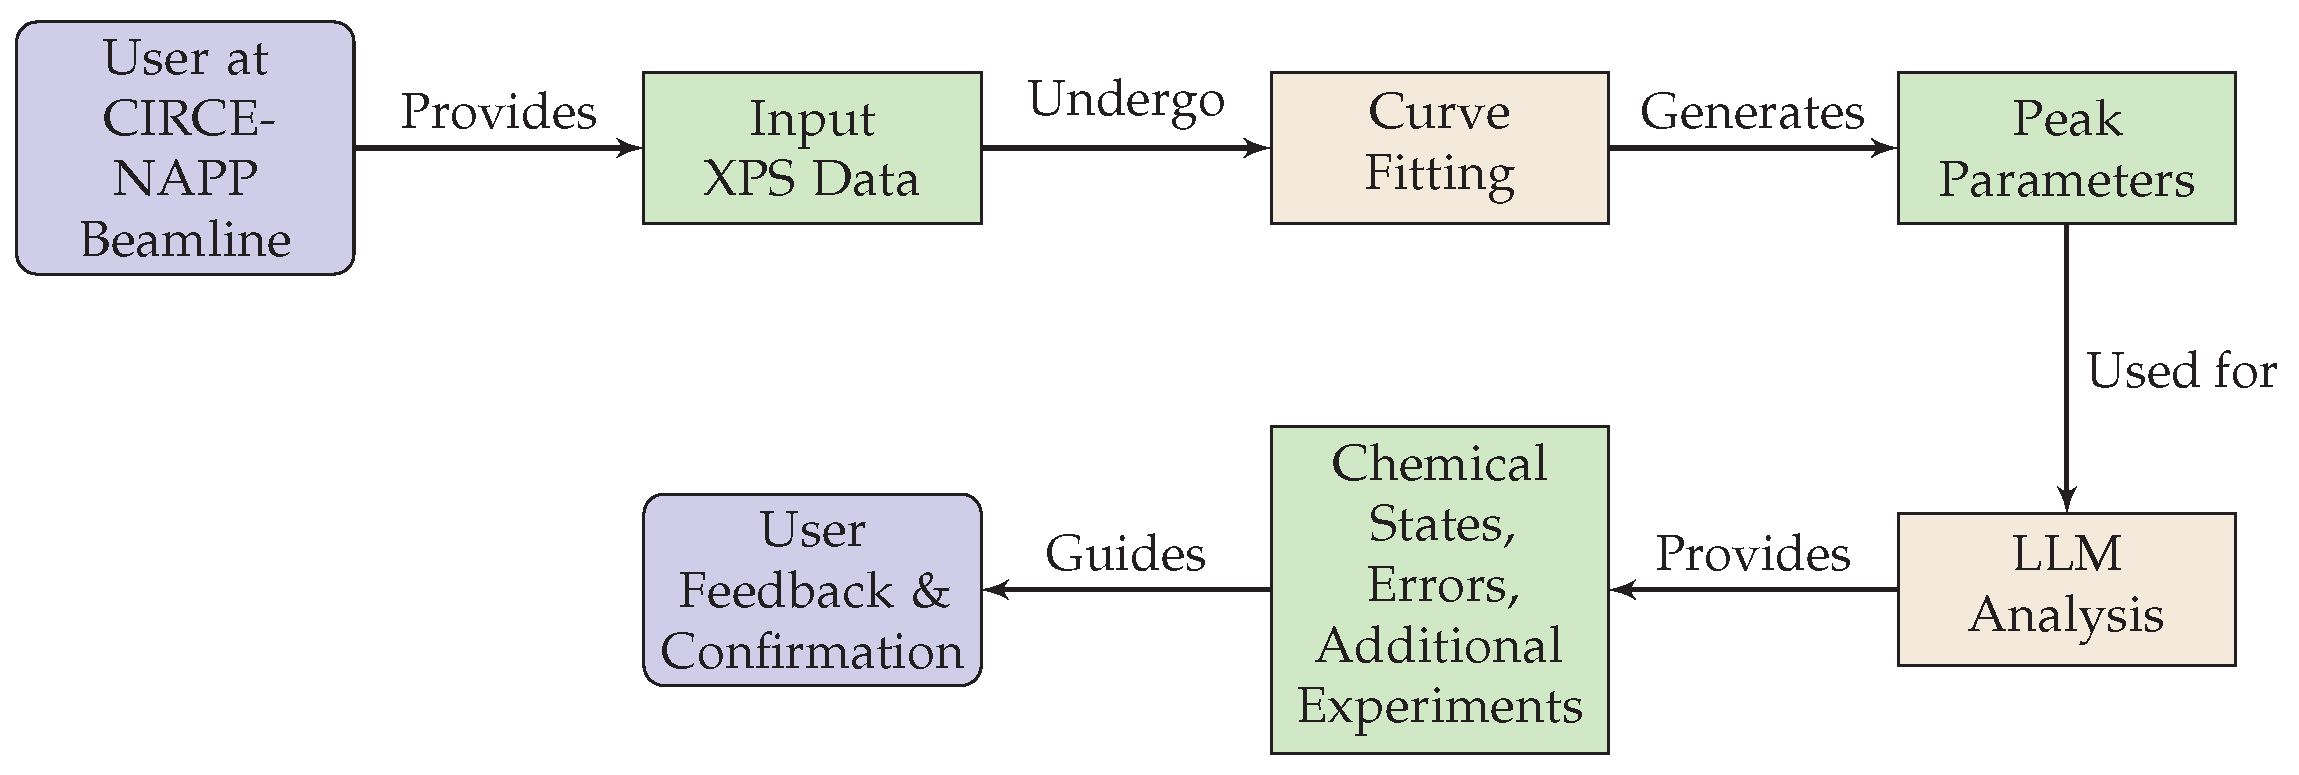
In our methodology, the LLM plays a significant role in interpreting the outcomes of the XPS data curve-fitting procedure as depicted in
Figure 3. We employ the LLM to provide insights on the potential chemical states of oxygen, suggest potential sources of error, and recommend any additional experiments needed for further confirmation based on the parameters obtained from the curve-fitting process.
In
Figure 3, the interaction between the user at the CIRCE-NAPP beamline at the CELLS ALBA Synchrotron facility and the LLM-informed agent is depicted. This diagram elucidates the key stages of our innovative XPS data analysis pipeline, beginning with the user providing initial XPS data. The data are then subjected to the curve-fitting process, described in Algorithm 1. The resultant peak parameters are subsequently analyzed by the LLM to provide detailed insights into possible oxygen chemical states, potential sources of error, and recommended additional experiments, as shown in Algorithm 2. This analysis is then returned to the user, facilitating a decision-making process informed by deep, AI-assisted understanding of the data. This iterative process enables rapid, accurate, and efficient analysis of XPS data, with each loop offering opportunities for fine-tuning and increased precision.
| Algorithm 2 LLM Peak Analysis Function for GPT-3.5/4.0 |
Require: parameters: List of fitted parameters for each peak
Ensure: analysis_response: Detailed analysis from the LLM
1: global recommendation_cache
2: function GetLLMPeakAnalysis(parameters)
3: parameters_string ← ConvertParametersToString(parameters)
4: if parameters_string ∈ recommendation_cache then
5: return recommendation_cache[parameters_string]
6: end if
7:
8: max_retries ← 100
9: wait_time ← 60 ▹ Seconds
10: while retries ≤ max_retries do
11: Attempt to send request to LLM
12: Handle exceptions and retry if needed with exponential backoff
13: if request successful then
14: break ▹ Successful request
15: end if
16: end while
17: if retries > max_retries then
18: raise Exception(’Maximum retries exceeded.’)
19: end if
20: analysis_response ← response.choices[0].message.content.strip()
21: ecommendation_cache[parameters_string] ← analysis_response
22: return analysis_response
23: end function |
This analysis starts structuring the LLM operation around a Python function, which takes as input a list of fitted parameters for each peak in the XPS data. These parameters include the center, amplitude, and standard deviation (sigma) of each peak.
This function creates a formatted string, detailing the center, amplitude, and sigma of each peak. This string acts as the basis for a query to the LLM. Prior to querying the LLM, we verify whether the same string exists in a cache, a dictionary that stores previous queries and their corresponding responses from the LLM. If a match is found, the cached response is returned immediately. This cache mechanism minimizes redundant queries to the LLM and enhances the efficiency of the function.
In cases where the query string is not found in the cache, the function engages in an interaction with the LLM. A maximum of 100 attempts, or “retries”, are allowed for successful communication with the LLM. The API function handles this interaction, where a system message first sets the context of the LLM as an expert in XPS with deep knowledge in chemical state identification and binding energy levels. The user message then presents the fitted peak parameters and requests a detailed analysis.
The choice of 100 retries was determined based on a balance between ensuring robustness in data processing and practical considerations regarding system wait times and API responsiveness. From empirical observations and prior usage metrics, we noted that instances requiring retries typically succeed within a handful of attempts due to transient network issues or temporary service outages. However, to account for the possibility of more protracted disruptions while avoiding indefinite engagement in futile attempts, we established an upper limit that is reasonably high to cover the vast majority of expected scenarios. This limit also serves as a safeguard against indefinite resource allocation in the event of unforeseen persistent issues with the API service. It allows the system to eventually timeout and provides feedback to the user, enabling them to take alternative actions if necessary. The number 100 is a heuristic that has been adopted in various computational systems as a standard threshold for retry mechanisms, striking a balance between tenacity and efficiency. In practice, the likelihood of reaching this limit is low, and our system logs indicate that the average number of retries rarely exceeds one or two times. Nevertheless, setting this limit ensures that our automated system can handle exceptions gracefully and maintain operational continuity without manual intervention under normal operational conditions.
The model of choice is “gpt-3.5-turbo” or “gpt-4-1106-preview”. If the function encounters any issues in this process, it applies an exponential backoff strategy by incrementally increasing the waiting time between retries, mitigating the potential for rapid, repeated failures.
Upon receiving a response from the LLM, the function extracts the analysis provided by the LLM, stores it in the cache for potential future use, and finally returns the analysis.
Through this process, the implementation integrates the expert-level insights of the LLM into the XPS data analysis pipeline, providing a richer, more comprehensive interpretation of the data than a purely quantitative approach may offer. By asking the LLM to provide analysis given the peaks’ parameters, we can extract high-level knowledge embedded in the LLM during its training, thereby leveraging its capability to generate human-like text based on the vast amount of information it was trained on.
4.3. LLM Interpretation
Post curve fitting, the resultant parameters of each peak are analyzed using OpenAI’s GPT-3.5 Turbo, as described previously. The model receives as input a formatted string containing the parameters of each fitted peak, as well as some auxiliary information about the sample, to generate an output that simulates a consultation with a domain expert.
The process is implemented with the OpenAI API. We use the “openai.ChatCompletion.create” function, passing in an array of message objects. The first message sets the role of the assistant and the second message provides the content which includes the fitted peak parameters.
For instance, the content may look as follows:
“Given that peak 1 has a mean at 532.5 eV with a standard deviation of 1.2 eV and an amplitude of 0.75, peak 2 has a mean at 533.5 eV with a standard deviation of 1.1 eV and an amplitude of 0.80, can you help me interpret the potential chemical states?”
The model then generates a response that interprets the peaks in terms of potential chemical states and other relevant factors. The output is parsed, and the extracted information is presented to the user.
This process introduces a layer of expert-like analysis, allowing for an accessible and insightful understanding of the fitted XPS data, which can be especially useful for those lacking extensive background in the field.
For instance, an example query using OpenAI GPT-3.5-turbo is the following:
![Signals 05 00010 i001]()
That produces the next LLM-informed analysis:
![Signals 05 00010 i002]()
In Algorithm 2, we present the pseudocode representation of the LLM peak analysis function, an integral part of our LLM-informed XPS analysis methodology. This function defines the core logic for interfacing with the LLM, handling the submission of XPS peak parameters, managing communication retries, and processing the LLM’s response. The pseudocode illustrates the sequence of operations, starting from the conversion of fitted peak parameters into a query string, checking against a cache for previously processed queries, and then engaging in a controlled interaction with the LLM API, which we have developed interfaces for GPT-3.5/4.0, and also LLaMA-2 [
35,
36] and Zephyr-7b-
[
6,
10]. Notably, it includes a mechanism for handling potential communication failures and employs an exponential back-off strategy for retrying requests, ensuring robustness in real-world application. The primary objective is to obtain a detailed analysis from the LLM, which is then returned to the user for further review and interpretation.
More advanced and sophisticated prompts could be used for specific use cases in the beamline, for instance the one shown next for the study on possible Oxygen chemical states present on an Ag(111) crystal:
![Signals 05 00010 i003]()
Additionally, this procedure could be further enhanced by using specialized domain knowledge to guide the LLM analysis [
37] as well as other measurement data files, for example, contamination analysis of the sample.
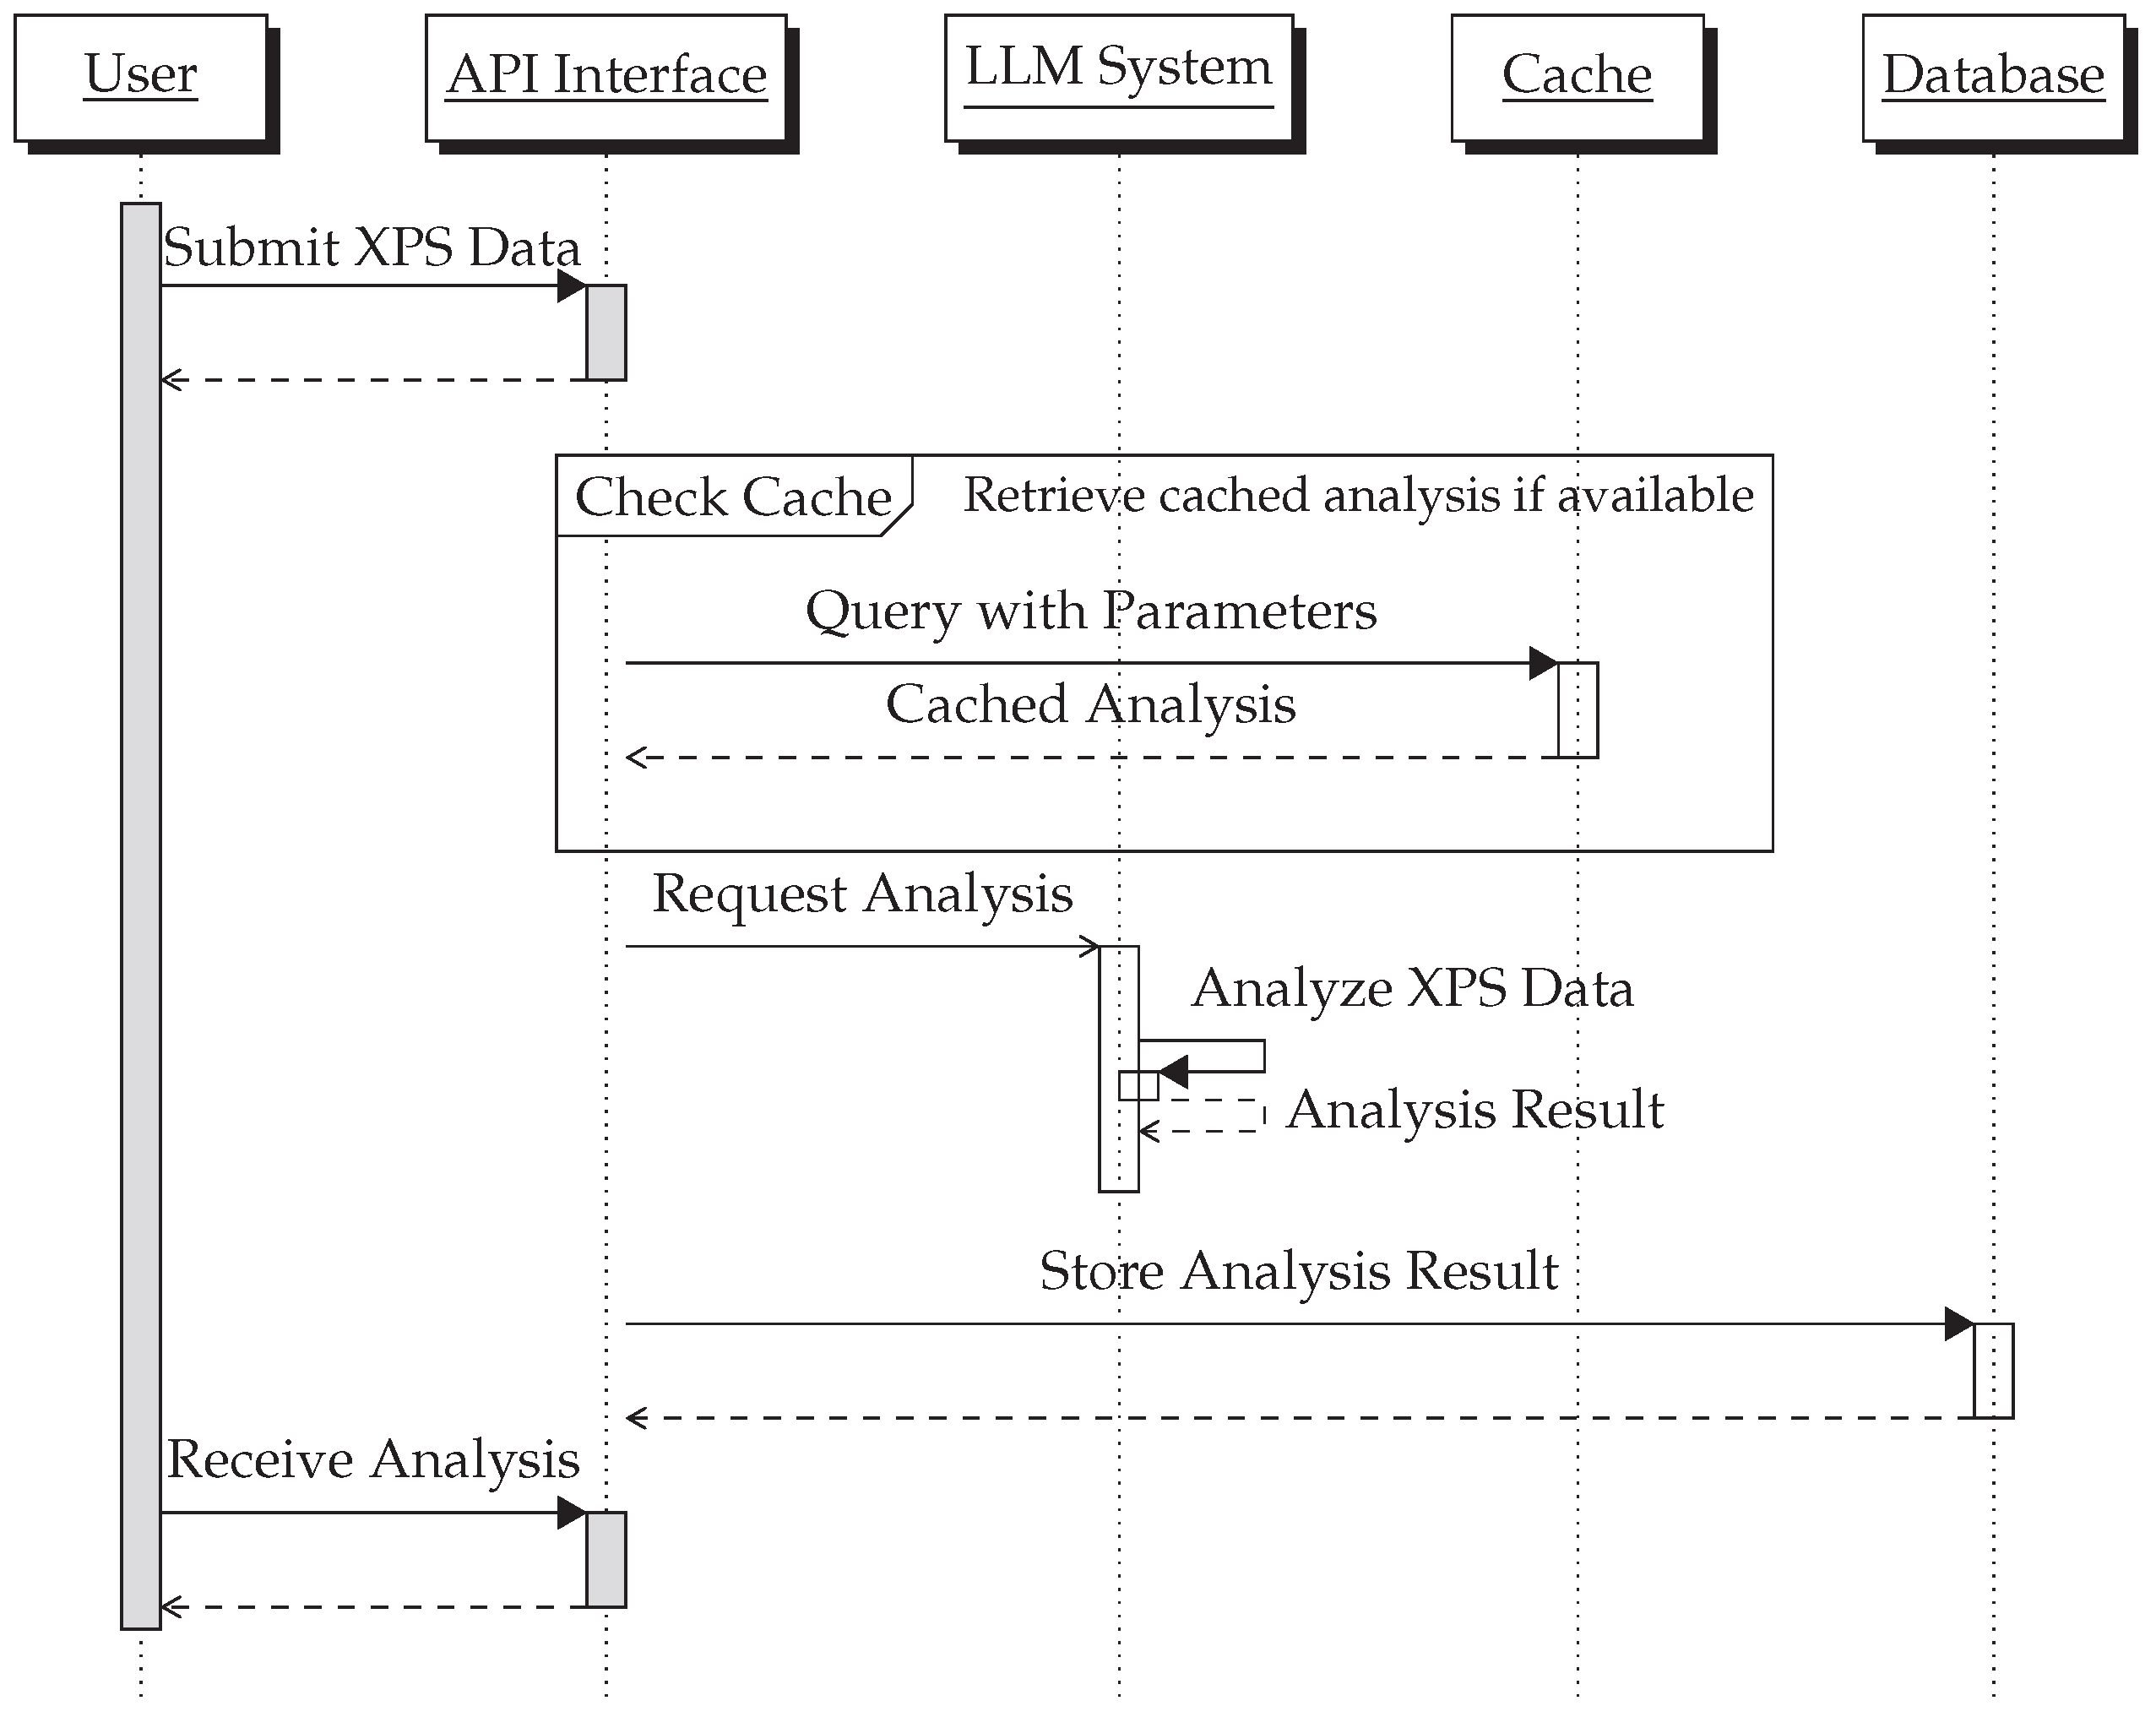
Figure 4 presents a sequence diagram that delineates the interaction between various components of the Synchrotron Light Source’s XPS data analysis framework. The process starts with the user uploading XPS data, which then traverse through a sequence of systematic checks and processes involving the API, LLM, cache mechanism, and the database for the user in the beamline.
5. Use Cases from the CELLS ALBA Synchrotron Radiation Facility
This section showcases two real use cases from the CELLS ALBA Synchrotron facility, illustrating the practical application and the efficacy of combining LLMs with advanced XPS analysis. These examples highlight the synthesis of theoretical knowledge with cutting-edge AI tools to address complex experimental scenarios. Due to confidentiality and data protection protocols, complete experimental details cannot be disclosed. However, the selected outputs underscore the depth of analysis achievable through this innovative approach.
5.1. In Situ Oxidation of Ag(111) Crystal Analyzed by GPT-4
The first example involves the in situ oxidation of an Ag(111) crystal, a critical process in understanding surface chemistry and reactivity. Utilizing the capabilities of “gpt-4-0613”, we were able to dissect the intricate details of the XPS spectrum, focusing on the identification and interpretation of oxygen chemical states amid experimental conditions. The peak analysis, as detailed below, sheds light on the potential formation of metal oxides and the presence of adsorbed oxygen species, providing invaluable insights into the surface phenomena occurring during the oxidation process.
![Signals 05 00010 i004]()
5.2. Further Insights from LLaMA-2 on Ag(111) Crystal Oxidation
Continuing our exploration, a subsequent analysis was performed using “llama-2-13b-chat-hf” to further dissect the XPS spectrum of the same Ag(111) crystal under similar experimental conditions. This examination aimed to validate and expand upon the findings from the GPT-4 analysis, leveraging the understanding of chemical states that LLMs provide. The detailed peak data and analysis accentuate the robustness of LLMs in deciphering complex XPS data, highlighting their potential to enhance scientific discovery and interpretation significantly.
![Signals 05 00010 i005]()
5.3. Scientific Assessment of the LLM Analyses
The identification of peaks around 528 eV and 530 eV and their association with lattice oxygen in metal oxides and adsorbed oxygen species or contamination effects is consistent with known XPS analysis phenomena. These binding energy values are within the expected range for oxygen species on metal surfaces, reflecting the versatility of XPS in detecting surface chemical states.
The consideration of sulfur contamination affecting peak interpretation is a realistic concern in XPS studies. Sulfur species can indeed contribute to the complexity of the spectrum, necessitating careful analysis to differentiate between overlapping peaks and chemical states.
The detailed analysis capturing the potential for the formation of silver oxide (Ag2O or AgO) during the oxidation process is a plausible outcome expected in such experiments. The discussion around various oxygen species, including adsorbed oxygen and hydroxyl groups, aligns with the surface chemistry changes one would anticipate during the oxidation of silver surfaces.
6. Scientist Analysis with Domain Knowledge
Following the innovative approach of combining traditional curve fitting with LLM-assisted interpretation for XPS data analysis, it becomes crucial to integrate expert scientist analysis into the workflow. This section emphasizes the importance of domain expertise in validating and contextualizing the findings obtained from the LLM.
The involvement of expert scientists serves several critical functions in the data analysis process:
Validation of LLM Interpretations:While LLMs provide a high-level interpretation of XPS data, the validation of these interpretations requires expert judgment. Experts in material science and surface chemistry can ascertain the accuracy of the LLM’s analysis, ensuring that it aligns with established scientific knowledge and principles.
Expert Review: This interpretation is then reviewed by the expert scientists, who assess its validity and relevance in the context of the specific material system under study.
Refinement and Contextualization: The expert may refine the interpretation, adding contextual details or highlighting aspects that the LLM may have overlooked or misinterpreted.
Formulation of Conclusions: The final step involves formulating the conclusions and recommendations for further research. This step is a collaborative effort, leveraging the strengths of both the LLM’s broad knowledge base and the expert’s deep domain-specific understanding.
6.1. Integration with LLM-Assisted Workflow
The integration of expert analysis with the LLM-assisted workflow follows a collaborative approach:
Initial Interpretation: The LLM provides an initial interpretation of the XPS data based on the parameters obtained from the curve-fitting procedure.
Expert Review: This interpretation is then reviewed by the expert scientists, who assess its validity and relevance in the context of the specific material system under study.
Refinement and Contextualization: The expert may refine the interpretation, adding contextual details or highlighting aspects that the LLM may have overlooked or misinterpreted.
Formulation of Conclusions: The final step involves formulating the conclusions and recommendations for further research. This step is a collaborative effort, leveraging the strengths of both the LLM’s broad knowledge base and the expert’s deep domain-specific understanding.
To illustrate the value of expert scientist analysis in this workflow, a series of case studies can be considered. These may include scenarios wherein the LLM’s interpretation required significant refinement or where the expert’s insight led to a reevaluation of the initial conclusions. For instance, in a study involving a novel alloy surface, the LLM may identify the predominant chemical states, but the expert’s analysis could reveal subtler interactions or phase transformations not immediately apparent from the XPS data.
Table 1 summarizes the framework.
6.2. Fine-Tuning of LLM Responses and Feedback Integration
The fine-tuning of the LLM’s responses involves a multi-step process, building on the pipeline introduced in [
38]:
Initial LLM Analysis:As depicted in
Figure 3, the LLM first provides a preliminary analysis based on the XPS data’s curve-fitting parameters. This analysis includes potential chemical states, errors, and recommendations for additional experiments.
Expert Review and Feedback: The initial LLM analysis is then reviewed by domain experts at the CELLS ALBA Synchrotron. These experts, equipped with extensive knowledge in material science and surface chemistry, evaluate the LLM’s interpretations for their accuracy and relevance to the specific material system under study.
Refinement and Feedback Integration: Based on their assessment, experts may refine the LLM’s interpretations. This refinement could involve correcting inaccuracies, providing additional contextual information, or suggesting alternative interpretations. This refined information is documented and systematically categorized for future reference.
Feedback Incorporation into LLM: The collected feedback and refined interpretations can be then used to further train the LLM. This training involves using the corrected interpretations and additional context as new training data, allowing the LLM to learn from the expert’s input and improve its future analyses.
Iterative Process: This process of analysis, review, refinement, and retraining forms an iterative loop. With each iteration, the LLM’s ability to accurately interpret XPS data is enhanced, leading to more reliable and precise analyses in subsequent uses.
Integrating expert feedback into the LLM involves several key mechanisms:
Data Annotation: Expert modifications and annotations are systematically recorded. These annotations include not only corrections but also contextual information and reasoning behind each adjustment.
Updating Training Data: The annotated data can be then added to the LLM’s training dataset. This dataset serves as the foundation for retraining the LLM, ensuring that it incorporates the expert knowledge imparted through the feedback.
Model Retraining: Periodically, the LLM can undergo retraining sessions where it is exposed to the updated dataset. This retraining should be conducted in a controlled environment to ensure that the model’s fundamental capabilities are preserved while it adapts to the new information.
Performance Monitoring: Post-retraining, the LLM’s performance should be closely monitored to assess improvements and identify areas where further refinement is needed. This monitoring is crucial to ensure that the model continues to align with the high standards of accuracy required in scientific data analysis.
The described fine-tuning process exemplifies a continual learning approach, where the LLM dynamically evolves based on ongoing expert input. This approach ensures that the LLM remains up-to-date with the latest scientific understanding and adapts to the nuanced needs of XPS data analysis.
Adaptive Learning: The LLM’s learning mechanism is designed to adapt to new information and feedback continuously, allowing it to stay relevant and accurate over time.
Expert Involvement: Regular involvement of domain experts ensures that the LLM’s learning trajectory aligns with real-world scientific knowledge and practices.
7. Integrating LLM-Informed Strategy with TANGO Control System at CELLS ALBA Synchrotron
The CELLS ALBA Synchrotron employs the TANGO (7.2.x/8.1.x/9.2.x/9.3.3) control system, a software framework for controlling and monitoring scientific and industrial hardware. Integrating the LLM-informed XPS data analysis strategy within this framework can significantly enhance the capabilities of the system, enabling more sophisticated and efficient processing and interpretation of XPS data. This section outlines the proposed integration approach.
TANGO Control System is an object-oriented distributed control system using CORBA (Common Object Request Broker Architecture). It provides a framework for device interfacing and management, offering tools for configuring and operating a wide range of devices and instruments. At CELLS ALBA Synchrotron, TANGO plays a critical role in managing beamline operations, including data acquisition systems.
The integration of the LLM-informed XPS analysis strategy into the TANGO system involves several key components and steps:
Data Acquisition and Preprocessing: The XPS data acquired from experiments at the beamline are first pre-processed to align with the input requirements of the LLM. This involves noise reduction, normalization, and any other relevant data conditioning.
Enhancing TANGO Device Servers: TANGO device servers, which control various hardware components, will be enhanced to include an interface to the LLM analysis module. This interface will handle the sending of processed XPS data to the LLM and receiving the interpreted results.
LLM Integration: A new device server or an extension to an existing server will be developed to incorporate the LLM. This server will manage the communication with the LLM API, sending the pre-processed XPS data and receiving the analysis results.
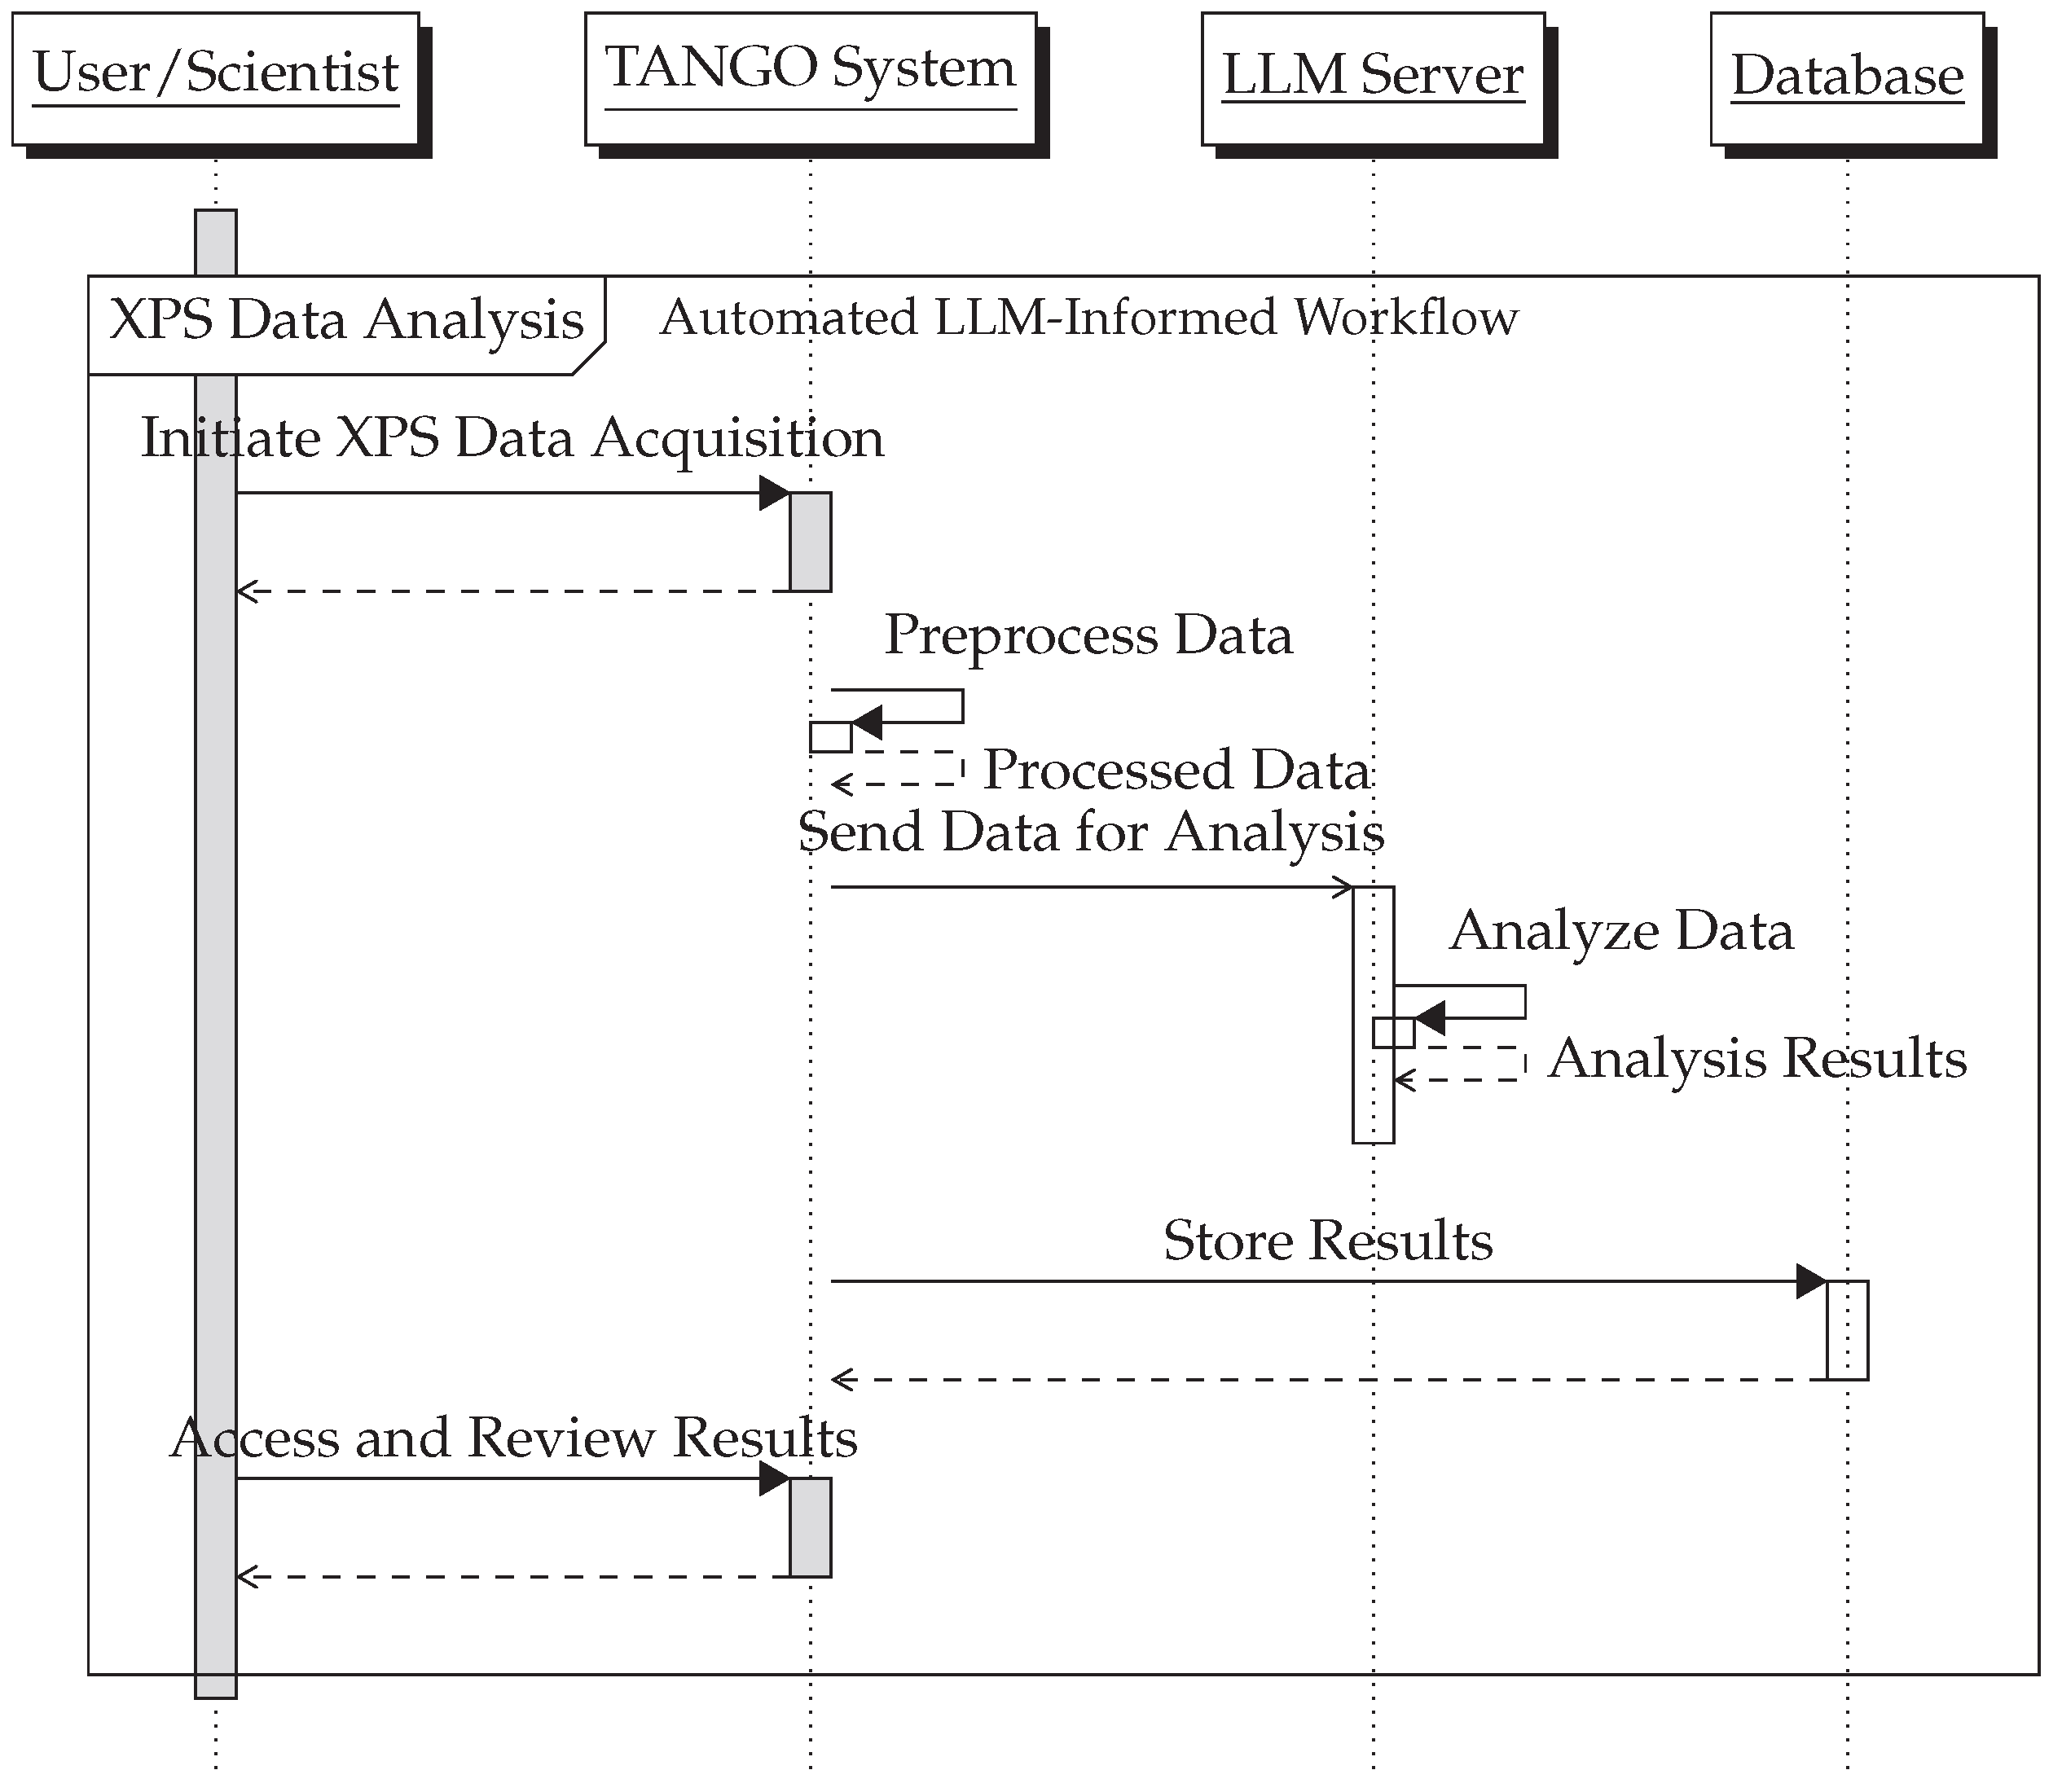
Automated Analysis Workflow: The TANGO system will automate the workflow where the XPS data, once acquired and pre-processed, are automatically sent to the LLM server for analysis. The interpreted results are then fed back into the TANGO system for user review or further automated processing.
User Interface and Visualization: The existing user interface of the TANGO system will be updated to include features for visualizing and interacting with the results provided by the LLM. This may include graphical representations of the XPS spectra with annotated peaks and interpretations, as well as tools for manual review or modification of the analysis.
Data Storage and Retrieval: Integration with TANGO’s database system for storing both the raw XPS data and the interpreted results. This ensures that all information is readily available for future reference, comparison, or further analysis.
The integration of the LLM-informed strategy into the TANGO control system at CELLS ALBA Synchrotron offers several benefits:
Enhanced Data Interpretation: Leveraging LLM for XPS data interpretation brings a higher level of accuracy and depth in analysis, aiding researchers in understanding complex chemical states and materials properties.
Increased Efficiency: Automating the data interpretation process reduces the time and effort required by researchers, allowing them to focus on more critical aspects of their experiments.
Scalability: As the volume of data generated at the synchrotron grows, the LLM-informed system can scale accordingly, providing consistent and reliable analysis.
User Accessibility: The integration makes advanced data analysis accessible to a broader range of users, including those who may not have deep expertise in XPS data interpretation.
The integration of an LLM-informed strategy within the TANGO control system at CELLS ALBA Synchrotron represents a significant advancement in the field of synchrotron data analysis. It exemplifies the potential of AI and ML in enhancing scientific research capabilities, paving the way for more accurate, efficient, and accessible scientific experimentation and data analysis. The workflow is depicted in
Figure 5.
7.1. Detailed Integration Mechanism
The integration of LLMs within the TANGO control system is accomplished through the following specific mechanisms:
LLM Server Integration: The LLM server acts as a bridge between the TANGO control system and the LLM’s analytical capabilities. This server is configured to interface with the OpenAI API, enabling it to send pre-processed XPS data for analysis and receive interpreted results.
Data Transmission Protocols: Within the TANGO system, data are transmitted between different components using the CORBA protocol. The LLM server will also utilize this protocol to ensure seamless data flow and integration within the existing framework.
Customized Device Server for LLM: A specialized TANGO device server is created specifically for the LLM integration. This server is responsible for handling all interactions with the LLM, including data sending, receiving analysis results, and error handling.
Trigger Mechanism for Analysis: The LLM server is programmed to automatically trigger the analysis process once the XPS data are pre-processed and ready. This trigger can be set manually by a user or programmed to activate upon certain conditions being met within the data.
7.2. Workflow Explanation
Initiation and Data Handling: When XPS data are acquired and pre-processed, the TANGO system initiates the analysis workflow. This involves packaging the data into a suitable format (e.g., JSON or XML) for transmission to the LLM server.
Analysis and Feedback Loop: Upon receiving the data, the LLM server processes the request and sends it to the OpenAI API. The results, once received, are then formatted and sent back to the TANGO system. This feedback loop ensures that the analysis is aligned with the system’s requirements and can be adjusted in real time based on user input or automated parameters.
Visualization and Interaction: The results from the LLM are integrated into TANGO’s user interface, where scientists can interact with, visualize, and interpret the data. This integration includes displaying annotated XPS spectra, highlighting key findings, and allowing users to adjust parameters or inputs for re-analysis if needed.
7.3. Enhanced Functionalities in TANGO
Real-time Analysis and Adaptation: The integration can allow for real-time analysis of XPS data, with the LLM providing rapid interpretations. This capability enables immediate adjustments to experiments based on the LLM’s feedback.
Automated Data Flow and Processing: The entire process, from data acquisition to analysis and storage, can be automated, ensuring a streamlined workflow. This automation reduces manual intervention and speeds up the research process.
Scalable and Updatable System: The integration framework can be designed to be scalable, accommodating increases in data volume and complexity. The LLM server can be updated or retrained as needed to keep up with advancements in AI and XPS analysis techniques.
8. Discussion
The combination of synthetic XPS spectra data analysis using curve fitting and interpretation with the LLM has been successfully demonstrated in this study. The approach presents several implications and potential improvements which warrant discussion.
The application of LLM, in particular OpenAI’s GPT-3.5 Turbo or GPT-4.0, for the interpretation of fitted XPS data adds a crucial layer of accessibility and comprehension for users who may not possess extensive background knowledge in XPS or materials science. By interpreting the peaks and their possible chemical states, users are guided toward a more precise understanding of their data, which can lead to more effective decision-making in subsequent steps, such as material synthesis or characterization.
Furthermore, the approach adopted in this study is not limited to XPS data alone. With suitable training or fine-tuning, the LLM can be adapted to interpret data from other spectroscopic techniques or even beyond the realm of materials science.
While the LLM provides helpful interpretations, it should be noted that its conclusions are based on the large corpus of information it was trained on, and it does not have the ability to “think” or “understand” in the human sense. Therefore, any output generated by the LLM should be carefully considered and cross-verified with other sources or expert opinions.
Moreover, the current methodology uses a XPS synthetic dataset which is a surrogate APXPS example use case data from the CIRCE-NAPP beamline at CELLS-ALBA Synchrotron facility and also some particular real sample usage for empirical validation, which may not encompass the full complexity of the comprehensive real-world XPS data. As future work, the system could be tested and refined using additional real-world XPS data to further validate its effectiveness. The incorporation of more advanced curve-fitting methods or models capable of handling more complex cases would be beneficial.
Another potential improvement is the fine-tuning of the LLM to better adapt to XPS data interpretation. With more specific training data, the LLM could potentially generate more accurate and detailed interpretations, further enhancing its utility as a tool for XPS data analysis.
In the rapidly evolving landscape of scientific research, particularly in nuanced disciplines such as APXPS, the continuous integration of emerging literature into analytic tools presents a transformative opportunity. Actual-generation LLMs [
39] are mainly constrained by a fixed knowledge cutoff, which inherently limits their capability to offer insights contextualized within the latest advancements. Incorporating real-time literature into LLMs, which has started to happen, could usher in a paradigm shift in research methodologies. Such a system would not only bolster the relevance of data interpretation by grounding it in the most contemporary theoretical frameworks, but also expedite the recognition of novel findings by juxtaposing them against recent publications. Moreover, this integration has the potential to streamline literature reviews and foster timely interdisciplinary collaborations. Yet, this promising horizon is not without its challenges. Quality control, potential biases from emergent literature, and the deliberation on incorporating non-peer-reviewed preprints necessitate a comprehensive and judicious approach to implementing this marriage of LLMs and live literature updates. Thus, as we stand on the cusp of this innovation, it is imperative to balance the allure of cutting-edge technology with the rigorous standards of scientific inquiry.
Open-source technologies have long fostered a spirit of collaborative innovation, democratizing access to state-of-the-art resources while promoting transparency and adaptability. Within the realm of LLMs, frameworks such as QLoRA [
22], paired with the power of models like Vicuna, LLaMA-1, Galactica, Alpaca, LlaMA-2, Mistral, or Zephyr-7b [
35,
36,
40,
41,
42], herald a new vision for research methodologies in fields like APXPS. Instead of relying on proprietary solutions like OpenAI, adopting open-source LLMs can empower research institutions to build bespoke, self-contained analytical systems tailored to their unique needs. This not only assures more control over the model’s parameters and its updating mechanisms but also facilitates the seamless integration of specialized datasets and domain-specific knowledge. Furthermore, by severing the process from proprietary frameworks, researchers can ensure greater transparency, allowing for more reproducible results and encouraging collaborative improvements to the system. Yet, as with all technological shifts, transitioning to an open-source LLM ecosystem requires an initial investment in training and understanding these tools. The promise, however, is a system that evolves with the collective intelligence of the global scientific community, ensuring that the insights drawn are both cutting-edge and deeply customized to the field’s ever-evolving nuances.
In exploring strategies to complement and augment the capabilities of the actual system implementation at the CELLS ALBA Synchrotron beamline and other synchrotron radiation facilities, we propose the introduction of a dedicated GPT agent for each experimental section, leveraging the new OpenAI API. These agents can be distinctively curated with the latest research papers, user manuals, and specifications derived from an extensive repository of previous experiments. The intention behind this initiative is to create up-to-date, intelligent assistants that provide on-demand, contextually relevant information and guidance to beamline users. Such a tool can not only streamline the research process by offering instant access to a wealth of knowledge but can also facilitate a more interactive and intuitive user experience that complements the techniques presented in the article. Unlike the programmatic API, this approach caters to the diverse expertise levels of the scientific users, potentially lowering the barrier to entry for those less familiar with computational tools, as it can be used through the web interface, and also the system can be updated in such a way. By ensuring that the GPT agent remains current with the latest scientific literature and experimental insights, we anticipate a significant enhancement in the efficiency and quality of experimental design and data interpretation at the beamline. This marks a paradigm shift in how scientists engage with XPS data, transitioning from a purely data-driven to a more knowledge-integrated research process.
In conclusion, the integration of LLM into XPS data analysis as demonstrated in this study holds promising potential. It showcases an innovative approach to incorporate AI into materials science, which could potentially be extended to a wider range of applications in the future.
9. Conclusions and Further Work
This study presents a novel methodology that combines traditional curve-fitting techniques with the advanced natural language processing capabilities of a large language model (LLM) to analyze X-ray photoelectron spectroscopy (XPS) data. By utilizing synthetic data simulating complex XPS spectra, we successfully demonstrated that this hybrid approach could extract meaningful features from the data and provide expert-like interpretation to facilitate understanding for a broad range of users.
The integration of an LLM into the data interpretation process significantly simplifies the complex task of understanding XPS data. By translating raw data features into human-understandable insights, the LLM acts as a bridge between quantitative data and qualitative understanding. It democratises the process, allowing non-experts to benefit from the insights typically reserved for domain specialists.
However, as with any model-based system, the quality of the outputs is contingent upon the quality of the inputs. Thus, careful consideration and cross-validation with domain experts should always accompany LLM interpretation. This is especially true as we are dealing with synthetic data in this study and a particular use-case, and the translation to a broad range of real-world XPS data may reveal additional complexities.
In terms of further work, refining this approach with more use cases derived from XPS beamline experiments stands as a natural progression. Given the complexity of real XPS data, the curve-fitting procedure may benefit from more sophisticated models capable of handling intricate overlaps, broader peaks, and high levels of noise. Additionally, the performance of the LLM could potentially be enhanced by fine-tuning it with a more specific dataset focused on XPS data interpretation. Also, the use of these techniques could find broader applicability in other similar domains; for instance, these approaches could be adapted for use in X-ray absorption spectroscopy (XAS) and X-ray magnetic circular dichroism (XMCD) studies.
This study opens up new avenues in the field of materials science data analysis. Looking forward, we anticipate that this methodology could be adapted for other types of spectroscopy or even extended to various data interpretation tasks beyond the field of materials science. As LLMs continue to evolve, the opportunities for integrating AI-driven interpretations into data analysis processes will only expand, providing exciting prospects for the future.


