
ApeTI: A Thermal Image Dataset for Face and Nose Segmentation with Apes

Comparative Cultural Psychology Department, Max Planck Institute for Evolutionary Anthropology, D-04103 Leipzig, Germany
Signals 2024, 5(1), 147-164; https://doi.org/10.3390/signals5010008
Submission received: 31 January 2024
/
Revised: 16 February 2024
/
Accepted: 12 March 2024
/
Published: 15 March 2024
Abstract
:The ApeTI dataset was built with the aim of retrieving physiological signals such as heart rate, breath rate, and cognitive load from thermal images of great apes. We want to develop computer vision tools that psychologists and animal behavior researchers can use to retrieve physiological signals noninvasively. Our goal is to increase the use of a thermal imaging modality in the community and avoid using more invasive recording methods to answer research questions. The first step to retrieving physiological signals from thermal imaging is their spatial segmentation to then analyze the time series of the regions of interest. For this purpose, we present a thermal imaging dataset based on recordings of chimpanzees with their face and nose annotated using a bounding box and nine landmarks. The face and landmarks’ locations can then be used to extract physiological signals. The dataset was acquired using a thermal camera at the Leipzig Zoo. Juice was provided in the vicinity of the camera to encourage the chimpanzee to approach and have a good view of the face. Several computer vision methods are presented and evaluated on this dataset. We reach mAPs of 0.74 for face detection and 0.98 for landmark estimation using our proposed combination of the Tifa and Tina models inspired by the HRNet models. A proof of concept of the model is presented for physiological signal retrieval but requires further investigation to be evaluated. The dataset and the implementation of the Tina and Tifa models are available to the scientific community for performance comparison or further applications.
1. Introduction
Infrared thermography is a technique to measure heat radiation and, thus, the surface temperature of objects and living beings. In psychological research, thermal imaging is a valuable tool to measure skin temperature variation related to automatic nervous system activity changes [1,2,3]. Previous comparative psychological research used thermal imaging to study the emotional states of various animal species [2,4,5]. Thermal imaging also finds its application in the human health sector [6,7,8] as in the industry [9]. Professor Palvadis and his team have conducted a series of studies on the retrieval of physiological signals, such as heart rate [10], breath rate [11], and stress detection [12], by utilizing temperature information from the perinasal area of humans. These studies also involve time series analysis using fast Fourier transformations. These studies have applications, among others, in detecting driving distractions [13]. Similarly, in [14], the temperature of the nose tip and forehead is observed to assess cognitive workload while driving. In nonhuman animals, the nose temperature is also observed for detecting arousal [15], breathing, and vocalization [16]. According to these studies, thermal imaging could provide deeper insights into the behavior and cognitive development of nonhuman animals. However, a limitation of thermal imaging is that it does not work through glass or plexiglass. Thus, studies on nonhuman primates are typically conducted with a mesh separating the participating animal from the thermal camera. This not only led to tremendous amounts of data loss (when the animal moved or when areas of interest were covered by bars) but also restricted how data could be processed and analyzed. The limited visibility made automatized processing impossible and forced researchers to process their data manually, leading to significant time loss and imprecise and noisy data.
To avoid such limitations, we developed a new apparatus involving infrared transmissive material, which allows an unobscured view of the tested individual while maintaining all necessary safety precautions. This unobscured view also enables us to advance automatized processing of thermal data using deep learning tools. We are developing and comparing different methods to extract the temperatures of areas of interest automatically. Using these newly developed methods, we aim to study small temperature changes related to more subtle emotional changes than previously possible, such as temperature changes in the forehead and nose caused by changes in mental effort. Furthermore, from a continuous signal, we also aim to extract the heart rate and the breath rate of the observed individuals. An accurate heart rate obtained from such a noninvasive acquisition method could also give us more information on their stress state [17] and further details on their nervous system activity [18,19]. Breath rate estimation from thermal images already gave satisfactory results on humans [20] and would also allow a better assessment of the emotional and health state of the observed individuals in a noninvasive way.
Due to the rarity of thermal images in image processing, largely attributed to the high cost of recording devices, thermal imaging (TI) is often combined with the RGB modality to enhance resolution [21] or for segmentation and detection purposes [22,23]. However, synchronizing and superimposing the different streams is costly [24] and may not achieve perfect alignment. This often results in trade-offs between the resolution of the modalities, varying acquisition rates, and calibration errors. Bearing these risks in mind, we decided to stick solely to the thermal modality for segmentation and physiological signal extraction to avoid the errors induced by complex cascading processes.
In this paper, we present the acquired Ape Thermal Image dataset (ApeTI) and our methods to detect chimpanzees’ face and nose landmarks from thermal images. The dataset is available online (https://share.eva.mpg.de/index.php/s/MnD33qD9ZxCYdJL (accessed on 11 March 2024)). Different methods are compared and combined on both tasks using the mean average precision (mAP) metrics. Section 2 introduces the ApeTI dataset and the evaluation procedure. We then present the different tested methods and their results, respectively, in Section 3 and Section 4. Subsequently, we outline the project’s scope, demonstrate a proof of concept for physiological signals retrieval, and discuss our future work in Section 5. We finally draw our conclusion in Section 6.
2. ApeTI Dataset
2.1. Acquisition
The thermal images have been recorded at the Wolfgang Köhler Primate Research Center (WKPRC) from the Leipzig Zoo affiliated with the Max Planck Institute for Evolutionary Anthropology (MPI EVA). The images are RGB-encoded using an InfraTec VarioCAM HD camera with a resolution of pixels. The temperature resolution of such a camera can reach up to 0.02 °C and record at 30 frames per second. Six different chimpanzees were filmed alone in a testing room through the mesh across a total of 26 sessions. A juice dispenser was located close to the camera to encourage the chimpanzee to approach in order to acquire a good view of the face and the nose. Fifty frames were manually extracted from each video for annotation. Extremely blurry frames or frames without a chimpanzee in the field of view were discarded.
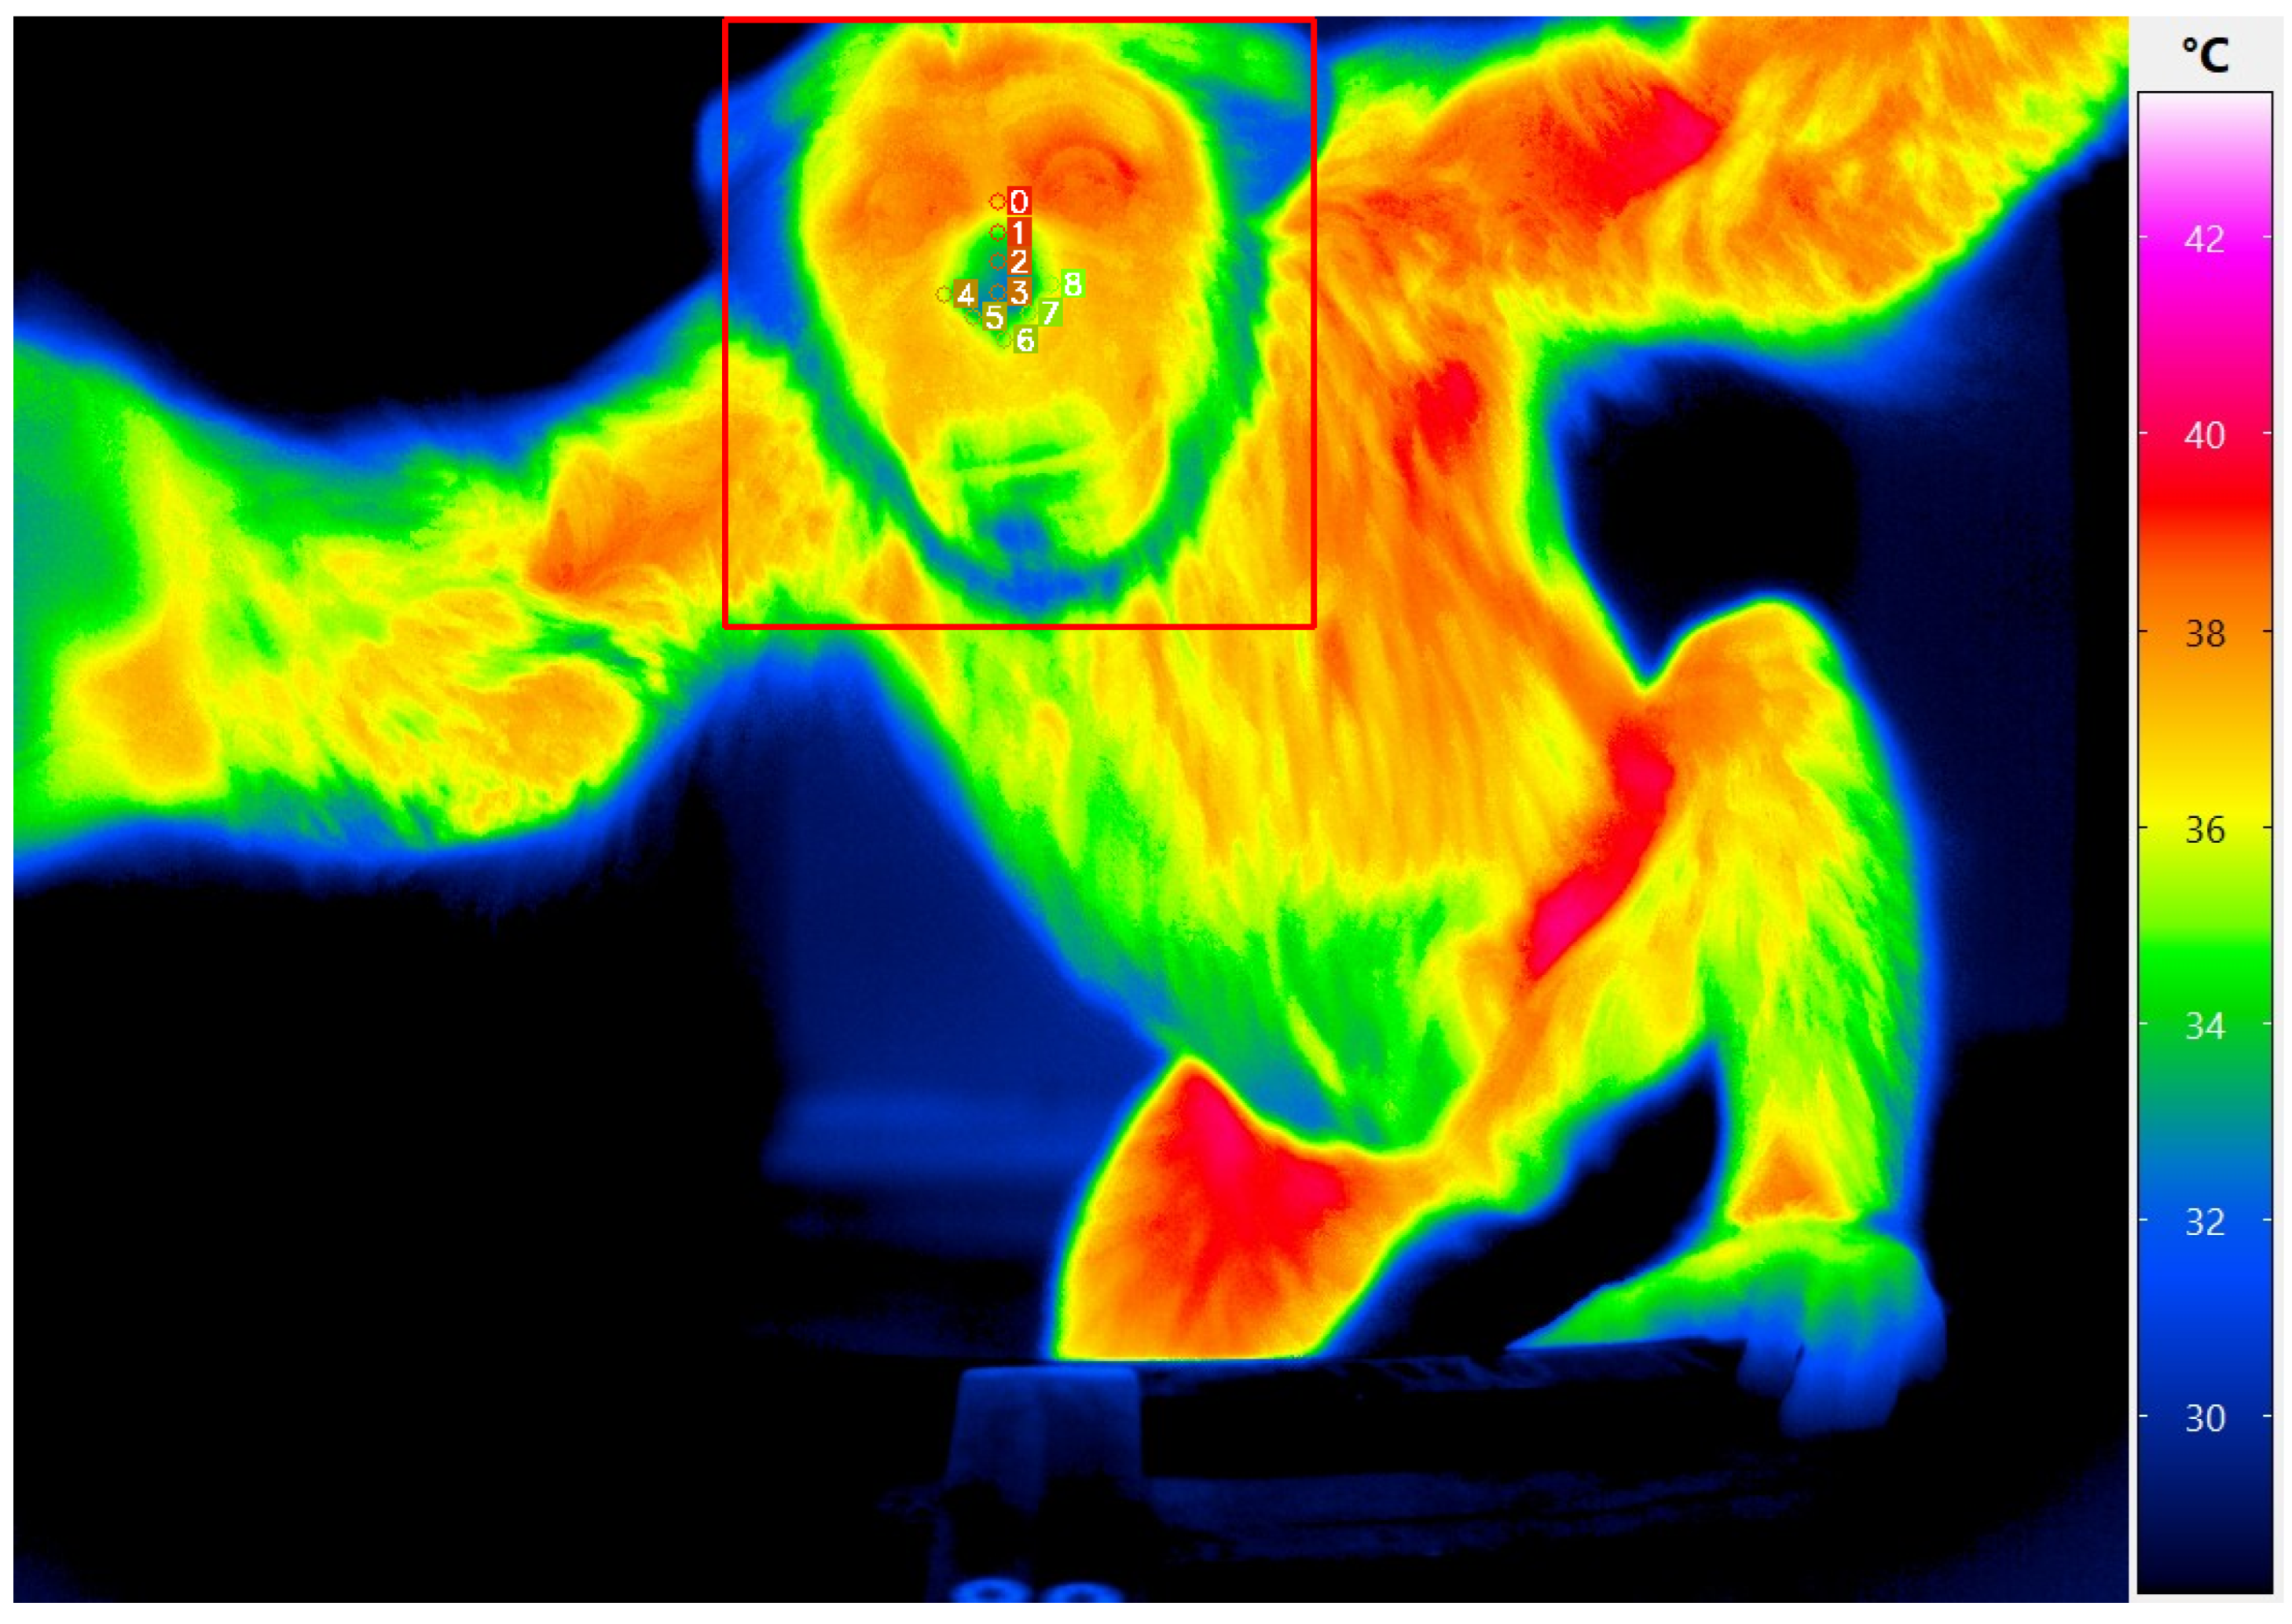
The temperature information was saved using a JPEG extension and a JET colormap. Sadly, the real temperature was lost during these sessions. Nevertheless, using HSV color distance, we mapped the RGB information to temperature using the color bar on the right side of Figure 1. This transformation uses a minimum temperature of 28 °C and a maximum temperature of 43 °C, which leads to a temperature resolution of 0.0625 °C. Even if the calibration changes across frames, using the same color bar allows us to retrieve qualitative temperature information and gradients between the different regions. For this dataset, we consider this approximation acceptable because of the property of CNNs to capture gradients. The original images and transformation details are available upon request.
2.2. Dataset Annotation
The annotations were carried out at the MPI EVA by student assistants and reviewed by a trained graduate student. The annotation project was coordinated by Gregor Kachel and Johanna Eckert, both researchers at the MPI EVA and with experience in primate research.
The chimpanzee’s face and nine nose landmarks were annotated on each frame using a bounding box and points, respectively, as depicted in Figure 1. The nine nose landmarks, indexed from 0 to 8, can also be physiologically named: rhinion, supratip break, supratip lobule, tip, columella left, columella left-center, columella center, columella right-center, and columella right [25]. These were chosen for their particularity of forming an arrow shape on the nose of the chimpanzee, making them easy to annotate. The nose area is also susceptible to changes when the subject is aroused [15] or breathing [16]. We began with these landmarks with the goal of extracting heart rate, breath rate, and arousal from their temperature changes over time.
2.3. Evaluation Strategy
We evaluate the results using the mean average precision metric (mAP) using several intersections over union (IoU) and object keypoint similarity (OKS) thresholds as previously performed in COCO challenges [26]: mAP at IoU = 0.50:0.05:0.95 for face detection and mAP at OKS = 0.50:0.05:0.95 for landmark regression. In addition, we report for both face detection and landmark regression the average precision (AP) values using only IoU and OKS thresholds of 50 and 75, denoted, respectively, as AP50 and AP75. These metrics gauge the precision of a method and are commonly reported in detection and regression challenges as secondary ranking metrics to foster discussion. Since our dataset has the particularity to contain only one individual in each frame, we also report the mIoU and mOKS over the whole test set.
The dataset is split videowise between train, validation, and test sets, meaning frames of the same video can be found only in one of the sets. The ground-truth annotations and the splits of the dataset are shared using the COCO format in our repository. This dataset allows for solving two tasks: chimpanzee face detection and nose landmark regression. We encourage researchers to use this dataset to benchmark their methods. Our model configurations, leaderboard, and guidelines for downloading the data are available on the dedicated GitHub repository (https://github.com/ccp-eva/ApeTI) (accessed on 11 March 2024).
3. Proposed Methods
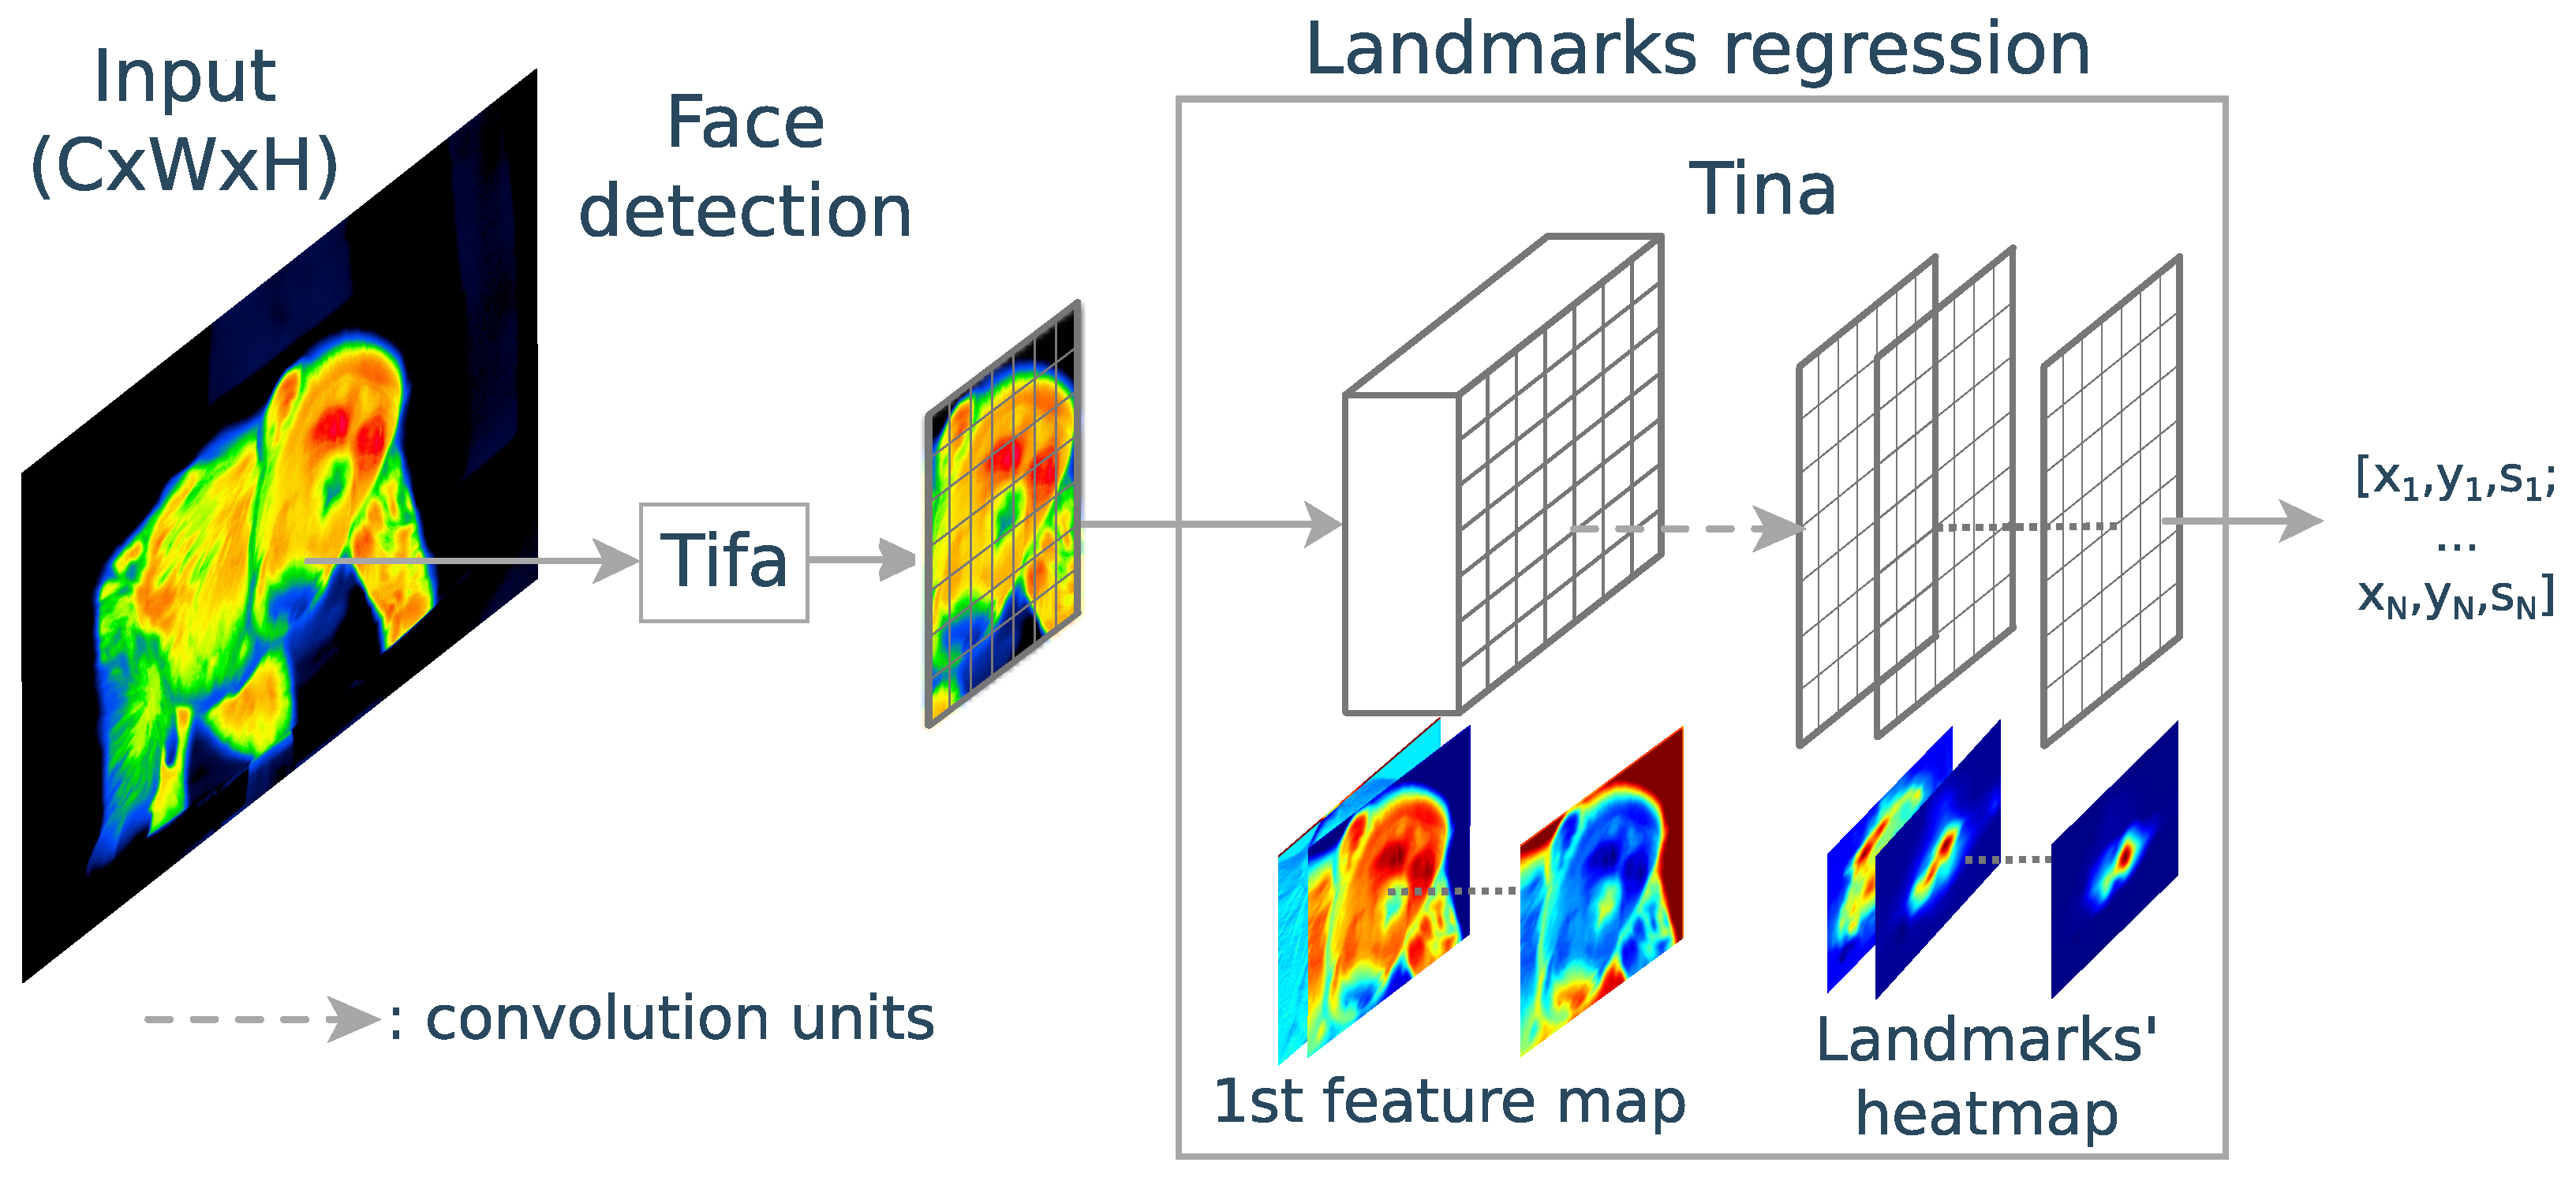
We approach this dataset to solve a cascade problem consisting of face detection, followed by landmark regression on the detected face, as depicted in Figure 2. The deep learning models are implemented in Python 3.7 using PyTorch 1.9 and OpenMMLab libraries [27,28].
3.1. Face Detection
In order to detect the face from the thermal images, we use the cascade HRNet model [29] pretrained on a COCO object detection task and modified to only recognize a chimpanzee’s faces from a one-channel input: the temperature. We use the same training procedure as in [29] except that the input temperature image is not normalized. We use usual random transformations, including rotation (), translation (ratio of 0.1), shear (max degree of 2), scaling (from 0.5 to 1.5), and flip (with probability 0.5) on the fly to augment our data. The model is fine-tuned for 50 epochs using stochastic gradient descent, a learning rate of , a weight decay of , and a momentum of 0.9 with 500 warm-up iterations. We annotate this version of HRNet “Tifa” (Thermal Image Face Ape) model.
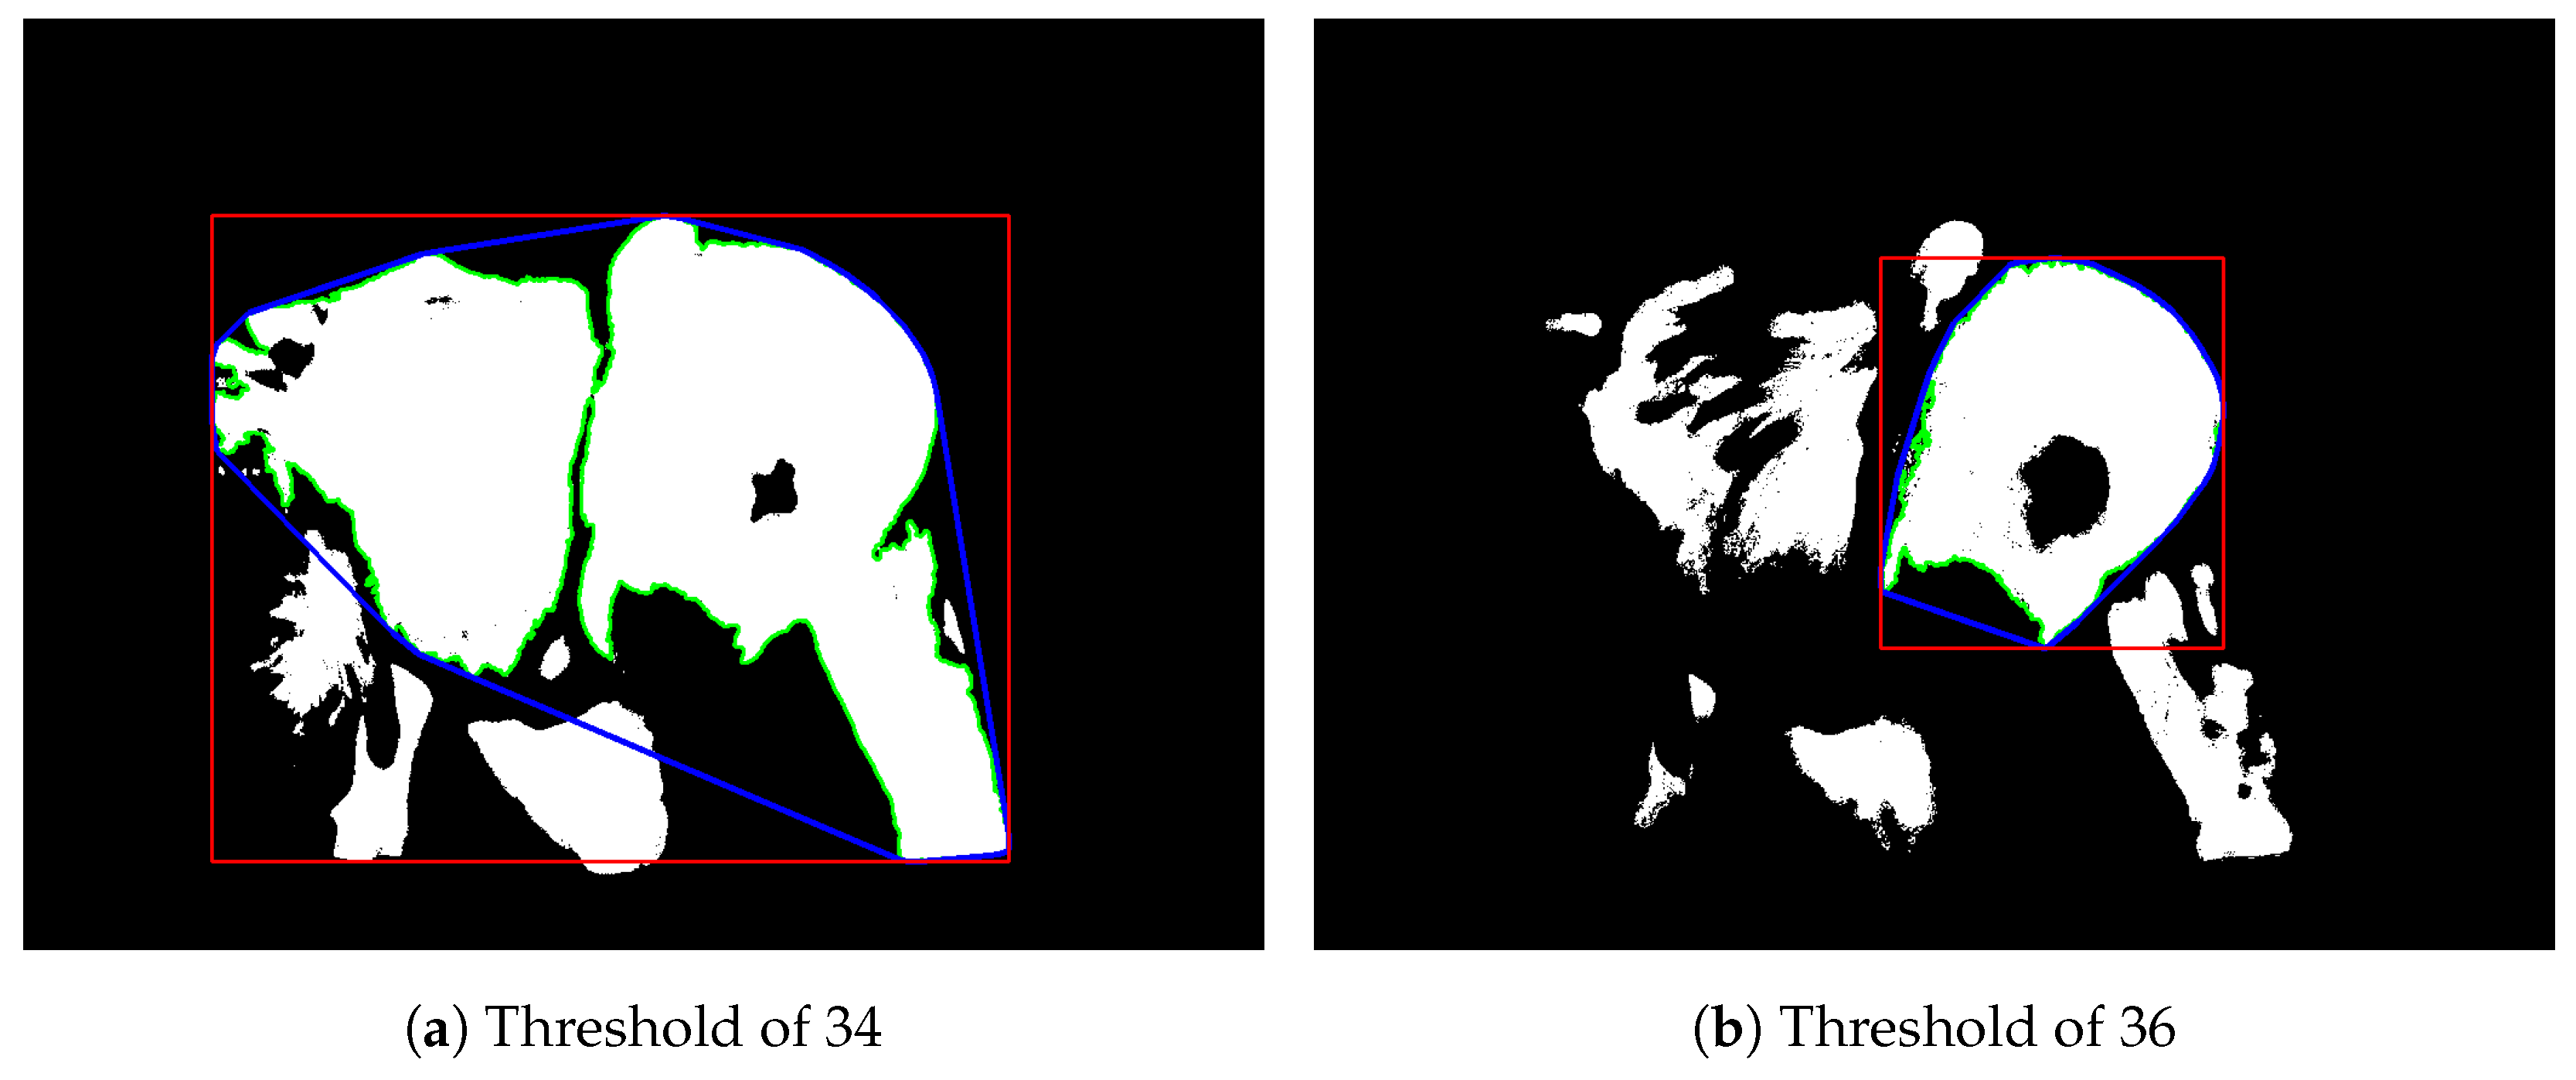
Since the face should be the warmest area in an image, segmentation based on thresholding the thermal region is also an option for face detection. Therefore, we implement a nonsupervised threshold method, annotated “Thresh”, for finding the largest area with a temperature above a certain threshold. As depicted in Figure 3, the method is sensitive to the threshold parameter, and a search for the best parameter is necessary in order to obtain the best segmentation. This method is used as a baseline comparison, but can also be combined with other approaches for improving performance.
3.2. Landmark Regression
In order to perform landmark regression, we use the HRNet V2 model [30] pretrained on the Annotated Facial Landmarks in the Wild (AFLW) dataset [31]. As previously mentioned, the model is modified to detect only nine landmarks and take a one-channel image as input: the temperature. We use the same training procedure as in [30]. The loss function is the mean square error between the computed and ground-truth landmarks heatmap. The ground-truth heatmap is generated by applying a 2D Gaussian filter with a standard deviation of two pixels centered on the ground-truth location of the landmark. We use the same data augmentation procedure as stated before. The model is fine-tuned for 60 epochs using an Adam optimizer, a learning rate of , a weight decay of , and a momentum of with 500 warm-up iterations. We annotate this version of HRNet “Tina” (Thermal Image Nose Ape).
Finally, we also use the state-of-the-art model BlazeFace [32] coupled with MeshFace [33] for comparison. These models, even if they were trained using an RGB modality and human faces, were the only ones working off the shelf with thermal images and chimpanzee faces. MeshFace provides a rich mesh of the human face. We retrieve the same landmarks as in our annotation procedure for evaluation. As BlazeFace usually takes only RGB images, we normalize our temperature between 0 and 255 and use this information in the three channels. The way these models have been shared by MediaPipe does not allow us to perform further modifications as we did with HRNet. Other state-of-the-art pretrained models were not robust enough to our type of data to be considered for comparison.
We run a full search of the best parameters to solve both tasks. The involved parameters are the threshold for the “Thresh” method and the min and max normalization values of the TI for BlazeFace and MeshFace. The min and max normalization values define the encoded range of temperature (Equation (1)) and the temperature resolution (Equation (2)) of the new grayscale image.
4. Results
The HRNet models Tifa and Tina were trained on the train set and evaluated at each epoch on the validation set. The model performing best on the validation set is saved and tested on the test sets. For the nonsupervised method Thresh, BlazeFace, and MeshFace and their combination with HRNet, we perform a full search for the best parameters to find the best combination on the joint train and validation sets, as depicted in Figure 4 and Figure 5. Further results are reported in Appendix A.
For clarity, we report in the following subsections only results across the different sets with regard to the mAP and a more detailed performance analysis on the test sets alone.
4.1. Face Detection
During our analysis, we notice that the performance for face detection could be improved to the detriment of the landmark regression performance. For greater clarity, we report in this section only results maximizing the landmark regression performance. In order to better appreciate the performance of the tested models, we incorporate the metrics using the ground-truth (GT) annotations with a size modified by (face still centered in the detected region)—annotated and . We also include results without taking into account a region of interest (ROI). In these cases, denoted as “no ROI”, the entire thermal image is considered. The models performing best with regard to the mAP on the whole dataset (Table 1) or the test set only (Table 2) are highlighted in bold.
The low performance on the train set in Table 1 with the fine-tuned model Tifa can be explained by the greater variety of samples in this set compared with the validation and test sets. Better performances were obtained at a later epoch, but would deteriorate the performance on the validation set.
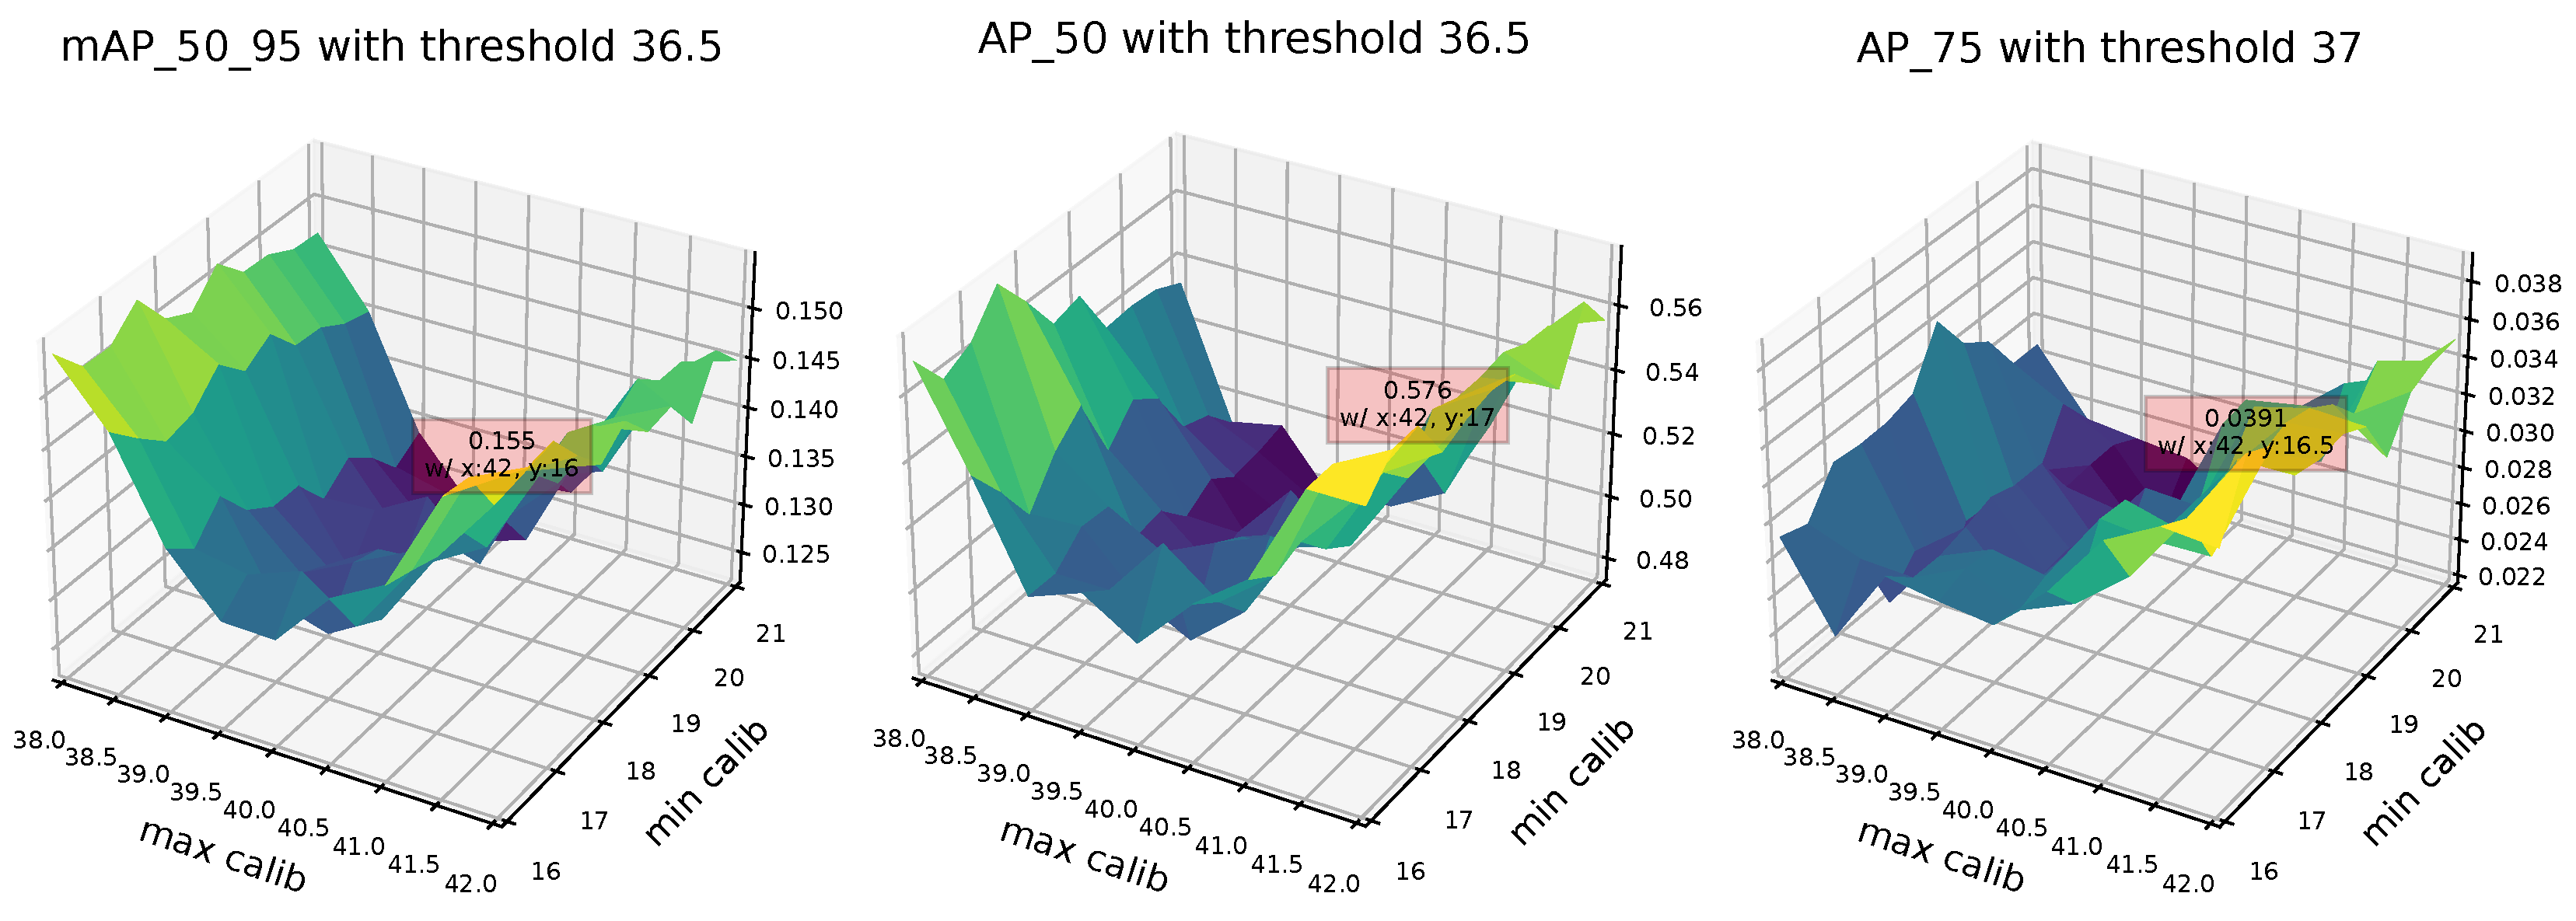
As depicted in Figure 4, the search for the best parameters for the combination of the BlazeFace and Threshold methods on the joint train and validation sets allows us to choose the right parameters to evaluate the model on the test set. The best performance achieved by these combined models, as measured by the mAP with IoU for face detection, is obtained using a threshold of 36.5 °C and minimum and maximum calibration values of 16 °C and 42 °C, respectively. Figure A1 and Figure A2 provide more metrics during the full search process.
As we can see in Table 2, the fine-tuned model Tifa performs best by a large margin. This is easily explicable since the type of information provided to the pretrained models differs from what they are used to processing. The Thresh method remains helpful to refine the ROI one model can process: it improves BlazeFace performance by a few points on all the sets.
4.2. Landmark Regression
As in the previous subsection, we incorporate results using the ground truth: GT, , and as inputs for the different models. Table 3 and Table 4 report the results for landmark regression. The first part of the tables is dedicated to the Tifa model’s result on the ground-truth face location. The landmark models are coupled with one or several face detection methods to analyze the face detection effect on landmark regression performance. The models performing best with regard to the mAP on the whole dataset (Table 3) or the test set only (Table 4) are highlighted in bold. FaceMesh, being entirely incorporated with BlazeFace, could not be tested on the ground-truth region of interest.
As Table 3 shows and similar to face detection, the results on the validation and the test sets are better than in the train set. The variety of samples in the train set is higher than in the others, which encourages us to increase the size of our dataset. Surprisingly, the combination leading to the best performance is obtained with the Thresh29.8 method and the Tina model. This can be explained by the few instances where the Tifa model fails to detect the face, as reported in Figure 6. In contrast, the Thresh method, with a low threshold value, inputs a larger ROI that includes the face, and the Tina model is robust enough to segment the nose landmarks from this larger input.
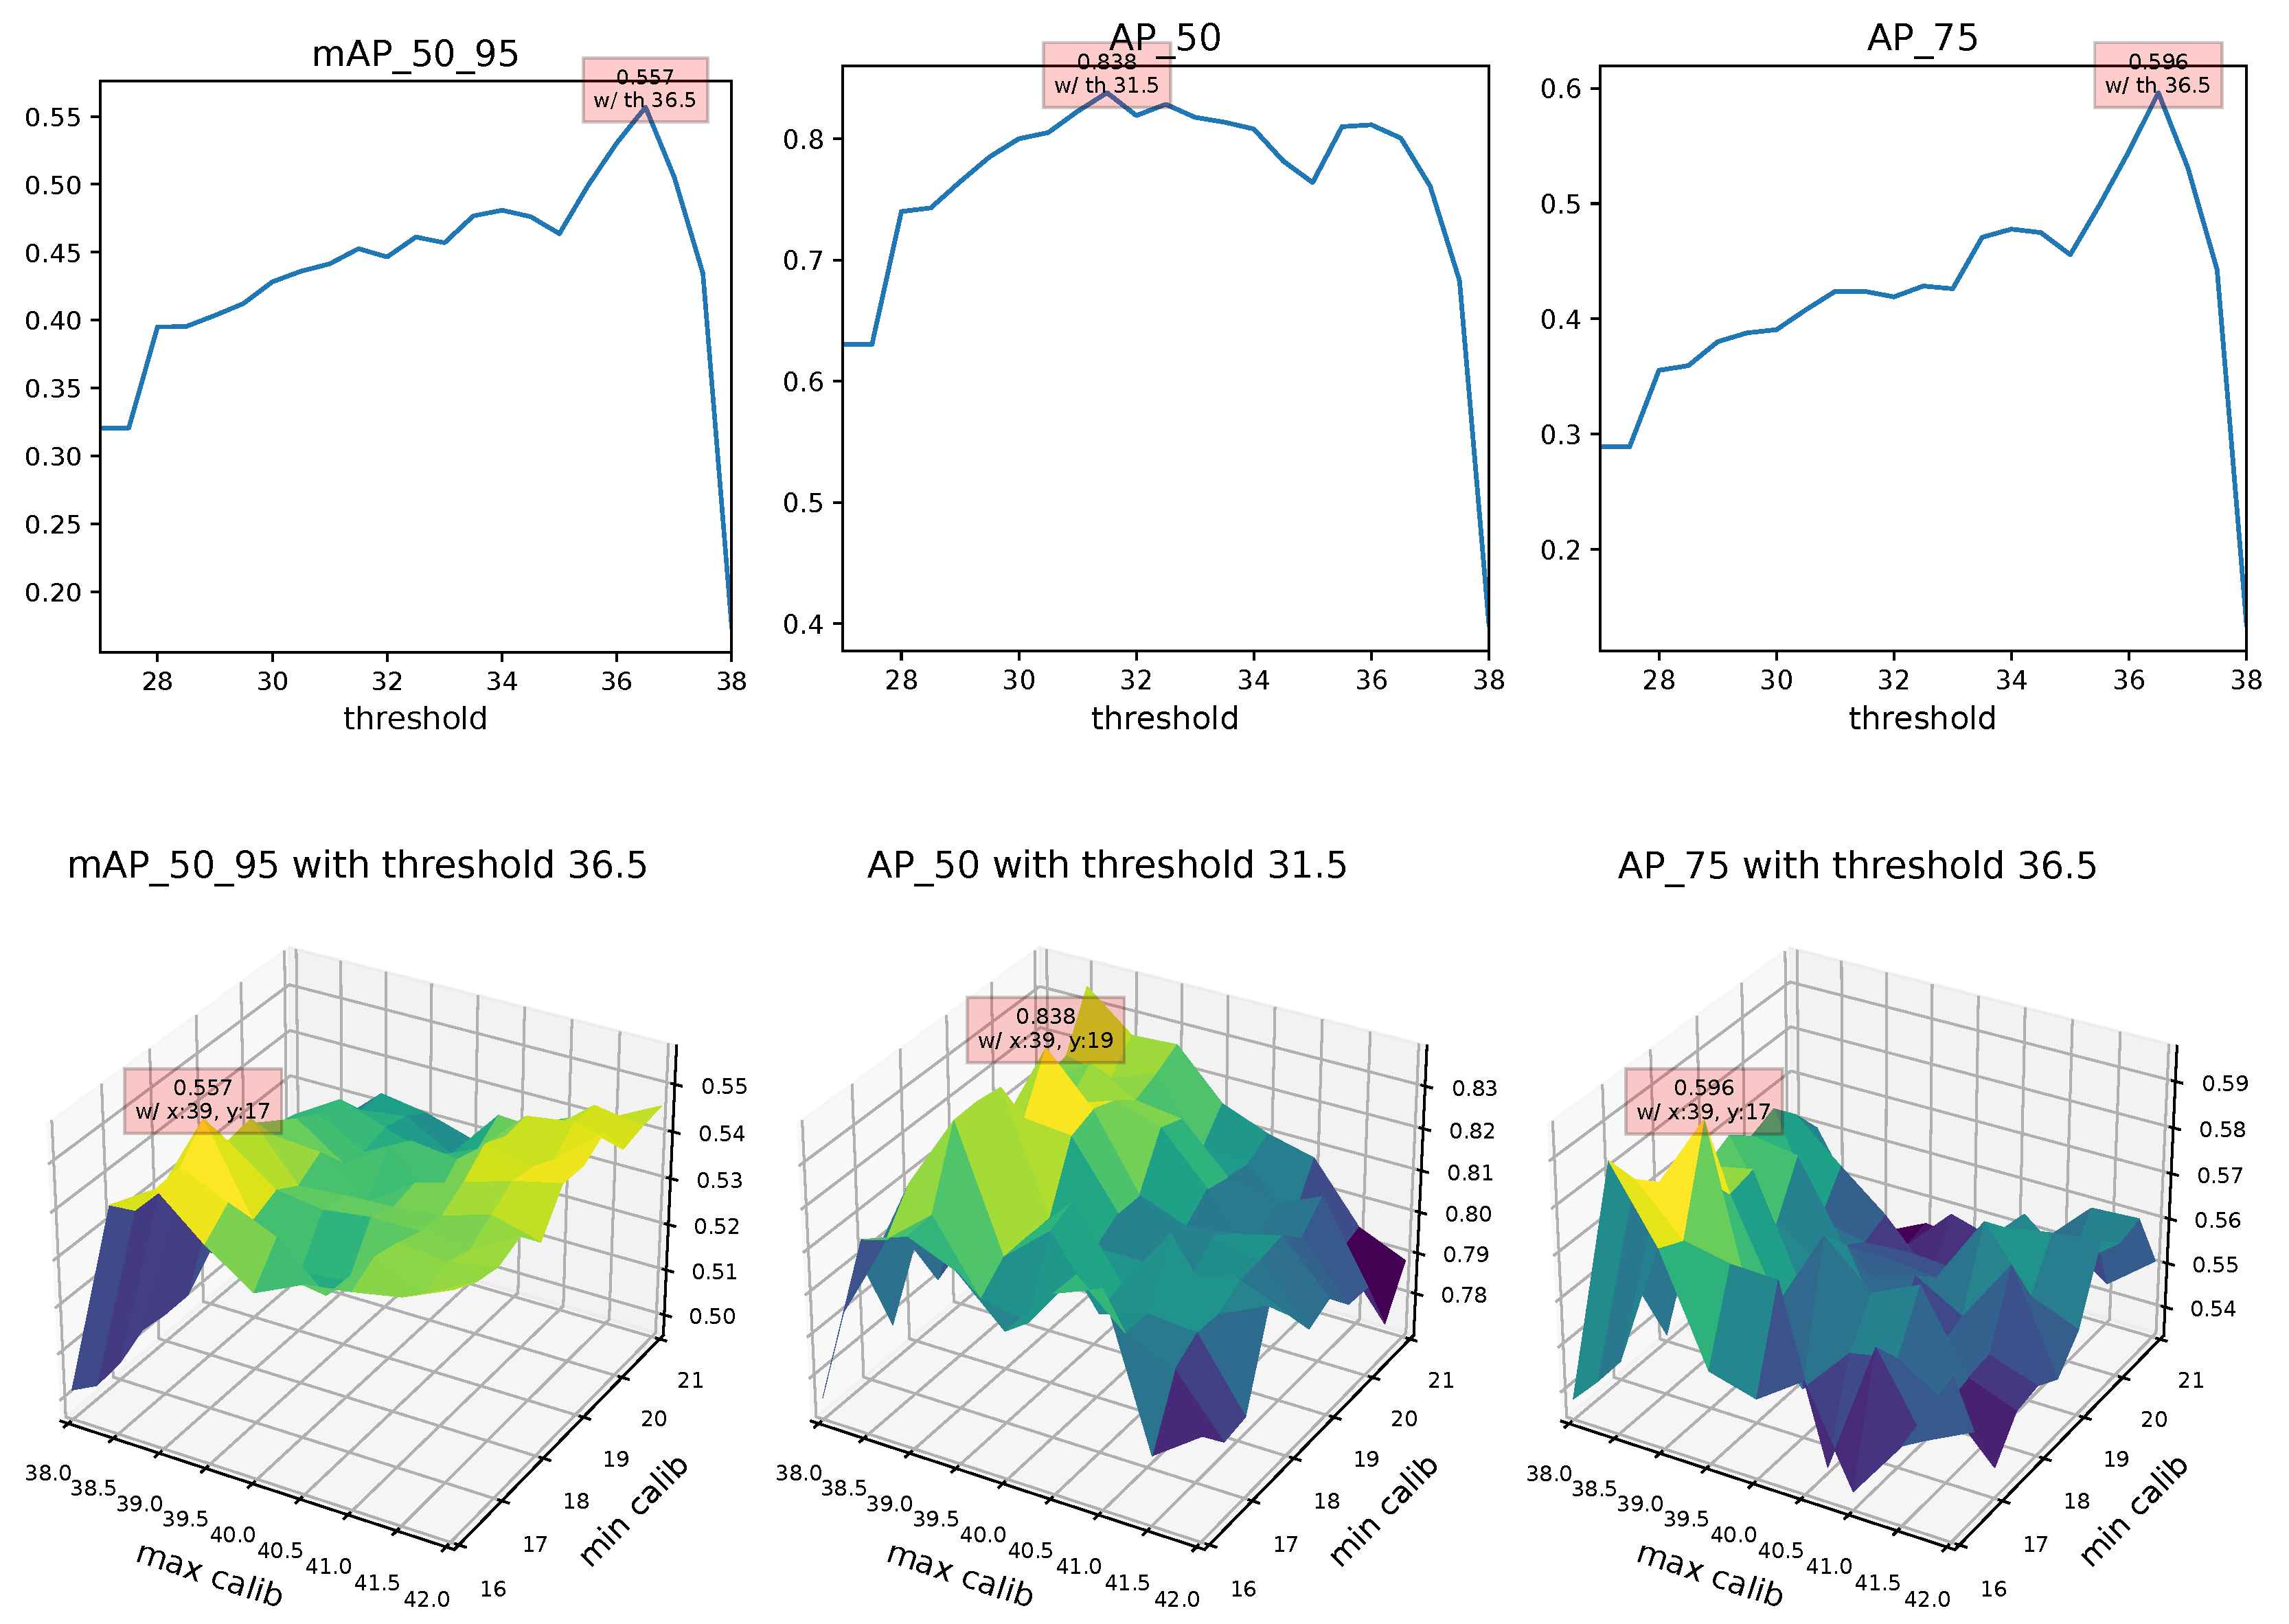
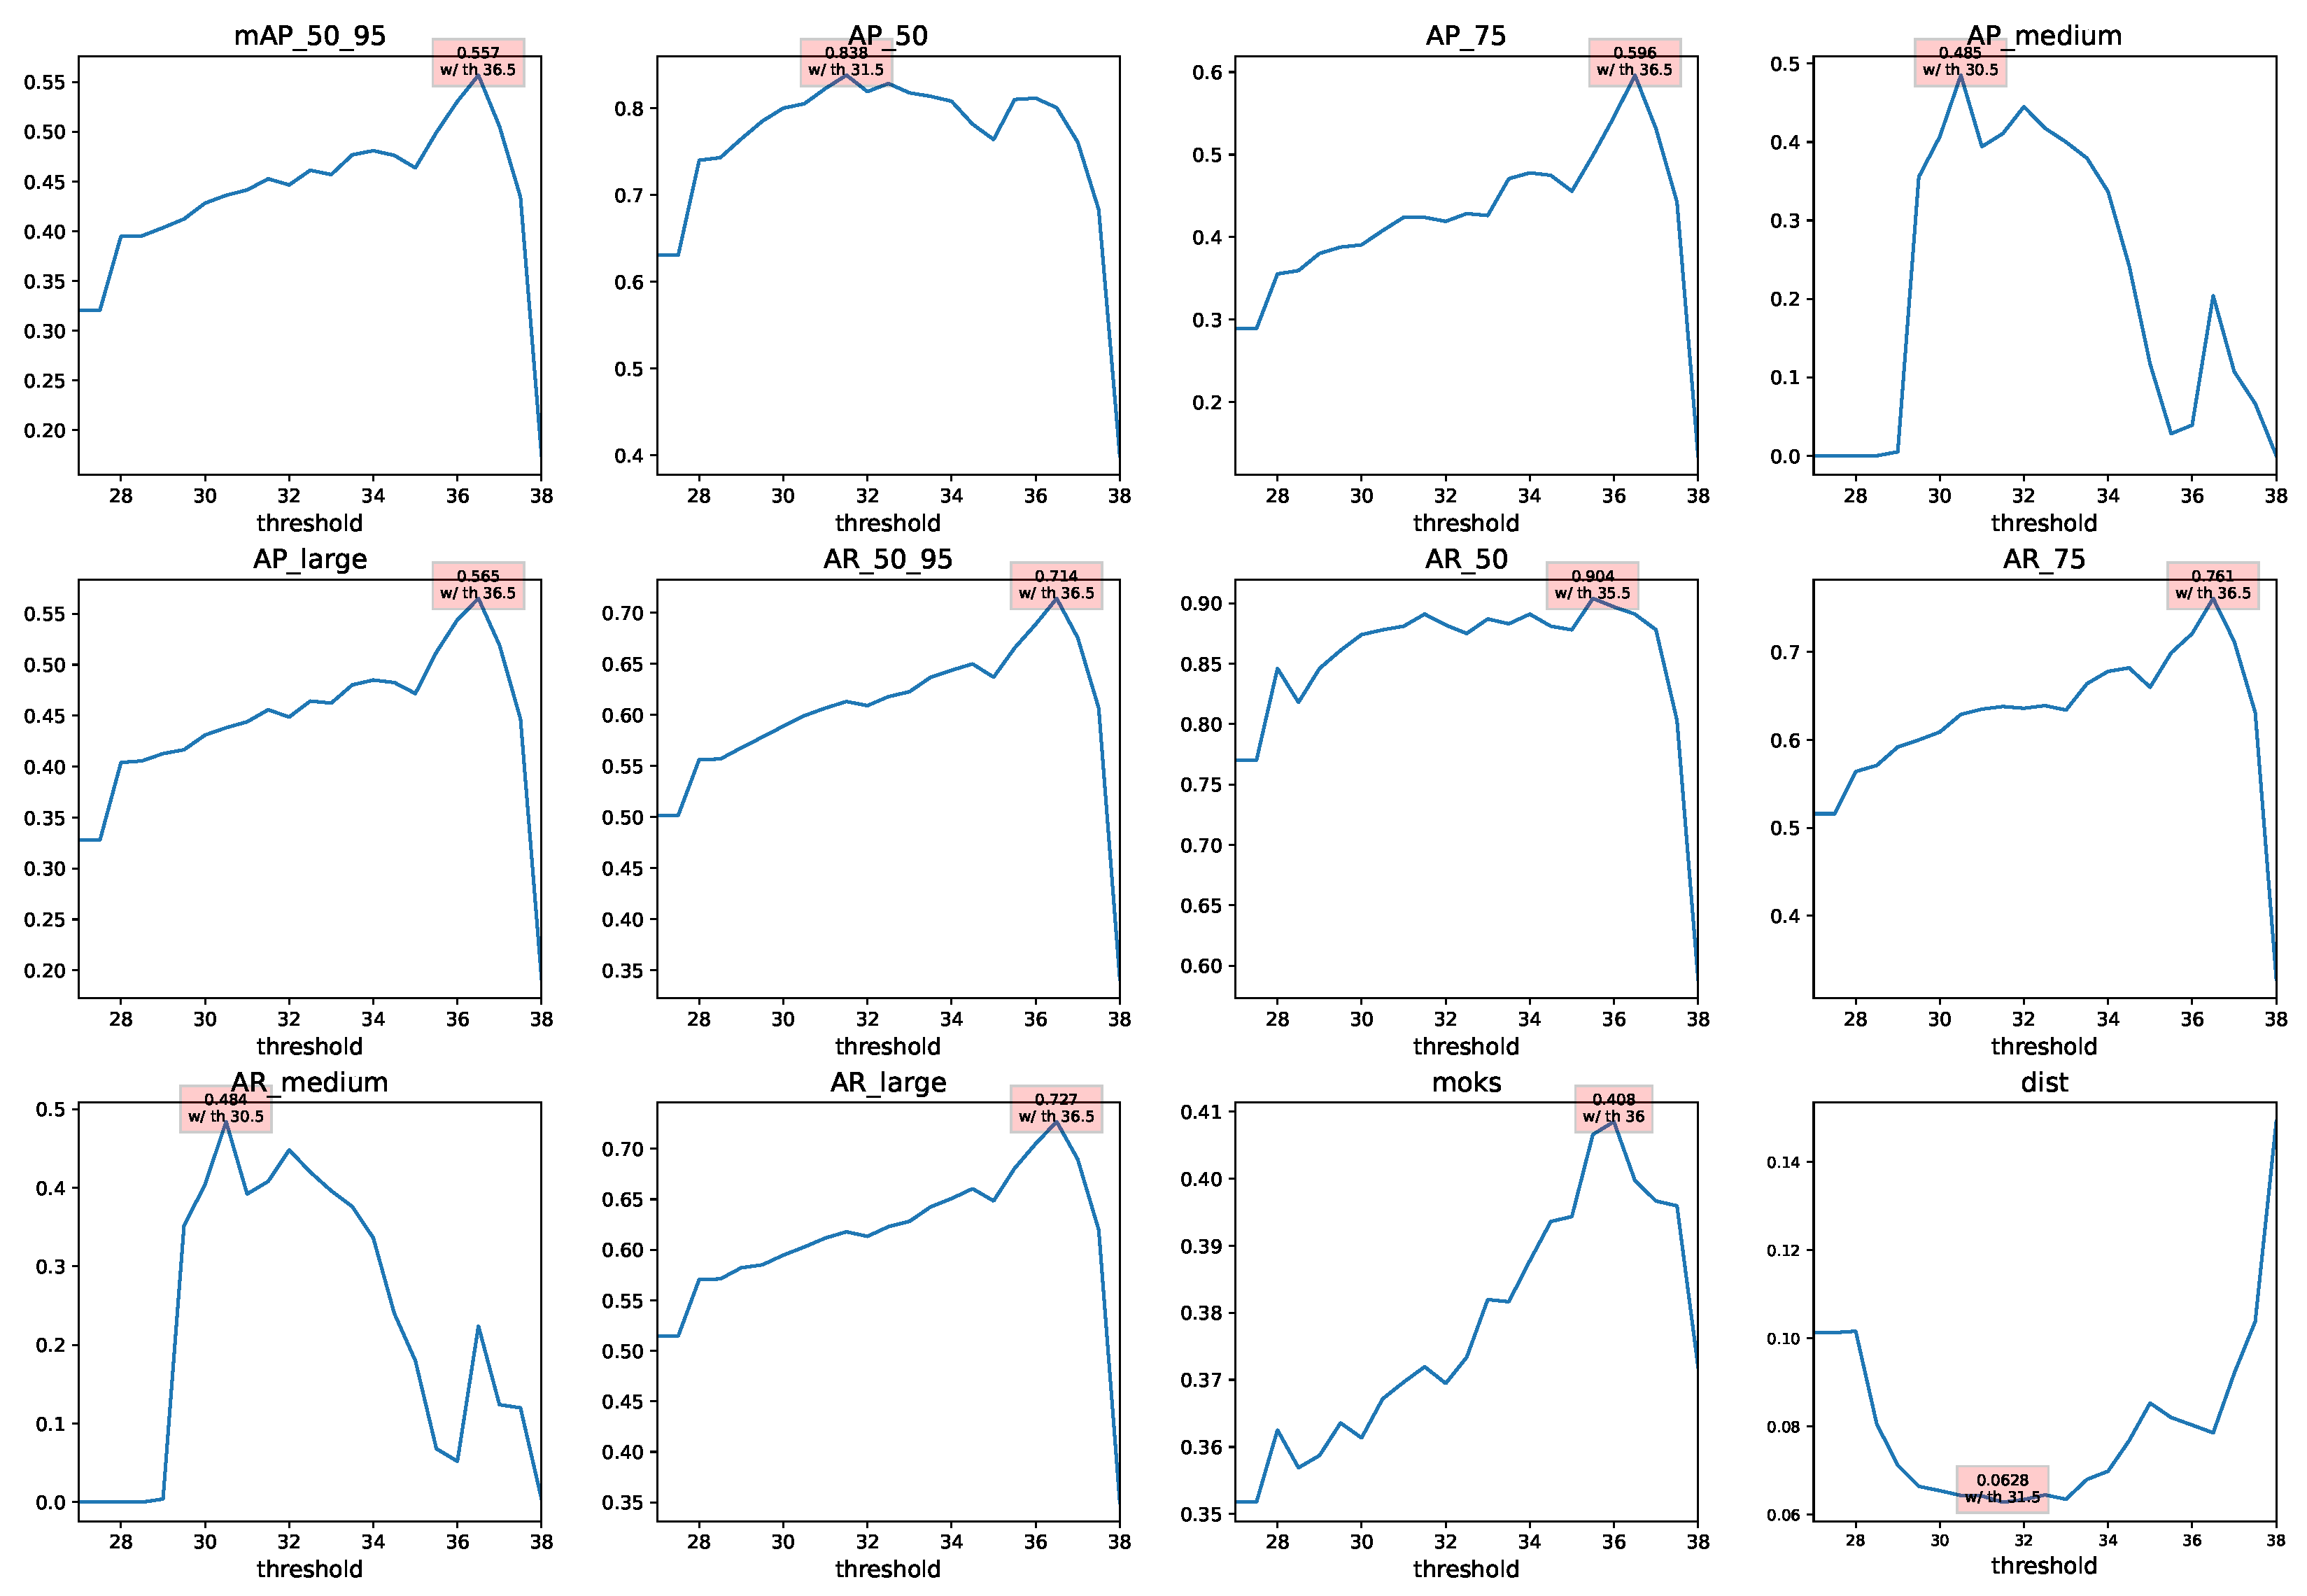
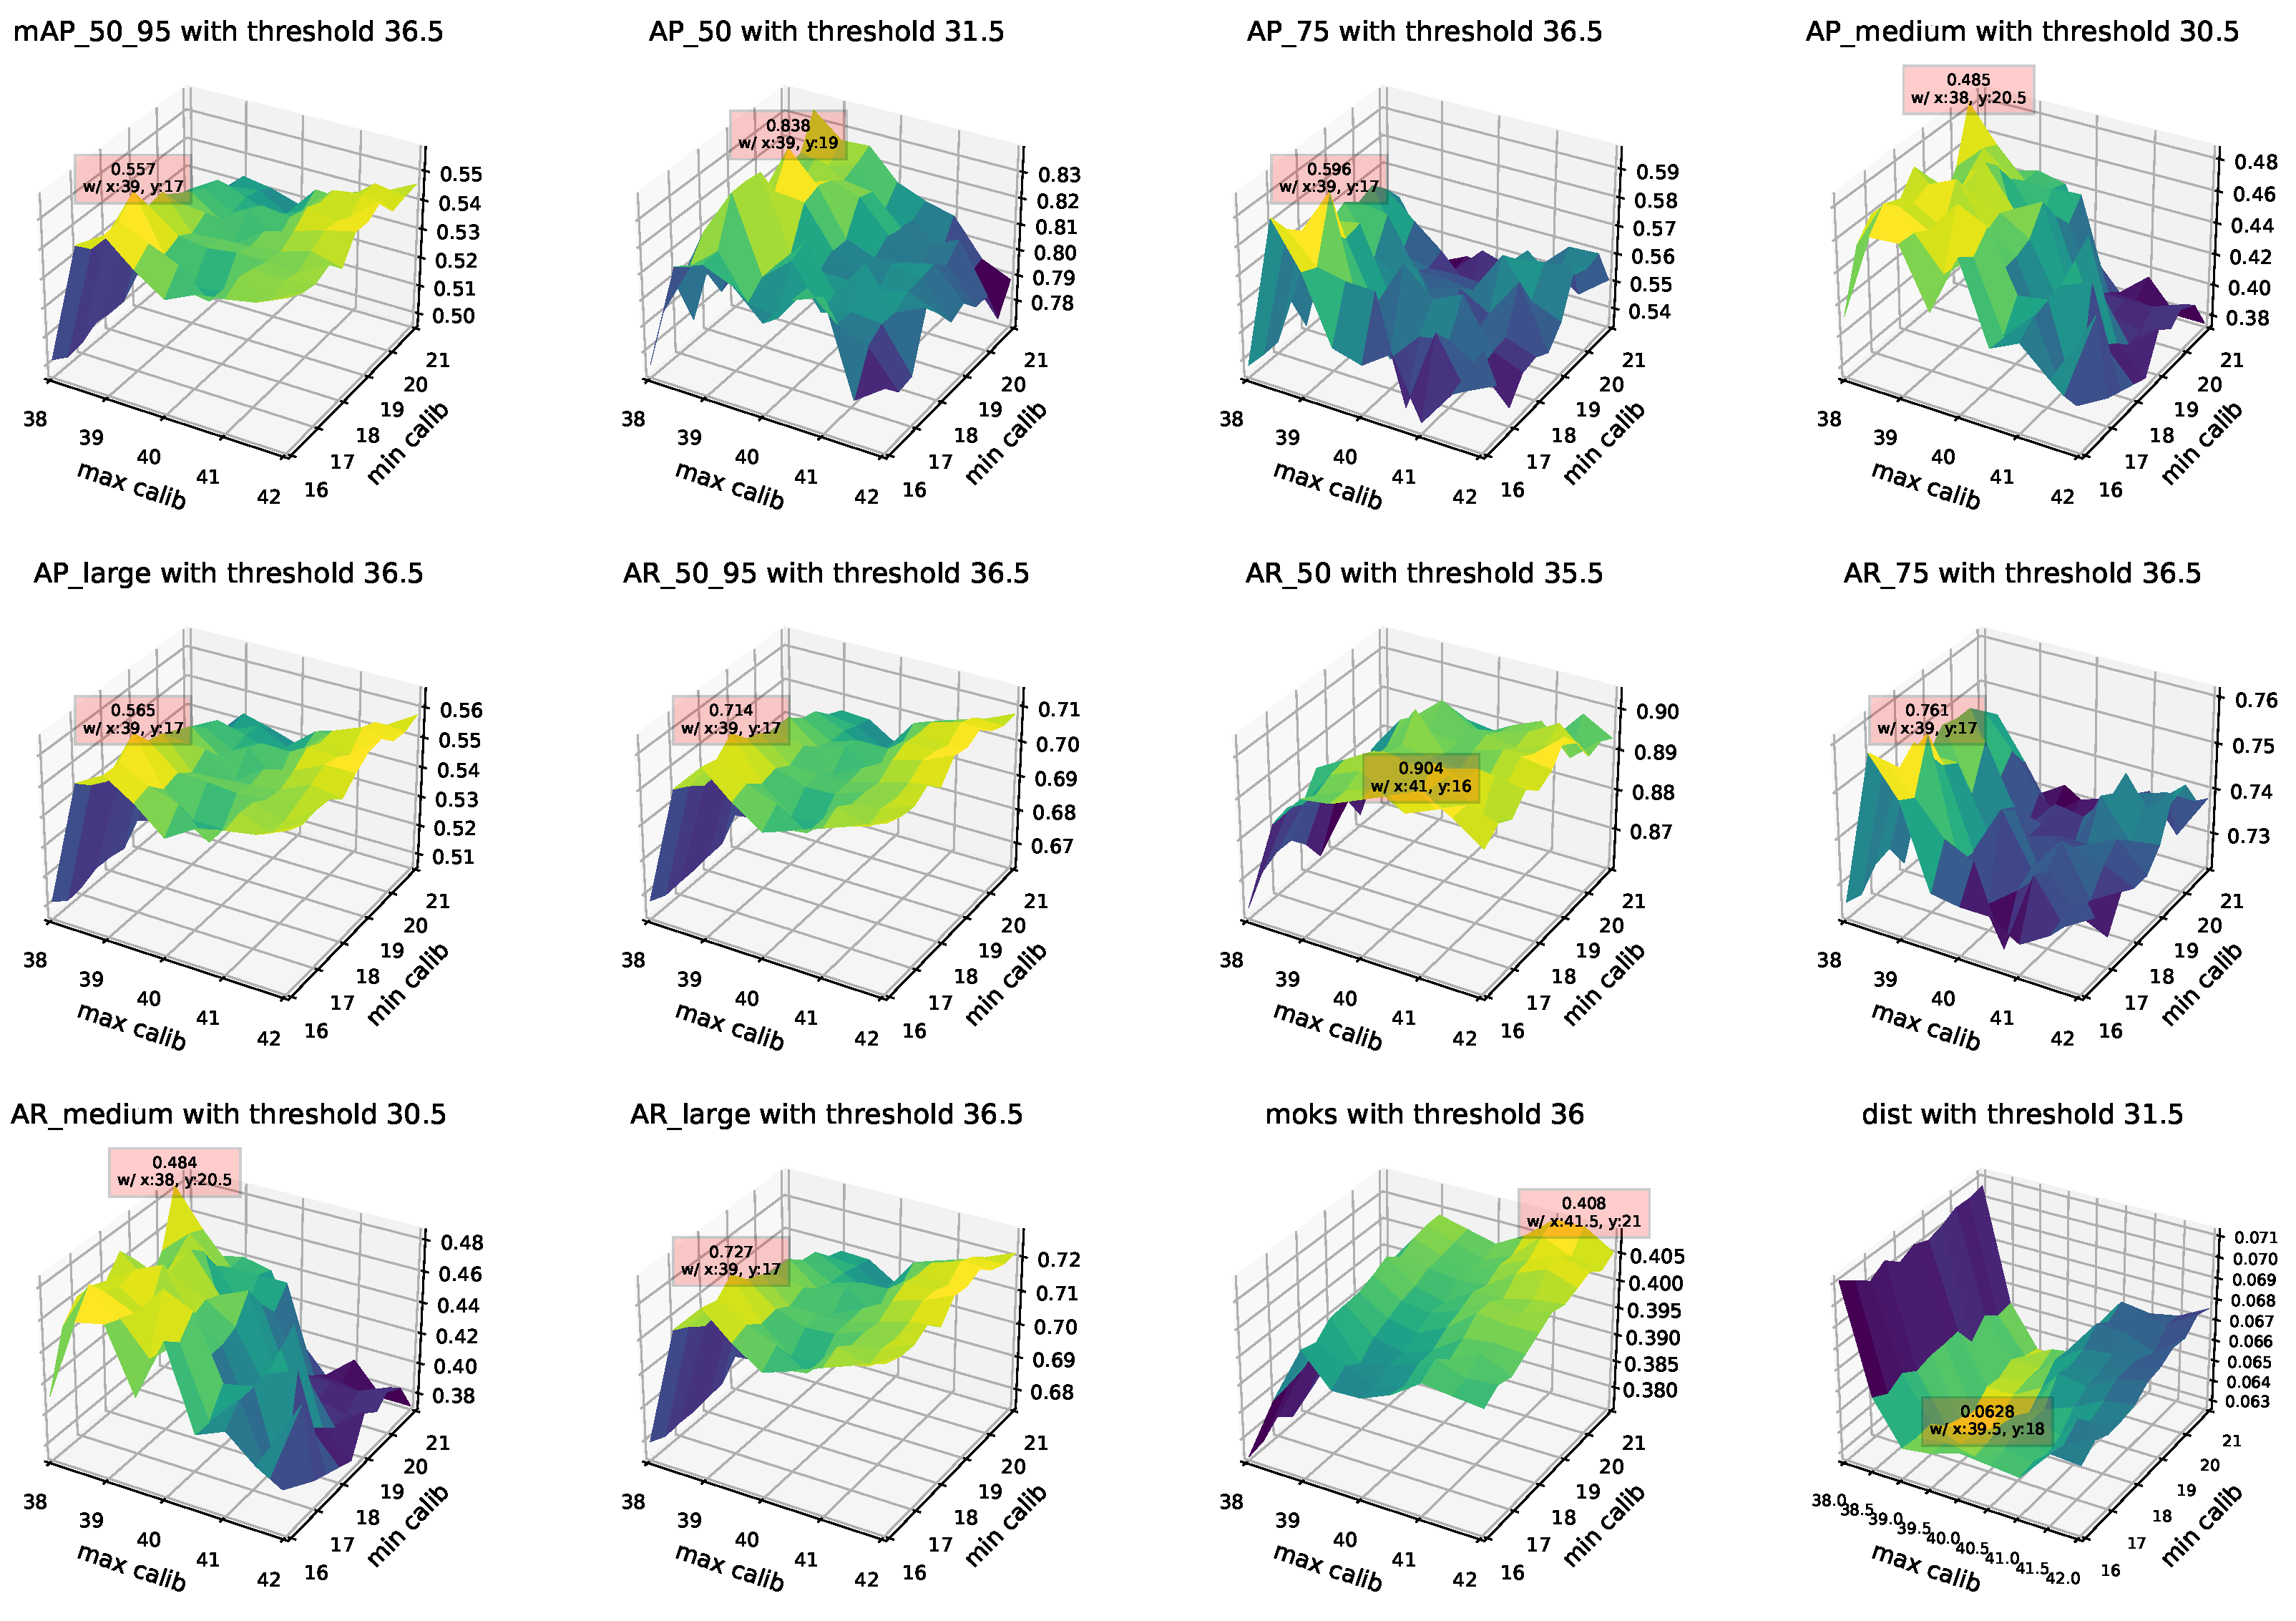
As depicted in Figure 5, the search for the best parameters of the combination of the BlazeFace, Threshold, and FaceMesh methods on the joint train and validation sets allows us to pick our parameters to evaluate the model on the test set. However, as also depicted in Figure A3 and Figure A4, the observed metrics do not always agree, nor are they stable. This behavior may be attributed to the sparsity of our dataset and the temperature differences across individual recording sessions. The range of temperatures may vary, and a slight change in parameters can suddenly affect a portion of the dataset. Nevertheless, the best performance achieved by these combined models, as measured by the mAP with OKS, is obtained using a threshold of 36.5 °C and minimum and maximum calibration values of 17 °C and 39 °C, respectively. Such a threshold may not guarantee that the entire face, which typically has a temperature between 30 °C and 38 °C, is included in the ROI inputted to BlazeFace. Moreover, these normalization parameters encode the face temperature using a range of 23 °C, leading to a temperature resolution r of approximately 0.09 °C, which is less precise than our initial resolution. Furthermore, neither BlazeFace nor FaceMesh has been trained on thermal data, which explains their lower performance compared with other methods.
As we can notice on the first part of Table 4, dedicated to the use of the ground-truth location of the face, the best results are obtained using . Indeed, the nose being localized in the center of the face, having a tinier ROI still centered on the face, will leave less room for error. When provided with the GT face location, the Tina model’s performance is especially high for a landmark model.
Furthermore, we can notice how the combination of the Tifa and Tina models fails against the Thresh method or even a full image provided to the model (no ROI). However, this is proper to the specificity of our dataset, which contains at least and only one face per image. The same metrics would drop if several or no faces were in the image. Nevertheless, the performance of the combination of the Tifa and Tina models remains respectable in the context of landmark regression with such a tiny dataset. Inference examples are depicted in Figure 6 for better appreciation.
Additionally, considering of the face area initially detected by the Tifa model did not significantly impact the landmark regression results. Surprisingly, BlazeFace and FaceMesh, coupled with the Thresh method, perform correctly despite being trained on RGB images and human faces. The mesh density used for inference certainly helps in this regard, and will more likely locate the nose in the middle of the segmented area. Thus, features of the face, such as the eyebrows and hair gradients, are maintained in the thermal information and may help align the human mesh with the chimpanzee’s face.
5. Application in Studies
To summarize, our project focuses on retrieving physiological signals such as heart rate, breath rate, and cognitive load from the thermal imaging of both human and nonhuman animals. We aim to provide a noninvasive method for psychologists and animal behavior researchers to gather signals to reveal cognitive load and emotional state. Computer vision models are exploited in order to automatically segment and track ROIs. The evolution of the temperature of the ROIs is then analyzed to extract physiological signals. In this paper, we focus on applications with the great apes of the WKPRC of the Leipzig Zoo. In this section, we present the next steps for this project.
5.1. The Apparatus
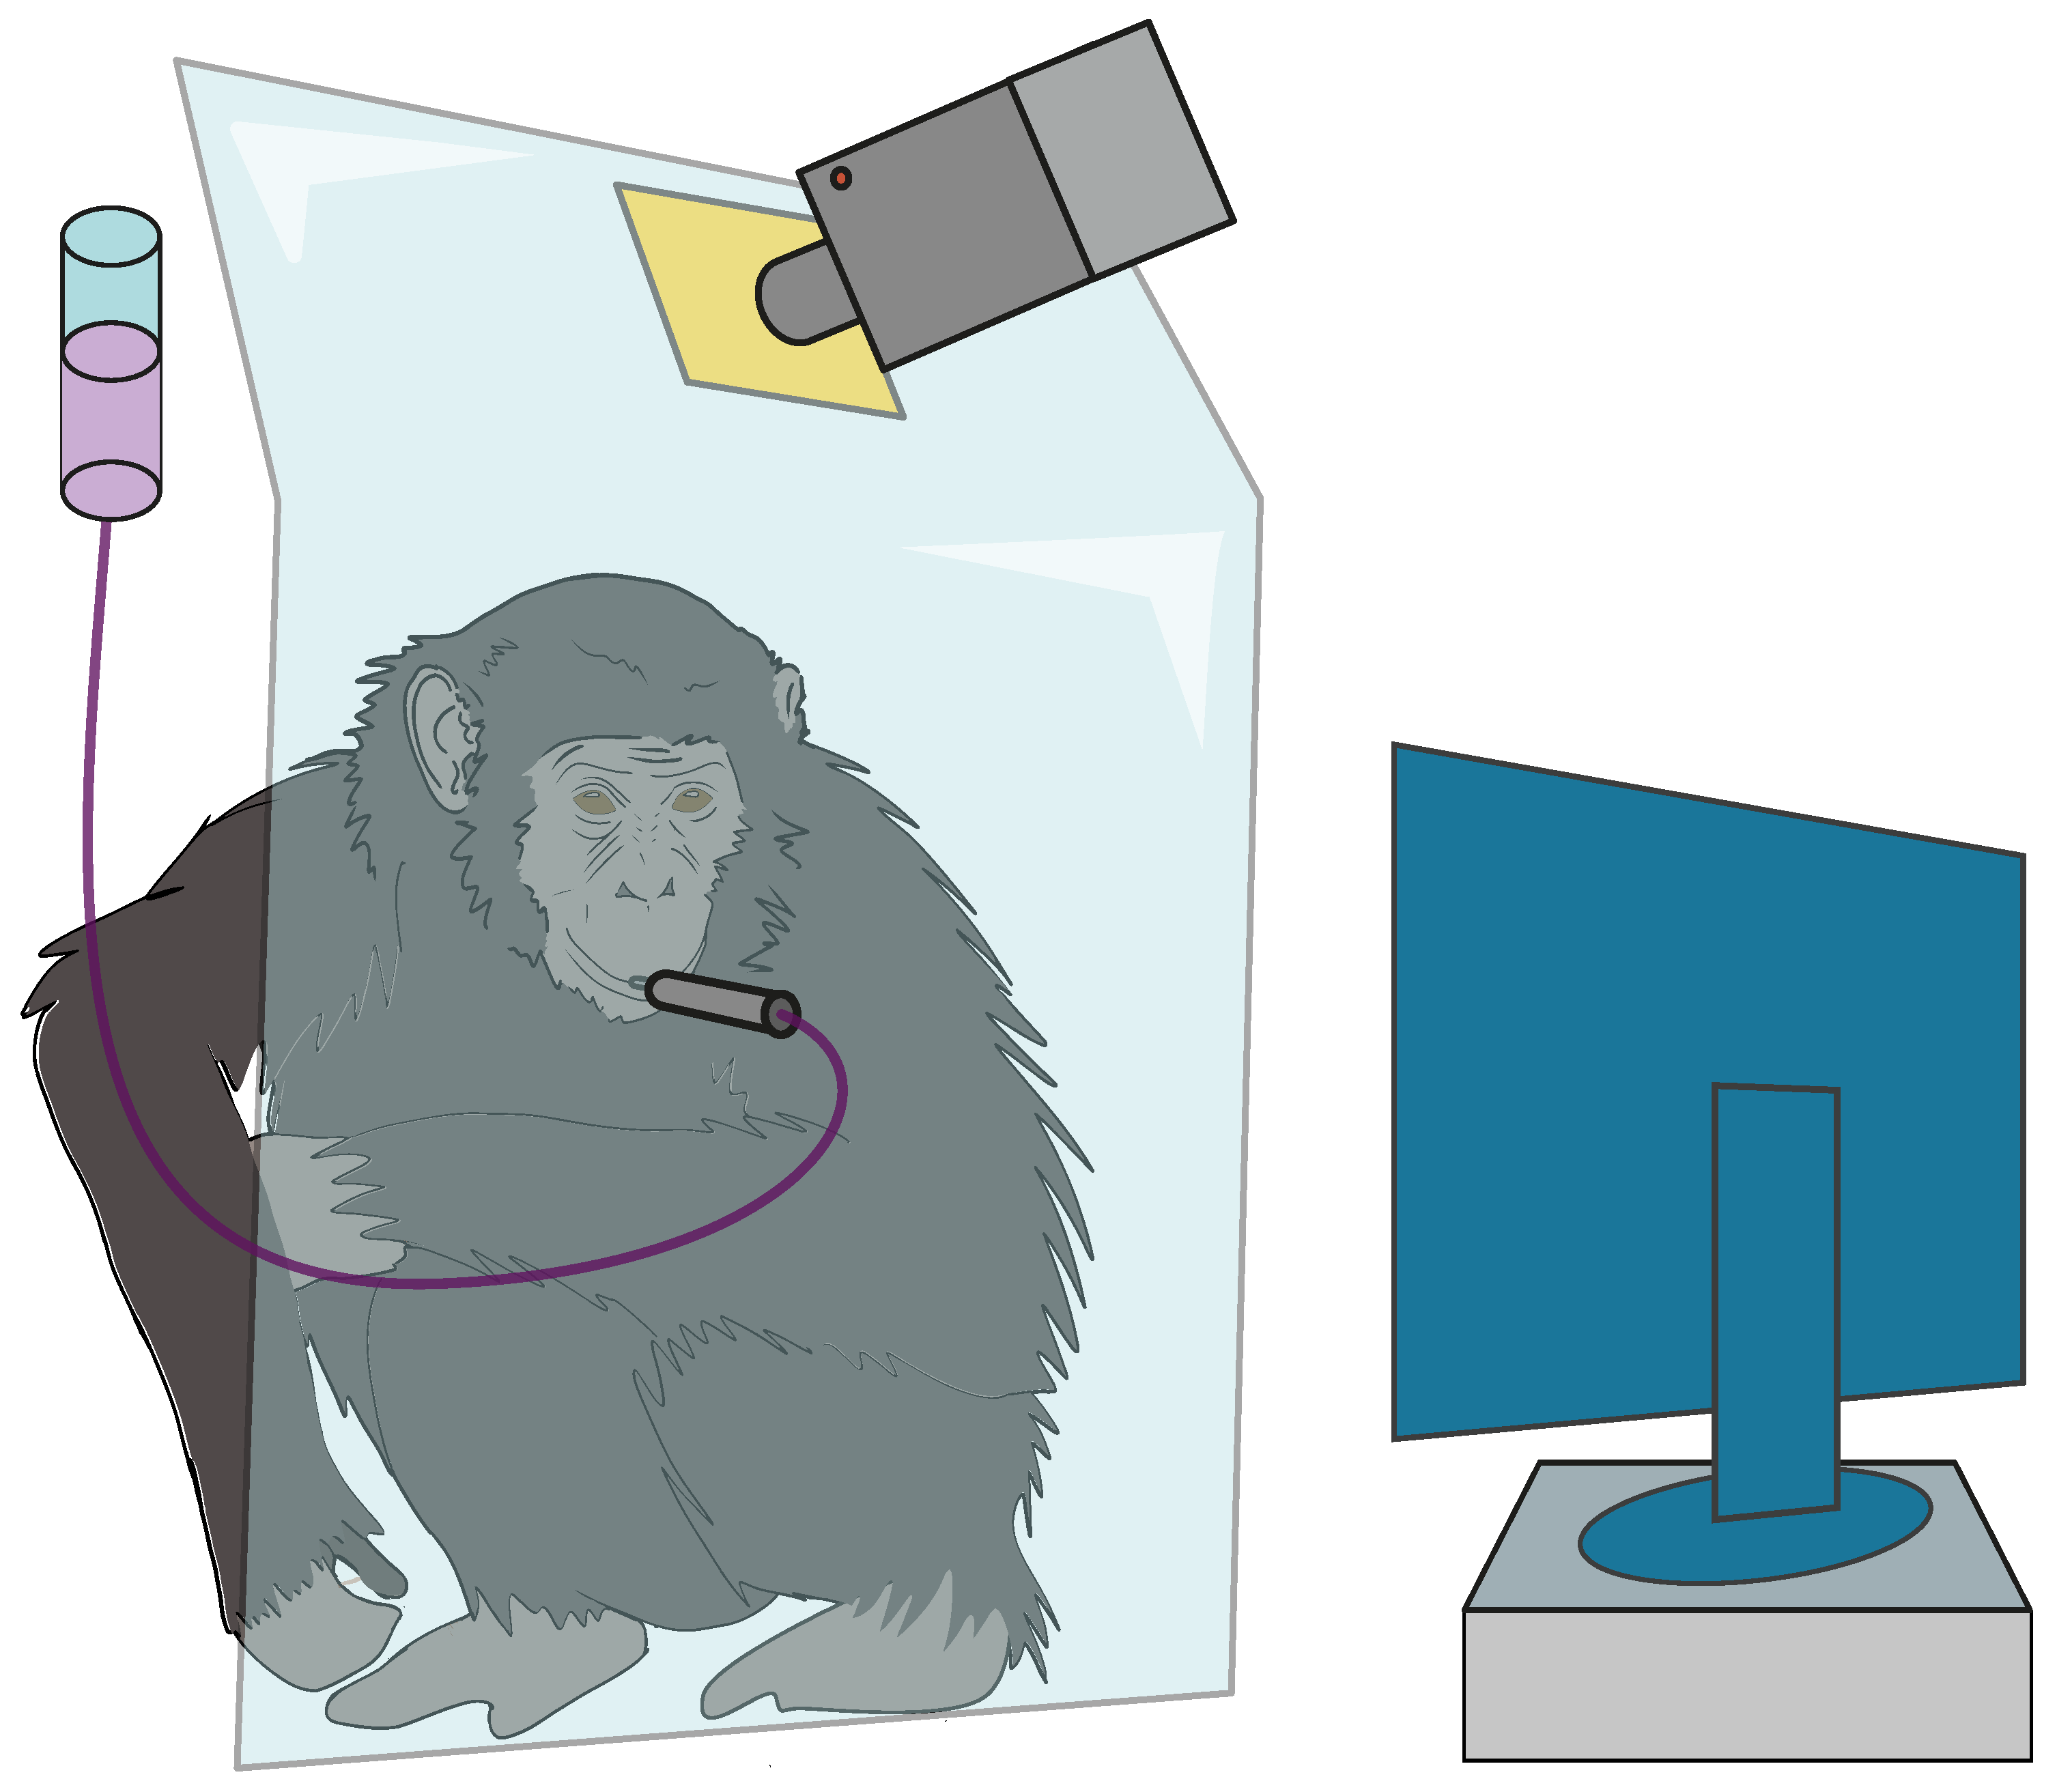
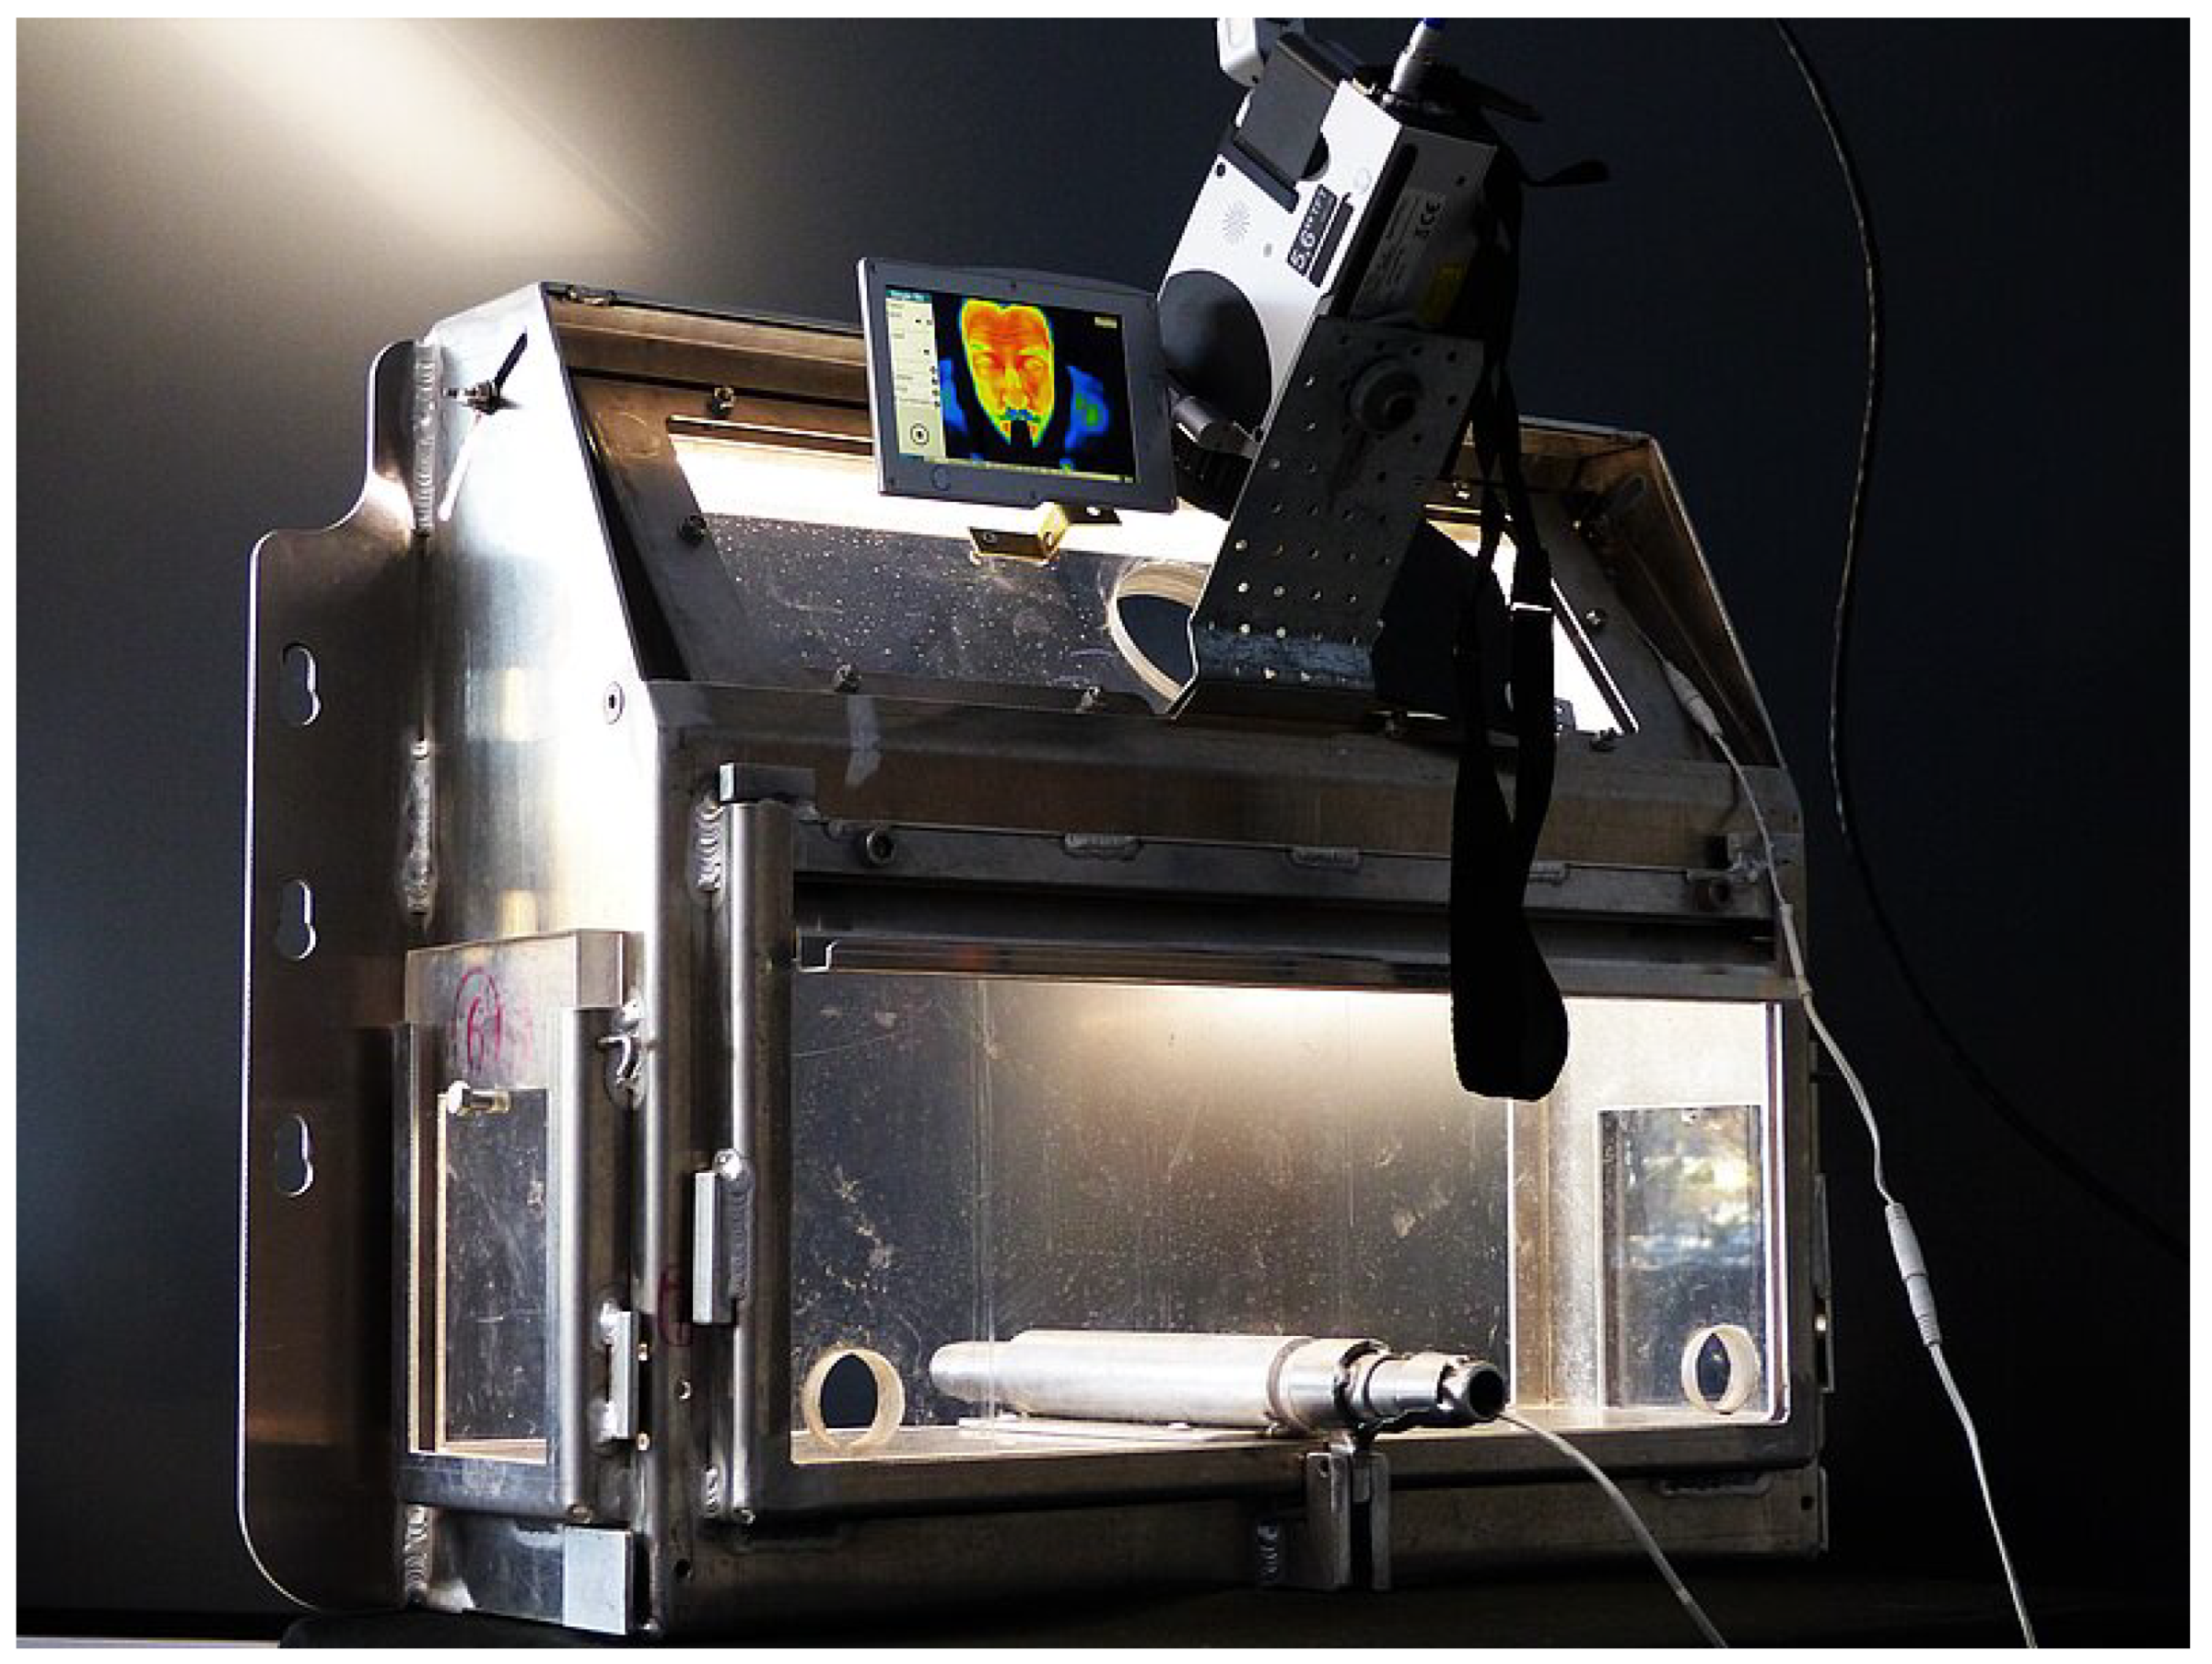
Our apparatus and our testing areas are designed to provide the great apes with a free space; a continuous reward, grape juice (allowing us to have stable recordings); and a stimulus. A scheme of this process is depicted in Figure 7. The stimulus is tailored for each study, from memory to computational tasks. Depending on the research study, we can enhance our setup with a touch screen or an eye tracker device. An additional image of the apparatus is reported in Figure A5.
5.2. Physiological Signal Retrieval
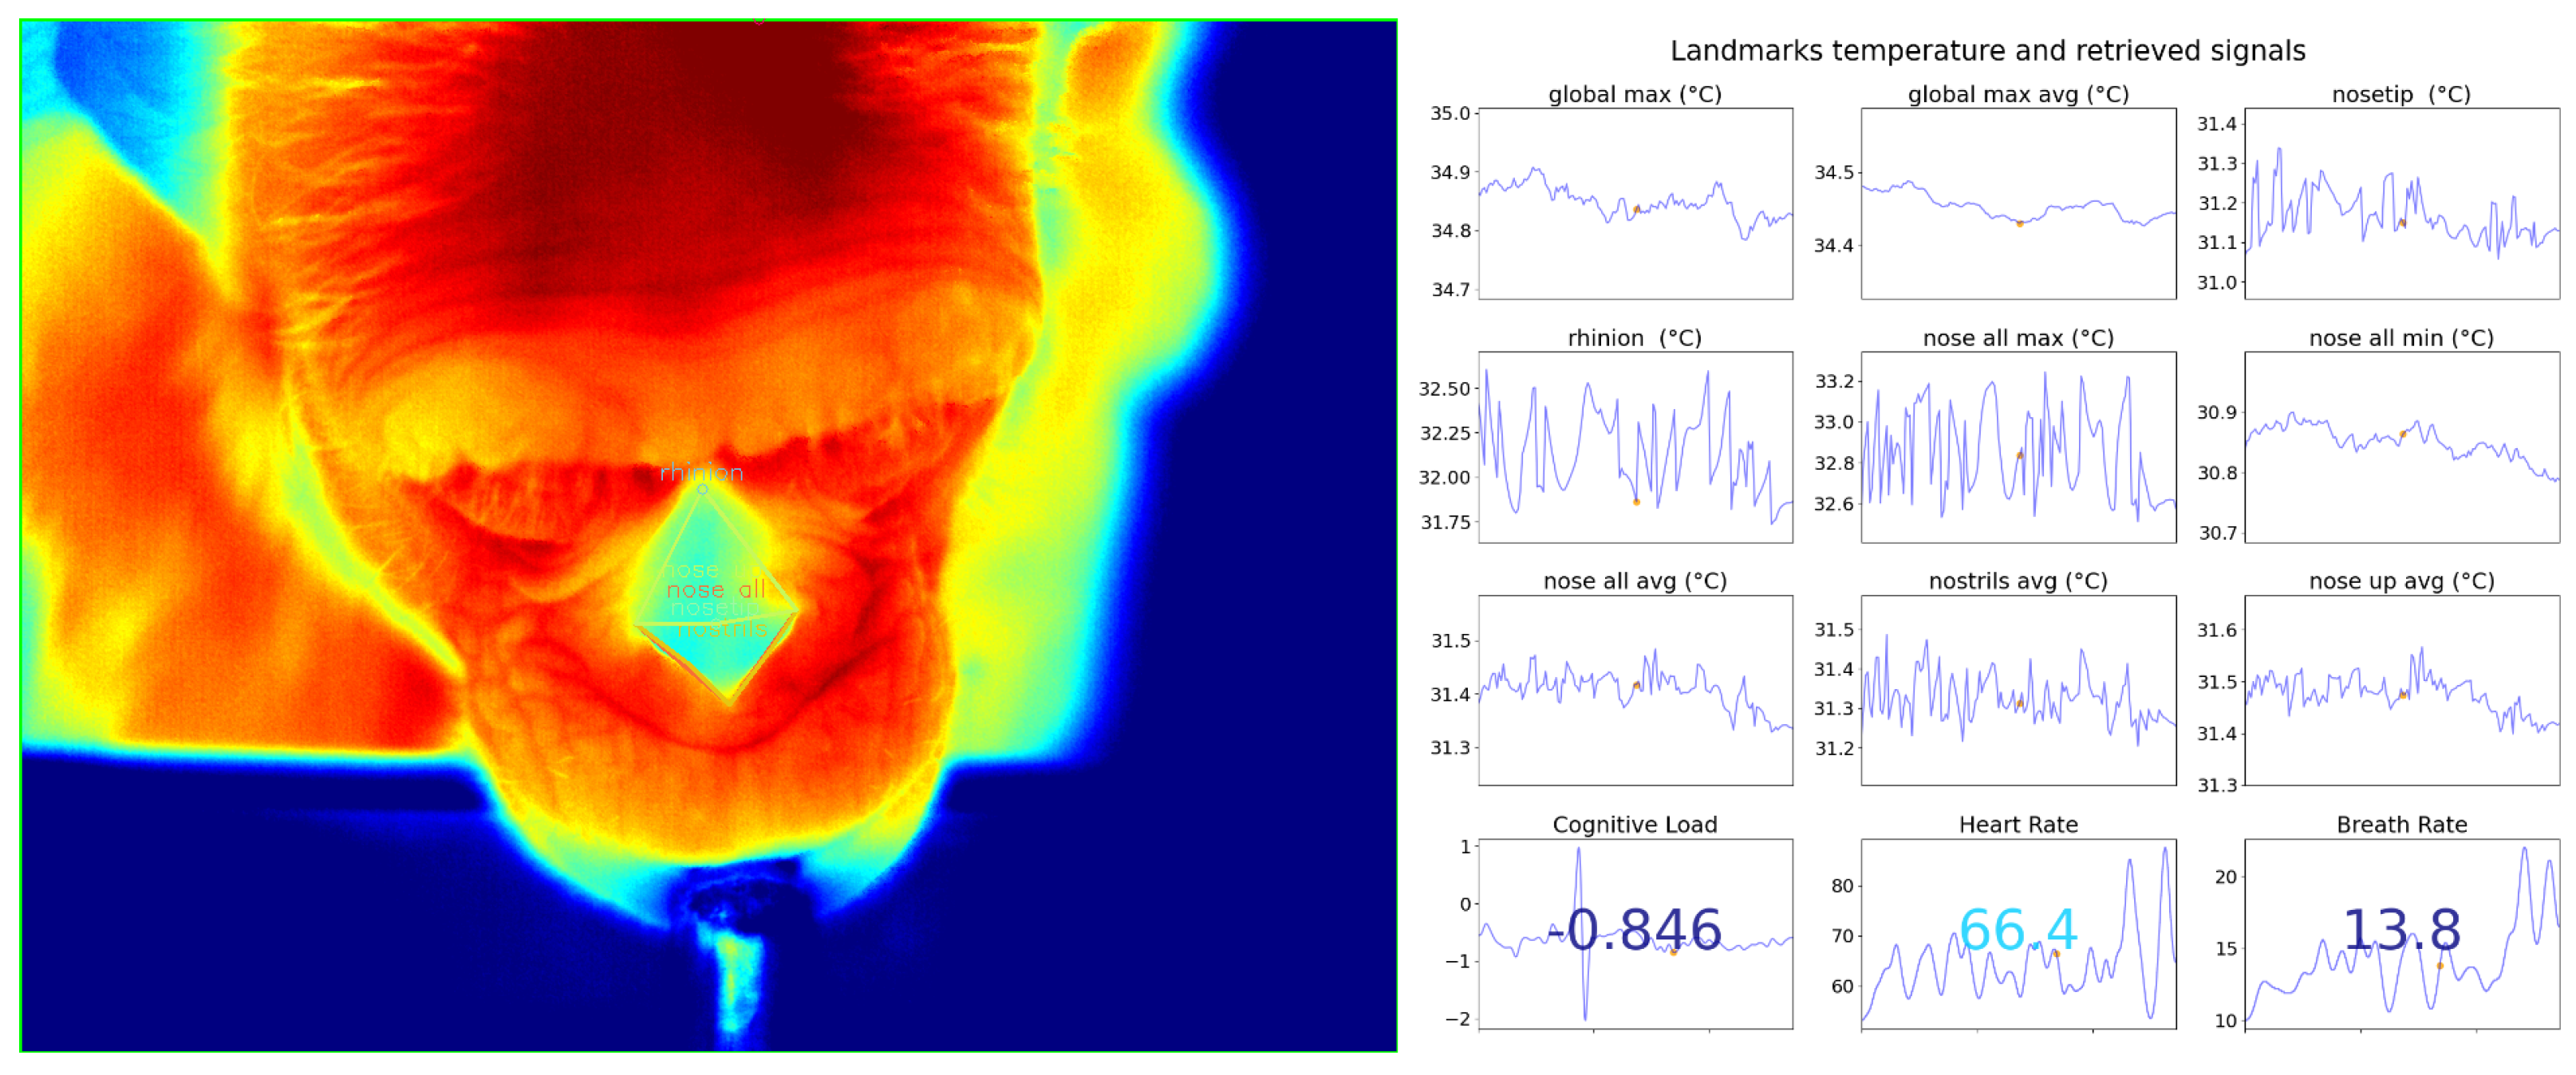
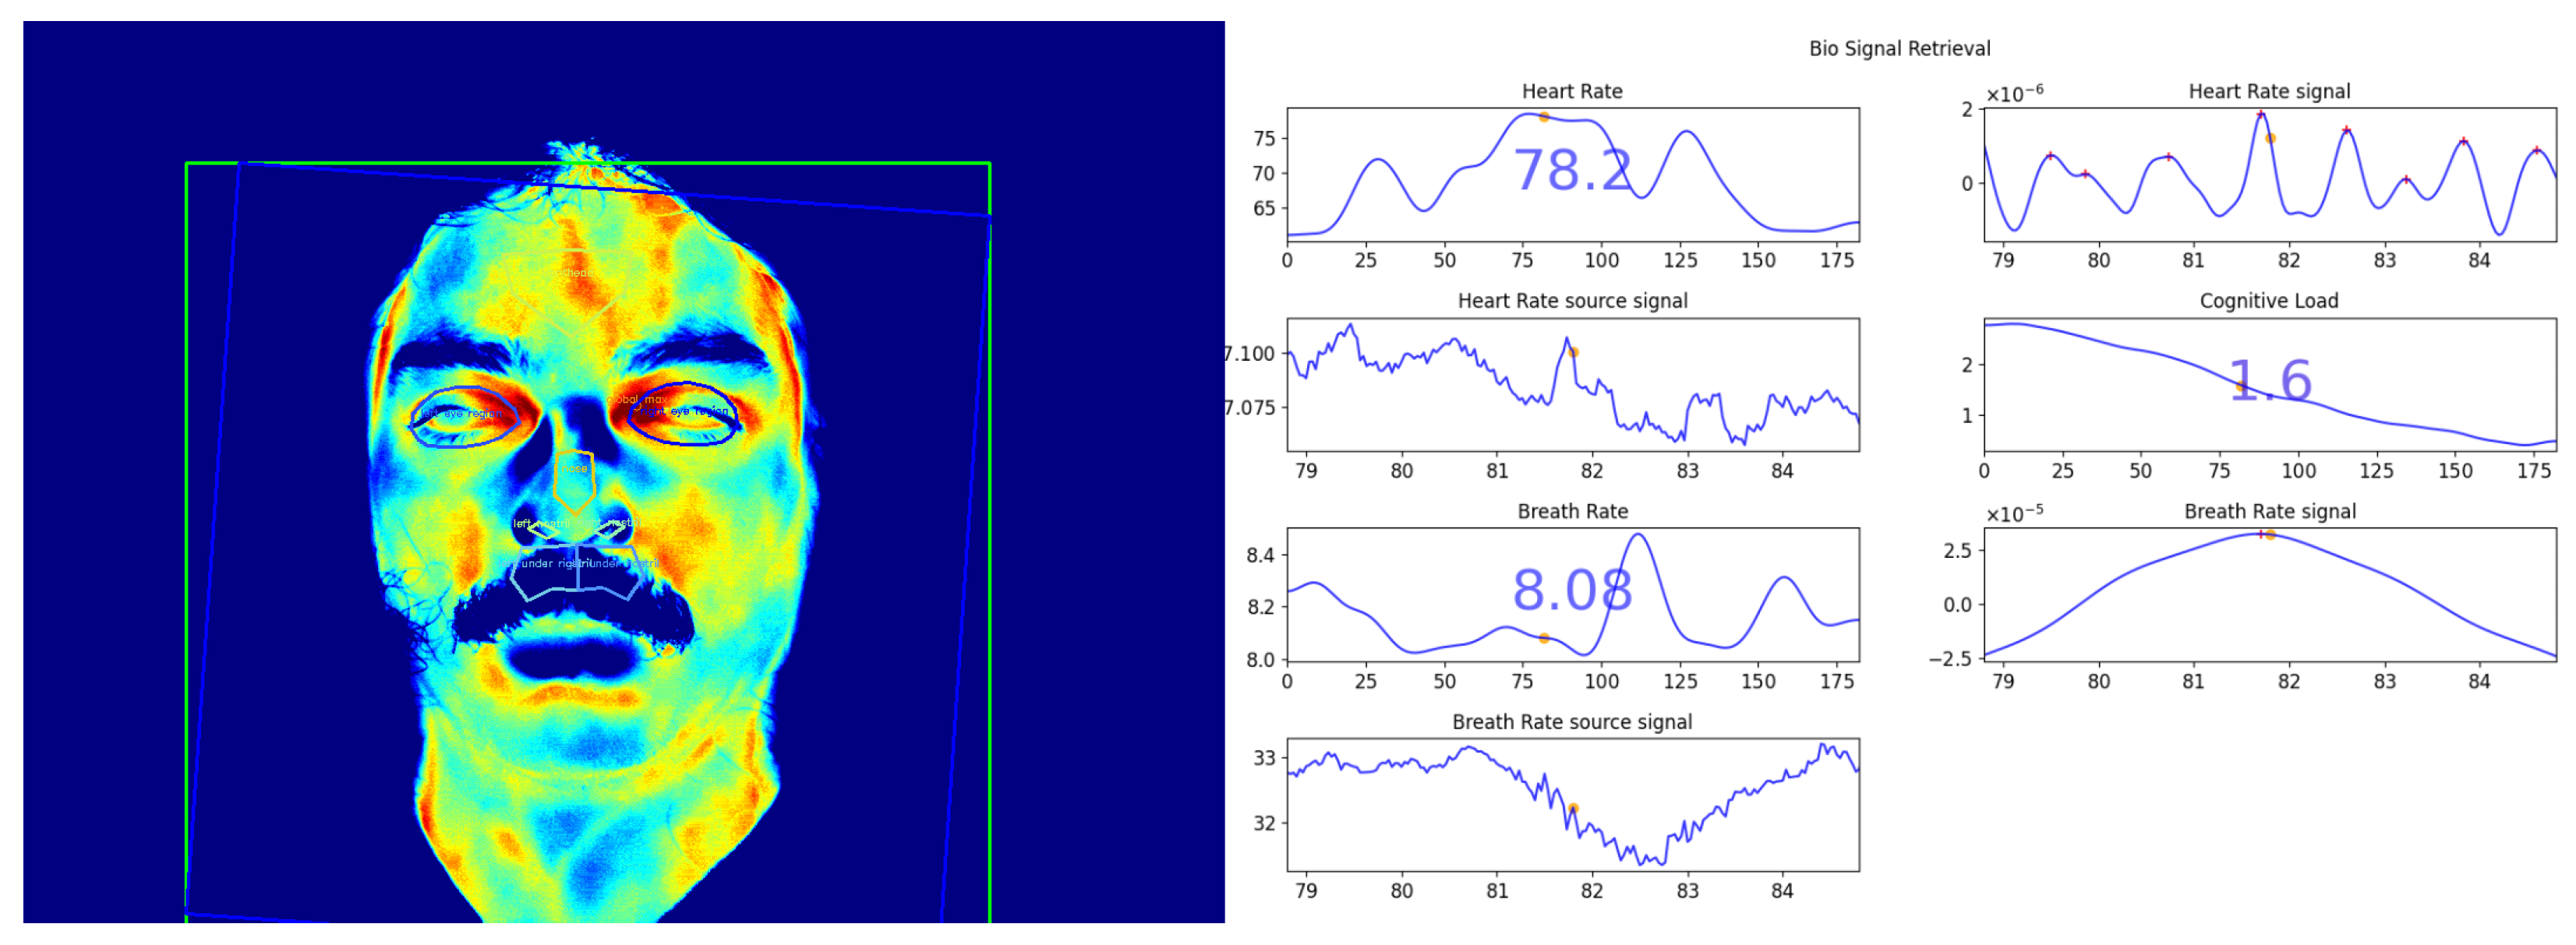
We estimate the physiological signals by analyzing the temperatures’ time series extracted from the computed regions and landmarks. We implement several methods relying on Fourier transformation, band-pass filter, and first-order derivatives. In Figure 8, we represent an attempt of the physiological signal retrieval from a chimpanzee face using our apparatus.
Different preprocessing, calculation, regions, and postprocessing methods are being tested. However, evaluating these methods with reliable ground-truth physiological data is problematic to achieve with great apes without invasive methods. Trials using a finger clip placed on one of the fingers of the chimpanzee were performed. Individuals were trained to present one of their fingers to wear the device. However, the signals remain unstable because of the thickness of the skin and the instability of the wearable device.
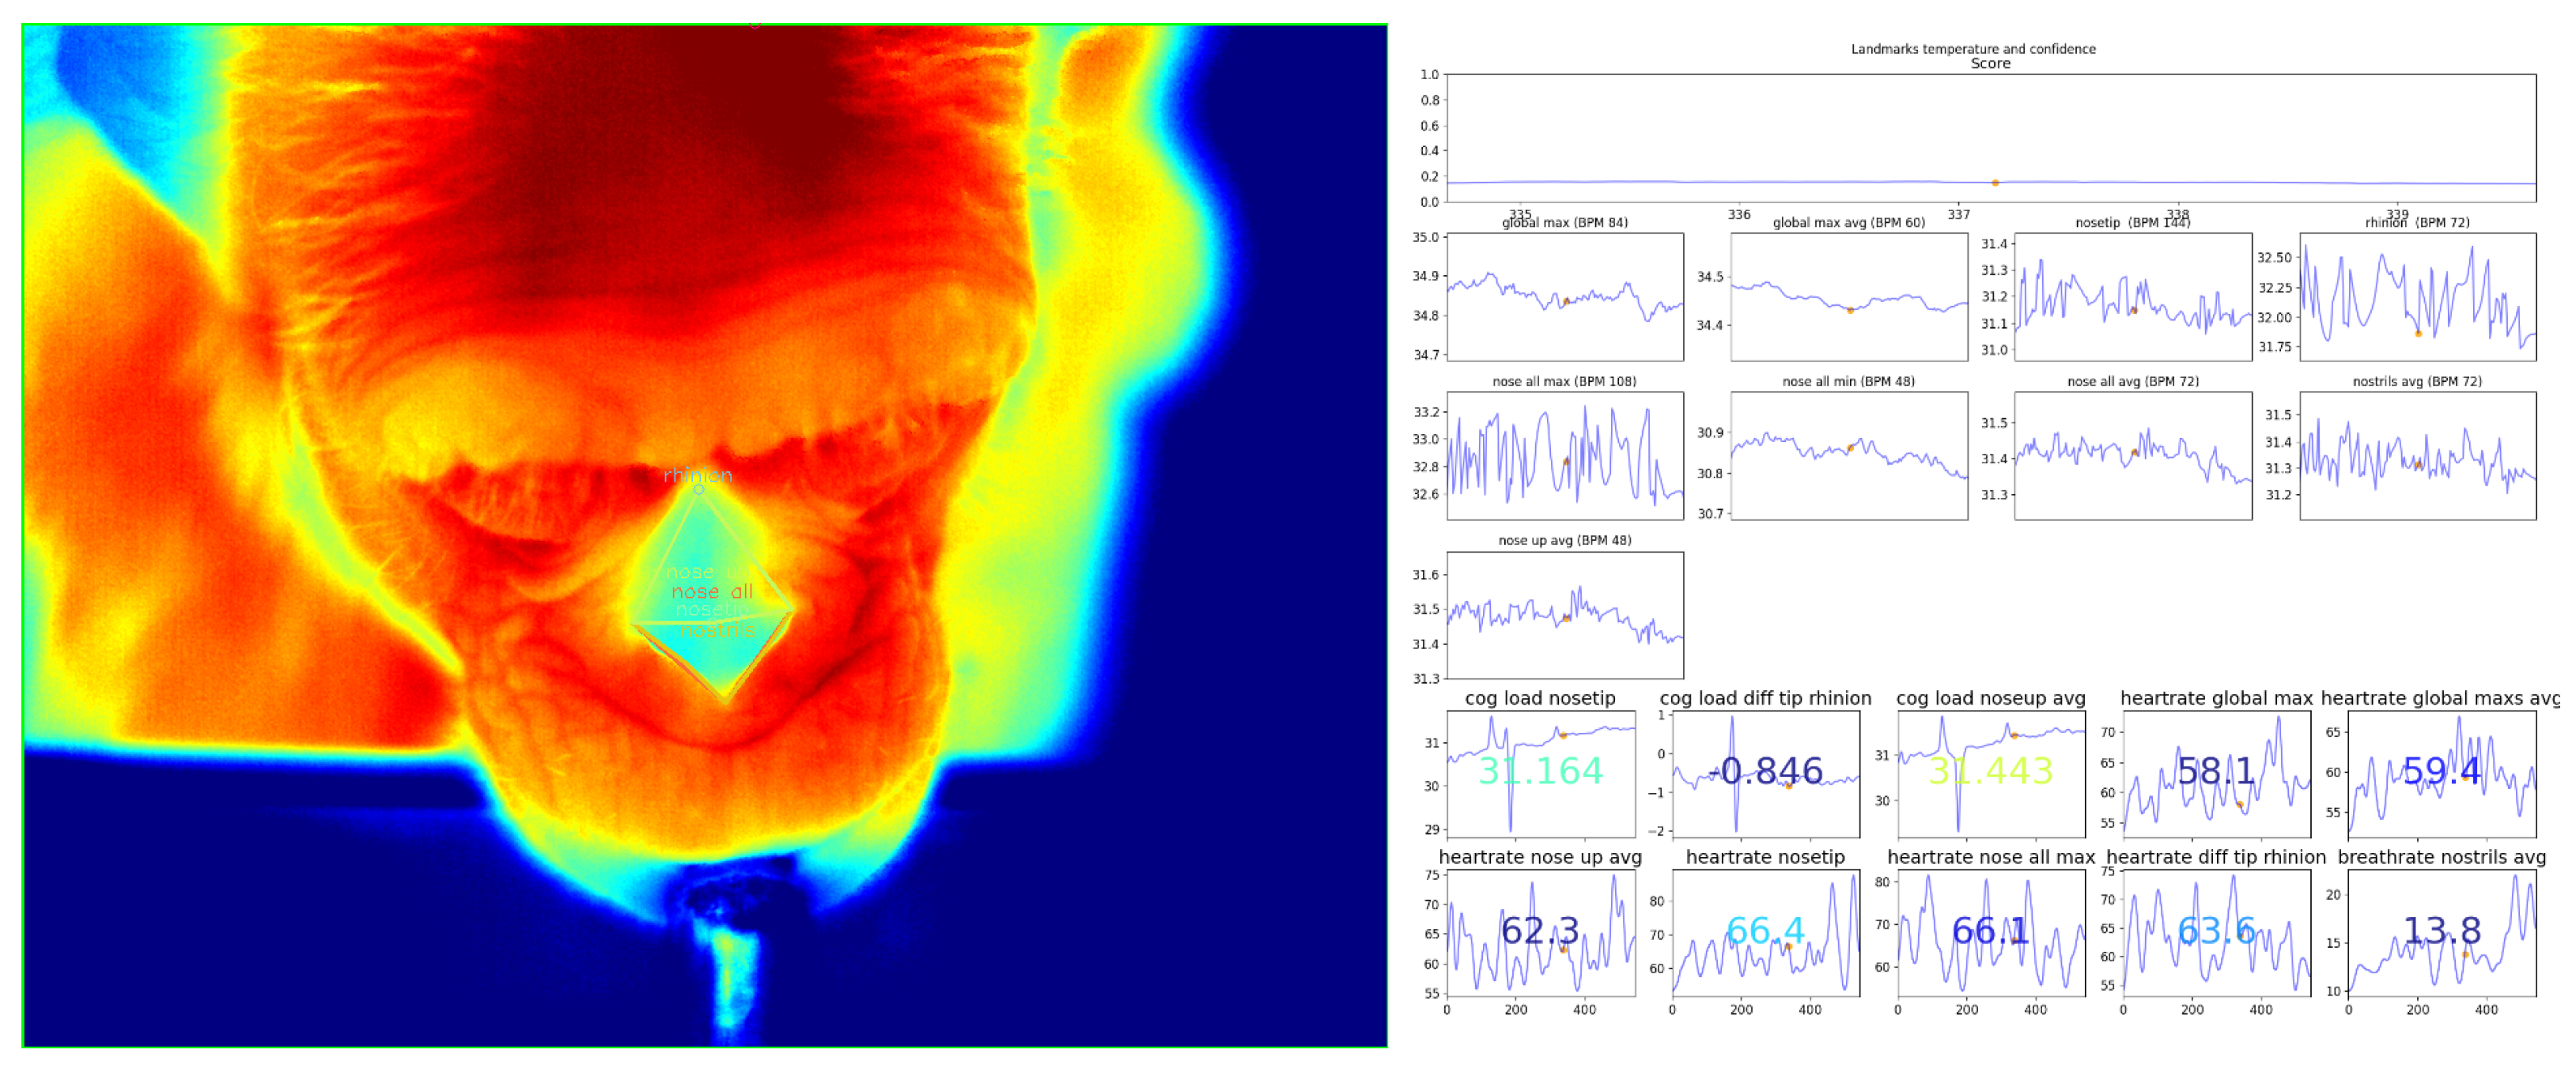
Therefore, we are building a TI human dataset in a controlled environment with an induced variation of the physiological signals through a biking activity. We synchronously record the RGB, thermal streams, and heart and breath rates for the community to evaluate methods based on only visual and/or thermal information to retrieve the physiological signals. We shall then be able to evaluate our implemented physiological signal retrieval methods. Moreover, we may identify the critical regions of the face to regain the measured physiological signals in humans, and extend this knowledge to great apes. An example of physiological signal retrieval with a human face is depicted in Figure 9.
The calculation of the physiological signals, and their evaluation, is currently under investigation. A more detailed demonstration image with the chimpanzee Zira and a human is also reported in Figure A6.
6. Conclusions
With this new ApeTI dataset, despite its limited size, we managed to fine-tune pretrained models for face detection and landmark regression. We evaluated and compared their performances and built a pipeline for finding and tracking landmarks of interest. The annotated landmarks were chosen for their aptitude to retrieve physiological signals with the aim of better understanding a chimpanzee’s behavior. The introduced Tina and Tifa models performed best compared with similar tools. The lack of models trained on thermal images did not allow an exhaustive comparison. Our future work will focus on the enlargement of the dataset to obtain models more robust to individual differences and acquisition angles, and the comparison of a greater number of models.
Our final goal being the processing of thermal images for biosignal retrieval for the study of human and nonhuman animal behaviors in an ecological context, several challenges remain to be solved, such as the following:
- Metal mesh segmentation and removal from thermal images;
- Heart rate and breath rate estimation from thermal videos; and
- Cognitive load estimation and monitoring from thermal videos.
The recording of physiological signals in nonhuman primates without invasive instruments or protocols is not trivial [34] and makes the evaluation of computed physiological signals hard to perform. Therefore, we are planning to record a new set of thermal videos synchronized with devices to record the heart rate and the breath rate of humans. This dataset will allow us to develop and evaluate methods to calculate such rates from the thermal information and define which regions of interest have to be observed for computing such rates. It may also contribute to the creation of a facial mapping proper to biosignal retrieval and tailor our annotation efforts for training new regression models. As presented in Section 5, we hope to retrieve these biosignals automatically from the thermal stream and transfer our knowledge from humans to other nonhuman animal species.
Funding
This research received no external funding.
Institutional Review Board Statement
The study involving great apes was reviewed and approved by an ethics committee from the Max Planck Institute for Evolutionary Anthropology and the Leipzig Zoo. This committee was internal and newly created at the time of the study; therefore, no approval number was delivered. The procedures used comply with the Weatherfall report “The use of non-human primates in research” and with the EAZA Minimum Standards for the Accommodation and Care of Animals in Zoos and Aquaria, the WAZA Ethical Guidelines for the Conduct of Research on Animals by Zoos and Aquariums, and the ASAB/ABS’s Guidelines for the Treatment of Animals in Behavioural Research and Teaching. IACUC approval was not necessary to conduct this research. Testing was always voluntary, the individuals were not food- or water-deprived, and a trained animal caretaker did the handling. Returning to their social group was possible at any moment of the test, as well as terminating the test, giving signs of discomfort or distress. We did not separate infants from their mothers. The study involving humans obtained approval from the Ethics Council of the Max Planck Society, Munich, Germany, falling under a packaged ethics application, “Uniquely human cultural diversity and its universal cognitive mechanisms” (Appl. No. 2021_45), and was approved by an internal ethics committee at the Max Planck Institute for Evolutionary Anthropology.
Informed Consent Statement
Informed consent was obtained from all subjects involved in the study to publish this paper.
Data Availability Statement
We encourage researchers to use this dataset to benchmark their methods. Our model configurations, leaderboard, and guidelines for downloading the data are available on the dedicated GitHub repository: https://github.com/ccp-eva/ApeTI (accessed on 11 March 2024). The data used for training and evaluating the different models mentioned in this paper and the weights of the Tifa and Tina models are available on the following password-protected repository: https://share.eva.mpg.de/index.php/s/MnD33qD9ZxCYdJL (accessed on 11 March 2024). The original recordings mentioned in this paper are available upon request by writing to the main author.
Acknowledgments
This work would not have been possible without the help of the WKPRC team, Sebastian Schütte, Katrin Kopp, Gregor Kachel, Johanna Eckert, and our student assistants who acquired, annotated, and reviewed the ApeTI dataset.
Conflicts of Interest
The author declare no conflicts of interest.
Abbreviations
The following abbreviations are used in this manuscript:
| TI | thermal image |
| ApeTI | Ape Thermal Image (dataset) |
| mAP | mean average precision |
| WKPRC | Wolfgang Köhler Primate Research Center |
| MPI EVA | Max Planck Institute for Evolutionary Anthropology |
| IoU | intersections over union |
| OKS | object keypoint similarity |
| AP | average precision |
| Tifa | Thermal Image Face Ape |
| Tina | Thermal Image Nose Ape |
| ROI | region of interest |
| EAZA | European Association of Zoos and Aquaria |
| WAZA | World Association of Zoos and Aquariums |
| ASAB | Association for the Study of Animal Behaviour |
| ABS | Animal Behavior Society |
| IACUC | Institutional Animal Care and Use Committee |
| AR | average recall |
Appendix A. Results
In this section, we provide complementary figures depicting the face detection and landmark regression performance during the full search for the best parameters. More metrics are observed than in the first part of the paper.
Appendix A.1. Face Detection
The observed metrics are similar to the metrics observed for the detection challenge in the COCO dataset (https://cocodataset.org/#detection-eval (accessed on 11 March 2024)).
Metrics definition:
- Average Precision (AP):
- –
- mAP at IoU = 0.50:0.05:0.95 (primary metric)
- –
- AP50 at IoU = 0.50 (loose metric)
- –
- AP75 at IoU = 0.75 (strict metric)
- AP Across Scales:
- –
- APsmall (small objects: area < )
- –
- APmedium (medium objects: < area < )
- –
- APlarge (large objects: area > )
- Average Recall (AR):
- –
- AR1 (AR given 1 detection per image)
- –
- AR10 (AR given 10 detections per image)
- –
- AR100 (AR given 100 detections per image)
- AR Across Scales:
- –
- ARsmall (small objects: area < )
- –
- ARmedium (medium objects: < area < )
- –
- ARlarge (large objects: area > )
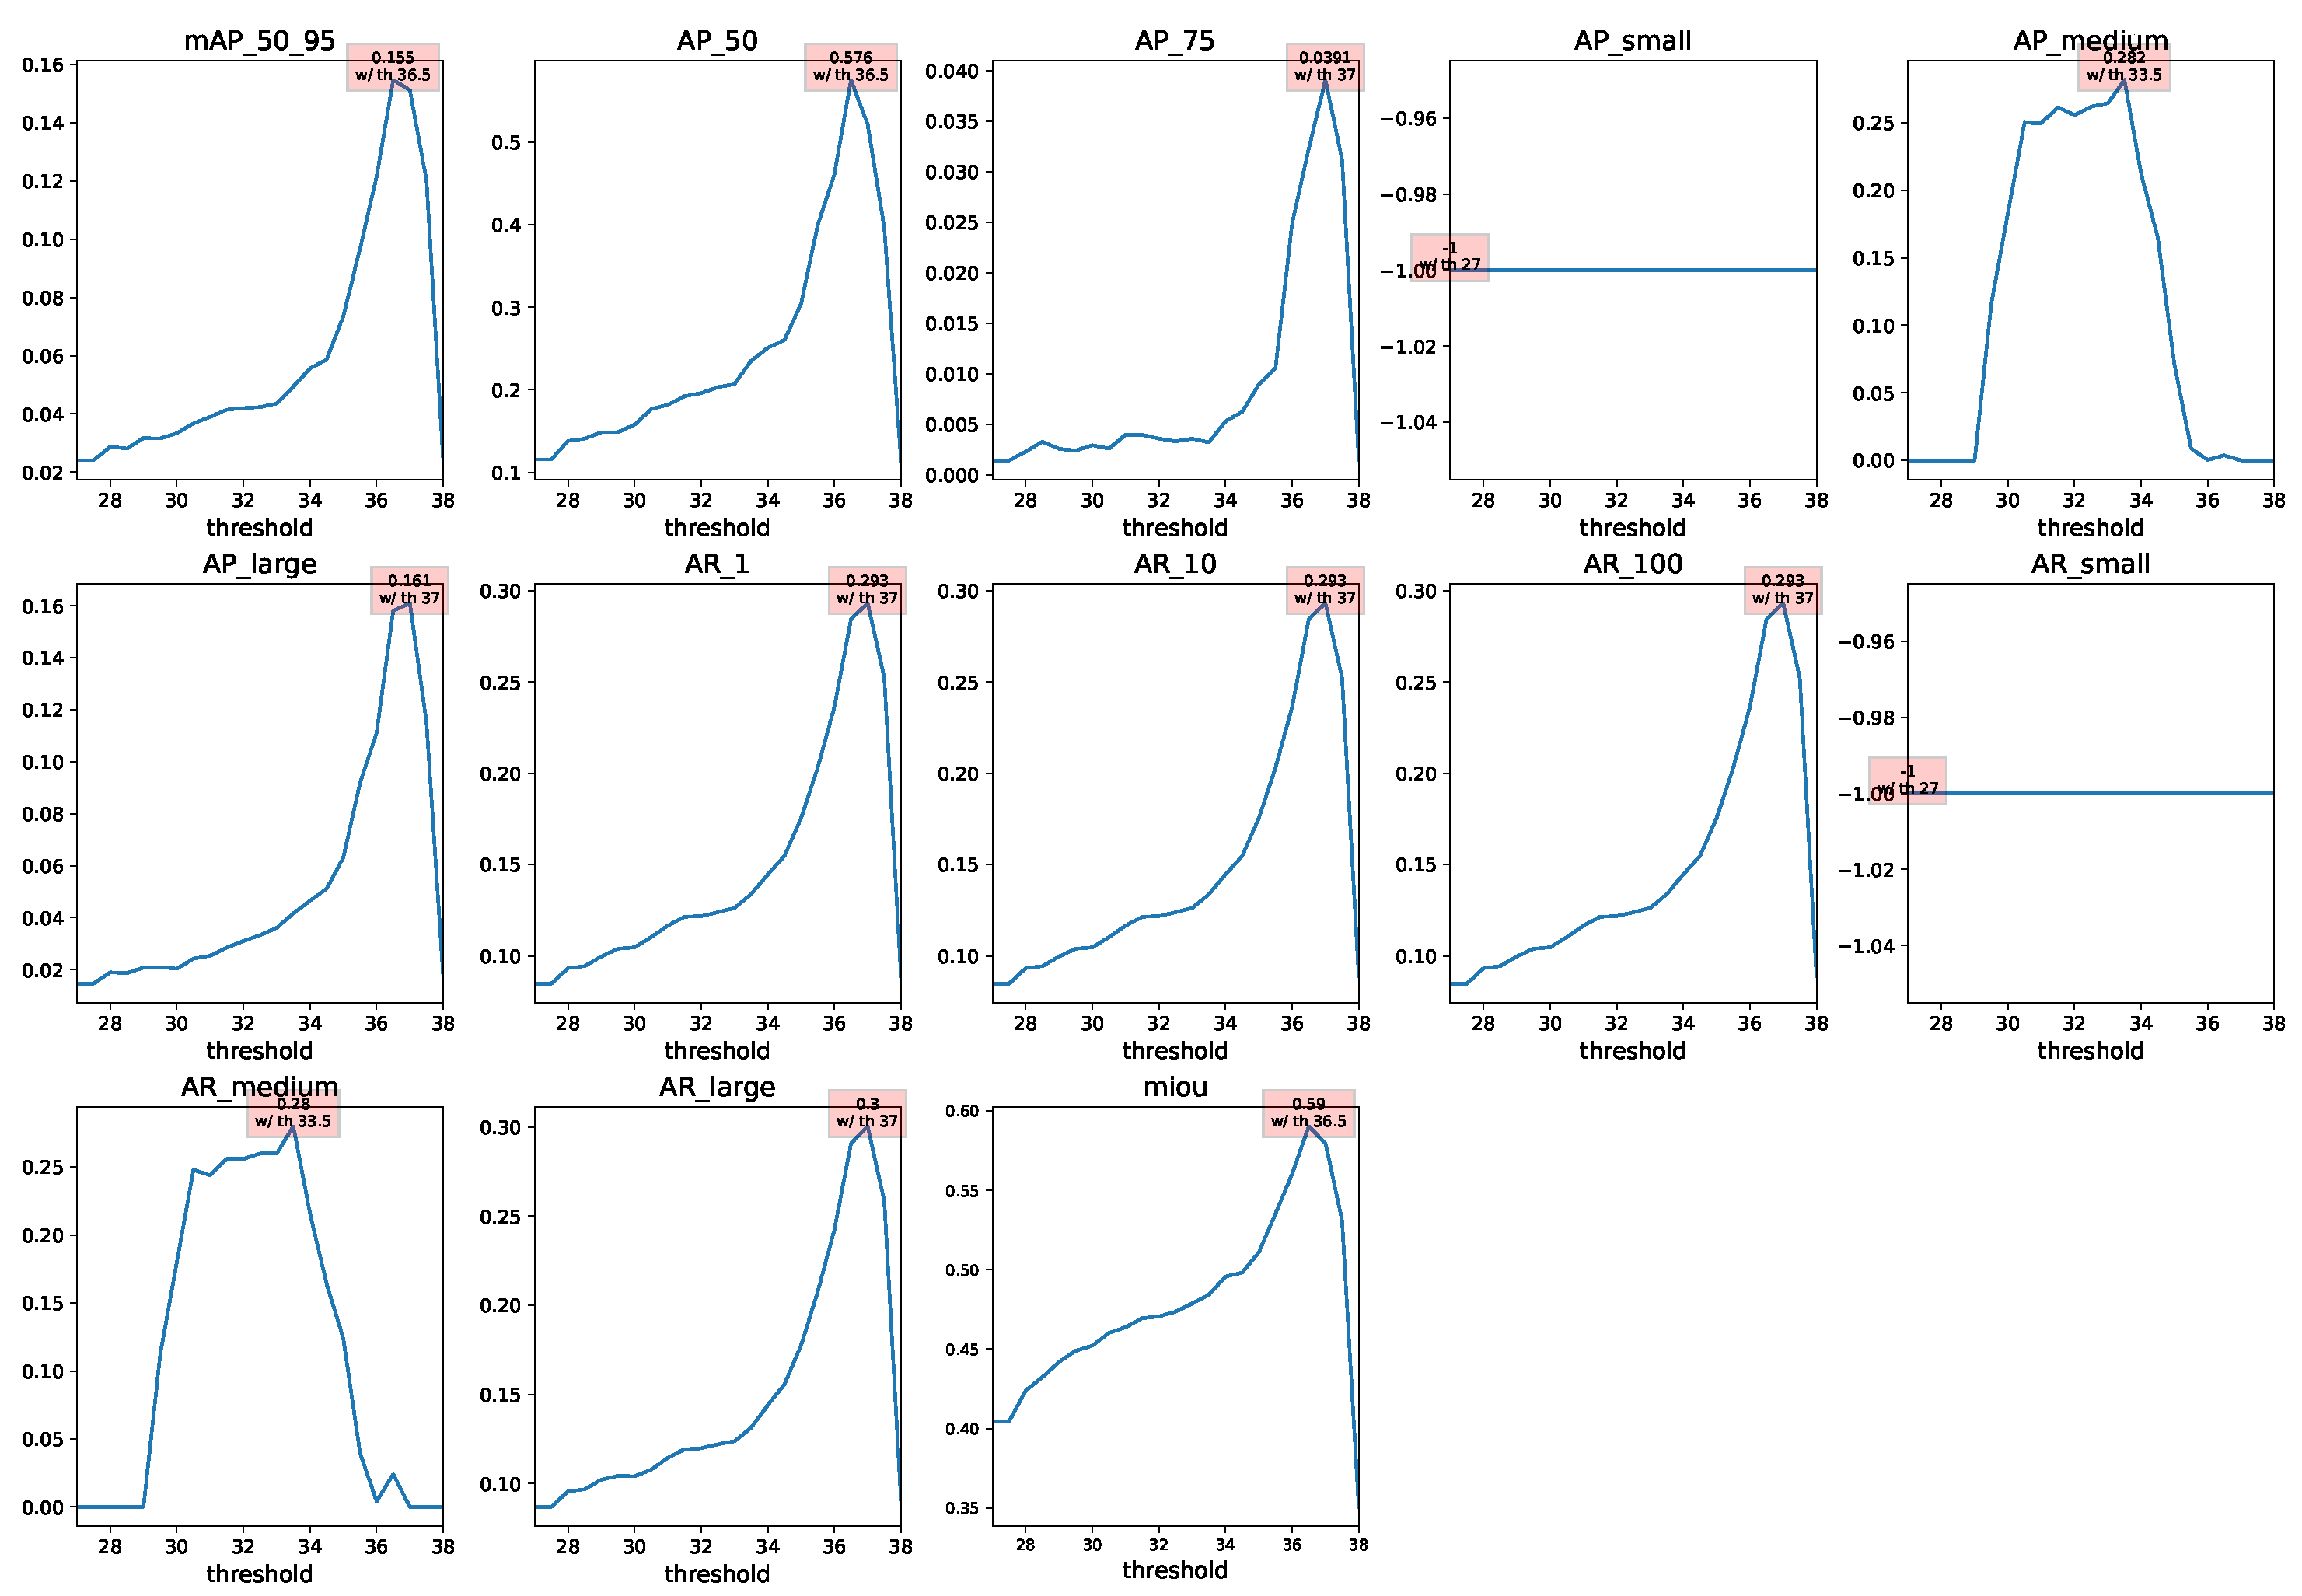
As visible in Figure A1 and Figure A2, the ApeTI dataset does not contain images with small faces and is therefore per default outputting a constant -1 value. Furthermore, ApeTI has the particularity to have only one and strictly one face per sample, which leads to having the same values for AR1, AR10, and AR100.
Figure A1.
Face detection results using the combination of the BlazeFace and Threshold methods on the joint train and validation sets with variable threshold.
Figure A1.
Face detection results using the combination of the BlazeFace and Threshold methods on the joint train and validation sets with variable threshold.

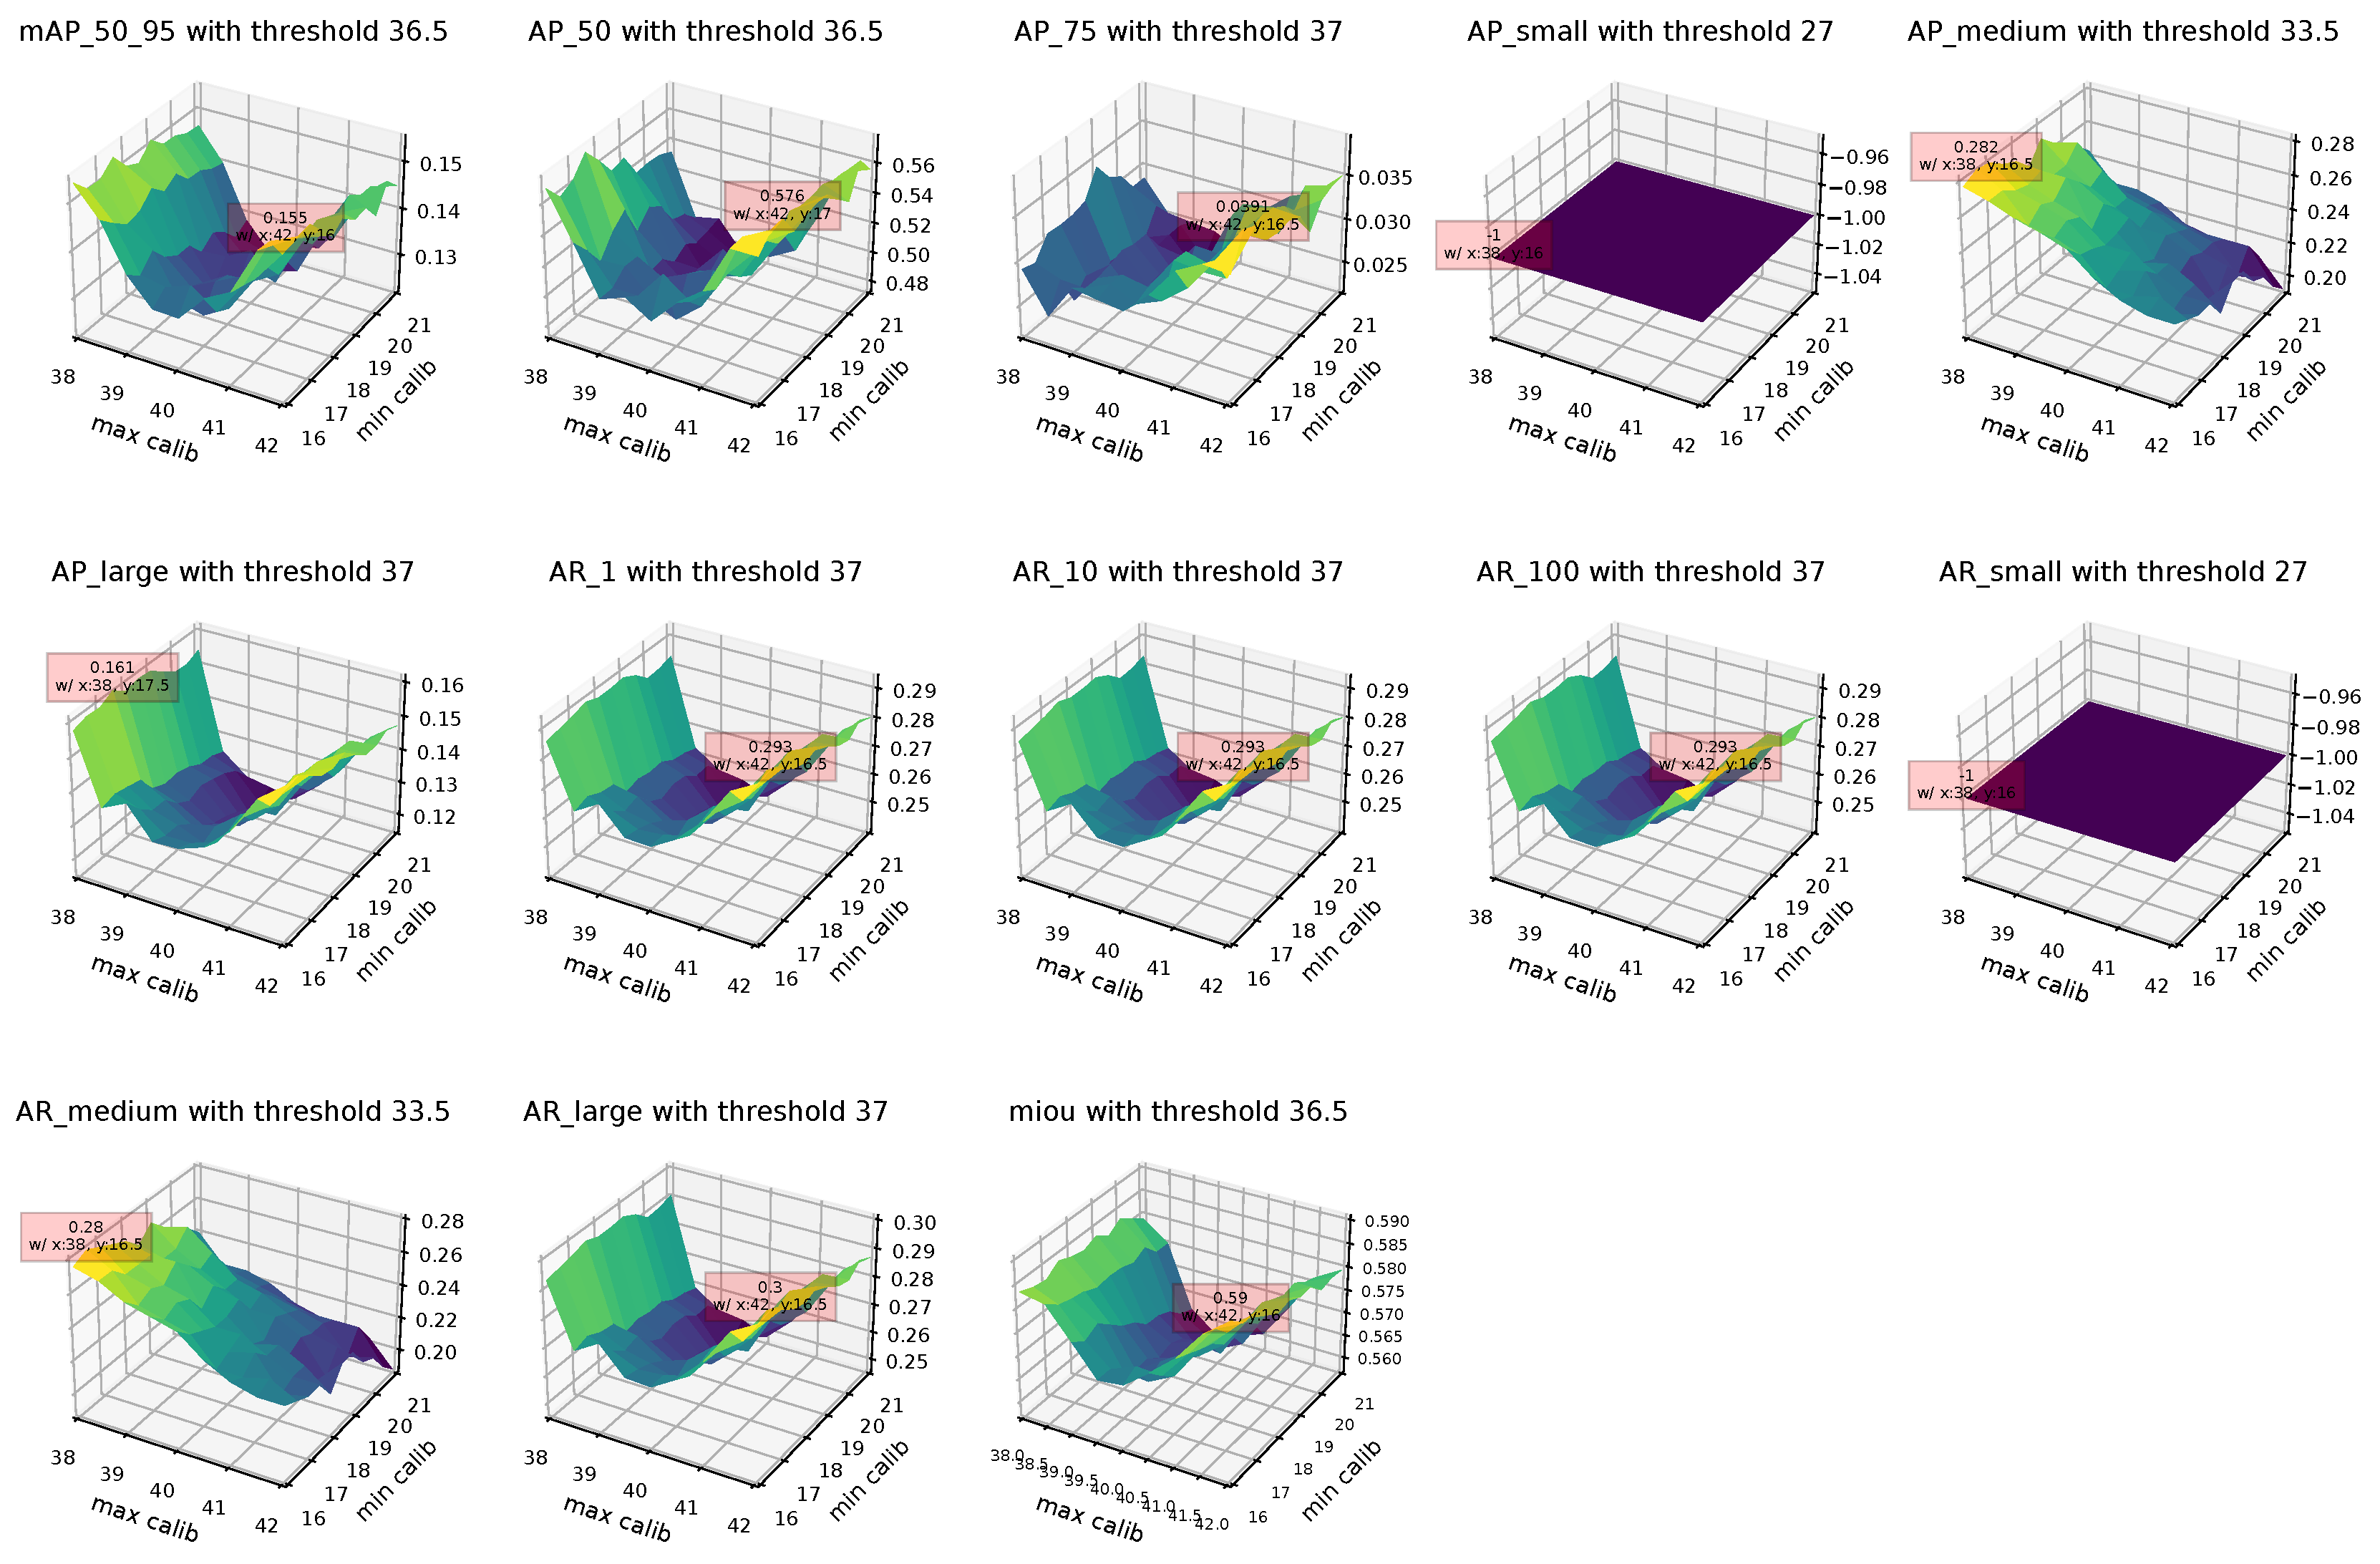
Figure A2.
Face detection results using the combination of the BlazeFace and Threshold methods on the joint train and validation sets with variable calibration.
Figure A2.
Face detection results using the combination of the BlazeFace and Threshold methods on the joint train and validation sets with variable calibration.

Appendix A.2. Landmark Regression
The observed metrics are similar to the metrics observed for the keypoint challenge in the COCO dataset (https://cocodataset.org/#keypoints-eval (accessed on 11 March 2024)).
Metrics definition:
- Average Precision (AP):
- –
- mAP at OKS = 0.50:0.05:0.95 (primary metric)
- –
- AP50 at OKS = 0.50 (loose metric)
- –
- AP75 at OKS = 0.75 (strict metric)
- AP Across Scales:
- –
- APmedium (medium objects: < area < )
- –
- APlarge (large objects: area > )
- Average Recall (AR):
- –
- mAR at OKS = 0.50:0.05:0.95
- –
- AR50 at OKS = 0.50
- –
- AR75 at OKS = 0.75
- AR Across Scales:
- –
- ARmedium (medium objects: < area < )
- –
- ARlarge (large objects: area > )
Figure A3.
Landmark regression results using the combination of the BlazeFace, Threshold, and FaceMesh methods on the joint train and validation sets with variable threshold.
Figure A3.
Landmark regression results using the combination of the BlazeFace, Threshold, and FaceMesh methods on the joint train and validation sets with variable threshold.

Figure A4.
Landmark regression results using the combination of the BlazeFace, Threshold, and FaceMesh methods on the joint train and validation sets with variable calibration. A brighter color stands for a higher score.
Figure A4.
Landmark regression results using the combination of the BlazeFace, Threshold, and FaceMesh methods on the joint train and validation sets with variable calibration. A brighter color stands for a higher score.

Appendix B. Application in Studies
Appendix B.1. The Apparatus
Figure A5.
The thermal image camera apparatus when unmounted from the testing room. A human face drinking from the juice dispenser is shown on the screen of the camera.
Figure A5.
The thermal image camera apparatus when unmounted from the testing room. A human face drinking from the juice dispenser is shown on the screen of the camera.

Appendix B.2. Physiological Signal Retrieval
Figure A6.
Landmark computation, time series observation, and physiological signal retrieval with a chimpanzee.
Figure A6.
Landmark computation, time series observation, and physiological signal retrieval with a chimpanzee.

References
- Cardone, D.; Pinti, P.; Merla, A. Thermal Infrared Imaging-Based Computational Psychophysiology for Psychometrics. Comput. Math. Methods Med. 2015, 2015, 984353. [Google Scholar] [CrossRef] [PubMed]
- Sonkusare, S.; Breakspear, M.; Pang, T.; Nguyen, V.T.; Frydman, S.; Guo, C.C.; Aburn, M.J. Data-driven analysis of facial thermal responses and multimodal physiological consistency among subjects. Sci. Rep. 2021, 11, 12059. [Google Scholar] [CrossRef] [PubMed]
- Paolini, D.; Alparone, F.R.; Cardone, D.; van Beest, I.; Merla, A. “The face of ostracism”: The impact of the social categorization on the thermal facial responses of the target and the observer. Acta Psychol. 2016, 163, 65–73. [Google Scholar] [CrossRef] [PubMed]
- Derakhshan, A.; Mikaeili, M.; Gedeon, T.; Nasrabadi, A.M. Identifying the Optimal Features in Multimodal Deception Detection. Multimodal Technol. Interact. 2020, 4, 25. [Google Scholar] [CrossRef]
- Stukelj, M.; Hajdinjak, M.; Pusnik, I. Stress-free measurement of body temperature of pigs by using thermal imaging—Useful fact or wishful thinking. Comput. Electron. Agric. 2022, 193, 106656. [Google Scholar] [CrossRef]
- Yadav, S.S.; Jadhav, S.M. Thermal infrared imaging based breast cancer diagnosis using machine learning techniques. Multim. Tools Appl. 2022, 81, 13139–13157. [Google Scholar] [CrossRef]
- Perpetuini, D.; Formenti, D.; Cardone, D.; Trecroci, A.; Rossi, A.; Di Credico, A.; Merati, G.; Alberti, G.; Di Baldassarre, A.; Merla, A. Can Data-Driven Supervised Machine Learning Approaches Applied to Infrared Thermal Imaging Data Estimate Muscular Activity and Fatigue? Sensors 2023, 23, 832. [Google Scholar] [CrossRef]
- Choi, J.; Oh, K.; Kwon, O.; Kwon, J.; Kim, J.; Yoo, S.K. Non-Contact Respiration Rate Measurement From Thermal Images Using Multi-Resolution Window and Phase-Sensitive Processing. IEEE Access 2023, 11, 112706–112718. [Google Scholar] [CrossRef]
- Cordoni, F.G.; Bacchiega, G.; Bondani, G.; Radu, R.; Muradore, R. A multi-modal unsupervised fault detection system based on power signals and thermal imaging via deep AutoEncoder neural network. Eng. Appl. Artif. Intell. 2022, 110, 104729. [Google Scholar] [CrossRef]
- Garbey, M.; Sun, N.; Merla, A.; Pavlidis, I.T. Contact-Free Measurement of Cardiac Pulse Based on the Analysis of Thermal Imagery. IEEE Trans. Biomed. Eng. 2007, 54, 1418–1426. [Google Scholar] [CrossRef]
- Fei, J.; Pavlidis, I.T. Thermistor at a Distance: Unobtrusive Measurement of Breathing. IEEE Trans. Biomed. Eng. 2010, 57, 988–998. [Google Scholar] [CrossRef] [PubMed]
- Shastri, D.J.; Papadakis, M.; Tsiamyrtzis, P.; Bass, B.; Pavlidis, I.T. Perinasal Imaging of Physiological Stress and Its Affective Potential. IEEE Trans. Affect. Comput. 2012, 3, 366–378. [Google Scholar] [CrossRef]
- Taamneh, S.; Tsiamyrtzis, P.; Dcosta, M.; Buddharaju, P.; Khatri, A.; Manser, M.; Ferris, T.; Wunderlich, R.; Pavlidis, I. A multimodal dataset for various forms of distracted driving. Sci. Data 2017, 4, 170110. [Google Scholar] [CrossRef] [PubMed]
- Kajiwara, S. Evaluation of driver’s mental workload by facial temperature and electrodermal activity under simulated driving conditions. Int. J. Automot. Technol. 2014, 15, 65–70. [Google Scholar] [CrossRef]
- Kano, F.; Hirata, S.; Deschner, T.; Behringer, V.; Call, J. Nasal temperature drop in response to a playback of conspecific fights in chimpanzees: A thermo-imaging study. Physiol. Behav. 2015, 155, 83–94. [Google Scholar] [CrossRef] [PubMed]
- Demartsev, V.; Manser, M.B.; Tattersall, G.J. Vocalization-associated respiration patterns: Thermography-based monitoring and detection of preparation for calling. J. Exp. Biol. 2022, 225, jeb243474. [Google Scholar] [CrossRef] [PubMed]
- Berntson, G.G.; Cacioppo, J.T. Heart rate variability: Stress and psychiatric conditions. In Dynamic Electrocardiography; Blackwell Publishing: Oxford, UK, 2007; pp. 57–64. [Google Scholar]
- Pomeranz, B.; Macaulay, R.J.; Caudill, M.A.; Kutz, I.; Adam, D.; Gordon, D.; Kilborn, K.M.; Barger, A.C.; Shannon, D.C.; Cohen, R.J.; et al. Assessment of autonomic function in humans by heart rate spectral analysis. Am. J. Physiol. Heart Circ. Physiol. 1985, 248, H151–H153. [Google Scholar] [CrossRef] [PubMed]
- Wang, D.; Eckert, J.; Teague, S.; Al-Naji, A.; Haun, D.; Chahl, J. Estimating the Cardiac Signals of Chimpanzees Using a Digital Camera: Validation and Application of a Novel Non-Invasive Method for Primate Research; Springer: Berlin/Heidelberg, Germany, 2023. [Google Scholar]
- Barbosa Pereira, C.; Czaplik, M.; Blazek, V.; Leonhardt, S.; Teichmann, D. Monitoring of Cardiorespiratory Signals Using Thermal Imaging: A Pilot Study on Healthy Human Subjects. Sensors 2018, 18, 1541. [Google Scholar] [CrossRef]
- Almasri, F.; Debeir, O. RGB Guided Thermal Super-Resolution Enhancement. In Proceedings of the 2018 4th International Conference on Cloud Computing Technologies and Applications, Cloudtech 2018, IEEE, Brussels, Belgium, 26–28 November 2018; pp. 1–5. [Google Scholar] [CrossRef]
- Vrochidou, E.; Sidiropoulos, G.K.; Tsimperidis, I.; Ouzounis, A.G.; Sarafis, I.T.; Kalpakis, V.; Stamkos, A.; Papakostas, G.A. Fusion of Thermal and RGB Images for Automated Deep Learning Based Marble Crack Detection. In Proceedings of the 2023 IEEE World AI IoT Congress (AIIoT), IEEE, Seattle, WA, USA, 7–10 June 2023; pp. 243–249. [Google Scholar] [CrossRef]
- Alexander, Q.G.; Hoskere, V.; Narazaki, Y.; Maxwell, A.; Spencer, B.F. Fusion of thermal and RGB images for automated deep learning based crack detection in civil infrastructure. AI Civ. Eng. 2022, 1, 3. [Google Scholar] [CrossRef]
- Brenner, M.; Reyes, N.H.; Susnjak, T.; Barczak, A.L.C. RGB-D and Thermal Sensor Fusion: A Systematic Literature Review. IEEE Access 2023, 11, 82410–82442. [Google Scholar] [CrossRef]
- Suh, M.K. Surgical Anatomy and Physiology of the Nose. In Atlas of Asian Rhinoplasty; Springer: Singapore, 2018; pp. 1–65. [Google Scholar] [CrossRef]
- Lin, T.; Maire, M.; Belongie, S.J.; Hays, J.; Perona, P.; Ramanan, D.; Dollár, P.; Zitnick, C.L. Microsoft COCO: Common Objects in Context. In Lecture Notes in Computer Science; Fleet, D.J., Pajdla, T., Schiele, B., Tuytelaars, T., Eds.; Springer: Berlin/Heidelberg, Germany, 2014; Volume 8693, pp. 740–755. [Google Scholar] [CrossRef]
- Chen, K.; Wang, J.; Pang, J.; Cao, Y.; Xiong, Y.; Li, X.; Sun, S.; Feng, W.; Liu, Z.; Xu, J.; et al. MMDetection: Open MMLab Detection Toolbox and Benchmark. arXiv 2019, arXiv:1906.07155. [Google Scholar]
- Contributors, M. OpenMMLab Pose Estimation Toolbox and Benchmark. 2020. Available online: https://github.com/open-mmlab/mmpose (accessed on 11 March 2024).
- Sun, K.; Xiao, B.; Liu, D.; Wang, J. Deep High-Resolution Representation Learning for Human Pose Estimation. In Proceedings of the CVPR, Long Beach, CA, USA, 15–20 June 2019. [Google Scholar]
- Wang, J.; Sun, K.; Cheng, T.; Jiang, B.; Deng, C.; Zhao, Y.; Liu, D.; Mu, Y.; Tan, M.; Wang, X.; et al. Deep High-Resolution Representation Learning for Visual Recognition. IEEE Trans. Pattern Anal. Mach. Intell. 2019, 43, 3349–3364. [Google Scholar] [CrossRef]
- Koestinger, M.; Wohlhart, P.; Roth, P.M.; Bischof, H. Annotated Facial Landmarks in the Wild: A Large-scale, Real-world Database for Facial Landmark Localization. In Proceedings of the 2011 IEEE International Conference on Computer Vision Workshops (ICCV Workshops), Barcelona, Spain, 6–13 November 2011. [Google Scholar]
- Bazarevsky, V.; Kartynnik, Y.; Vakunov, A.; Raveendran, K.; Grundmann, M. BlazeFace: Sub-millisecond Neural Face Detection on Mobile GPUs. arXiv 2019, arXiv:abs/1907.05047. [Google Scholar]
- Kartynnik, Y.; Ablavatski, A.; Grishchenko, I.; Grundmann, M. Real-time Facial Surface Geometry from Monocular Video on Mobile GPUs. arXiv 2019, arXiv:abs/1907.06724. [Google Scholar]
- Iwata, I.; Sakamoto, T.; Matsumoto, T.; Hirata, S. Noncontact Measurement of Heartbeat of Humans and Chimpanzees Using Millimeter-Wave Radar with Topology Method. IEEE Sens. Lett. 2023, 7, 1–4. [Google Scholar] [CrossRef]
Figure 1.
Sample from the ApeTI dataset with the thermal colorbar and annotations.

Figure 2.
Landmark computation pipeline: face detection followed by a CNN encoding the position of the landmarks in its final layer’s channels. The landmark model features of the first and last convolutional layers are depicted.
Figure 2.
Landmark computation pipeline: face detection followed by a CNN encoding the position of the landmarks in its final layer’s channels. The landmark model features of the first and last convolutional layers are depicted.

Figure 3.
Resulting binary images of the Thresh method for segmenting the face. In green, the biggest contour, and in blue and red, its resulting convex contour and bounding box.
Figure 3.
Resulting binary images of the Thresh method for segmenting the face. In green, the biggest contour, and in blue and red, its resulting convex contour and bounding box.

Figure 4.
Face detection results with variable threshold using the combination of BlazeFace and Threshold on the joint train and validation sets. A brighter color stands for a higher score.
Figure 4.
Face detection results with variable threshold using the combination of BlazeFace and Threshold on the joint train and validation sets. A brighter color stands for a higher score.

Figure 5.
Landmark regression results with variable threshold (first row) and variable calibration (second row) using the combination of the BlazeFace, Threshold, and FaceMesh methods on the joint train and validation sets. For the second row, a brighter color stands for a higher score.
Figure 5.
Landmark regression results with variable threshold (first row) and variable calibration (second row) using the combination of the BlazeFace, Threshold, and FaceMesh methods on the joint train and validation sets. For the second row, a brighter color stands for a higher score.

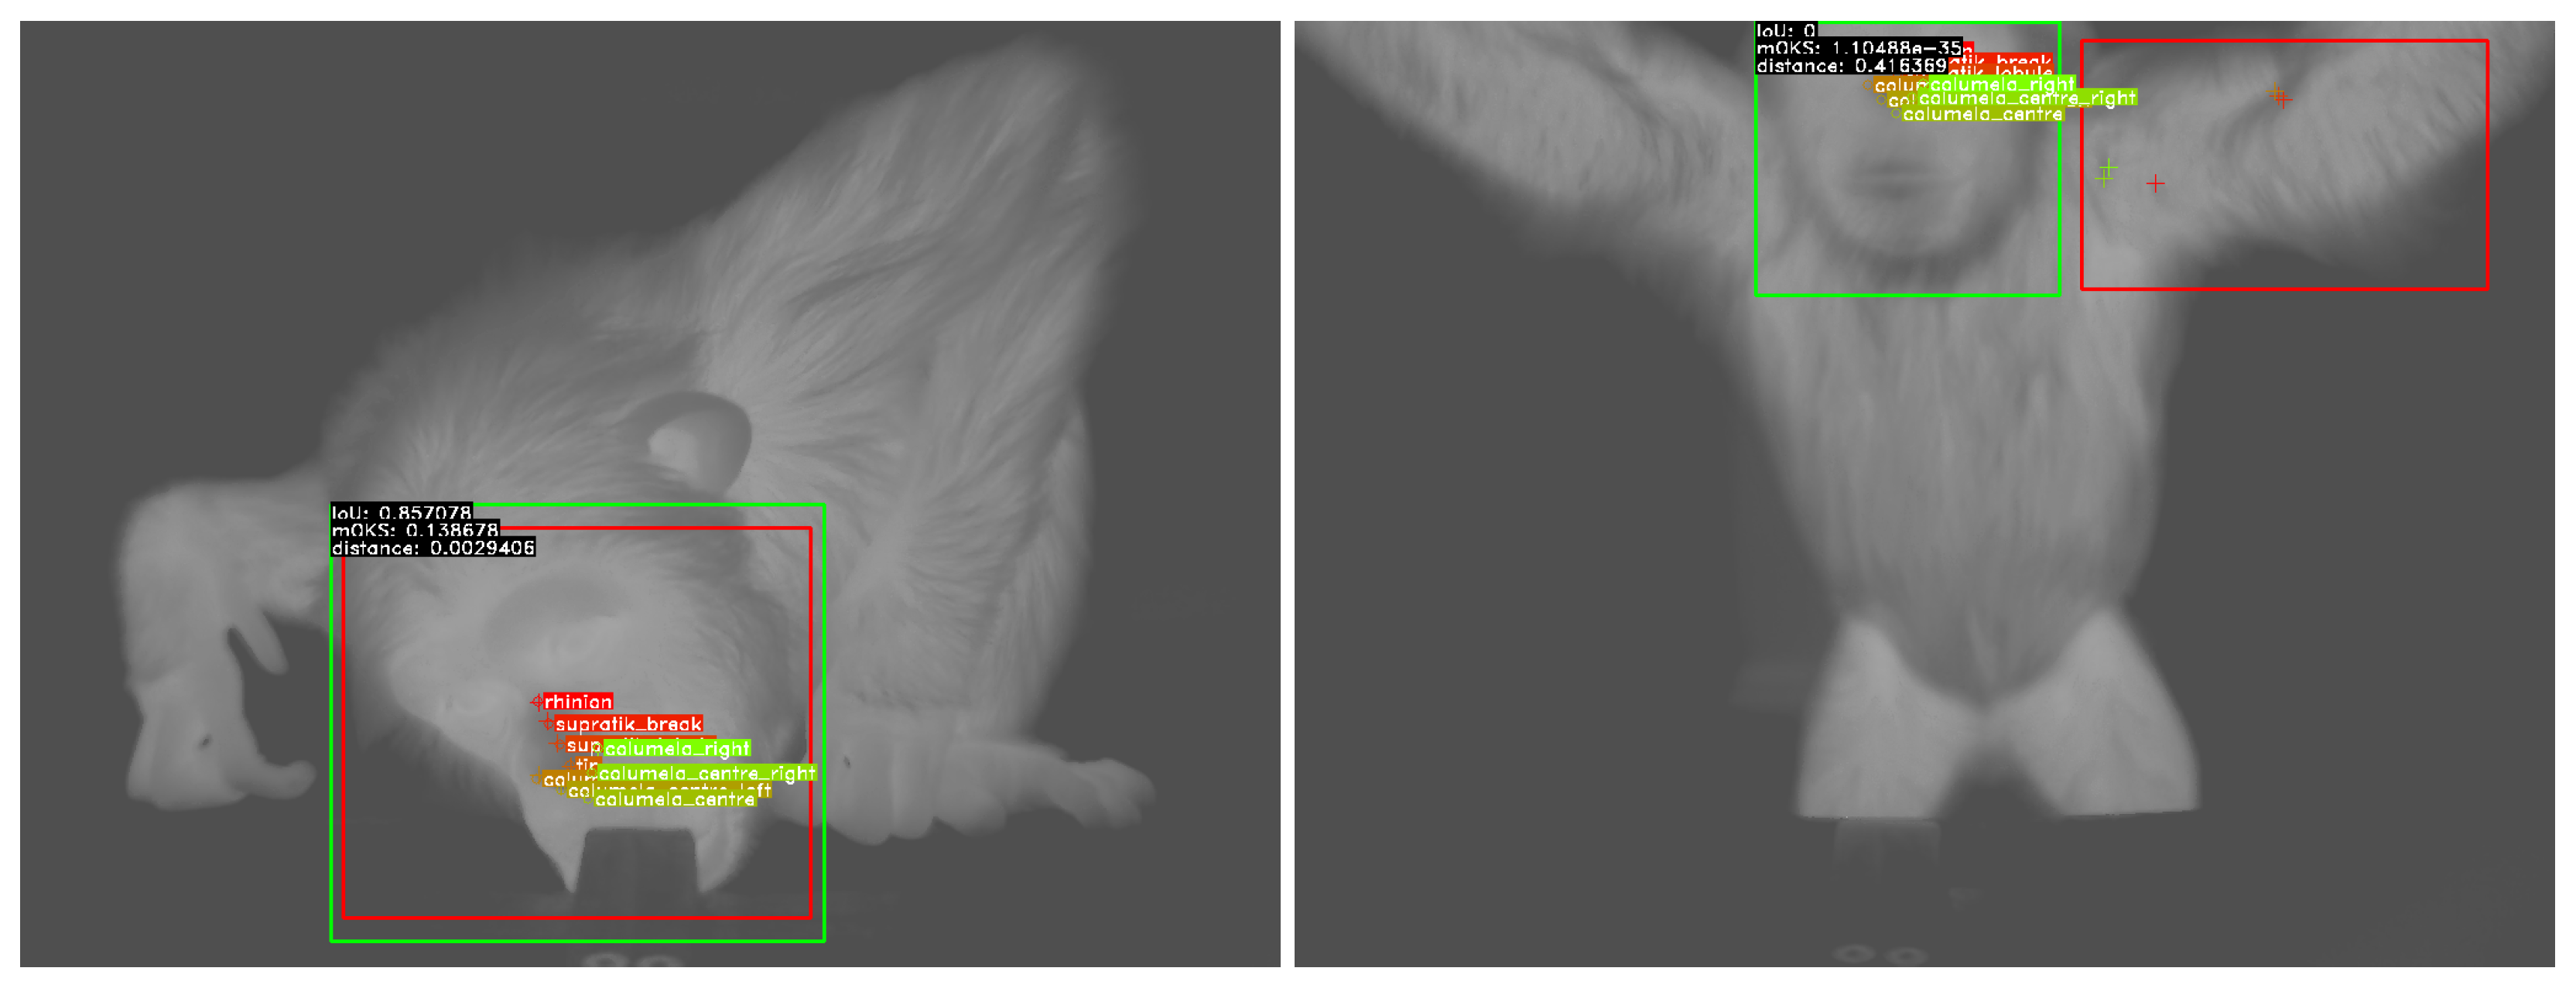
Figure 6.
Good (left) and bad (right) inference examples with their ground truth from the combination of the Tifa and Tina models. Ground truth is annotated in green (face) and circles (landmarks) and inference in red (face) and crosses. Thermal information is encoded using a grayscale colormap for better annotation visualization: brighter being warmer.

Figure 7.
Scheme of the apparatus with a chimpanzee in a testing context.

Figure 8.
Landmark computation, time series observation, and physiological signal retrieval with the chimpanzee Zira.
Figure 8.
Landmark computation, time series observation, and physiological signal retrieval with the chimpanzee Zira.

Figure 9.
An attempt of biosignal retrieval from a thermal video with a human face using BlazeFace [32] and FaceMesh [33] for segmentation.


Table 1.
Face detection mAP score across the different ApeTI sets.
| Method | Train | Validation | Test | Overall |
|---|---|---|---|---|
| 0.692 | 0.7 | 0.7 | 0.693 | |
| 0.692 | 0.7 | 0.7 | 0.693 | |
| Tifa | 0.550 | 0.685 | 0.744 | 0.622 |
| no ROI | 0 | 0 | 0 | 0 |
| Thresh35.6 | 0.001 | 0 | 0 | 0.001 |
| BlazeFace | 0.024 | 0.017 | 0.007 | 0.017 |
| Thresh36.5 + BlazeFace | 0.155 | 0.155 | 0.136 | 0.155 |
Table 2.
Face detection results on the ApeTI test set.
| Method | mAP | AP 50 | AP 75 | mIoU |
|---|---|---|---|---|
| 0.7 | 1 | 1 | 0.836 | |
| 0.7 | 1 | 1 | 0.821 | |
| Tifa | 0.744 | 0.980 | 0.902 | 0.868 |
| no ROI | 0 | 0 | 0 | 0.128 |
| Thresh35.6 | 0 | 0 | 0 | 0.183 |
| BlazeFace | 0.007 | 0.037 | 0 | 0.398 |
| Thresh36.5 + BlazeFace | 0.136 | 0.512 | 0.025 | 0.576 |
Table 3.
Landmark regression mAP score across the different ApeTI sets.
| Method | Train | Validation | Test | Overall |
|---|---|---|---|---|
| GT + Tina | 0.940 | 1 | 0.989 | 0.965 |
| + Tina | 0.957 | 1 | 0.989 | 0.971 |
| + Tina | 0.926 | 0.993 | 0.995 | 0.956 |
| no ROI + Tina | 0.926 | 1 | 0.987 | 0.953 |
| Thresh29.8 + Tina | 0.965 | 1 | 0.989 | 0.981 |
| Tifa + Tina | 0.919 | 0.990 | 0.980 | 0.950 |
| + Tina | 0.949 | 0.999 | 0.980 | 0.968 |
| + Tina | 0.903 | 0.978 | 0.980 | 0.939 |
| Thresh29.8 + Tifa + Tina | 0.919 | 0.990 | 0.952 | 0.950 |
| BlazeFace + FaceMesh | 0.312 | 0.363 | 0.336 | 0.336 |
| Thresh36.5 + BlazeFace + FaceMesh | 0.557 | 0.557 | 0.566 | 0.557 |
Table 4.
Landmark regression results on the ApeTI test set.
| Method | mAP | AP 50 | AP 75 | mOKS |
|---|---|---|---|---|
| GT + Tina | 0.989 | 0.989 | 0.989 | 0.524 |
| + Tina | 0.989 | 0.989 | 0.989 | 0.523 |
| + Tina | 0.995 | 1 | 1 | 0.524 |
| no ROI + Tina | 0.987 | 0.988 | 0.988 | 0.532 |
| Thresh29.8 + Tina | 0.989 | 0.990 | 0.990 | 0.532 |
| Tifa + Tina | 0.980 | 0.980 | 0.980 | 0.524 |
| + Tina | 0.980 | 0.980 | 0.980 | 0.523 |
| + Tina | 0.980 | 0.980 | 0.980 | 0.524 |
| Thresh29.8 + Tifa + Tina | 0.952 | 0.953 | 0.953 | 0.518 |
| BlazeFace + FaceMesh | 0.336 | 0.652 | 0.312 | 0.398 |
| Thresh36.5 + BlazeFace + FaceMesh | 0.566 | 0.819 | 0.617 | 0.41 |
Disclaimer/Publisher’s Note: The statements, opinions and data contained in all publications are solely those of the individual author(s) and contributor(s) and not of MDPI and/or the editor(s). MDPI and/or the editor(s) disclaim responsibility for any injury to people or property resulting from any ideas, methods, instructions or products referred to in the content. |
© 2024 by the author. Licensee MDPI, Basel, Switzerland. This article is an open access article distributed under the terms and conditions of the Creative Commons Attribution (CC BY) license (https://creativecommons.org/licenses/by/4.0/).
Share and Cite
MDPI and ACS Style
Martin, P.-E. ApeTI: A Thermal Image Dataset for Face and Nose Segmentation with Apes. Signals 2024, 5, 147-164. https://doi.org/10.3390/signals5010008
AMA Style
Martin P-E. ApeTI: A Thermal Image Dataset for Face and Nose Segmentation with Apes. Signals. 2024; 5(1):147-164. https://doi.org/10.3390/signals5010008
Chicago/Turabian StyleMartin, Pierre-Etienne. 2024. "ApeTI: A Thermal Image Dataset for Face and Nose Segmentation with Apes" Signals 5, no. 1: 147-164. https://doi.org/10.3390/signals5010008