Article

Recording, Processing, and Reproduction of Vibrations Produced by Impact Noise Sources in Buildings †

1
IBO—Austrian Institute for Building and Ecology, Alserbachstraße 5/8, 1090 Vienna, Austria
2
Research Division for Building Physics, Technische Universität Wien, Karlsplatz, 1040 Vienna, Austria
3
InnoRenow CoE, Livade 6a, 6310 Izola, Slovenia
4
Faculty of Mathematics, Natural Sciences and Information Technologies, University of Primorska, Glagoljaška 8, 6000 Koper, Slovenia
*
Author to whom correspondence should be addressed.
Portions of this study were presented in “The design of an impact sound vibration exposure device”. In Proceedings of Forum Acusticum, Torino, Italy, September 2023.
Acoustics 2024, 6(1), 97-113; https://doi.org/10.3390/acoustics6010006
Submission received: 3 December 2023 / Revised: 4 January 2024 / Accepted: 12 January 2024 / Published: 17 January 2024
(This article belongs to the Special Issue Building Materials and Acoustics)

Abstract

:
Several studies on the perception of impact sounds question the correlation of standardized approaches with perceived annoyance, while more recent studies have come to inconsistent conclusions. All these studies neglected the aspect of whole-body vibrations, which are known to be relevant for the perception of low-frequency sound and can be perceived especially in lightweight constructions. Basically, the contribution of vibrations to impact sound annoyance is still unknown and could be the reason for the contradictory results. To investigate this aspect, we measured vibrations on different types of floors under laboratory conditions and in situ. For this purpose, a vibration-sensing device was developed to record vibrations more cost-effectively and independently of commercial recording instruments. The vibrations of predefined impact sequences were recorded together with the sound field using a higher-order ambisonics microphone. In addition, a vibration exposure device was developed to expose the test objects to the exact vibrations that occur in the built environment. The vibration exposure device is integrated into the ambisonics reproduction system, which consists of a large number of loudspeakers in a spherical configuration. The article presents the development and performance achieved using the vibration-sensing unit and the vibration exposure device. The study is relevant for conducting future impact sound listening tests under laboratory conditions, which can be extended to include the reproduction of vibrations.

1. Introduction

Acoustic comfort evaluations combined with subjective response tests in laboratories have already been carried out in various institutions [1]. As a rule, these tests focus exclusively on the sound stimulus, while the exposure of the test subjects to vibrations is disregarded. Nevertheless, vibrations in buildings are not only disturbing for sensitive equipment in laboratories but can also cause annoyance and should, therefore, be taken into account in the structural design and interior design of buildings [2,3]. Lightweight structures, such as timber buildings, pose a particular challenge for the treatment of vibrations caused by impact sources, as described in [4]. Therefore, Eurocode 5 [5] already provides guidance on how to keep low-frequency vibrations within a range that does not disturb the users of a building. This guidance contains important rules for dealing with unpleasant vibrations of the excited floor structure but does not take into account the transmission of structure-borne sound or the perception of vibrations in adjacent rooms.
The research project focuses on a holistic perception of impact noise in buildings, which includes the reproduction of sound and vibration. For the reproduction part, some technical aspects of the design of the vibration exposure device have already been presented. This paper presents the entire chain of vibration recording and reproduction, including the evaluation of the solutions developed and their integration into the ambisonics listening setup.
Impact noise in buildings has already been investigated in several research projects that included listening tests [1], with the result that impact sound can be a significant annoyance for building users [6]. Another well-studied topic is the correlation of noise annoyance levels with Single-Number Quantities (SNQs). Several research studies have concluded that the standardized SNQs commonly used in Europe (Ln,w or LnT,w) do not correlate satisfactorily [1,7,8,9] with the annoyance level of the occupants. This has already led to several proposals for new SNQs, especially for lightweight buildings [7,9]. Recent research, on the other hand, shows a high correlation between the standard SNQs of standard impact sources and the energy-based noise ratings generated by real-world impact sources such as a walking adult [10]. Even the previously unanimously rejected Ln,w has recently been considered relevant for the characterization of low-frequency impact noise in lightweight structures [11]. Recent disagreements have also been noted by Geluykens, who concluded in [12] that the results of sound perception studies are highly dependent on the sound stimuli used.
Although it is known from [4] that vibrations caused by impact noise sources are a significant problem in lightweight buildings, studies have never included vibrations in the design of laboratory listening tests. The perception of vibrations is also part of our daily experience when strong impacts occur, such as running down the stairs, slamming doors, etc. The aim of this study is to develop a vibration reproduction system that accurately reproduces, under laboratory conditions, the vibrations previously recorded in the built environment. This will make it possible to extend the listening tests carried out in the ambisonics listening environment to include the exposure of test subjects to vibrations. Indeed, the combined effect of sound and vibration stimuli can have a significant impact on the holistic perception of real-life scenarios.
Sound and vibrations are recorded simultaneously in the impact sound insulation testing facilities at TU Wien (laboratory recordings) and in various buildings in Vienna (in situ recordings). Different types of floor constructions made of different materials are examined. To evaluate the performance of the recording method, different types of microphones (class 1 free-field microphone, low-noise microphone, fourth- and first-order ambisonics microphones) and different types of accelerometers (analog piezo accelerometers, piezoelectric accelerometers, and digital capacitor accelerometers) were used. The recording procedure was predefined and was consistently followed for all measurements. To achieve the required repeatability of the impact sound source used for recording, the same 70 kg person was made to walk with and without shoes at a speed of 80 and 100 steps per minute. A recording was also made with the standardized tapping machine used as the impact sound source. Recordings were made at three positions in the room below the excited floor using the four different microphone types at each position. The accelerometers were positioned on the floor of the receiving room for in situ recordings, while they were mounted on the ceiling of the receiving room for laboratory recordings. The reason for mounting the accelerometers on the ceiling was the largely limited transmission of vibrations to the floor of the receiving room, which is due to the specific design of the laboratory test facility. In addition, a standardized measurement of the impact sound pressure level is performed in order to have the possibility of characterizing the floor according to the current standardized SNQs. This will later open up the possibility of investigating correlations between the SNQs and the annoyance ratings acquired through listening tests.

2. Instruments and Methods of Recording, Processing, and Reproducing Vibrations

In order to reproduce vibrations under laboratory conditions, the vibrations must be properly recorded, processed, and reproduced. In this section, each of these relevant steps is presented in a separate section.

2.1. Vibration Recording

2.1.1. Accelerometer Selection

When recording vibrations, the choice of the accelerometer is important from various points of view, e.g., the expected dynamic and frequency measurement range, the mass, and other technical features of the accelerometer. There are several ways to categorize the accelerometers available on the market. Considering their operating principle, there are 3 main types of accelerometers, which are listed in Table A1 [13,14,15] together with their specific characteristics. For piezoelectric accelerometers, it is also possible to further categorize them depending on how the generated signal is used at the output, which is summarized in Table A2 [13,16].
Piezoelectric accelerometers in voltage mode often implement the IEPE standard (Integrated Electronics Piezo Electric). In this case, the acquisition module supplies the accelerometer with a constant current, while the accelerometer itself generates a DC bias voltage and an AC voltage representing the acquired acceleration. Both are transmitted via the same cable, which requires an inexpensive standard coaxial cable. The DC bias voltage can easily be filtered out with a capacitor so that only the vibration signal remains at the acquisition unit. The constant current is usually set in the range of 2 to 20 mA. Although a higher current improves the frequency performance and increases the usable cable length, it also increases the power consumption and causes the sensor to heat up. In such a design, due to the application of a constant current, cable faults can be detected using the bias voltage, with a bias voltage close to the supply voltage indicating a cable break or a missing sensor, while a bias voltage close to the low saturation voltage indicates a short circuit in the transmission. Regardless of the sensor principle used, the measurement data can be retrieved in analog or digital form. The differences between the two data forms are highlighted in Table A3 [17,18].
Commercially available vibration measuring devices are complete measuring systems consisting of an accelerometer, acquisition, and storage modules. Such systems provide accurate results and are easy to use for the specific measurement tasks for which they were developed.
Such systems can be very expensive, with the disadvantage of their lack of measurement flexibility being even more significant. It is common for software to limit control over measurement and data management. In addition, the small number of supported recording channels is a very common hardware limitation. To overcome these problems, our design used an easily accessible, off-the-shelf accelerometer. Furthermore, the design envisaged that the hardware components could be easily modified and extended to record a large number of channels simultaneously.
Since human sensitivity to vibrations is highest at frequencies below 100 Hz, as mentioned in [19], this frequency can also be considered the required upper operating frequency range of the accelerometer. As it turns out, this is not a challenging technical requirement, given the operating bandwidths of most commercial accelerometers. On the other hand, with regard to the lower operating frequency, it makes sense to record as low frequencies as possible.
With these requirements in mind, a capacitive MEMS accelerometer with digital output, the ADXL355 from analog devices, was used in the first version of the vibration sensing device. The ADXL355 is capable of measuring acceleration in all 3 dimensions (x, y, and z), but—as explained in the following section—the sensitivity of the accelerometer was not sufficient. Therefore, a piezoelectric accelerometer, VSU TE 805-0050-01, was used for the final version of the vibration sensing device.

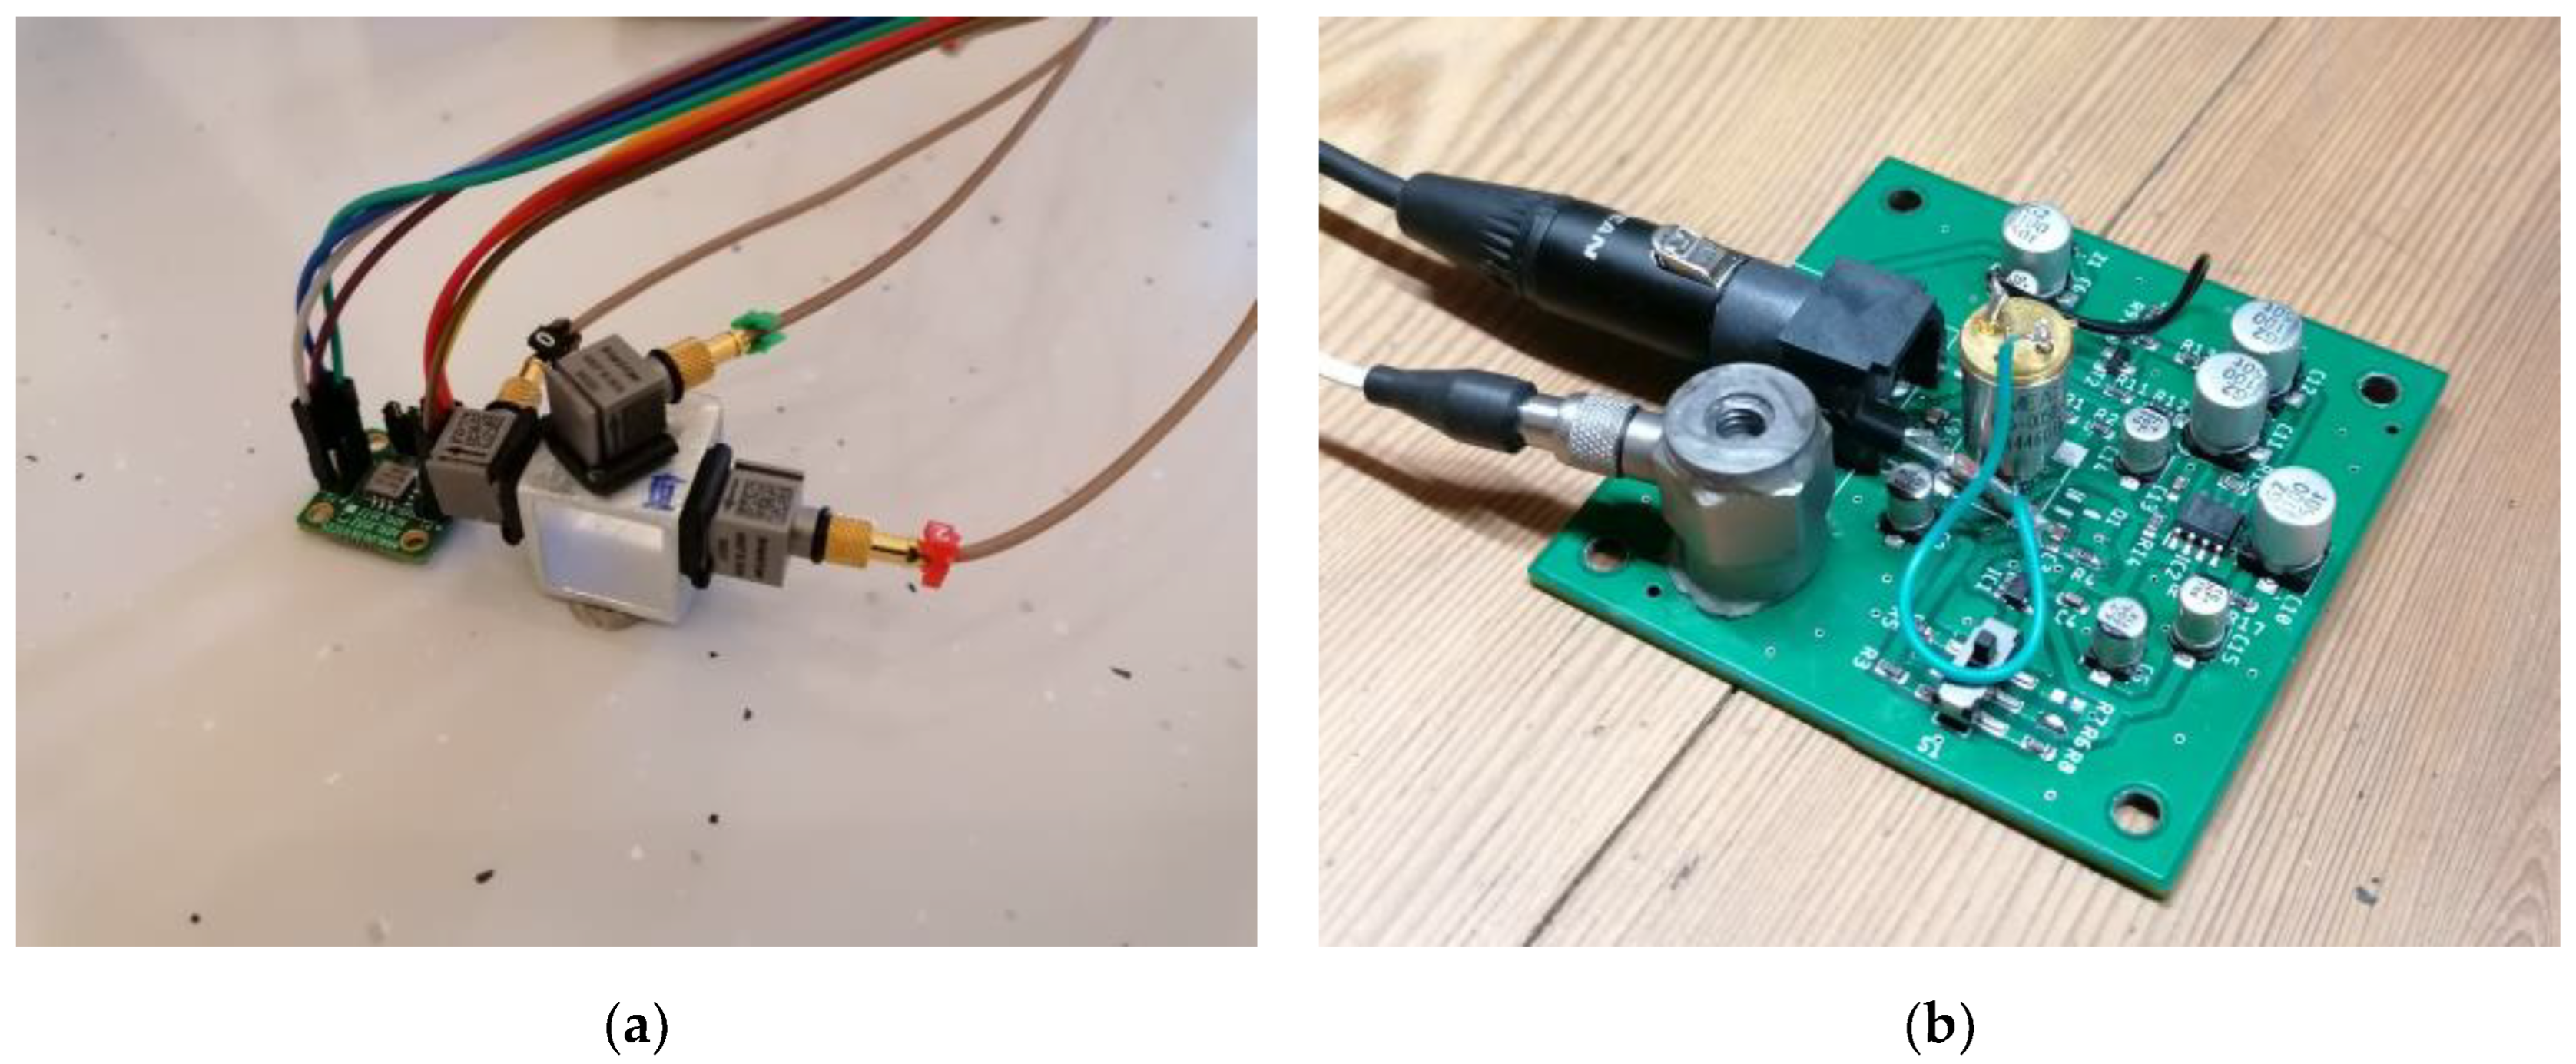
2.1.2. The Design and Initial Experimental Validation

The ADXL355 capacitive MEMS accelerometer was part of a development board, with the sensor already soldered to a circuit board. The board also contained some passive components and pins for the wiring. Communication with the sensor was controlled using an STM32 microcontroller (Nucleo-F334R8 board). The accelerometer was configured via an SPI (Serial Peripheral Interface) bus, and the measured values were transmitted via a UART (Universal Asynchronous Receiver Transmitter) protocol to a PC, where they were processed and stored.
A validation measurement was performed by placing the ADXL355 and a system of 3 single-axis low-noise piezoelectric accelerometers, which served as a reference, side by side on the floor (see Figure 1). For 30 s, the floor was left unexcited, and the background noise was recorded while a person walked near the accelerometers for the following 30 s. When comparing the ADXL355 with the reference accelerometer recordings (Figure 2), it is clear that the SNR of the ADXL355 is too low, as none of the peaks caused by foot impacts are visible. Furthermore, a high level of inherent noise can be recognized. This leads to the conclusion that the sensitivity of the ADXL355 is not sufficient for the intended use.
Another aspect to consider is the data transmission protocol. In digital data transmission, the clock frequency of the bus determines the upper acquisition number, which also depends on the measurement bandwidth. Furthermore, when using the SPI bus, the wiring complexity increases with each additional accelerometer. This can be avoided by using the I2C (inter-integrated circuit) bus, but usually, the accelerometers themselves only provide one or two different addresses, so an address extender is required in this case.
Due to the insufficient sensitivity of the ADXL355-based design, a piezoelectric accelerometer was used in the next step, as such accelerometers are known to provide higher sensitivity. In addition, it was found in [19] that for impact noise in buildings, the vibrations in the vertical (z) direction in the frequency range below 100 Hz are at least 10 dB higher than those in the horizontal direction (x and y). Therefore, only the vibrations in the vertical direction of the sample need to be recorded, making the low-noise piezoelectric accelerometer a sensible choice.
Among affordable piezoelectric accelerometers, only those with an analog output are readily available. Therefore, the addition of an AD converter is required, for which a standard audio interface is used. In this way, it is practical and affordable to increase the number of channels if required. Symmetric wiring is used in the form of an XLR cable, which can be shielded and largely limits electromagnetic interference. Another addition that the design requires is a circuit that converts the accelerometer’s output signals to a symmetric type. On the other hand, such a design has the advantage that it is possible to power the accelerometers via phantom power, which is commonly used for the same purpose as microphones.
Although the required use of an audio interface increases the cost of the system, it is important to consider that with a high number of channels required, the cost per channel is relatively low as audio interfaces are now widely available and accessible. Furthermore, the number of channels can easily be increased as many audio interfaces offer different types of synchronization.
Based on these considerations, a VSU (vibration-sensing unit) was developed consisting of a piezoelectric accelerometer, the TE 805-0050-01, a buffer amplifier, a constant current source, a circuit to convert the IEPE (Integrated Electronics Piezo-Electric) output to a symmetric signal, and a circuit to use the phantom power of the audio interface as a power supply. The accelerometer and all circuitry are on one board, together with a mini XLR connector that connects the VSU to the microphone input of the audio interface via a shielded XLR cable. The measurement of the VSU board, together with a standard accelerometer, is shown in Figure 1.
Data acquisition from the VSU can be performed with any suitable audio recording software or other software that can communicate with audio interfaces. In our case, Matlab was used to retrieve the measured data and then save it in the form of a .csv file. The measurement data in such a form can be used later with a high degree of interoperability.

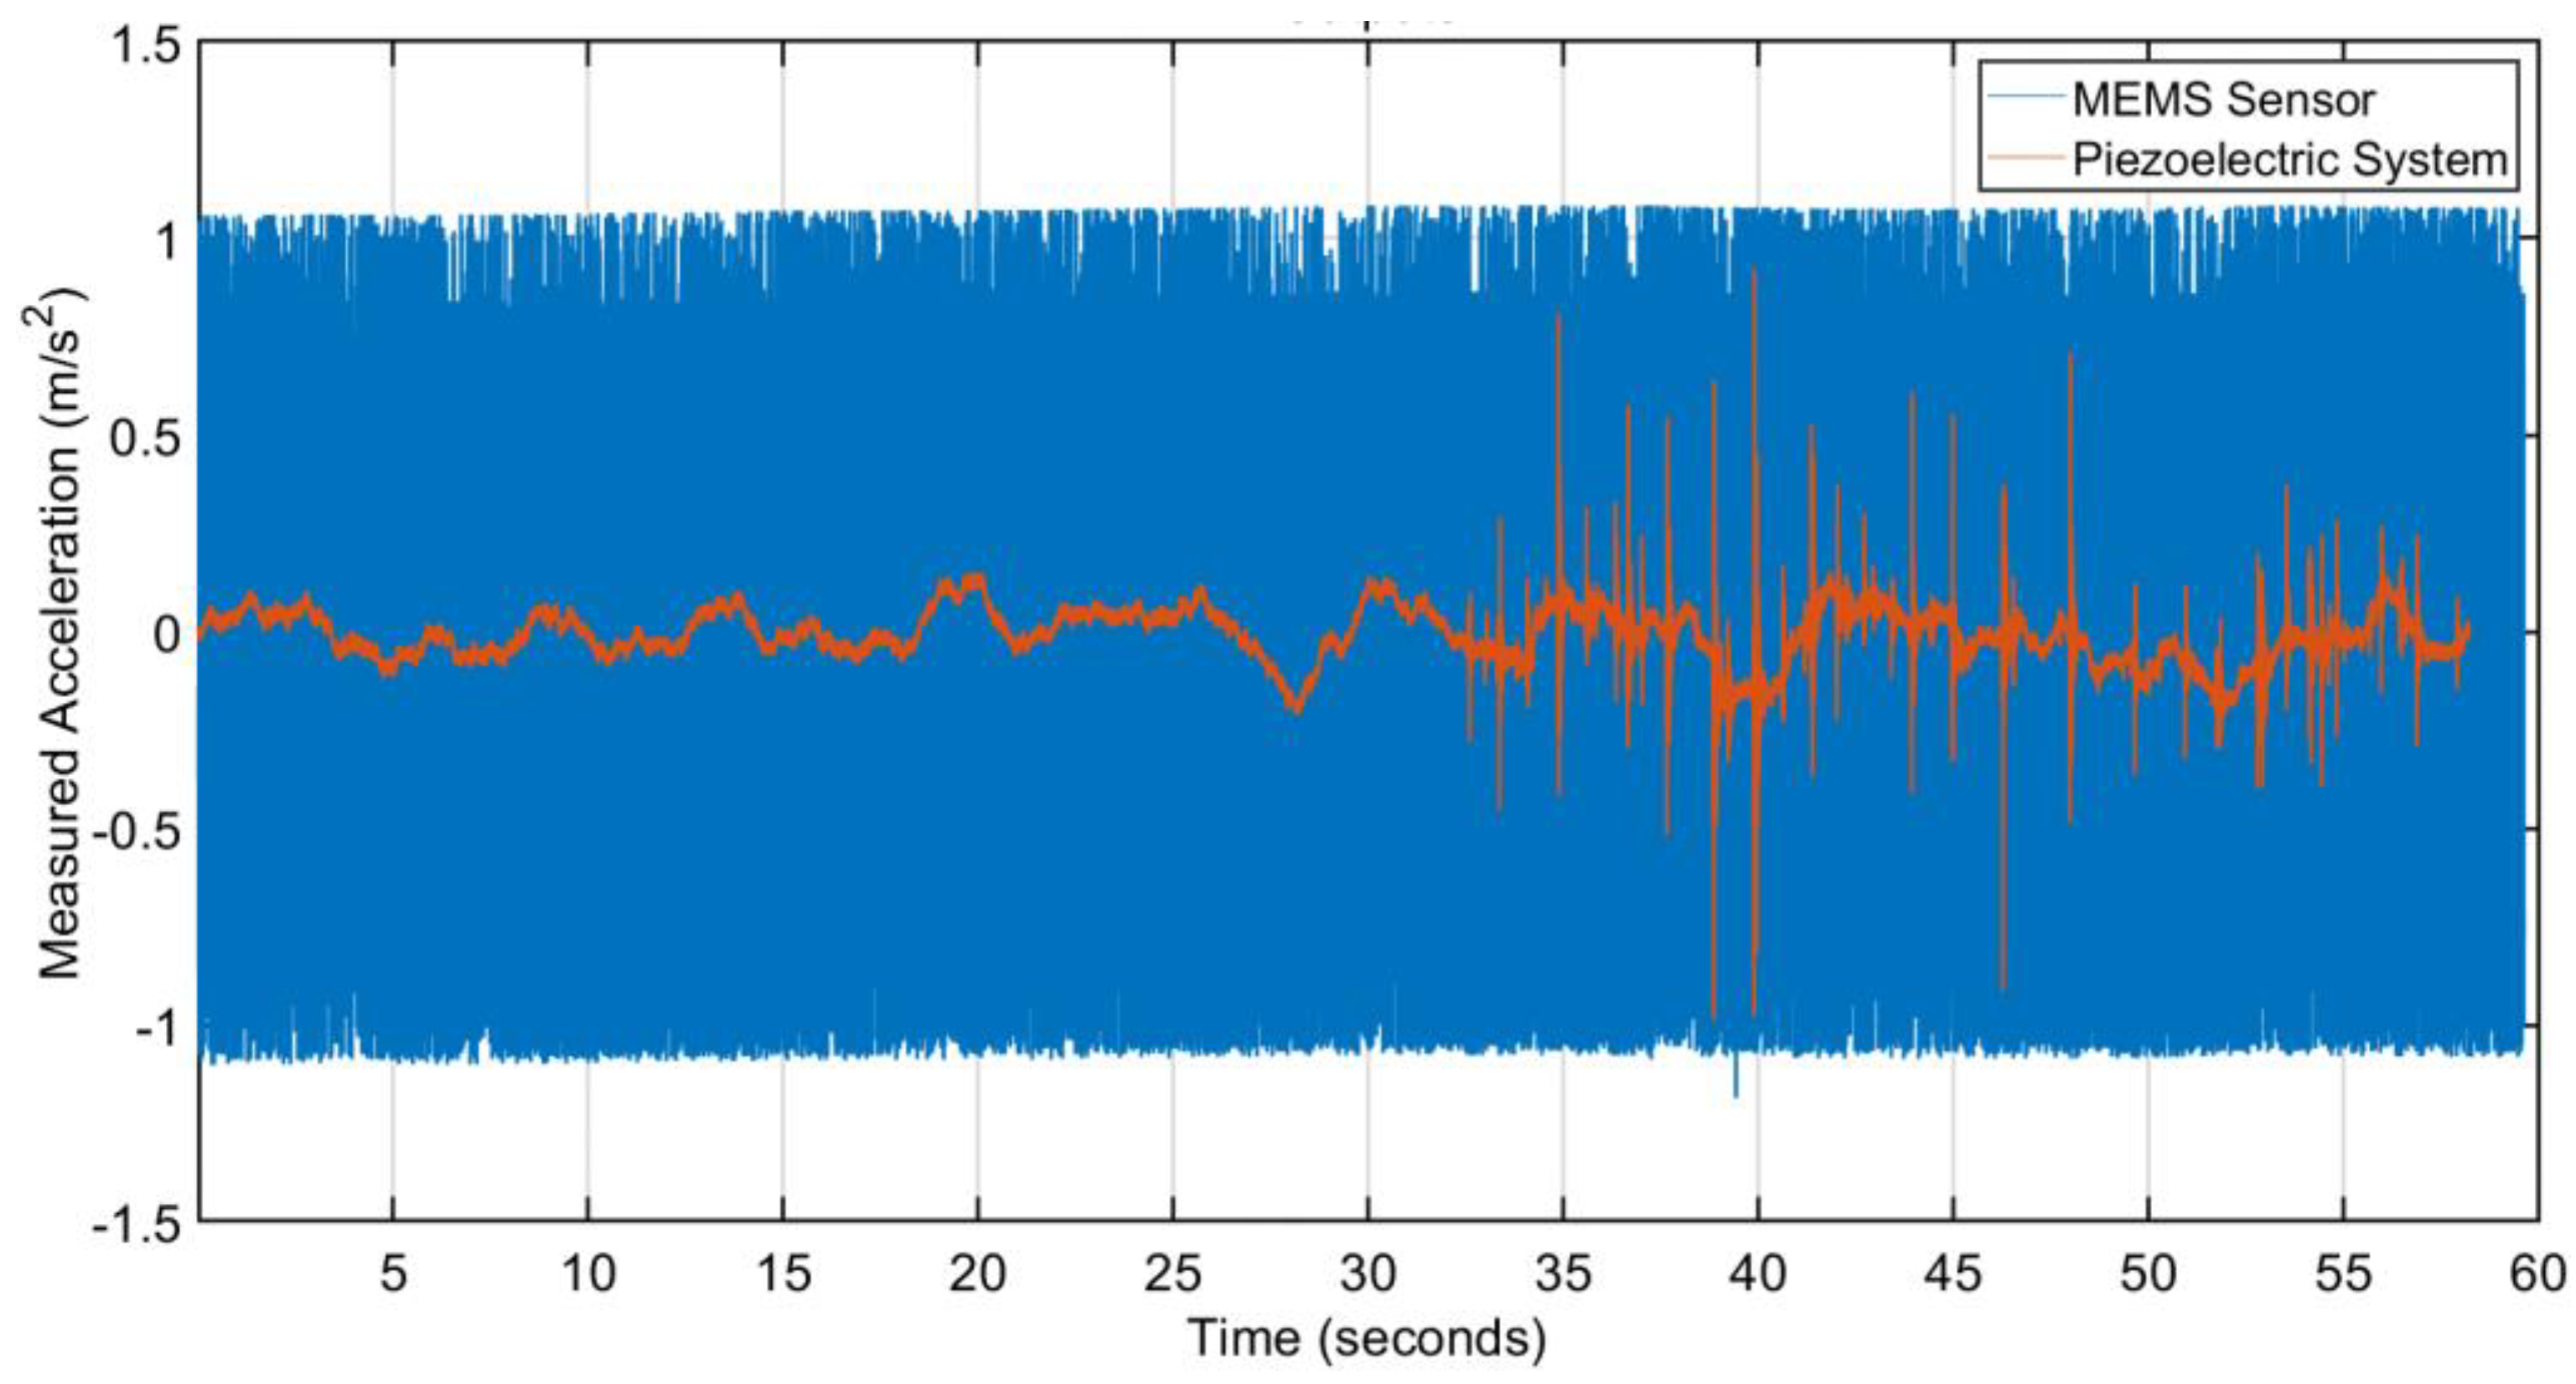
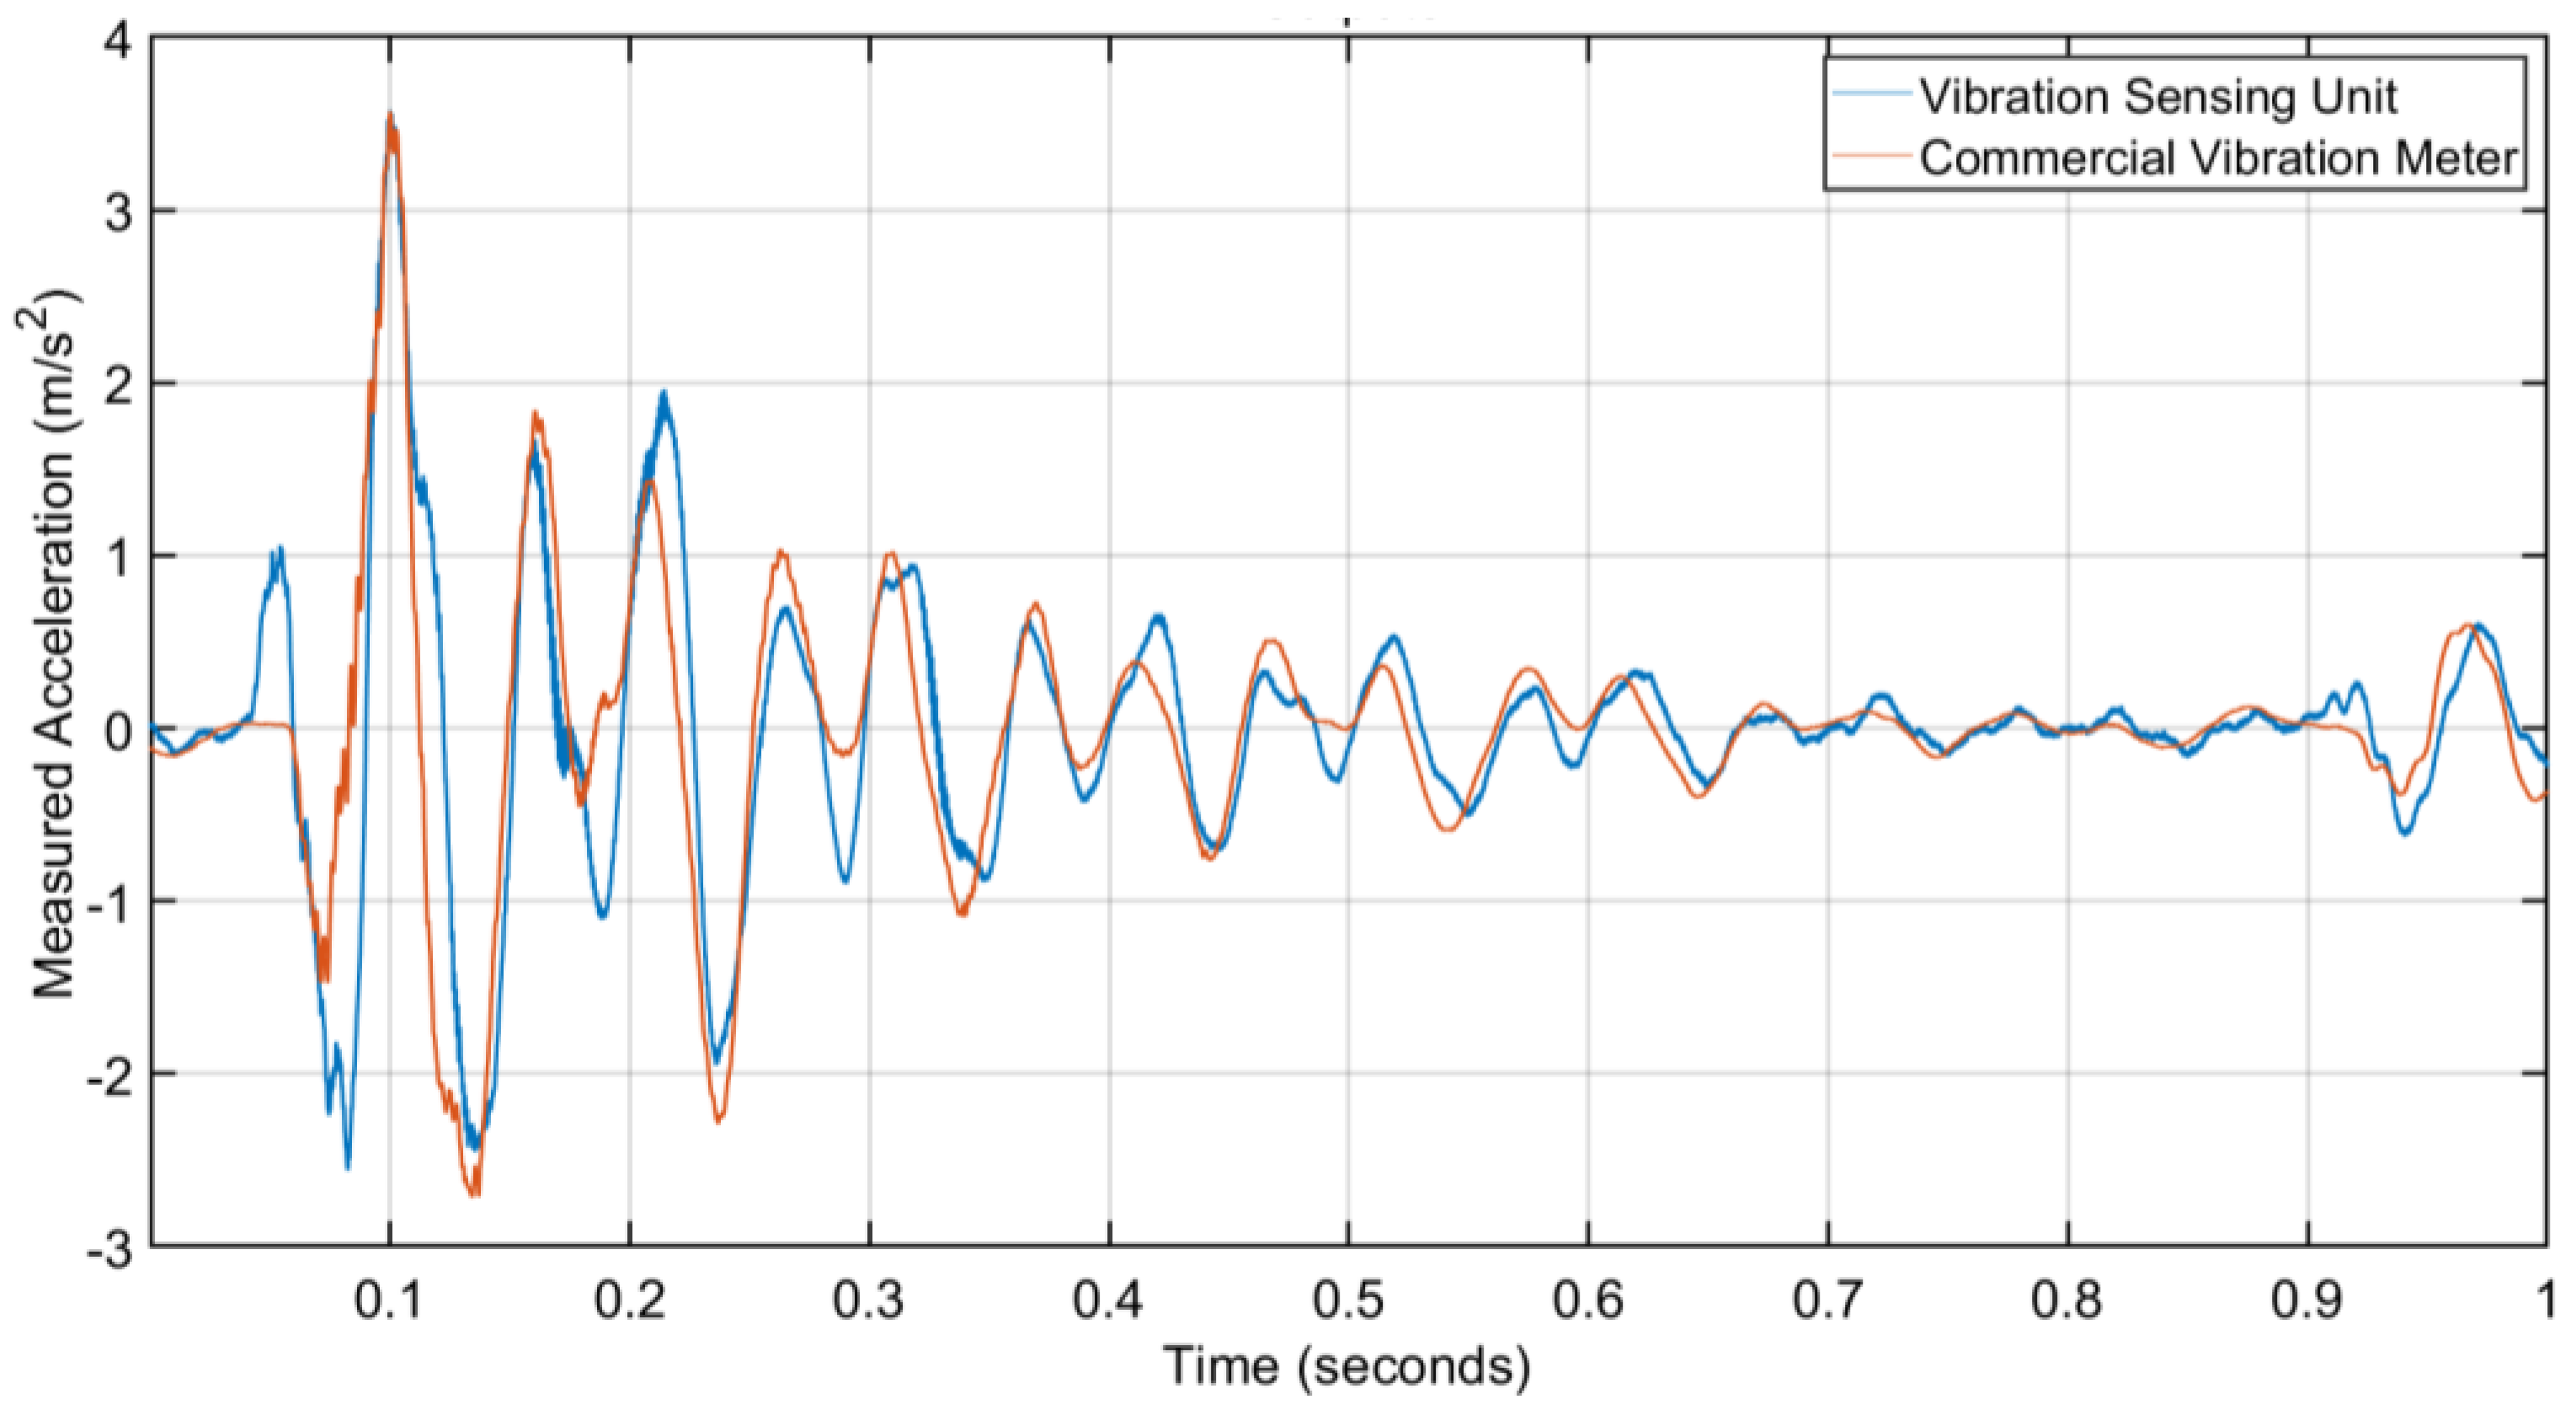
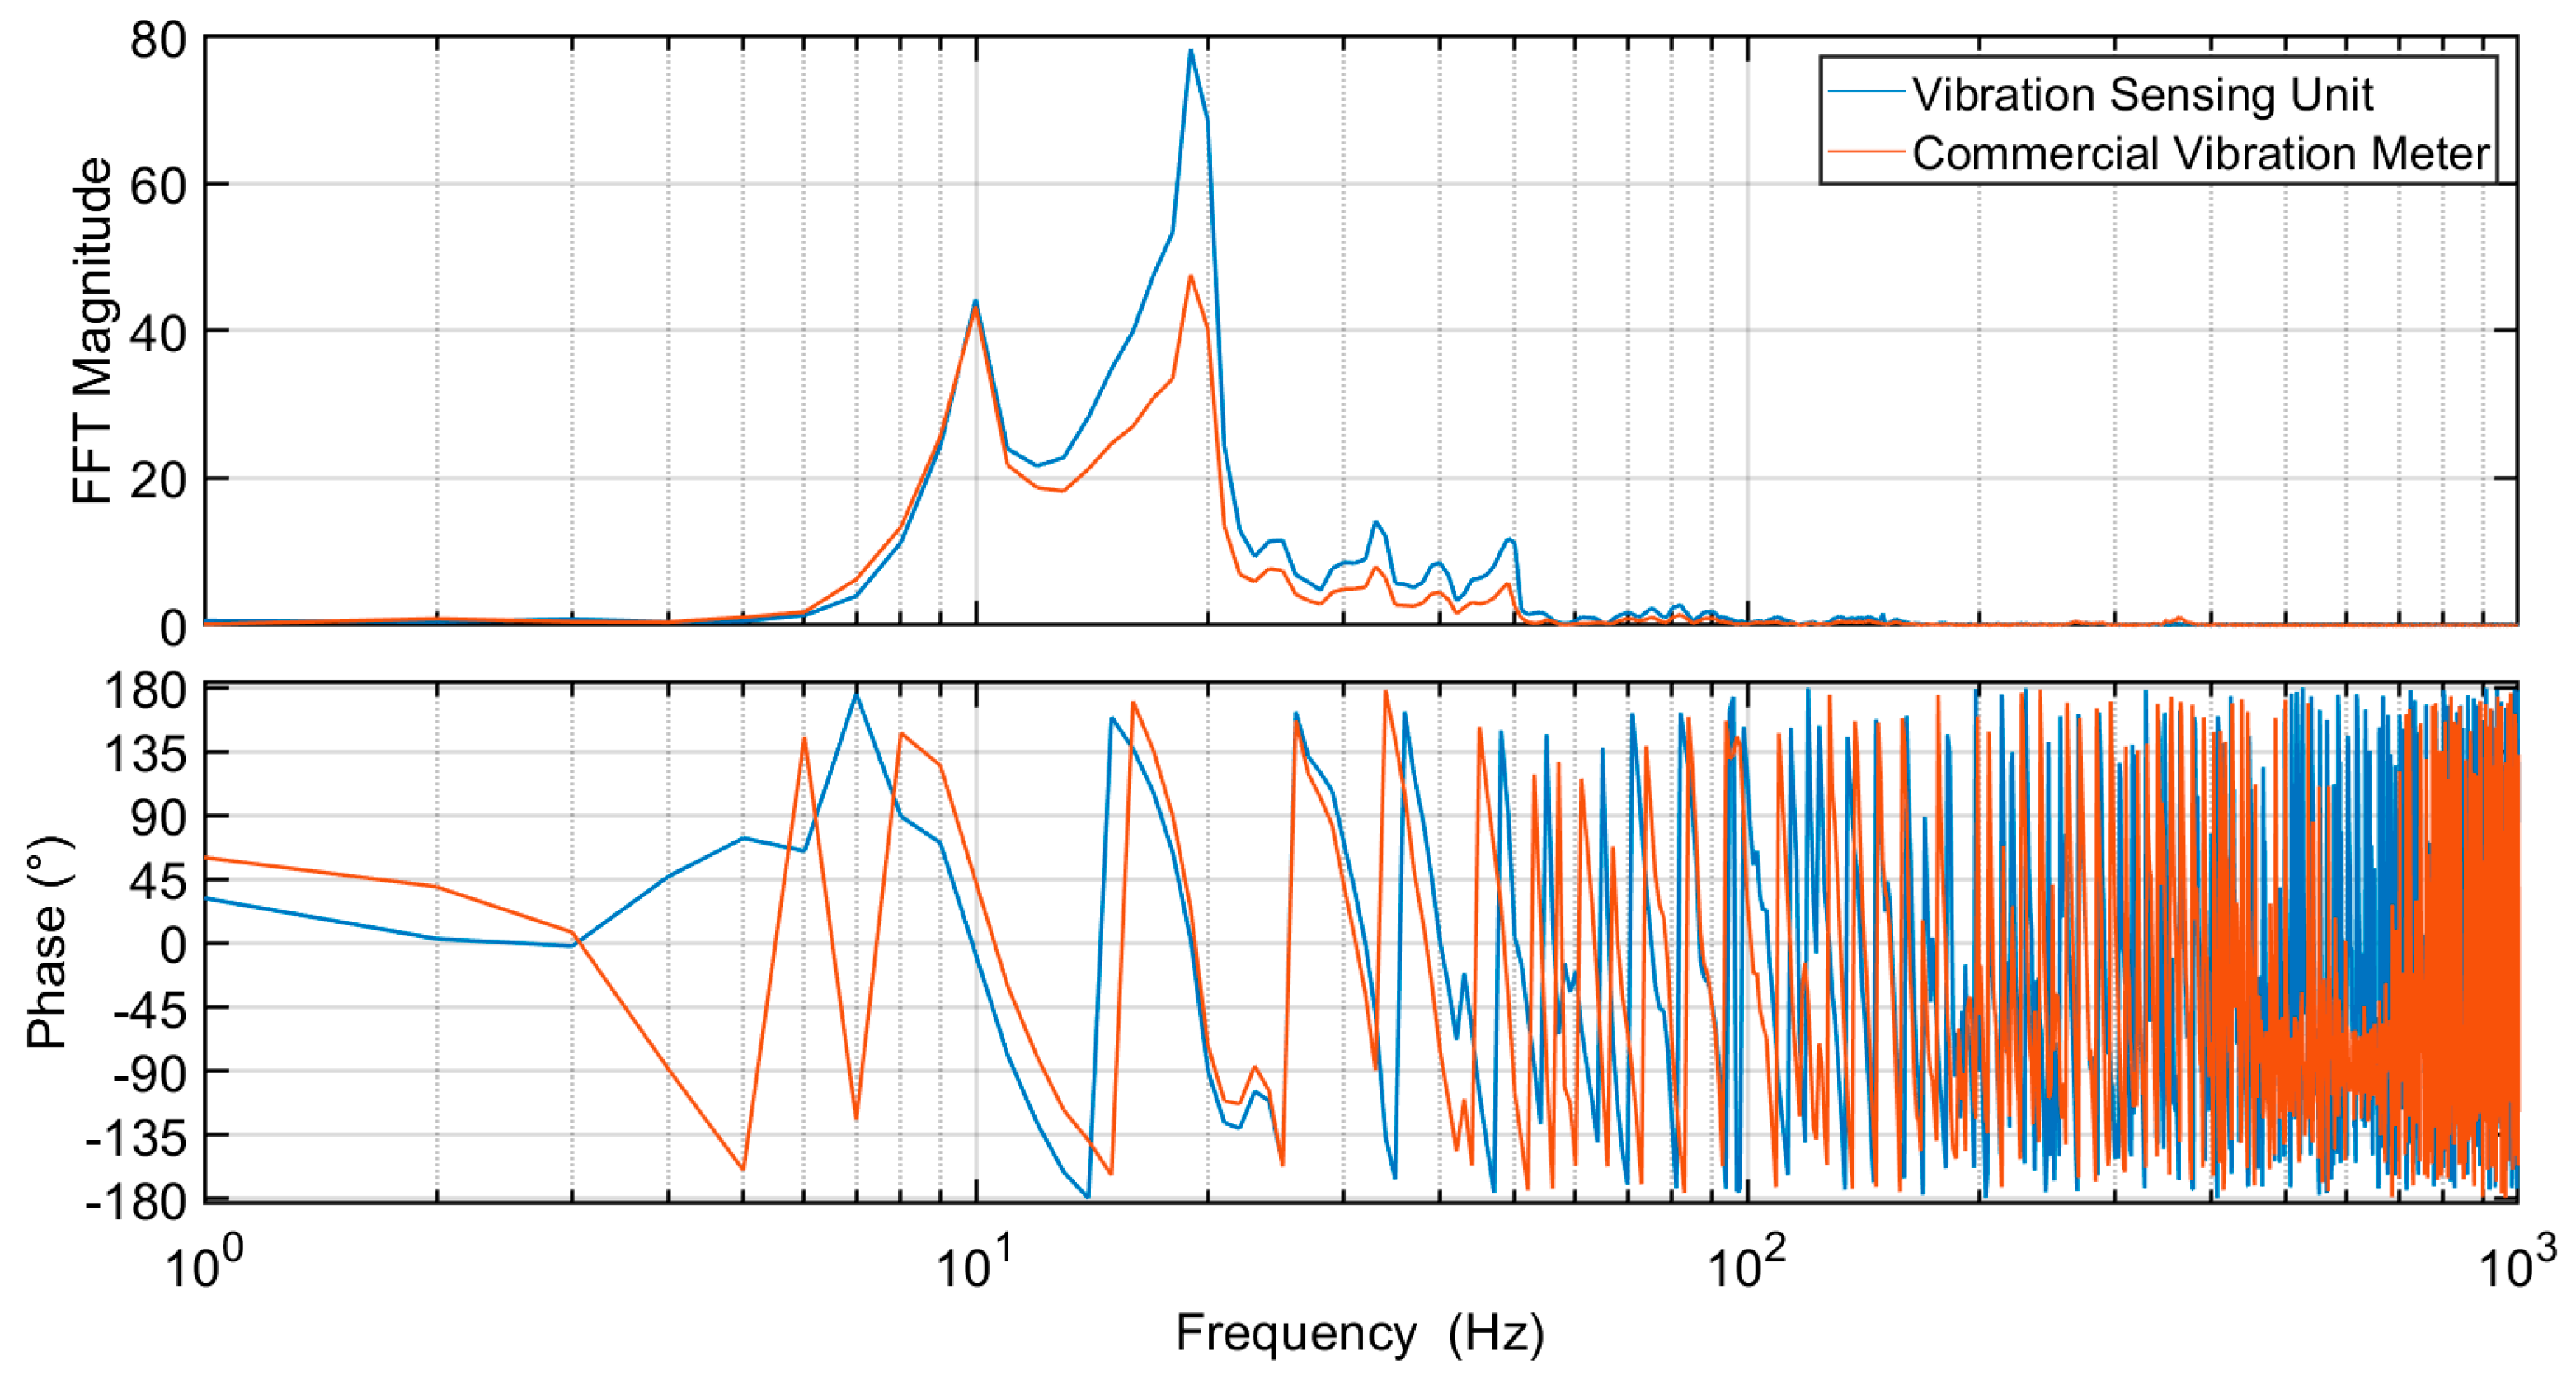
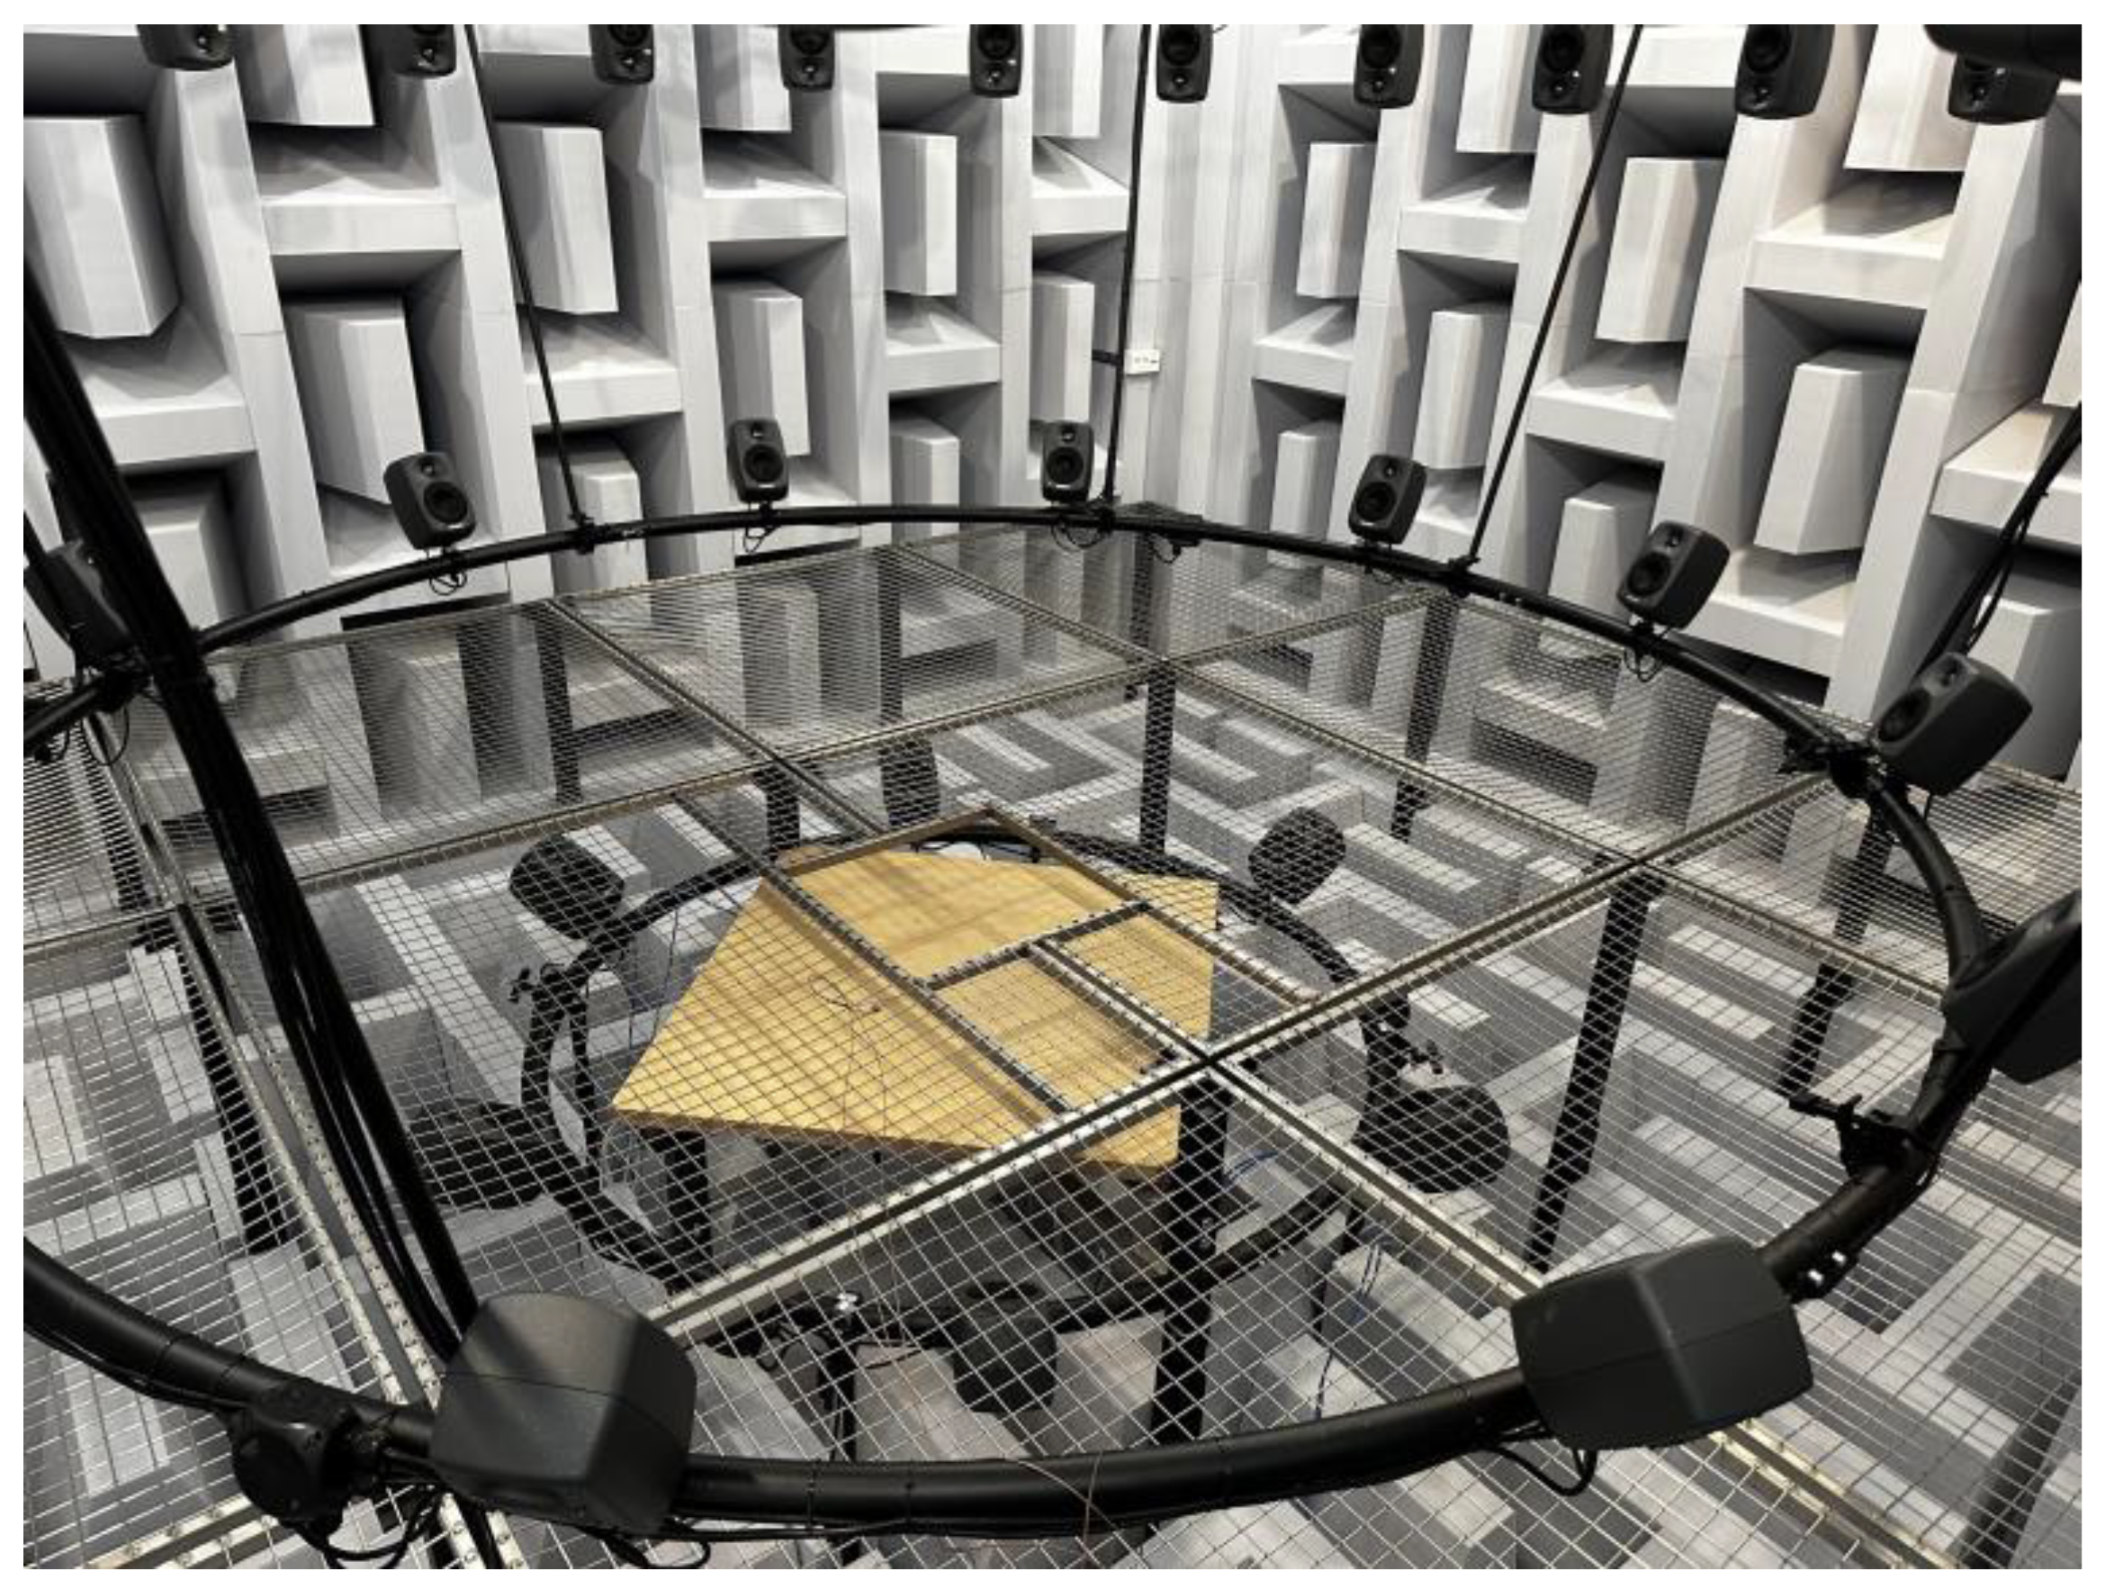
2.1.3. Experimental Validation of the Final VSU Design

To evaluate the performance of the final version of the developed VSU, the device was mounted on a ceiling, and walking impact noise was recorded. In parallel, the recording was also performed with a commercially available vibration meter consisting of a low-noise piezoelectric accelerometer mounted on the circuit board next to the mini-XLR connector (see Figure 2).
A characteristic recording of the impact during walking is shown in Figure 3. It shows that the two waveforms are generally consistent, while the reference acceleration looks smoother, which is related to the reduction in some frequency components. These can be seen in the FFT spectrum of the same recordings, which is shown in Figure 4. This graph shows that the general shapes of the two responses are consistent, while the largest discrepancy occurs at the peak around 20 Hz, where the VSU overestimates the acceleration. It should also be noted that the two accelerometers are not positioned in exactly the same place and can also be influenced by the vibration of the PCB itself, which may cause part of the measurement difference.

2.1.4. Considering the Mass Loading of the VSU

The mass added by attaching the accelerometer to the surface under test can affect the vibration level at the measurement point. Therefore, commercially available vibration measurement devices consist of accelerometers with a relatively low mass [20], as they are used to investigate structures very different in mass and in a wide frequency range. Therefore, an important aspect in the development of the VSU was to minimize the mass of the device by reducing the size of the circuit board and using small and lightweight components, e.g., replacing XLR with mini XLR connectors. According to ISO 10848-1 [21], the effect of mass loading can be neglected if the following condition is met:
m a c c < 1 2 π f Y d P
where macc is the mass of the accelerometer in kg, YdP is the driving point mobility in Ns/m, and f is the frequency in Hz.
For materials like concrete, bricks, timber, or gypsum plasterboard, the driving point mobility at the center of the plate can be estimated as follows (assuming a thin isotropic plate [21]):
Y d P = 1 8 B ρ s = 1 2.3 ρ s c L h
where B is the bending stiffness of the plate in Nm, ρ s is the surface-related mass of the plate in kg/m², c L is the longitudinal wave speed in m/s, and h is the thickness of the plate in m.
In this respect, materials with low bending stiffness (generally lightweight materials) can pose a challenge in the high-frequency range, which can reach up to 5 kHz in building acoustics. Considering Equations (1) and (2), the frequency range for each accelerometer used is given in Table 1, which also considers the scenario with/without cables and different building materials. It can be seen that the developed VSU (with the mini XLR connector and the cable) fulfills the mass requirement for all listed materials and can be used in the entire frequency range relevant for building acoustics.

2.2. Vibration Signal Processing

2.2.1. General Method to Capture and Process Vibration Signals from Predefined Impact Noise Sequences

Recordings of impact noise are saved as .wav files, an uncompressed Linear Pulse Code Modulation (LPCM) format. An LPCM format stores information in such a way that the signal value is represented as a bit value at each sampling time. The accuracy of such a digital signal representation is completely determined by the sampling rate and the bit depth of the ADC.
A digital audio workstation (DAW) connected to an audio interface is used to record signals from the VSU. The same interface is also used to record first-order ambisonics and low-noise microphones. In parallel, the vibrations are recorded with a standard vibration meter. These recordings are used for comparison and calibration. In addition, the higher-order ambisonics recordings are made on a separate computer running dedicated software.
Since the recordings are made on several manually operated devices, synchronization of the recorded signals is required. For this purpose, each recording session started with the person making a single jump, waiting a few seconds, and then starting to walk following the measurement protocol. By visually aligning the peak of the jump on all recordings, the sound engineer can synchronize the recordings in the DAW. After this synchronization, the files are broken down into shorter listening samples, possibly normalized, and converted to the format required for the loudspeaker and vibration reproduction system in the lab.

2.2.2. In Situ and Laboratory Recordings

The recordings were to be taken in structurally different buildings, with the focus on examining at least one typical multi-family dwelling made of reinforced concrete, one made of CLT (cross-laminated timber), and one made of timber frame structure. To this end, several construction companies, architects, and project developers were asked to provide access to their facilities.
For the in situ measurements, the vibrations were recorded on the floor of the receiving room, while for the laboratory measurements, the vibrations were recorded on the ceiling of the receiving room (Figure 5). Therefore, a transfer function (TF) between the measurements on the ceiling and on the floor of the receiving room had to be determined for the laboratory measurements. This was conducted separately in another acoustic test facility built entirely from CLT. The measurement was carried out by exciting the ceiling with a heavy hammer while recording the vibrations generated at different locations on the ceiling and floor. The acquired vibration signal consists of several pulses, with each pulse representing a hammer stroke. The signals were split into shorter, equal-length signals, each containing a single stroke. The complex FFT spectrum is calculated from these and the TF by dividing the spectrum of the output signals by the spectrum of the input signals. In the next step, the arithmetic mean of the TFs is calculated. Calculation was carried out for 3 types of hammer excitations (conventional metal hammer, rubber hammer, and metal hammer with rubber damping plate).
The TF was determined in a frequency range wider than the frequency range of the vibrations generated by walking impacts [22,23]. In the next step, as part of the DAW postprocessing, the TF was used to convolve the vibration signals recorded on the laboratory ceiling. The resulting signal corresponds to the floor vibrations and will be used to reproduce the vibrations under laboratory conditions.

2.3. Vibrations Reproduction

2.3.1. The Design of the Vibration Exposure Device

Devices that expose subjects to vibrations have already been developed in the form of differently shaped platforms and seats. Such devices were called vibration tables [24], vibration simulators [25], and vibration machines [26] and provided the experimental infrastructure needed to evaluate the effect of vibration on humans in different scenarios. However, to accurately reproduce impact sound, a relatively weak stimulus, several of these devices are noisy due to moving mechanical components or electrical/hydraulic exciters. When large, the devices also limit the accuracy of sound field reproduction by restricting the positioning of loudspeakers and elements of the room’s acoustic treatment.
The motivation, therefore, was to build a discrete device that would not generate audible noise. The device was designed to accommodate a single person with their head in the listening “hot spot”. This is in the center of the spherically arranged higher-order ambisonics reproduction system, which consists of 64 loudspeakers and a dedicated low-frequency driver. The entire system is located in the anechoic chamber of the InnoRenew CoE’s acoustics lab, with an acoustically transparent secondary floor under which several loudspeakers are also installed (Figure 6). Although the case of the specific installation is presented, VED is an independent system that could also be used in combination with other listening setups.
The VED will only reproduce vibrations in the vertical direction generated using a linear vibration transducer (mass shaker) installed on the underside of the platform. Such transducers are commonly used in advanced sound reproduction systems for cinemas and computer games to extend the perception of low frequencies by adding vibrations. Thus, these vibration transducers are not intended to reproduce vibrations accurately but rather to convey an arbitrary intensity of vibrations to the user. For this reason, a calibration procedure is required to achieve highly accurate vibration reproduction.

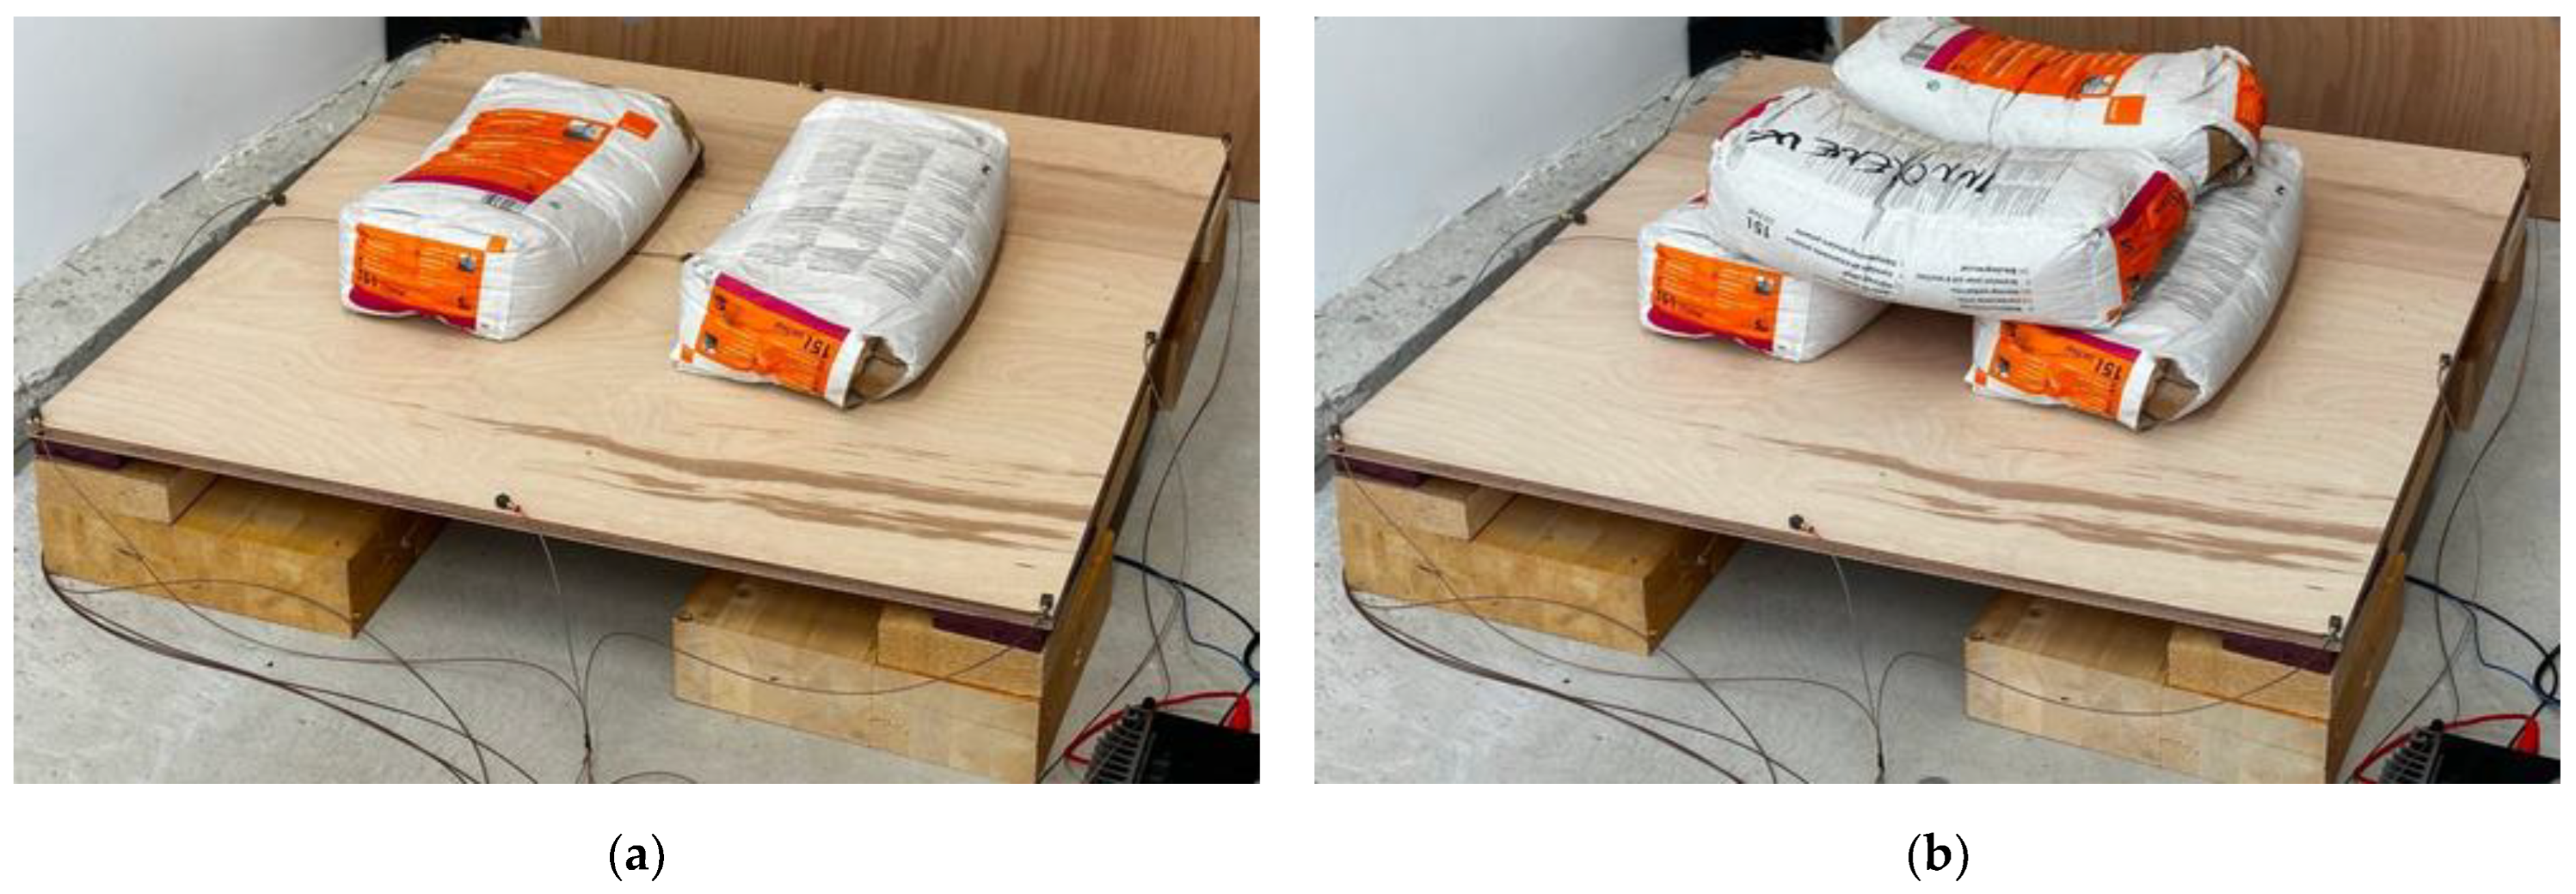
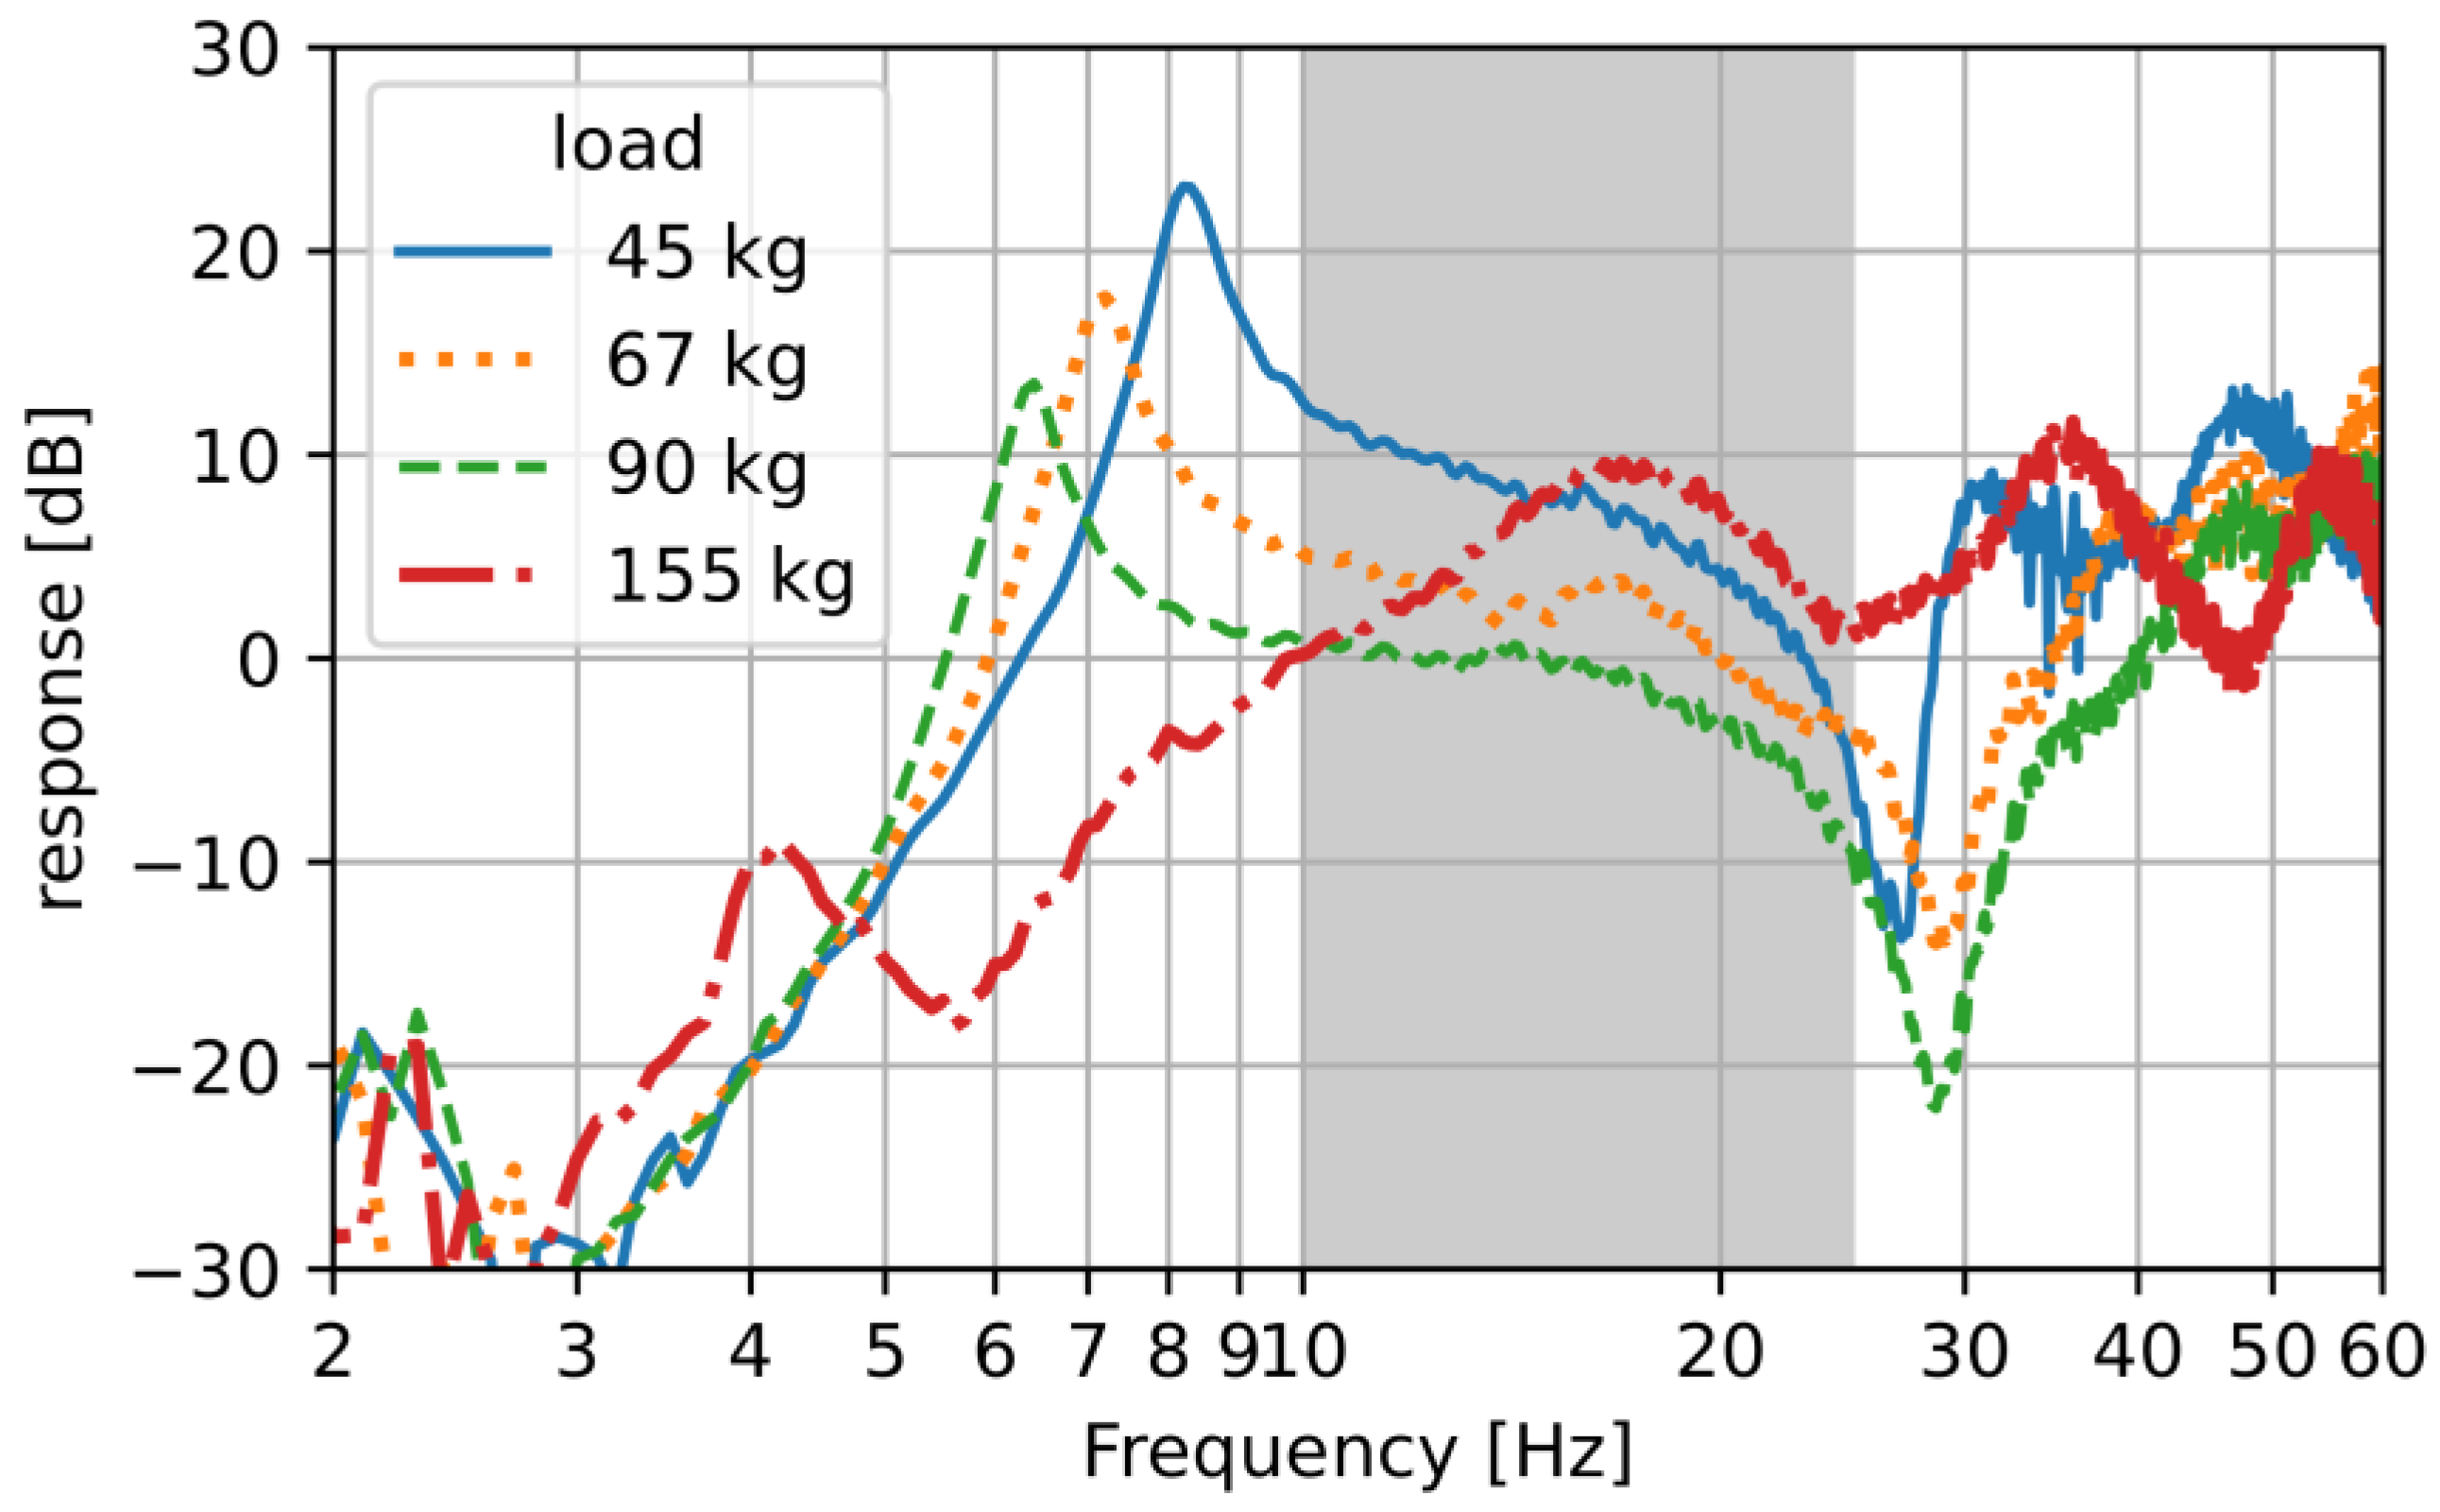
2.3.2. Operating Frequency Range at Different Loads

The VED is designed as a rectangular platform (wooden board) supported at its four corners. These rest on highly elastic pads that, together with the platform and its load, form a mass-spring system that moves in the vertical direction. The stiffness of the pads was chosen so that the resonant frequency of the system is below the frequency range in which the vibrations are to be reproduced. In this context, the frequency range of 10 to 40 Hz is set as the target operating frequency of the VED.
The resonant frequency of the VED is also highly dependent on the body mass of the test subject, which can vary considerably. Preliminary frequency response measurements were performed with various loads on the platform, with the accelerator positioned in the center of the platform. The measurements were made before the VED was installed in the anechoic chamber (see Figure 7).
The acquired frequency responses of the measured acceleration with a constant voltage signal fed to the vibration transducer are shown in Figure 8. From this, it can be seen that the addition of weight causes (i) the expected decrease in resonant frequency, visible in the form of a peak ranging between 4 Hz and 9 Hz depending on the load, and (ii) the magnitude of the response around the resonant frequency decreases at higher loads. It can also be observed that in the frequency range of 10–25 Hz (gray-shaded area), a signal correction of +/−10 dB is required to reproduce vibrations uniformly.
A dip in the frequency response was observed at 30 Hz, most likely related to the bending mode of the wooden platform. Therefore, the platform was thickened in the final design to increase the bending stiffness of the platform and shift this resonance to a higher frequency. As the final results show (see Section 3), this intervention extended the final operating frequency range to 10–30 Hz.
Another design decision was to load the platform only in its central part to avoid excessive loading of the individual elastic pads, which could lead to non-elastic responses or damage to the elastic pads. Such loading is achieved in practice by restricting the user’s access to the central part of the platform, as visible in the photo in Figure 6.

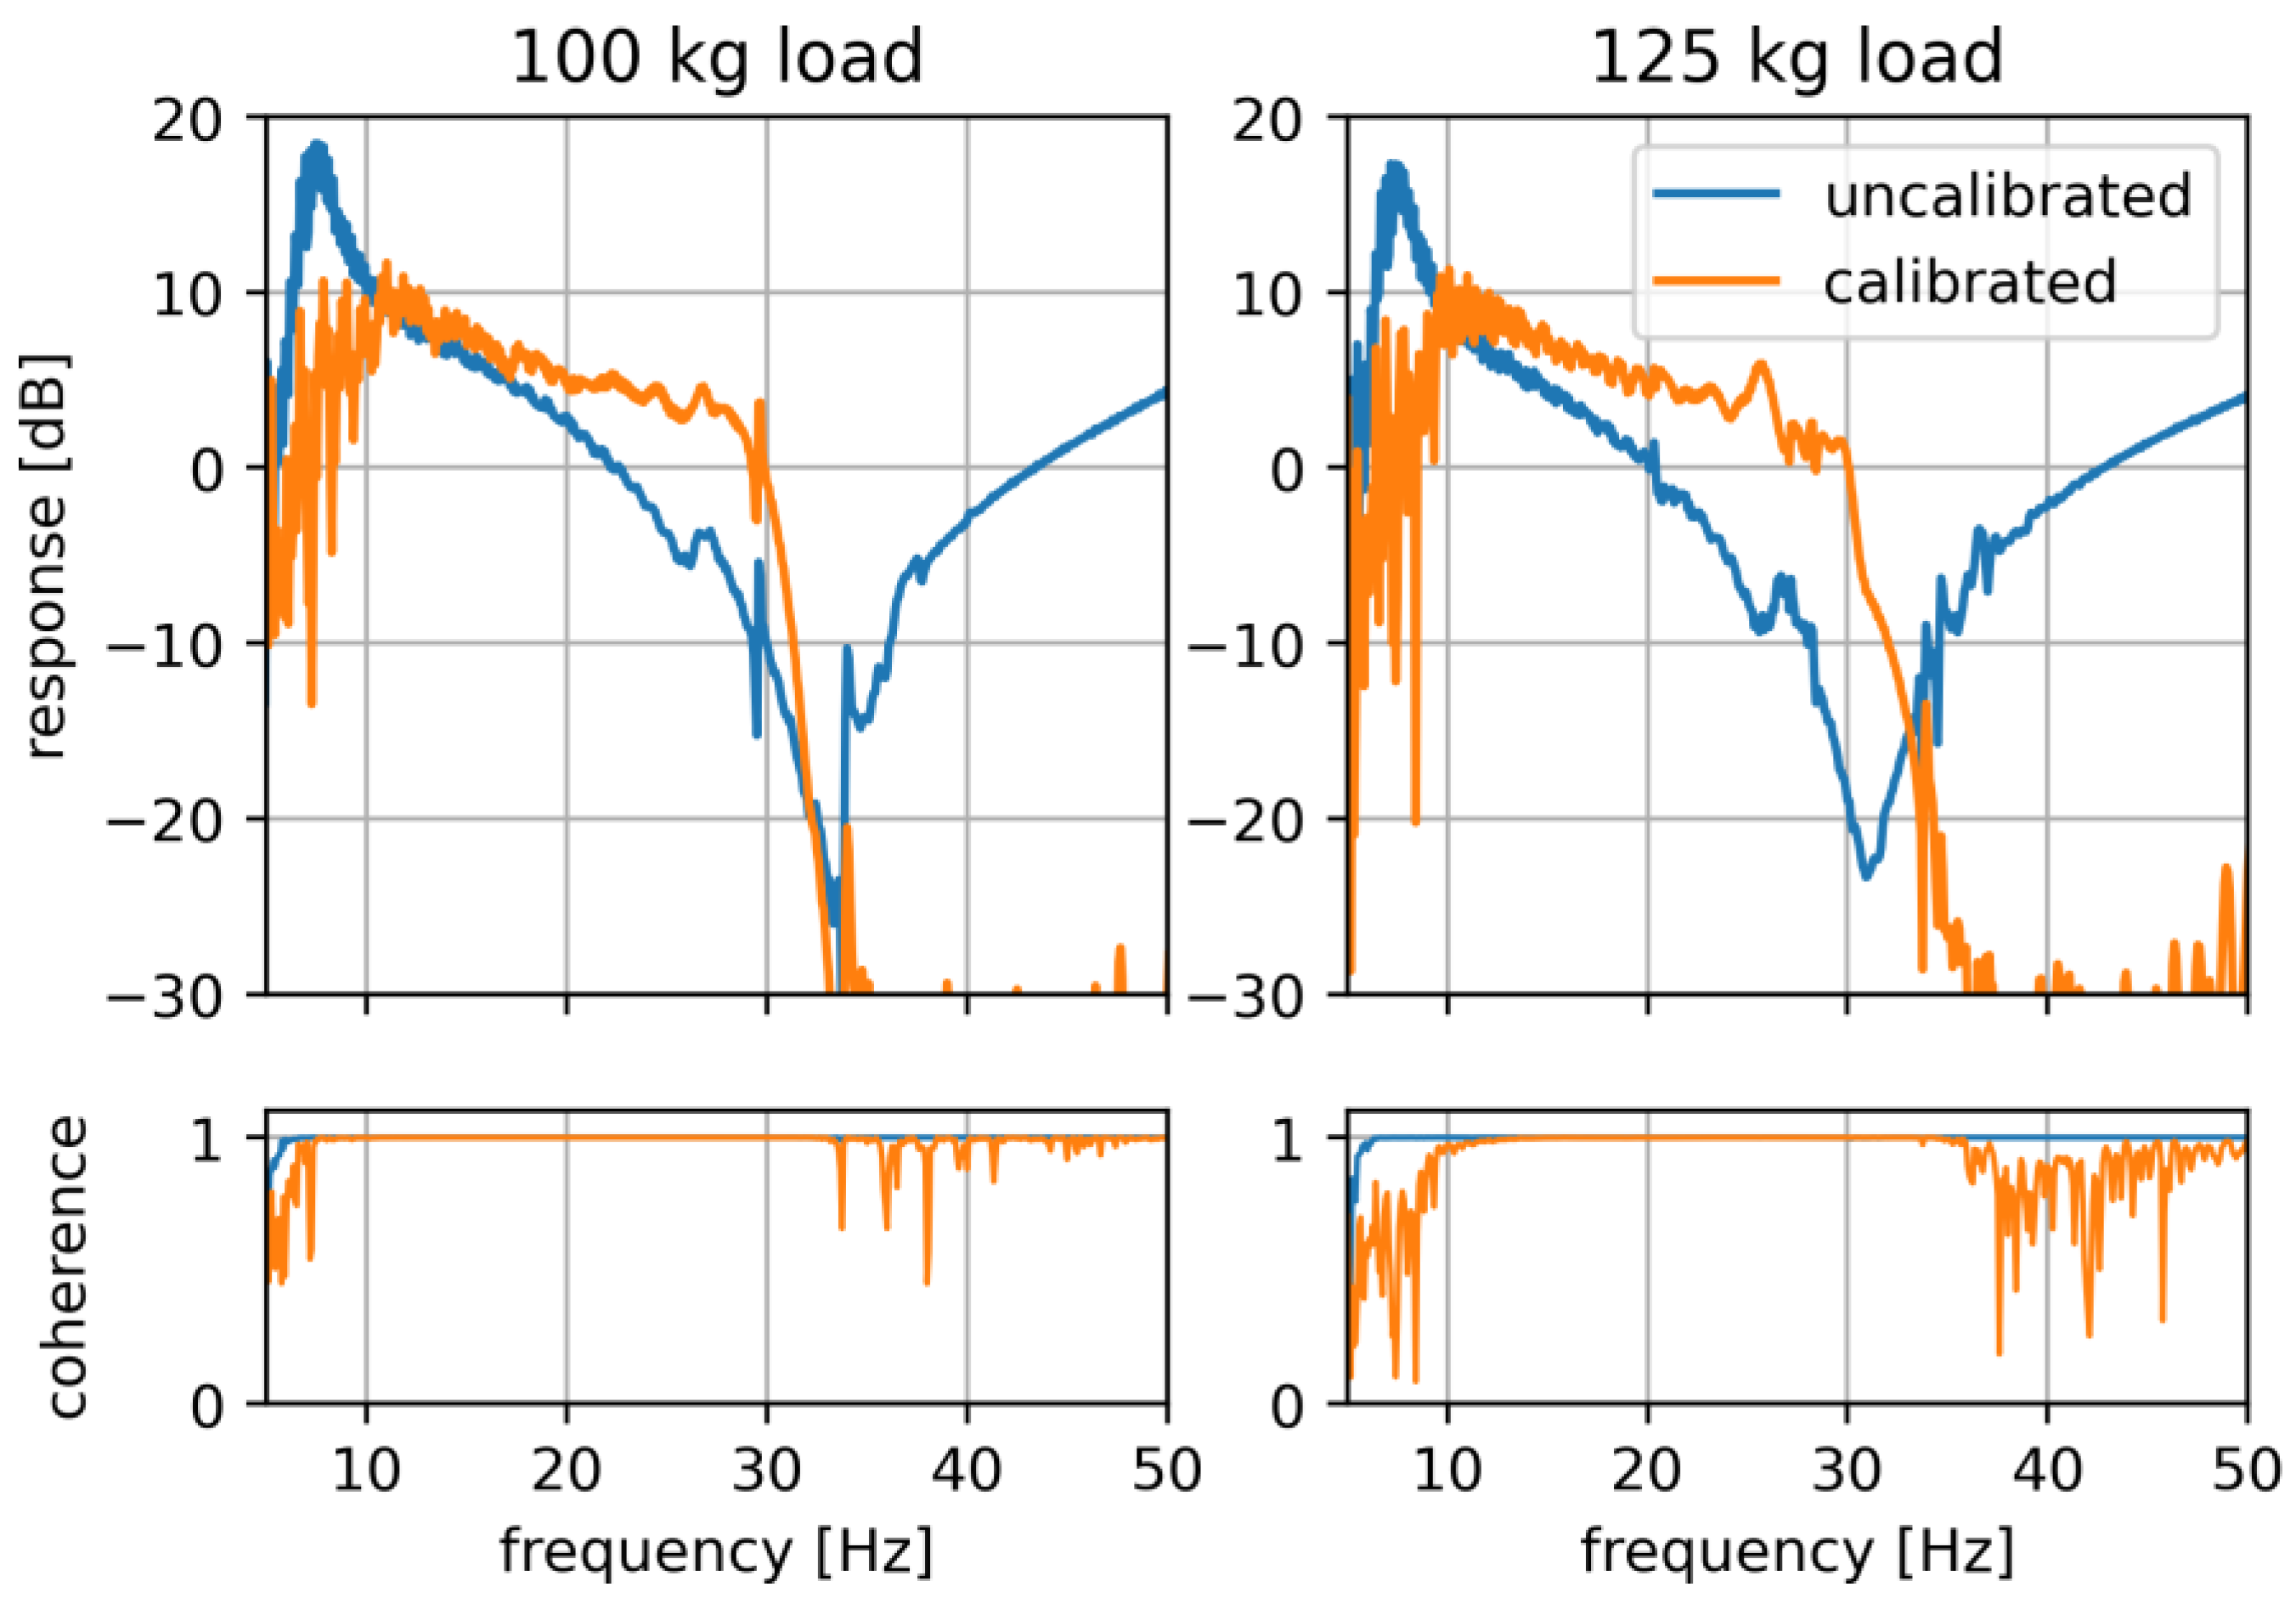
2.3.3. VED Calibration and Operation Monitoring

On the DAW, the vibration signal a ( t ) recorded in the field is set as an independent audio track that is played back in parallel with the decoded ambisonics tracks. This allows synchronous reproduction of both stimuli, which is an important reproduction requirement.
The vibration output channel is delivered to the power amplifier driving the vibration transducer and in parallel to the B & K LAN-XI acquisition system. The acquisition system records this signal along with the acceleration a v e d ( t ) , which is detected using an accelerometer mounted on the underside of the VED platform. The two recorded signals are used to calculate the frequency response of the system as follows:
H f = A v e d f A f
where A v e d ( f ) and A ( f ) are Fourier transforms of the signals a v e d ( t ) and a ( t ) , respectively, where f represents frequency.
The recordings with a duration of 5 s are post-processed to continuously monitor the response of the system, which must be constant in the operating frequency range. In addition to the monitoring function of the presented system, it is also used to generate an FIR correction filter [27] unique to each subject performing the listening test.
The filters are obtained from an additional measurement that starts immediately before the listening tests, when the subject is already positioned on the VED. For this purpose, a frequency sweep signal of 5 s in the frequency range 5–80 Hz is used instead of a ( t ) . The inverse of the acquired frequency response is calculated as 1 / H ( f ) , and its inverse Fourier transform is finally the FIR correction filter. In addition, the FIR filter implements a 10–30 Hz bandpass filter that limits the vibration reproduction to the operating frequency range. The coefficients of the FIR filter are loaded into the convolution plug-in, which is applied to the track of the a ( t ) signal in the DAW. The described calibration process, which takes about 20 s, is performed before each listening test.

3. Results

To evaluate the performance of the VED, its frequency response was measured in its final state, i.e., with the VED installed in the center floor area of the ambisonics listening setup in the anechoic chamber (see the photo in Figure 6). The frequency response was measured in the same way as in the design phase (as described in Section 2.3.2), but also after applying the calibration procedure. The measured frequency response for the VED loaded with 100 and 125 kg is shown in Figure 9, together with the measured coherence.
Without the calibration, the response shows a similar behavior as in the design phase (see Figure 8), with a distinct resonance peak below 10 Hz. By thickening the platform, a pronounced deepness, which was previously observed in the range of 25–30 Hz, has shifted to just above 30 Hz. This made it possible to set the operating range of the VED to 10–30 Hz.
After applying the calibration, the response of the VED in the operating frequency range is constant (+/−5 dB) for both load scenarios. Furthermore, a frequency decaying trend can be observed, which is happening at a constant rate. It can also be observed that the coherence decreases outside the operating range, which is most likely related to a higher SNR in this range. This is then also reflected in larger deviations of the response magnitude below the operating range.
When evaluating the frequency response of the platform, the recorded peak acceleration in the operating frequency range for the calibrated scenario and a load of 100 kg was 0.86 m/s2. This gives some indication of the level of reproducible accelerations that can be achieved, although a systematic assessment of the dynamic reproduction range of VED has not yet been performed.

4. Discussion

The comparison of the acceleration recorded with different accelerometers has shown that a relatively large deviation (a factor of two) can be observed in the determined operating frequency range (see Figure 4). For this reason and due to the relatively easily accessible instrumentation, all recordings carried out as part of the study are also made using a commercially available accelerometer. For this reference accelerometer, the specified operating range includes the operating range of the VED. On the other hand, there is no direct information on its frequency response, but it can be assumed that the frequency deviations are in the range of +/−X dB, as required for Class 1 accelerometers. In view of possible future research steps, a more complete comparison will be made after a larger number of measurements have been made with several accelerometers.
As far as the reproduction of vibrations is concerned, the operating frequency range of VED could be set to 10-30 Hz, with frequency deviations of VED in the range of +/−5 dB (Figure 9). The limitation in the lower frequency range refers to the lowest resonance peak of the response, while in the upper frequency, a deep resonance peak in the response is difficult to compensate for. In comparison, the operating frequency range achieved with the VED is significantly narrower than that of the much more advanced vibration simulator [28], which operates from 0.5 to 40 Hz. However, only limited conclusions can be drawn from this, as no information on frequency deviation is available for the vibration simulator [28]. Another comparison found in the literature can be made with the vibration floor [29], which, according to the authors, is capable of reliably reproducing vibrations in the frequency range from 5 to 200 Hz. However, the frequency dependence of the reproduced magnitude is in the range of +/−20 dB [29], which is very high. Overall, despite its relatively limited frequency range, the VED represents a significant low-frequency extension of listening setups, which were previously only capable of reproducing auditory stimuli.
Based on the measured response of the VED (Figure 9), relatively large deviations in the response are measured below 10 Hz, i.e., below the operating frequency range. This is the frequency range near the lowest resonance of the system, in which it is highly sensitive to excitation. Therefore, the observed deviations are most likely due to background noise and would disappear at higher reproduction levels. In this respect, a more systematic evaluation of the dynamic range of the VED should be performed, taking into account aspects such as the SNR and harmonic distortion.
An interesting observation of the measured response of the VED after its calibration (Figure 9) is the underlying frequency dependence of the magnitude, which decreases with frequency at a constant rate. Such behavior could most likely be well compensated using an improved FIR filter design. Nevertheless, it is important to be aware that a signal compensation that is already at 20 dB would have to be increased even further. This could be a challenge from a signal processing point of view, as it could lead to clipping effects.
An alternative way to improve the response of the VED would be to model its dynamics. This would be a conceptually different approach than the current treatment of the VED as a “black box”, i.e., controlling its response without understanding the underlying physics. Such an insight would most likely be useful to address the unfavorable 30 Hz depth in the response, which has already been successfully shifted towards the higher frequencies during development by thickening the platform. Nevertheless, this design improvement has only extended the frequency range by 5 Hz, while this extension could probably be even larger if more advanced methods, such as experimental modal analysis, were also applied. On the other hand, it must be considered that the VED is not a static device, as it can be loaded by different listeners with very different body masses (45–125 kg can be accommodated). Since variations in load strongly influence the dynamic response of the VED, a calibration procedure would also be required if the dynamic response is to be optimized by design.
A partial improvement in this regard would be to optimize the micro-positioning of the listeners’ feet. Namely, if modal nodes are identified, they can be avoided, and the “optimal foot position” for the listener can be marked. To this end, it is likely that future improvements to the VED will evaluate the response on the platform with a high spatial resolution. This approach is particularly convenient, as it does not require significant changes to the design and can be understood as an advanced calibration procedure.
The accuracy of recording and reproduction should also be discussed in relation to the variation in acceleration depending on the specific recording position on the floor. Indeed, if the variations in recording position are significant, it would make more sense to further evaluate the recording protocol to account for these variations. As the field recordings have not yet been completed, such an evaluation will only be carried out as follows.
To further discuss the acceleration amplitudes that the VED can reproduce, it is important to keep in mind that the characteristic levels generated by impact sound sources in the building are not generally known, making it impossible to define concrete targets for the reproduction range of the VED. However, in the data obtained during the calibration of the VED, the maximum reproduction amplitude for the 100 kg load was 0.86 m/s2. From this, the corresponding displacement can be calculated, which is 0.21 mm, assuming harmonic excitation at 10 Hz. If this is compared with the vibration simulator [27], for which the displacement range of the platform is specified as 21 mm, the displacement achieved with the VED is 100 times smaller. Such a large difference in range can be explained by the fact that the vibration simulator [27] is designed to reproduce vibrations in a wider range of scenarios, such as on bridges and in transportation. Another comparison can be made with the vibration floor [29], which is declared to be able to reproduce vibrations with an amplitude of up to 3 m/s2. Although this value is almost four times higher than the amplitude we measured with VED, it must be taken into account that the reported frequency deviations of the vibration floor [28] exceed the range of +/−20 dB, which represents significantly poorer performance.
Another aspect to consider is the perception of vibrations. The human ability to discriminate between different stimuli is quantified by the just-noticeable differences (JND), which are, unfortunately, difficult to generalize for comparison. This is because JNDs are known to be highly frequency-dependent, highly dependent on the body location excited (face, fingertips, legs, etc.), and also vary greatly between individuals. In our case, the studies by Bellman et al. [30] are the most relevant for comparison, even though they examined the test subjects in a sitting position, whereas VED is designed for a standing person. The authors investigated the JND level difference at different frequencies for subjects excited in the vertical direction. Their results in the operating frequency range of VED show that the mean JNDs are between 1.5 and 1.7 dB. In view of this, further improvements to the VED are needed, for which several directions have already been mentioned in the course of the discussion.

5. Conclusions and Outlook

The importance of low frequencies and vibrations in the built environment and their perception are well known. This leads to a new challenge that we have tackled with our investigation, namely, to accurately record vibrations in the built environment and reproduce them under laboratory conditions. This goal is important in order to be able to carry out listening tests for impact sounds that combine auditory and vibration stimuli. This requires three steps: recording, processing, and reproduction, as described in this article.
For recording vibrations, various accelerometers were considered and tested. Some did not meet the sensitivity requirements, so finally, a piezoelectric accelerometer was used as part of the developed vibration-sensing unit (VSU). The VSU was evaluated experimentally and proved to be competitive with commercially available low-noise accelerometers. The VSU only records vibrations in the vertical direction, as previous research has shown that vibrations generated by impact noise sources in buildings are dominant in the vertical direction. It is important to point out that the developed VSU can be used for more general vibration measurements, the potential of which will be explored in future research activities.
The recorded vibrations will be reproduced with another developed device, the Vibration Exposure Device (VED). The VED is used as an extension of the higher-order ambisonics reproduction system installed in the anechoic chamber of the InnoRenew CoE acoustics laboratory. The VED consists of a platform on which a standing test subject is exposed to vibrations. Their head is located in the center of the spherically arranged loudspeaker array. This reproduction setup allows the simultaneous and accurate reproduction of sound and vibrations. An important challenge in this context is the need to compensate the driving vibration force for the different loading of the VED due to the different weights of the test subjects. This obstacle was overcome by a developed calibration procedure that is performed at the beginning of each listening test. This procedure leads to constant-frequency responses from the VED for all loading scenarios. The system has already been installed in the anechoic chamber and is in the pilot phase, with the first listening tests underway. Future research activities will focus on using the developed infrastructure for different listening tests, with the option to extend the setup by applying virtual reality solutions.

Author Contributions

Conceptualization, F.D.; methodology, F.D. and R.P.; software, A.R., R.P. and A.W.; validation, F.D. and R.P.; formal analysis, F.D.; investigation, F.D., R.P. and A.R.; resources, F.D. and R.P.; data curation, F.D., R.P. and A.W.; writing—original draft preparation, F.D., R.P., A.R. and A.W.; writing—review and editing, F.D. and R.P.; visualization, F.D., A.R. and R.P.; supervision, F.D., R.P. and M.N.; project administration, F.D.; funding acquisition, F.D. and R.P. All authors have read and agreed to the published version of the manuscript.

Funding

The authors acknowledge the financial support from the Slovenian Research Agency (research core funding No. Z1-4388, Toward better understanding the diffuse sound field, and research core funding No. J4-3087, Engineered wood composites with enhanced impact sound insulation performance to improve human well being) as well as funding by the AUSTRIAN SCIENCE FUND (FWF), grant number I 5503-N. The authors gratefully acknowledge the European Commission for funding the InnoRenew project (grant agreement #739574) under the Horizon2020 Widespread-Teaming program and the Republic of Slovenia (investment funding from the Republic of Slovenia and the European Union from the European Regional Development Fund).

Data Availability Statement

The data are not publicly available because the paper is about the method to collect data for listening tests. The data generated so is not publicly available as stated, it will be used for listening tests.

Acknowledgments

The authors gratefully acknowledge the opportunity to conduct recordings and measurements in test facilities or on construction sites of the following companies and associations: KLH Massivholz GmbH, STRABAG AG, Haus des Lernens, and Graf-Holztechnik GmbH. Open Access Funding by the Austrian Science Fund (FWF).

Conflicts of Interest

Dr. Franz Dolezal, Mr. Andreas Reichenauer, Mr. Armin Wilfling are affiliated with IBO—Austrian Institute for Building and Ecology, remining authors declare no potential conflicts of interests.

Appendix A

This appendix contains tables comparing the different types of accelerometers.
Table A1. Categorization of accelerometer types with benefits and drawbacks [13,14,15].
PiezoelectricCapacitivePiezoresistive
electrical signal is generated via seismic mass pressing on piezoelectric elementbased on capacitance change of seismic mass under acceleration, manufactured with MEMS technologyproduces resistance changes in strain gages of seismic system, can be manufactured with MEMS technology
+ high bandwidth+ low cost+ higher bandwidth
+ wide measuring/dynamic range+ can detect static displacement+ can detect static displacement
+ high signal-to-noise ratio+ good linearity+ high dynamic range
+ noise floor independent of bandwidth+ high output stability+ outstanding signal-to-noise ratio
+ good temperature stability+ can be built in very small case+ can be built in very small case
+ very robust design+ possibility of doing an active self-test- sensitive to temperature variation, compensation necessary
+ many different variations/designs+ easy to implement in wireless designs- low sensitivity
+ very good linearity+ no saturation on large impacts
+ low sensitivity to magnetic fields- poor signal-to-noise ratio
- not possible to detect very low frequencies or static displacements- limited dynamic range
- no active self-test possible- low bandwidth
- bigger in size
- saturation on large impacts
Table A2. Categorization of piezoelectric accelerometer types regarding their output [13,16].
ChargeVoltage
+ no power supply necessary (charge accumulated by piezoelectric principle)+ sensitivity independent of cable length and quality
+ no noise (no circuitry inside of sensor case)+ signal can be transmitted over long cables due to low impendence output
+ wide dynamic range (>120 dB)+ inexpensive signal conditioners and cables, as no charge amplifiers or low-noise cables are necessary
+ high operating temperatures (−200 to +640 °C)+ self-test function for IEPE usage
+ smaller sensors possible (no additional circuit inside of case)+ better for usage in harsher conditions like dirt and humidity
+ sensitivity can be changed with charge amplifier- constant power supply necessary
- cables as short as possible (<10 m)- additional noise due to necessary circuitry
- requires special shielded low-noise cables (to minimize triboelectric noise)- operating temperature limited by electronics (<125 °C)
- requires charge amplifier- dynamic range and sensitivity determined using an internal amplifier
- sensitivity can be influenced by cable length and quality- bigger case necessary to fit additional circuitry
Table A3. Retrieving data from accelerometers—benefits and drawbacks [17,18].
AnalogDigital
+ time continuous data+ really cheap sensors available
+ easier to process+ robust against interference
+ best suited for audio transmission+ more flexible signal processing with DSPs
+ data transmission bandwidth equals measurement bandwidth+ possibility to check for erroneous transmission
+ possibility to use a more accurate ADC+ only (small and cheap) microcontroller necessary for data readout via SPI or I2C protocols, also for multiple sensors
- no possibility to detect erroneous transmission+ accuracy only determined with sensor
- additional circuitry needed for signal processing- more complex to process
- usually more expensive- smaller measurement bandwidth for same data transmission bandwidth
- more susceptible to noise and interference- time-sampled data
- accuracy and noise performance can be reduced via further circuitry- SPI and I2C busses are not meant for long cable transmission (only up to a few meters)
- more expensive microcontroller necessary for readout for accurate ADC and multiple ADC channels- number of usable accelerometers limited by data transmissions clock speed
- SPI requires a lot of chip-select wires, and I2C requires an address extender chip for a higher number of accelerometers

References

  1. Vardaxis, N.G.; Bard, D. Review of acoustic comfort evaluation in dwellings: Part II—Impact sound data associated with subjective responses in laboratory tests. Build. Acoust. 2018, 25, 171–192. [Google Scholar] [CrossRef]
  2. ISO 10137:2007; Bases for Design of Structures–Serviceability of Buildings and Walkways against Vibrations. International Organization for Standardization: Geneva, Switzerland, 2007.
  3. Griffin, M.J. Effects of Vibration on People. In Handbook of Noise and Vibration Control, 1st ed.; Crocker, M.J., Ed.; John Wiley & Sons, Inc.: Hoboken, NJ, USA, 2007. [Google Scholar] [CrossRef]
  4. Chapain, S.; Aly, A.M. Vibration attenuation in a high-rise hybrid-timber building: A comparative study. Appl. Sci. 2023, 13, 2230. [Google Scholar] [CrossRef]
  5. EN 1995-1-1:2004; Eurocode 5: Design of Timber Structures–Part 1-1: General–Common Rules and Rules for Buildings. European Committee for Standardization: Brussels, Belgium, 2004.
  6. Park, S.H.; Lee, P.J. Effects of floor impact noise on psychophysiological responses. Build. Environ. 2017, 116, 173–181. [Google Scholar] [CrossRef]
  7. Bard Hagberg, K. Management of Acoustics in Lightweight Structures. Ph.D. Thesis, Lund University, Lund, Sweden, 2018. [Google Scholar]
  8. Ljunggren, F.; Simmons, C.; Hagberg, K. Correlation between sound insulation and occupants’ perception–Proposal of alternative single number rating of impact sound. Appl. Acoust. 2014, 85, 57–68. [Google Scholar] [CrossRef]
  9. Ljunggren, F.; Simmons, C.; Öqvist, R. Correlation between sound insulation and occupants’ perception–Proposal of alternative single number rating of impact sound, part II. Appl. Acoust. 2017, 123, 143–151. [Google Scholar] [CrossRef]
  10. Frescura, A.; Lee, P.J.; Schöpfer, F.; Schanda, U. Correlation between standardised and real impact sound sources in lightweight wooden structures. Appl. Acoust. 2021, 173, 107691. [Google Scholar] [CrossRef]
  11. Hongisto, V.; Laukka, J.; Alakoivu, R.; Virtanen, J.; Hakala, J.; Linderholt, A.; Jarnerö, K.; Olsson, J.; Keränen, J. Suitability of standardized single number ratings of impact sound insulation for wooden floors–Psychoacoustic experiment. Build. Environ. 2023, 244, 110727. [Google Scholar] [CrossRef]
  12. Geluykens, M.; Müllner, H.; Chmelík, V.; Rychtarikova, M. Airborne sound insulation and noise annoyance: Implications of listening test methodology. In Proceedings of the Forum Acusticum, Torino, Italy, 11–15 September 2023. [Google Scholar]
  13. TE Connectivity Ltd. Choosing the Right Type of Accelerometer. Available online: https://www.te.com/usa-en/products/sensors/vibration-sensors/intersection/types-of-accelerometers.html (accessed on 9 November 2023).
  14. Murphy, C. Why MEMS Accelerometers Are Becoming the Designer’s Best Choice for CbM Applications. Available online: https://www.analog.com/en/technical-articles/why-memes-acceler-are-best-choice-for-cbm-apps.html (accessed on 9 November 2023).
  15. Weber, M. Characteristics. Available online: https://mmf.de/en/piezoelectric-principle-4 (accessed on 2 January 2024).
  16. Weber, M. IEPE Standard. Available online: https://mmf.de/en/iepe-standard (accessed on 2 January 2024).
  17. TE Connectivity Ltd. Sieben Aspekte der Gegenüberstellung Von “Digital” und “Analog”. Available online: https://www.te.com/de/industries/sensor-solutions/insights/digital-over-analog.html (accessed on 9 November 2023).
  18. MPS. Analog Signals vs. Digital Signals. Available online: https://www.monolithicpower.com/en/analog-vs-digital-signal (accessed on 9 November 2023).
  19. Prislan, R. The design of an impact sound vibration exposure device. In Proceedings of the Forum Acusticum, Torino, Italy, 11–15 November 2023. [Google Scholar]
  20. Hopkins, C. Sound Insulation, 1st ed.; Elsevier Ltd.: Oxford, UK, 2007. [Google Scholar]
  21. ISO 10848-1:2017; Acoustics–Laboratory and Field Measurement of Flanking Transmission for Airborne, Impact and Building Service Equipment Sound between Adjoining Rooms–Part 1: Frame Document. International Organization for Standardization: Geneva, Switzerland, 2017.
  22. Watters, B.G. Impact noise Characteristics of Female Hard-Heeled Foot Traffic. J. Acoust. Soc. Am. 1965, 37, 619–630. [Google Scholar] [CrossRef]
  23. Van Nimmen, K.; Lombaert, G.; Jonkers, I.; De Roeck, G.; Van den Broeck, P. Chararacterisation of walking loads by 3D inertial motion tracking. J. Sound. Vib. 2014, 20, 5212–5226. [Google Scholar] [CrossRef]
  24. Miwa, T. Evaluation methods for vibration effect. Ind. Health 1967, 5, 11–17. [Google Scholar] [CrossRef]
  25. Woods, A.G. Human response to low frequency sinusoidal and random vibration: A description of a series of tests made with a vibration simulator to evaluate the effect of vibration on task performance. Airc. Eng. Aerosp. TEC. 1967, 39, 6–14. [Google Scholar] [CrossRef]
  26. Meister, A.; Bräuer, D.; Kurerov, N.N.; Metz, A.M.; Mucke, R.; Rothe, R.; Seidel, H.; Starozuki, I.A.; Uvorov, G.A. Evaluation of responses to broad-band whole-body vibration. Ergonomics 1984, 27, 959–980. [Google Scholar] [CrossRef] [PubMed]
  27. Proaksis, J.G.; Manolakis, D.K. Digital Signal Processing; Pearson Prentice Hall: Upper Saddle River, NJ, USA, 2007. [Google Scholar]
  28. University of Exeter. VSimulators. Available online: https://vsimulators.co.uk (accessed on 3 January 2023).
  29. Bellmann, M.A. Perception of Whole-Body Vibrations: From Basic Experiments to Effects of Seat and Steering-Wheel Vibrations on the Passenger’s Comfort Inside Vehicles. Ph.D. Dissertation, Shaker Verlag, Aachen, Germany, 2002. [Google Scholar]
  30. Bellmann, M.A.; Mellert, V.; Remmers, H.; Weber, W. Influence of Frequency and Magnitude on the Perception of Vertical Whole-Body Vibration. Joint Congress CFA/DAGA’04 (2004), Strasbourg, March 22–25. Available online: http://www.conforg.fr/cfadaga2004/cdrom/data/procs/articles/000510.pdf (accessed on 13 June 2014).
Figure 1. Photos of the developed VSU during the validation measurements. (a) The version based on the ADXL 355 (left) next to the reference accelerometers (right), and (b) the version based on the piezoelectric VSU TE 805-0050-01 with the visible circuit board consisting of the accelerometer, a mini XLR connector, and all necessary electronic components for a direct connection to an audio interface. In addition, a low-noise piezoelectric accelerometer is added to the board and used as a reference.
Acoustics 06 00006 g001
Figure 2. Comparison of acceleration recorded on the floor using a capacitive MEMS accelerometer (ADXL355) in blue and a piezoelectric reference accelerometer in red.
Acoustics 06 00006 g002
Figure 3. Comparison of the acceleration recorded with the VSU and a low-noise commercial vibration meter. The recorded transient corresponds to the single impact of a person walking on the floor.
Acoustics 06 00006 g003
Figure 4. Comparison of the FFTs of the accelerations recorded with the VSU and a low-noise commercial vibration meter. The FFTs correspond to the time signals shown in Figure 3.
Acoustics 06 00006 g004
Figure 5. Capturing the vibration signals with the VSU on site in the red circle (a) and in the test suite (b).
Acoustics 06 00006 g005
Figure 6. Photo of the vibration exposure device (VED) installed in the central position of the ambisonics reproduction system.
Acoustics 06 00006 g006
Figure 7. Loading of the platform (not yet installed in the anechoic chamber) during the preliminary frequency response measurements at a load of 45 kg (a) and 90 kg (b).
Acoustics 06 00006 g007
Figure 8. Measured frequency responses of the VED in the design phase at four different load conditions. The gray area represents the relatively flat operating frequency range.
Acoustics 06 00006 g008
Figure 9. Measured frequency responses (top) and coherence (bottom) of the final version of the VED in the anechoic chamber. For two different loading conditions (left/right), the response is constant (+/− 5dB) in the operating frequency range.
Acoustics 06 00006 g009
Table 1. Upper measurement frequencies for accelerometers to meet the mass requirements. The values are provided considering the additional mass of the cable/connector and for different building materials.
AccelerometerMass in gCableRC 1HB 1CLT 1GPB 1
Bruel and Kjaer 4553-B 8excluded
21included>5 kHz>5 kHz>5 kHz>5 kHz
VSU with XLR25excluded
67included>5 kHz<4.85 kHz<2.70 kHz<3.83 kHz
VSU with mini XLR24excluded
32included>5 kHz>5 kHz>5 kHz>5 kHz
1 RC—reinforced concrete, HB—hollow brick, CLT—cross-laminated timber, and GPB—gypsum plasterboard.
Disclaimer/Publisher’s Note: The statements, opinions and data contained in all publications are solely those of the individual author(s) and contributor(s) and not of MDPI and/or the editor(s). MDPI and/or the editor(s) disclaim responsibility for any injury to people or property resulting from any ideas, methods, instructions or products referred to in the content.

