

Influence of Test Room Acoustics on Non-Native Listeners’ Standardized Test Performance †


Abstract
:1. Introduction
1.1. Background
1.2. The Present Study
2. Materials and Methods
2.1. Participants
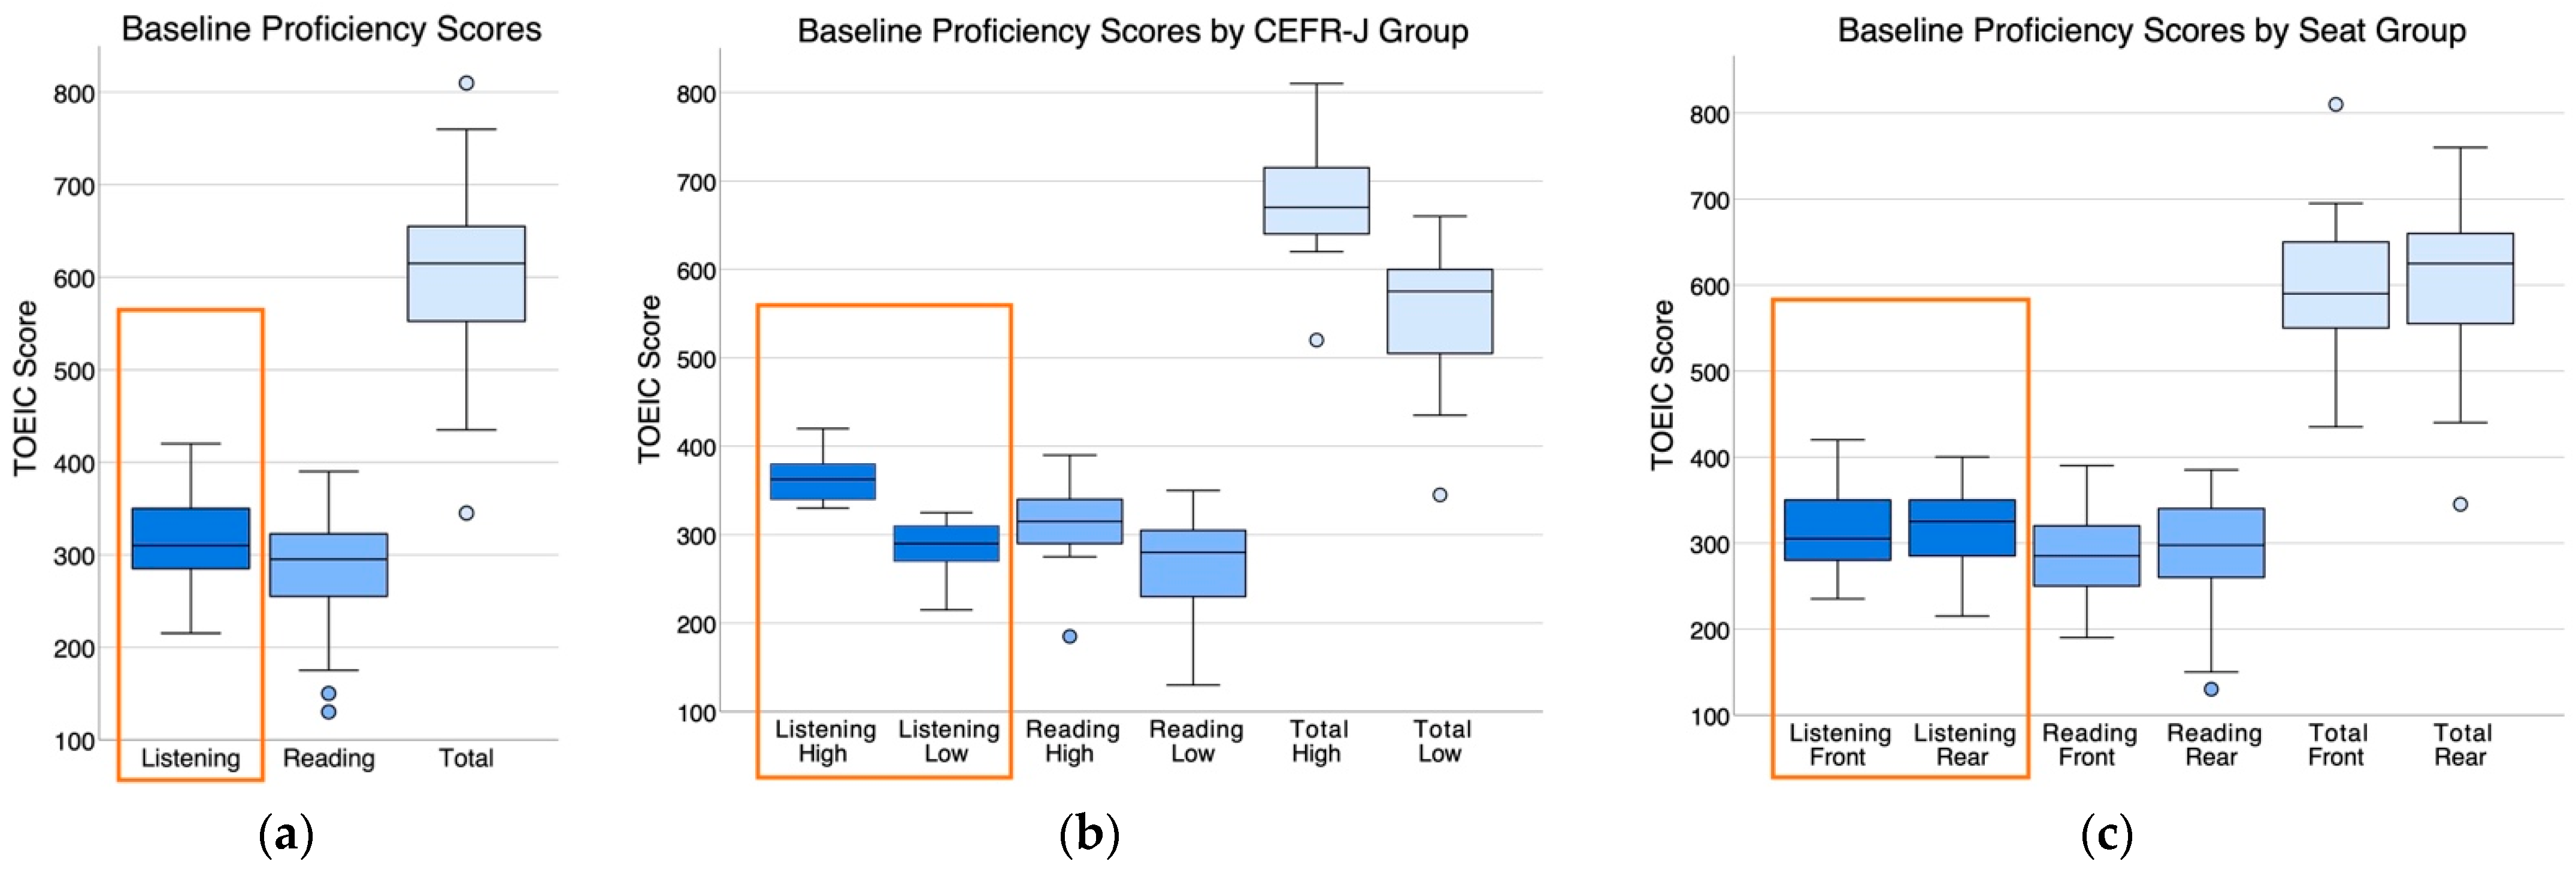
2.1.1. Baseline Proficiency Levels
2.2. Test Rooms
2.2.1. Sound Sources
2.2.2. Speech Transmission Index
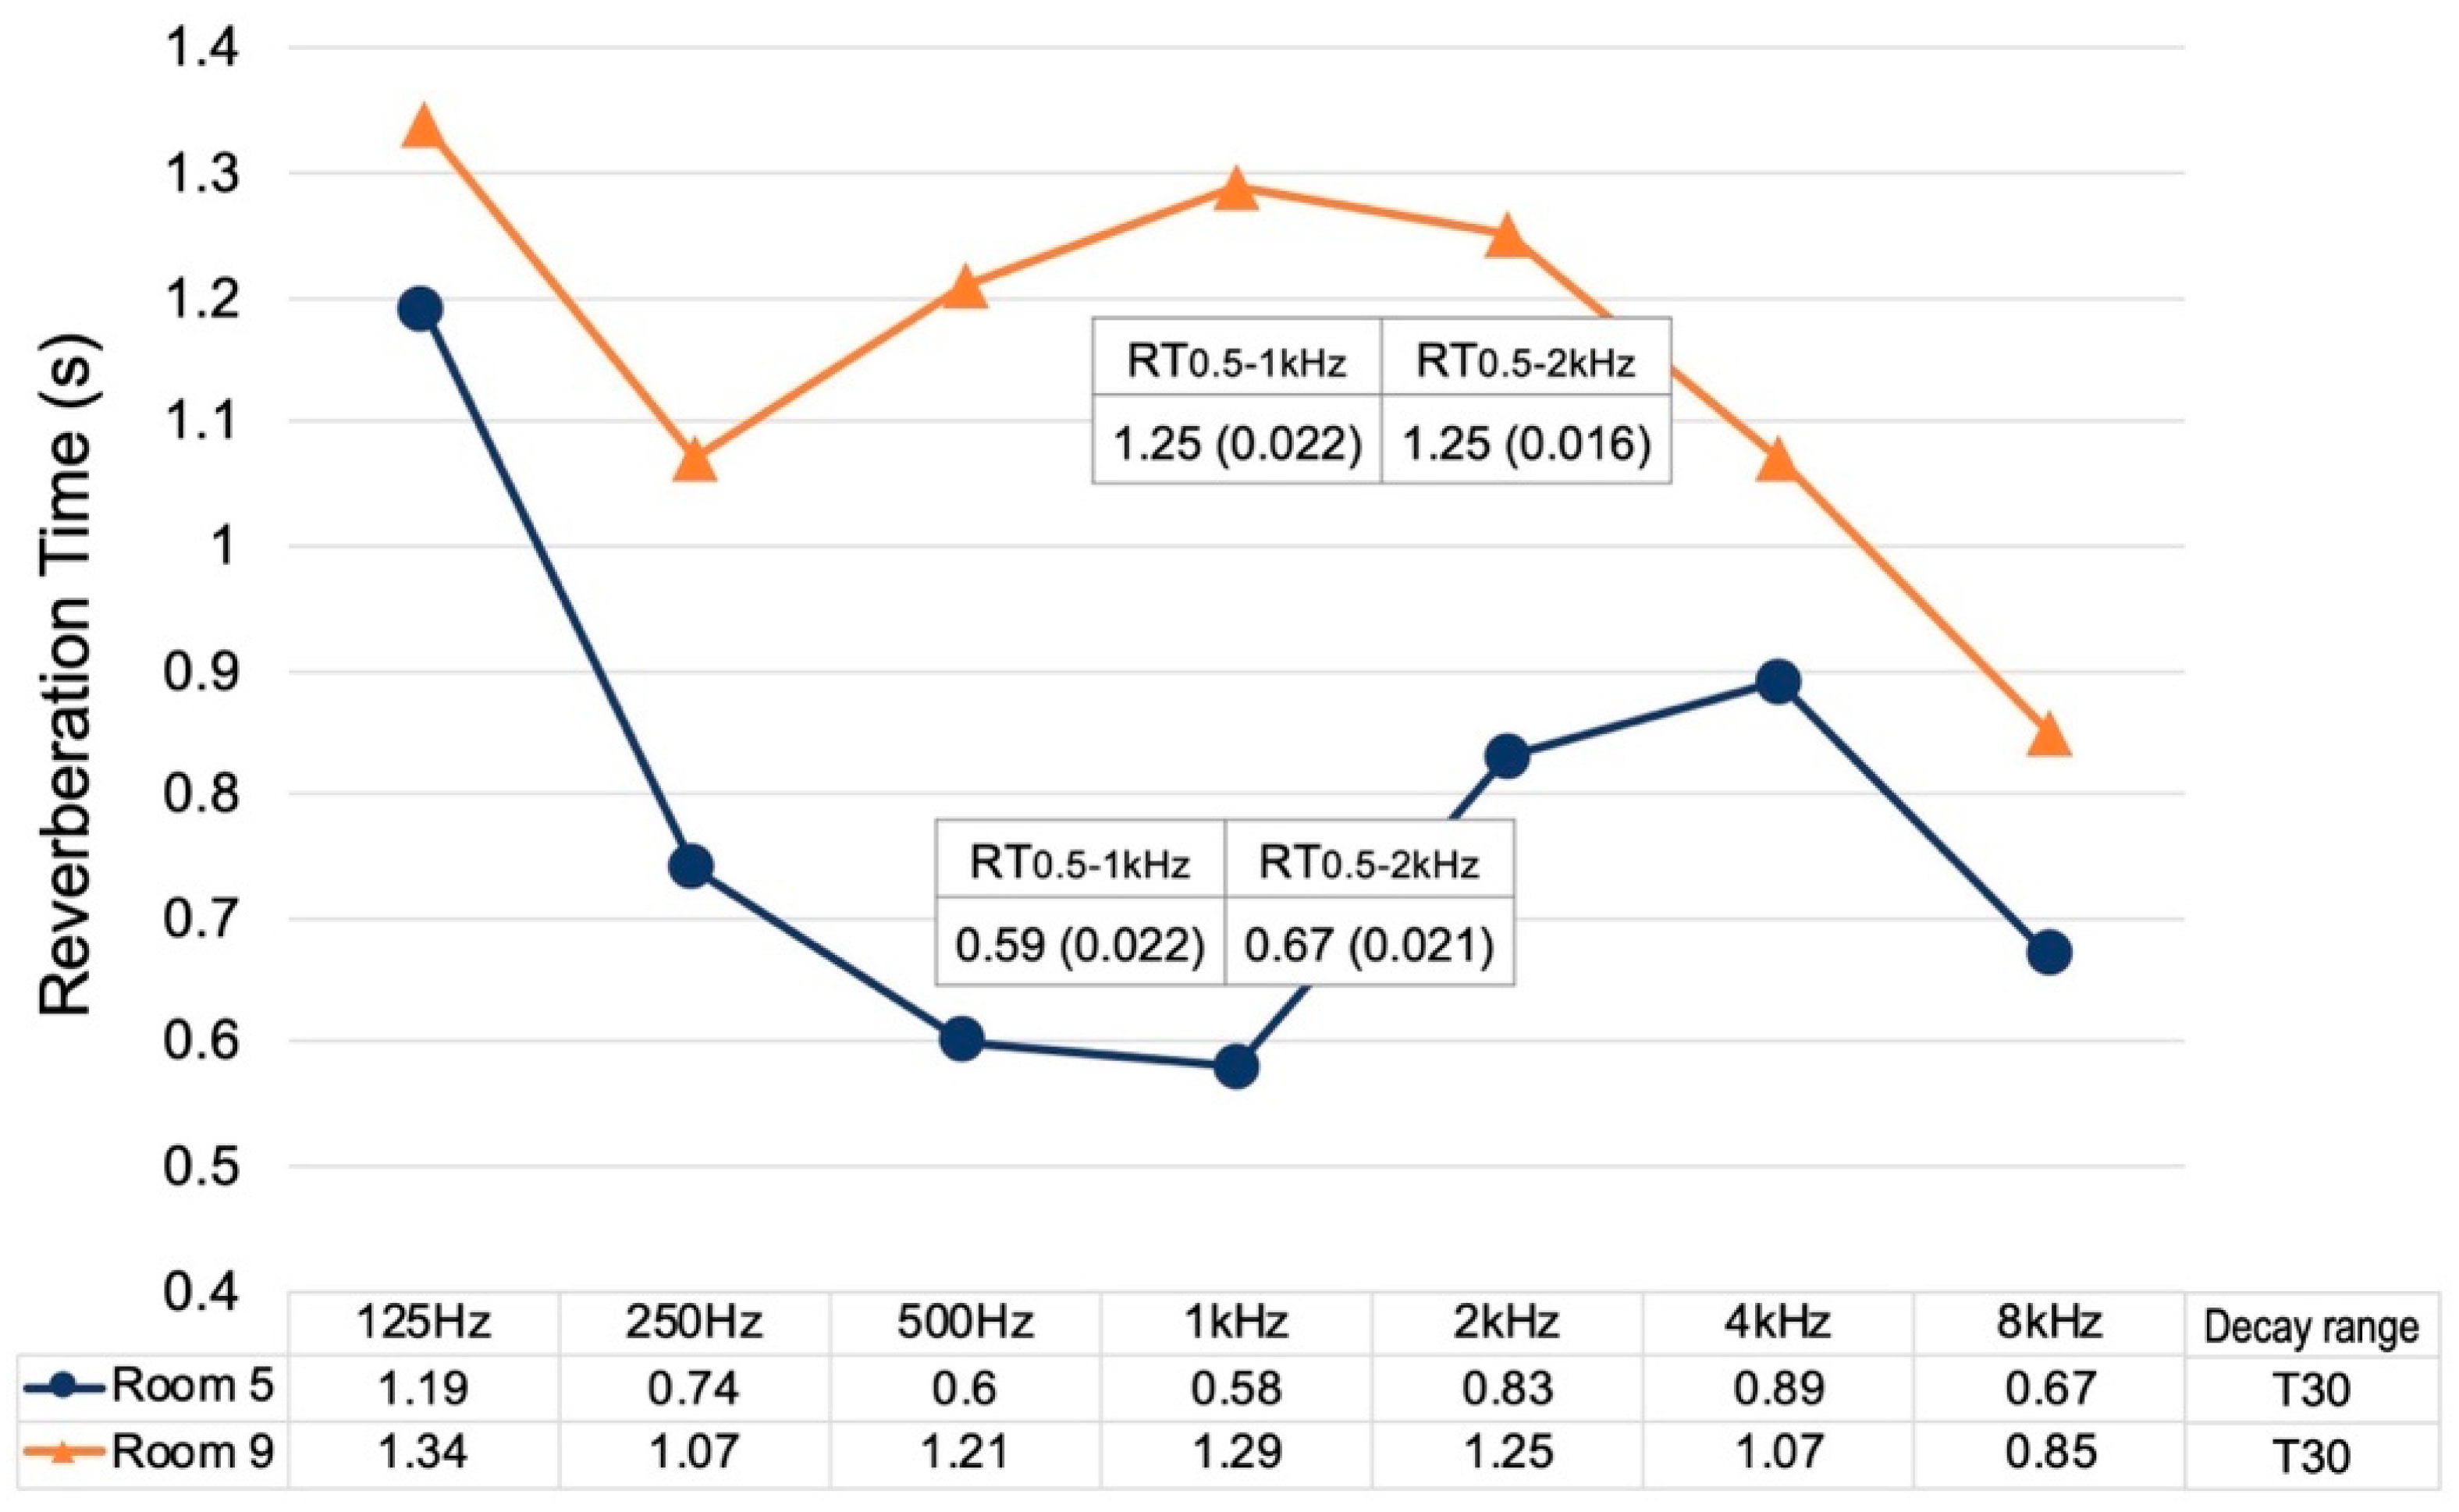
2.2.3. Reverberation Time
2.3. Experiment Procedures
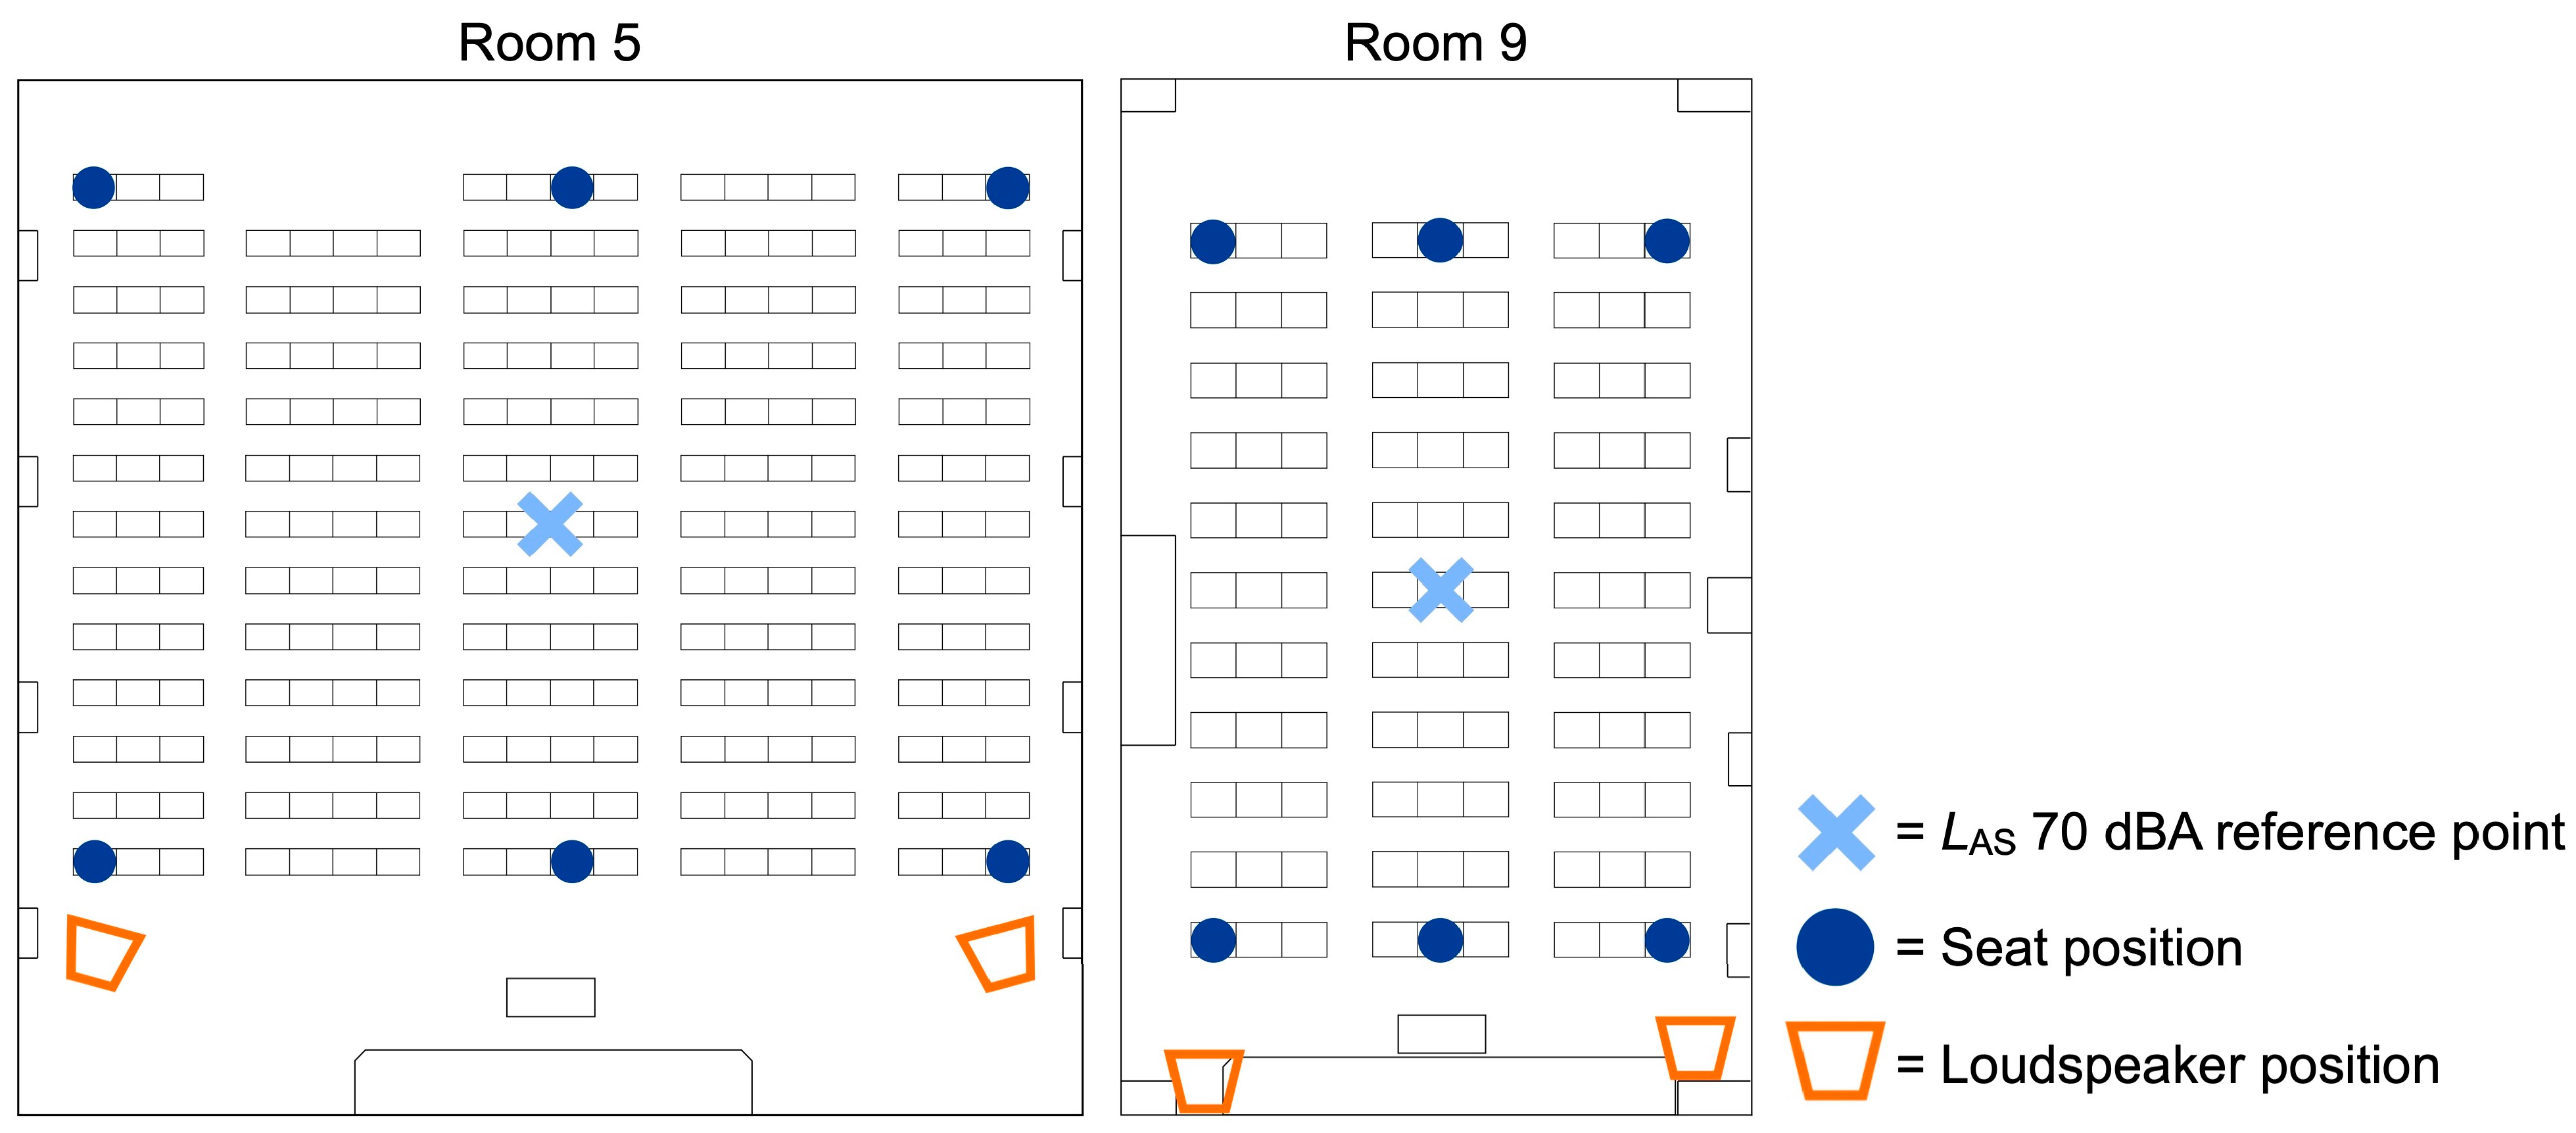
2.3.1. Seat Positions
2.3.2. Test Material
2.3.3. Sound Pressure Level
2.3.4. Room Preparation
2.3.5. Background Noise Level
2.3.6. Compensation
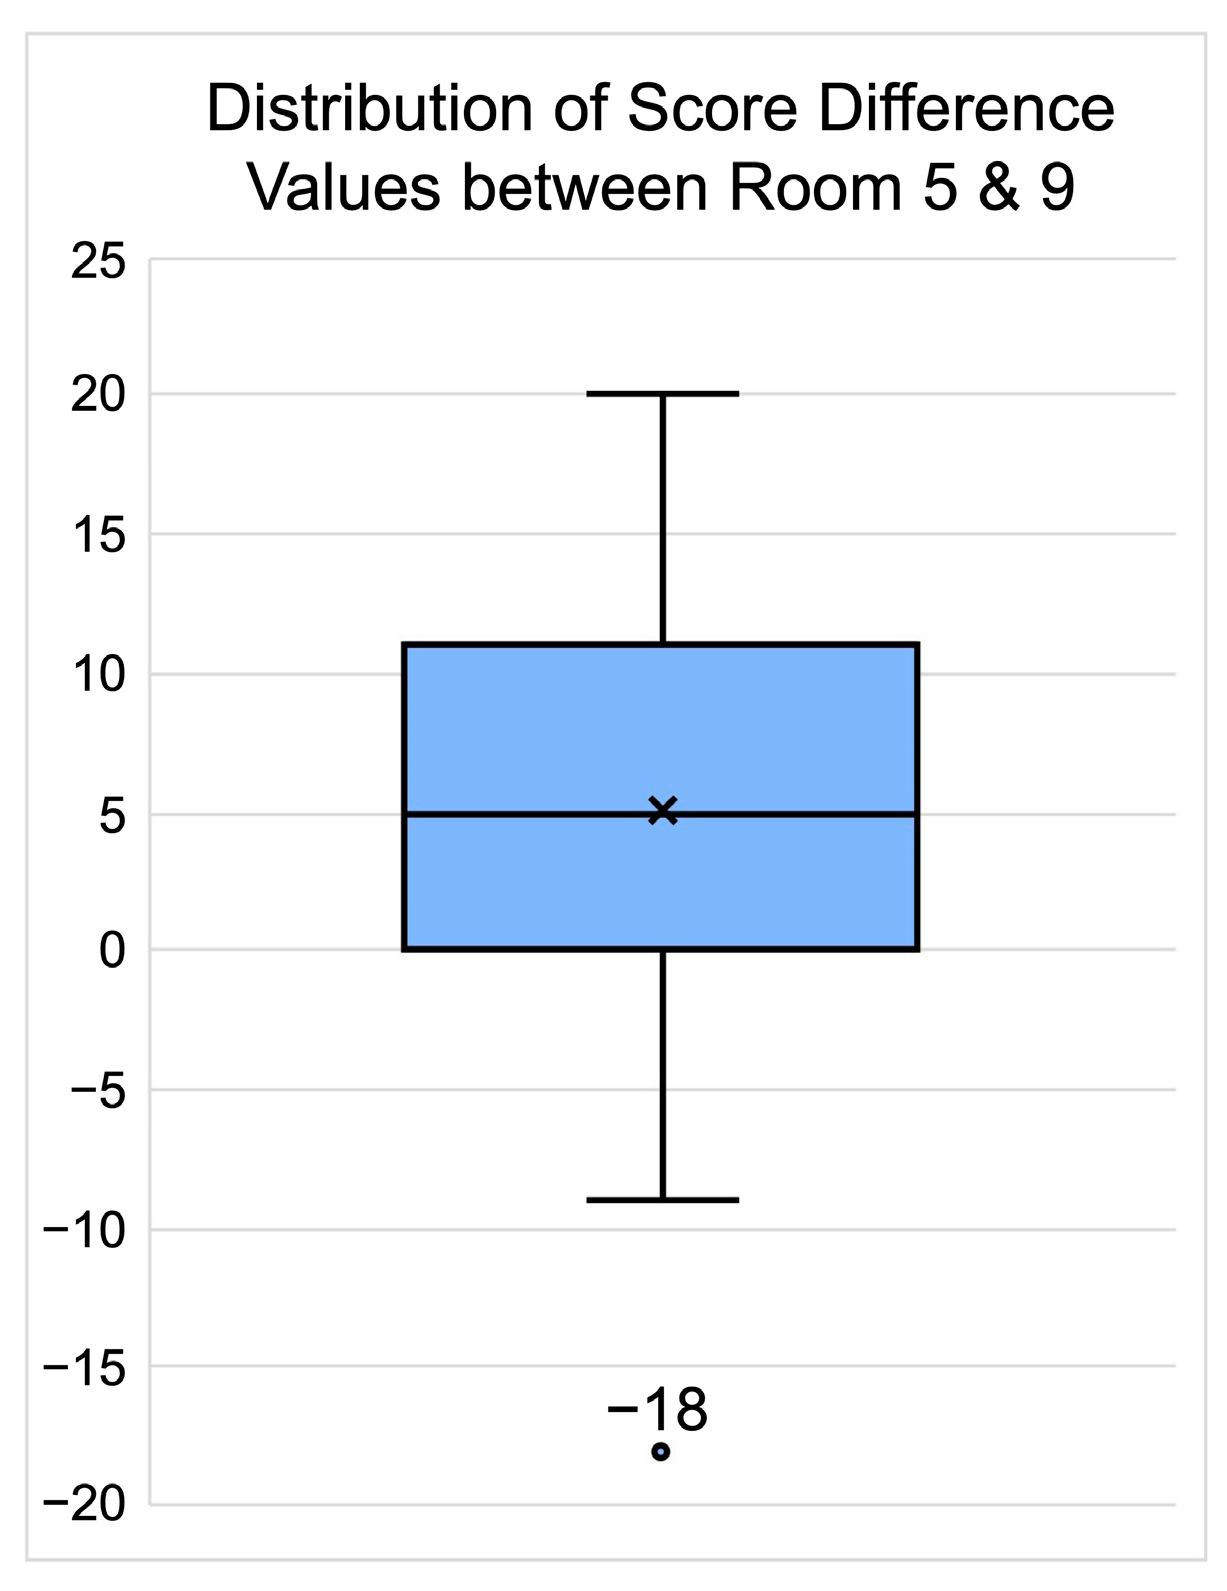
3. Results
4. Discussion
4.1. Reverberation Time
4.2. Speech-to-Noise Ratio
4.3. Standardized Assessment Methods
4.4. Sound Source to Receiver Distance
4.5. Listening Effort
4.6. University Facilities
4.7. Recommendations for Standardized Tests
4.8. Limitations and Future Studies
5. Conclusions
Author Contributions
Funding
Institutional Review Board Statement
Informed Consent Statement
Data Availability Statement
Acknowledgments
Conflicts of Interest
References
- IELTS. IELTS Guide for Teachers 2019; IELTS: Manchester, UK, 2019. [Google Scholar]
- Educational Testing Service. TOEFL iBT Test and Score Data Summary 2022; ETS: Princeton, NJ, USA, 2022. [Google Scholar]
- Educational Testing Service. TOEIC Listening & Reading Test Examinee Handbook 2022; ETS: Princeton, NJ, USA, 2022. [Google Scholar]
- Eberhard, D.M.; Simons, G.F.; Fennig, C.D. (Eds.) Ethnologue: Languages of the World, 26th ed.; SIL International: Dallas, TX, USA, 2023; Available online: http://www.ethnologue.com (accessed on 1 November 2023).
- Should I Take IELTS on Computer or Paper? Available online: https://ieltsjp.com/japan/about/article-computer-delivered-paper-based-ielts-comparison/en-gb (accessed on 1 November 2023).
- The TOEFL Assessment Series. Available online: https://www.ets.org/toefl/itp.html (accessed on 1 November 2023).
- TOEIC Listening & Reading Test. Available online: https://www.iibc-global.org/english/toeic/corpo/toeic.html (accessed on 1 November 2023).
- IELTS Online. Available online: https://ielts.org/take-a-test/test-types/ielts-academic-test/ielts-online (accessed on 1 November 2023).
- At Home Testing for the TOEFL iBT Test. Available online: https://www.ets.org/toefl/test-takers/ibt/test-day/at-home-test-day.html (accessed on 1 November 2023).
- TOEIC Program IP Test Online. Available online: https://www.iibc-global.org/toeic/corpo/guide/online_program.html (accessed on 1 November 2023).
- van Wijngaarden, S.J.; Bronkhorst, A.W.; Houtgast, T.; Steeneken, H.J.M. Using the Speech Transmission Index for predicting non-native speech intelligibility. J. Acoust. Soc. Am. 2004, 115, 1281–1291. [Google Scholar] [CrossRef]
- Escobar, V.G.; Morillas, J.M.B. Analysis of intelligibility and reverberation time recommendations in educational rooms. Appl. Acoust. 2015, 96, 1–10. [Google Scholar] [CrossRef]
- Yang, D.; Mak, C.M. An investigation of speech intelligibility for second language students in classrooms. Appl. Acoust. 2018, 134, 54–59. [Google Scholar] [CrossRef]
- Sörqvist, P.; Hurtig, A.; Ljung, R.; Rönnberg, J. High second-language proficiency protects against the effects of reverberation on listening comprehension. Scand. J. Psychol. 2014, 55, 91–96. [Google Scholar] [CrossRef]
- Mealings, K. Classroom acoustic conditions: Understanding what is suitable through a review of national and international standards, recommendations, and live classroom measurements. In Proceedings of the Acoustics 2016: The Second Australasian Acoustical Societies Conference, Brisbane, Australia, 9–11 November 2016. [Google Scholar]
- MacCutcheon, D.; Hurtig, A.; Pausch, F.; Hygge, S.; Fels, J.; Ljung, R. Second language vocabulary level is related to benefits for second language listening comprehension under lower reverberation time conditions. J. Cogn. Psychol. 2019, 31, 175–185. [Google Scholar] [CrossRef]
- Puglisi, G.E.; Warzybok, A.; Astolfi, A.; Kollmeier, B. Effect of reverberation and noise type on speech intelligibility in real complex acoustic scenarios. Build. Environ. 2021, 204, 108137. [Google Scholar] [CrossRef]
- Mayo, L.H.; Florentine, M.; Buus, S. Age of second-language acquisition and perception of speech in noise. J. Speech Lang. Hear. Res. 1997, 40, 686–693. [Google Scholar] [CrossRef]
- Tabri, D.; Chacra, K.M.S.A.; Pring, T. Speech perception in noise by monolingual, bilingual and trilingual listeners. Int. J. Lang. Commun. Disord. 2011, 46, 411–422. [Google Scholar] [CrossRef]
- Kilman, L.; Zekveld, A.; Hällgren, M.; Rönnberg, J. The influence of non-native language proficiency on speech perception performance. Front. Psychol. 2014, 5, 651. [Google Scholar] [CrossRef] [PubMed]
- Scharenborg, O.; van Os, M. Why listening in background noise is harder in a non-native language than in a native language: A review. Speech Commun. 2019, 108, 53–64. [Google Scholar] [CrossRef]
- Bistafa, S.R.; Bradley, J.S. Reverberation time and maximum background-noise level for classrooms from a comparative study of speech intelligibility metrics. J. Acoust. Soc. Am. 2000, 107, 861–875. [Google Scholar] [CrossRef]
- Crandell, C.C.; Smaldino, J.J. Classroom acoustics for children with normal hearing and with hearing impairment. Lang. Speech Hear Serv. Sch. 2000, 31, 362–370. [Google Scholar] [CrossRef] [PubMed]
- van Wijngaarden, S.J.; Steeneken, H.J.M.; Houtgast, T. Quantifying the intelligibility of speech in noise for non-native listeners. J. Acoust. Soc. Am. 2002, 111, 1906–1916. [Google Scholar] [CrossRef] [PubMed]
- Bradley, J.S.; Sato, H. The intelligibility of speech in elementary school classrooms. J. Acoust. Soc. Am. 2008, 123, 2078–2086. [Google Scholar] [CrossRef] [PubMed]
- Warzybok, A.; Brand, T.; Wagener, K.C.; Kollmeier, B. How much does language proficiency by non-native listeners influence speech audiometric tests in noise? Int. J. Audiol. 2015, 54, 88–99. [Google Scholar] [CrossRef] [PubMed]
- Choi, J.Y. The intelligibility of speech in university classrooms during lectures. Appl. Acoust. 2020, 162, 107211. [Google Scholar] [CrossRef]
- Picou, E.M.; Gordon, J.; Ricketts, T.A. The effects of noise and reverberation on listening effort for adults with normal hearing. Ear Hear. 2016, 37, 1–13. [Google Scholar] [CrossRef]
- Lam, A.; Hodgson, M.; Prodi, N.; Visentin, C. Effects of classroom acoustics on speech intelligibility and response time: A comparison between native and non-native listeners. Build. Acoust. 2018, 25, 35–42. [Google Scholar] [CrossRef]
- Peng, Z.E.; Wang, L.M. Listening effort by native and nonnative listeners due to noise, reverberation, and talker foreign accent during English speech perception. J. Speech Lang. Hear. Res. 2019, 62, 1068–1081. [Google Scholar] [CrossRef]
- Hurtig, A.; Sörqvist, P.; Ljung, R.; Hygge, S.; Rönnberg, J. Student’s second-language grade may depend on classroom listening position. PLoS ONE 2016, 11, e0156533. [Google Scholar] [CrossRef]
- Visentin, C.; Prodi, N.; Cappelletti, F.; Torresin, S.; Gasparella, A. Speech intelligibility and listening effort in university classrooms for native and non-native Italian listeners. Build. Acoust. 2019, 26, 275–291. [Google Scholar] [CrossRef]
- Srinivasan, N.K. The Perception of Natural, Cell Phone, and Computer-Synthesized Speech during the Performance of Si- multaneous Visual–Motor Tasks. Ph.D. Dissertation, University of Nebraska, Lincoln, NE, USA, 2010. [Google Scholar]
- Kawata, M.; Sato, K.; Tsuruta-Hamamura, M.; Hasegawa, H. Analysis of standardized foreign language listening test scores and their relationship to speech transmission index and reverberation time in test rooms. In Proceedings of the 27th International Congress on Sound and Vibration, ICSV27, Virtual, 11–16 July 2021. [Google Scholar]
- Kawata, M.; Tsuruta-Hamamura, M.; Hasegawa, H. Assessment of speech transmission index and reverberation time in standardized English as a foreign language test rooms. Appl. Acoust. 2023, 202, 109093. [Google Scholar] [CrossRef]
- Steeneken, H.J.M.; Houtgast, T. A physical method for measuring speech-transmission quality. J. Acoust. Soc. Am. 1980, 67, 318–326. [Google Scholar] [CrossRef]
- Council of Europe. Common European Framework of Reference for Languages: Learning, Teaching, Assessment: Companion volume, Council of Europe Publishing, Strasbourg. 2020. Available online: www.coe.int/lang-cefr (accessed on 1 November 2023).
- CEFR-J, European Language Portfolio CAN-DO Descriptors. 2012. Available online: http://www.cefr-j.org/index.html (accessed on 1 November 2023).
- Educational Testing Service. Official TOEIC Listening & Reading Workbook 9, 1st ed.; The Institute for International Business Communication: Tokyo, Japan, 2023. [Google Scholar]
- TOEIC Test Results. Available online: https://www.iibc-global.org/english/toeic/test/lr/guide05.html (accessed on 1 November 2023).
- TOEIC SP Schedule & Test Locations by Prefecture. Available online: https://www.iibc-global.org/toeic/test/lr/guide01/schedule/area.html (accessed on 1 November 2023).
- Educational Testing Service. TOEIC Program Data Analysis 2022; ETS: Princeton, NJ, USA, 2022. [Google Scholar]
- Nestoras, C.; Dance, S. The interrelationship between room acoustics parameters as measured in university classrooms using four source configurations. Build. Acoust. 2013, 20, 43–54. [Google Scholar] [CrossRef]
- Prodeus, A.; Didkovska, M. Assessment of speech intelligibility in university lecture rooms of different sizes using objective and subjective methods. East-Eur. J. Enterp. Technol. 2021, 3, 47–56. [Google Scholar] [CrossRef]
- Minelli, G.; Puglisi, G.E.; Astolfi, A. Acoustical parameters for learning in classroom: A review. Build. Environ. 2022, 208, 108582. [Google Scholar] [CrossRef]
- Mealings, K. A scoping review of the effect of classroom acoustic conditions on university students’ listening, learning, and well-being. J. Speech Lang. Hear. Res. 2023, 66, 4653–4672. [Google Scholar] [CrossRef]
- Mealings, K. Validation of the SoundOut room acoustics analyzer app for classrooms: A new method for self-assessment of noise levels and reverberation time in schools. Acoust. Aust. 2019, 47, 277–283. [Google Scholar] [CrossRef]


| Room | Length (m) | Width (m) | Height (m) | Volume (m3) | Total Seating Capacity | Exam Seating Capacity | Seating Style | Floor Type | Acoustic Classification |
|---|---|---|---|---|---|---|---|---|---|
| 5 | 14.22 | 13.80 | 3.22 | 631.88 | 230 | 128 | Front-facing | Tiered | Favorable |
| 9 | 14.66 | 8.41 | 2.72 | 335.35 | 130 | 66 | Front-facing | Flat | Unfavorable |
| Power Amplifier | Loudspeaker | |||||
|---|---|---|---|---|---|---|
| Room | Brand and Model Number | Output Power (W) | Brand and Model Number | Type | Components | Units |
| 5 | JVC PA-806 1 | 60 W | Panasonic WS-AT80 3 | 2-way | 20 cm woofer + SCWG horn tweeter | 2 |
| 9 | Yamaha MA2030a 2 | 30 W | Sony SRP-S320 4 | 1-way | 12 cm full range | 2 |
| Front Row | Rear Row | Entire Room | |||||||
|---|---|---|---|---|---|---|---|---|---|
| Room | Left | Center | Right | Left | Center | Right | n | Mean | SD |
| 5 | 0.75 | 0.66 | 0.81 | 0.70 | 0.72 | 0.71 | 25 | 0.72 | 0.04 |
| 9 | 0.61 | 0.58 | 0.62 | 0.56 | 0.56 | 0.50 | 15 | 0.56 | 0.03 |
| Room | AC Fan Strength | Ventilation | BNL + HVAC Mean (dBA) | BNL + HVAC SD | Test Audio SPL (dBA) | Test Audio SPL SD | SNR (dB) | SNR SD |
|---|---|---|---|---|---|---|---|---|
| 5 | [W] S P | ON [OFF] | 34.1 | 0.08 | 73.1 | 5.07 | +39.0 | 5.09 |
| 9 | [1] 2 3 4 5 | ON [OFF] | 36.4 | 0.96 | 72.6 | 2.06 | +36.2 | 1.30 |
| Raw Scores | Converted TOEIC Scores | Baseline Proficiency Scores | |||||||||
|---|---|---|---|---|---|---|---|---|---|---|---|
| Room 5 | Room 9 | Room 5 | Room 9 | ||||||||
| n | Mean | SD | Mean | SD | Mean | SD | Mean | SD | Mean | SD | |
| Entire Set | 42 | 62.90 | 9.44 | 57.29 | 10.95 | 314.52 | 47.20 | 286.43 | 54.76 | 319.17 | 48.07 |
| CEFR-J High | 17 | 66.71 | 8.75 | 63.47 | 9.85 | 333.53 | 43.76 | 317.35 | 49.25 | 366.18 | 28.37 |
| CEFR-J Low | 25 | 60.32 | 9.16 | 53.08 | 9.73 | 301.60 | 45.82 | 265.40 | 48.67 | 287.20 | 27.95 |
| Front Seat | 20 | 63.90 | 7.48 | 58.10 | 10.69 | 319.50 | 37.41 | 290.50 | 53.46 | 318.00 | 52.88 |
| Rear Seat | 22 | 62.00 | 11.02 | 56.55 | 11.38 | 310.00 | 55.12 | 282.73 | 56.92 | 320.23 | 44.49 |
| Shapiro–Wilk Normality Test | Paired Samples t-Test | ||||||
|---|---|---|---|---|---|---|---|
| n | p | t | df | 95% CI [Lower, Upper] | p | d | |
| Entire Set | 42 | 0.502 | 4.81 | 41 | [3.258, 7.980] | <0.001 *** | 0.74 |
| CEFR-J High | 17 | 0.367 | 2.13 | 16 | [0.022, 6.449] | 0.049 * | 0.52 |
| CEFR-J Low | 25 | 0.354 | 4.48 | 24 | [3.905, 10.575] | <0.001 *** | 0.90 |
| Front Seat | 20 | 0.354 | 3.80 | 19 | [2.609, 8.991] | 0.001 *** | 0.85 |
| Rear Seat | 22 | 0.584 | 3.06 | 21 | [1.746, 9.163] | 0.006 ** | 0.65 |
| Shapiro–Wilk Normality Test | Levene’s Test | Independent Samples t-Test | |||||||
|---|---|---|---|---|---|---|---|---|---|
| n | p | p | t | df | 95% CI [Lower, Upper] | p | d | ||
| Room 5 | Front | 20 | 0.990 | 0.182 | 0.647 | 40 | [−4.04, 7.84] | 0.521 | 0.20 |
| Rear | 22 | 0.111 | |||||||
| Room 9 | Front | 20 | 0.244 | 0.602 | 0.445 | 40 | [−5.35, 8.46] | 0.652 | 0.14 |
| Rear | 22 | 0.292 | |||||||
Disclaimer/Publisher’s Note: The statements, opinions and data contained in all publications are solely those of the individual author(s) and contributor(s) and not of MDPI and/or the editor(s). MDPI and/or the editor(s) disclaim responsibility for any injury to people or property resulting from any ideas, methods, instructions or products referred to in the content. |
© 2023 by the authors. Licensee MDPI, Basel, Switzerland. This article is an open access article distributed under the terms and conditions of the Creative Commons Attribution (CC BY) license (https://creativecommons.org/licenses/by/4.0/).
Share and Cite
Kawata, M.; Tsuruta-Hamamura, M.; Hasegawa, H. Influence of Test Room Acoustics on Non-Native Listeners’ Standardized Test Performance. Acoustics 2023, 5, 1161-1179. https://doi.org/10.3390/acoustics5040066
Kawata M, Tsuruta-Hamamura M, Hasegawa H. Influence of Test Room Acoustics on Non-Native Listeners’ Standardized Test Performance. Acoustics. 2023; 5(4):1161-1179. https://doi.org/10.3390/acoustics5040066
Chicago/Turabian StyleKawata, Makito, Mariko Tsuruta-Hamamura, and Hiroshi Hasegawa. 2023. "Influence of Test Room Acoustics on Non-Native Listeners’ Standardized Test Performance" Acoustics 5, no. 4: 1161-1179. https://doi.org/10.3390/acoustics5040066