
Exploratory Acoustic Investigation of Customizable 3D-Printed Hybrid Acoustic Materials (HAMs) through Interlaboratory Impedance Tube Measurements


Abstract
:
1. Introduction
2. Methodologies
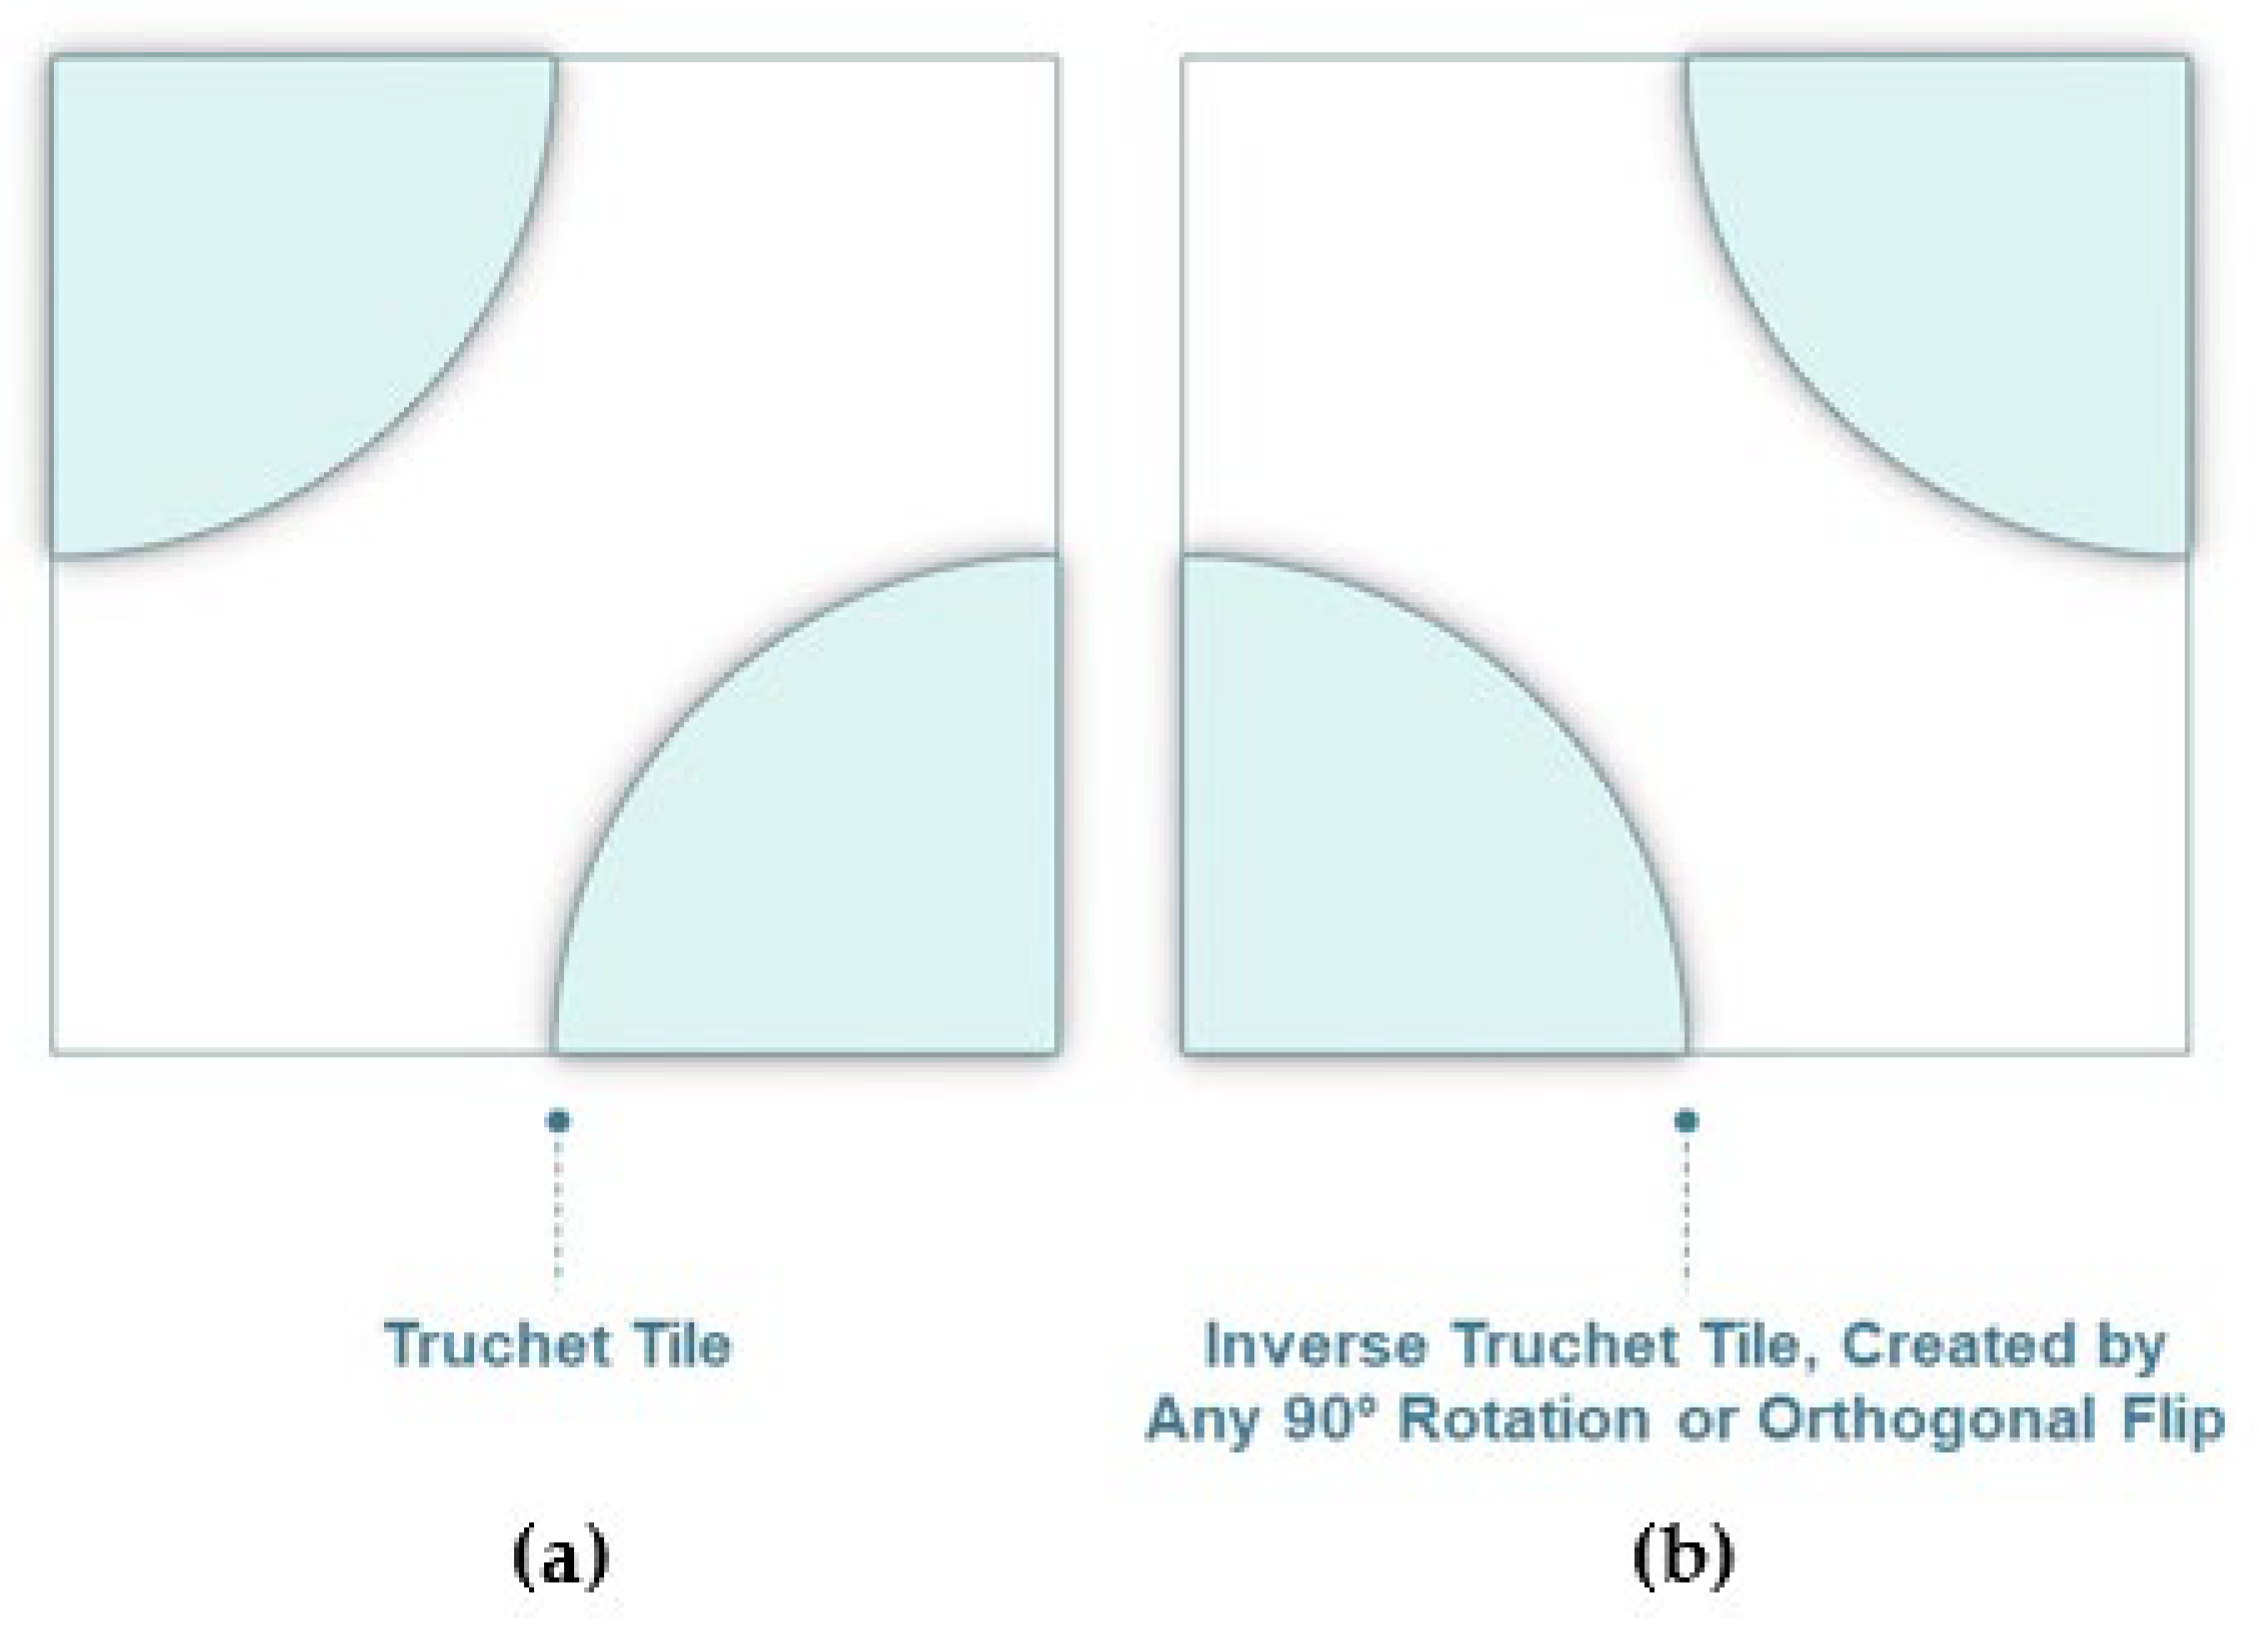
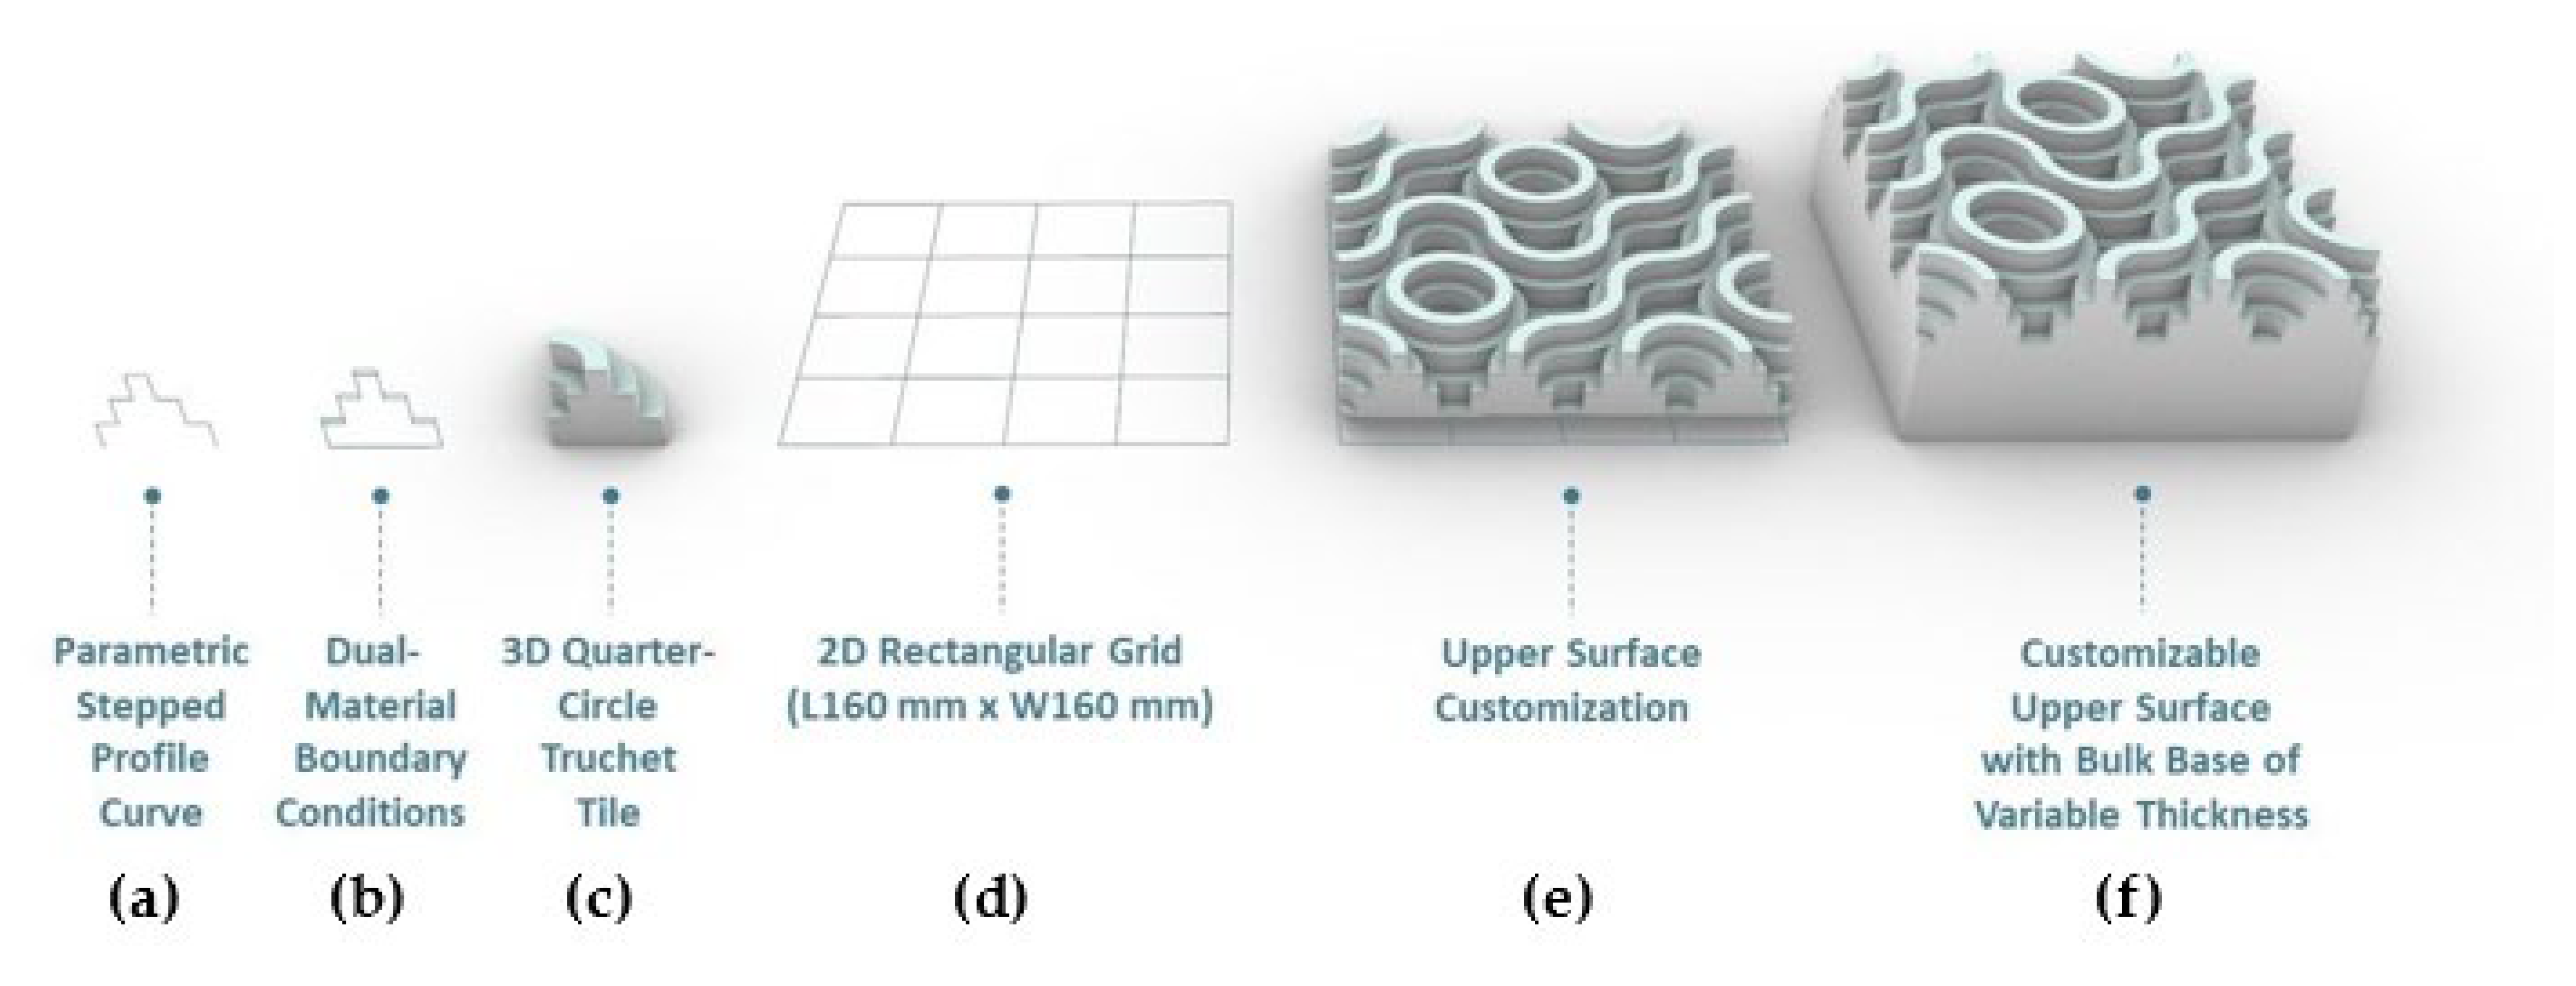
2.1. Design and Theoretical Bases
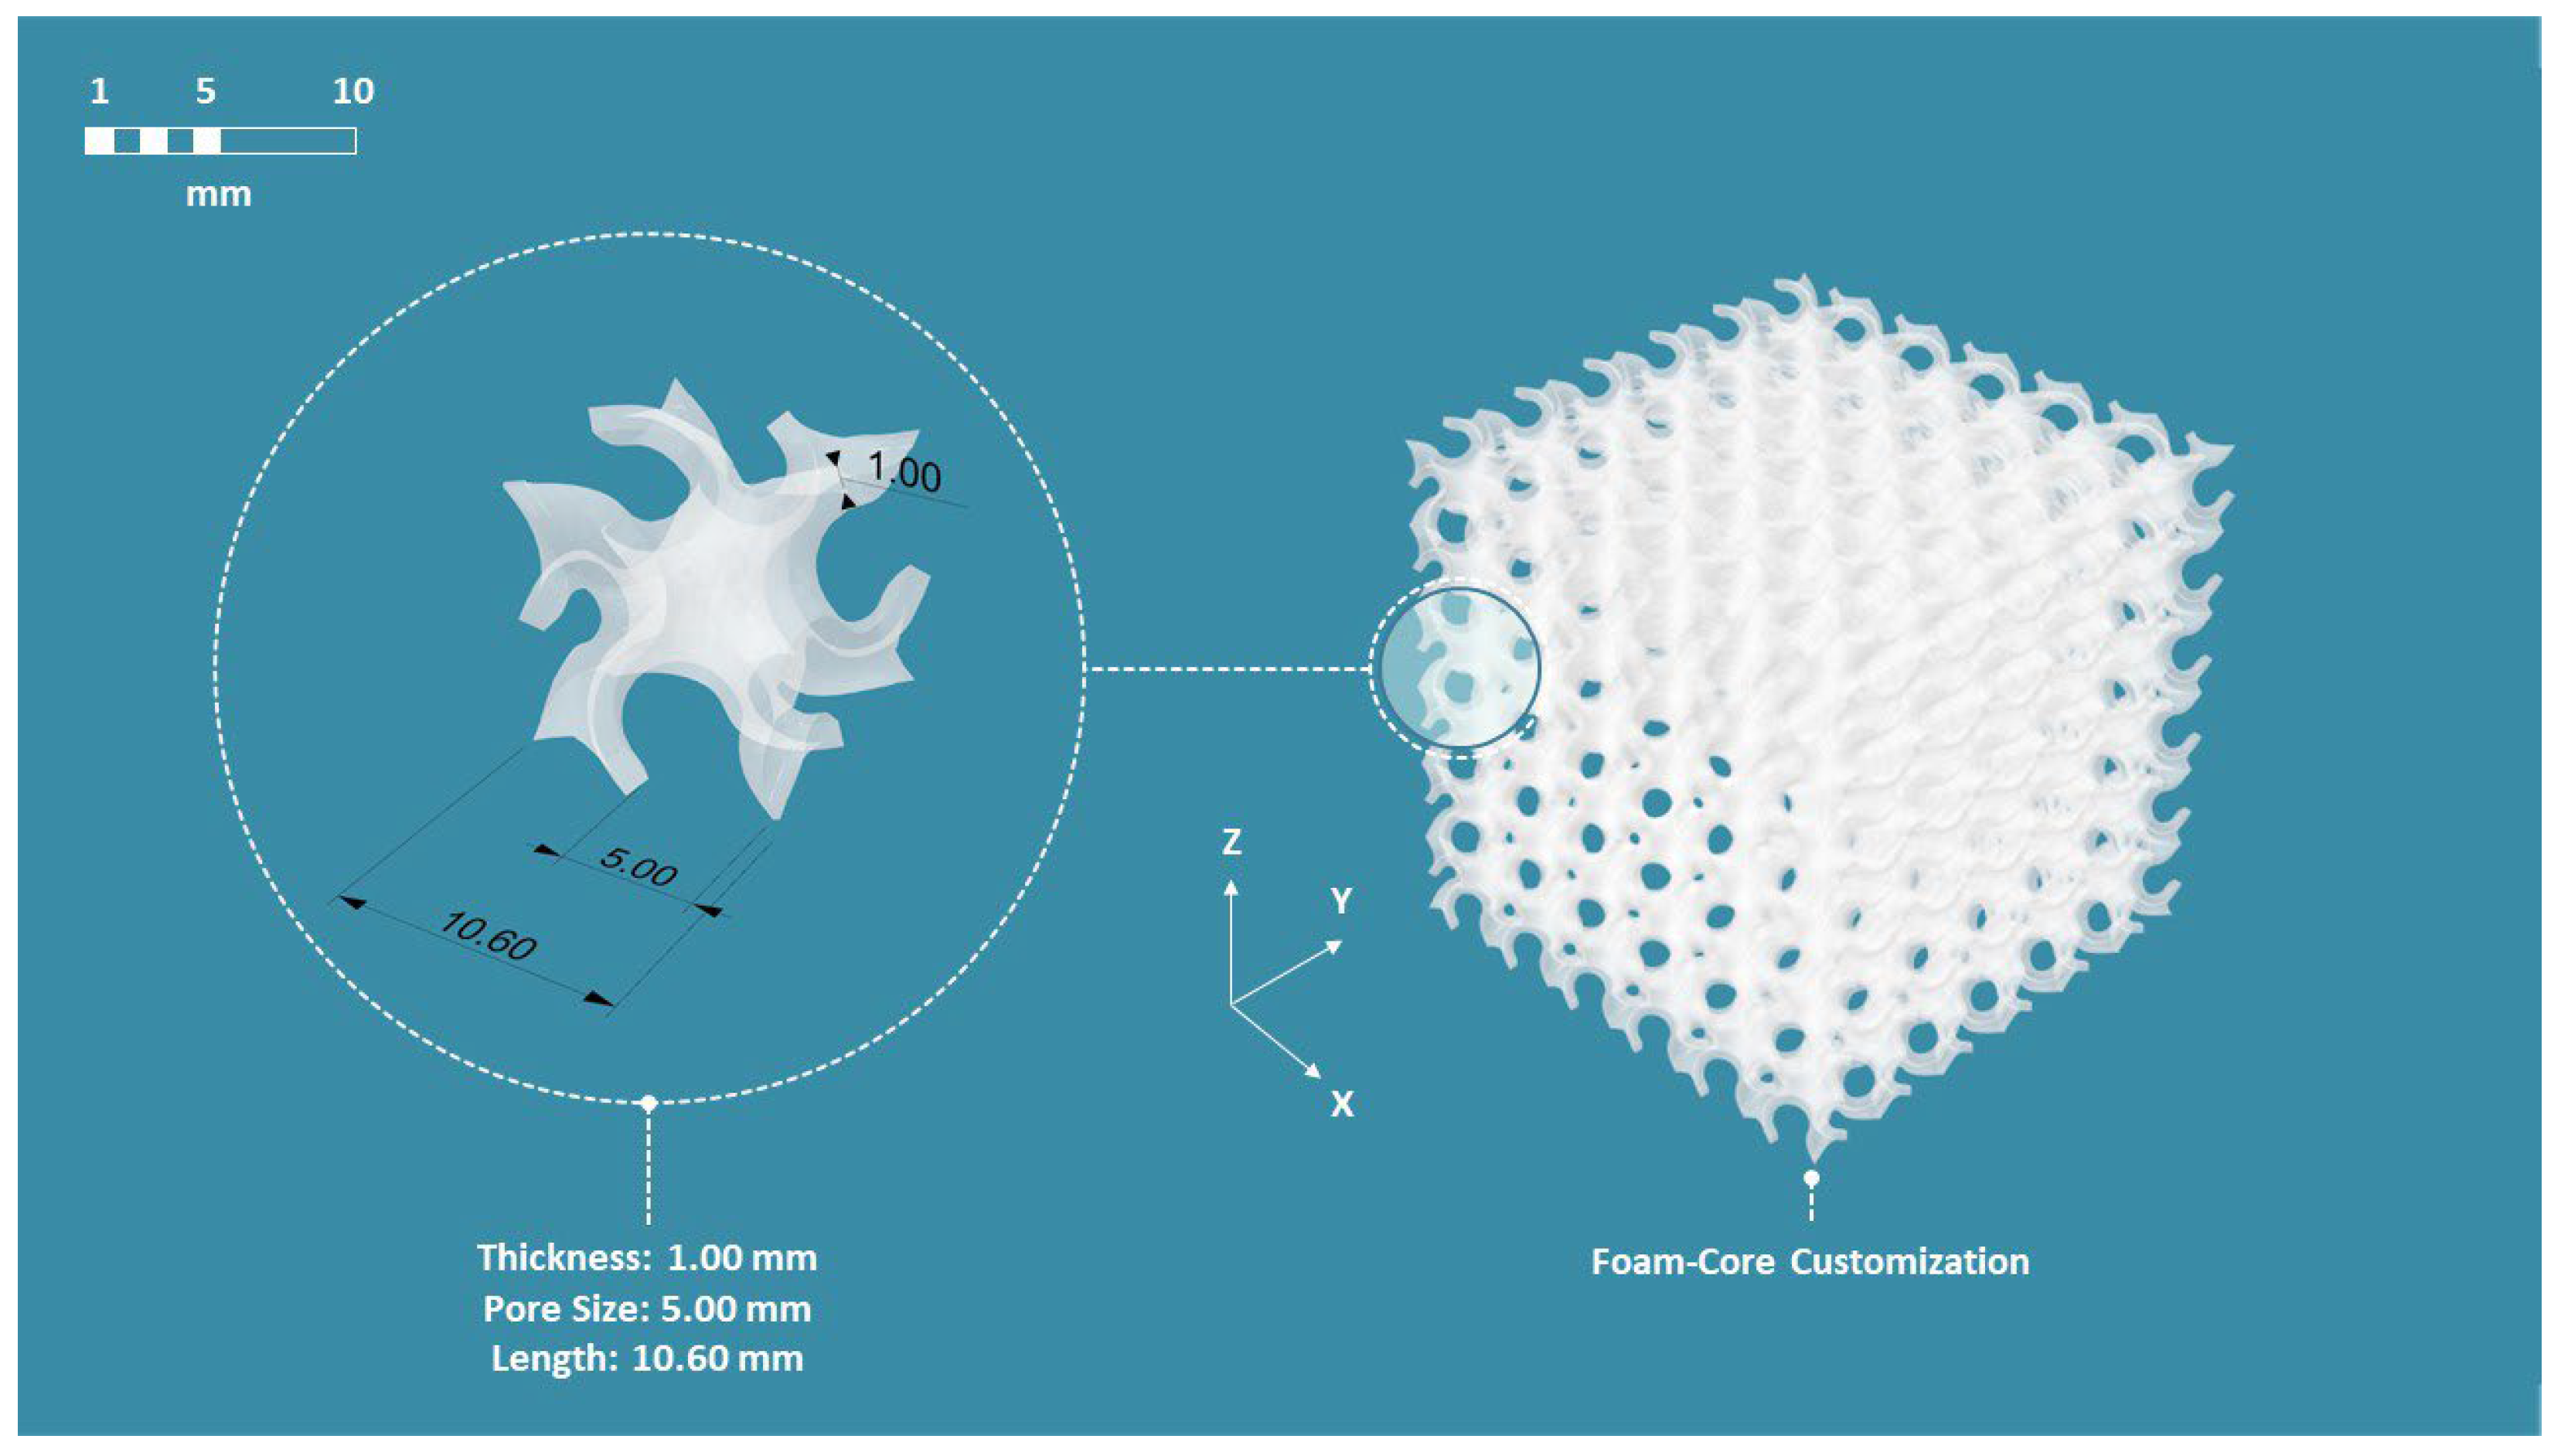
2.2. Materials and Fabrication
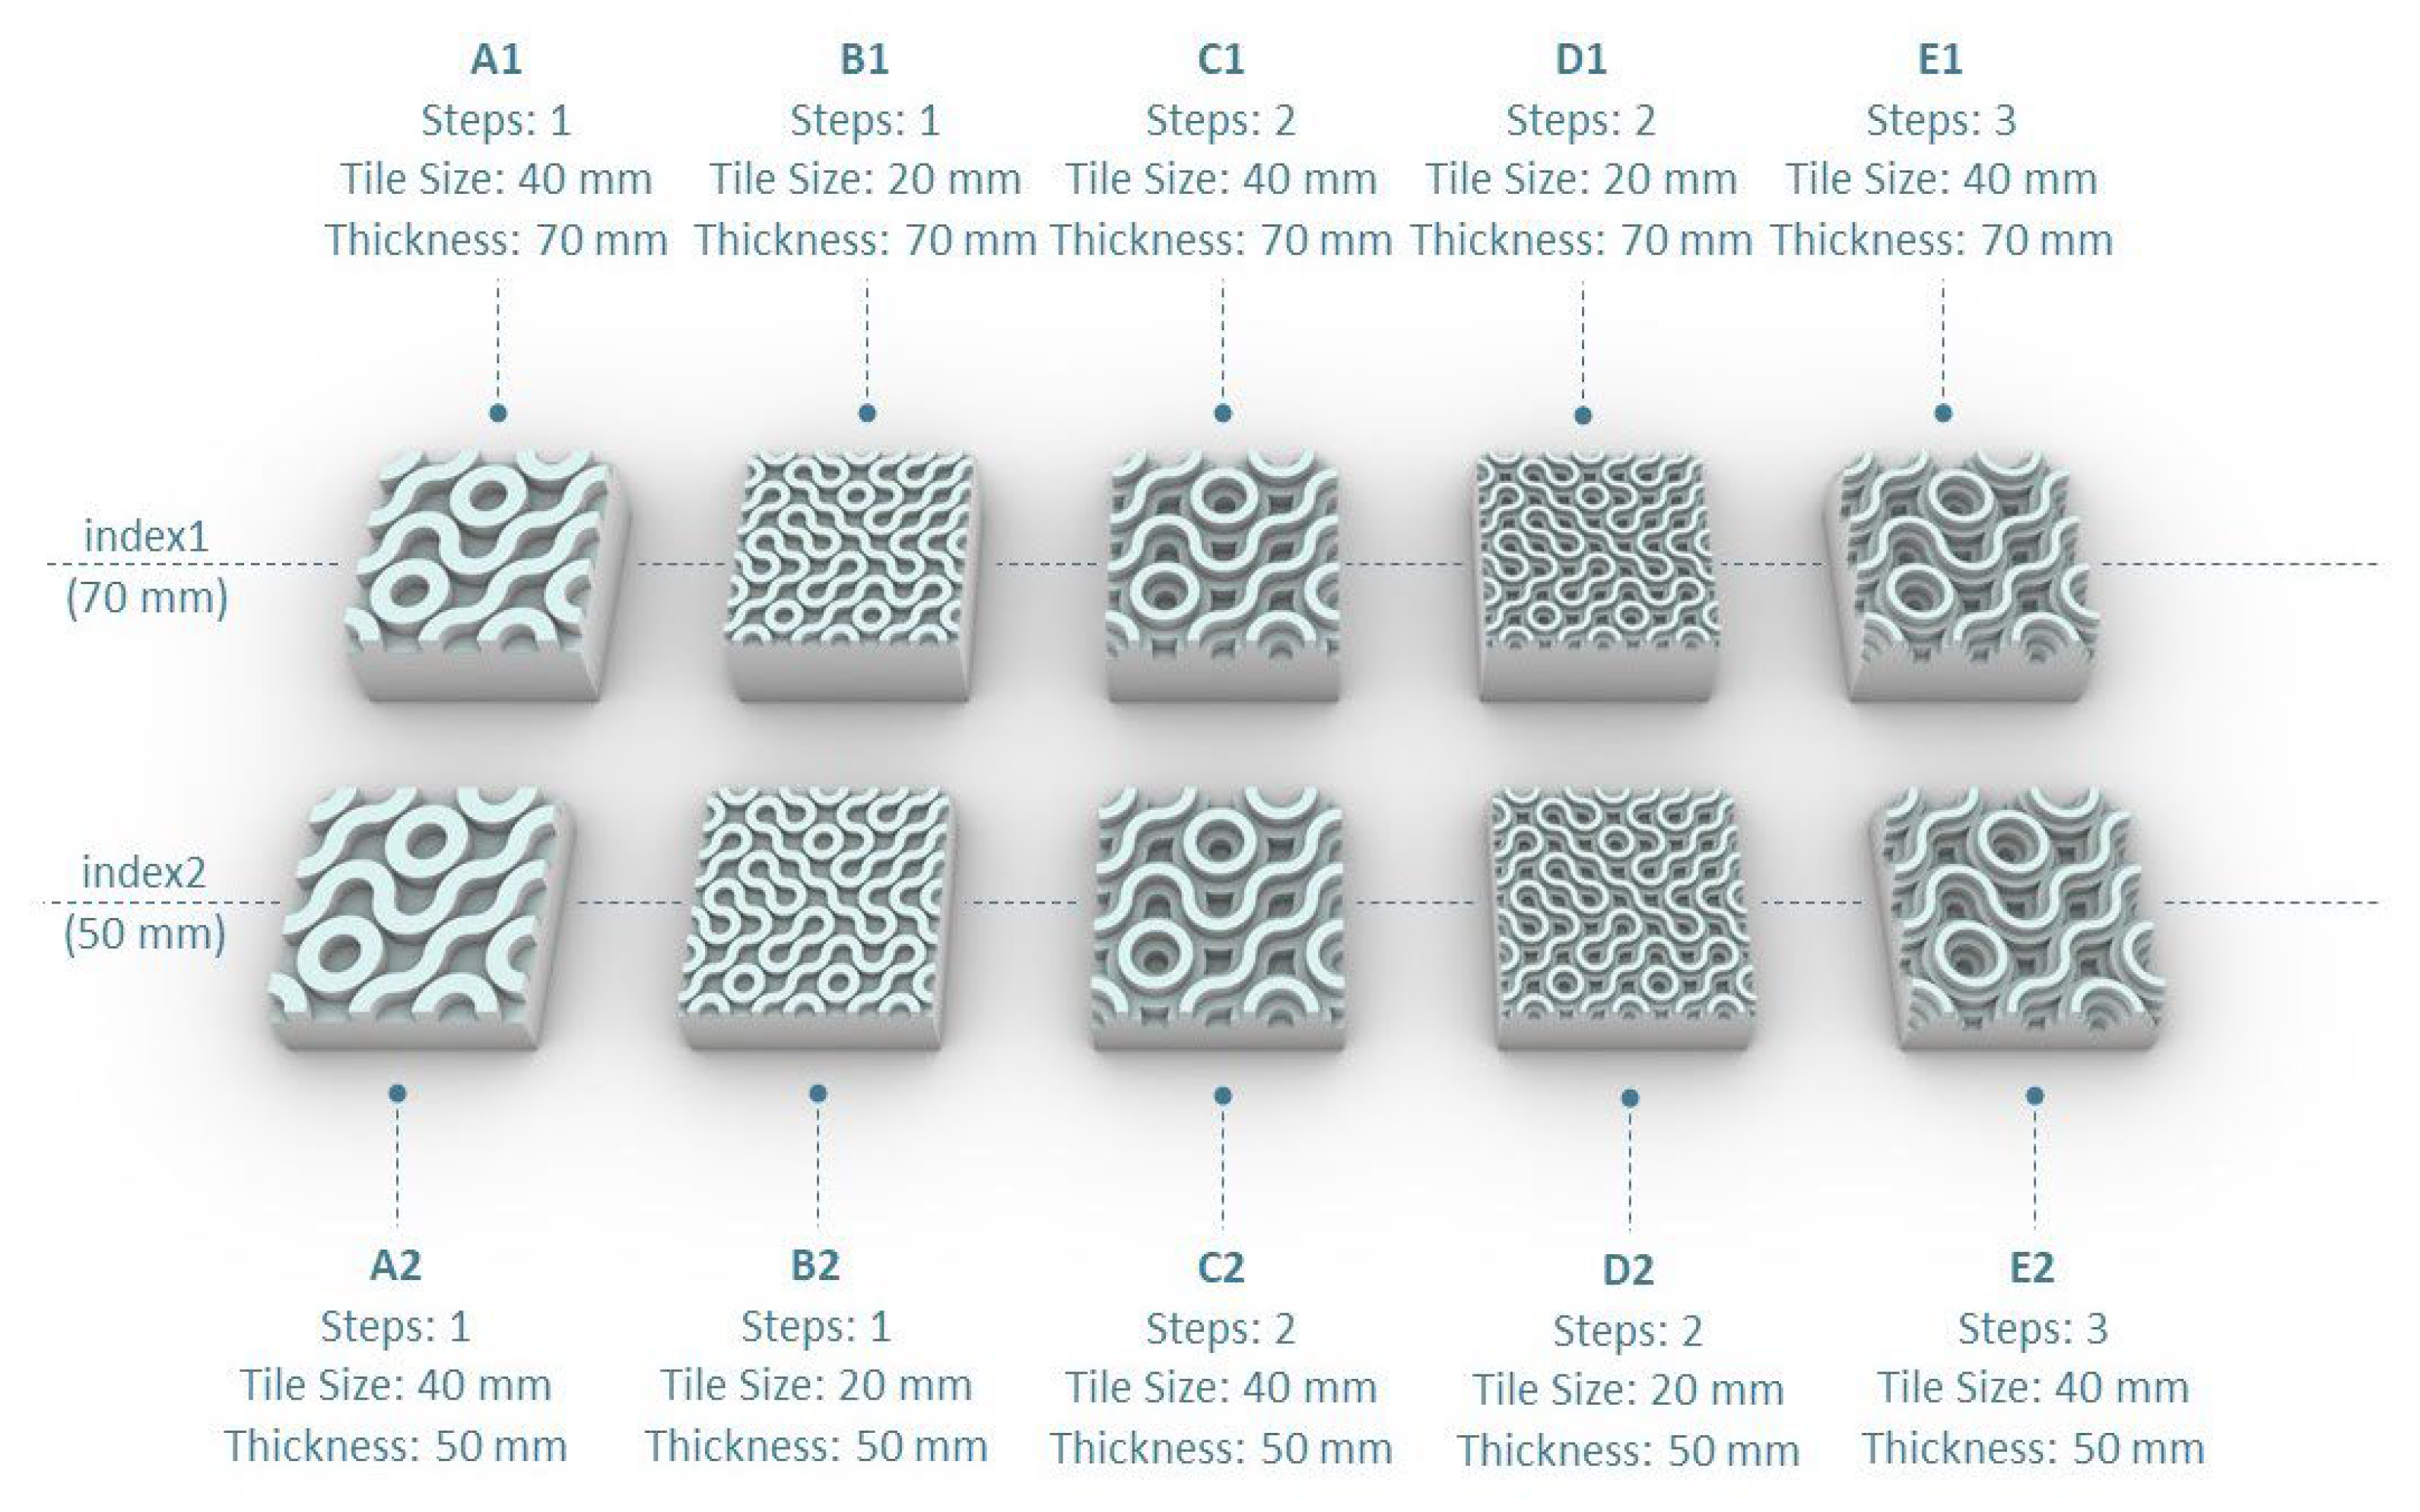
2.3. Tested Configurations
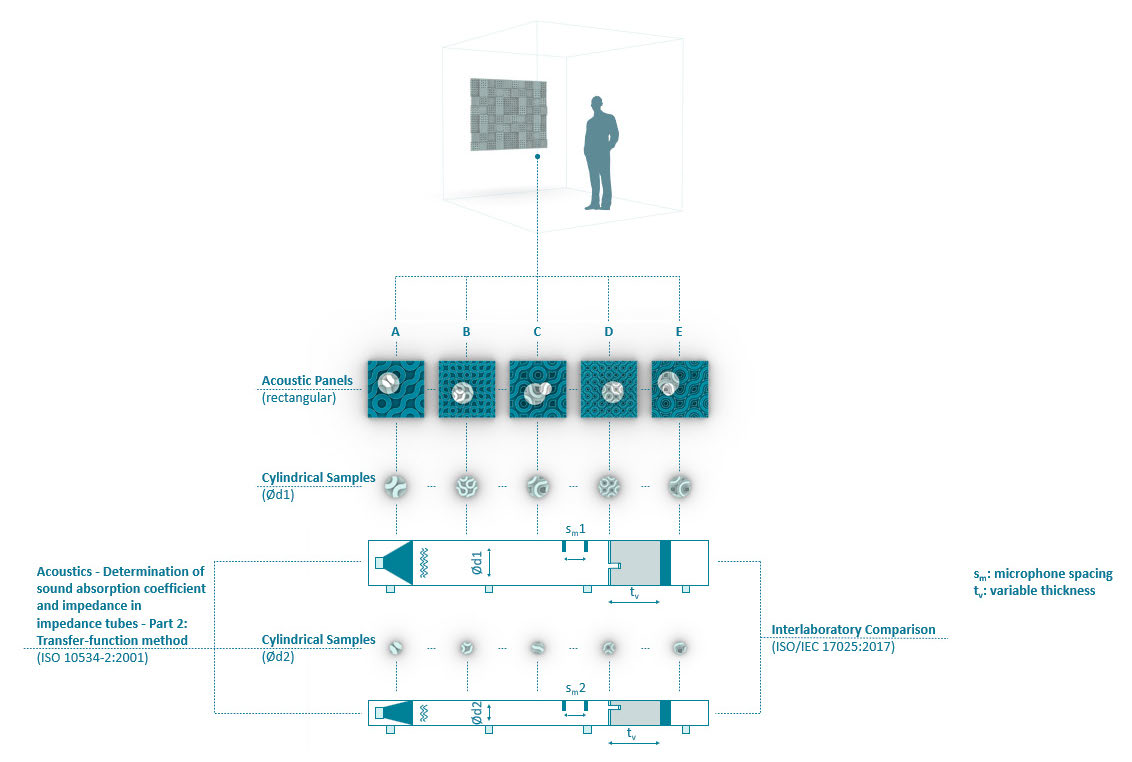
2.4. Acoustic Characterization
3. Results and Discussion
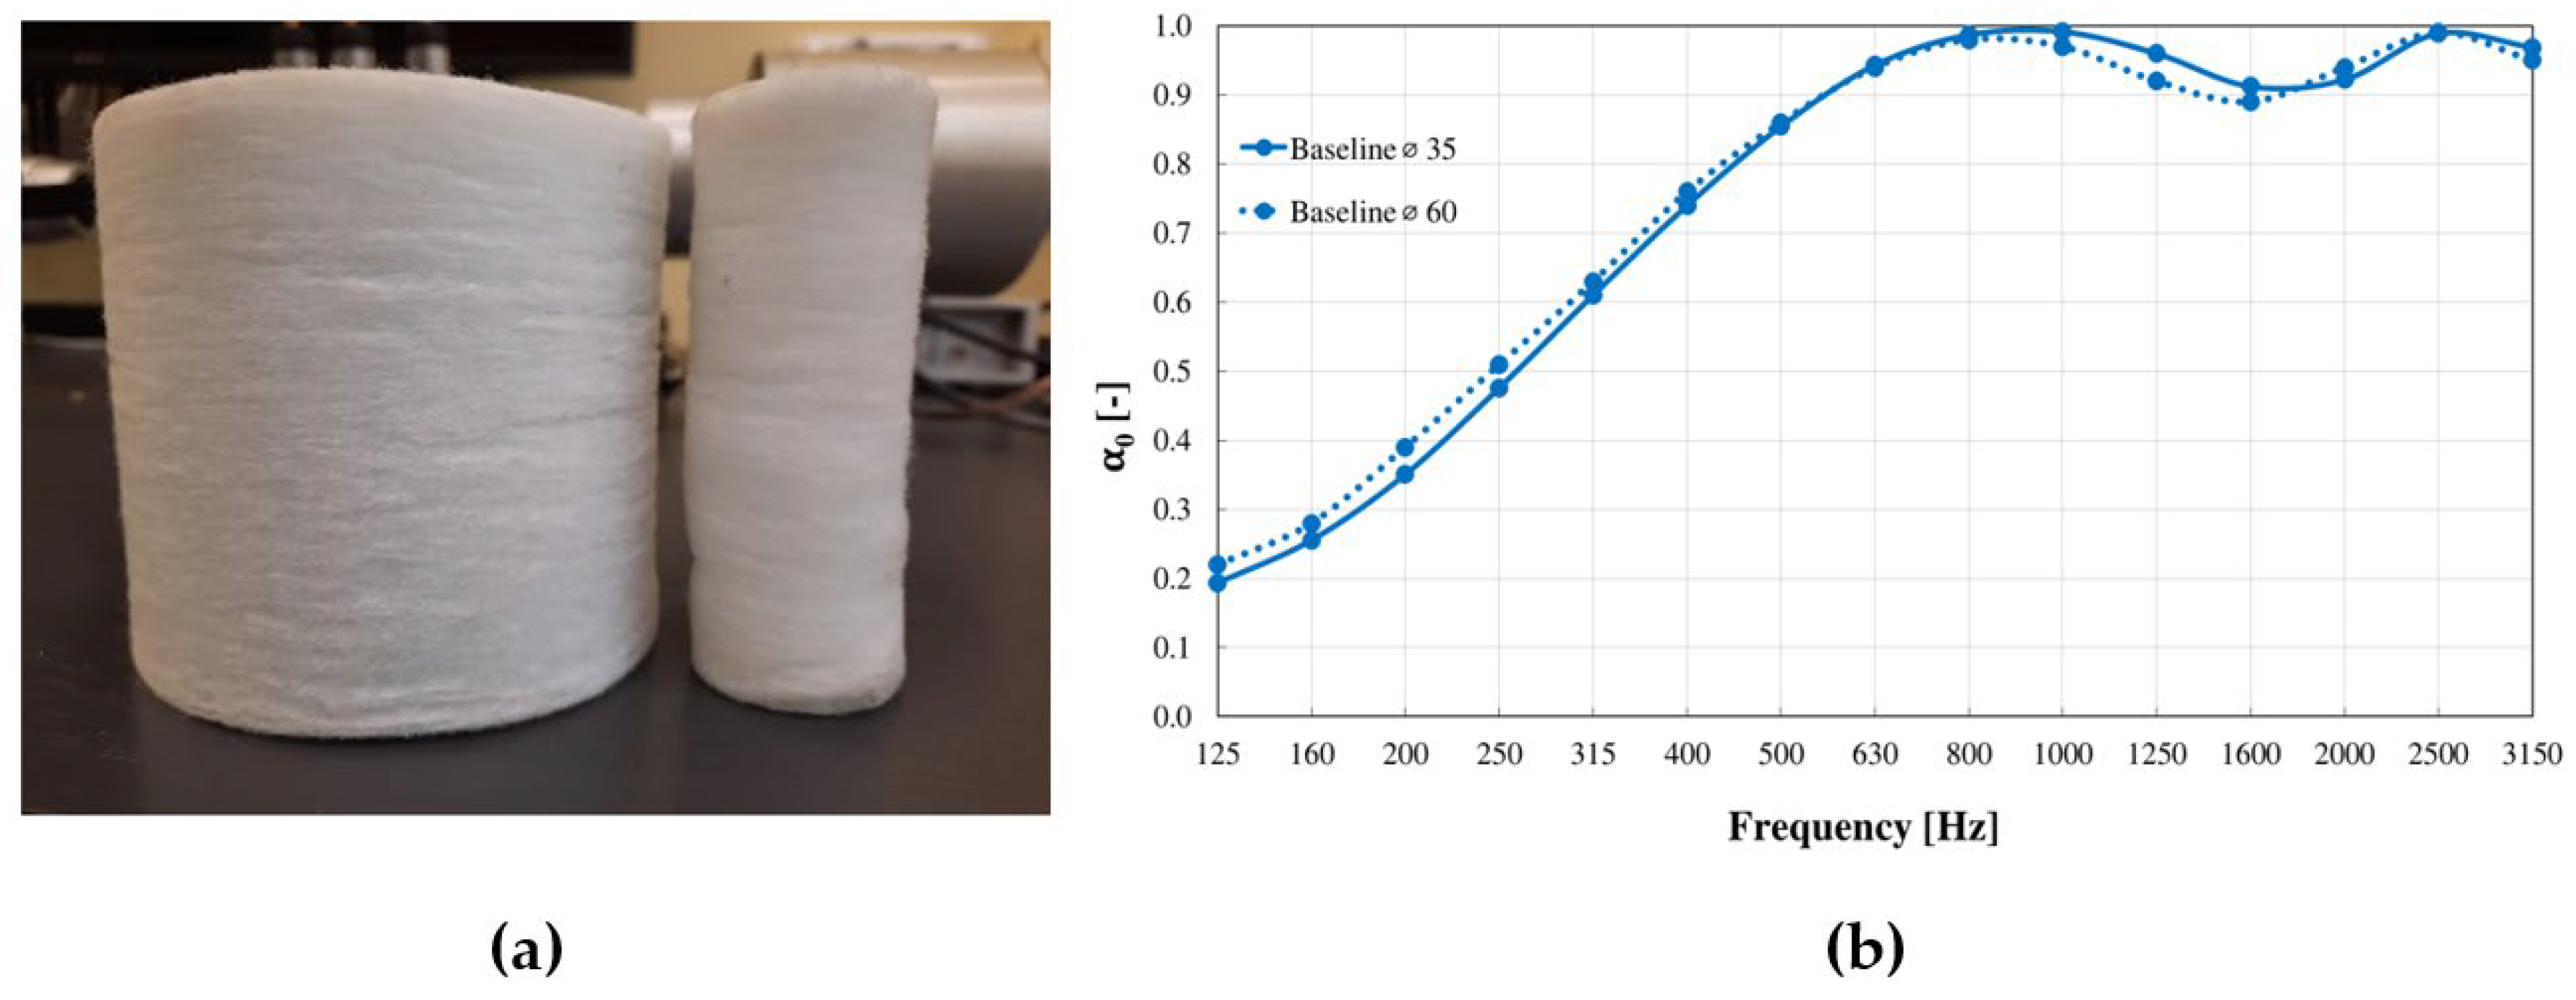
3.1. Baseline Material Comparisons
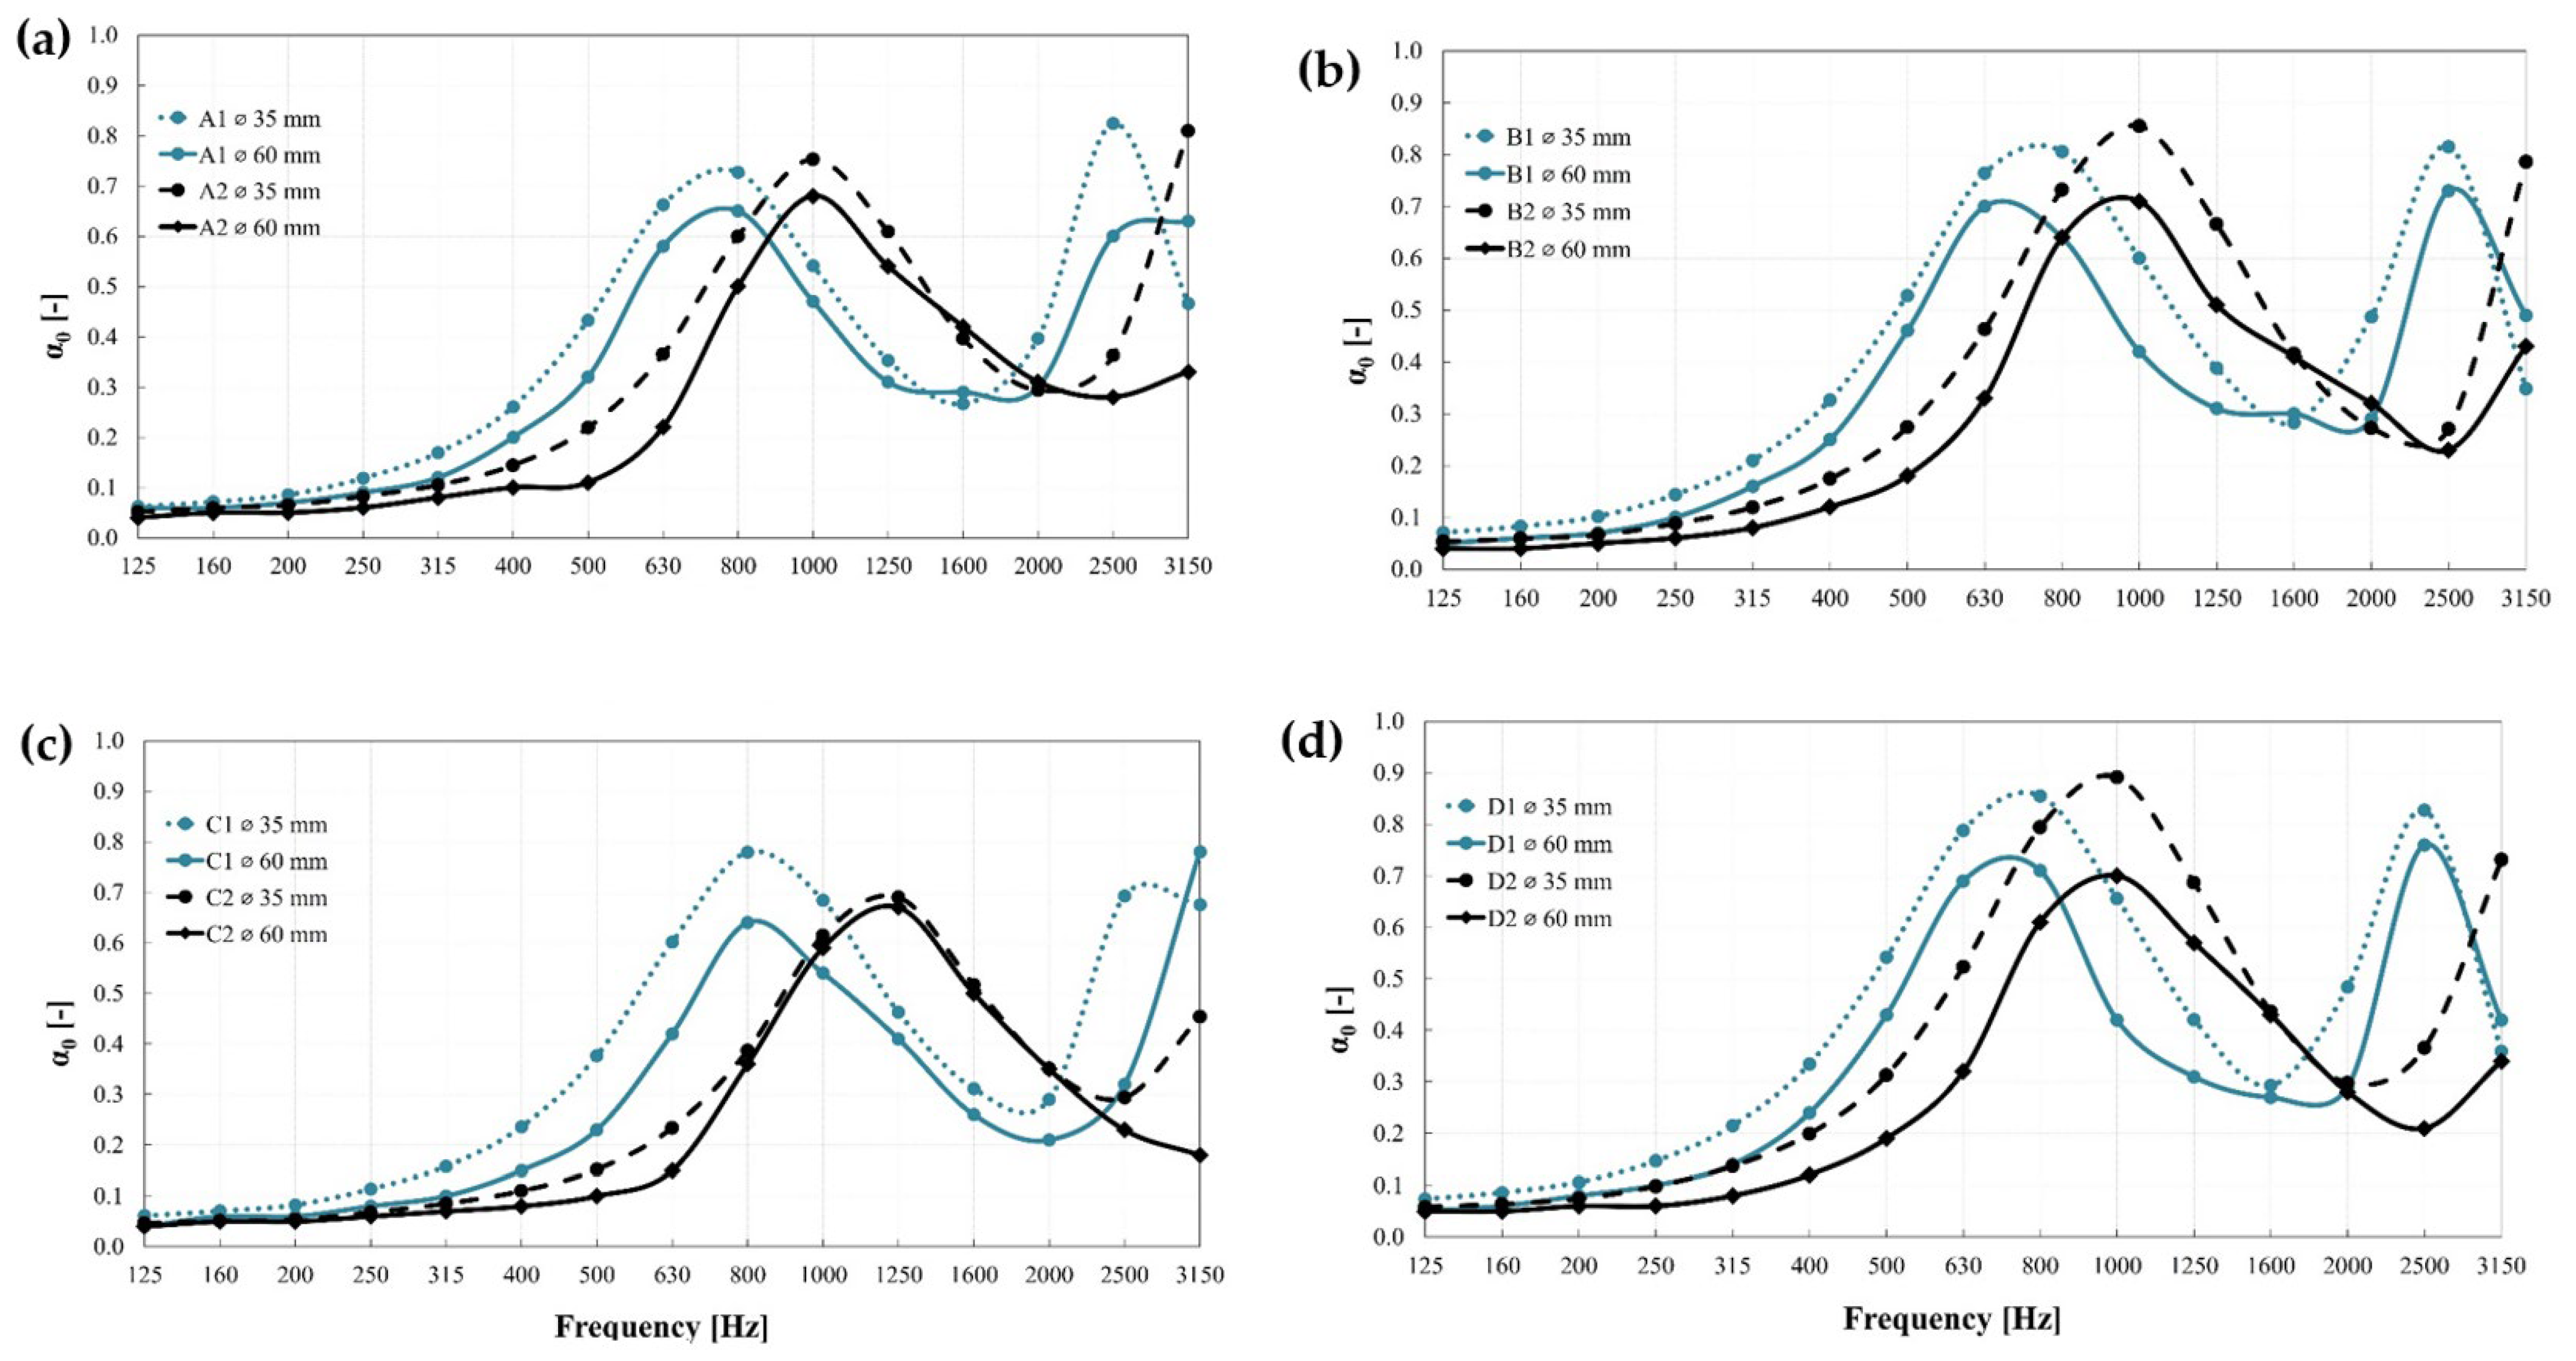
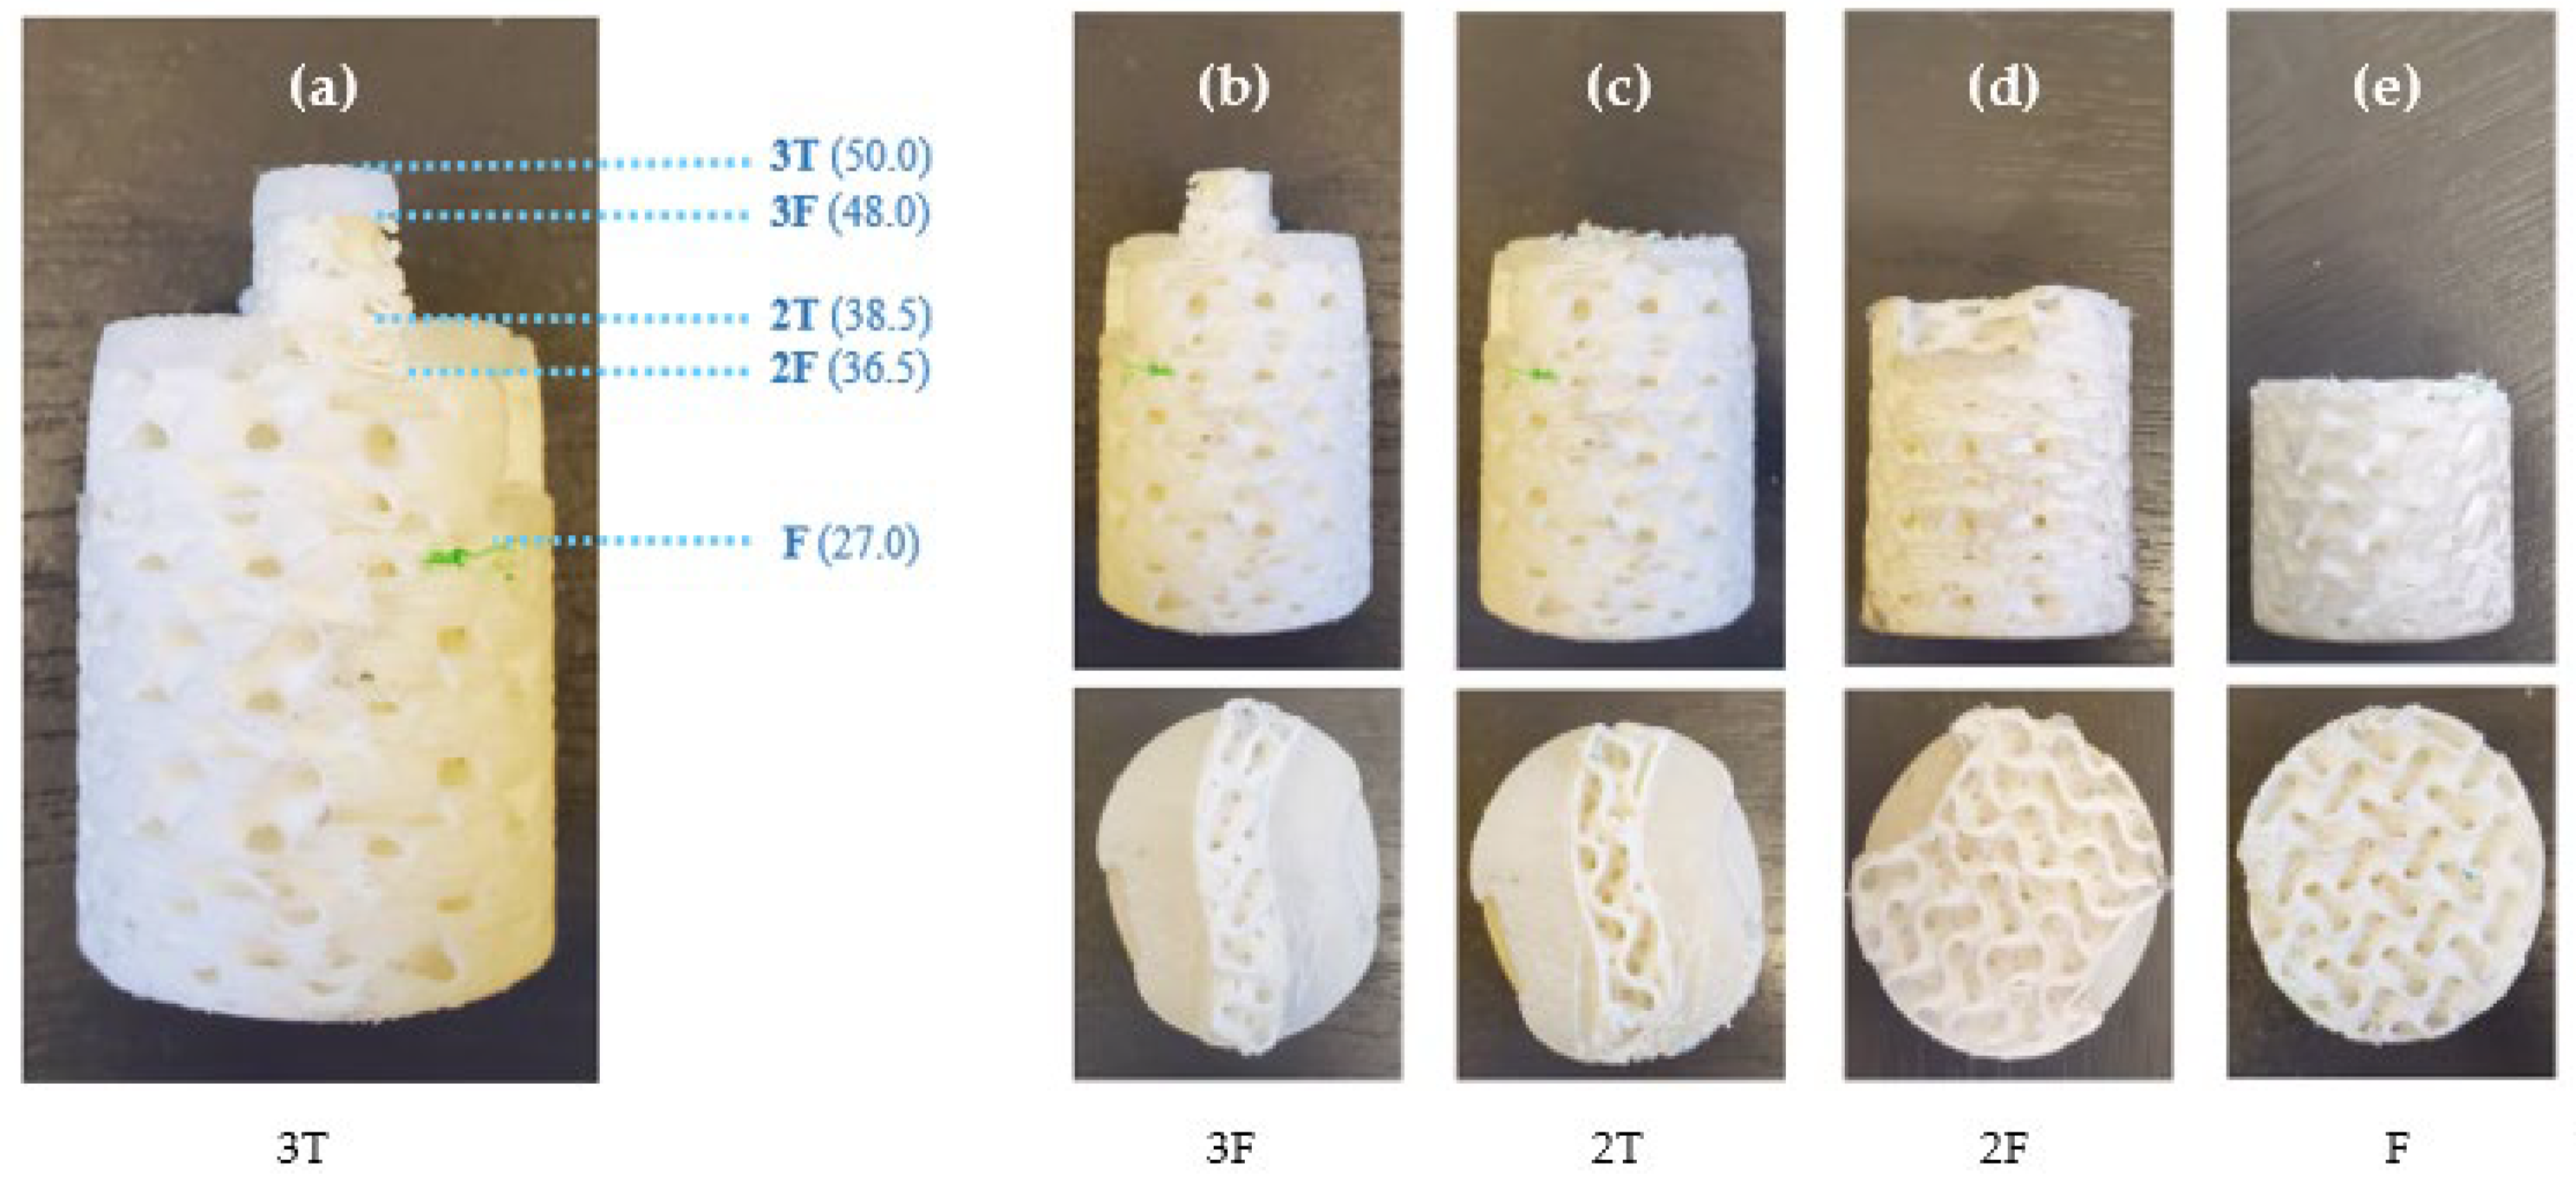
3.2. Effect of the Sample Thickness
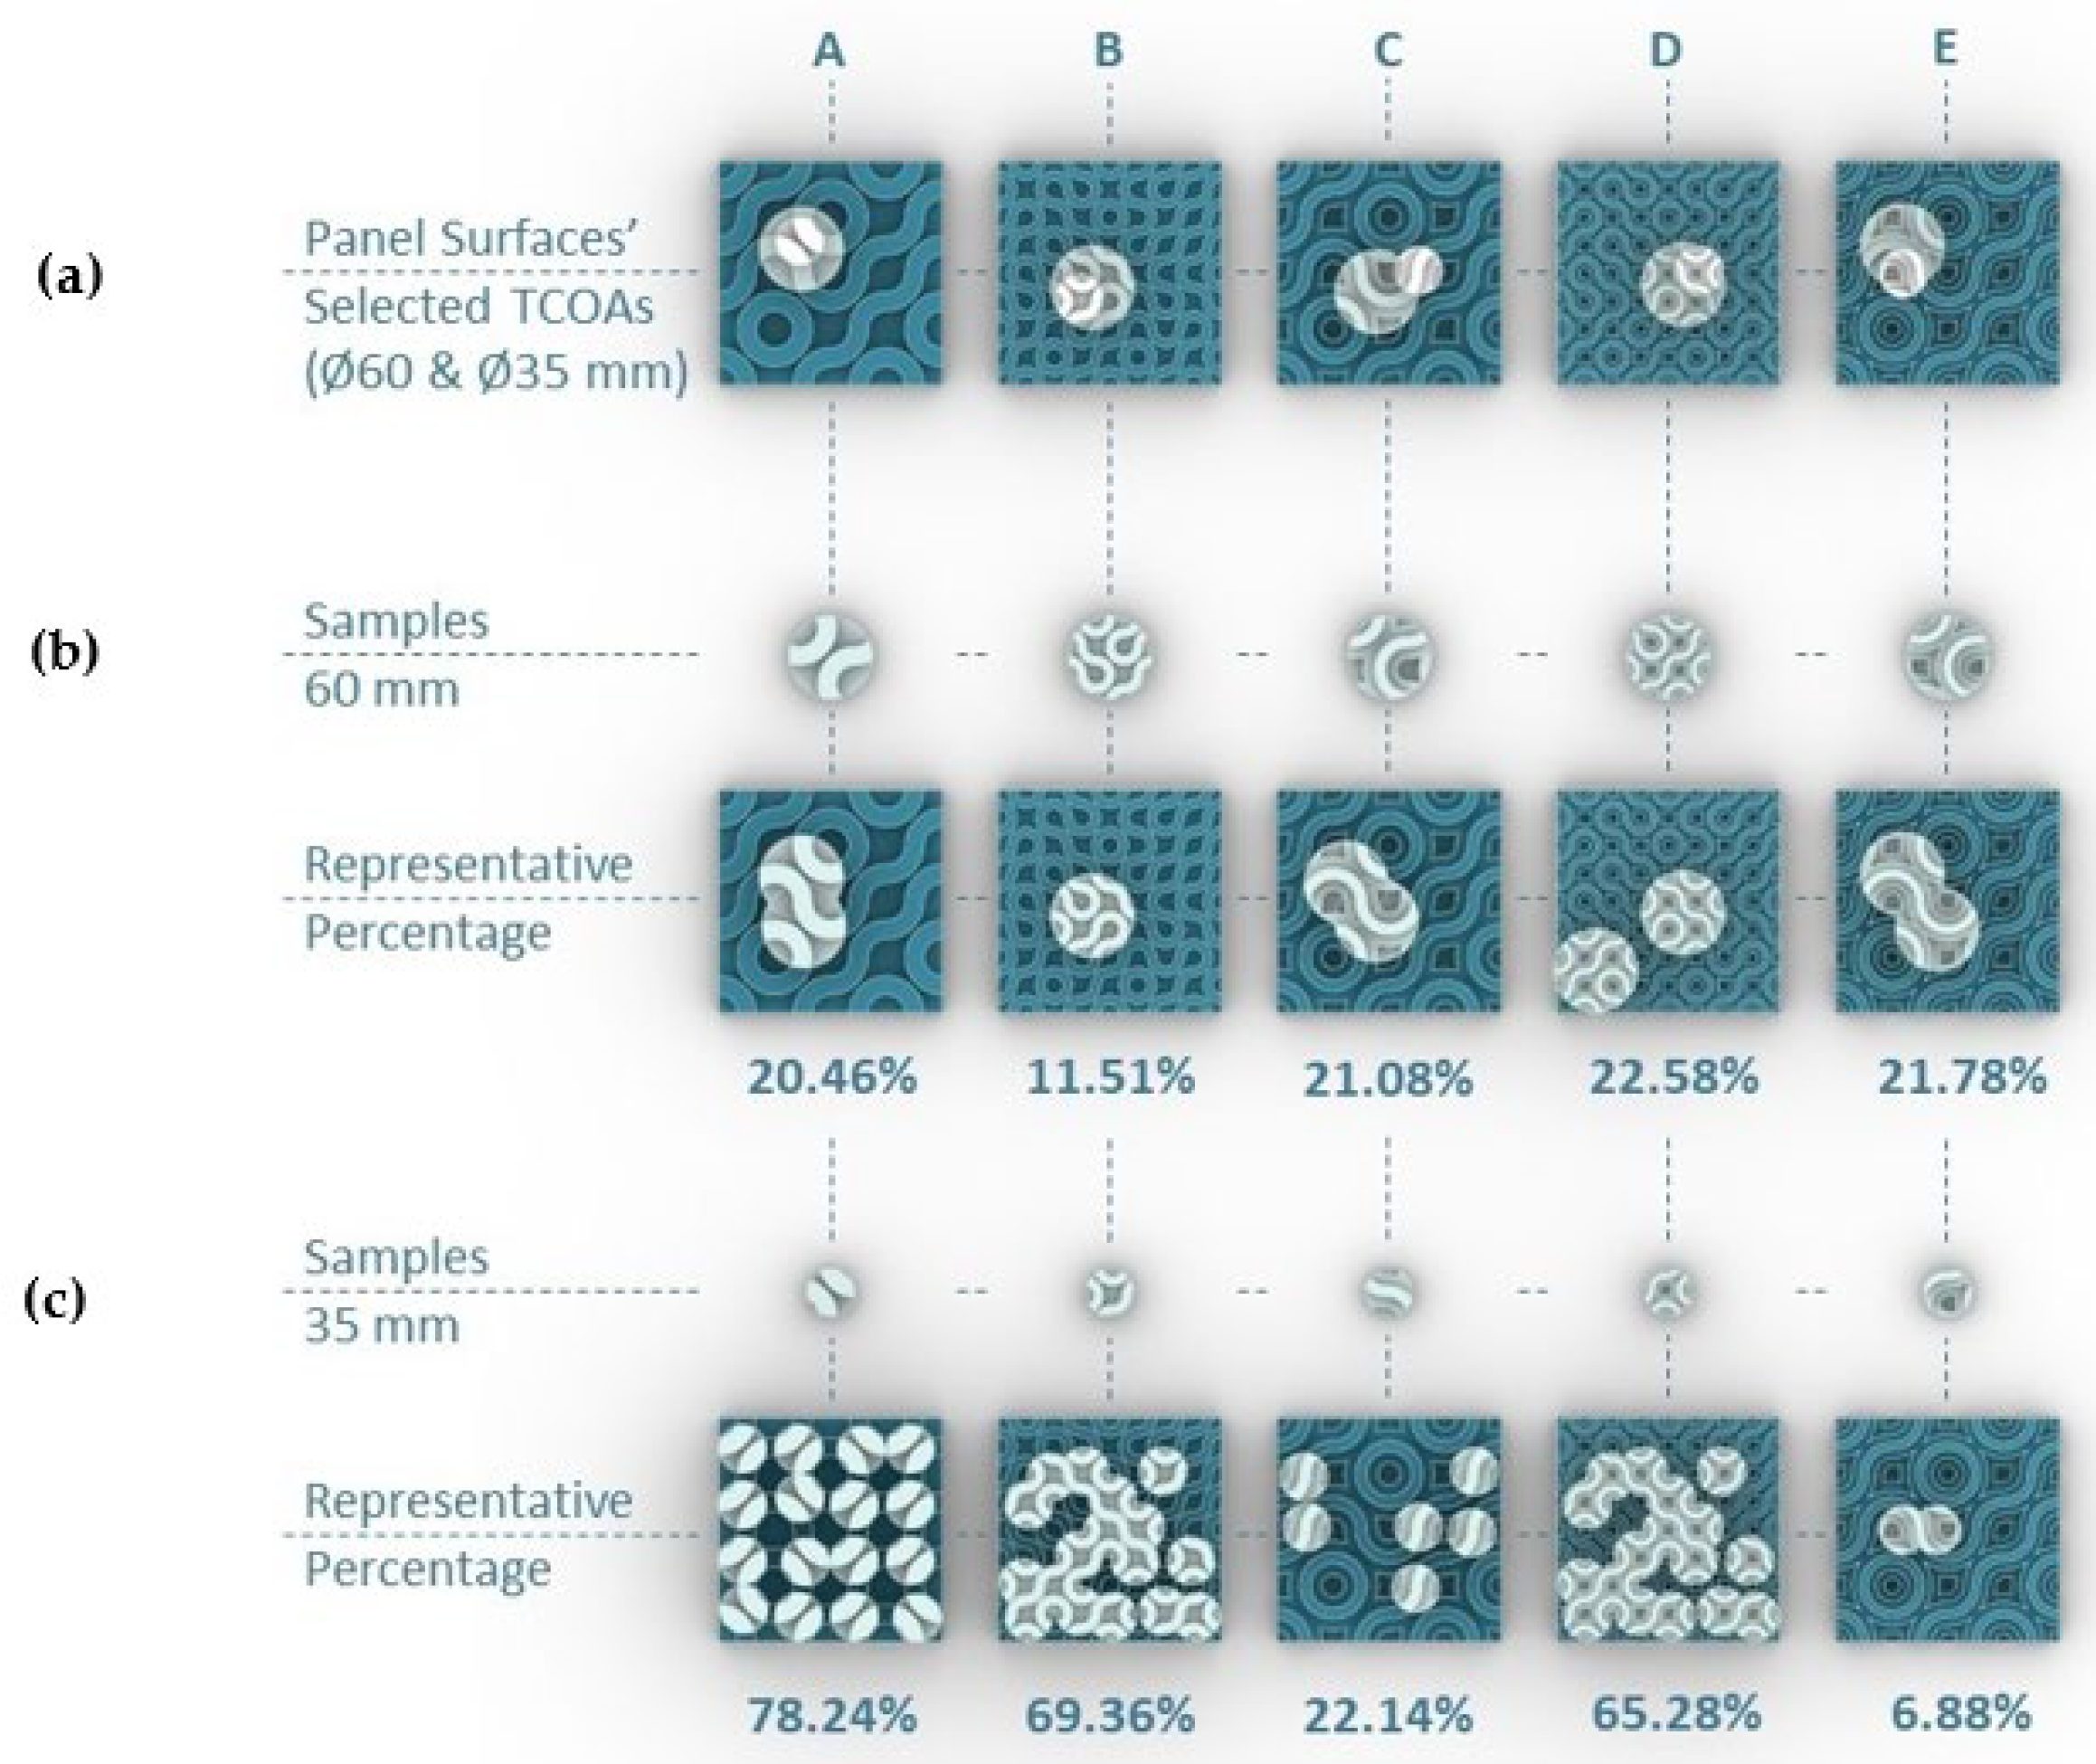
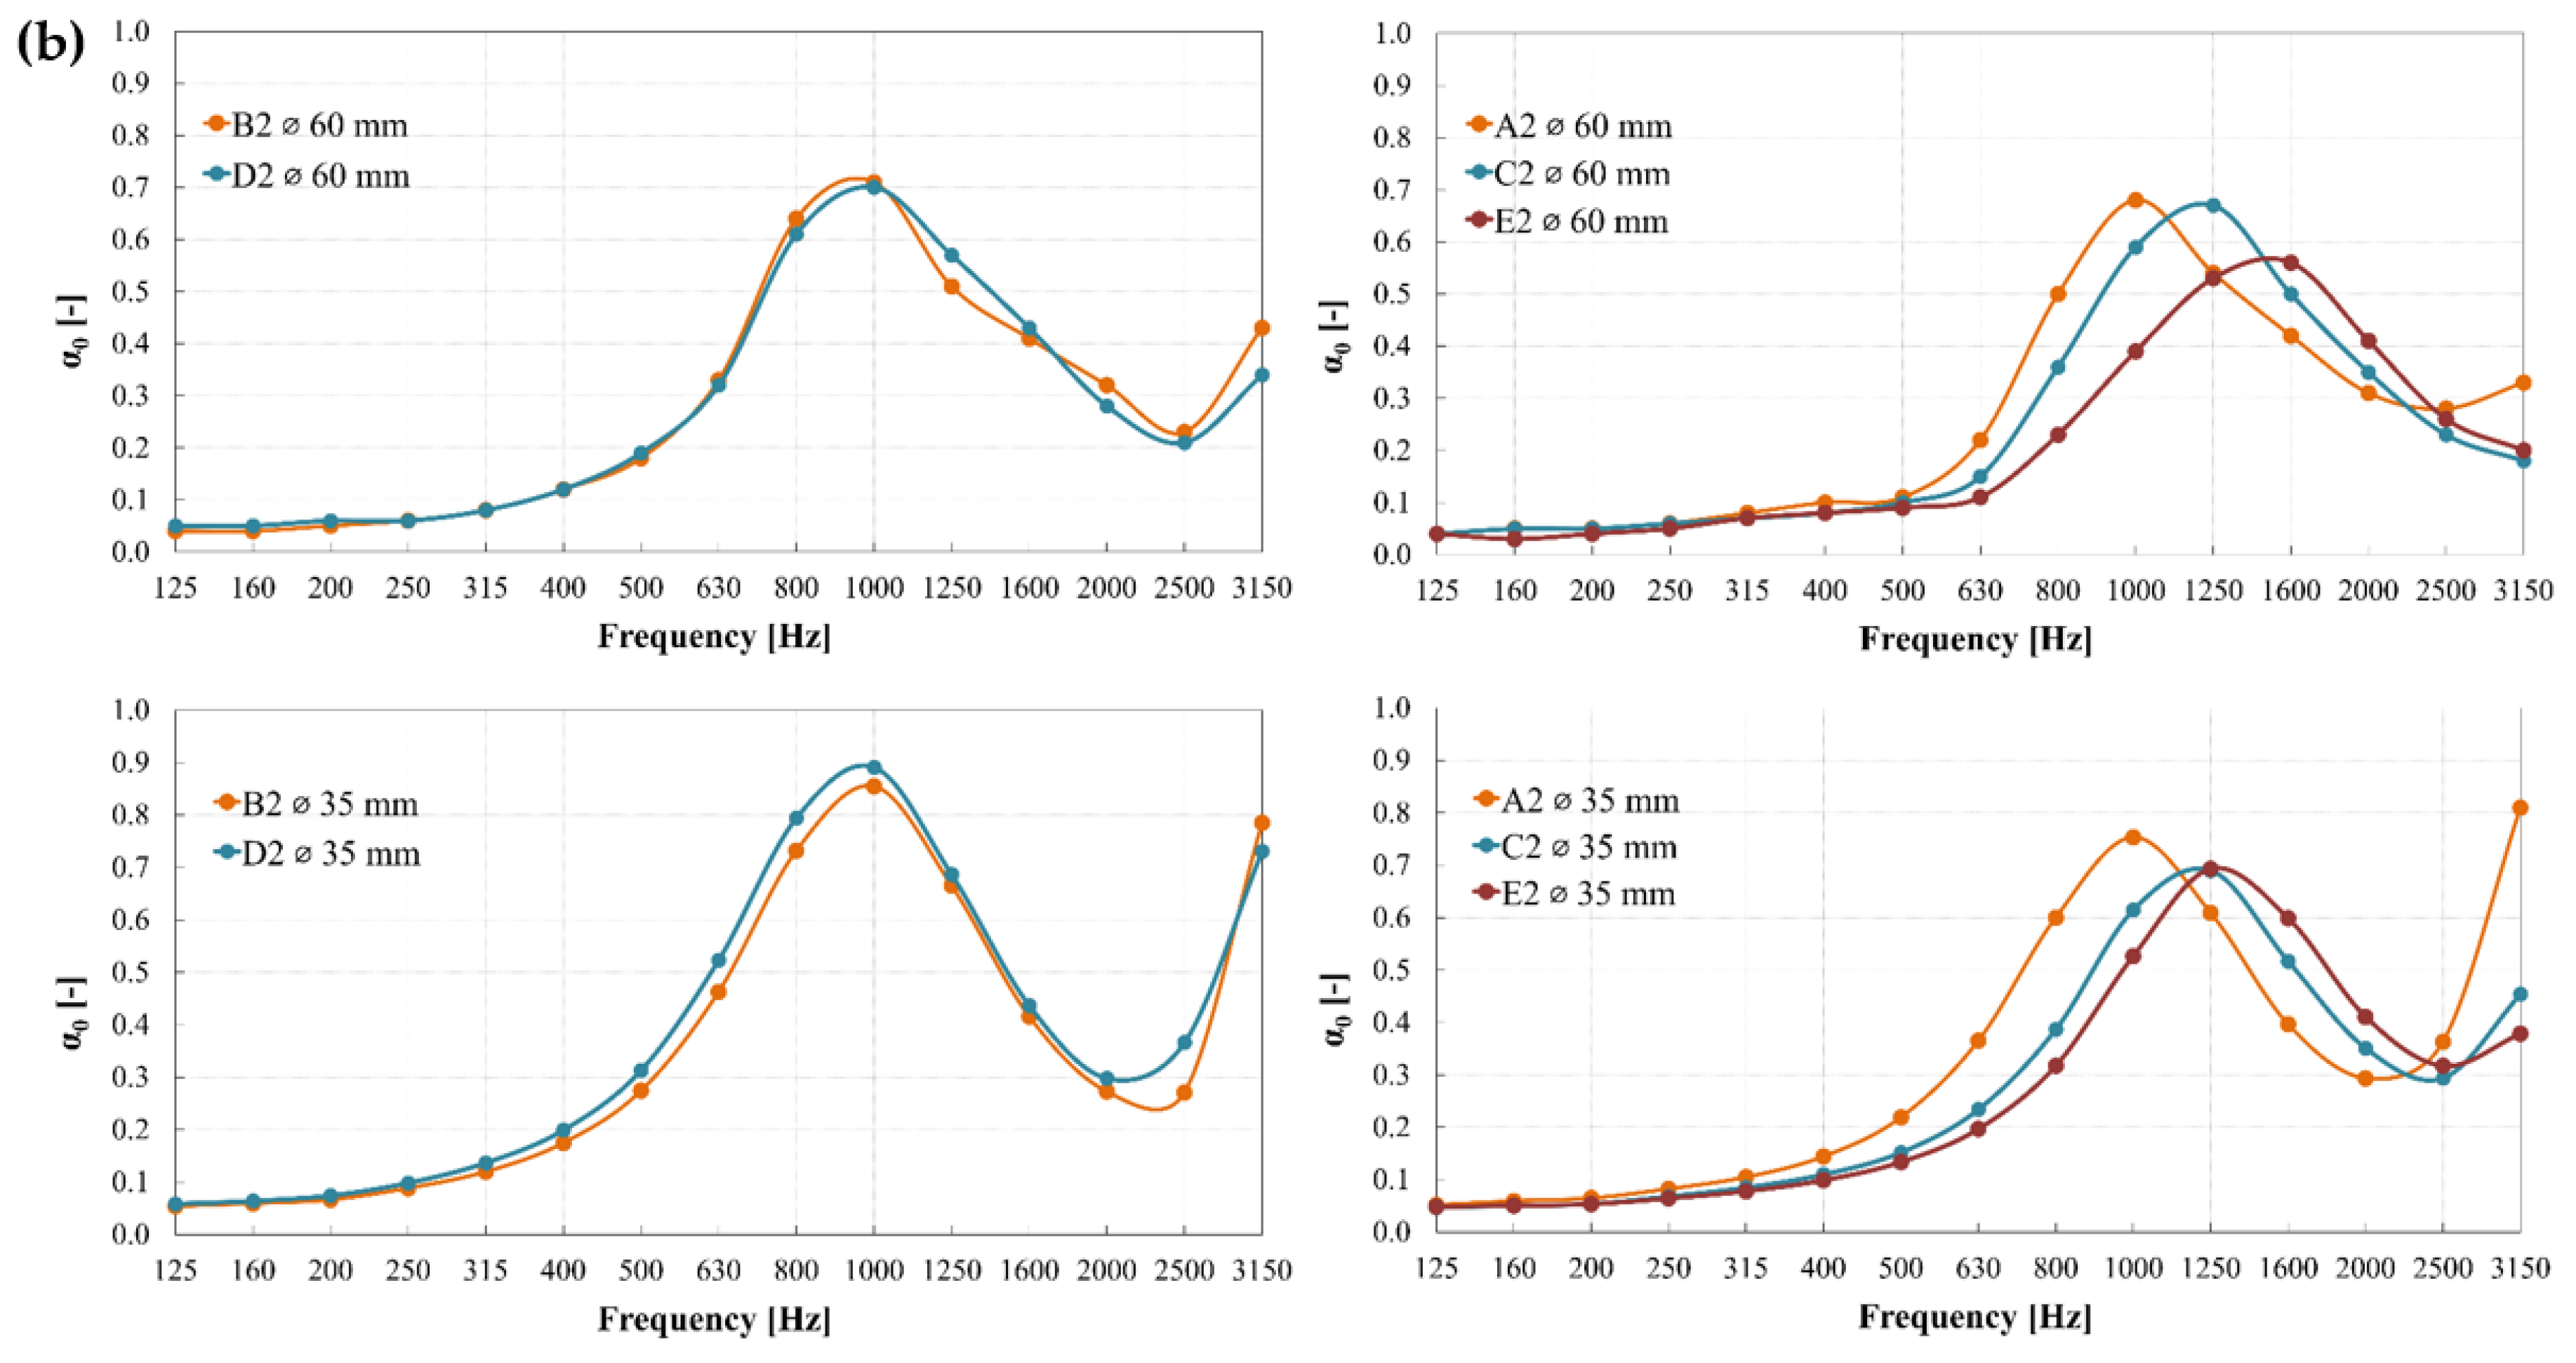
3.3. Effect of the Sample Diameter
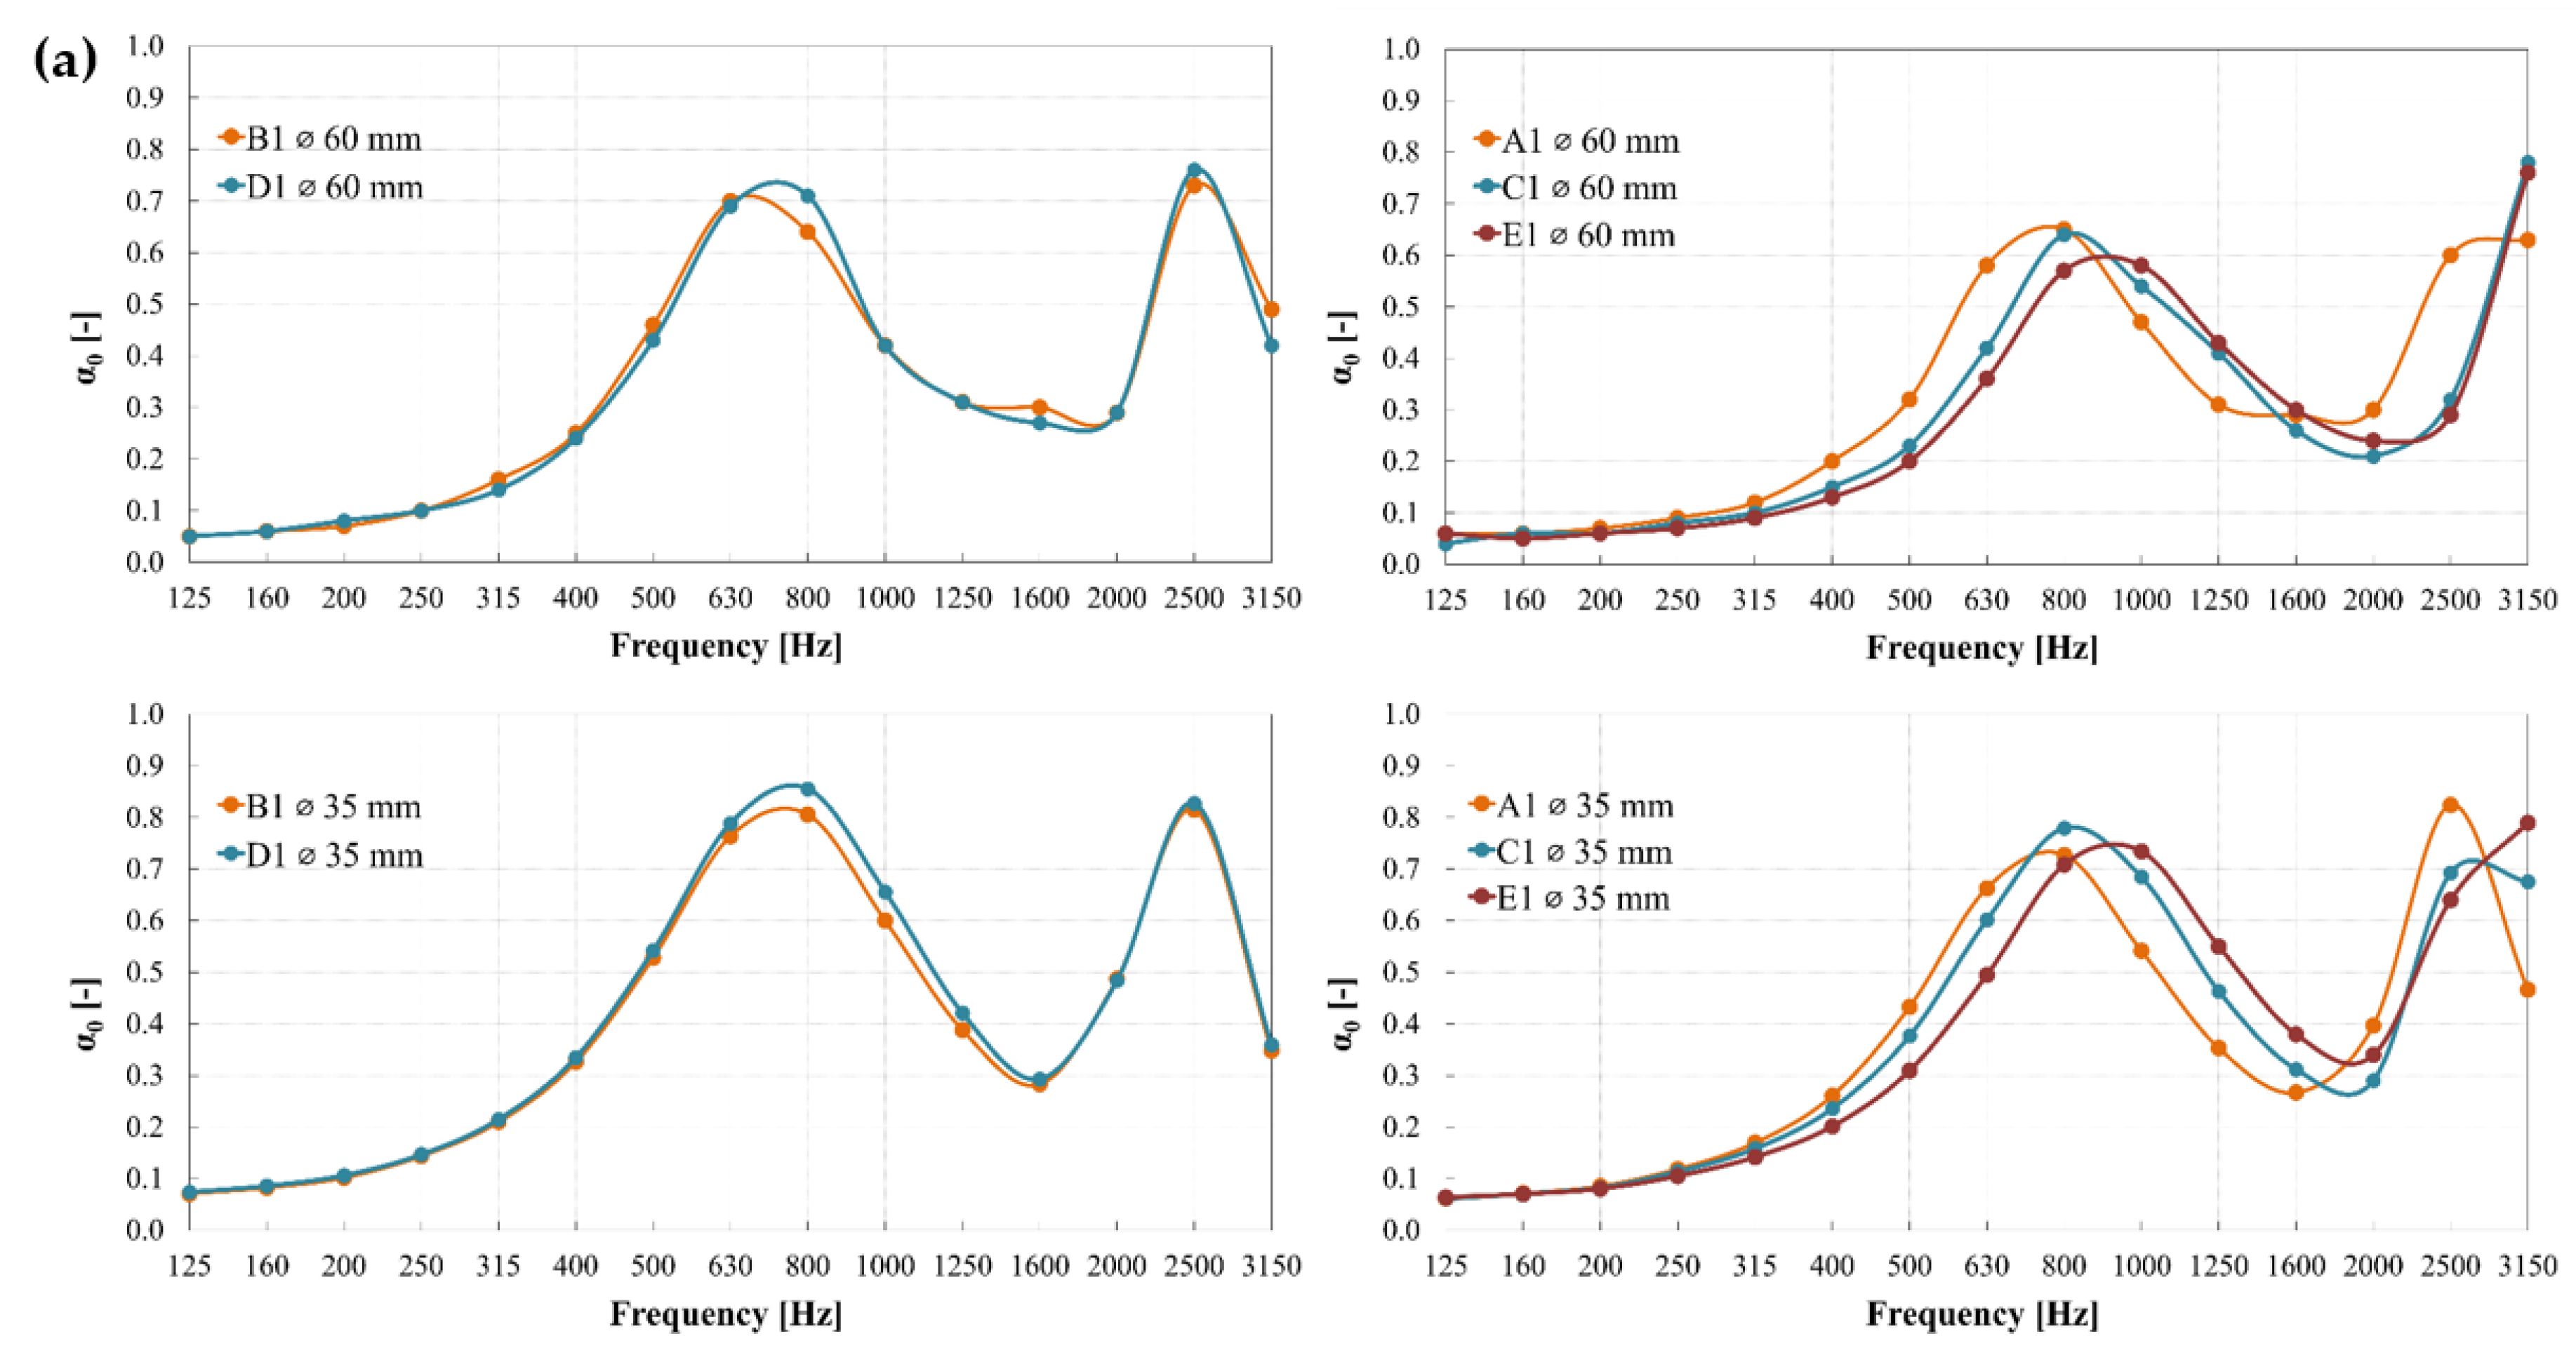
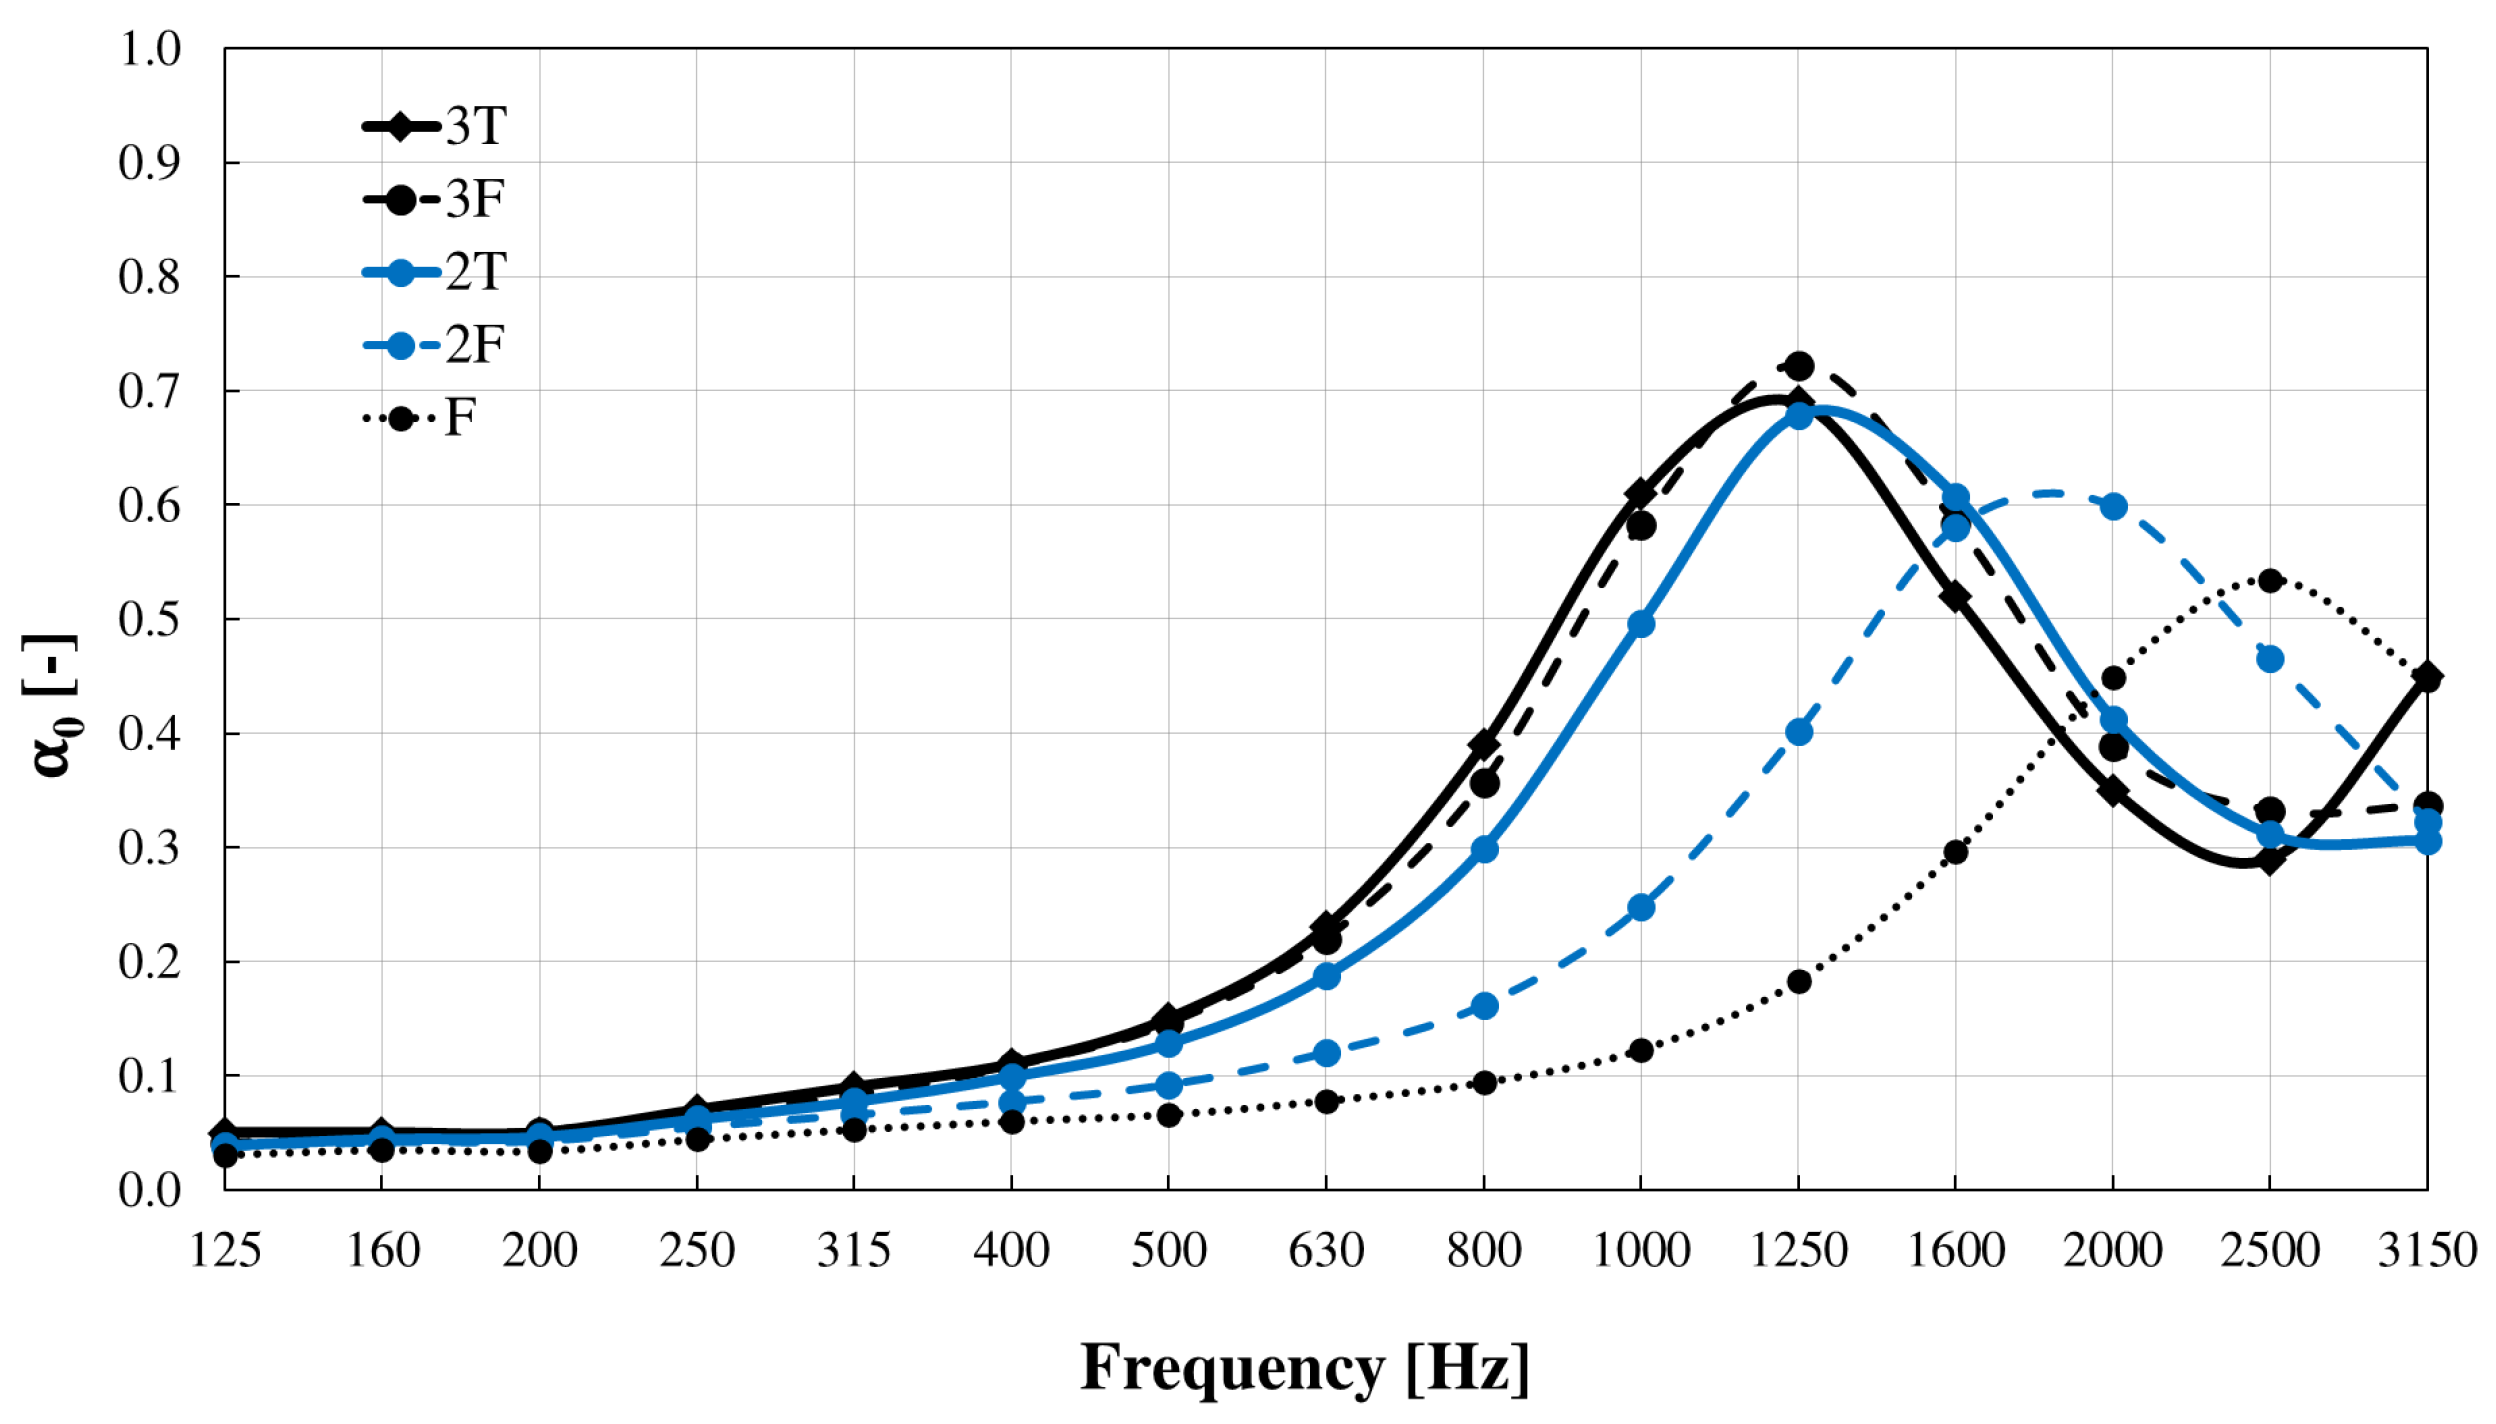
3.4. Effect of the Sample Typology
4. Conclusions and Outlook
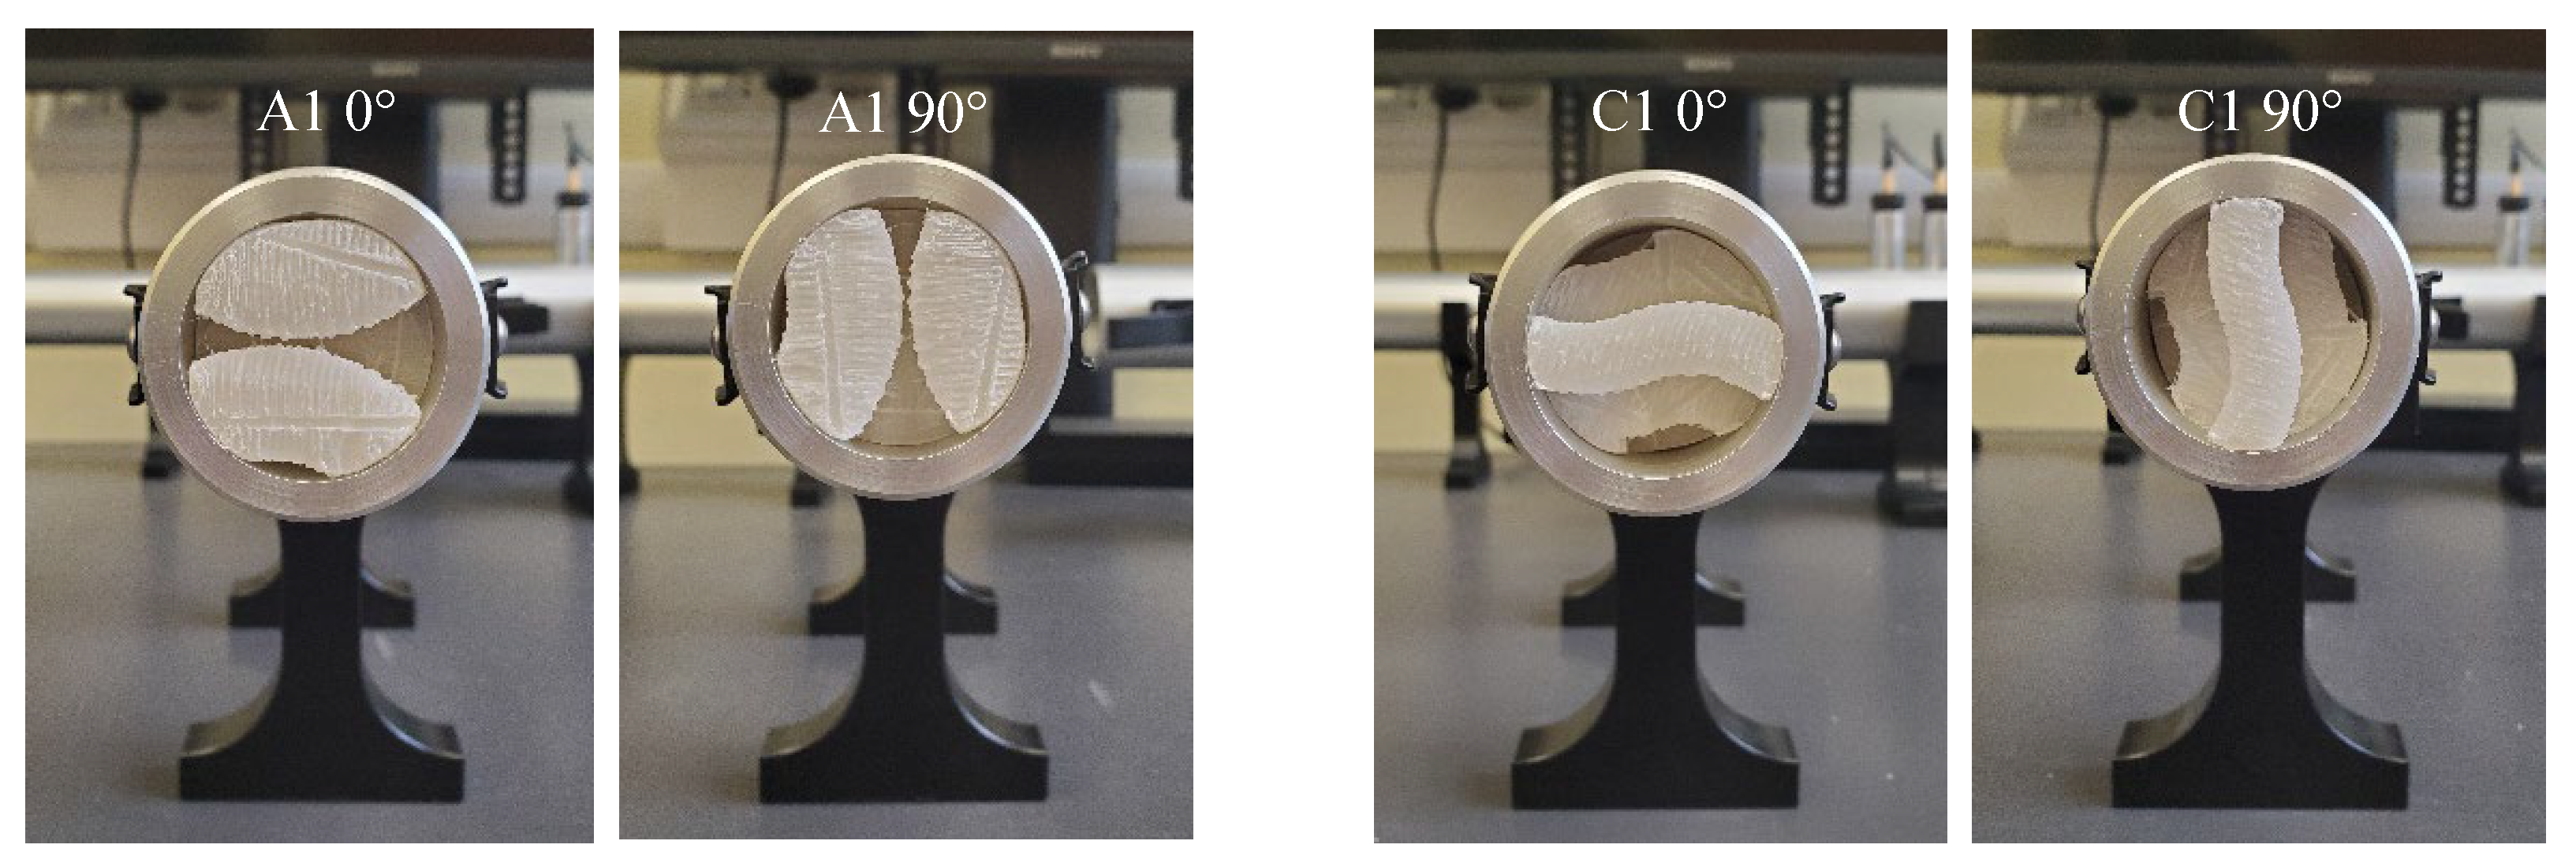
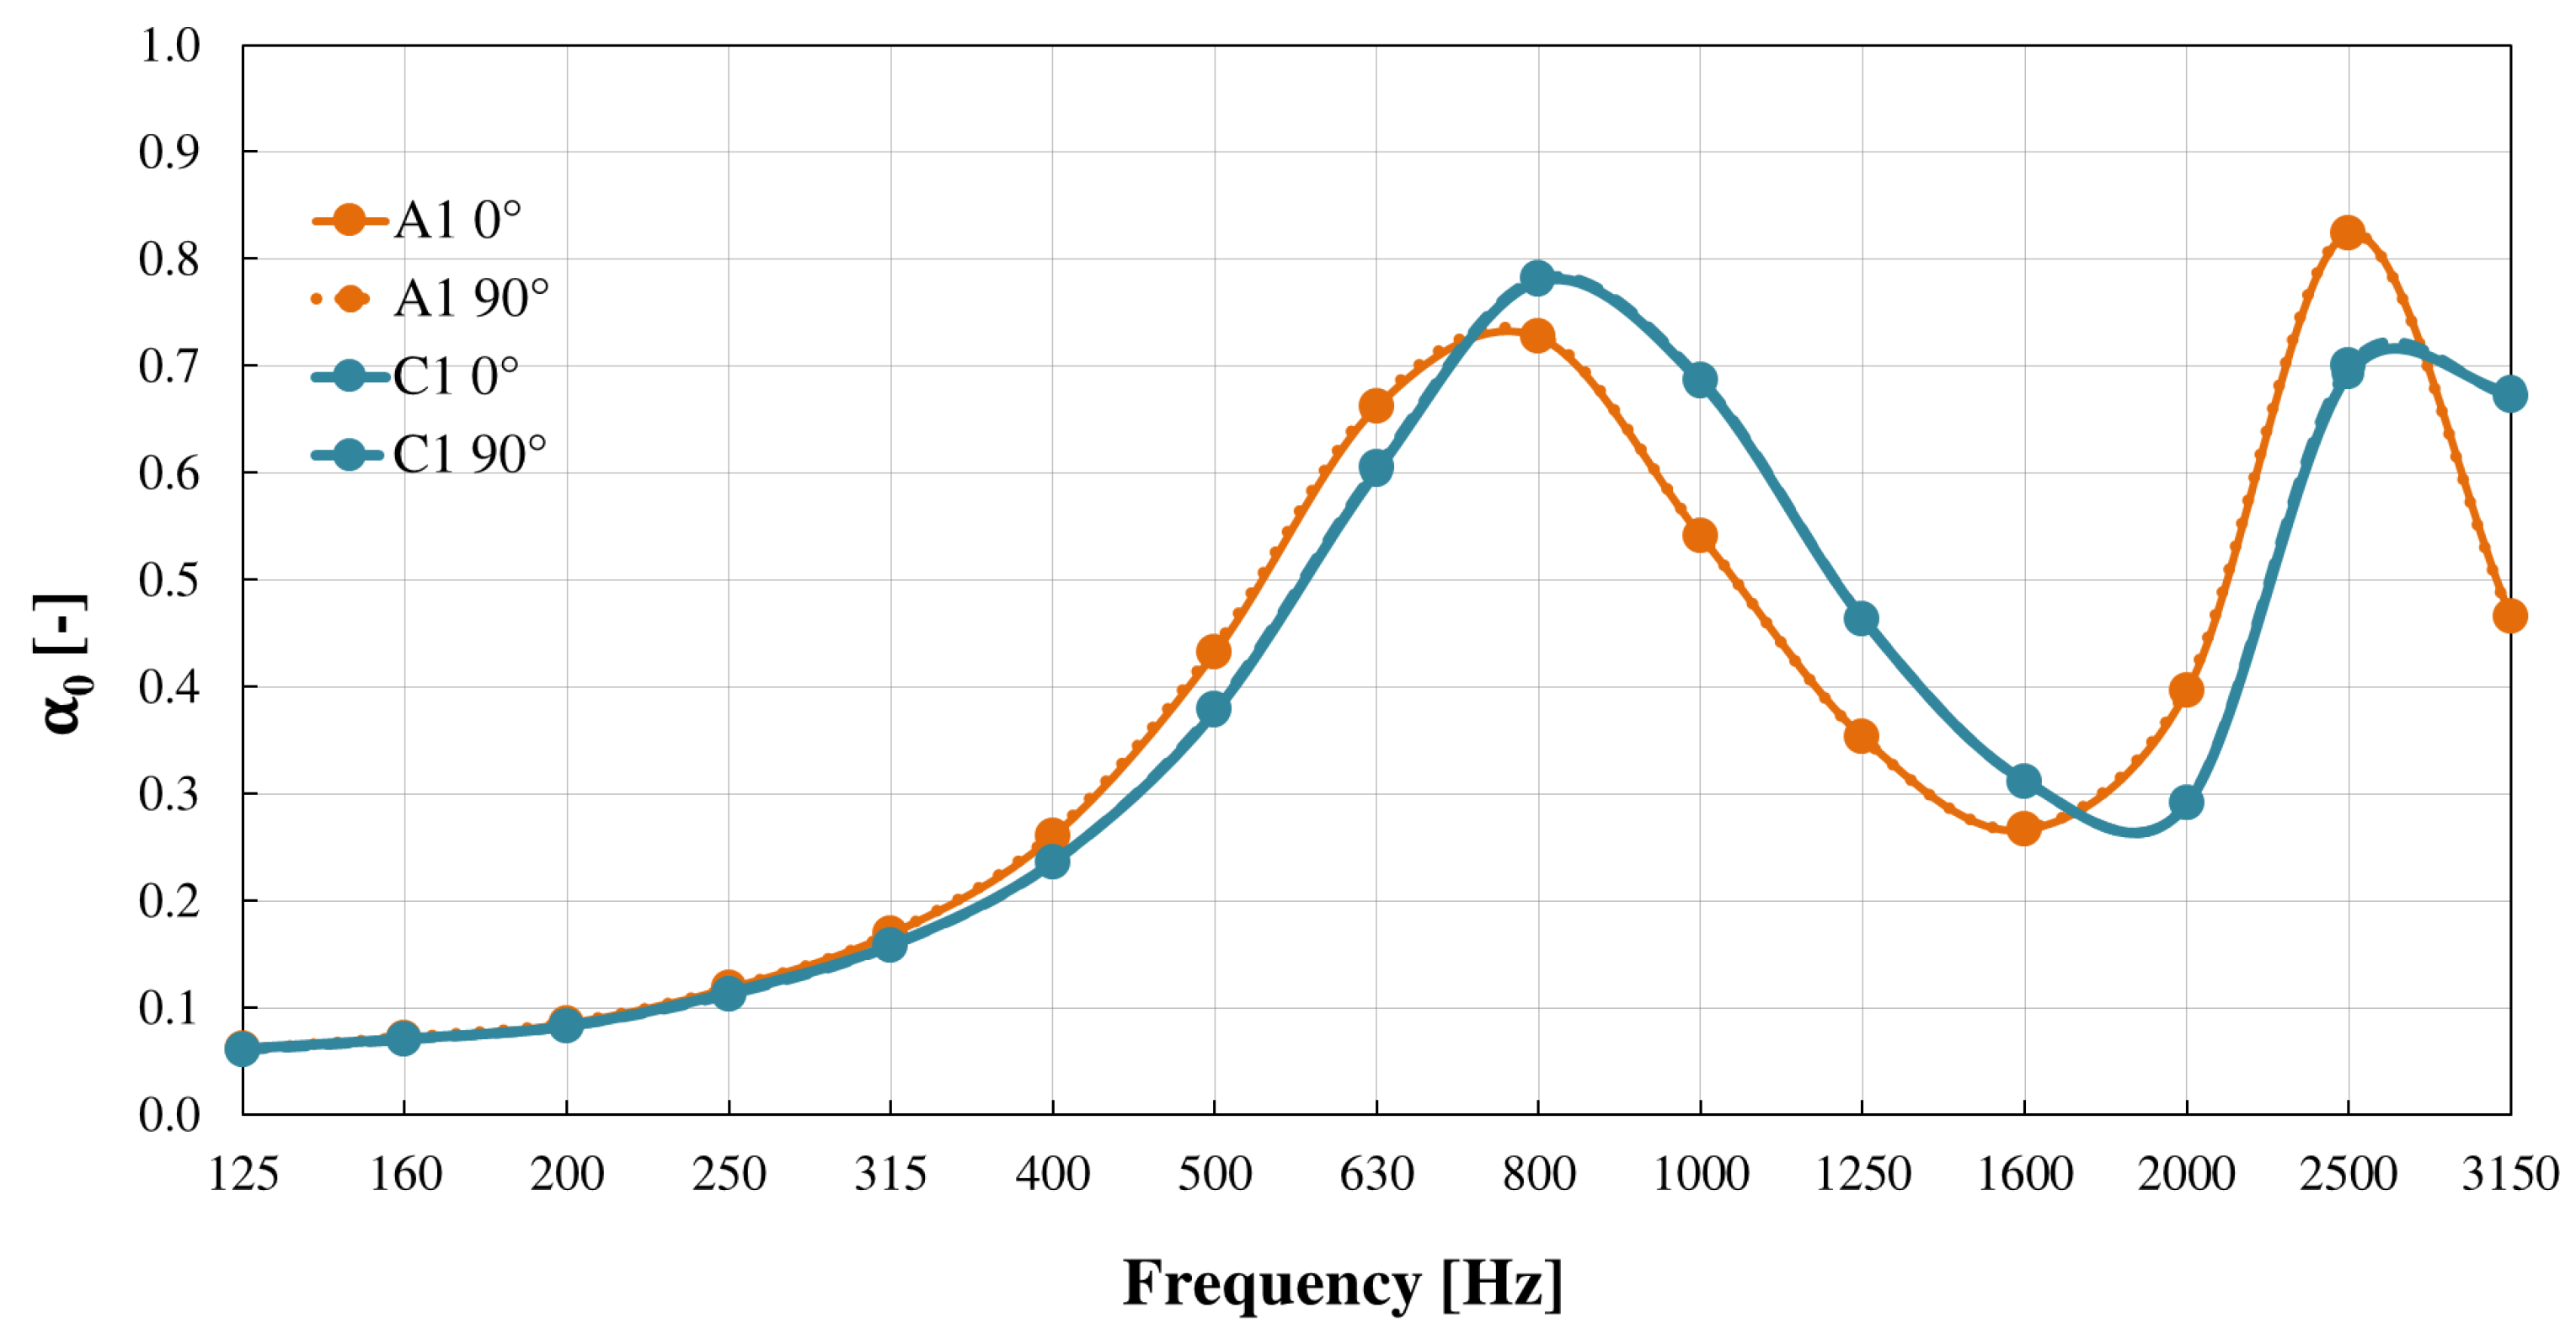
- The preliminary analysis in two orientations (i.e. at 0° and 90°) demonstrated an almost perfect overlapping between the measured data, suggesting that the orientation of the sample’s irregularities within the impedance tube does not affect the measurement repeatability.
- The results obtained with the two impedance tubes demonstrated a good level of agreement on the first frequency of resonance, while at higher frequencies, larger differences occurred due to the non-plane wave propagation being affected by the surface irregularities and impedance variations.
- The HAMs performed better at lower frequencies than expected and behaved like Helmholtz absorbers, demonstrating a frequency shift pattern related to superficial geometric features, i.e., surface irregularities, compared to the theoretical frequency of resonance due to the material thickness alone.
- Lower values of sound absorption for the 60 mm diameter tube were observed at the frequency of resonance, suggesting a significant effect on the sample air volume (increasing factor of ~2.9).
- A shifting pattern in the peak absorption values towards higher frequencies was observed for specimens with a larger (i.e., 40 mm) Truchet tile size length, a step size larger than 8 mm, and a gradually incremental (i.e., 1, 2, and 3) number of steps. This suggests that a full frequency range acoustic absorber could be achieved by determining the proper combination of the design factors.
Author Contributions
Funding
Data Availability Statement
Acknowledgments
Conflicts of Interest
Appendix A

| Physical Properties | Unit | Value at 200 °C; 100% Flow | Value at 250 °C; 45% Flow | Method |
|---|---|---|---|---|
| Tensile modulus | MPa | 3333.76 | 864.25 | ISO 527 |
| Yield strength | MPa | 43.07 | N/A | ISO 527 |
| Yield strain | % | 1.68 | N/A | ISO 527 |
| Tensile strength | MPa | 43.07 | 10.83 | ISO 527 |
| Tensile strain at tensile strength | % | 1.68 | 12.00 | ISO 527 |
| Tensile stress at break | MPa | 38.74 | 10.73 | ISO 527 |
| Tensile strain at break | % | 8.08 | 12.78 | ISO 527 |
| Charpy unnotched impact strength | kJ/m2 | 5.46 | ISO 179-1/1 eU | |
| Charpy notched impact strength | kJ/m2 | 3.67 | ISO 179-1/1 eU | |
| Density | kg/m3 | 400–1240 | ||
| Glass transition Temperature | °C | 55–60 | DSC | |
Appendix B
| Acoustic Panel | Sample 60 mm | Sample 35 mm | ||||
|---|---|---|---|---|---|---|
| Profile Type | Rectangular | Circular | Circular | |||
| Visual Representation |  |  |  |  |  |  |
| Size (mm) | L160 × W160 × H70 | L160 × W160 × H50 | Ø60 × H70 | Ø60 × H50 | Ø35 × H70 | Ø35 × H50 |
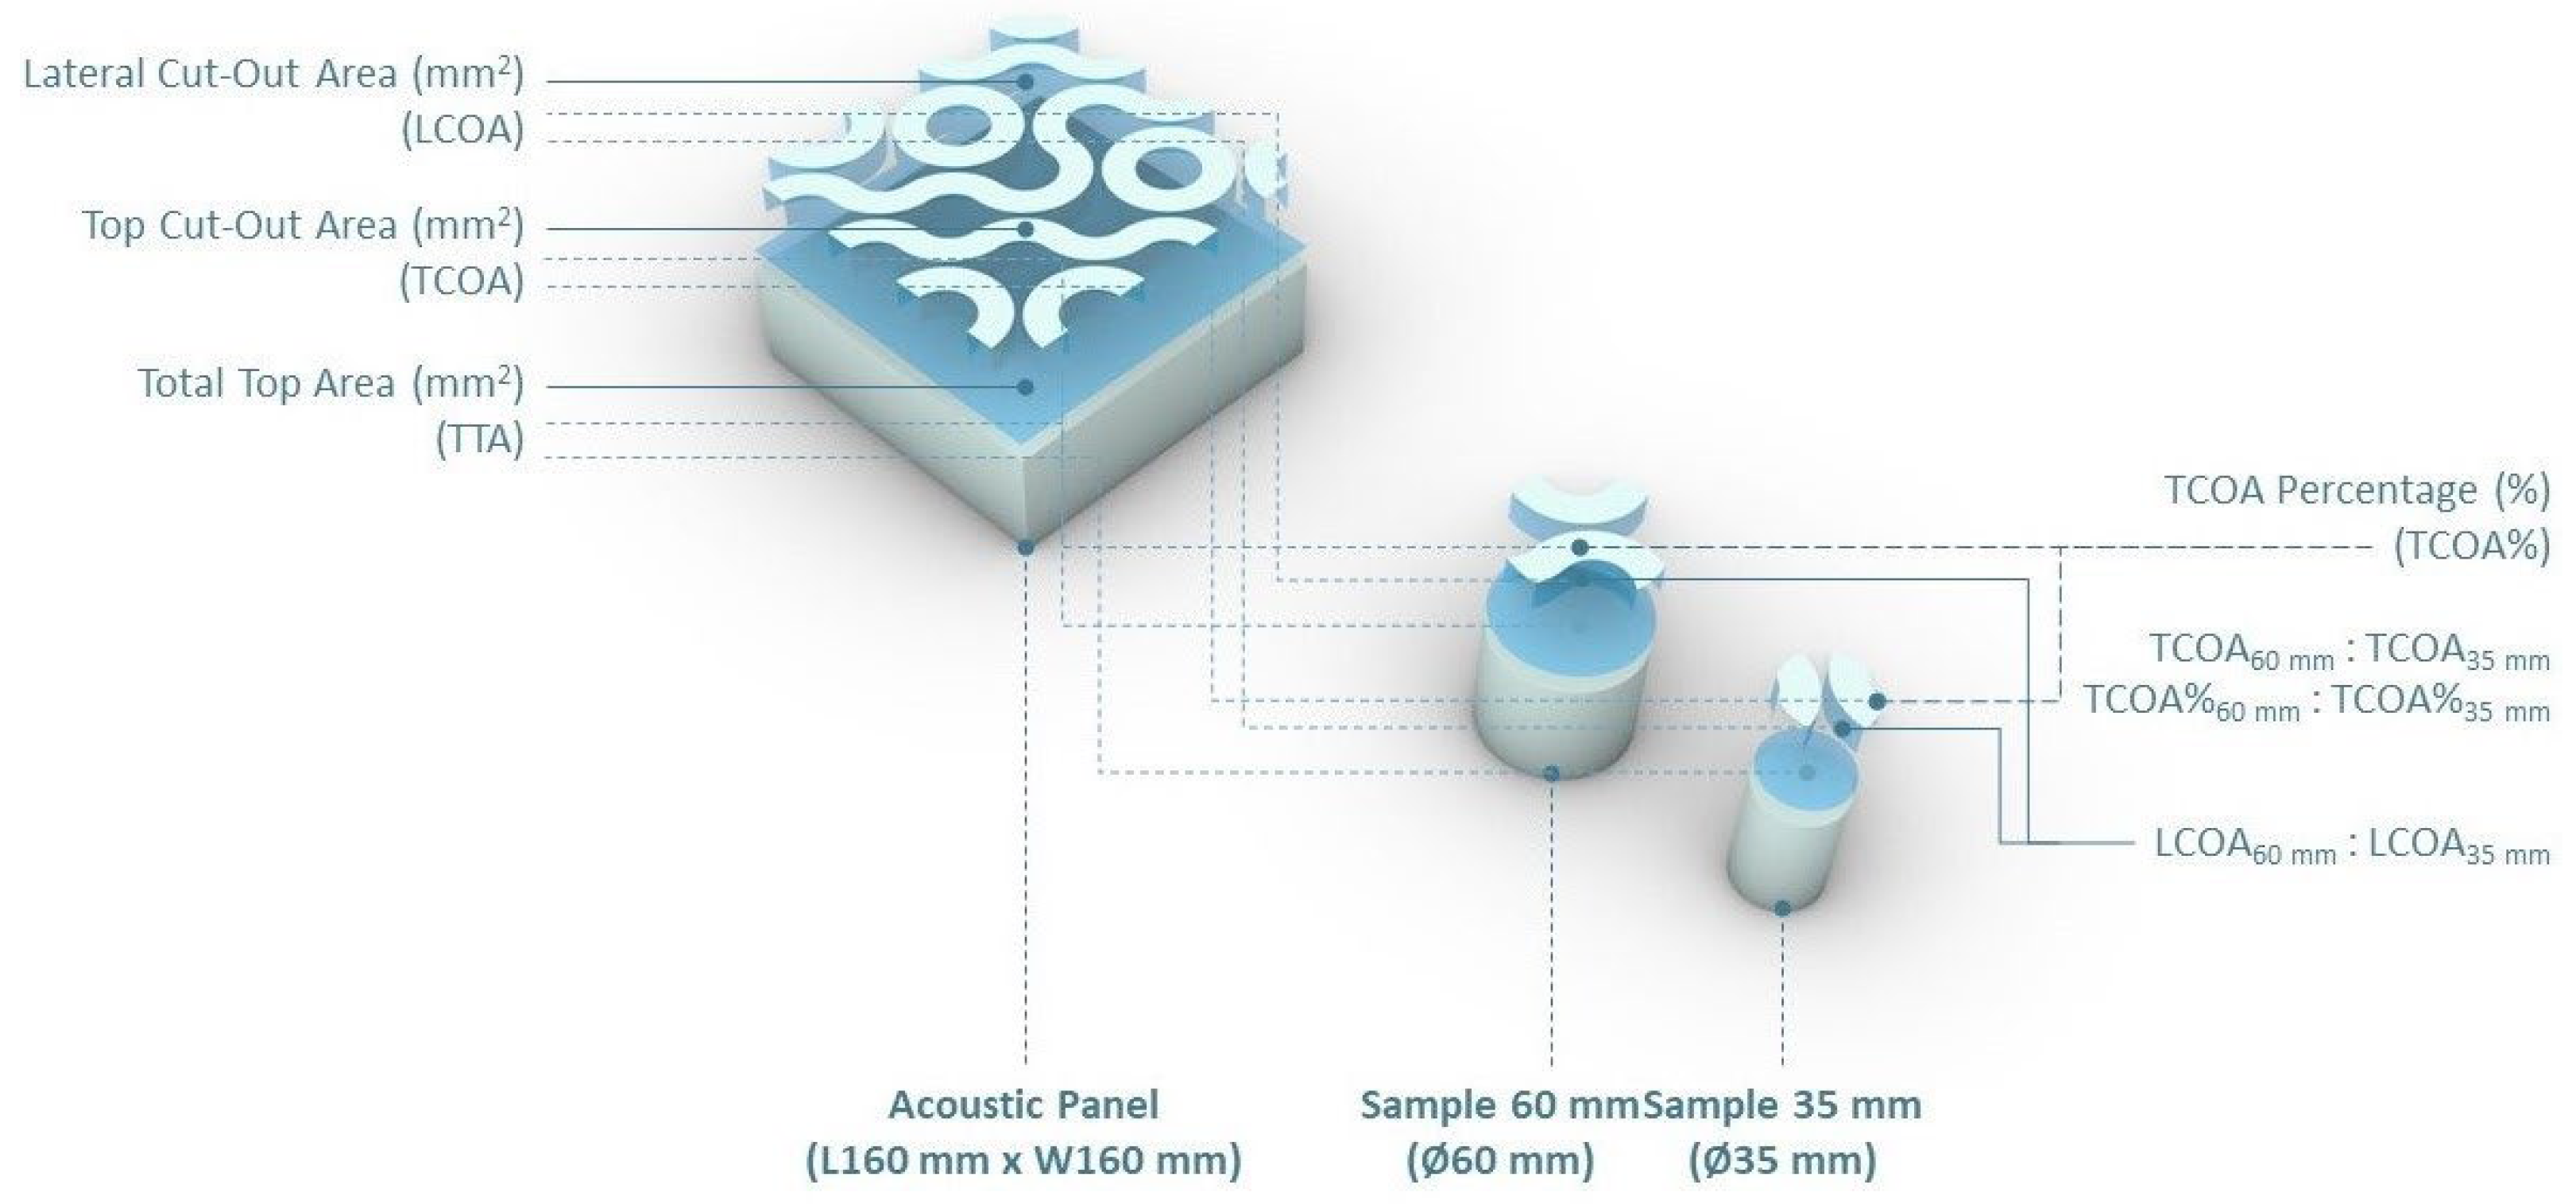
| TTA (mm2) | 25,600 | 2827 | 935 | |||
| TTA60 mm: TTA35 mm | 3.02 | |||||
| TTA% (%) | 100 | 100 | 100 | |||
| TTA%60 mm: TTA%35 mm | 1.00 | |||||
| A1 | A2 | A1 | A2 | A1 | A2 | |
| Visual Representation |  |  |  |  |  |  |
| TCOA (mm2) | 13,404 | 1371 | 655 | |||
| TCOA60 mm: TCOA35 mm | 2.09 | |||||
| TCOA% (%) | 52.36 | 48.50 | 70.05 | |||
| TCOA%60 mm: TCOA%35 mm | 0.69 | |||||
| LCOA (mm2) | 26,808 | 2680 | 1197 | |||
| LCOA60 mm: LCOA35 mm | 2.24 | |||||
| Open Area (LCOA/LCOA + TCOA) (mm2) | 0.67 | 0.66 | 0.65 | |||
| B1 | B2 | B1 | B2 | B1 | B2 | |
| Visual Representation |  |  |  |  |  |  |
| TCOA (mm2) | 13,404 | 1543 | 547 | |||
| TCOA60 mm: TCOA35 mm | 2.82 | |||||
| TCOA% (%) | 52.36 | 54.58 | 58.5 | |||
| TCOA%60 mm: TCOA%35 mm | 0.93 | |||||
| LCOA (mm2) | 26,808 | 3072 | 1074 | |||
| LCOA60 mm: LCOA35 mm | 2.86 | |||||
| Open Area (LCOA/LCOA + TCOA) (mm2) | 0.67 | 0.67 | 0.66 | |||
| C1 | C2 | C1 | C2 | C1 | C2 | |
| Visual Representation |  |  |  |  |  |  |
| TCOA (mm2) | 21,726 | 2289 | 801 | |||
| TCOA60 mm: TCOA35 mm | 2.86 | |||||
| TCOA% (%) | 84.87 | 80.97 | 85.67 | |||
| TCOA%60 mm: TCOA%35 mm | 0.95 | |||||
| LCOA (mm2) | 32,261 | 3503 | 1209 | |||
| LCOA60 mm: LCOA35 mm | 2.90 | |||||
| Open Area (LCOA/LCOA + TCOA) (mm2) | 0.60 | 0.60 | 0.60 | |||
| D1 | D2 | D1 | D2 | D1 | D2 | |
| Visual Representation |  |  |  |  |  |  |
| TCOA (mm2) | 21,726 | 2452 | 835 | |||
| TCOA60 mm: TCOA35 mm | 2.94 | |||||
| TCOA% (%) | 84.87 | 86.74 | 89.3 | |||
| TCOA%60 mm: TCOA%35 mm | 0.97 | |||||
| LCOA (mm2) | 32,261 | 3589 | 1167 | |||
| LCOA60 mm: LCOA35 mm | 3.08 | |||||
| Open Area (LCOA/LCOA + TCOA) (mm2) | 0.60 | 0.59 | 0.58 | |||
| E1 | E2 | E1 | E2 | E1 | E2 | |
| Visual Representation |  |  |  |  |  |  |
| TCOA (mm2) | 23,667 | 2577 | 814 | |||
| TCOA60 mm: TCOA35 mm | 3.17 | |||||
| TCOA% (%) | 92.45 | 91.16 | 87.06 | |||
| TCOA%60 mm: TCOA%35 mm | 1.05 | |||||
| LCOA (mm2) | 38,180 | 4163 | 1388 | |||
| LCOA60 mm: LCOA35 mm | 3.00 | |||||
| Open Area (LCOA/LCOA + TCOA) (mm2) | 0.62 | 0.62 | 0.63 | |||
Appendix C


Appendix D


References
- Badino, E.; Shtrepi, L.; Astolfi, A. Acoustic Performance-Based Design: A Brief Overview of the Opportunities and Limits in Current Practice. Acoustics 2020, 2, 246–278. [Google Scholar] [CrossRef]
- Kuttruff, H. Room Acoustics, 6th ed.; Routledge: London, UK, 2016. [Google Scholar] [CrossRef]
- World Health Organization. Regional Office for Europe. Combined or Multiple Exposure to Health Stressors in Indoor Built Environments: An Evidence-Based Review Prepared for the WHO Training Workshop “Multiple Environmental Exposures and Risks”, Bonn, Germany, 16–18 October 2013; World Health Organization: Geneva, Switzerland, 2013. [Google Scholar]
- Itard, L.; Meijer, F.; Vrins, E.; Hoiting, H. Building Renovation and Modernisation in Europe: State of the Art Review; OTB Research Institute for Housing, Delft University of Technology: Delft, The Netherlands, 2008. [Google Scholar]
- Paoletti, I. Mass Customization with Additive Manufacturing: New Perspectives for Multi Performative Building Components in Architecture. Procedia Eng. 2017, 180, 1150–1159. [Google Scholar] [CrossRef]
- Islam, S.; Bhat, G.; Sikdar, P. Thermal and Acoustic Performance Evaluation of 3D-Printable PLA Materials. J. Build. Eng. 2023, 67, 105979. [Google Scholar] [CrossRef]
- Žujović, M.; Obradović, R.; Rakonjac, I.; Milošević, J. 3D Printing Technologies in Architectural Design and Construction: A Systematic Literature Review. Buildings 2022, 12, 1319. [Google Scholar] [CrossRef]
- Prasittisopin, L.; Pongpaisanseree, K.; Jiramarootapong, P.; Snguanyat, C. Thermal and Sound Insulation of Large-Scale 3D Extrusion Printing Wall Panel. In Proceedings of the 2nd RILEM International Conference on Concrete and Digital Fabrication, Eindhoven, The Netherlands, 6–8 July 2020; Springer: Berlin/Heidelberg, Germany, 2020; Volume 28, pp. 1174–1182. [Google Scholar] [CrossRef]
- Vasina, M.; Monkova, K.; Pavol Monka, P.; Kozak, D.; Tkac, J. Study of the Sound Absorption Properties of 3D-Printed Open-Porous ABS Material Structures. Polymers 2020, 12, 1062. [Google Scholar] [CrossRef] [PubMed]
- Boulvert, J.; Cavalieri, T.; Costa-Baptista, J.; Schwan, L.; Romero-García, V.; Gabard, G.; Fotsing, E.R.; Ross, A.; Mardjono, J.; Groby, J.P. Optimally Graded Porous Material for Broadband Perfect Absorption of Sound. J. Appl. Phys. 2019, 126, 175101. [Google Scholar] [CrossRef]
- Liu, Z.; Zhan, J.; Fard, M.; Davy, J.L. Acoustic Properties of a Porous Polycarbonate Material Produced by Additive Manufacturing. Mater. Lett. 2016, 181, 296–299. [Google Scholar] [CrossRef]
- Attenborough, K. Macro- and Micro-Structure Designs for Porous Sound Absorbers. Appl. Acoust. 2019, 145, 349–357. [Google Scholar] [CrossRef] [Green Version]
- Cai, X.; Guo, Q.; Hu, G.; Yang, J. Ultrathin Low-Frequency Sound Absorbing Panels Based on Coplanar Spiral Tubes or Coplanar Helmholtz Resonators. Appl. Phys. Lett. 2014, 105, 121901. [Google Scholar] [CrossRef] [Green Version]
- Attenborough, K. Microstructures for Lowering the Quarter Wavelength Resonance Frequency of a Hard-Backed Rigid-Porous Layer. Appl. Acoust. 2018, 130, 188–194. [Google Scholar] [CrossRef]
- Liu, Z.; Zhan, J.; Fard, M.; Davy, J.L. Acoustic Properties of Multilayer Sound Absorbers with a 3D Printed Micro-Perforated Panel. Appl. Acoust. 2017, 121, 25–32. [Google Scholar] [CrossRef]
- Huang, W.; Schwan, L.; Romero-García, V.; Génevaux, J.M.; Groby, J.P. 3D-Printed Sound Absorbing Metafluid Inspired by Cereal Straws. Sci. Rep. 2019, 9, 8496. [Google Scholar] [CrossRef] [PubMed] [Green Version]
- Casarini, C.; Tiller, B.; Mineo, C.; MacLeod, C.N.; Windmill, J.F.C.; Jackson, J.C. Enhancing the Sound Absorption of Small-Scale 3D Printed Acoustic Metamaterials Based on Helmholtz Resonators. IEEE Sens. J. 2018, 18, 7949–7955. [Google Scholar] [CrossRef] [Green Version]
- Setaki, F.; Tian, F.; Turrin, M.; Tenpierik, M.; Nijs, L.; Van Timmeren, A. 3D-Printed Sound Absorbers: Compact and Customisable at Broadband Frequencies. Archit. Struct. Constr. 2023, 3, 205–215. [Google Scholar] [CrossRef]
- Setaki, F.; Tenpierik, M.; Timmeren, A.V.; Turrin, M. New Sound Absorption Materials: Using Additive Manufacturing for Compact Size, Broadband Sound Absorption at Low Frequencies. In Proceedings of the Inter-Noise 2016, Hamburg, Germany, 21–24 August 2016. [Google Scholar]
- Sekar, V.; Eh Noum, S.Y.; Putra, A.; Sivanesan, S.; Chin Vui Sheng, D.D. Fabrication of Light-Weighted Acoustic Absorbers Made of Natural Fiber Composites via Additive Manufacturing. Int. J. Lightweight Mater. Manuf. 2022, 5, 520–527. [Google Scholar] [CrossRef]
- Yang, W.; Bai, X.; Zhu, W.; Kiran, R.; An, J.; Chua, C.K.; Zhou, K. 3D Printing of Polymeric Multi-Layer Micro-Perforated Panels for Tunable Wideband Sound Absorption. Polymers 2020, 12, 360. [Google Scholar] [CrossRef] [Green Version]
- Jiang, C.; Moreau, D.; Doolan, D. Acoustic Absorption of Porous Materials Produced by Additive Manufacturing with Varying Geometrics. In Proceedings of the AAS2017 Acoustics 2017 Perth: Sound, Science and Society, Perth, Australia, 19–22 November 2017. [Google Scholar]
- Aslan, R.; Turan, O. Gypsum-Based Sound Absorber Produced by 3D Printing Technology. Appl. Acoust. 2020, 161, 107162. [Google Scholar] [CrossRef]
- Monkova, K.; Vasina, M.; Monka, P.P.; Vanca, J.; Kozak, D. Effect of 3D-Printed PLA Structure on Sound Reflection Properties. Polymers 2022, 14, 413. [Google Scholar] [CrossRef]
- Zieliński, T.G.; Opiela, K.C.; Pawłowski, P.; Dauchez, N.; Boutin, T.; Kennedy, J.; Trimble, D.; Rice, H.; Van Damme, B.; Hannema, G.; et al. Reproducibility of Sound-Absorbing Periodic Porous Materials Using Additive Manufacturing Technologies: Round Robin Study. Addit. Manuf. 2020, 36, 101564. [Google Scholar] [CrossRef]
- Cox, T.J.; D’Antonio, P. Acoustic Absorbers and Diffusers: Theory, Design and Application, 3rd ed.; Taylor & Francis: Abingdon-on-Thames, UK, 2017. [Google Scholar]
- ISO/IEC 17025:2017; General Requirements for the Competence of Testing and Calibration Laboratories. International Organization for Standardization: Geneva, Switzerland, 2017.
- ISO 10534-2:2001; Acoustics: Determination of Sound Absorption Coefficient and Impedance in Impedance Tubes. Part 2, Transfer-Function Method. International Organization for Standardization: Geneva, Switzerland, 2001.
- Smith, C.S.; Boucher, P. The Tiling Patterns of Sebastien Truchet and the Topology of Structural Hierarchy. Leonardo 2017, 20, 373–385. [Google Scholar] [CrossRef]
- Cox, T.J. Modelling of Acoustic Absorbers: Predict Material Properties, Surface Impedance and Absorption Coefficients of Acoustic Absorbers. Available online: https://www.mathworks.com/matlabcentral/fileexchange/54004-modelling-of-acoustic-absorbers?tab=discussions (accessed on 5 July 2023).
- Buj-Corral, I.; Bagheri, A.; Domínguez-Fernández, A.; Casado-López, R. Influence of Infill and Nozzle Diameter on Porosity of FDM Printed Parts with Rectilinear Grid Pattern. Procedia Manuf. 2019, 41, 288–295. [Google Scholar] [CrossRef]
- colorFabb LW-PLA—Technical Datasheet. Available online: https://colorfabb.com/media/datasheets/tds/colorfabb/TDS_E_ColorFabb_LW-PLA.pdf (accessed on 11 July 2023).
- Shtrepi, L.; Mendéz Echenagucia, T.; Badino, E.; Astolfi, A. A Performance-Based Optimization Approach for Diffusive Surface Topology Design. Build. Acoust. 2021, 28, 231–247. [Google Scholar] [CrossRef]
- Pfretzschner, J.; Simon, F.; Rodriguez, R.M.; de la Colina, C. Simplified Calculus to Estimate the Acoustical Absorption of Nonplanar Materials. J. Acoust. Soc. Am. 1999, 105, 1316. [Google Scholar] [CrossRef]
- Kristiansen, U.R.; Vigran, T.E. On the Design of Resonant Absorbers Using a Slotted Plate. Appl. Acoust. 1994, 43, 39–48. [Google Scholar] [CrossRef]


| Printing Profile A | Printing Profile B | |
|---|---|---|
| First Layer Height | 0.10 mm | - |
| Layer Height | 0.20 mm | 0.20 mm |
| Extrusion Width | 0.75 mm | 0.60 mm |
| Shells | 0 | 0 |
| Retraction Speed | 45 mm/s | 45 mm/s |
| Retraction Material Amount | 0.50 mm | 0.50 mm |
| Flowrate | 45% | 90% |
| Infill Pattern Type | Gyroid | Grid |
| Infill Density | 20% | 100% |
| First Layer Solid Fill Pattern | Lines | - |
| Bottom Solid Fill Layers | 2 | - |
| Bed Temperature | 60 °C | 60 °C |
| Extruder | 265 °C | 207 °C |
| Fan Speed | No Fan | No Fan |
| First Layer Speed | 15.00 mm/s | - |
| Default Printing Speed | 40 mm/s | 40 mm/s |
| Sample Typology | Number of Steps | Step Size (mm) | Remaining Core Thickness (mm) |
|---|---|---|---|
| A1 | 1 | 13.3 | 54.7 |
| B1 | 1 | 6.7 | 61.3 |
| C1 | 2 | 10.7 | 46.7 |
| D1 | 2 | 5.3 | 57.3 |
| E1 | 3 | 8.6 | 42.3 |
| A2 | 1 | 13.3 | 34.7 |
| B2 | 1 | 6.7 | 41.3 |
| C2 | 2 | 10.7 | 26.7 |
| D2 | 2 | 5.3 | 37.3 |
| E2 | 3 | 8.6 | 22.3 |
| Sample Typology | Volume (×10−5 m3) of 60 mm Samples | Volume (×10−5 m3) of 35 mm Samples |
|---|---|---|
| A1 | 17.3 | 5.98 |
| B1 | 18.4 | 6.10 |
| C1 | 16.6 | 5.52 |
| D1 | 18.0 | 5.98 |
| E1 | 16.2 | 5.22 |
| A2 | 11.6 | 4.11 |
| B2 | 12.7 | 4.23 |
| C2 | 10.9 | 3.65 |
| D2 | 12.4 | 4.11 |
| E2 | 10.5 | 3.35 |
| 60 mm Samples | 35 mm Samples | |
|---|---|---|
| A | 2 | 16 |
| B | 1 | 17 |
| C | 2 | 6 |
| D | 2 | 17 |
| E | 2 | 2 |
| Samples | TCOA Ratios (TCOA60 mm: TCOA35 mm) | TCOA% Ratios (TCOA%60 mm: TCOA%35 mm) | LCOA Ratios (LCOA60 mm: LCOA35 mm) |
|---|---|---|---|
| A1 | 2.09 | 0.69 | 2.24 |
| A2 | 2.09 | 0.69 | 2.24 |
| B1 | 2.82 | 0.93 | 2.86 |
| B2 | 2.82 | 0.93 | 2.86 |
| C1 | 2.86 | 0.95 | 2.90 |
| C2 | 2.86 | 0.95 | 2.90 |
| D1 | 2.94 | 0.97 | 3.08 |
| D2 | 2.94 | 0.97 | 3.08 |
| E1 | 3.17 | 1.05 | 3.00 |
| E2 | 3.17 | 1.05 | 3.00 |
| Mean | 2.78 | 0.92 | 2.82 |
Disclaimer/Publisher’s Note: The statements, opinions and data contained in all publications are solely those of the individual author(s) and contributor(s) and not of MDPI and/or the editor(s). MDPI and/or the editor(s) disclaim responsibility for any injury to people or property resulting from any ideas, methods, instructions or products referred to in the content. |
© 2023 by the authors. Licensee MDPI, Basel, Switzerland. This article is an open access article distributed under the terms and conditions of the Creative Commons Attribution (CC BY) license (https://creativecommons.org/licenses/by/4.0/).
Share and Cite
Tsiokou, V.; Shtrepi, L.; Badino, E.; Astolfi, A.; Karatza, A. Exploratory Acoustic Investigation of Customizable 3D-Printed Hybrid Acoustic Materials (HAMs) through Interlaboratory Impedance Tube Measurements. Acoustics 2023, 5, 653-675. https://doi.org/10.3390/acoustics5030040
Tsiokou V, Shtrepi L, Badino E, Astolfi A, Karatza A. Exploratory Acoustic Investigation of Customizable 3D-Printed Hybrid Acoustic Materials (HAMs) through Interlaboratory Impedance Tube Measurements. Acoustics. 2023; 5(3):653-675. https://doi.org/10.3390/acoustics5030040
Chicago/Turabian StyleTsiokou, Vaia, Louena Shtrepi, Elena Badino, Arianna Astolfi, and Anna Karatza. 2023. "Exploratory Acoustic Investigation of Customizable 3D-Printed Hybrid Acoustic Materials (HAMs) through Interlaboratory Impedance Tube Measurements" Acoustics 5, no. 3: 653-675. https://doi.org/10.3390/acoustics5030040