Article

Sustainable Sound Absorbers to Improve Acoustical Comfort in Atria: A Methodological Approach

Dipartimento di Architettura, Costruzione e Design, Politecnico di Bari, via Orabona 4, I-70125 Bari, Italy
*
Author to whom correspondence should be addressed.
Acoustics 2023, 5(1), 280-298; https://doi.org/10.3390/acoustics5010017
Submission received: 27 January 2023 / Revised: 28 February 2023 / Accepted: 3 March 2023 / Published: 6 March 2023

Abstract

:
Resource-efficient buildings are one of the most important challenges of the construction industry, which could be achieved by limiting the extraction of natural resources and by replacing them with industrial residues. The present work proposes innovative panels made from textile wastes as an efficient solution for making the semi-open atrium in the Polytechnic University of Bari, acoustically suitable for use as an area of study. Several measurements were carried out in the atrium under empty and occupied conditions in order to characterize the sound field of the space (i.e., the reverberation time and the sound pressure level) and the actual sound sources (i.e., the sound power level of the students occupying the space). The on-site measurement results were useful to calibrate a geometrical acoustic model implemented in CATT-Acoustic software and used to predict the effect of the proposed treatments. About 700 m2 of absorbent panels were distributed, leading to a predicted reduction in the reverberation time from 2.4 s to 1.4 s at 500 Hz, and consequently to an estimated 3 dB reduction in sound pressure level, resulting in a reduction in the background noise level due to speech. Furthermore, as a consequence of the “Lombard effect”, a decrease in the background noise level will likely reduce the sound power level of the speakers by 2 dB, with an expected overall reduction of 5 dB.

1. Introduction

The growing awareness of the importance of acoustic quality and noise protection in indoor and outdoor environments is encouraging the building sector to offer design solutions which are not only sustainable, but also able to meet acoustic comfort requirements [1]. In 2015, all member states of the United Nations adopted the 2030 Agenda as a plan of action aimed at defining the paths for achieving 17 Sustainable Development Goals, including that of ensuring good health and well-being at every stage of life [2]. Considering that poor acoustic environments negatively impact the well-being of occupants, this third goal inevitably intersects with the fields of acoustic quality and of outdoor and indoor acoustic comfort [3].
The acoustic comfort is an aspect especially considered in those environments where attention, listening and learning processes are heavily involved [4]. Several studies have shown the physical and psychological effects associated with the poor acoustic quality of open plan offices [5,6] or schools [7,8]. Interest in the acoustics of educational spaces, in general, and school classrooms, in particular, has significantly increased in the past years, leading to the introduction of standard regulations aimed at limiting the noise level in these spaces. Italy has recently introduced the UNI 11532-2 standard [9] in order to define minimum requirements for achieving acoustic comfort conditions in schools, for different categories of space in relation to their use.
However, all the spaces where many people gather such as restaurants [10] or atria [11] could be easily affected by the detrimental effects related to the background noise and reverberation. In large atria, acoustic comfort plays an important role, but it is less studied compared to other physical environmental factors [12]. This is due to the large volume or special shape of these spaces, which make the sound fields difficult to characterize [13]. In fact, usually, the shapes of atria result from the interactions between the main space and the linked smaller spaces which affect the sound wave forms, determining the speed and level at which the sound reaches the occupants [14]. As a consequence of an increase in the sound pressure level, the occupants tend to increase their vocal effort, leading the so-called “Lombard Effect” [15]. A further aspect which makes the atria “non-acoustic” spaces concerns the used materials. Usually, atria are characterized by hard and polished materials which look very nice and clean, but cause long reverberation times and high noise levels [16]. The treatment of the surfaces with sound-absorbing materials could be the most applicable solution for reducing the sound reflectance of surfaces, but their application should be carefully chosen to achieve acoustically and architecturally efficient results [17].
The aim of the present research work is to prove the effectiveness of using innovative textile-waste based panels in order to make the semi-open atrium of the Architecture Faculty Building of the Polytechnic University of Bari acoustically suitable for use as an area of study. The acoustic performances of the studied textile materials were experimentally measured and largely discussed in the previously published papers [18,19]. As a consequence of the less explicit design guidance for atria in contrast to the accuracy of the UNI 11532-2 [9] and taking into account the possibility of converting the atrium in an area of study, the application of the sound-absorbing panels was suitably designed following the UNI 11532-2 [9].
The paper presents a methodological approach to deal with a complex topic, which not only involves controlling the space characteristics, but is expected to have implications on the subjective responses of the occupants to be fully successful. Unfortunately, it was not possible to actually install the materials given their “experimental” nature, but careful simulations were carried out in order to obtain reliable predictions. In situ measurements were carried out in order to define the actual acoustic conditions of the atrium under occupied and unoccupied conditions. The experimental results were useful to calibrate the virtual geometrical acoustic model performed with CATT-Acoustic software [20] in order to simulate the acoustic behaviour of the atrium after the application of the panels. The effectiveness of the acoustic treatment was evaluated in terms of the reduction in the reverberation time and of the resulting improvement in the control of the background noise level. Furthermore, a decrease in the vocal effort of the students who occupy the atrium was also expected based on the obtained results and taking into account the “Lombard Effect”.

2. Acoustic Comfort in Large Spaces

Acoustic comfort is the perceived state of satisfaction with the acoustical conditions in an environment [21]. It is a crucial aspect of the comfort due to the subjective perception of noise as a consequence of some factors such as retention time, purpose and type of sound sources or visit frequency [22].
The sound pressure level of background noise represents the main objective index influencing acoustic comfort evaluation. After a sound source stops emitting energy, it takes some time for the sound to become inaudible due to the continued multiple reflections between the surfaces of the space. The sound coming from the source and the sound reflected from all its surrounding surfaces can be heard by the occupants, provoking a more or less annoying sensation [23]. The time elapsed for the sound pressure level to decay over a specific range is known as reverberation time [24]. According to Sabine’s formula [25], the reverberation time is dependent on overall absorption and on the mean-free-path, that, in proportionate and diffuse spaces, depends on room volume and surface area:
T60 = 0.161 · V/∑i (Si · αi)
where T60 is the time in seconds required for a sound to decay 60 dB, V is the volume of the space, Si and αi are the area and the absorption coefficient of the i-th surface, respectively.
This is the main reason large spaces are generally characterized by a long reverberation time, resulting in an increase in the background noise level due to noise traveling and bouncing for too long before dissipating.
A longer reverberation time reduces the signal to noise ratio, resulting in a significant decrease in speech intelligibility [26]. Furthermore, in a multi-speaker background situation, the noise consists of speech of occupants who increase their speech level in order to compensate the decrease in the signal to noise ratio between them, leading to presence of the so-called “Lombard effect” [27].
The Lombard Effect is a spontaneous increase in the vocal effort of the speakers as a consequence of the increase in the ambient noise pressure level. This increase in the speech level again led to a higher background sound level. The Lombard Effect was introduced in 1909, after the French otolaryngologist Étienne Lombard (1869–1920) observed and reported that people with normal hearing raised their voice when subjected to noise [15].
Vocal effort was introduced in ISO 9921 [28], where it is objectively defined in terms of equivalent continuous A-weighted sound pressure level of the direct sound in front of a male speaker at a distance of 1 m from the mouth (Lp,A,1m). Thus, according to Equation (2), the Lombard effect was found to start at an A-weighted background noise level (Lb,A) above 45 dB and a speech level above 55 dB:
Lp,A,1m = 55 + c · (Lb,A − 45)
where c is the Lombard slope.
Values of c ranging from 0.3 to 0.7 dB/dB have been suggested in the literature with varying of the ambient noise pressure level [29]. According to Rindel [30], the Lombard slope c = 0.5 was in reasonable agreement with the data measured in eating establishments for a wide range of customers. This meant that the A-weighted sound power level of speech was assumed to increase by 0.5 dB when the ambient noise level increased by 1 dB. The same slope was already found by Webster and Klumpp [31] and again by Gardner [32] in several cases, including dining rooms, auditoriums and theatres, studying a large number of individuals in each facility.

3. Textile Material

3.1. Overview of General Properties and Manufacturing Process

The materials chosen for the study were innovative and sustainable nonwoven panels made from textile wastes, resulting from the industrial scale-up of the most promising prototypes previously developed and tested at laboratory scale [33]. Therefore, the panels tested in this work were produced with specific characteristics (i.e., density and thickness values) determined on the basis of the laboratory results. The wastes were selected among tailoring of the autumn–winter collection of the local company Gordon Confezioni srl and were mainly made of wool. An industrial airlaying process was followed by using 15% Copolyester/polyester (Co PET/PET) sheath-core bi-component fibres as thermally bondable fibres at 100 °C. The obtained materials were in the form of panels 60 × 120 cm2 with a density of 68 kg/m3 and 4 cm thick. The main non-acoustical properties of the materials, i.e., the porosity and the air flow resistivity, were measured in laboratory on samples cut from the larger panels in compliance with the sizes and shapes required by the followed measurement methods. Particularly, the open porosity was characterized by using a ULTRAPYC 1200-e Quantachrome Helium gas Pycnometer; whereas the air flow resistivity was evaluated following the Ingard and Dear method [34]. More information about the manufacturing process followed to obtain the studied materials and about the experimental characterization of their performances are reported in [18]. However, the results of the properties considered most useful for the practical acoustic application of the panels as proposed in the present work are outlined in Table 1.

3.2. Acoustic Measurements

As it can be better explained later, the design solutions chosen to improve the acoustic conditions of the atrium made it necessary to measure the sound absorption behaviour of the panels considering two different situations. The diffuse sound absorption coefficients α (-) were measured in a reverberation room according to standard ISO 354 [35], considering one-third octave bands with centre frequencies from 100 Hz to 5000 Hz. The material was tested according to type A mounting illustrated in Annex B of ISO 354 [35] (later referred as “ISO mounting_A”). This type of measurement was useful to characterize the sound absorption behaviour of panels which will be supposedly fixed to the plastered surfaces of the building facades surrounding the atrium.
A baffle arrangement, later on referred as “suspended mounting”, was also tested (Figure 1). The mounting of the materials as baffles differed from Annex B prescriptions in order to replicate the later supposed use conditions of the panels between the worktables and for the covering. Particularly, the recommended rigid matrix was replaced by a random arrangement of the baffles mounted at 1.50 m from the floor, having four free edges.
More details about the measurement set-up of the sound absorption coefficients obtained arranging the samples according to ISO mounting_A were reported in [18]; whereas a more accurate description of the measurements carried out considering the baffles arrangement was reported in [19]. However, the most relevant experimental results are shown in Figure 2.
As it can be seen in Figure 2, regardless of the mounting type, the panels showed a sound absorption behaviour in accordance with the “ideal” performance of a porous sound absorber. In fact, the sound absorption coefficients sharply increased in the medium and high frequency range reaching α = 0.9 starting from 1250 Hz in the case of suspended mounting and showing α values higher than one starting from 2000 Hz in the case of ISO mounting_A. As better explained in [18], the observed sound absorption coefficients higher than the unity could be explained due to the diffraction effects of the edges and the boundary conditions, with particular reference, in the low frequency range, to the modal behaviour of the room.
The sound absorption coefficients obtained considering the suspended mounting were lower than those obtained from the ISO mounting_A. Such results were expected as removing the rigid backing makes the panel acoustically transparent and makes their absorption only dependent on surface mass and flow resistivity [36], with a theoretical limit equal to 0.5 when the impedance of the panel is twice the impedance of the air. In the present case, values exceeded 0.5 realistically as a consequence of the edge effect as well as of mutual reflection leading to multiple absorption [37].

4. Case Study

4.1. Architectural Features

The atrium of the Department of Architecture Construction and Design of the Polytechnic University of Bari was chosen as a case study. The aim was to optimize the acoustic characteristics of this semi-outdoor space in order to make it suitable for use by students, while reducing noise exposure of the rooms facing the atrium. A targeted distribution of the acoustic absorption was planned to keep low the background noise level from speech and to control the reverberation phenomenon. The atrium is rectangular, approximately 11 m × 15 m, with an approximate height of 21 m. On three sides, it is surrounded by buildings with four floors above ground (i.e., on one long side and on the two short ones). On the other long side, it is surrounded by two buildings with two floors above ground, divided by a passageway about 3 m wide and 12 m long. Strip windows create horizontal stripes across the facade of these buildings. The repetition of the openings to the same way on all the floors it is underlined by large, plastered string course-frames. The rectangular space and the passageway have a curved Plexiglas ceiling supported by a space truss. The passageway connects the atrium with an uncovered larger space. Figure 3 shows a layout in which the atrium is highlighted in grey and some pictures of the atrium.

4.2. Acoustic Measurements

Impulse responses (IRs) were measured in the empty atrium in order to characterize the sound field of the space, obtaining its reverberation time and other acoustic parameters. A balloon burst was used as a source and a pair of omnidirectional microphones (Soundman OKM II), worn by one of the authors and connected to a Tascam DR08 portable recorder, used for recording the signal. The measurements were carried out according to ISO 3382-2 [38]. The source (S0) was located in the middle of the atrium and three positions were established for the receivers (1, 2, and 3), 1.6 m off the ground (ear height). Two receivers were located within the largest rectangular covered area and one was located in the covered passageway (Figure 4). As the balloon burst was used as a source, each measurement was repeated at least twice to evaluate the repeatability of the results and T20 was calculated to ensure that signal-to-noise ratio was adequate among the entire spectrum of the frequencies. Reverberation time and other acoustical parameters were calculated from measured IRs using the free tool Aurora for Audacity. The environmental conditions were monitored during the whole measurement campaign using a thermo-hygrometer DeltaOhm HD2101. A temperature of 13.8 °C and a relative humidity of 56.6% were recorded. Figure 5 shows the results of the Early Decay Time EDT (the reverberation time extrapolated from the initial 10 dB of decay) and of the reverberation time T20 (extrapolated from −5 to −25 dB) expressed as values averaged over the three measuring points at octave band frequencies from 125 Hz to 4 kHz. The EDT results a good predictor of the perception of reverberation, mainly affecting the space’s support to the voice. The difference observed between EDT and T20 values proved the non-diffuse behaviour of the treated space. However, a T20 value longer than EDT suggested a shorter initial reverberation especially in the volume of the space where the worktables were located, an indicator of good speech clarity.
The background noise level was also evaluated measuring the sound pressure level (Lb,A) of the space in 80% occupied conditions, over a period of 5 min. The measurements were carried out in three different receiver positions (Figure 4), labelled “1” “4” and “5” using a 01dB SOLO sound level meter equipped with a GRAS 40AR random-incidence microphone. One receiver was located in the centre of the atrium; the other two positions were shifted along the symmetry axis, respectively close to the entrance door and to the passageway. Figure 6 highlights that the Lb,A values measured in three receiver points show insignificant variation at each third-octave band frequency from 125 Hz to 4 kHz. The A-weighted sound pressure level averaged over the three measuring points was 62.3 dB and resulted from the presence of 30 students (about 80% of total seating capacity) evenly distributed among tables. During the measurements students were studying, chatting and discussing among them, and they were explicitly asked not to change their behaviour in consequence of the measurement. It should be noted that, with few exceptions, only one person per table was actually speaking. Finally, in order to evaluate the role of speech in comparison to other background noises, and possibly explain the higher-than-expected low frequency levels, measurements were also carried out with the atrium under unoccupied conditions. The measurement was carried out in receiver position 1, deemed far enough from the uncovered space connected with the atrium by the passageway, but at the same time in a symmetrical position with respect to the worktables. The one-third octave band values given in Figure 6 and an A-weighted level of 49.4 dB were obtained, proving that speech was largely responsible for the noisiness of the space.

5. Acoustic Modelling

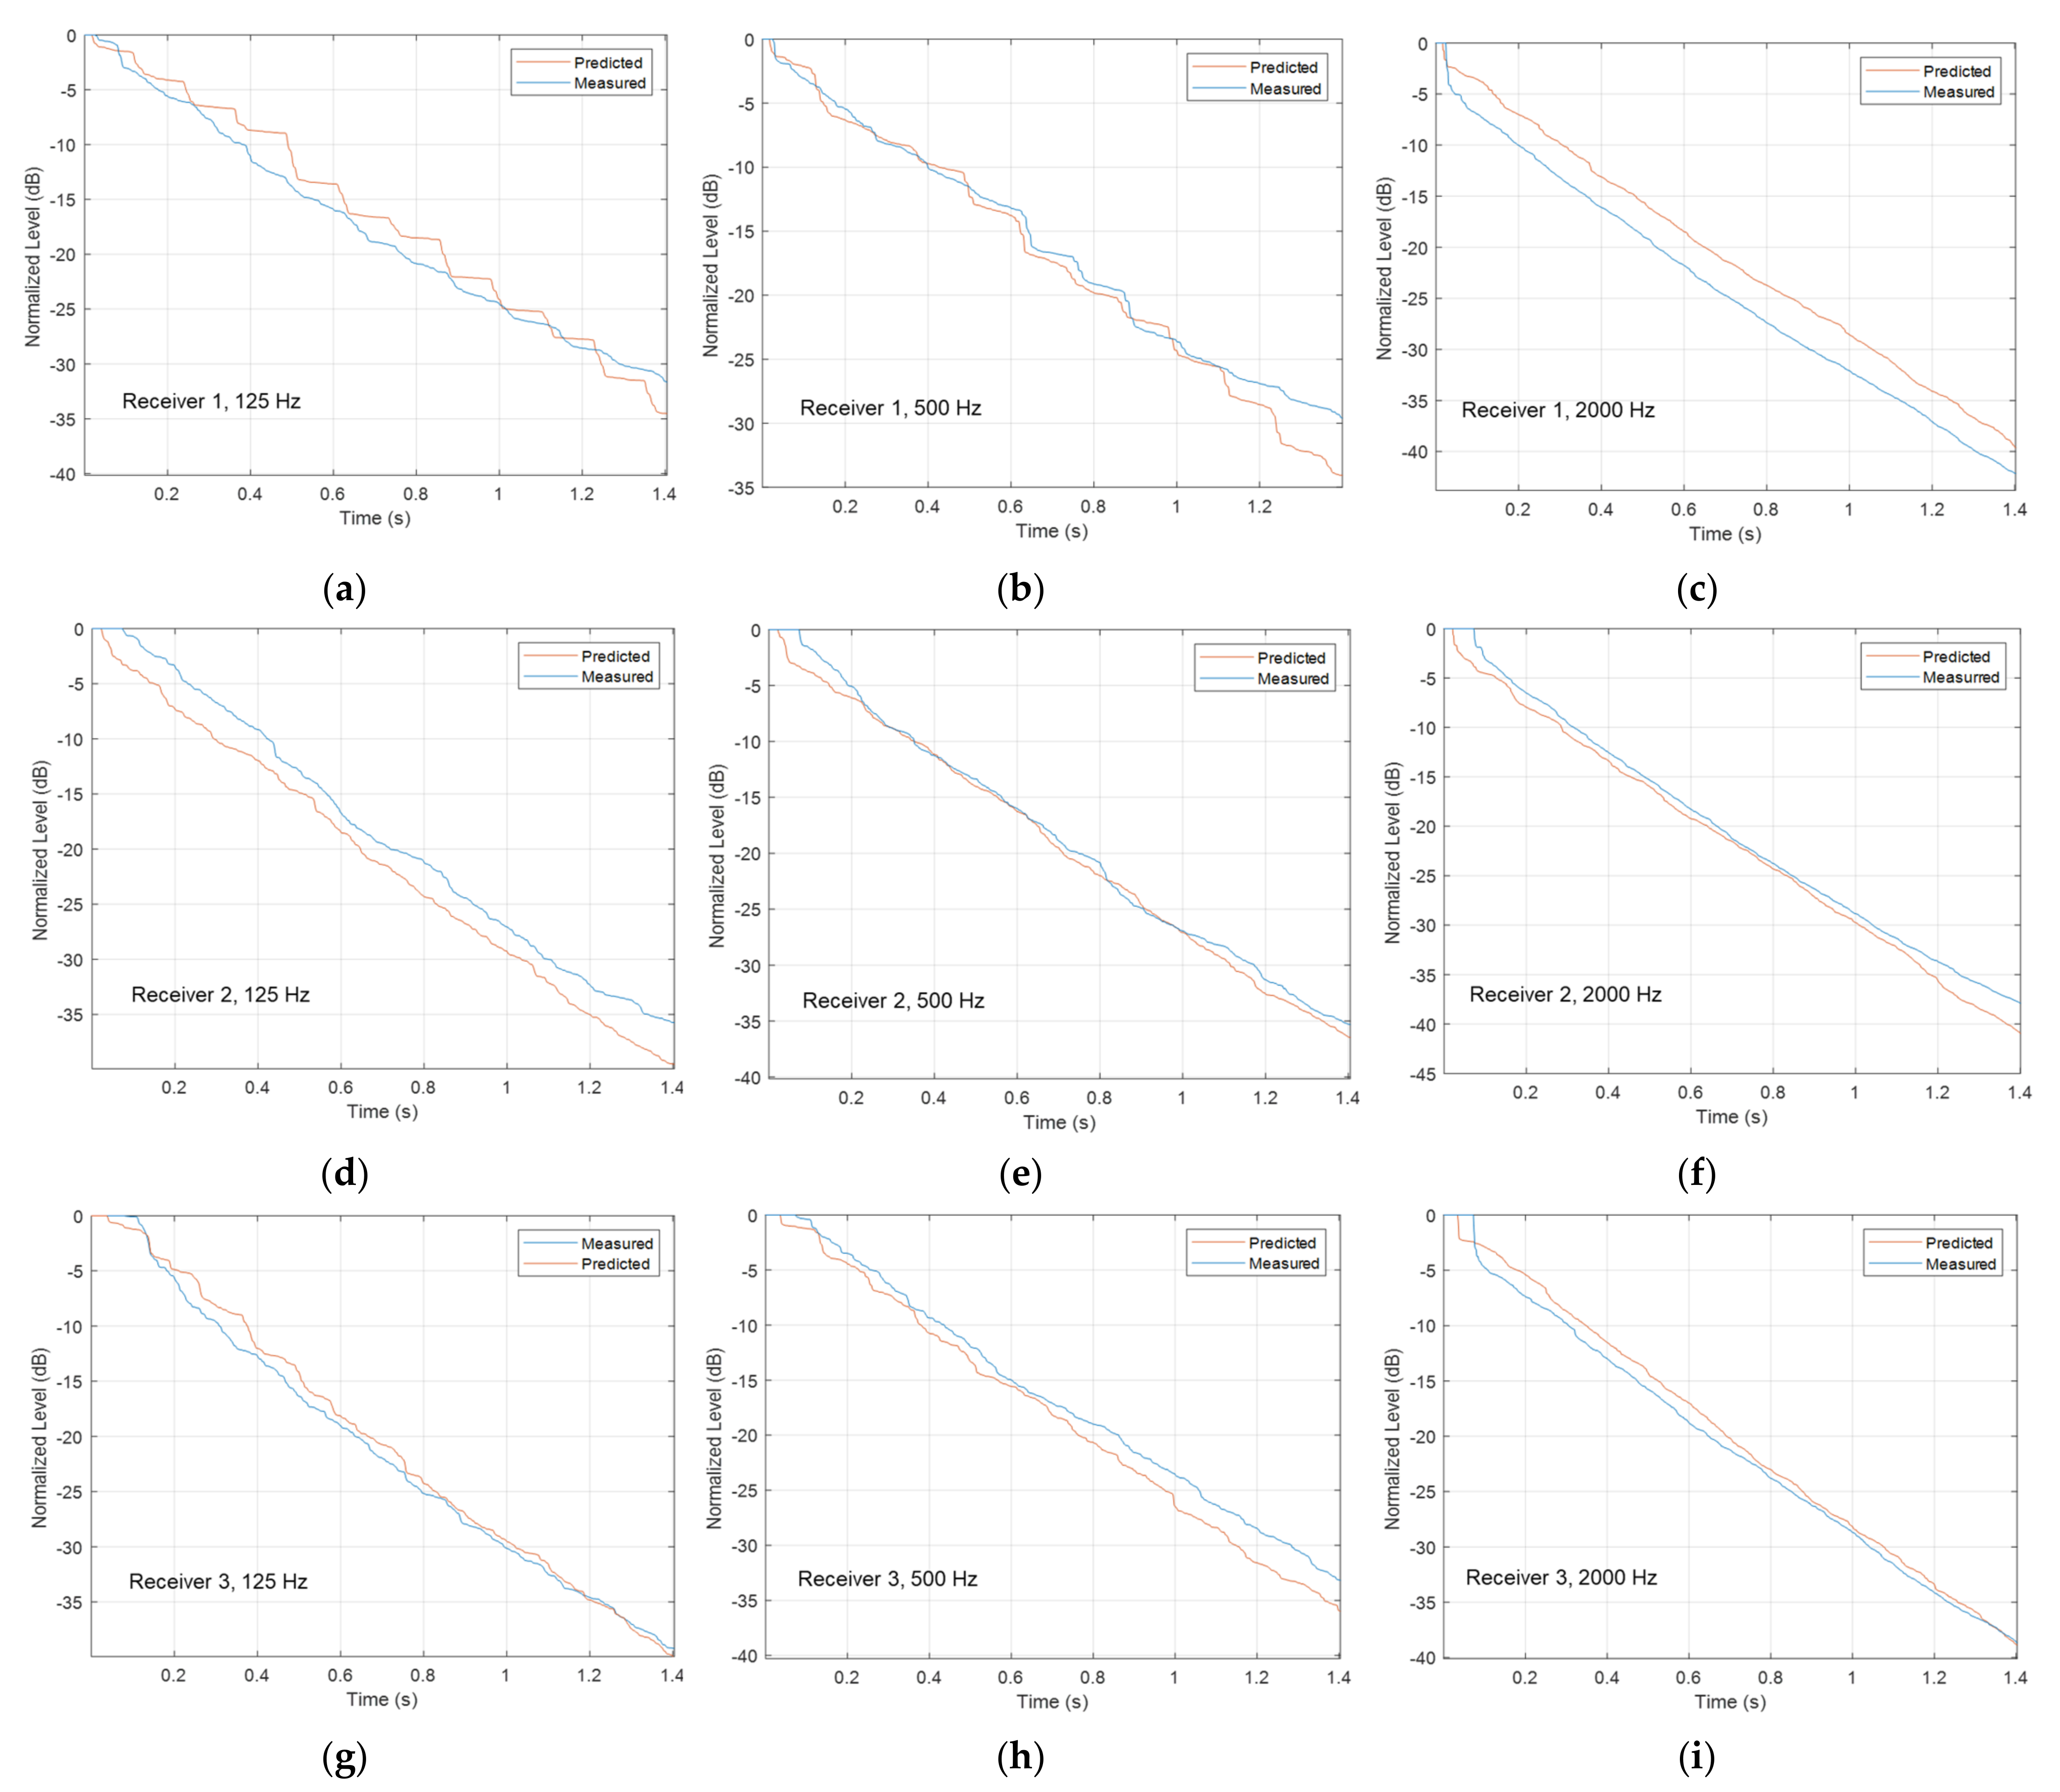
5.1. Implementation and Calibration of the Model

CATT-Acoustic software (v. 9.1g) [20], with the calculation engine, TUCT v.2, was used for acoustic simulations and the “Algorithm 2” was considered. It uses a first degree of actual ray split-up for all reflection orders where all specular–specular and all specular–diffuse reflections are deterministic, while the remaining reflection combinations are treated randomly, meaning that if the scattering coefficient s (-) of the surface is 0.1, 9 reflections out of 10 will be reflected specularly, while the remaining will be reflected randomly. This algorithm is mandatory for open rooms and is slightly slower (being computationally more demanding), but requires a lower number of rays to cast because diffuse rays are actually split in many new rays. In addition, it reduces dramatically the random variations that may appear in the results.
The resulting geometrical model was made of 84 planes, with an overall surface area of 2172 m2 and an approximate volume of 5000 m3, calculated as the volume of the atrium between the floor and the Plexiglas ceiling (Figure 7a). Windows were modelled as subplanes, so as to minimize the overall number of surfaces and speed up calculations, but they were modelled so that the “auto-edge” feature could be used, to increase scattering at borders and account for diffraction effects due to different materials and to the recessed mounting compared to the actual wall plane. Figure 7b shows the relative absorption area expressed in the percentage of each material used in the model.
In order to provide an accurate calibration of the model, sources and receivers were located in the same positions used during the on-site measurements (Figure 4) and the source was assumed to be omni-directional. Calculations were run using 500,000 rays per octave (the number suggested by the software was about ten times lower), and truncation time (i.e., the length of the simulated impulse response) was set to 2500 ms in compliance with the maximum measured T20. The effect of air absorption was taken into account by properly setting temperature and relative humidity as measured during the on-site survey, so that the software could calculate the appropriate coefficients according to ISO 9613-1 [39]. The absorption coefficients were assigned starting from literature values [40], after identifying comparable surface treatments. Then, the approach that was followed was to start from the materials with the largest surface and possibly more uncertain behaviour and apply small changes in the absorption coefficients, always remaining within “physically acceptable” limits. When these limits where reached, another material was considered, and so on. A significant aspect in this process was represented by the knowledge of the simplifications that were introduced in the model and that might be responsible of a reduction in the actual exposed area (e.g., the aluminium cladding covering a larger surface, being folded on the sides of the small pillars, thus justifying the increased values that were found). With reference to scattering, the higher values were only assigned to surfaces that were simplified in the model but are more complex in reality (e.g., occupied tables that also include seats and students around them), and strictly following the guidelines given in the program manual [20]. This refinement process was concluded when mean values of measured and predicted T20 coincided within the same accuracy limits considered during the on-site measurements (Table 2). The calculation, made according to Annex A of ISO 3382-2 [38], returned frequency dependent limits equal to 4.3%, 2.9%, 1.9%, 1.4% 1.0%, and 0.8%, respectively at octave band frequencies from 125 Hz to 4 kHz.
In order to compare measured and predicted results consistently [41], simulated IRs were exported as binaurals in uncompressed wave format and processed with the same tool used to calculate on-site acoustical parameters. The subsequent fine tuning of the absorption coefficients mostly involved the materials with greater uncertainty (such as the aluminium cladding between windows). Scattering coefficients were assigned taking into account the surface irregularities and the finite dimensions of the planes (such as the already mentioned windows), and, for tables, the presence of seats around them. The Plexiglas ceiling was given higher scattering coefficients to account for the curvature and the presence of the space truss. Flat surfaces were given values of 0.1 independent of frequency, with the exception of the floor, which, being very large, was given a 0.05 value. Absorption and scattering coefficients for all the surfaces are given in Table 3, which also shows the sound absorption coefficients used for the absorbing panels subsequently applied for improving acoustic comfort in the atrium.
After the calibration of reverberation time, a further check was carried out to verify that point-by-point, differences were correctly accounted by the model. Thus, mid-frequency values of Clarity C50 (dB) and Centre Time Ts (ms) were used to compare simulations and measurements, obtaining variations that, as shown in Table 4, were close to one Just Noticeable Difference (JND) as given by ISO 3382-1 [42] (i.e., JND equal to 1 dB for C50 and to 10 ms for Ts).
As a further demonstration of the accuracy of the simulated results, the measured and predicted decay curve in position 1, 2 and 3 (Figure 4) at 125 Hz, 500 Hz and 2000 Hz are given in Figure 8. As can be observed, especially in position 1, a stepped decay appears as a consequence of a flutter echo between the floor and the Plexiglas ceiling. In both predicted and measured cases at 500 Hz, the “steps” appeared almost perfectly in the same positions and with smaller differences appearing in the initial part where diffuse reflections probably minimized the effect in the measured IR.
Finally, once the model was fully calibrated in terms of surface properties, the characteristics of the actual sound sources (the students occupying the space) were considered, using the measurements of sound pressure level described before as a reference. In order to properly simulate the measured conditions, it was assumed that only one of the occupants of the tables was actually speaking. Thus, taking advantage of the symmetry of the space and the fact that Lb,A measurements were carried out along the symmetry axis, three sound sources (from S1 to S3) were added to the model, respectively located close to each table on one side of the atrium (Figure 9). Omni-directional behaviour was assumed to account for the different orientations of the actual speakers, while the sound power level of each source was adapted so that the overall Lb,A resulting from the simulation, increased by 3 dB to account for symmetrical sources and averaged over the three measuring points, matched the measured values. The final sound pressure level at 1 m distance Lp,1m assigned to each source is given in Figure 10, showing that the values are located in between the standardized sound pressure level usually assigned to a “normal” and to a “raised” voice level, resulting in an A-weighted Lp,A,1m value of 62.3 dB. Table 5 shows the background level Lb,A values averaged over the three measuring points comparing the measured values with those simulated after the calibration of the model. The A-weighted sound pressure level obtained after calibration of the model and averaged over the three measuring points was 62.4 dB.

5.2. Acoustic Treatment Design

The acoustic treatment was designed in compliance with the UNI 11532-2 [9] prescriptions, considering the atrium as a space for studying, but not intended for learning and libraries (i.e., category A6.3). Thus, being a space characterized by multiple and simultaneous speakers and listeners, the acoustic comfort objective should be achieved with sound absorption and residual noise control. For spaces belonging to category A6, the optimal value of the reverberation time is a function of the equivalent absorption area A and of the geometric characteristic of the space (volume V and height h). Particularly, according to Table 7 contained in the UNI 11532-2 [9], for spaces with height greater than 2.5 m, as the considered case study, the reference absorption-to-volume (A/V) ratio can be obtained from the following equation:
A/V ≥ [3.13 + 4.69 · Log10 (h)]−1
The semi-open character of the considered space made volume calculation difficult and, in any case, meaningless. Thus, Equation (3) was applied using an indirect approach. In fact, geometrical acoustic simulations allowed us to determine the reverberation time T20 of the treated space despite its non-diffuse behaviour. Therefore, the A/V values obtained from Equation (3), were used to estimate (using Sabine’s formula under the diffuse field hypothesis) the relevant reverberation time to take as a reference for the octave band frequencies suggested by the standard [9] (i.e., from 250 Hz to 2 kHz, without considering absorption by people). Considering an approximate height of 21 m, the reference A/V ratio to satisfy was 0.107, resulting in a T20 ≤ 1.49 s.
Designing an acoustic treatment usually starts from calculating the amount of total absorption that is needed at each frequency band. However, given the non-diffuse behaviour of the space under analysis, no simple predictive formula could be used. Thus, the required acoustic treatment was applied step by step, by simulating and evaluating the acoustic behaviour of the atrium after gradually entering sound absorption elements balancing the architectural restrictions on one hand, and the acoustical requirements on the other. The plastered string course-frames (green areas in Figure 11) were shown to be the only surfaces which could be directly affected by acoustic treatments to be applied directly on the façade, with the panels on the two lowest frames being the most effective sound absorption position, being closer to the source for a total of about 248 m2.
The need for further absorption led to the evaluation of additional design solutions which were chosen also by taking advantages of the self-load-bearing ability of the panels. Therefore, vertical screens mounted between the tables (at a 25 cm height from the floor) for a total of about 135 m2 were added in order to both absorb sound and prevent direct sound propagation among tables. Furthermore, as the previous treatments were not sufficient to meet the desired T20, suspended baffles (i.e., about 323 m2 of sound absorption) were added at about 9.75 m from the floor in order to limit propagation of sound towards the highest part of the atrium, and hence reverberation, without affecting the visual comfort of the occupants. Figure 11 shows the geometrical acoustic model after applying all the sound absorption treatments.

6. Results

In order to take into account the effects of the acoustic treatment on the users of the space, six receiver positions from R1 to R6 were uniformly distributed, one for each worktable (Figure 9). Three omnidirectional sound sources (from S1 to S3) were located as shown in Figure 9. Calculations were run using 500,000 rays per octave, and the truncation time was set to 2000 ms.
Figure 12 compares T20 values obtained from simulations before and after the acoustic treatment. In both cases, they are expressed as values spatially averaged over the measuring points. As can be seen, T20 was lower than the maximum value of 1.49 s at each octave band frequency suggested by the standard [9].
The control of the reverberation was not the only parameter analysed for evaluating the effects of the application of the absorbing panels on the acoustic comfort in the atrium. In fact, the aim of the acoustic treatment was also to lower the background noise level from speech in order to make the space suitable for studying, while reducing the noise exposure of the rooms facing the atrium. For this reason, the sound pressure level was also evaluated by comparing the A-weighted background Lb,A values obtained from simulations with and without sound absorbers.
The simulation was carried out under the same conditions explained before, assuming one source per table. Figure 13 compares the spatially averaged Lb,A values as a function of frequency. As it can be seen, the application of the sound-absorbing panels led to a reduction in the sound pressure value, with a consequent decrease in the background noise level due to speech. An A-weighted Lb,A value of 59.2 was obtained, observing a reduction of 3 dB with reference to the corresponding value obtained before the acoustic treatment (considering the same measuring points).
However, as it was better explained in Section 2, as a consequence of the “Lombard effect”, a reduction in the background noise level will also affect the sound power level of the speakers, that will consequently decrease according to Equation (2). So, in order to estimate the extent of this reduction and, consequently, the overall effect of the panel installation, the following considerations were implemented.
As explained before, the sound power level of the sources was indirectly determined by measuring the background noise level in the atrium under occupied conditions (obviously considering a time interval in which no other “external” sound sources could bias the results). According to such measurements Lb,A was 62.3 dB and the calibration of the geometrical acoustic model consequently resulted in a Lp,A,1m equal to 62.3 dB as well, which was slightly lower than the value resulting from direct application of Equation (2), equal to 63.6 dB. Such a small difference might originate from several reasons, but the simpler explanation might be that, given the semi-open character of the space and the large distance among the tables, the variation in vocal effort requested to overcome the background noise was lower. In fact, the distance among the tables represents an important factor to attenuate the Lombard Effect, especially in eating establishments. Poncetti et Soares [43] considered the weak spatial sound decay due to the small space between two tables one of the main factors that made the conversation striking and uncomfortable. By inverting Equation (2), it is possible to find that an Lp,A,1m equal to 62.3 dB yields from a Lombard slope of 0.42, meaning that the increase in vocal effort is slightly less than the conventional 0.5 dB that is used for most applications (including restaurants).
Thus, assuming this newly determined value of the Lombard slope, Equation (2) was used to calculate the expected variation in background speech noise resulting from increased absorption. Given the linear behaviour of the model, a simple iterative search returned a Lp,A,1m value of 60.3 dB, resulting in a further reduction of 2 dB. Assuming the reduction to be evenly distributed among frequencies, Figure 14 shows the resulting spectrum of Lp,A,1m. As it can be observed, the new spectrum is very close to the normal voice level, with the A-weighted value nearly identical to the level that ISO 9921 [27] refers to as normal vocal effort (i.e., Lp,A,1m = 60 dB).
Finally, the overall variation in level resulting from the addition of the sound-absorbing panels was 5 dB, with an Lb,A equal to 57.2 dB, which, according to Bottalico [44] is the turning point where young adults start raising their voice and only slightly above the threshold where noise starts becoming seriously disturbing for a conversation. Such noise levels are also in the range of typical values observed in classrooms for student activity [45], thus allowing effortless communication.
Table 6 shows the effects of the acoustic treatment on the perceived clarity of sound and on the speech intelligibility in the atrium comparing the values of Clarity (C50) and of Speech Transmission Index (STI) before and after the addition of panels. The values obtained from the simulations were calculated considering the source-receiver positions as indicated in Figure 9 and the C50 values were averaged over mid frequencies (500 to 1000 Hz), according to ISO 3382-1 [42]. As it can be observed, C50 values significantly increased after the treatment and the STI reached values close or higher than 0.6, resulting in a good level of speech intelligibility according to the IEC 60268-16 [46].

7. Conclusions

The present paper investigated the potential of sustainable sound-absorbing textile waste-based panels in order to improve the acoustic comfort conditions in a semi-open-air atrium of the Polytechnic University of Bari. The materials were characterized on the basis of the design solutions deemed best for ensuring an acoustic treatment capable of balancing the architectural value of the semi-open feature of the atrium and the acoustic requirements connected to the possibility of using it as space for students. A good sound absorption behaviour was observed both for both panels to be mounted on the hard surfaces of the atrium and for panels arranged as baffles.
Acoustic measurements were carried out in the empty atrium in order to characterize the impulse responses of the space. The results of the measurements were useful to calibrate the geometrical acoustic model implemented with CATT-Acoustic [19] software, paying particular attention to the measured and predicted results in terms of reverberation time T20. Furthermore, the sound pressure level measurements in the atrium under occupied conditions were considered to take into account the characteristics of the actual sound sources (the students occupying the space).
The acoustic treatment was designed in compliance with the UNI 11532-2 [9] prescriptions, applying about 700 m2 of panels. The effect of the application of the sound-absorbing panels was evaluated by means of a geometrical acoustic simulation of the space, based on the previously calibrated model, that led to the following expected results:
  • T20 was lower than 1.49 s at each octave band frequency from 125 Hz to 4 kHz, with a significant reduction compared to the values observed before treatment which reached about 2.5 s at 500 Hz and 1 kHz;
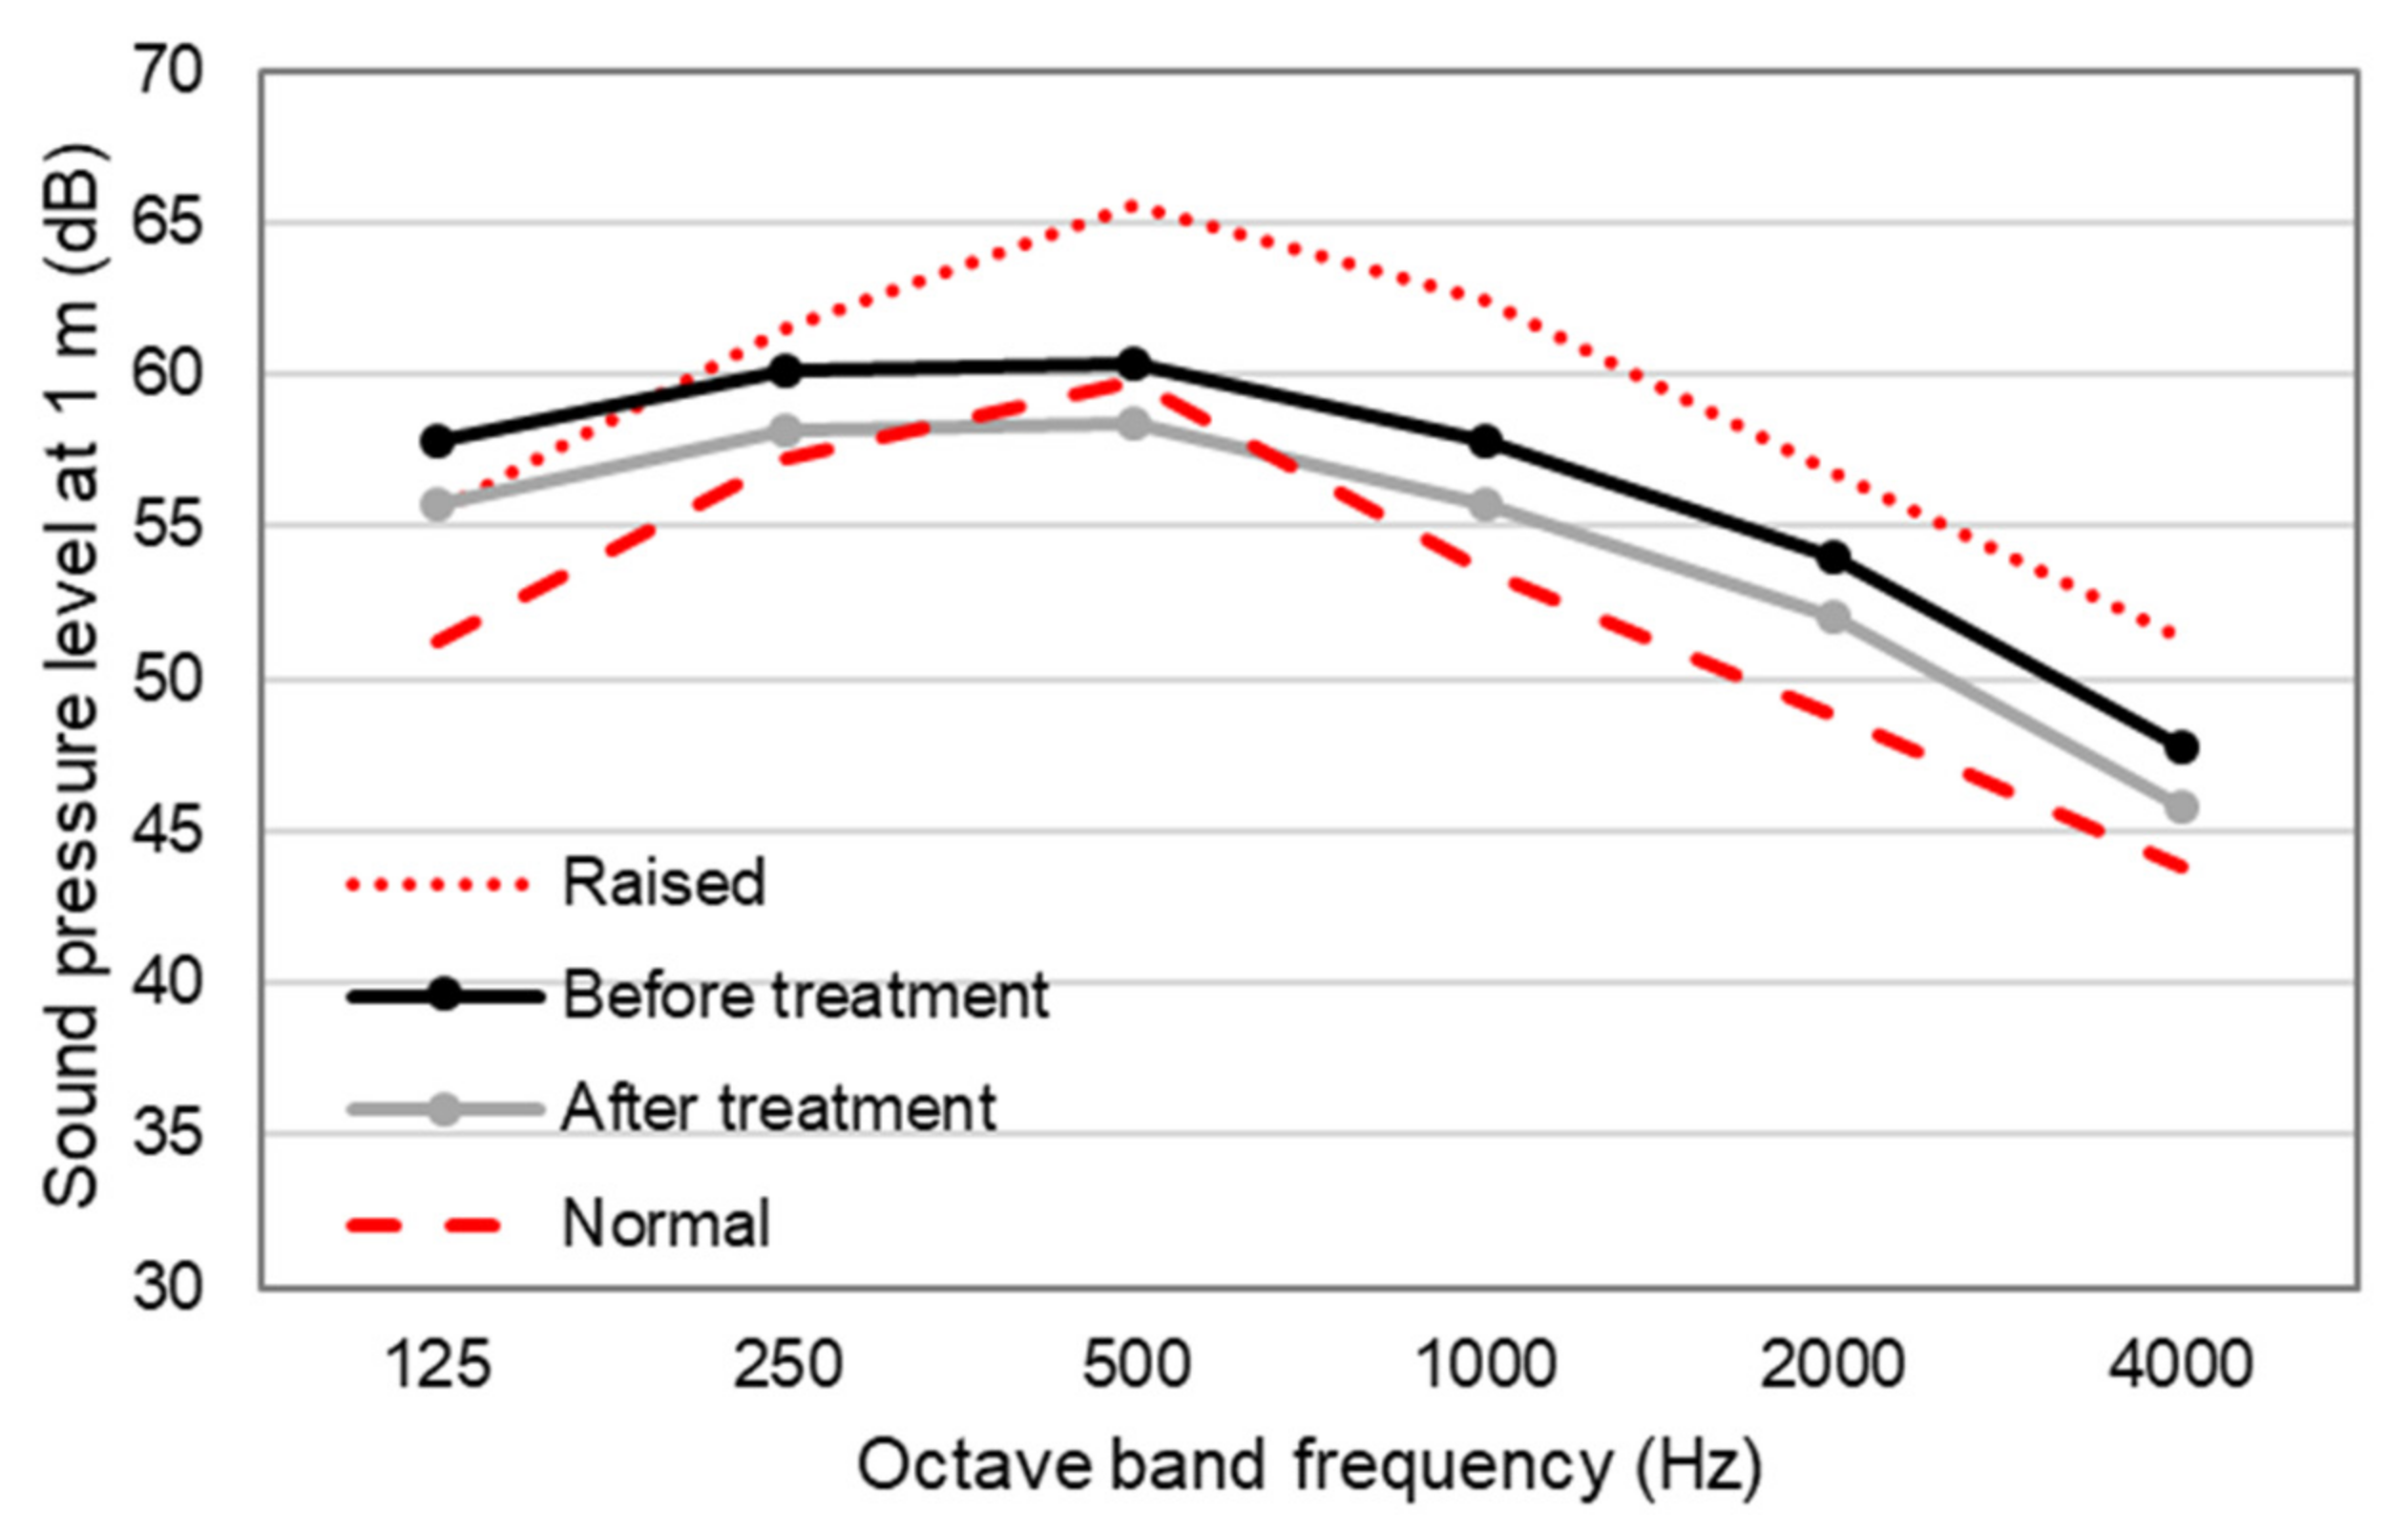
  • the sound pressure level value was reduced by 3 dB (Lb,A equal to 59.2 dB compared to 62.3 dB), with a consequent decrease in the background noise level due to speech;
  • as a consequence of the “Lombard effect”, a reduction in the background noise level also reduced the sound power level of the speakers by 2 dB (Lp,A,1m equal to 62.3 dB compared to 60 dB). A spectrum very close to the normal voice level was obtained, assuming the reduction to be evenly distributed among frequencies;
  • taking into account the “Lombard effect”, the overall expected reduction in the sound pressure level was 5 dB, with an Lb,A equal to 57.2 dB.
  • the perceived clarity of sound and the speech intelligibility in the atrium were found to be significantly improved as proven by the increased values of Clarity and Speech Transmission Index.

Author Contributions

Conceptualization, C.R.; Methodology, F.M. and C.R.; Investigation, C.R. and S.L.; Formal analysis, C.R. and S.L.; Data curation, C.R.; Writing—original draft preparation, C.R. Writing—review and editing, C.R., S.L. and F.M.; Visualization, C.R.; Software and simulations, F.M.; Supervision, F.M. All authors have read and agreed to the published version of the manuscript.

Funding

This research was funded within the framework of the Italian PRIN (“Progetto di Ricerca di Rilevante Interesse Nazionale) Project “SUSTAIN/ABLE e SimultaneoUs STructural And energetIc reNovAtion of BuiLdings through innovativE solutions”, ERC Sector PE8, ID20174RTL7W.

Institutional Review Board Statement

Not applicable.

Informed Consent Statement

Not applicable.

Data Availability Statement

Data available on request.

Conflicts of Interest

The authors declare no conflict of interest.

References

  1. Aly, N.M.; Seddeq, H.S.; Elnagar, K.; Hamouda, T. Acoustic and thermal performance of sustainable fiber reinforced thermoplastic composite panels for insulation in buildings. J. Build. Eng. 2021, 40, 102747. [Google Scholar] [CrossRef]
  2. Tóthová, D.; Heglasová, M. Measuring the environmental sustainability of 2030 Agenda implementation in EU countries: How do different assessment methods affect results? J. Environ. Manag. 2022, 322, 116152. [Google Scholar] [CrossRef]
  3. Nering, K.; Kowalska-Koczwara, A.; Shymanska, A.; Pawluś, M. The possibility of providing acoustic comfort in hotel rooms as an element of sustainable development. Sustainability 2022, 14, 13692. [Google Scholar] [CrossRef]
  4. Puglisi, G.E.; Warzybok, A.; Astolfi, A.; Kollmeier, B. Effect of reverberation and noise type on speech intelligibility in real complex acoustic scenarios. Build. Environ. 2021, 204, 108137. [Google Scholar] [CrossRef]
  5. Kang, S.; Mak, C.M.; Ou, D.; Zhang, Y.; Mak, C.M.; Ou, D.; Zhang, Y. The effect of room acoustic quality levels on work performance and perceptions in open-plan offices: A laboratory study. Appl. Acoust. 2022, 201, 109096. [Google Scholar] [CrossRef]
  6. Park, S.H.; Lee, P.-J.; Lee, B.K.; Roskams, M.; Haynes, B.P. Associations between job satisfaction, job characteristics, and acoustic environment in open-plan offices. Appl. Acoust. 2022, 201, 109096. [Google Scholar] [CrossRef]
  7. Ricciardi, P.; Buratti, C. Environmental quality of university classrooms: Subjective and objective evaluation of the thermal, acoustic, and lighting comfort conditions. Build. Environ. 2018, 127, 27–36. [Google Scholar] [CrossRef]
  8. Simone, S.; Astolfi, A.; Calosso, G.; Casini, D.; Cellai, G.; Scamoni, F.; Scrosati, C.; Shtrepi, L. Effect of outdoor noise and façade sound insulation on indoor acoustic environment of Italian schools. Appl. Acoust. 2017, 126, 120–130. [Google Scholar]
  9. UNI 11532-2; Internal Acoustical Characteristics of Confined Spaces—Design Methods and Evaluation Techniques—Part 2: Educational Sector. UNI: Milan, Italy, 2020.
  10. Chen, X.; Kang, J. Acoustic comfort in large dining spaces. Appl. Acoust. 2017, 115, 166–172. [Google Scholar] [CrossRef]
  11. Rychtáriková, M.; Chmelík, V.; Urbán, D.; Vargová, A. Acoustic conditions in the atrium of Slovak philharmonic. Procedia Eng. 2016, 155, 464–471. [Google Scholar] [CrossRef] [Green Version]
  12. Mahdavi, A.; Lechleitner, J.; Pak, J. Measurements and predictions of room acoustics in atria. J. Build. Perform. Simul. 2008, 1, 67–74. [Google Scholar] [CrossRef]
  13. Mei, H.; Kang, J. An experimental study of the sound field in a large atrium. Build. Environ. 2012, 58, 91–102. [Google Scholar] [CrossRef]
  14. Fratoni, G. The sound of a monumental architecture. Can. Acoust.-Acoust. Can. 2020, 48, 5–13. [Google Scholar]
  15. Rindel, J.H. Verbal communication and noise in eating establishments. Appl. Acoust. 2010, 71, 1156–1161. [Google Scholar] [CrossRef]
  16. Urbán, D.; Zrneková, J.; Zat’ko, P.; Maywald, C.; Rychtáriková, M. Acoustic comfort in atria covered by novel structural skins. Procedia Eng. 2016, 155, 361–368. [Google Scholar] [CrossRef] [Green Version]
  17. Eldakdoky, S. Optimizing acoustic conditions for two lecture rooms in Faculty of Agriculture, Cairo University. Ain Shams Eng. J. 2017, 8, 481–490. [Google Scholar] [CrossRef] [Green Version]
  18. Rubino, C.; Liuzzi, S.; Stefanizzi, P.; Martellotta, F. Characterization of sustainable building materials obtained from textile waste: From laboratory prototypes to real-world manufacturing processes. J. Clean. Prod. 2023, 390, 136098. [Google Scholar] [CrossRef]
  19. Martellotta, F.; Rubino, C.; Liuzzi, S. Sound absorption of hung elements: Comparing measurements in a reverberant chamber. In Proceedings of the 24th International Congress on Acoustics, Gyeongju, Republic of Korea, 24–28 October 2022. [Google Scholar]
  20. Bengt-Inge Dalenbäck (Ph.D.). CATT-Acoustic Software; v. 9.1g. Bengt-Inge Dalenbäck: Gothenburg, Sweden, 2022. Available online: www.catt.se (accessed on 26 January 2023).
  21. Ganesh, G.A.; Sinha, S.L.; Verma, T.N.; Dewangan, S.K. Investigation of indoor environment quality and factors affecting human comfort: A critical review. Build. Environ. 2021, 204, 108146. [Google Scholar] [CrossRef]
  22. Meng, Q.; Kang, J.; Jin, H. Field study on the influence of user’s social qualities on the evaluation of subjective loudness and acoustic comfort in underground shopping streets. Appl. Acoust. 2010, 29, 371–381. [Google Scholar]
  23. Yang, W.; Kang, J. Acoustic comfort evaluation in urban open public spaces. Appl. Acoust. 2015, 66, 211–229. [Google Scholar] [CrossRef]
  24. Vigran, T.E. Room Acoustic. In Building Acoustics, 1st ed.; Taylor & Francis: New York, NY, USA; London, UK, 2008; pp. 103–151. [Google Scholar]
  25. Hopkins, C. Sound fields. In Sound Insulation, 1st ed.; Butterworth-Heinemann: London, UK, 2007; pp. 1–110. [Google Scholar]
  26. Scoczynski Ribeiro, R.; Amlani, A.M.; de Conto, J.; Schwerz, B.G.; Deniz Amarilla, R.S.; Sant’Ana, L.H.; Avelar, M.; Catai, R.E.; Matoski, A. Acoustical treatment characterization of a classroom with wood-based composites. Appl. Acoust. 2021, 178, 107967. [Google Scholar] [CrossRef]
  27. Braat-Eggen, E.; Poll, M.K.V.D.; Hornikx, M.; Kohlrausch, A. Auditory distraction in open-plan study environments: Effects of background speech and reverberation time on a collaboration task. Appl. Acoust. 2019, 154, 148–160. [Google Scholar] [CrossRef]
  28. ISO 9921; Ergonomics—Assessment of Speech Communication. ISO: Geneva, Switzerland, 2004. Available online: http://store.uni.com/catalogo/uni-en-iso-9921-2004 (accessed on 15 October 2022).
  29. Lazarus, H. Prediction of Verbal Communication in Noise—A Review: Part 1. Appl. Acoust. 1986, 19, 439–464. [Google Scholar] [CrossRef]
  30. Rindel, J.H. Acoustical capacity as a means of noise control in eating establishments. In Proceedings of the Joint Baltic Nordic Acoustic Meeting 2012, Odense, Denmark, 18–20 June 2012. [Google Scholar]
  31. Webster, J.C.; Klumpp, R.G. Effects of ambient noise and nearby talkers on a face-to-face communication task. J. Acoust. Soc. Am. 1962, 34, 936–941. [Google Scholar] [CrossRef]
  32. Gardner, M.B. Factors Affecting Individual and Group Levels in Verbal Communication. J. Audio Eng. Soc. 1971, 19, 560–569. [Google Scholar]
  33. Rubino, C.; Bonet Aracil, M.; Liuzzi, S.; Stefanizzi, P.; Martellotta, F. Wool waste used as sustainable nonwoven for building applications. J. Clean. Prod. 2021, 278, 123905. [Google Scholar] [CrossRef]
  34. Ingard, U.K.; Dear, T.A. Measurement of acoustic flow resistance. J. Sound Vib. 1985, 103, 567–572. [Google Scholar] [CrossRef]
  35. ISO 354; Acoustics—Measurement of Sound Absorption in a Reverberation Room. ISO: Geneva, Switzerland, 2003.
  36. Alonso, A.; Martellotta, F. Room acoustic modeling of textile materials hung freely in space: From the reverberation chamber to ancient churches. J. Build. Perform. Simul. 2016, 9, 469–486. [Google Scholar] [CrossRef]
  37. Sakagami, K.; Okuzono, T.; Somatomo, Y.; Funahashi, K.; Toyoda, M. A Basic Study on a Rectangular Plane Space Sound Absorber Using Permeable Membranes. Sustainability 2019, 11, 2185. [Google Scholar] [CrossRef] [Green Version]
  38. ISO 3382-2; Acoustics—Measurement of Room Acoustic Parameters—Part 2: Reverberation Time in Ordinary Rooms. ISO: Geneva, Switzerland, 2008.
  39. ISO 9613-1; Acoustics—Attenuation of Sound during Propagation Outdoors—Part 1: Calculation of the Absorption of Sound by the Atmosphere. ISO: Geneva, Switzerland, 1993.
  40. Cox, T.J.; D’Antonio, P.K. Acoustic Absorbers and Diffusers, Theory, Design and Application; Spon Press: London, UK, 2004; pp. 141–145. [Google Scholar]
  41. Postma, B.N.J.; Katz, B.F.G. Perceptive and objective evaluation of calibrated room acoustic simulation auralizations. J. Acoust. Soc. Am. 2016, 140, 4326. [Google Scholar] [CrossRef] [PubMed]
  42. ISO 3382-1; Acoustics—Measurement of Room Acoustic Parameters—Part 1: Performance Spaces. ISO: Geneva, Switzerland, 2008.
  43. Poncetti, N.F.; Soares, P.F. An analytical model for calculating the minimum space between restaurant tables in order to attenuate the Lombard effect. Appl. Acoust. 2022, 194, 108771. [Google Scholar] [CrossRef]
  44. Bottalico, P. Lombard effect, ambient noise, and willingness to spend time and money in a restaurant. J. Acoust. Soc. Am. 2018, 144, EL209–EL214. [Google Scholar] [CrossRef] [PubMed] [Green Version]
  45. D’Orazio, D.; De Salvio, D.; Anderlucci, L.; Garai, M. Measuring the speech level and the student activity in lecture halls: Visual-vs blind-segmentation methods. Appl. Acoust. 2020, 169, 107448. [Google Scholar] [CrossRef]
  46. IEC 60268-16; Sound System Equipment—Part 16: Objective Rating of Speech Intelligibility by Speech Transmission Index. IEC: Geneva, Switzerland, 2020.
Figure 1. Arrangement of baffles according to suspended mounting.
Acoustics 05 00017 g001
Figure 2. Diffuse sound absorption coefficients measured according to the ISO mounting_A and the suspended mounting.
Acoustics 05 00017 g002
Figure 3. Atrium of the Architecture’s Building of the Polytechnic University of Bari: layout (a), the rectangular square (b), the passageway (c) and the Plexiglas ceiling (d).
Acoustics 05 00017 g003
Figure 4. Reverberation time and background noise level measurement set-up: S0 indicates the source position, the points from 1 to 5 indicate the receiver positions.
Acoustics 05 00017 g004
Figure 5. Measured values of reverberation time T20 and of the Early Decay Time EDT, spatially averaged, and plotted as a function of octave-band frequencies.
Acoustics 05 00017 g005
Figure 6. Measured values of background noise level in three receiver points at one-third octave band frequencies from 100 Hz to 5 kHz.
Acoustics 05 00017 g006
Figure 7. Geometrical acoustic model (a) and percentages of equivalent absorption area of the materials involved in the simulations (b).
Acoustics 05 00017 g007
Figure 8. Plot of normalized decay level as a function of time at 125 Hz, 500 Hz and 2000 Hz, for receiver positions 1 (ac), 2 (df) and 3 (gi) derived from measured (blue) and predicted (orange) IR.
Acoustics 05 00017 g008
Figure 9. Source positions considered during the simulation of the background noise level: S1-S3 indicate the source positions, R1-R3 indicate the receiver positions.
Acoustics 05 00017 g009
Figure 10. Sound power level used for each source, located in between the standardized “normal” and “raised” voice level.
Acoustics 05 00017 g010
Figure 11. Geometrical acoustic model after the sound absorption treatment.
Acoustics 05 00017 g011
Figure 12. Comparison between mean values of reverberation time before and after the acoustic treatment. The last are also compared with the target value chosen as a design criterion.
Acoustics 05 00017 g012
Figure 13. Averaged background sound pressure level (Lb,A) measured before and simulated after the acoustic treatment, together with the corresponding A-weighted sound pressure level.
Acoustics 05 00017 g013
Figure 14. Comparison between sound power level of each source before and after the acoustic treatment, located in between the standardized “normal” and “raised” voice level.
Acoustics 05 00017 g014
Table 1. Values of size, density, porosity and air flow resistivity of the tested materials.
Specimen Area
cm2
Thickness
cm
Density
kg/m3
Porosity
-
Air Flow Resistivity
kN·s/m4
60 × 1204680.9217.4
Table 2. Spatially averaged reverberation time T20: measured values, calibrated values and their percentage difference.
125 Hz250 Hz500 Hz1 kHz2 kHz4 kHz
Measured values (s)1.872.132.422.352.111.82
Predicted values (s)1.932.082.402.342.131.83
Percentage difference (%)3.6−2.1−0.5−0.60.60.6
Table 3. Summary of absorption (α) and scattering (s) coefficients assigned to materials as a function of frequency. (*) corresponds to surfaces with auto-edge settings. Non-specified scattering coefficients correspond to default 0.1 values appropriate for large flat surfaces.
MaterialsSurface
%
Absorption and Scattering Coefficients
125 Hz250 Hz500 Hz1 kHz2 kHz4 kHz
Rough plaster18.9α0.030.030.030.060.080.09
s------
Floor13.3α0.030.030.030.040.060.09
s0.050.050.050.050.050.05
Aluminium cladding8.4α0.200.350.130.100.100.10
s0.150.200.250.300.400.40
Glass11α0.200.150.100.100.080.05
s******
Marble1.5α0.010.010.010.020.030.03
s------
Plexiglas ceiling18.4α0.250.150.080.080.040.02
s0.200.150.150.150.150.15
Unoccupied table0.85α0.200.200.100.100.050.05
s******
Occupied table0.85α0.280.320.320.520.590.68
s0.300.400.500.600.700.80
Absorbing panels9.4α0.140.370.820.950.990.99
s------
Absorbing panels as baffles17.3α0.080.290.500.820.890.86
s------
Table 4. Comparison between mid-frequency values of Clarity (C50) and Centre Time (Ts) measured and predicted in the three receivers and their relative variation expressed with reference to Just Noticeable Difference.
Clarity C50 (dB)Centre Time (ms)
123123
Measured values−0.2−1.5−2.8146.6134.7168.6
Predicted values−2.00.1−3.0160.2141.2168.4
JND variation 1−1.81.4−0.11.40.70.0
1 JND variation was calculated as the difference between predicted and measured parameter value, divided by the relevant JND as given by ISO 3382-1 [42].
Table 5. Comparison between averaged background level (Lb,A) values measured and calibrated and their difference.
125 Hz250 Hz500 Hz1 kHz2 kHz4 kHz
Measured values (dB)57.659.261.157.953.646.6
Predicted values (dB)57.659.361.157.953.546.6
Difference (dB)0.00.0−0.10.00.1−0.1
Table 6. Comparison between values of Clarity (C50) and Speech Transmission Index (STI) simulated before and after the acoustic treatment in three different source-receiver positions and their variation.
Clarity
C50 (dB)
Speech Transmission Index STI (−)
S1-R1S2-R2S3-R3S1-R1S2-R2S3-R3
Before treatment7.105.006.000.450.400.43
After treatment18.9017.2018.950.600.570.61
Variation11.8012.2012.950.150.170.18
Disclaimer/Publisher’s Note: The statements, opinions and data contained in all publications are solely those of the individual author(s) and contributor(s) and not of MDPI and/or the editor(s). MDPI and/or the editor(s) disclaim responsibility for any injury to people or property resulting from any ideas, methods, instructions or products referred to in the content.

