2. Methods of Evaluating Oscillation Velocity in Orifices
One of the first to began to consider this issue back in the 1930s was Sivian. He evaluated the acoustic impedance of orifices at high sound pressure levels. In his work [
5], he studied thin diaphragms with one orifice, particularly the diaphragm itself on the front wall of the Helmholtz resonator, and the orifice was its neck.
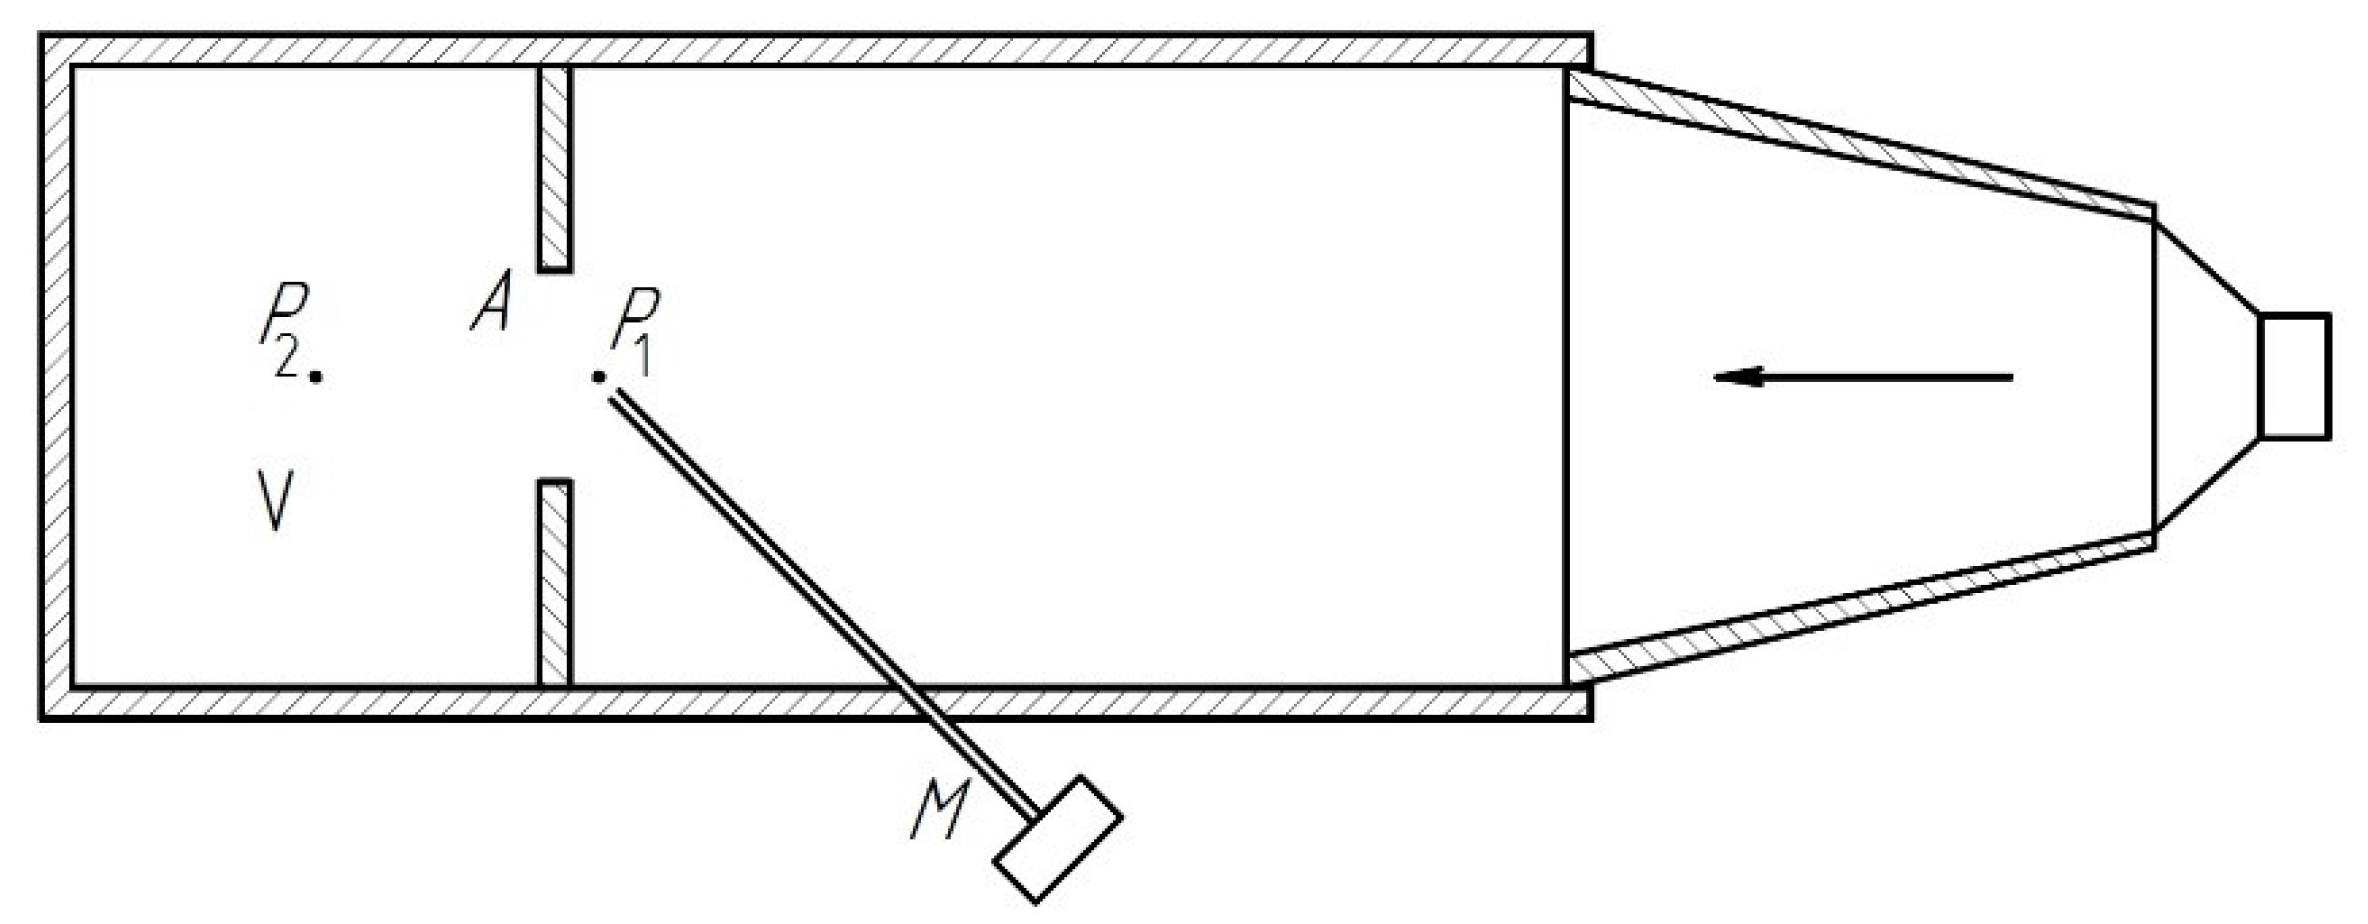
The scheme of the measuring setup used by him is shown in
Figure 1. In this setup, sound pressure (amplitude and phase) can be measured at point
P1, in the vicinity of orifice
A, and at some point
P2 in volume V, behind the orifice. The pressure in front of the orifice can be measured using a probe attached to the M microphone. In this case, the impedance of the orifice is determined by the relationship:
where
V0 is the amplitude of the oscillation velocity of particles in the neck of the resonator.
To determine the oscillation velocity in the neck of the resonator, Sivian used the simplest model of the Helmholtz resonator as an oscillatory system consisting of the mass
m of the air oscillating in the neck of the resonator and the acoustic stiffness
C of the volume of air in the cavity of the resonator. The stiffness
C depends on the bulk modulus
K of the air and the geometrical parameters of the resonator:
where
S0 is a cross-sectional area of the neck, and ρ
0 and
c0 are density of the medium (air) and speed of sound in the medium, respectively.
The use of such a model is reasonable at low frequencies, frequencies that are much lower than the natural frequency of the resonator ω
0 = (
C/
m)
0.5. In this case, the formula for the amplitude of the oscillation velocity of particles in the neck
V0 can be transformed to the form:
where
k = ω/
c0 is a wave number, and ω is an angular frequency of sound wave.
As a result of using this approach, Sivian found a sharp increase in the resistance of the resonator neck in nonlinear regime at high sound pressure levels. Sivian suggested that this phenomenon is associated with the appearance of a jet motion of the medium in the neck of the resonator in the nonlinear regime. Therefore, he assumed that Bernoulli’s law can be used for description, according to which the pressure drop across the neck of the resonator will be proportional to the square of the oscillation velocity in the neck, which means that the neck impedance is proportional to this speed.
A great contribution to the study of the acoustic characteristics of orifices was made by Ingard [
6,
7,
8]. In one of his first works [
6], he visualized the mechanism of formation of vortices at the edges of the orifice by introducing smoke particles into the measuring channel. In his next work [
7], which became a classic one, he figured out some patterns of influence of the geometrical parameters of the resonator neck on its acoustic impedance. In this case, the measurement of the oscillation velocity in the orifice was carried out on the basis of the Sivian approach. Further development of studies of the nonlinear acoustic impedance of the resonator neck was obtained in the later work of Ingard in collaboration with Ising [
8]. In this study, the oscillation velocity of particles in the resonator neck was evaluated by direct measurements using a hot-wire anemometer.
It should be noted that the measurement of oscillation velocity in the neck of the resonator using the Sivian method means that the sound pressure throughout the volume of the resonator chamber is the same, so it does not really matter at what point in this volume the sound pressure is measured. However, in reality this assumption cannot always be considered fair. Both the dimensions of the resonator chamber and the sound frequency are of great importance here.
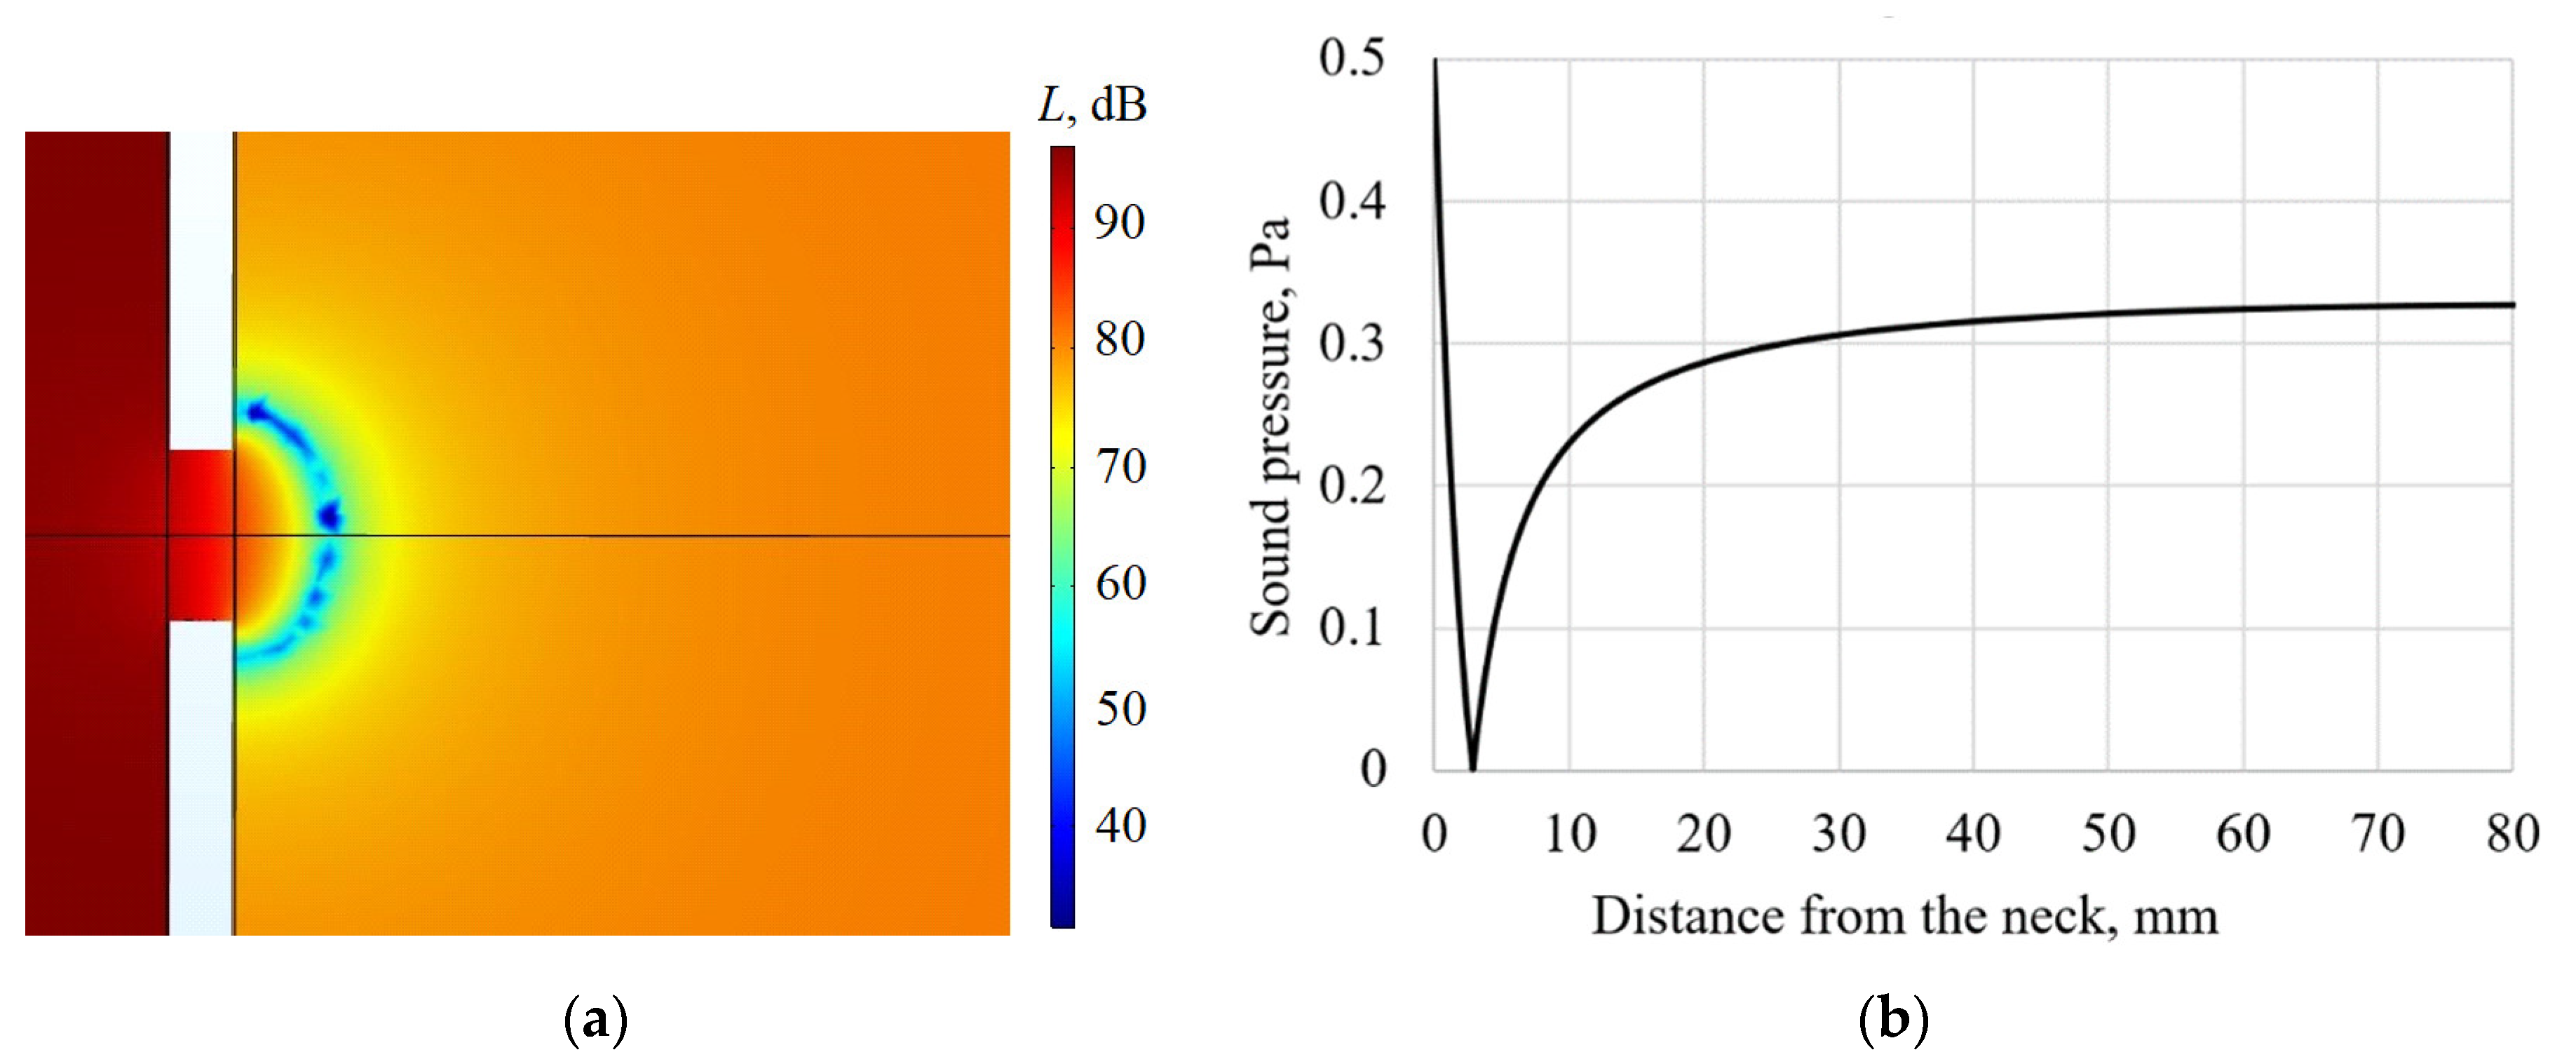
Figure 2a shows a picture of the distribution of sound pressure over the longitudinal central axis of the Helmholtz resonator with a cylindrical chamber. It shows that in the area adjacent to the neck of the resonator, there is a specific sound pressure level distribution, which is the result of the transformation of the flat front in the vicinity of the neck as waves pass it. In the area more distant from the neck, the pressure is distributed over the volume of the resonator much more evenly. These patterns are also confirmed by the graphical dependence of the sound pressure on the distance to the front wall of the resonator in the longitudinal central axis of the resonator (
Figure 2b). At small distances from the neck, the amplitude of sound pressure changes significantly, and then, as the distance increases, it gradually increases, asymptotically approaching a certain maximum value. Hence, it follows that when carrying out such measurements, it is expedient to measure the sound pressure in the resonator chamber in the vicinity of the rear wall of the resonator.
This behavior of sound pressure in the resonator chamber can be described theoretically using the transfer-matrix method. In this case, we obtain that for a Helmholtz resonator with a short neck, when neck length
l0 is much less than the length of the resonator chamber
l and the relation
kl0 << 1 is satisfied, the relationship between the oscillation velocity
V0 and the sound pressure on its wall is determined by the formula:
where
S is a cross-sectional area of the cylindrical chamber of the resonator.
For a short resonator chamber, we can establish that sin(kl) ≈ kl. At the same time, taking into account that Sl = V, we obtain the Formula (3) used by Sivian.
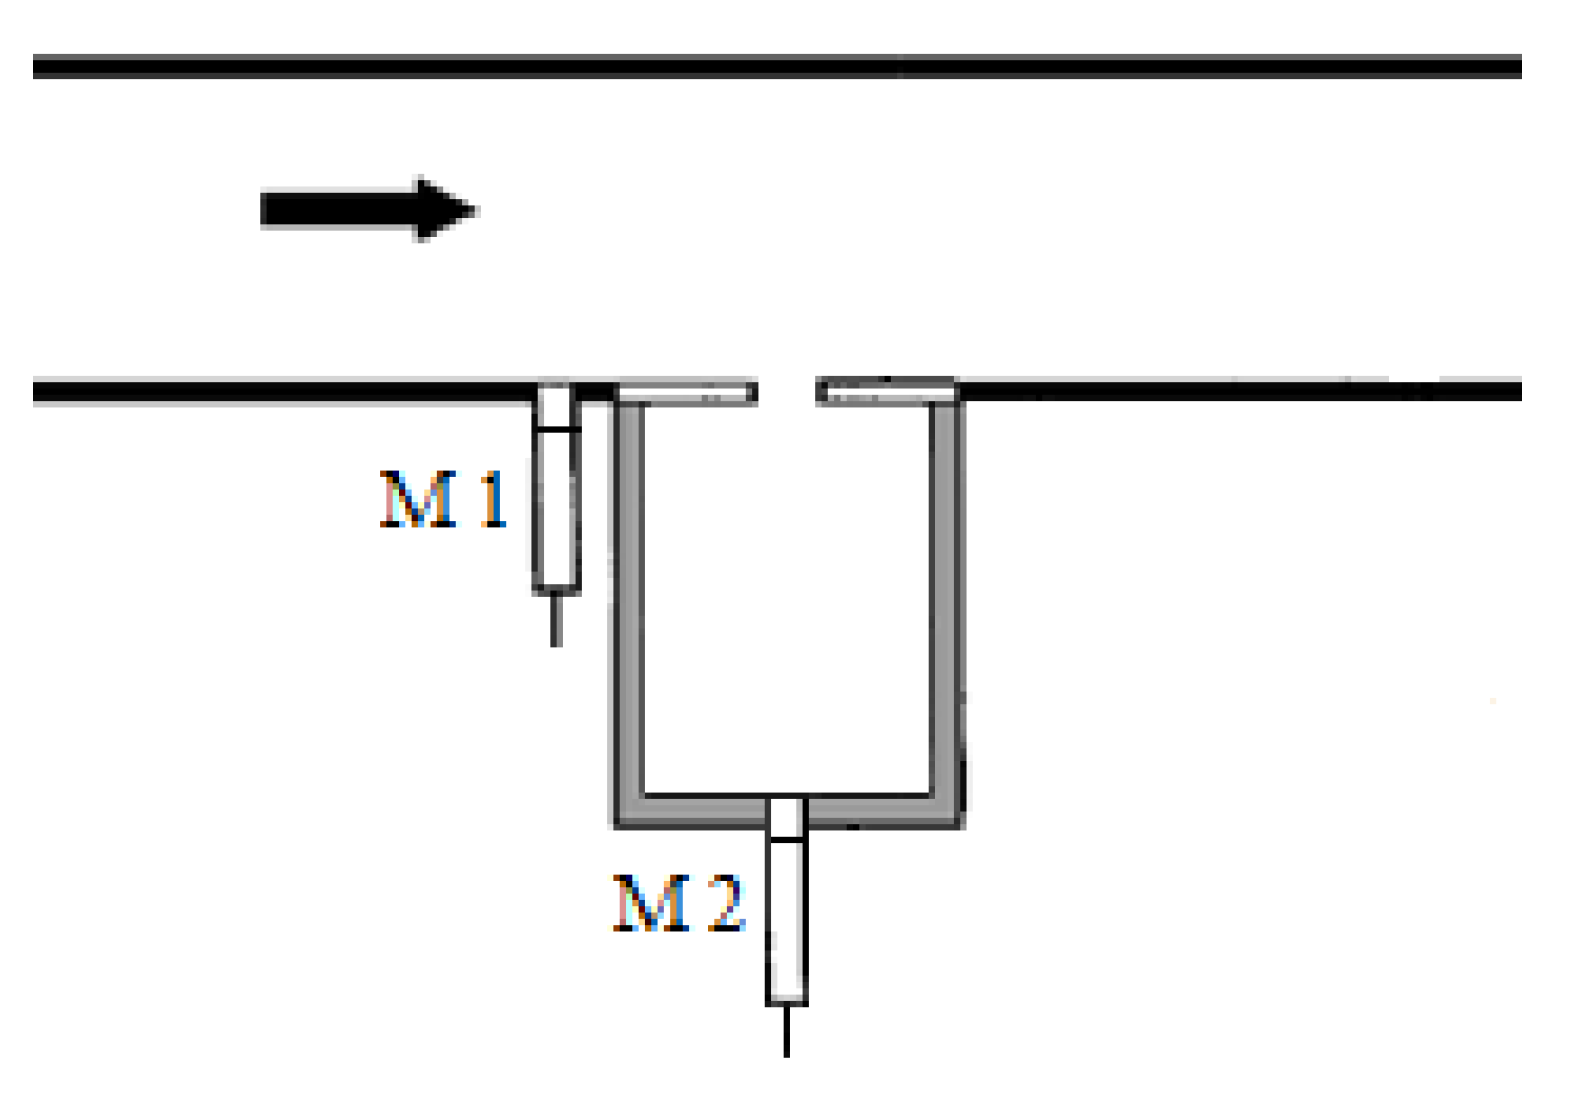
Such an approach, which is in fact a modification of the Sivian method and called the in situ method, was presented in the work of Dean [
9]. It was applied for the case when the resonator is placed on the side wall of the channel. During the measurements, two microphones were used, the first of which was installed flush with the inner surface of the channel relatively close to the neck of the resonator, and the second was installed in the resonator cavity on its back wall so that the pressure in this cavity could be measured (
Figure 3). In this case, the oscillation velocity in the neck of the resonator was determined through pressure
P2 using Formula (4). We should note that the formula Sivian used did not include the ratio
S/
S0, so it can be valid only if this ratio is close to 1.
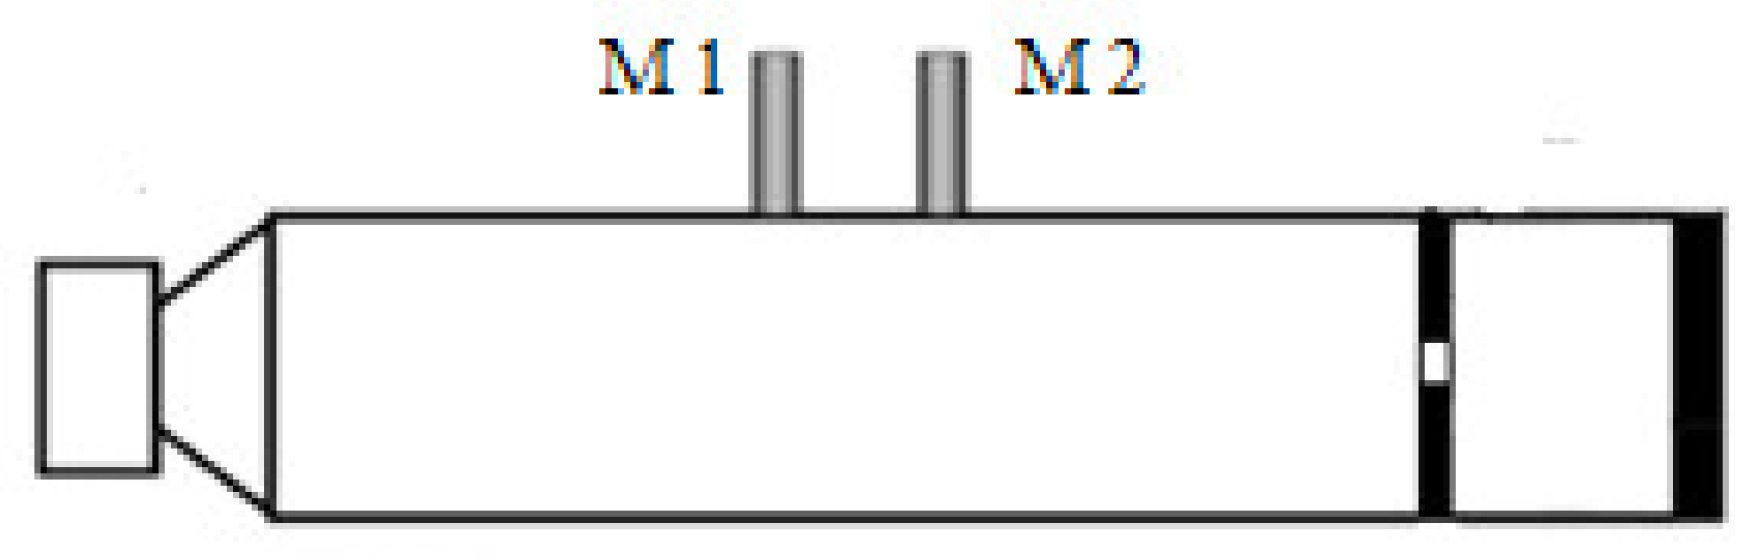
Another method for measuring orifice characteristics is the transfer function method (two-microphone method). This method was proposed by Chang and Blazer in 1980 [
10], and has since found wide application in acoustic measurements in impedance tubes. The investigated sample resonator or, for example, a perforated plate, is fixed at the end of the impedance tube (
Figure 4).
The sound field in an impedance tube should be considered a superposition of the incident and reflected waves. From the results of sound pressure measurements with two microphones, the amplitudes of the direct and reflected waves in the impedance tube are distinguished, and then the sound pressure and oscillation velocity of the sample and the acoustic characteristics of the sample are determined. Within the theory of linear acoustics, for the system under consideration, when a sound wave passes through an orifice, the law of conservation of volumetric velocity is satisfied. Therefore, the oscillation velocity in the orifice
V0 can be determined in terms of the velocity in the impedance tube
V from the relationship:
In order to reduce the influence of calibration errors on the measurement result, multi-microphone measurement systems in an impedance tube can be used [
11]. This allows one to significantly increase the array of measured data. Due to this, the number of averaging of the processed data increases, which results in a decrease in the error of the results obtained.
Indirect methods for evaluation the oscillation velocity of particles based on microphone measurements have been considered. Direct methods for measuring the velocity in the neck of the resonator are also used. Anemometers are commonly used for this purpose. They were used in studies of resonators, as mentioned above, by Ingard and Ising [
8] and, later, by Grushin and Lebedeva [
12]. Note that anemometers make it possible to measure oscillation velocity in a large dynamic range, but the procedure for preparing and carrying out measurements is rather complicated. At the same time, at high levels of sound pressure, the amplitude of the oscillation velocity in the neck of the resonator takes high values, more than 1 m/s. This makes it possible to carry out velocity measurements with a Pitot tube, which is much easier than with anemometer measurements. This possibility was realized by Komkin et al. when studying the nonlinear characteristics of orifices in a partition [
13,
14]. It was found that in nonlinear regime, the oscillation velocity of particles on the axis of the orifice did not depend on the diameter of the orifice, but was determined only by the level of sound pressure at the partition. In this case, the resistance of the orifice also ceases to depend on its diameter. On the one hand, this result is consistent with Bernoulli’s hydrodynamic law, according to which the rate of liquid outflow from the orifice at the bottom of the tank will be determined only by the pressure of the liquid on this bottom and does not depend on the diameter of the orifice. On the other hand, such a result conflicts with the law of conservation of volumetric velocity, which is valid in linear acoustics when a sound wave passes through an orifice, from which relation (5) follows.
To remove the existing contradiction and understand the results of measurements, additional research is needed. In this case, to solve this problem, it seems appropriate to involve visualization methods of sound oscillations. In the middle of the last century, this method was used by Ingard to visualize, using smoke particles, the jet-vortex motion of medium particles in the vicinity of the orifice in nonlinear regime [
1]. Nowadays, with the development of experimental techniques, lasers are used for visualization purposes [
15].
3. Measurements of Oscillation Velocity in the Neck of the Resonator
Today, there are several methods for determining the oscillation velocity of particles in an orifice, but they do not always agree with each other. Because of that, the task of evaluation of the oscillation velocity in the neck of the resonator by microphone methods and comparison the results obtained with the known data of direct measurements of this velocity with a Pitot tube has taken its place.
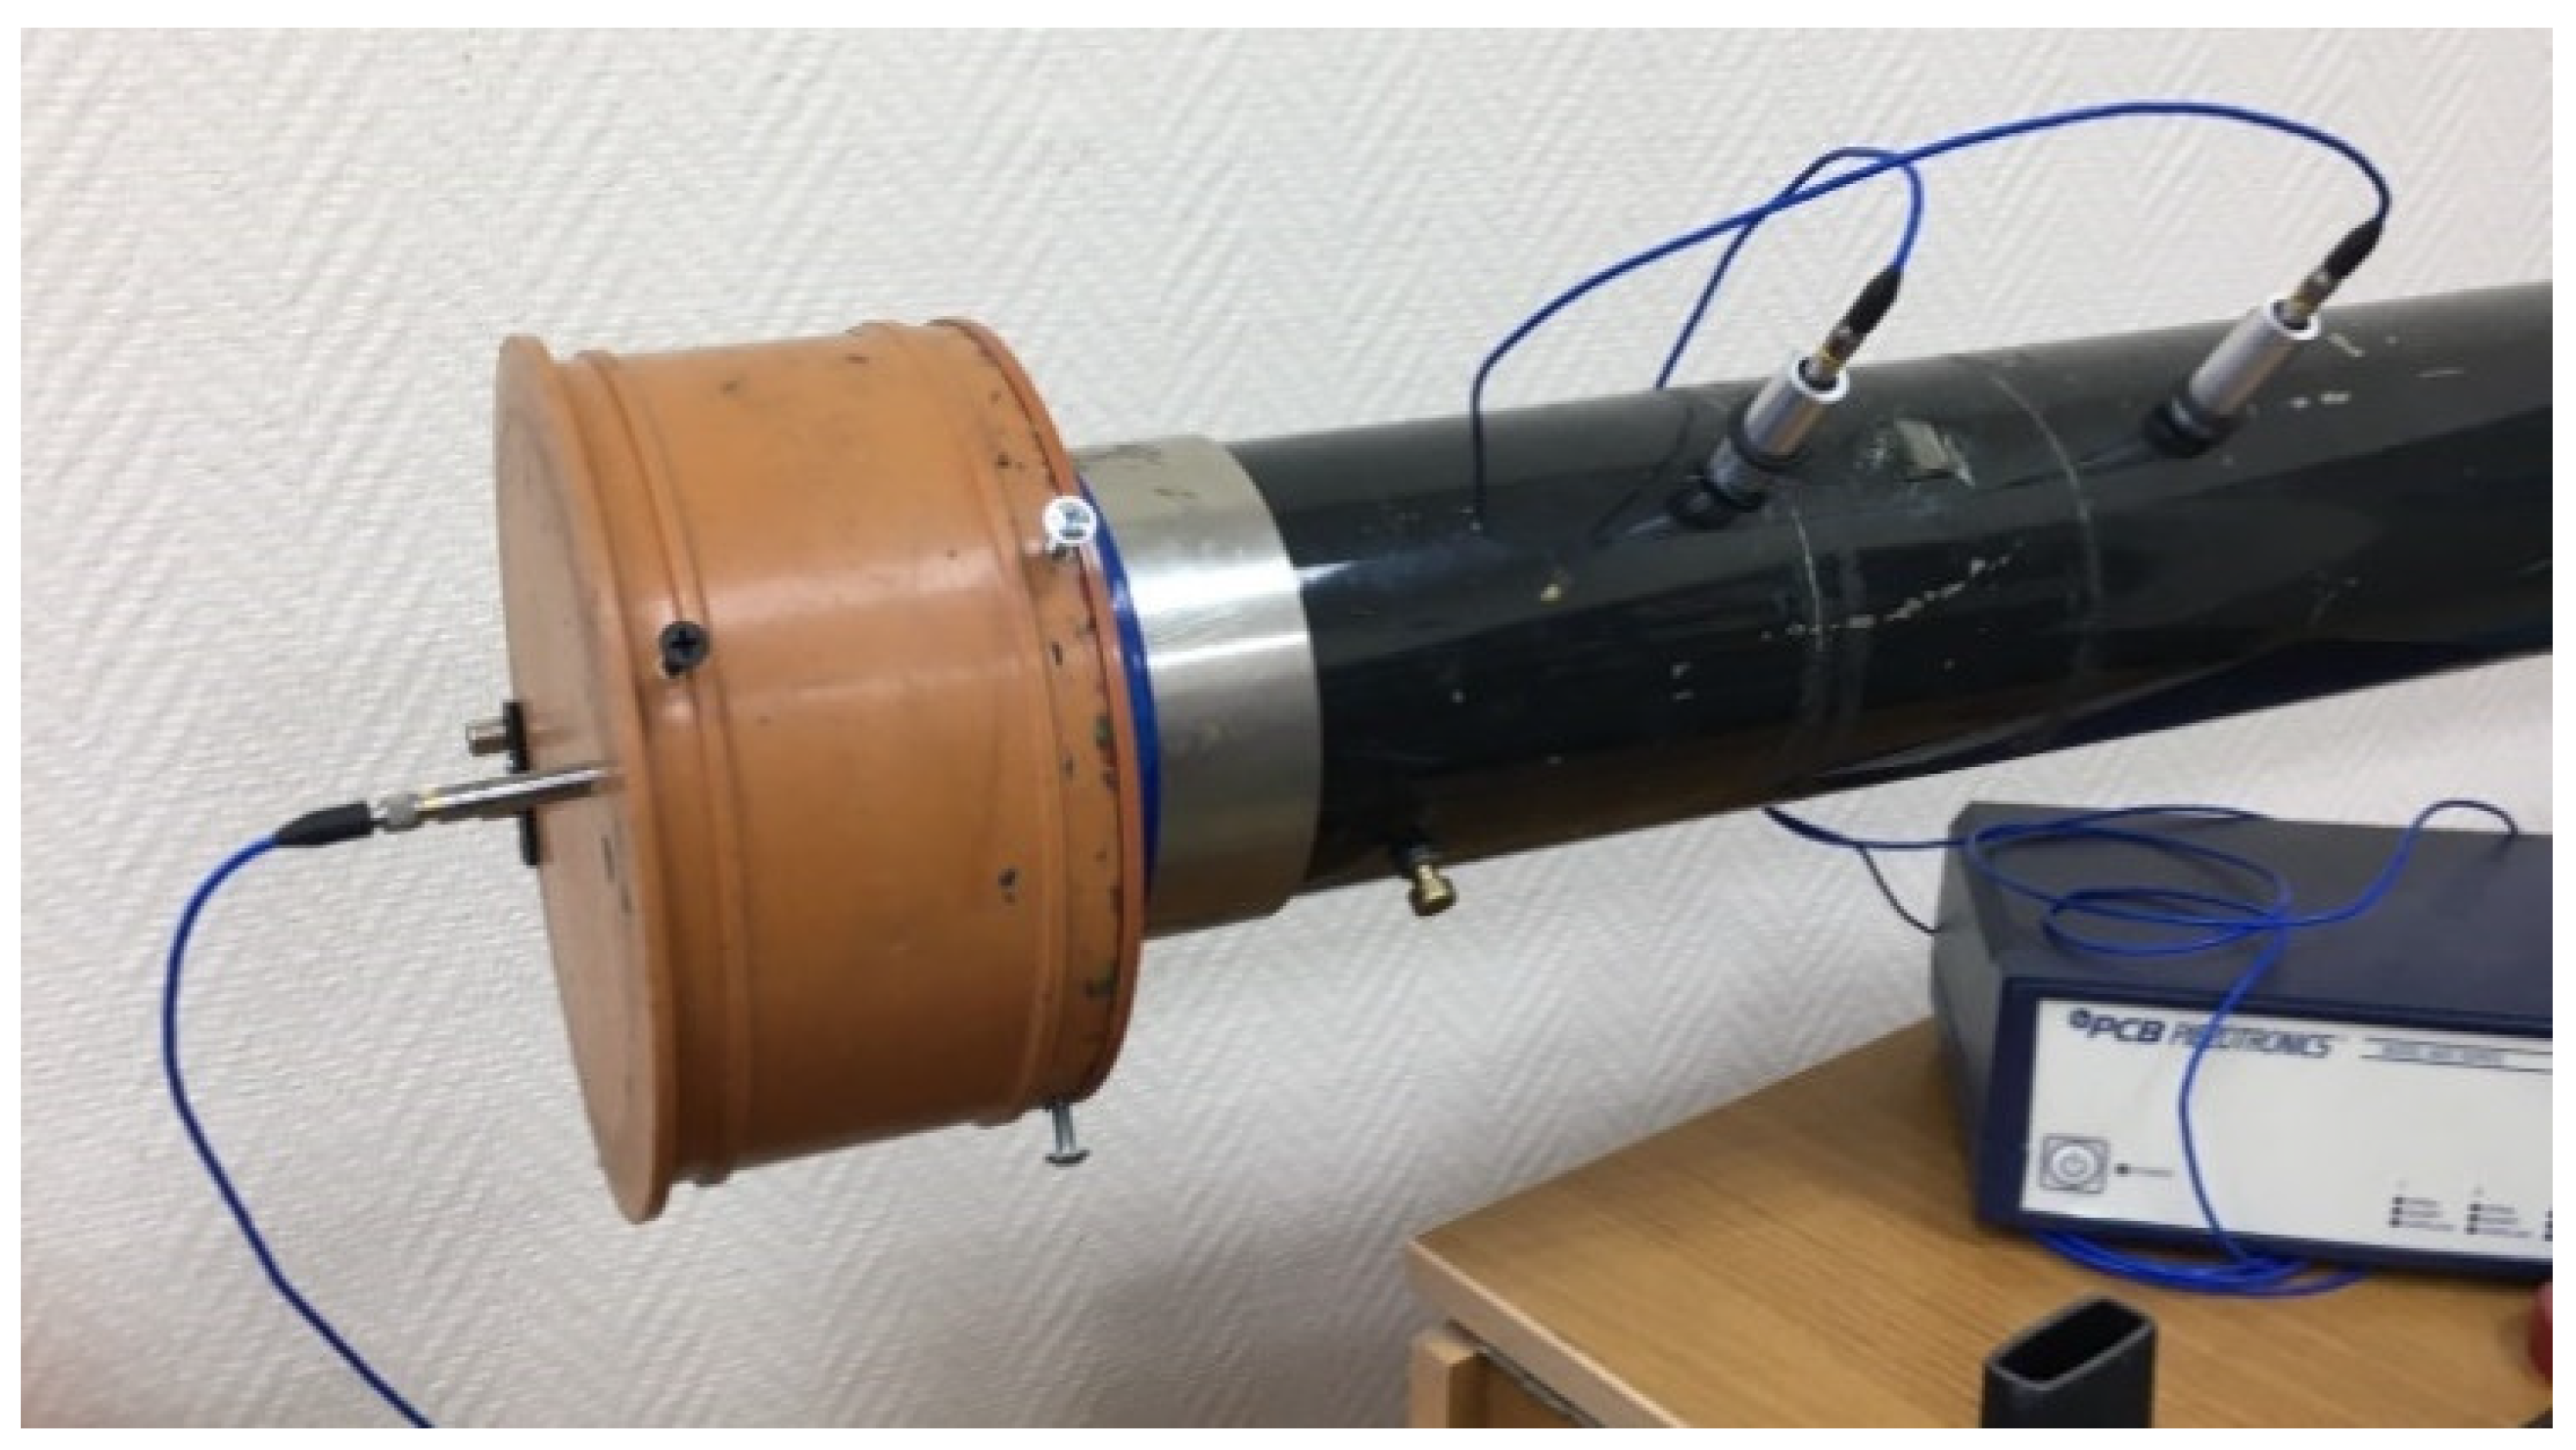
For this purpose, on the basis of an impedance tube, a measuring setup was developed, the general view of which is shown in
Figure 5. The diameter of the impedance tube was 99 mm, and the length was 1000 mm. A Helmholtz resonator with a cylindrical chamber of 160 mm diameter and 85 mm length was studied. The neck of the resonator had a diameter of 10 mm and a length of 2 mm, so that open area ratio was approximately 1%.
When implementing the method for evaluating the oscillation velocity through sound pressure in the resonator chamber, the microphone was placed in the chamber of the resonator with its rear wall at a distance of 50 mm from the longitudinal axis of the resonator. When measuring with the two-microphone method, the microphones were installed in the same way as in [
10] at distances of 153 mm and 281 mm from the inlet section of the resonator neck. A 450 W speaker was used as the sound source in this setup. To excite the speaker, a narrow-band chirp signal with a bandwidth of 10 Hz and a central frequency
f0 = 150 Hz was used. The amplitude of the chirp signal was taken so that the linear regime was maintained in the orifice. Sound pressure was measured with ¼-inch PSB 482C05 condenser microphones. Microphone signals were subjected to spectral analysis using a B&K PHOTON+ analyzer. Further, the obtained spectral data were transferred to a computer, where they were further processed. Before starting the direct measurement, the microphones were calibrated.
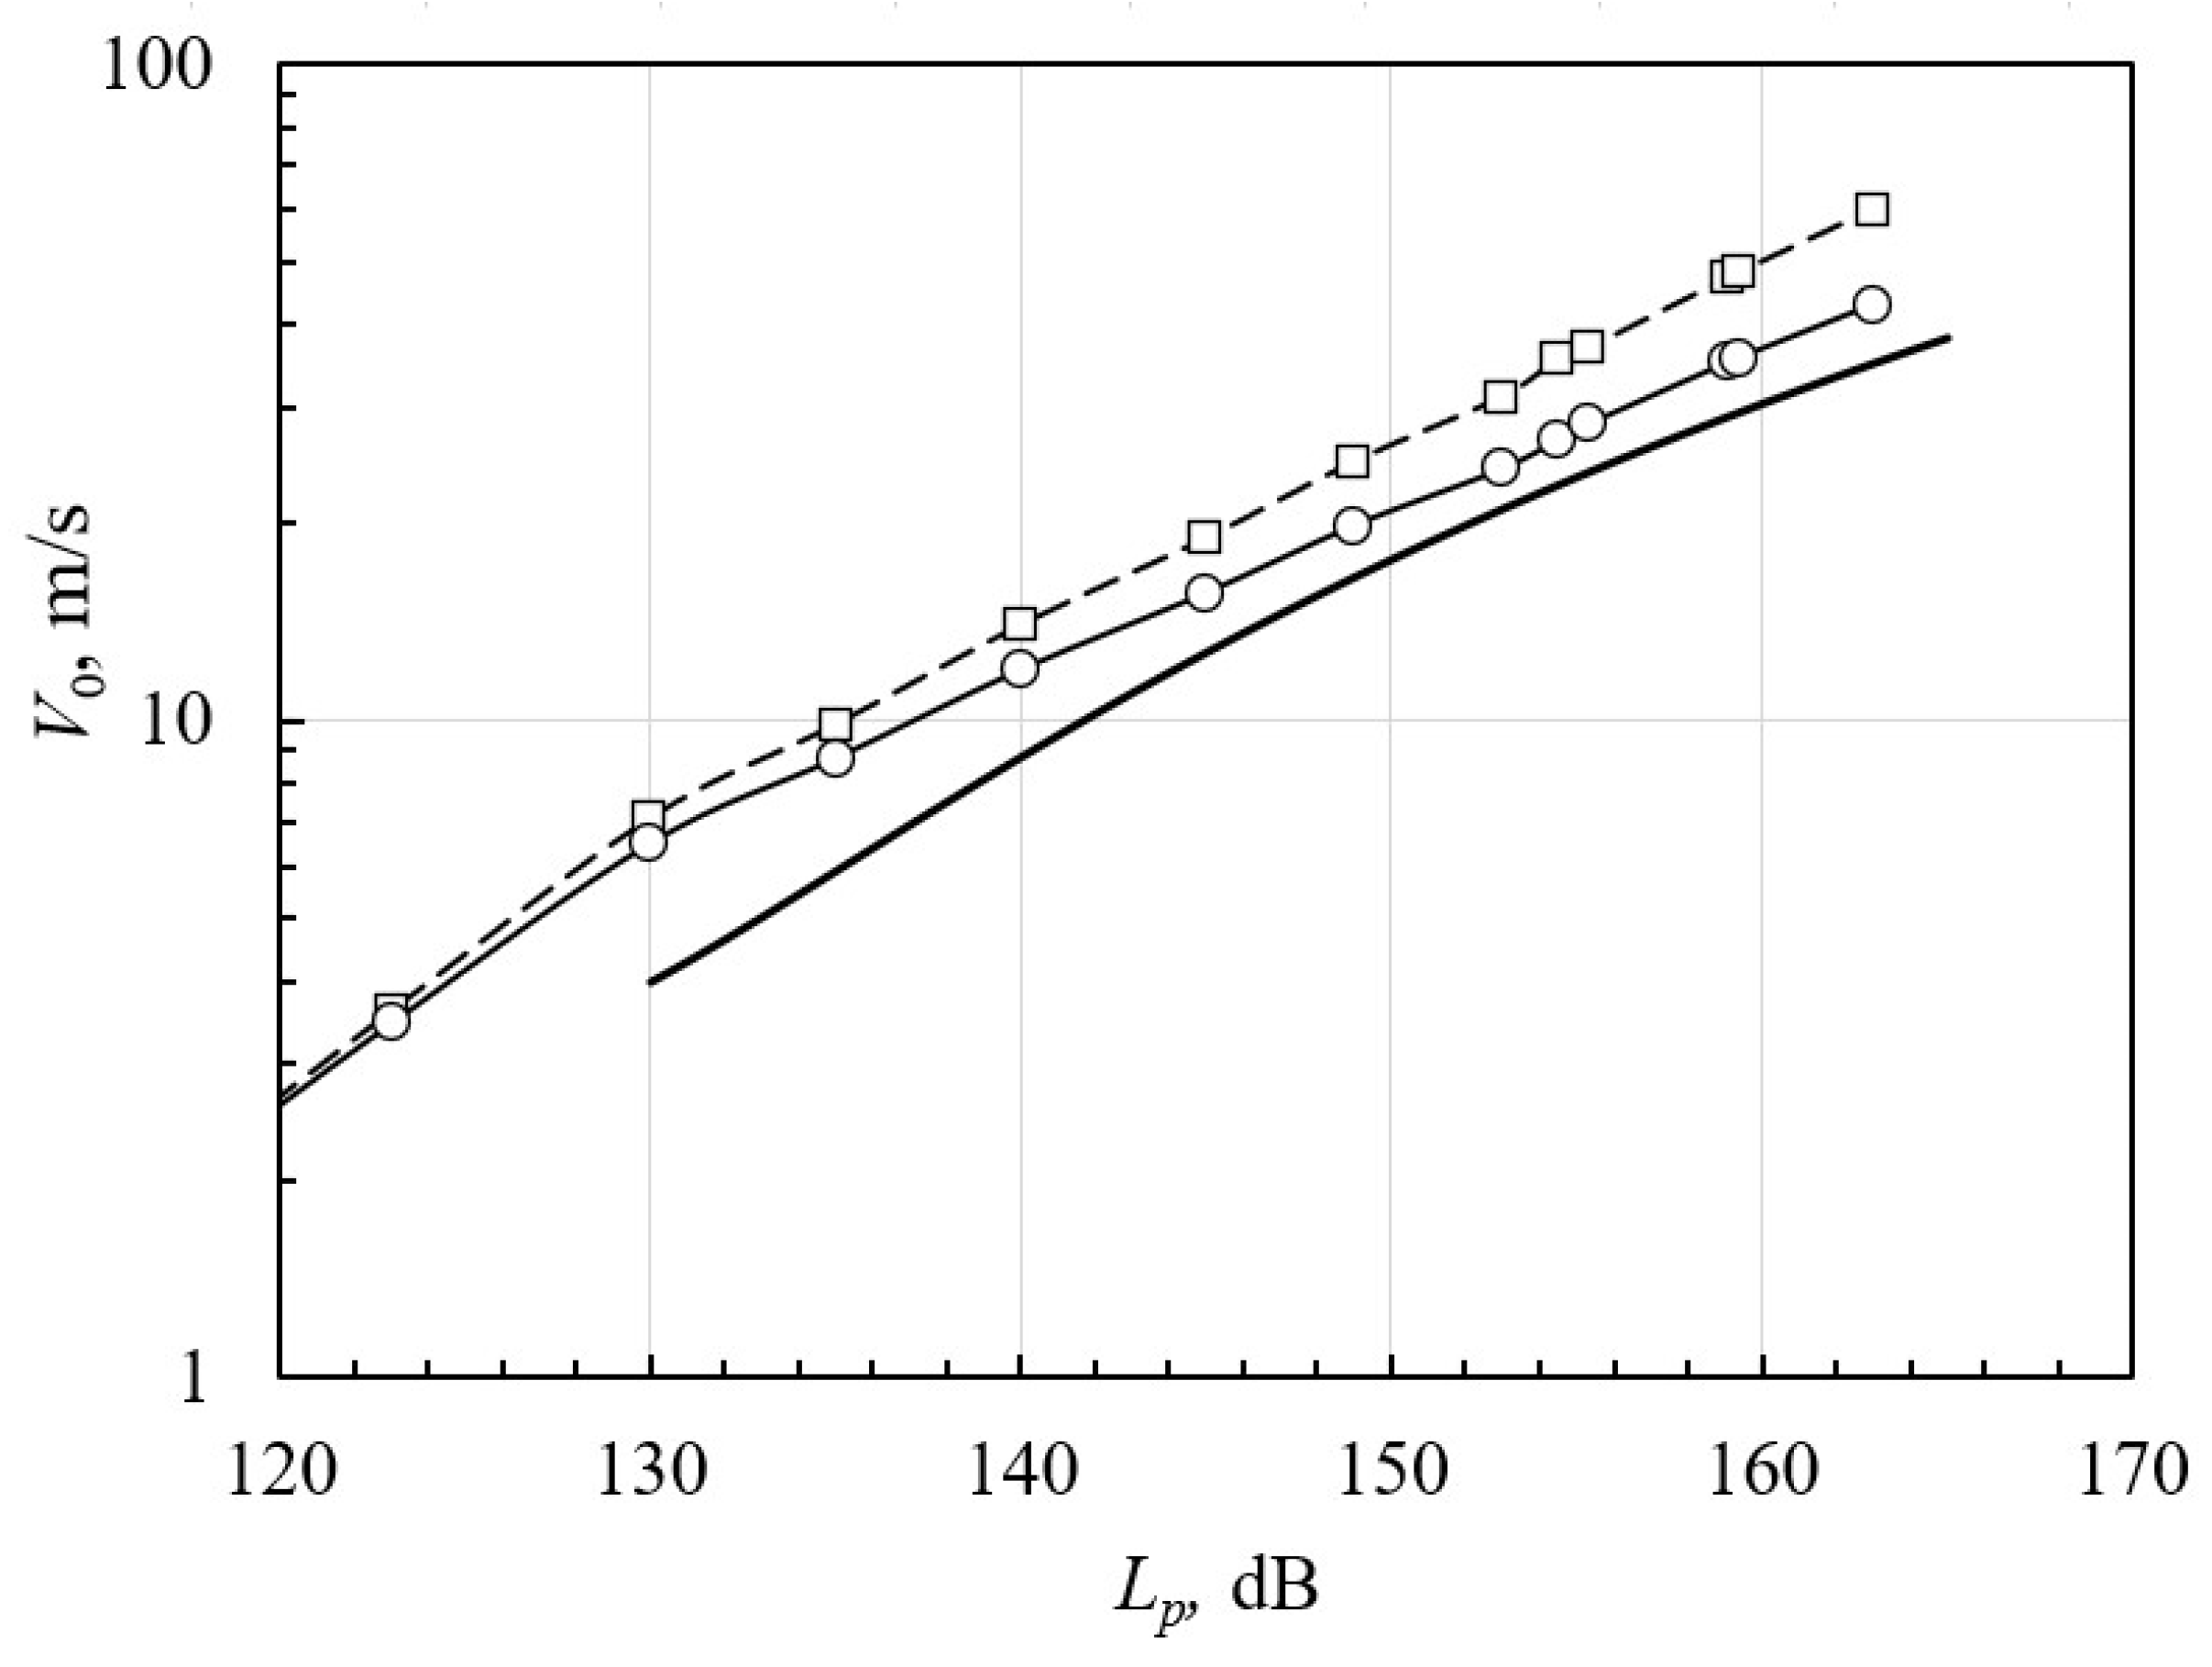
Studies by microphone methods were carried out in a wide range of sound pressure levels (SPL) in an impedance tube, including linear, transient, and non-linear regimes of operation. In this case, the linear regime of operation took place at SPL up to 100 dB and the nonlinear regime at SPL above 130 dB, so that there was a transient regime between. According to the measurement results, the dependence of the oscillation velocity in the resonator neck on SPL was obtained, which is presented for the transient and nonlinear regimes in a logarithmic scale along the axis in
Figure 6. The same figure shows the results of measurements of this velocity in the nonlinear regime, obtained in [
9] using a Pitot tube.
The results obtained show that in each of the two presented regimes, transient and nonlinear, the logarithmic dependence of the oscillation velocity on SPL can be considered linear. In
Figure 6, for each line, there is an angle between the line and horizontal axis that determines transfer between regimes. The biggest angle corresponds to the linear regime, the smallest angle corresponds to the nonlinear one. In addition, the measurements showed that in the linear regime, both microphone methods give almost the same results, which also coincide with the results of numerical calculations using finite element modeling in COMSOL Multiphysics version 5.2a. From
Figure 6, it follows that those two methods of microphone measurements give good agreement for the transient regime as well (less than 130 dB).
At the same time, in nonlinear regime, measurements by microphone methods begin to differ, and the two-microphone method gives higher amplitude values of oscillation velocity than three-microphone method. The corresponding lines on the graphs have different angles, so that with increasing SPL, the difference in the velocities obtained by these methods becomes larger. Both of these methods give velocity values greater than the results of direct measurements using a Pitot tube; however, the velocity values obtained from the results of measuring the sound pressure in the resonator chamber are in better agreement with the results of direct measurements.
The fact that the use of microphone methods leads to overestimations of the oscillation velocity compared to direct measurements is apparently due to the fact that the algorithms for evaluating the oscillation velocity in microphone methods are based on the statements of linear acoustics, and therefore, upon transition to nonlinear acoustics, their use is reasonless. Therefore, for the resonators operating in the nonlinear regime, direct measurement methods should be used.
4. Visualization of the Oscillational Processes
It should also be noted that the measurements of the oscillation velocity of the Pitot tube presented in this work were carried out only on the central axis of the orifice and do not reflect the complete picture of the oscillatory processes in the resonator neck, which would make it possible to analyze the features of the law of conservation of the volumetric oscillation velocity of particles in the resonator neck in nonlinear regime. From this point of view, it is advisable to use methods for visualizing oscillatory processes. Thus, a laser visualization method was used, the features of which are described in a number of applications [
16,
17,
18].
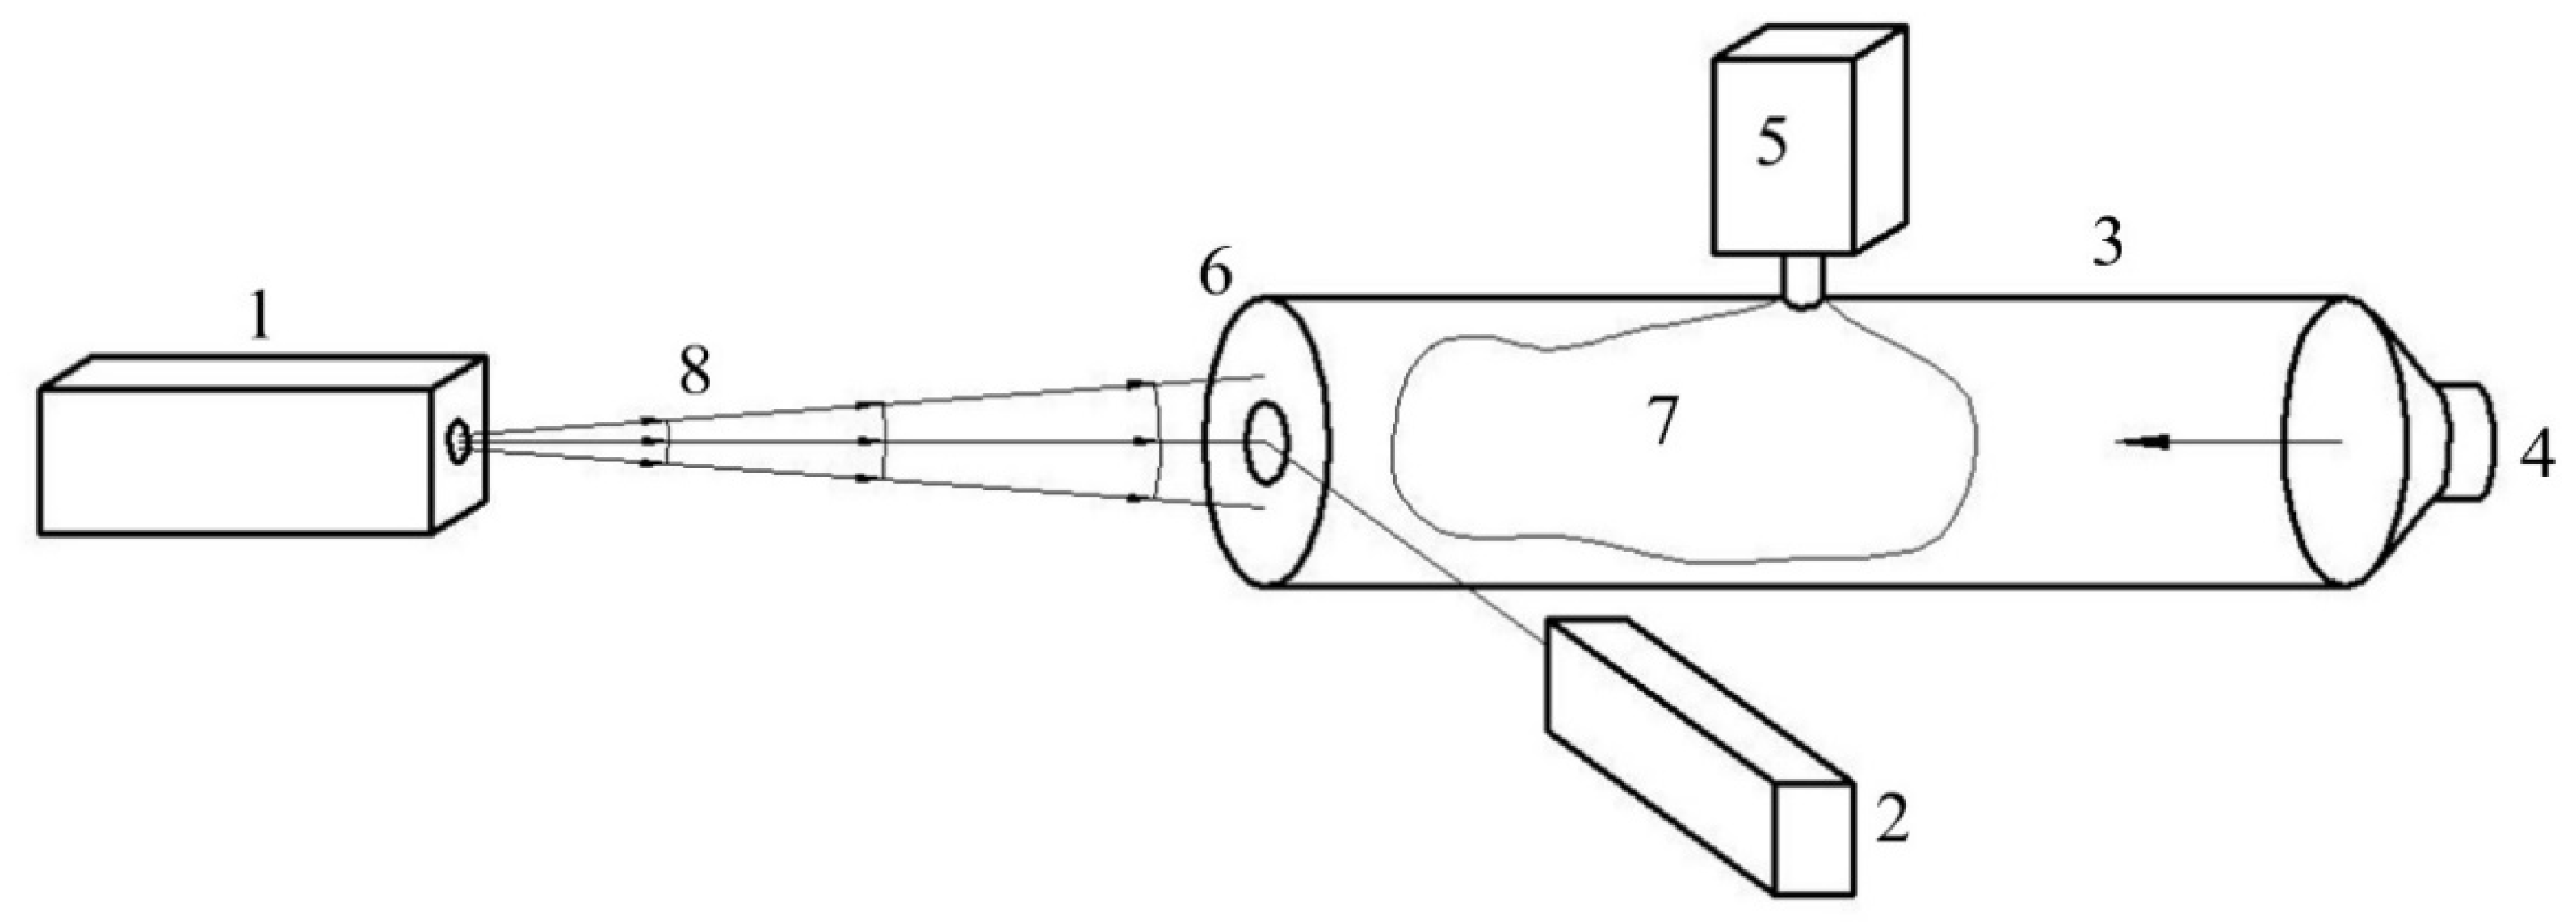
The scheme of the corresponding experimental setup is shown in
Figure 7. It consists of the following modules: a laser (1), a high-speed camera (2), a Kundt tube (3), a sound source (4), a vapor generator (5), and a baffle (6) with an orifice in the middle. The neck of the resonator, where the sound wave can be converted into a jet, has a diameter of 10 mm and a length of 2 mm. The diameter of the impedance tube is 99 mm.
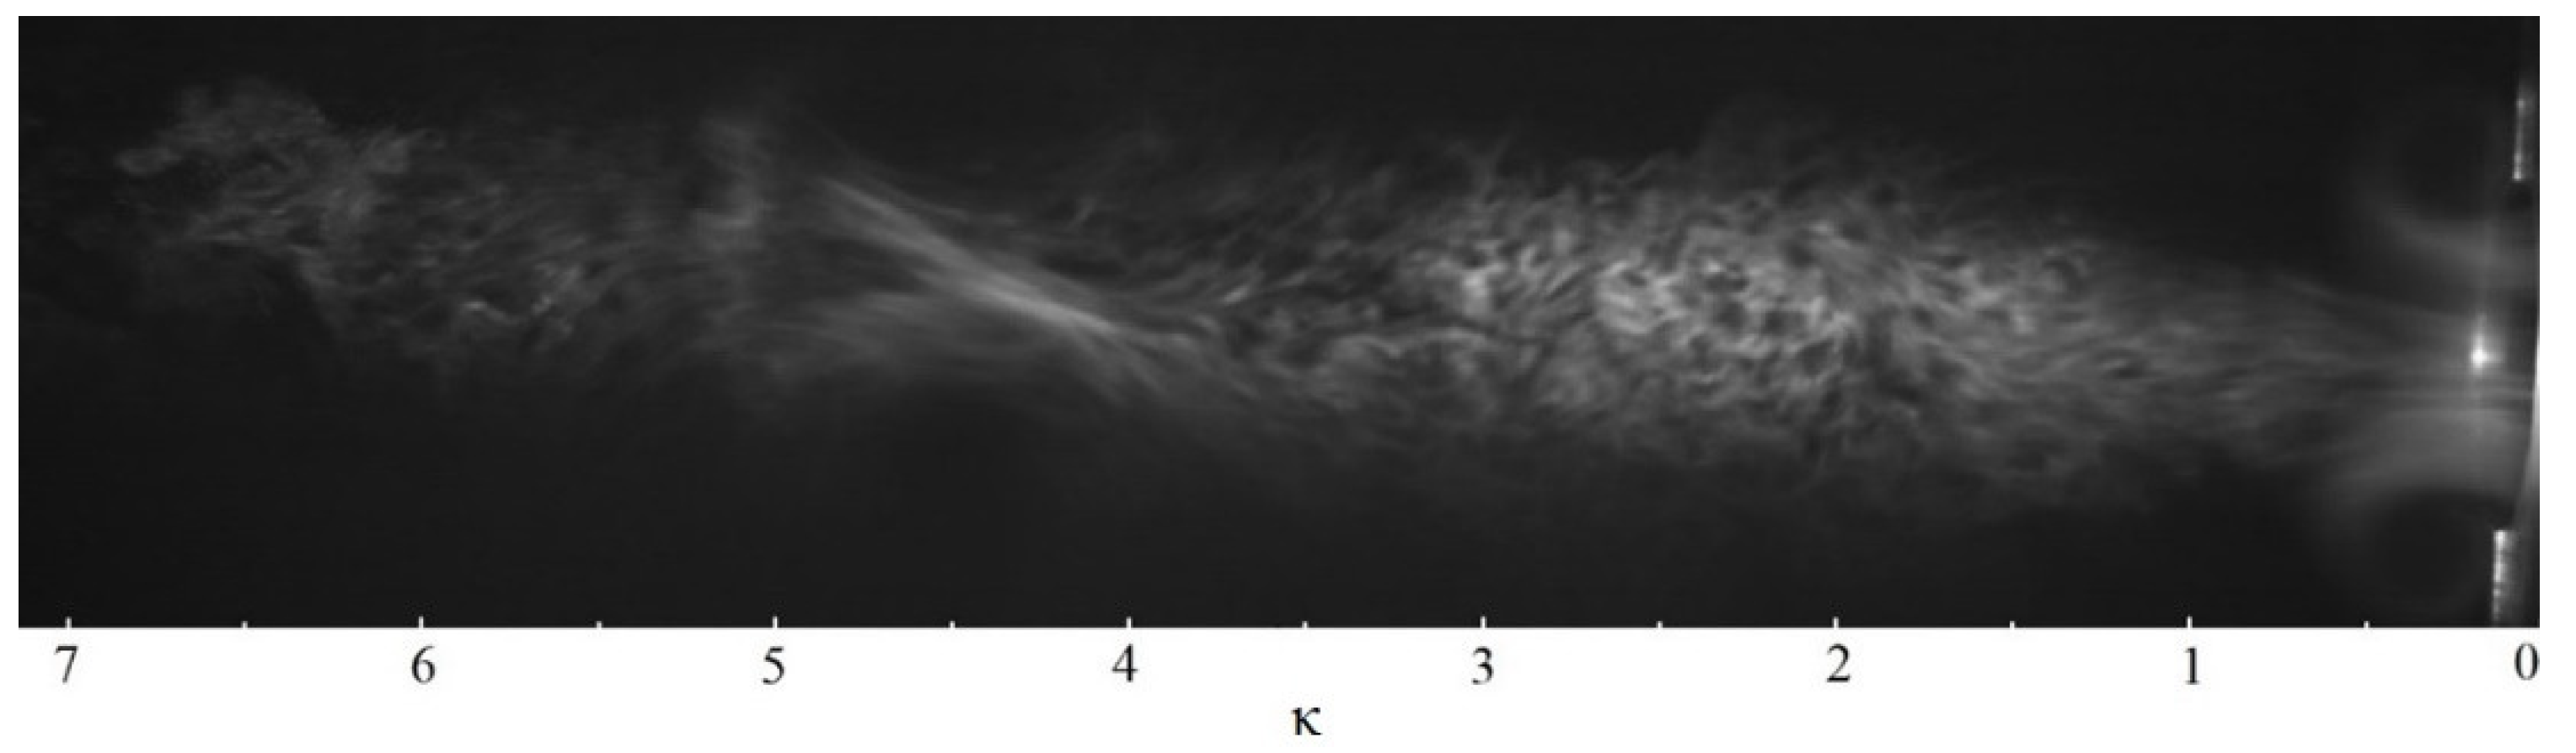
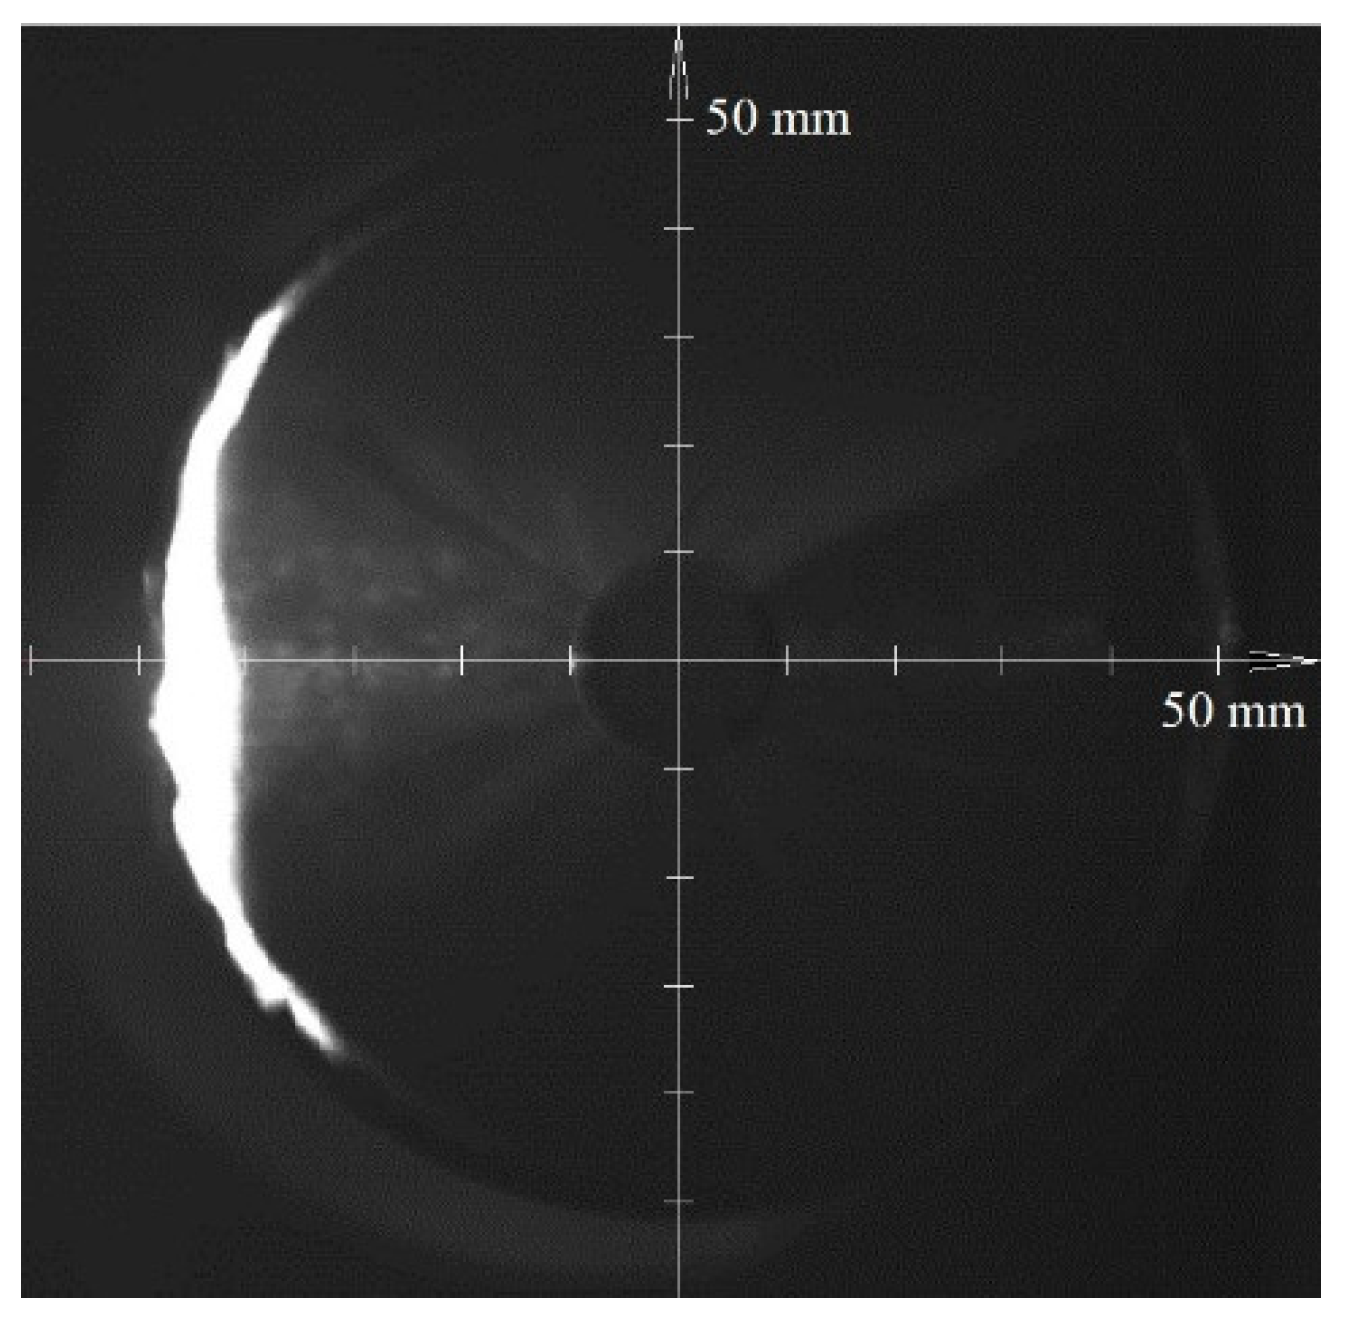
In this installation, the impedance tube is filled with an azeotropic mixture (7) using a steam generator. Sound waves generated by a sound source located at its end also propagate in this impedance tube. The azeotropic mixture of vapors moves together with the air medium, making joint oscillations. The pulsating vapor–air mixture emerging from the opening of the baffle is illuminated by a laser “knife” (8) so that the high-speed camera can capture the movement of particles in such a medium as, for example, shown in
Figure 8. In this figure, the distance from the orifice along the horizontal axis
x is set in the caliber κ =
x/
d0, where
d0 is a diameter of the orifice. It should be noted that a special diaphragm of the emitter is used to convert the laser beam into a “knife”.
In this experiment, the motion of particles in a vapor–air medium was considered in two main planes: a longitudinal section along the symmetry axis of the impedance tube and a partition, and a transverse plane located in the vicinity of the considered partition and parallel to it (
Figure 9). In the first case, the laser and high-speed camera are positioned as shown in
Figure 8, and in the second case, they were swapped. During the experiment, a sound pressure level of 136 dB was created by a sinusoidal signal in the tube, with a frequency of signal of 150 Hz. The process was recorded by the high-speed camera at a frequency of 3000 frames per second. Thus, 20 frames accounted for one period of oscillation of the sound signal.
The results of high-speed photography of the longitudinal section of the acoustic jet are shown in
Figure 8 and in
Supplementary Materials Figure S1 «Longitudinal section of the acoustic flow». As expected, in the considered nonlinear regime at the outlet of partition 6, the acoustic wave transforms into a jet, the movement of which is accompanied by the formation of a vortex ring, which then continues to move along with the jet through the entire path of its propagation. In this case, during the period of the generated sound wave, the annular vortex overcomes a distance of 46 mm. From here, the average propagation velocity of the front of the acoustic jet can be obtained. For example, for the first period after the breakdown of the sound wave into the flow, it is approximately 6.9 m/s.
Figure 9 and
Supplementary Materials Figure S2 «A section parallel to the partition with an orifice» demonstrate the movement of a medium in a plane parallel to a partition with an orifice. In this case, the predominant movement of the medium towards the orifice is observed.
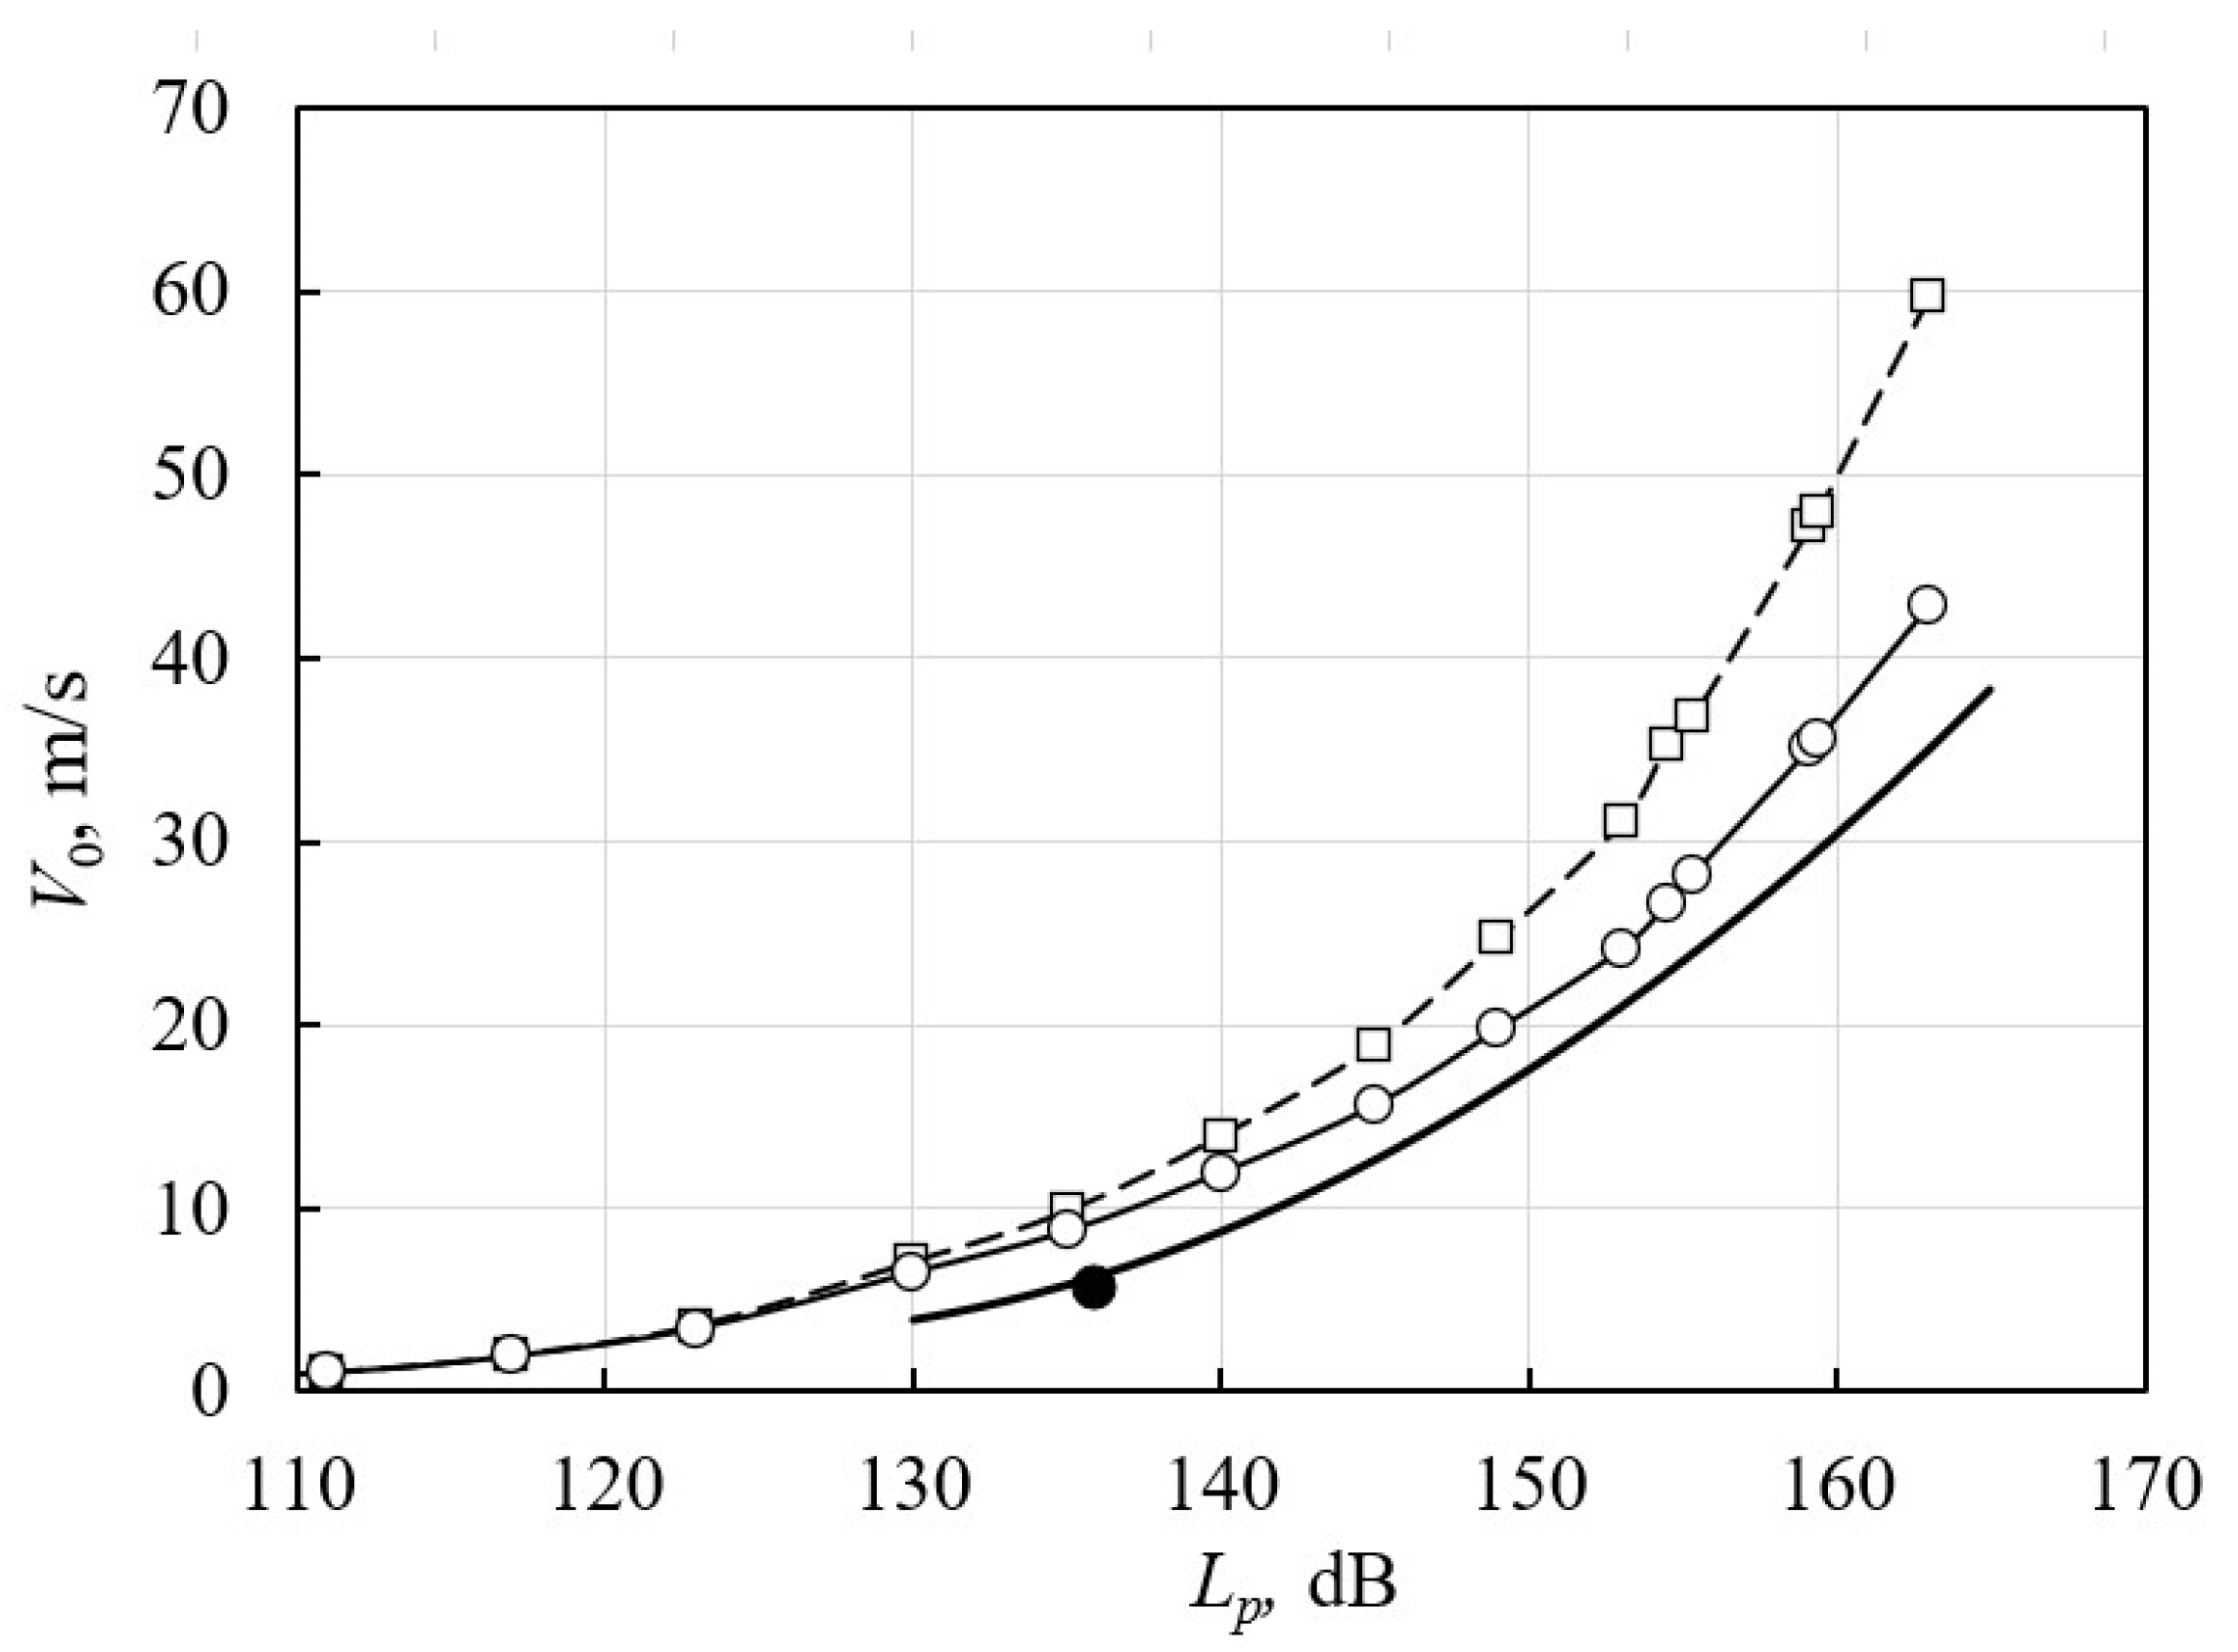
Figure 10 shows the graphical dependence of the oscillation velocity in the orifice of the partition (resonator neck) on the sound pressure level in the impedance tube obtained from the measurement results. In contrast to that shown in
Figure 6, the graph here uses a linear scale along the
y-axis. Additionally, in this figure, the black dot indicates the velocity value in the orifice, obtained from the analysis of the visualized pattern of oscillatory processes in the vicinity of it. Note that the value of the oscillation velocity obtained in this way, corresponding to an SPL of 136 dB, is in good agreement with the velocity measured by the Pitot tube at this SPL.


