
Electrochemical Impedance Spectroscropy Study on the Behavior of Reinforced Concrete Elements under Loading


Abstract
:1. Introduction
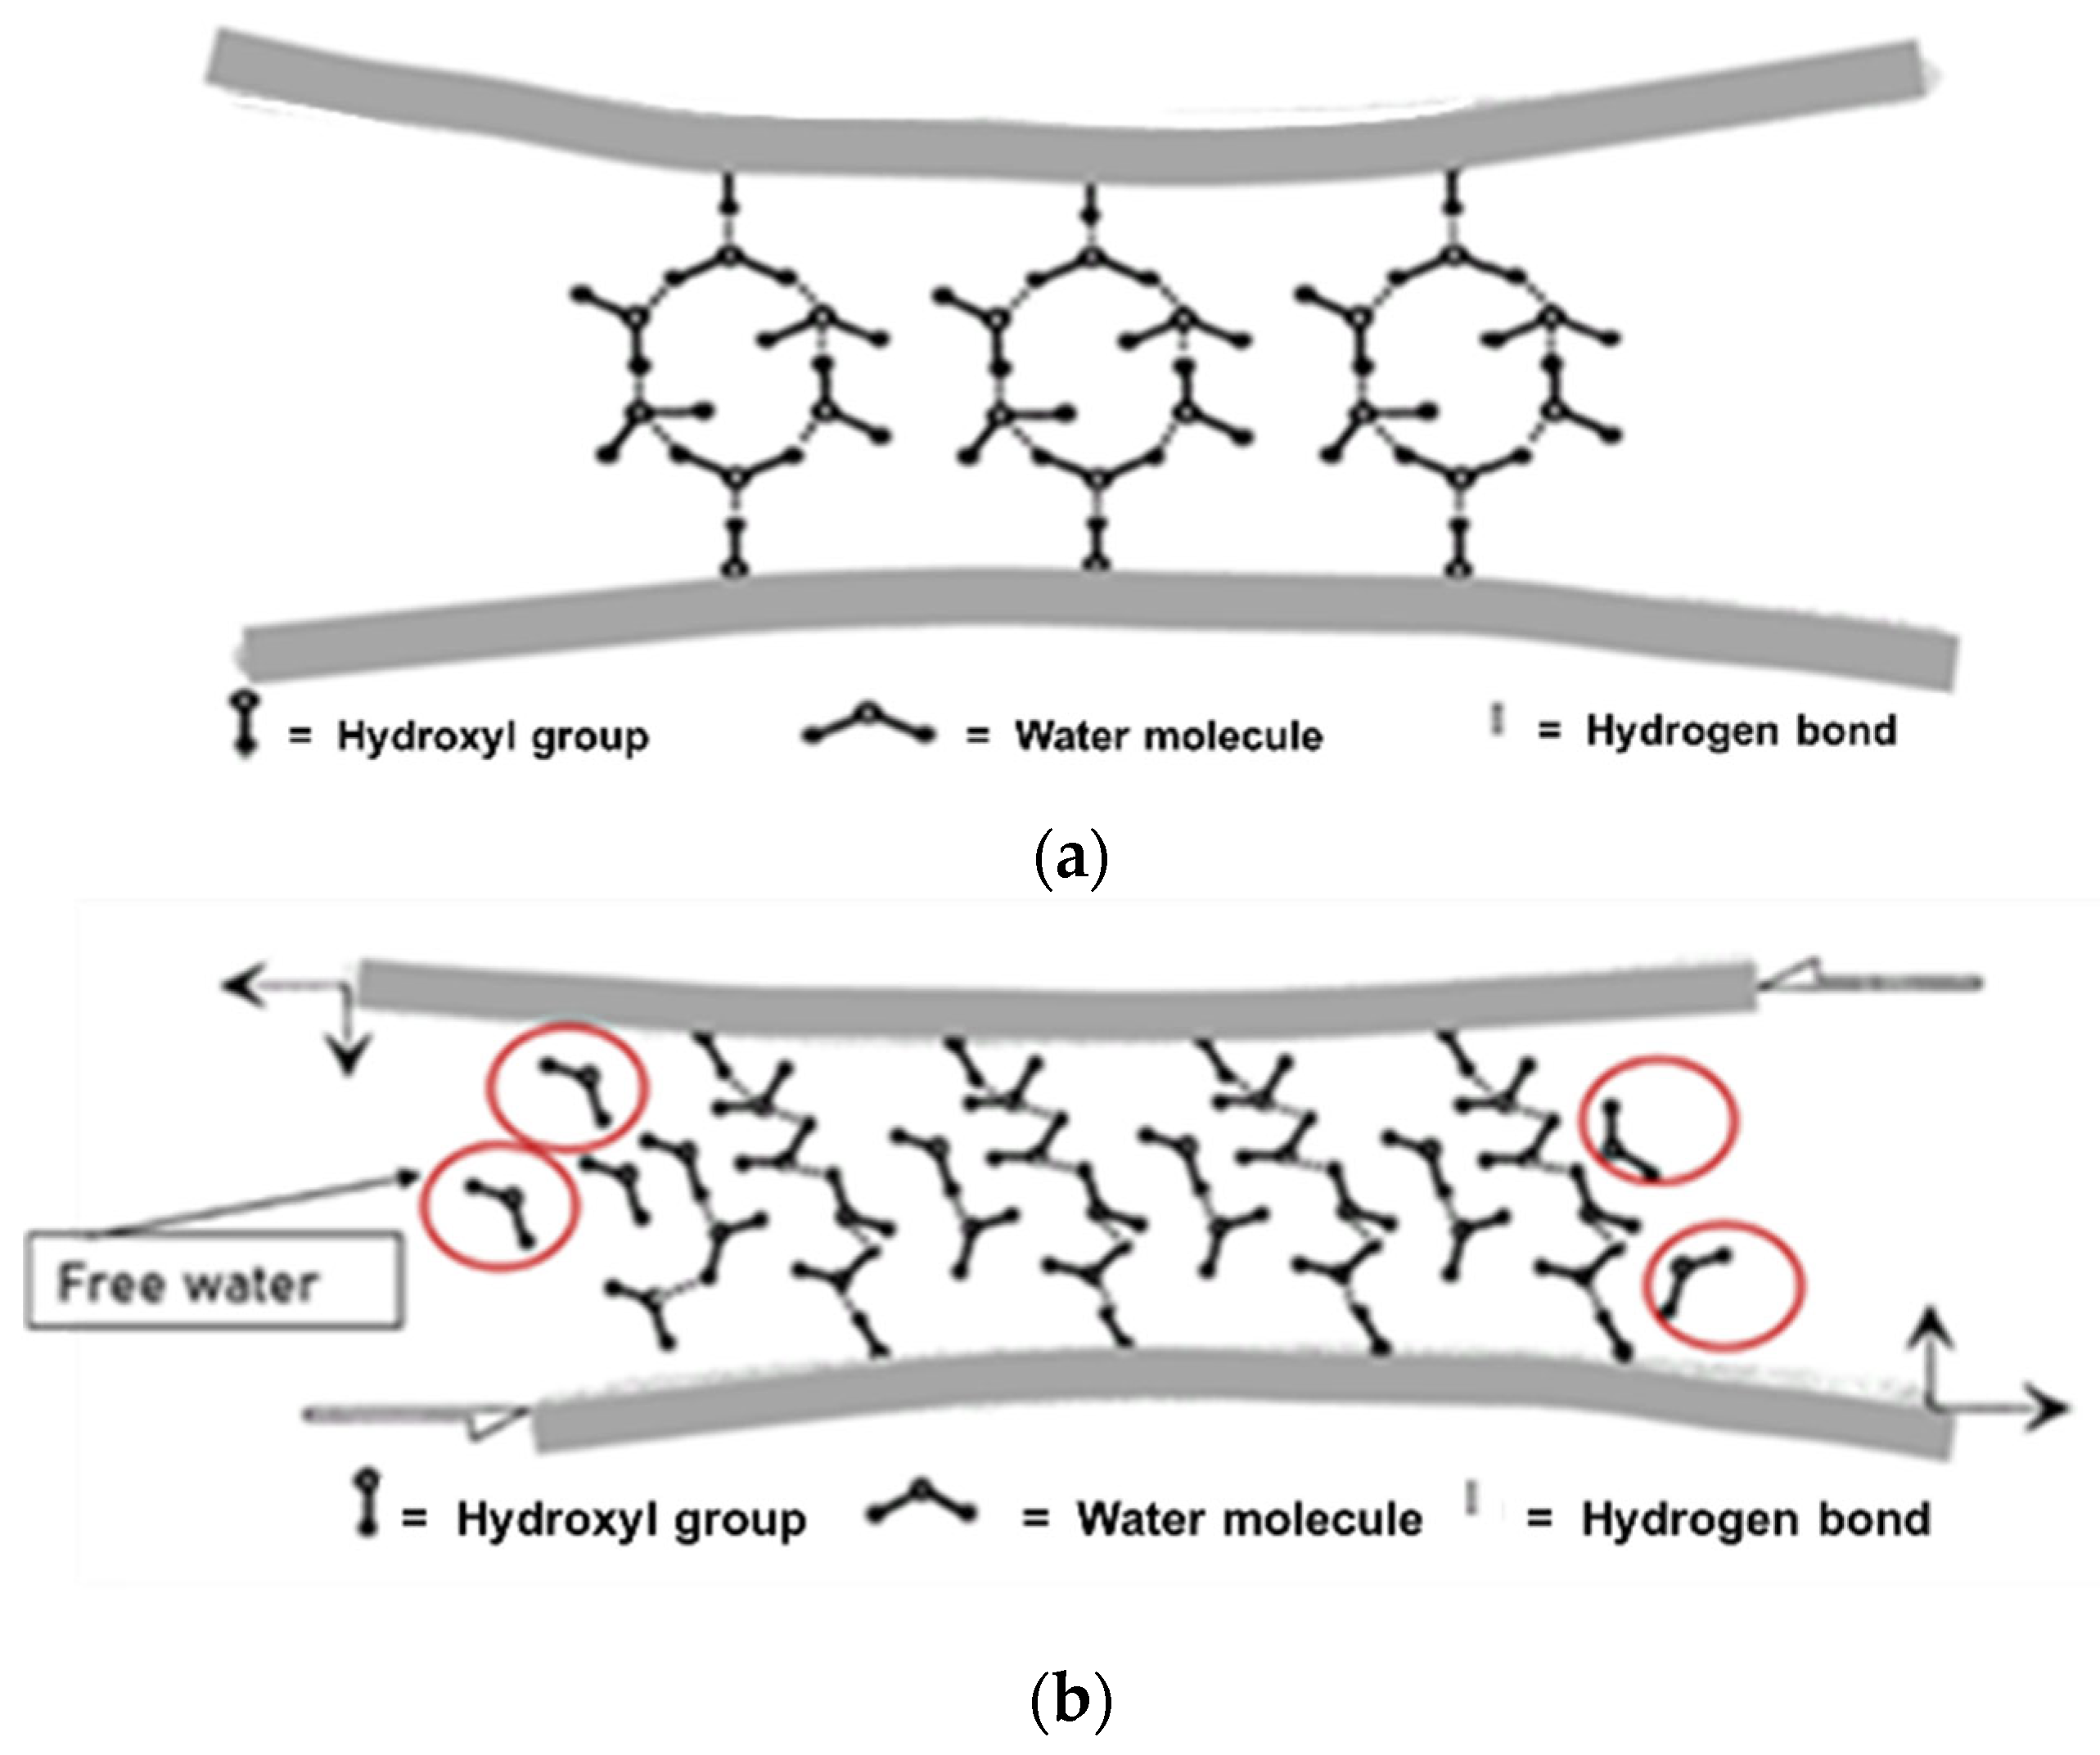
2. The States of Water in Porous Materials
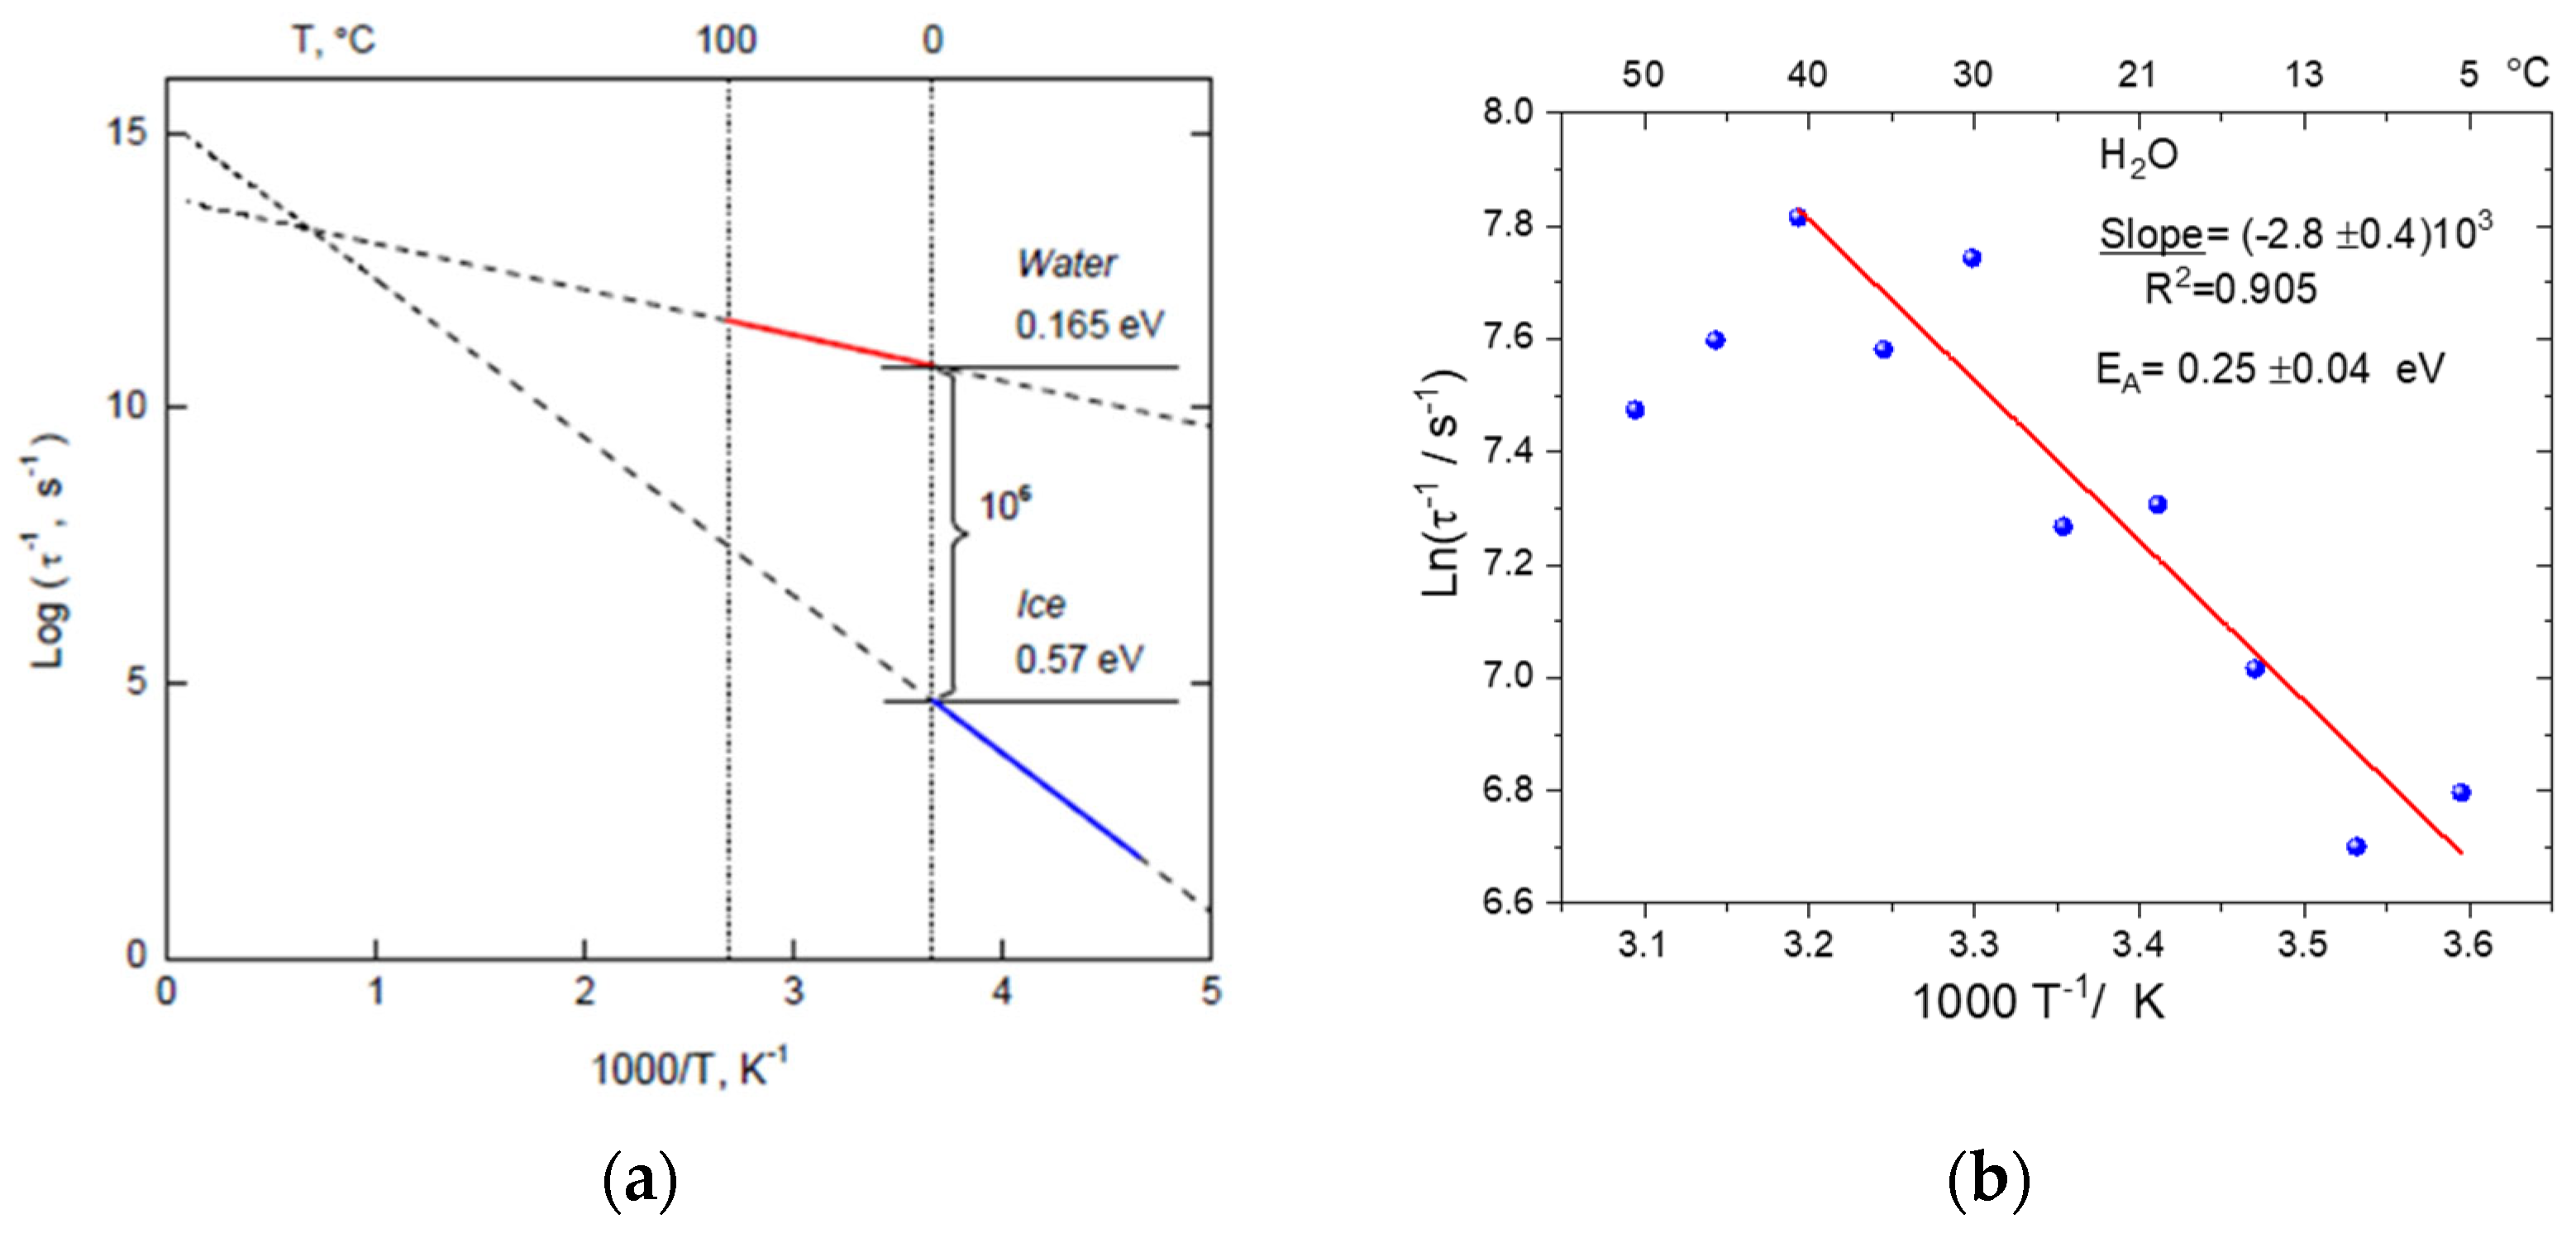
3. The Dielectric Permittivity of Water
4. The Self-Sensing Capability of Cementitious Materials
4.1. Bare elements
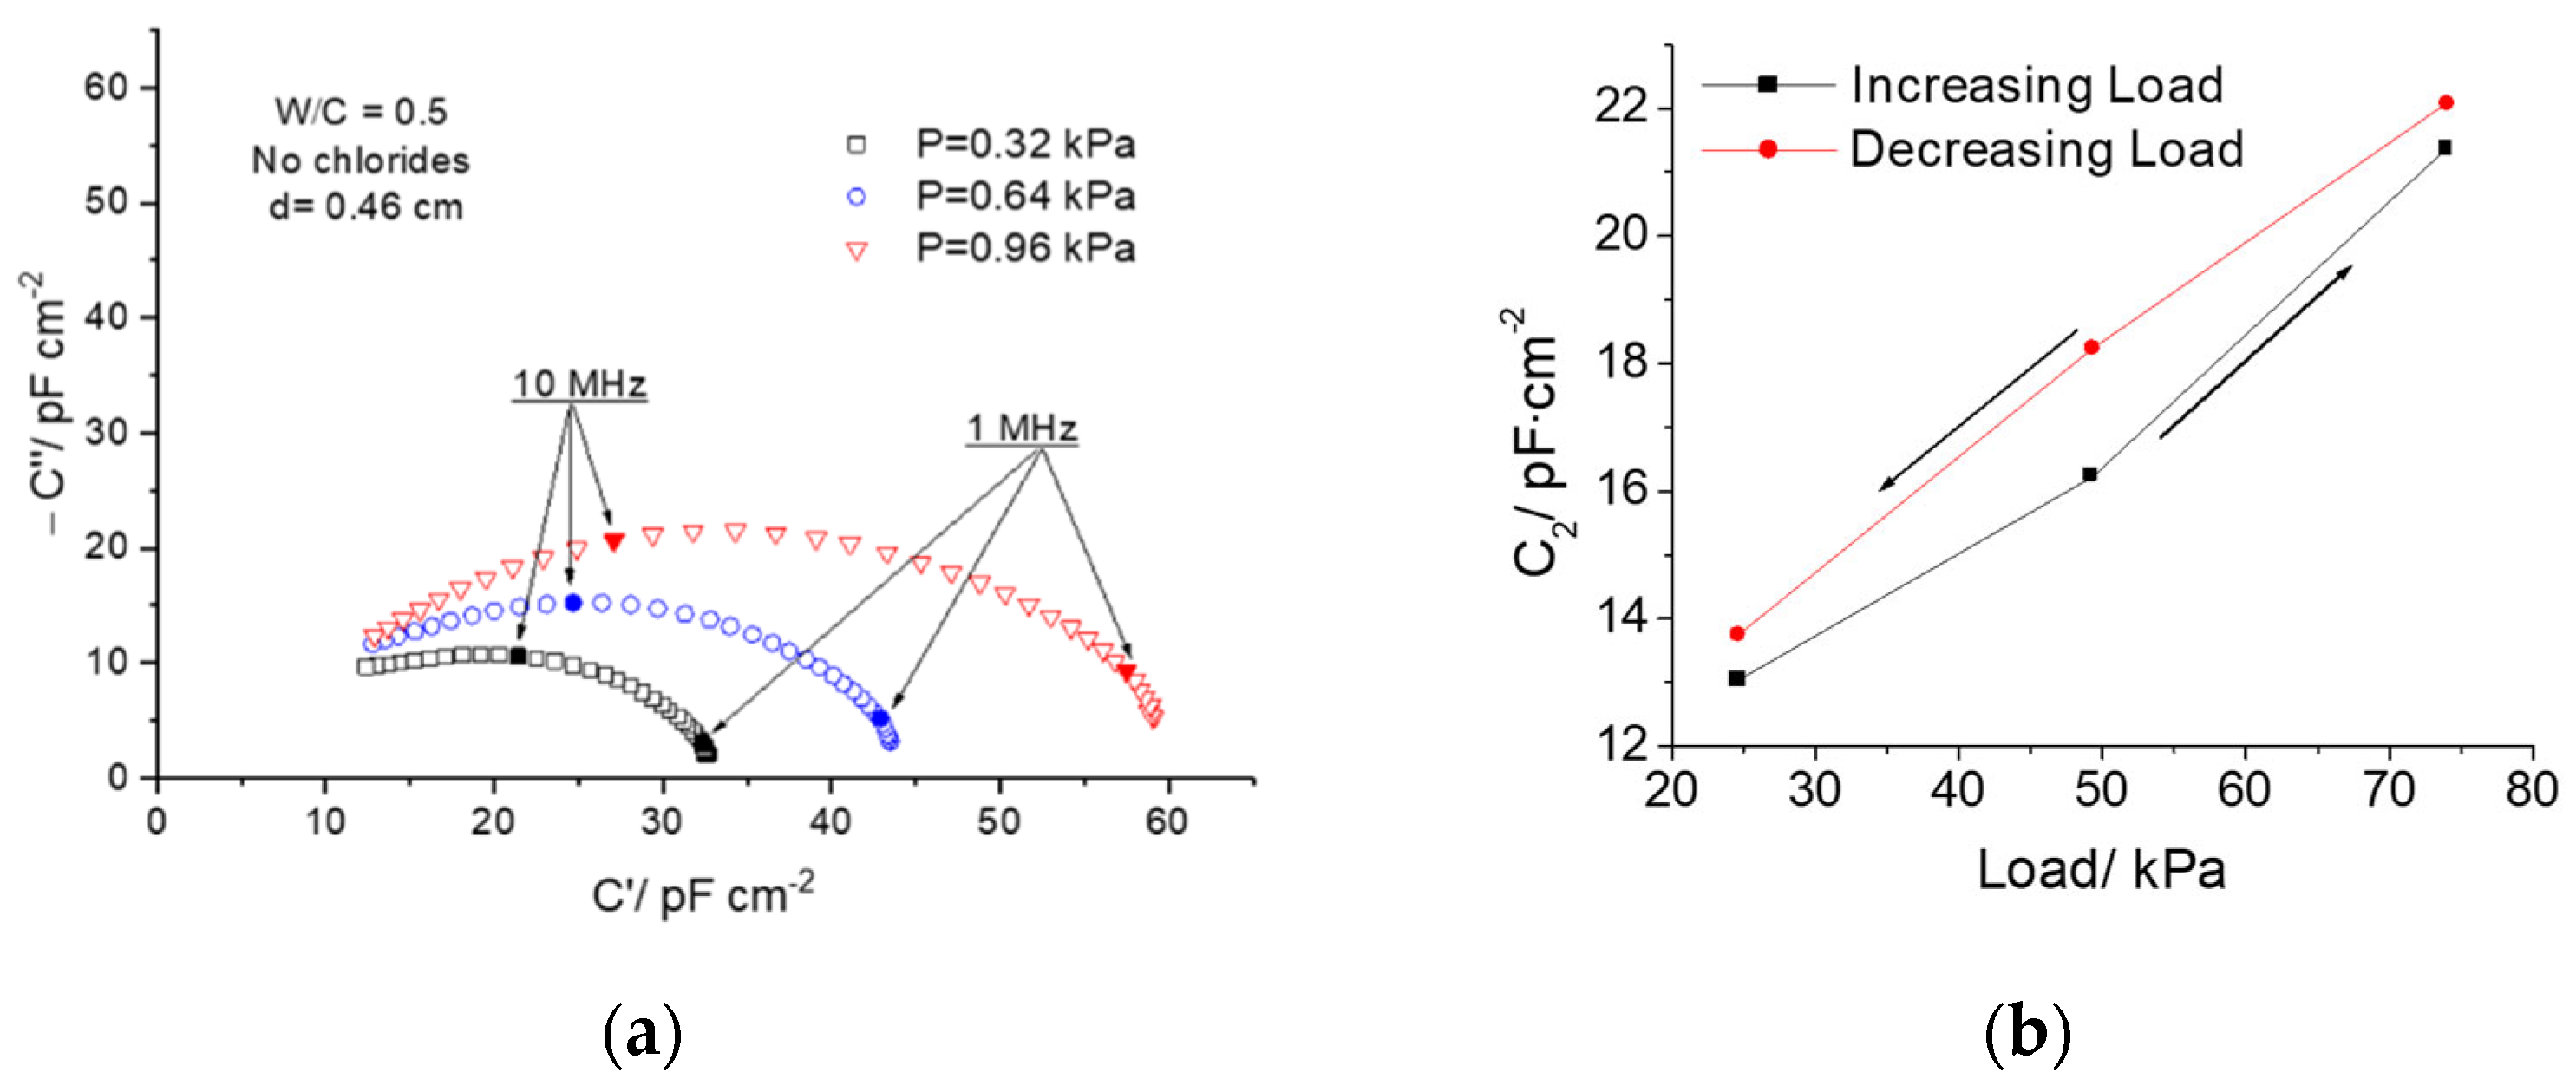
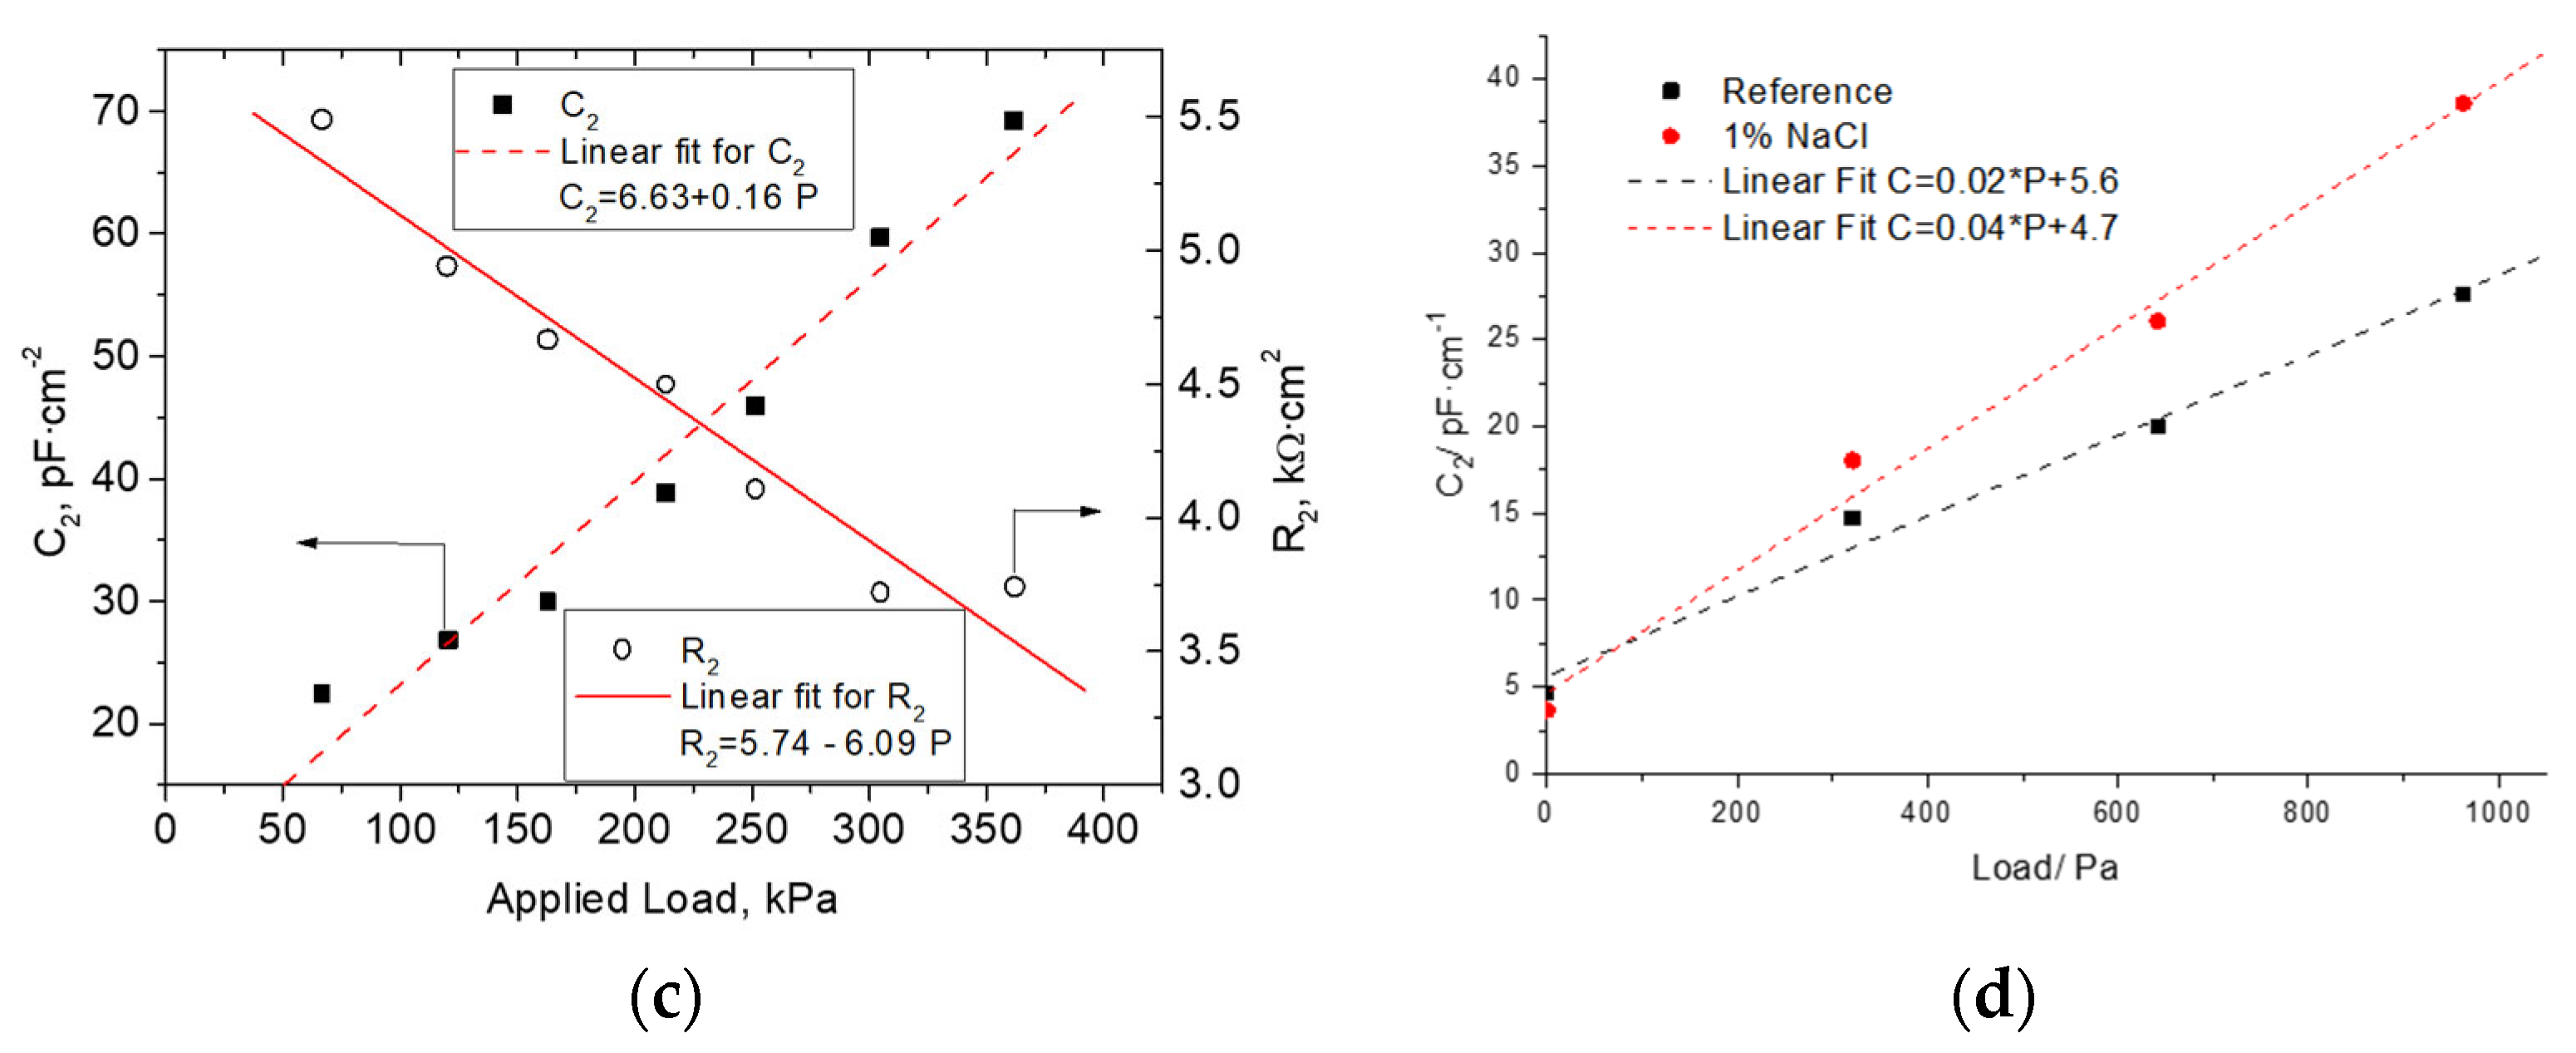
4.1.1. Load Sensing
4.1.2. Relative Humidity Sensing
4.2. Reinforced Elements
5. Conclusions
Author Contributions
Funding
Data Availability Statement
Conflicts of Interest
References
- John, D.G.; Searson, P.C.; Dawson, J.L. Use of AC Impedance Technique in Studies on Steel in Concrete in Immersed Conditions. Br. Corros. J. 1981, 16, 102–106. [Google Scholar] [CrossRef]
- McCarter, W.J.; Brousseau, R. The A.C. response of hardened cement paste. Cem. Concr. Res. 1990, 20, 891–900. [Google Scholar] [CrossRef]
- Xu, Z.; Gu, P.; Xie, P.; Beaudoin, J.J. Application of A.C. impedance techniques in studies of porous cementitious materials. Cem. Concr. Res. 1993, 23, 853–862. [Google Scholar] [CrossRef]
- Christensen, B.J.; Coverdale, T.; Olson, R.A.; Ford, S.J.; Garboczi, E.J.; Jennings, H.M.; Mason, T.O. Impedance Spectroscopy of Hydrating Cement-Based Materials: Measurement, Interpretation, and Application. J. Am. Ceram. Soc. 1994, 77, 2789–2804. [Google Scholar] [CrossRef]
- McCarter, W.J. The fractal surface of cementitious materials determined by impedance spectroscopy. Adv. Cem. Res. 1994, 6, 147–154. [Google Scholar] [CrossRef]
- Xie, P.; Gu, P.; Xu, Z.; Beaudoin, J.J. A rationalized a.c. impedence model for microstructural characterization of hydrating cement systems. Cem. Concr. Res. 1993, 23, 359–367. [Google Scholar] [CrossRef]
- Keddam, M.; Takenouti, H.; Nóvoa, X.R.; Andrade, C.; Alonso, C. Impedance measurements on cement paste. Cem. Concr. Res. 1997, 27, 1191–1201. [Google Scholar] [CrossRef]
- Ford, S.; Shane, J.; Mason, T. Assignment of features in impedance spectra of the cement-paste/steel system. Cem. Concr. Res. 1998, 28, 1737–1751. [Google Scholar] [CrossRef]
- Mason, T.O.; Ford, S.J.; Shane, J.D.; Hwang, J.-H.; Edwards, D.D. Experimental limitations in impedance spectroscopy of cement-based materials. Adv. Cem. Res. 1998, 10, 143–150. [Google Scholar] [CrossRef]
- Alonso, C.; Andrade, C.; Keddam, M.; Nóvoa, X.R.; Takenouti, H. Study of the Dielectric Characteristics of Cement Paste. Mater. Sci. Forum 1998, 289–292, 15–28. [Google Scholar] [CrossRef]
- Nóvoa, X.R. Electrochemical aspects of the steel-concrete system. A review. J. Solid State Electrochem. 2016, 20, 2113–2125. [Google Scholar] [CrossRef]
- Wang, R.; He, F.; Shi, C.; Zhang, D.; Chen, C.; Dai, L. AC impedance spectroscopy of cement—Based materials: Measurement and interpretation. Cem. Concr. Compos. 2022, 131, 104591. [Google Scholar] [CrossRef]
- Díaz, B.; Guitián, B.; Nóvoa, X.R.; Pérez, M.C. The effect of long-term atmospheric aging and temperature on the electrochemical behaviour of steel rebars in mortar. Corros. Sci. 2018, 140, 143–150. [Google Scholar] [CrossRef]
- Andrade, C.; Soler, L.; Nóvoa, X.R. Advances in Electrochemical Impedance Measurements in Reinforced Concrete. Mater. Sci. Forum 1995, 192–194, 843–856. [Google Scholar] [CrossRef]
- Andrade, C.; Soler, L.; Alonso, C.; Nóvoa, X.R.; Keddam, M. The importance of geometrical considerations in the measurement of steel corrosion in concrete by means of AC impedance. Corros. Sci. 1995, 37, 2013–2023. [Google Scholar] [CrossRef]
- Díaz, B.; Freire, L.; Nóvoa, X.R.; Puga, B.; Vivier, V. Resistivity of cementitious materials measured in diaphragm migration cells: The effect of the experimental set-up. Cem. Concr. Res. 2010, 40, 1465–1470. [Google Scholar] [CrossRef]
- Keysight-Technologies. Impedance Measurement Handbook. A Guide to Measurement Technology and Techniques, 6th ed.; Application Note; Keysight Technologies: Santa Rosa, CA, USA, 2016. [Google Scholar]
- Chung, D.D.L. Self-monitoring structural materials. Mater. Sci. Eng. R Rep. 1998, 22, 57–78. [Google Scholar] [CrossRef]
- Han, B.; Ding, S.; Yu, X. Intrinsic self-sensing concrete and structures: A review. Measurement 2015, 59, 110–128. [Google Scholar] [CrossRef]
- Han, J.; Pan, J.; Cai, J. Self-sensing properties and piezoresistive effect of high ductility cementitious composite. Constr. Build. Mater. 2022, 323, 126390. [Google Scholar] [CrossRef]
- Lee, S.-J.; You, I.; Kim, S.; Shin, H.-O.; Yoo, D.-Y. Self-sensing capacity of ultra-high-performance fiber-reinforced concrete containing conductive powders in tension. Cem. Concr. Compos. 2022, 125, 104331. [Google Scholar] [CrossRef]
- Chen, B.; Li, B.; Gao, Y.; Ling, T.-C.; Lu, Z.; Li, Z. Investigation on electrically conductive aggregates produced by incorporating carbon fiber and carbon black. Constr. Build. Mater. 2017, 144, 106–114. [Google Scholar] [CrossRef]
- Cui, Y.; Wei, Y. Mixed “ionic-electronic” thermoelectric effect of reduced graphene oxide reinforced cement-based composites. Cem. Concr. Compos. 2022, 128, 104442. [Google Scholar] [CrossRef]
- Han, B.; Yu, X.; Ou, J. Effect of water content on the piezoresistivity of MWNT/cement composites. J. Mater. Sci. 2010, 45, 3714–3719. [Google Scholar] [CrossRef]
- Baeza, F.J.; Zornoza, E.; Andion, L.G.; Ivorra, S.; Garces, P. Variables affecting strain sensing function in cementitious composites with carbon fibers. Comput. Concr. 2011, 8, 229–241. [Google Scholar] [CrossRef]
- Honorio, T.; Bore, T.; Benboudjema, F.; Vourc’h, E.; Ferhat, M. Dielectric properties of the pore solution in cement-based materials. J. Mol. Liq. 2020, 302, 112548. [Google Scholar] [CrossRef] [Green Version]
- Zhang, J.; Heath, A.; Abdalgadir, H.M.T.; Ball, R.J.; Paine, K. Electrical impedance behaviour of carbon fibre reinforced cement-based sensors at different moisture contents. Constr. Build. Mater. 2022, 353, 129049. [Google Scholar] [CrossRef]
- Díaz, B.; Nóvoa, X.R.; Pérez, M.C. Study of the chloride diffusion in mortar: A new method of determining diffusion coefficients based on impedance measurements. Cem. Concr. Compos. 2006, 28, 237–245. [Google Scholar] [CrossRef]
- Cabeza, M.; Keddam, M.; Nóvoa, X.R.; Sánchez, I.; Takenouti, H. Impedance spectroscopy to characterize the pore structure during the hardening process of Portland cement paste. Electrochim. Acta 2006, 51, 1831–1841. [Google Scholar] [CrossRef]
- Deus, J.M.; Díaz, B.; Freire, L.; Nóvoa, X.R. The electrochemical behaviour of steel rebars in concrete: An Electrochemical Impedance Spectroscopy study of the effect of temperature. Electrochim. Acta 2014, 131, 106–115. [Google Scholar] [CrossRef]
- Feijoo, J.; Nóvoa, X.R.; Rivas, T. Electrokinetic treatment to increase bearing capacity and durability of a granite. Mater. Struct. 2017, 50, 251. [Google Scholar] [CrossRef]
- Collazo, A.; Izquierdo, M.; Nóvoa, X.R.; Pérez, C. Surface treatment of carbon steel substrates to prevent cathodic delamination. Electrochim. Acta 2007, 52, 7513–7518. [Google Scholar] [CrossRef]
- Cao-Paz, A.; Covelo, A.; Fariña, J.; Nóvoa, X.R.; Pérez, C.; Rodríguez-Pardo, L. Ingress of water into organic coatings: Real-time monitoring of the capacitance and increase in mass. Prog. Org. Coatings 2010, 69, 150–157. [Google Scholar] [CrossRef]
- Vosgien Lacombre, C.; Bouvet, G.; Trinh, D.; Mallarino, S.; Touzain, S. Water uptake in free films and coatings using the Brasher and Kingsbury equation: A possible explanation of the different values obtained by electrochemical Impedance spectroscopy and gravimetry. Electrochim. Acta 2017, 231, 162–170. [Google Scholar] [CrossRef]
- Artemov, V.G.; Volkov, A.A. Water and Ice Dielectric Spectra Scaling at 0 °C. Ferroelectrics 2014, 466, 158–165. [Google Scholar] [CrossRef]
- Sierra, R. Répartition des différentes formes d’eau dans la structure des pâtes pures de C3S et de Ciment Portland. In Proceedings of the 7th International Congress on the Chemistry of Cement, Paris, France, 30 June–4 July 1980; Volume 3, pp. 201–206. [Google Scholar]
- Feldman, R.F. Factors affecting young’s modulus—Porosity relation of hydrated portland cement compacts. Cem. Concr. Res. 1972, 2, 375–386. [Google Scholar] [CrossRef] [Green Version]
- Cabeza, M.; Merino, P.; Nóvoa, X.R.; Sánchez, I. Electrical effects generated by mechanical loading of hardened Portland cement paste. Cem. Concr. Compos. 2003, 25, 351–356. [Google Scholar] [CrossRef]
- Cabeza, M.; Franco, M.; Izquierdo, M.; Nóvoa, X.R.; Sánchez, I. Effet des chlorures sur les propriétés chimiques et barrière de la pâte de ciment. In Proceedings of the 13ème Forum sur les Impedances Electrochimiques, Paris, France, 11 December 2000; pp. 43–53. [Google Scholar]
- Wang, H.; Shi, F.; Shen, J.; Zhang, A.; Zhang, L.; Huang, H.; Liu, J.; Jin, K.; Feng, L.; Tang, Z. Research on the self-sensing and mechanical properties of aligned stainless steel fiber-reinforced reactive powder concrete. Cem. Concr. Compos. 2021, 119, 104001. [Google Scholar] [CrossRef]
- Keddam, M.; Nóvoa, X.R.; Vivier, V. The concept of floating electrode for contact-less electrochemical measurements: Application to reinforcing steel-bar corrosion in concrete. Corros. Sci. 2009, 51, 1795–1801. [Google Scholar] [CrossRef]
- Díaz, B.; Guitián, B.; Ramón Nóvoa, X.; Pérez, C. Conductivity assessment of multifunctional cement pastes by impedance spectroscopy. Corros. Sci. 2021, 185, 109441. [Google Scholar] [CrossRef]
- Díaz, B.; Guitián, B.; Nóvoa, X.R.; Pérez, C. Analysis of the microstructure of carbon fibre reinforced cement pastes by impedance spectroscopy. Constr. Build. Mater. 2020, 243, 118207. [Google Scholar] [CrossRef]


Publisher’s Note: MDPI stays neutral with regard to jurisdictional claims in published maps and institutional affiliations. |
© 2022 by the authors. Licensee MDPI, Basel, Switzerland. This article is an open access article distributed under the terms and conditions of the Creative Commons Attribution (CC BY) license (https://creativecommons.org/licenses/by/4.0/).
Share and Cite
Díaz, B.; Nóvoa, X.R.; Pérez, C. Electrochemical Impedance Spectroscropy Study on the Behavior of Reinforced Concrete Elements under Loading. Corros. Mater. Degrad. 2022, 3, 759-769. https://doi.org/10.3390/cmd3040039
Díaz B, Nóvoa XR, Pérez C. Electrochemical Impedance Spectroscropy Study on the Behavior of Reinforced Concrete Elements under Loading. Corrosion and Materials Degradation. 2022; 3(4):759-769. https://doi.org/10.3390/cmd3040039
Chicago/Turabian StyleDíaz, Belén, X. Ramón Nóvoa, and Carmen Pérez. 2022. "Electrochemical Impedance Spectroscropy Study on the Behavior of Reinforced Concrete Elements under Loading" Corrosion and Materials Degradation 3, no. 4: 759-769. https://doi.org/10.3390/cmd3040039