Article

Simple and Intelligent Electrochemical Detection of Ammonia over Cuprous Oxide Thin Film Electrode

1
Department of Chemistry, Faculty of Science, King Abdulaziz University, Jeddah 21589, Saudi Arabia
2
Centre of Excellence in Environmental Studies (CEES), King Abdulaziz University, Jeddah 21589, Saudi Arabia
3
National Center of Physics, Quaid-e-Azam University, Islamabad 44000, Pakistan
*
Author to whom correspondence should be addressed.
Surfaces 2023, 6(4), 430-449; https://doi.org/10.3390/surfaces6040029
Submission received: 1 September 2023 / Revised: 6 October 2023 / Accepted: 20 October 2023 / Published: 6 November 2023
(This article belongs to the Collection Featured Articles for Surfaces)

Abstract

:
To realize simple and intelligent electrochemical ammonia (NH3) detection in water, highly dense colloidal copper nanoparticles (CuNPs) were prepared and subsequently deposited onto a glassy carbon electrode (GCE). The CuNPs/GCE was then placed in an oven at 60 °C to intelligently transform CuNPs into cuprous oxide (Cu2O) thin film. The colloidal CuNPs were characterized by ultraviolet-visible (UV-Vis) spectroscopy, whereas the fabricated Cu2O/GCE was subjected to Fourier transform infrared spectroscopy (FTIR), X-ray diffraction (XRD), X-ray photoelectron spectroscopy (XPS), scanning electron microscopy (SEM), and electrochemical impedance spectroscopy (EIS). The XRD of Cu2O/GCE showed the crystalline nature of the thermally converted Cu2O thin film, whereas XPS demonstrated that the thin film formed on the surface of GCE was primarily composed of Cu2O. The SEM images of Cu2O/GCE revealed Cu2O crystals with hexapod morphology. The EIS study exhibited substantially higher charger transfer activity of Cu2O/GCE compared to bare GCE. The drop coating of ammonia (NH3) solution onto Cu2O/GCE enabled the fabricated electrode to be utilized as an electrochemical sensor for NH3 detection in water. The cyclic voltammetric (CV) behavior of NH3/Cu2O/GCE was investigated in 0.1 M pH 7 phosphate buffer, which led to the formation of a copper-ammonia complex and revealed the nobility of the fabricated electrode. The square wave voltammetric (SWV) response was linear over the 10 µM and 1000 µM ranges with a detection limit of 6.23 µM and good reproducibility. The NH3/Cu2O/GCE displayed high selectivity for the detection of NH3 in the presence of various coexisting cations and anions in 0.1 M pH 7 phosphate buffer. The recovery of NH3 in the drinking water sample varied from 98.2% to 99.1%.

Graphical Abstract

1. Introduction

The determination of ammonia in water is particularly important because of its toxic and irritant effects [1,2]. And, because of the widespread use of ammonia in food processing, agriculture, cleaning and disinfectant products, and refrigeration, excess ammonia can significantly harm the environment and human health [3]. The detection of ammonia in water has been reported through colorimetric/spectroscopic methods, however, time consumption, labor requirements, and associated high costs often limit their regular use [4,5,6]. Several researchers have also reported the amperometric/potentiometric detection of ammonia [7,8,9,10,11,12]. However, from the viewpoint of wastewater treatment, application in the ammonia fuel cell, and as a source for ultra-pure hydrogen, most of the detection of ammonia has been focused on its electrochemical oxidation in alkaline solution [13,14,15,16]. Based on the fabricated electrode system, a few methods have also been developed to detect the presence of ammonia in water, however, the lack of simplicity in fabrication is a significant shortcoming [3,17]. In this regard, the synthesis of colloidal CuNPs, their fabrication as Cu2O thin film on GCE, and drop coating of NH3 solution onto Cu2O/GCE for the detection of NH3 through copper-ammonia complex formation is a novel and simple approach to report.
CuNPs are striking materials primarily due to their intrinsic properties and wide range of applications in various fields, including photocatalysis, perovskite solar cells, energy conversion, electrochemical detection/sensing, biosensing, gas sensors, and antimicrobial activity [18,19,20]. Due to their high electrical conductivity and chemical reactivity, CuNPs are also replacing Au and Ag in conductive pastes and catalysis applications [21,22]. Recently, CuNPs have been of particular interest in electrochemical detection applications as well. As a result, CuNP-based electrodes have emerged in the past few years as the most suitable alternative for the direct monitoring of a variety of analytes [23,24,25]. Due to copper-ammonia complex affinity [26,27], CuNPs can be an efficient electrode material for the simple electrochemical detection of NH3. However, the only report appears to be from Valentini et al. [17], who used multi-walled carbon nanotube/copper nanoparticles composite paste electrodes for the detection of NH3 in drinking water. The disadvantages of this method include the complicated fabrication steps, vague mechanism, and poor reproducibility of the proposed electrode.
Among the various chemical methods for the synthesis of CuNPs, the wet chemical reduction method offers several advantages over others [28,29,30]. It is economical, simple, requires less effort, provides better control over the particle size and distribution, and flexibility in terms of the dense packing of CuNPs as thin films. However, the stability of colloidal CuNPs is extremely critical due to their sensitivity to air and the permanence of their oxides [31,32]. In recent years, reducing agents with additional capping and binding properties have received much attention due to their capability of modifying the NP surfaces in such a way as to increase their loading on substrates and produce functional thin films [28,33,34,35]. One such reducing agent is ascorbic acid, which is known to functionalize CuNPs while reducing them to a stable colloidal form.
There has been much interest in electrochemical sensing applications of Cu2O NPs due to their narrow band gap and excellent electrical properties [36]. As a result, various synthesis routes have been employed to obtain Cu2O NP-fabricated GCE. One such unique route consisted of oxidizing colloidal CuNPs on the surface of GCE at a low temperature (<250 °C) in the air [37,38]; however, to the best of our knowledge, this strategy was not employed in electrochemical sensing applications of Cu2O NPs. On the other hand, copper-ammonia chemistry is well established in the literature regarding the electrodeposition of Cu from ammonia solution because of the diverse speciation of Cu2O and CuO [37,38]; however, no NH3 detection was proposed earlier. Thus, oxidizing colloidal CuNPs on the surface of GCE under controlled thermal treatment in Cu2O is an intelligent and unique way to report the detection of NH3.
Herein, colloidal CuNPs were prepared through a wet chemical reduction method using ascorbic acid as a reducing as well as stabilizing agent. Prepared CuNPs were subsequently deposited on GCE and oxidized into Cu2O thin film in an oven at 60 °C. For the detection of NH3, Cu2O/GCE was further modified with NH3 solution and investigated by CV in 0.1 M pH 7 phosphate buffer. Suitable reaction pathways have been proposed corresponding to the reduction of the copper-ammonia complex, which produced a new reduction peak. Based on this, an intelligent NH3 detection in water is presented here.

2. Experimental Section

2.1. Reagents and Solutions

Copper(II) nitrate (Cu(NO3)2, 99%), ascorbic acid, sodium hydroxide (NaOH), phosphoric acid (H3PO4), ammonia (NH3) solution (32%), potassium chloride (KCl), potassium ferricyanide (Fe(CN6)3−/4−), and sodium sulfate (Na2SO4) were purchased from Sigma-Aldrich and used without any further modification. Then, 0.1 M stock solution of NH3 was prepared in deionized water. The 0.1 M phosphate buffers of various pH were prepared by the appropriate mixing of 0.5 M H3PO4 and 0.5 M NaOH solutions. The working solutions of NH3 were prepared by diluting the stock solution with phosphate buffer; 0.1 M KCl and 0.1 M NaSO4 were also tested as supporting electrolytes.

2.2. Synthesis of Colloidal CuNPs

Highly dense colloidal CuNPs were prepared in a single pot using the wet chemical reduction method. Briefly, 1 mL of 0.3 M Cu(NO3)2 was mixed with an appropriate amount of 0.5 M ascorbic acid and 0.2% NaOH under stirring. The reaction mixture was then refluxed for 2 h at 80 °C in air until the complete reduction of the metallic salt. During the reaction, the color changed from colorless to pale yellow, orange, pale brown, and, finally, dark brown. The volume of the reaction vessel was kept constant at 10 mL during the reduction process. The purpose of adding NaOH was to accelerate the rate of reduction. Ascorbic acid served as both a reducing and stabilizing agent. The reaction mixture was cooled and kept at room temperature for further studies.

2.3. Preparation of Cu2O Thin Film Electrode

For thin film formation, about 1 mL of the colloidal CuNPs was diluted with deionized water and sonicated for 2 min to obtain a homogeneous solution. The surface of GCE was thoroughly cleaned through polishing on alumina and diamond slurries, respectively, subsequently washed, and air dried. About 20 µL of colloidal CuNPs was dropped on GCE to cover the entire surface. The uniformity of the coated surface was optically ensured and left in an oven at 60 °C for 5 min. The drop-coated CuNPs were oxidized into a Cu2O thin film during the drying process and labeled as Cu2O/GCE.

2.4. Apparatus

The UV-visible spectra of colloidal CuNPs were recorded on a Cary 60 (Agilent Technology, Santa Clara, CA, USA). Fourier transform infrared (FTIR) analysis of Cu2O/GCE was performed with a Cary 630 (Agilent Technology, USA). The crystallinity of thermally converted Cu2O thin film on GCE was studied using an automated multipurpose X-ray diffractometer (Ultima IV, Rigaku, Akishima, Japan) equipped with Cu Kα radiation source in the 2θ range of 10° to 80°, at a 40 kV accelerating voltage, and a current of 40 mV. The elemental composition was analyzed by XPS (PHI 5000 Versa Probe II, ULVAC-PHI Inc., Chigasaki, Japan) in the binding energy range of 0 eV to 1350 eV. The shape, aggregation, and distribution information of Cu2O thin film on GCE was obtained using a field emission electron microscope (FESEM, JEOL, JSM-IT700HR, Tokyo, Japan). Electrochemical measurements including EIS, CV, and SWV were carried out with a VSP multi-channel potentiostat (Bio-logic Science Instrument, Seyssinet-Pariset, France) in a 20-mL cell with a three-electrode assembly. The assembly had a 3-mm diameter glassy carbon working electrode, a 50-mm long with a 0.5-mm diameter Pt wire counter electrode, and an Ag/AgCl reference electrode.

2.5. EIS and Electrochemical Measurements

Throughout the electrochemical measurements, the nitrogen environment was maintained. The EIS data were obtained against 2 mM (Fe(CN6)3−/4−) in 0.1 M KCl by scanning the frequency between 100 mHz–100 kHz at a 10 mV AC amplitude. The Nyquist plots were extracted using Randle’s equivalent circuit model. CV scans were initiated at all times at open circuit voltage (OCV) to a vertex potential (E1) +1.0 V followed by a cathodic sweep from + 1.0 V to −1.0 V and an anodic sweep from −1.0 V to +1.0 V at a scan rate of 100 mV/s in 0.1 M pH 7 phosphate buffer. A series of optimizations were performed with SWV in the potential direction from +1.0 V to −1.0 V to construct the calibration curves and calculate the limit of detection. No OCV or accumulation time was employed during SWV. For the interference study, reagent-grade chemicals were used.

2.6. NH3 Detection Procedure

An amount of 10 µL of 1 mM NH3 was dropped onto Cu2O/GCE and dried in air before the electrochemical measurements. The as-prepared NH3/Cu2O/GCE was then immersed in an electrochemical cell containing 0.1 M pH 7 phosphate buffer to obtain the CV behavior of NH3, as shown in Scheme 1. For analytical detection, NH3/Cu2O/GCE with various concentrations of NH3 were separately prepared using the drop coating procedure and subjected to SWV under the optimized conditions.

2.7. NH3 Recovery in Drinking Water

The drinking water sample was collected from Jeddah, Saudi Arabia. The sample was filtered using a 0.45-µm membrane filter to remove solid particulates and kept refrigerated at 4 °C. The sample was diluted with 0.1 M of pH 7 phosphate buffer and the SWV response of Cu2O/GCE was recorded under the optimized conditions. For recovery, the stock solution of NH3 was quantitatively dropped and coated onto Cu2O/GCE, and the SWV scans of the various NH3/Cu2O/GCEs were recorded in drinking water samples adjusted with 0.1 M pH 7 phosphate buffer.

3. Results and Discussion

3.1. UV-Visible Spectra of Colloidal CuNPs

Figure 1 shows the absorption spectra obtained at different times and the color change due to the formation of colloidal CuNPs. In an aqueous solution, CuNPs exhibited a broad and strong absorption signal around ~428 nm, corresponding to the surface plasmon resonance (SPR) of CuNPs. Ascorbic acid treatment is responsible for the broadening of CuNP SPR accompanied by a blue shift, indicating the formation and growth of smaller well-dispersed CuNPs, as reported elsewhere [28].
The increase in absorbance was due to the continuous growth of CuNPs in aqueous solution. The absorbance reached a maximum at 120 min as there was no further change in the color or UV-Vis spectra witnessed indicating that Cu salt completely reduced into CuNPs. The time required to produce CuNPs is much less than reported in the literature [28]. The additional absorption peak at ~330 nm was assigned to the oxidation product of ascorbic acid according to the literature [28].

3.2. Surface Functional Group Analysis by FTIR

The provision of ascorbic acid in the Cu2O thin film formation on GCE was studied by FTIR. The typical IR spectrum of pure ascorbic acid is presented in Figure 2, where characteristic peaks appeared at 3021, 1775, 1664, 1329, and 1108 cm−1, respectively [29,39]. A group of peaks in the region 3216–3529 were unassigned and were due to the O-H stretches. The peak at 3021 cm−1 was assigned to the =C-H stretching vibrations. The C=O bond stretching was observed at 1775 cm−1, whereas the 1664 cm−1 vibrations belonged to the C=C. The stretching at 1329 cm−1 originated from the C-O-C functional group. The C-O-H bond probably contributed to the peak at 1108 cm−1. In the IR spectrum of Cu2O thin film (Figure 2), the peaks associated with C=O and C-O-H bonds disappeared.
Ascorbic acid fully oxidized into dehydroascorbic acid when CuNPs occurred in colloidal solution [40]. However, during Cu2O thin film formation, as the Cu0 reoxidized into Cu+1, it is highly likely that dehydroascorbic acid converted into semi-dehydroascorbic acid form [41,42,43]. This is inferred from the IR spectrum of Cu2O/GCE, as the peak correlated with C=C and C-O-C remained but shifted to a lower wavenumber due to the significant delocalization of conjugated C=C bonds. Moreover, the peak at 600 cm−1 can be assigned to the vibrations of the Cu-O bond [44]. Considerable differences in the IR spectra provided clear evidence of the presence and aiding of ascorbic acid in the Cu2O thin film formation on GCE.

3.3. X-ray Diffraction Pattern of Cu2O/GCE

The crystal structure of Cu2O thin film on GCE was studied by XRD. The obtained XRD pattern of Cu2O/GCE is presented in Figure 3, where the peaks at 30.6°, 37.4°, 42.6°, 61.4°, and 72.4° corresponded to the 110, 111, 200, 220, and 311 planes of cuprite, indicating the crystalline nature of Cu2O thin film formed on GCE. The observed peak positions were well-matched with JCPDS# 05-0667, confirming the presence of body-centered cubic (bcc) Cu2O on the surface of GCE as a thin film [29,45,46]. The XRD spectrum indicated that peaks indexed to Cu2O were dominated in the spectrum, ruling out the presence of CuO in the film formed on the surface of GCE. The peaks indicated by -asterisk in the spectrum were due to the ascorbic acid adduct [47] and showed polycrystalline behavior, which is necessary and favorable in integrating Cu2O as a thin film on the surface of GCE.

3.4. XPS Analysis

The structure of the Cu2O thin film formed on GCE was further investigated by XPS. The obtained high-resolution XPS spectra are illustrated in Figure 4, where the symmetrical peak related to Cu2p1/2 appeared at ~952.9 eV with no or minimal satellite formation, suggesting that the film was primarily composed of Cu2O. The Cu2p3/2 corresponding to Cu+ in Cu2O after fitting was observed at 932.8 eV [48,49]. Furthermore, the peak located at 530.15 consisted of the signature of O1s peak of Cu2O based on literature interpretations. Thus, both XRD and XPS analysis showed no evidence of the presence of Cu2+ in the film.

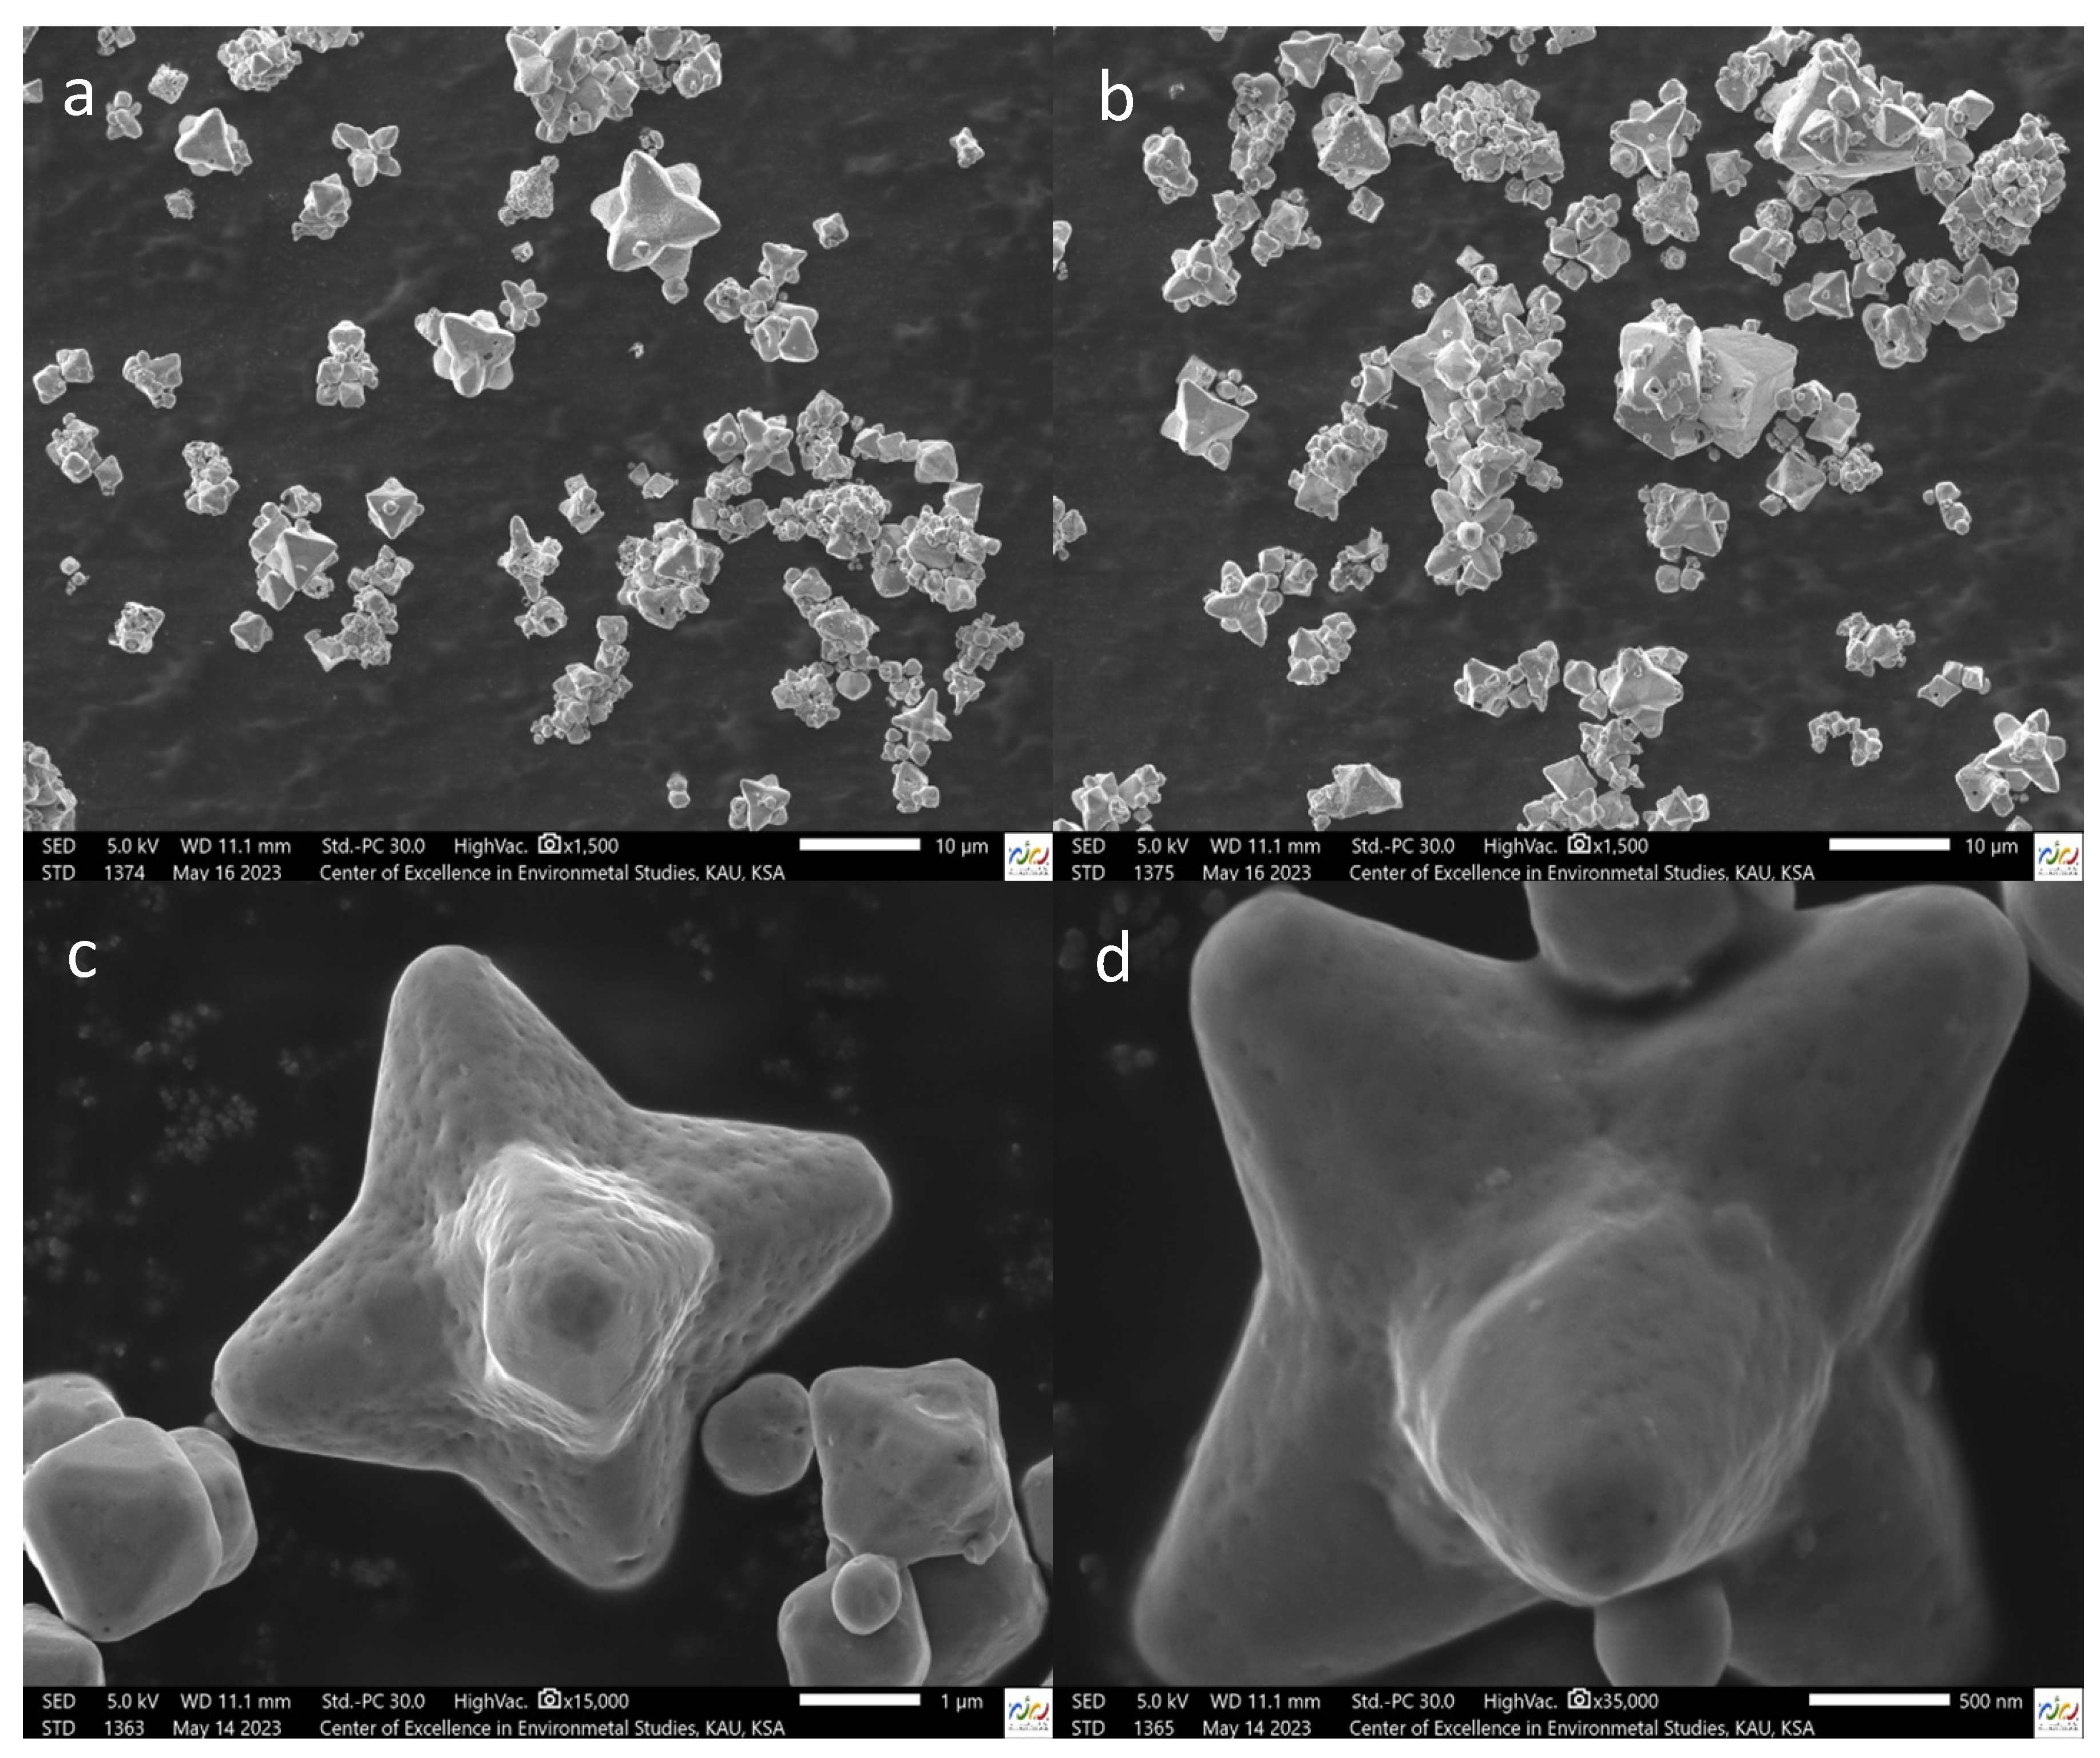
3.5. Morphology of Cu2O on GCE

The morphology of Cu2O spread on the surface of GCE was characterized by SEM analysis. Figure 5a–d shows the SEM images of Cu2O/GCE at different magnifications, where the presence of a micron-sized hexapod was evident on Cu2O/GCE [50,51,52]. For comparison, an SEM image of bare GCE is provided in Figure S1 (Supplementary Information), where no particles were observed. In Figure 5a,b, images at 1500× magnification show that hexapod Cu2O with different growth stages, i.e., long- and short-leg-sized particles, were substantially populated on the surface of GCE. CuNPs were prone to oxidation in the air. When spread on GCE as a thin film, under controlled heat treatment at 60 °C, CuNPs mainly transformed into the Cu2O phase because CuO formation was reported at an even higher temperature >250 °C [37,38]. The controlled heat treatment also affected the size and morphology of the CuNP film and, upon reaction with oxygen, the micron-sized Cu2O with a characteristic hexapod morphology was formed on the surface of GCE, as confirmed by XRD and XPS analysis. Thus, the thermal treatment of colloidal CuNPs spread on the surface of GCE is a novel and simple way to produce hexapod Cu2O as a thin film. Higher magnification (Figure 5c,d) revealed that the larger hexapods appeared to be formed by an aggregation of smaller particles. Also, the smooth faces of larger hexapods were the result of the steady growth and surface reconstruction. Alongside the area coverage by the Cu2O hexapod, which improved the current response of the modified electrode, the exposed facets of Cu2O were also reported to play an important role in defining the electrochemical performance of the modified electrode [50]. As a result, due to the excellent conductivity of Cu2O hexapods and their affinity towards copper-ammonia complex formation, the highly sensitive detection of NH3 on Cu2O/GCE was expected.

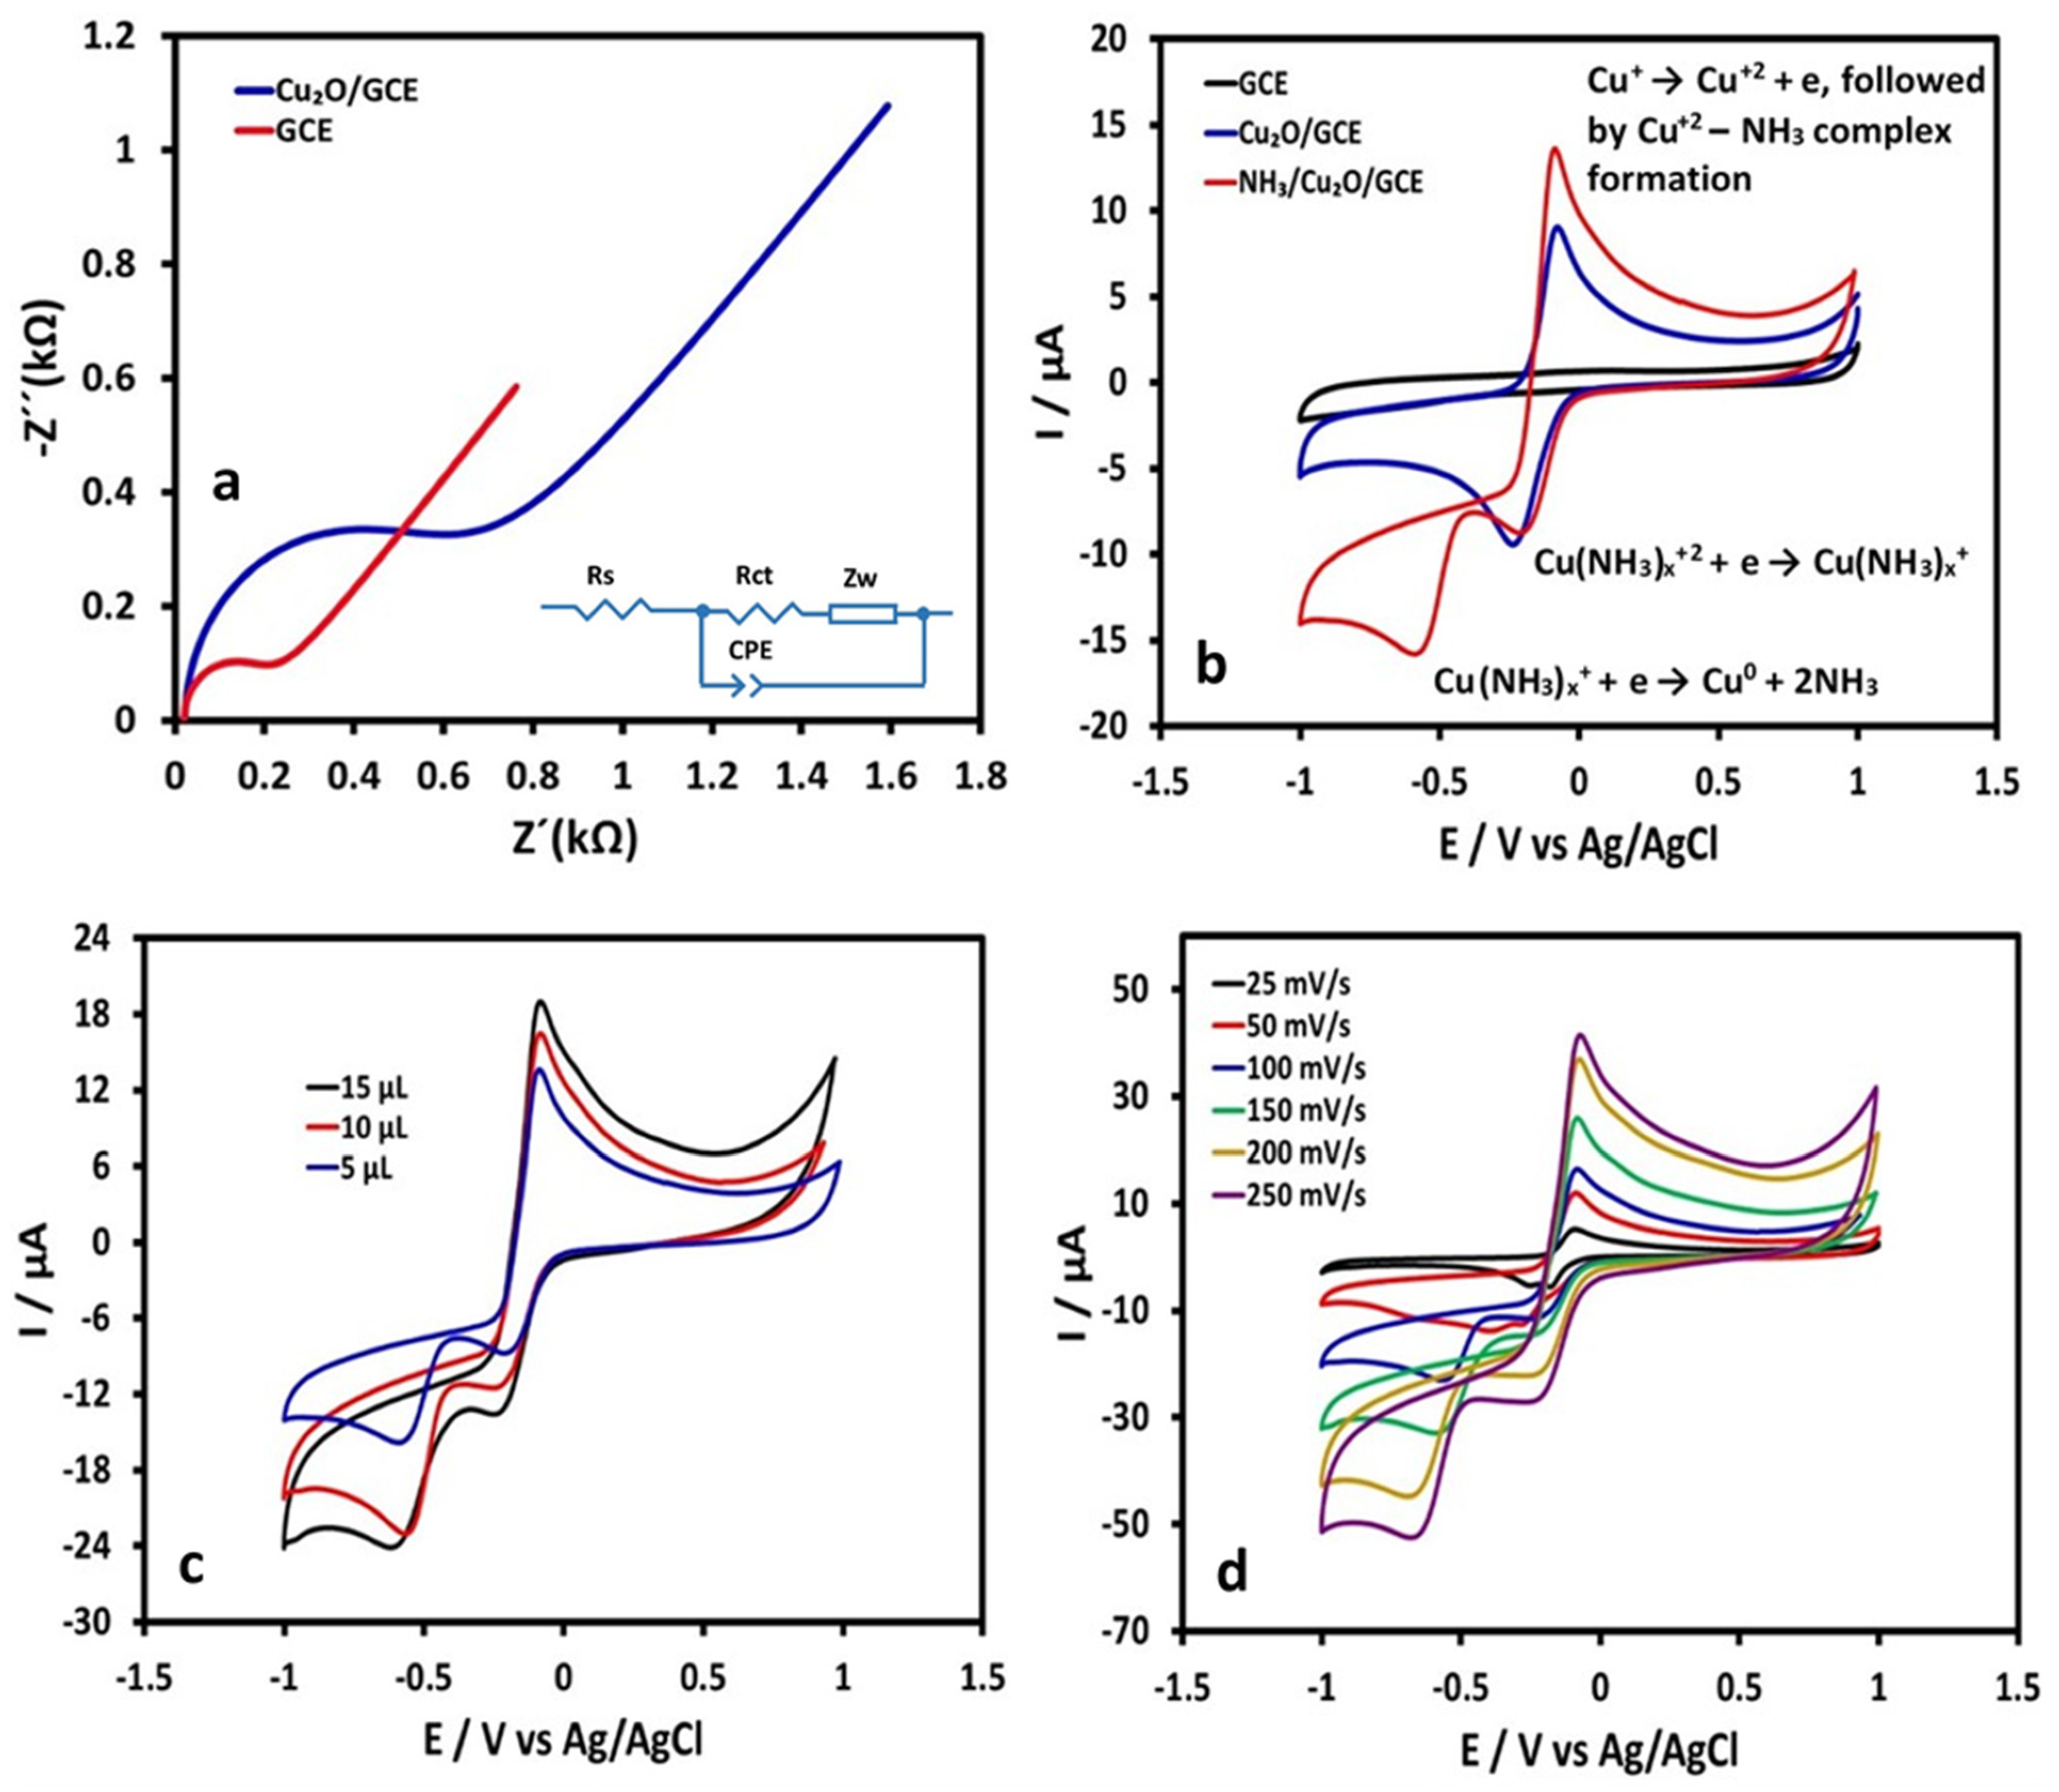
3.6. EIS Analysis of GCE and Cu2O/GCE

The EIS analysis of GCE and Cu2O/GCE was performed to evaluate the changes in the interfacial charge transfer resistance of the modified electrode. EIS in the form of a Nyquist plot features a semicircle in the higher frequency region corresponding to the electron-transfer-limited process and a straight light at the lower frequency region, which is due to a diffusion-limited process [53,54]. A Nyquist plot is typically used to distinguish between the successful modification, and the interpretation of the Nyquist plot relies on Randle’s equivalent circuit model, where Rct is the surface resistance of the modified electrode, Cdl is the capacitance of the electrical double layer, Rs is the solution resistance, and Zw is the Warburg impedance of a diagonal line. The Nyquist plots of GCE and Cu2O/GCE are presented in Figure 6a, where Cu2O/GCE exhibited a distinctly larger semicircle compared to GCE, which is probably due to the presence of negatively charged functional groups at the modified electrode surface that hindered the electron transfer reaction between the Cu2O/GCE and redox marker (Fe(CN6)3−/4−). The interactions, either attractive or repulsive, between the modified material at the surface of GCE and (Fe(CN6)3−/4−) were estimated on the basis of the comparison of the magnitude of the semicircular region in the impedance measurements. The attractive interactions are due to the surface positive charges, whereas the negative entities such as surface oxygen groups generate the repulsive influence under the applied biased conditions. The expanded semicircular region for the modified electrode compared to bare GCE is indicative of such interactions. When Cu2O/GCE was investigated against (Fe(CN6)3−/4−), a distinctly larger semicircle was observed than for GCE, which is due to the repulsion between the oxygen functional groups at the modified surface and (Fe(CN6)3−/4−), thus elaborating the higher charger transfer activity or conductivity compared to the bare electrode [53,55]. Thus, the charger transfer activity of the GCE was greatly improved after being modified with Cu2O. Moreover, this significant increase in charge transfer resistance successfully advocates the entire surface coverage of GCE by Cu2O thin film. The increase in the Warburg impedance for the Cu2O/GCE was also concurrent with the decrease in the diffusion rate.

3.7. CV Analysis of GCE and Cu2O/GCE

Figure 6b represents the CV (black curve) obtained for GCE in 0.1 M pH 7 phosphate buffer with and without NH3 (1 mM) casting on the electrode surface. The CV scans were initiated at all of the times at OCV to a vertex potential (E1) +1.0 V. The cathodic sweep was recorded from +1.0 V to −1.0 V and the anodic sweep was recorded from −1.0 V to +1.0 V. There was no clear redox peak at GCE, which indicated that the oxidation or reduction reaction of NH3 did not take place at GCE in the investigated potential window. Subsequently, the CV of Cu2O/GCE was researched (without the presence of NH3 on the surface, blue curve) in 0.1 M pH 7 phosphate buffer by starting at OCV until +1.0 V and sweeping from positive to negative potentials (reduction) with a scan rate of 100 mV/s followed by the anodic sweep (oxidation) in the reverse direction (Figure S2, Supplementary Information). As the aim of the present work is the formation and properties of Cu2O thin film on GCE, only the potential range from +1.0 V to −1.0 V was scanned, which did not allow the formation of a passive layer. In the first anodic scan, from OCV until +1.0 V, the oxidation peak at ~+0.006 was due to the oxidation of Cu2O into CuO. The cathodic scan of Cu2O/GCE was characterized by a well-shaped reduction peak at ~−0.23 V, assigned to CuO conversion into Cu2O [45,56,57,58]. It might be speculated that, at a sufficiently positive potential, all of the Cu2O was converted to CuO, whereas it subsequently reduced to Cu2O during the cathodic scan. The reduction of CuO was immediately followed by the reduction of Cu2O into metallic copper (Cu) and, characteristically, the peak position of the second reduction was more negative as per literature interpretations [36,59]; however, in phosphate buffer medium, a second reduction peak was not observed. While, in the anodic scan, the oxidation of deposited Cu should produce two peaks; however, the oxidation of deposited Cu at the interface was not limited by diffusion, so most of the Cu appeared as Cu2O at the interface and, upon reverting the potential sweep in the positive direction, only one oxidation peak (~−0.07) was observed due to Cu2O converting into CuO in the form of a well-defined semi-reversible peak. Thus, affected by the electrolyte medium, the reduction peak was due to the electrode reductions of both CuO and Cu2O and the oxidation peak was due to the oxidation of Cu2O formed at the interface. Moreover, as the surface area of the oxidation peak was comparable to the reduction peak, it was supposed that all the Cu2O was reversibly reduced into CuO. Thus, the CV results also supported the XRD and XPS interpretations of the presence of Cu2O thin film on the surface of GCE. The appearance of only oxidation and reduction associated with Cu2O might be useful in the electrocatalytic detection of NH3 in the phosphate buffer electrolyte. Thus, thermally converted Cu2O thin film enhanced the electrocatalytic activity of the GCE in a phosphate buffer medium.

3.8. CV Analysis of NH3/Cu2O/GCE

The Cu2O/GCE was then covered with 10 µL of 1 mM NH3 by drop coating and investigated in 0.1 M pH 7 phosphate buffer under the same CV conditions. The CV curve started from OCV and scanned between +1.0 V and −1.0 V is presented in Figure S2 (Supplementary Information). Under corresponding experimental conditions, however, in the presence of NH3 over Cu2O/GCE, the CV curve differed from the preceding. The presence of NH3 on the modified electrode surface ensured the complex formation between CuO and NH3 when scanning reached +1.0 V [26,27]. This assumption is based on the possibility that NH3 chemically reacts with CuO after it is formed [26,27,60]. The NH3 covering favors the direct interaction between CuO and NH3 and favors the electron transfer. However, an additional oxidation peak at +0.4 V (Figure S2, Supplementary Information) in the first anodic scan from OCV until +1.0 V may also be associated with the copper-ammonia complex formation. As was likely, it was found that by providing the same CV conditions, the NH3/Cu2O/GCE exhibited two reduction peaks in the cathodic scan and one oxidation peak in the reverse direction (Figure 6b, red curve). The anodic peak was more or less at the same potential value, however, the appearance of two reduction peaks at ~−0.57 and at ~−0.19, one small and one sharp, probably indicates the formation of a copper-ammonia complex. Different from the CV analysis of Cu2O/GCE, the second reduction peak appeared at a more negative potential and was well separated from the first peak; therefore, it was chosen for the quantification of NH3. The same has been reported elsewhere [26,27,60], in that the oxidation of Cu2O in ammoniacal solution most likely went through the formation of the copper-ammonia complex and rather directly proceeded to form a passive layer, which subsequently reduced the electrocatalytic activity of the modified electrode. Since the NH3/Cu2O/GCE was exposed to the same experimental conditions as the Cu2O/GCE, the consideration that the second reduction peak could arise due to the dissolution of the Cu2O thin film was ruled out, but was due to the dissolution of NH3. As a result, in the presence of NH3, the anodic peak formed at ~−0.07 represented the oxidation of Cu2O into CuO and the subsequent copper-ammonia complex formation according to the following equation,
CuO + xNH3 + 2H+  → Cu(NH3)x+2 + H2O
In the reverse scan, the produced copper-ammine complex underwent two reductions according to the following reactions,
Cu(NH3)x+2 + e → Cu(NH3)x+1
Cu(NH3)x+1 + e → Cu0 + xNH3
The first reaction was due to the reduction of the Cu(II)-ammonia complex into the Cu(I)-ammonia complex, whereas the second reaction represented the subsequent reduction of the Cu(I)-ammonia complex into Cu in a phosphate buffer medium. It can be further explained that, in the more positive potential, the reacting copper-ammine species were formed by complexation, and when the reverse bias was employed, the copper-ammine species depleted by two successive reductions into Cu. The second cathodic peak appeared due to the reaction of NH3 with the Cu2O thin film; thus, by examining the various CV effects on the second cathodic peak, the electrochemical detection of NH3 was viable. Additionally, as the copper-ammonia complex formed at the modified electrode surface in a tiny amount, therefore, the exact coordination number of ammonia was uncertain.

3.9. Effect of Cu2O Amount

The thickness of Cu2O thin film is an important parameter to quantify the NH3 [53]. The CVs of 1 mM NH3 with three different thicknesses of Cu2O thin film on GCE are presented in Figure 6c. As can be seen, by increasing the film thickness, the oxidation and reduction peak currents were also increased; however, the second reduction peak was eventually more affected. An insignificant change in the redox peaks associated with Cu2O indicated these peaks were insensitive toward the presence of NH3. Considering the second cathodic peak, at first, the current drastically increased from 5 µL to 10 µL and then approximately remained at the same intensity with a further increase in the film thickness. This phenomenon was caused by the presence of NH3 on the surface of Cu2O/GCE and indicated that the complex formation between CuO and NH3 was adsorption-controlled due to the high concentration of Cu2O. However, the further increase in the intensity of the second cathodic peak with an increase in the Cu2O film thickness was not observed because of the saturation. Thus, the changes in the second reduction peak current, caused by copper-ammonia complex reduction, were distinguishable due to different amounts of Cu2O on GCE. Based on the above results, a 10-µL coating of CuNPs was chosen as the optimal value.

3.10. Effect of the Scan Rate

The effects of the scanning rate on the reduction of the copper-ammonia complex were studied. The NH3/Cu2O/GCE was prepared by first depositing 10 µL of CuNPs followed by thermal treatment, and then 10 µL of 1 mM NH3. Since the second cathodic peak originated from the complex formation between CuO and NH3, this peak can be directly related to the presence of NH3. The current of the second cathodic peak increased with the increase in the scan rate and was accompanied by a slight shift (Figure 6d) in the peak potential to the more negative direction due to the irreversible nature of the copper-ammonia reduction process. The peak current versus the scan rate is shown in Figure 7a, where a straight line with a correlation coefficient of 0.9941 also indicates the formation and reduction of the copper-ammonia complex were controlled by the adsorption process [34,49]. In Figure 7b, a plot of the logarithm of the peak current versus the logarithm of the scan rate is shown. The relationship was found to be linear with a slope of 0.97, which is far from the theoretical value of 0.5, suggesting that the detection of NH3 is an adsorption-controlled rather than a diffusion-controlled process.

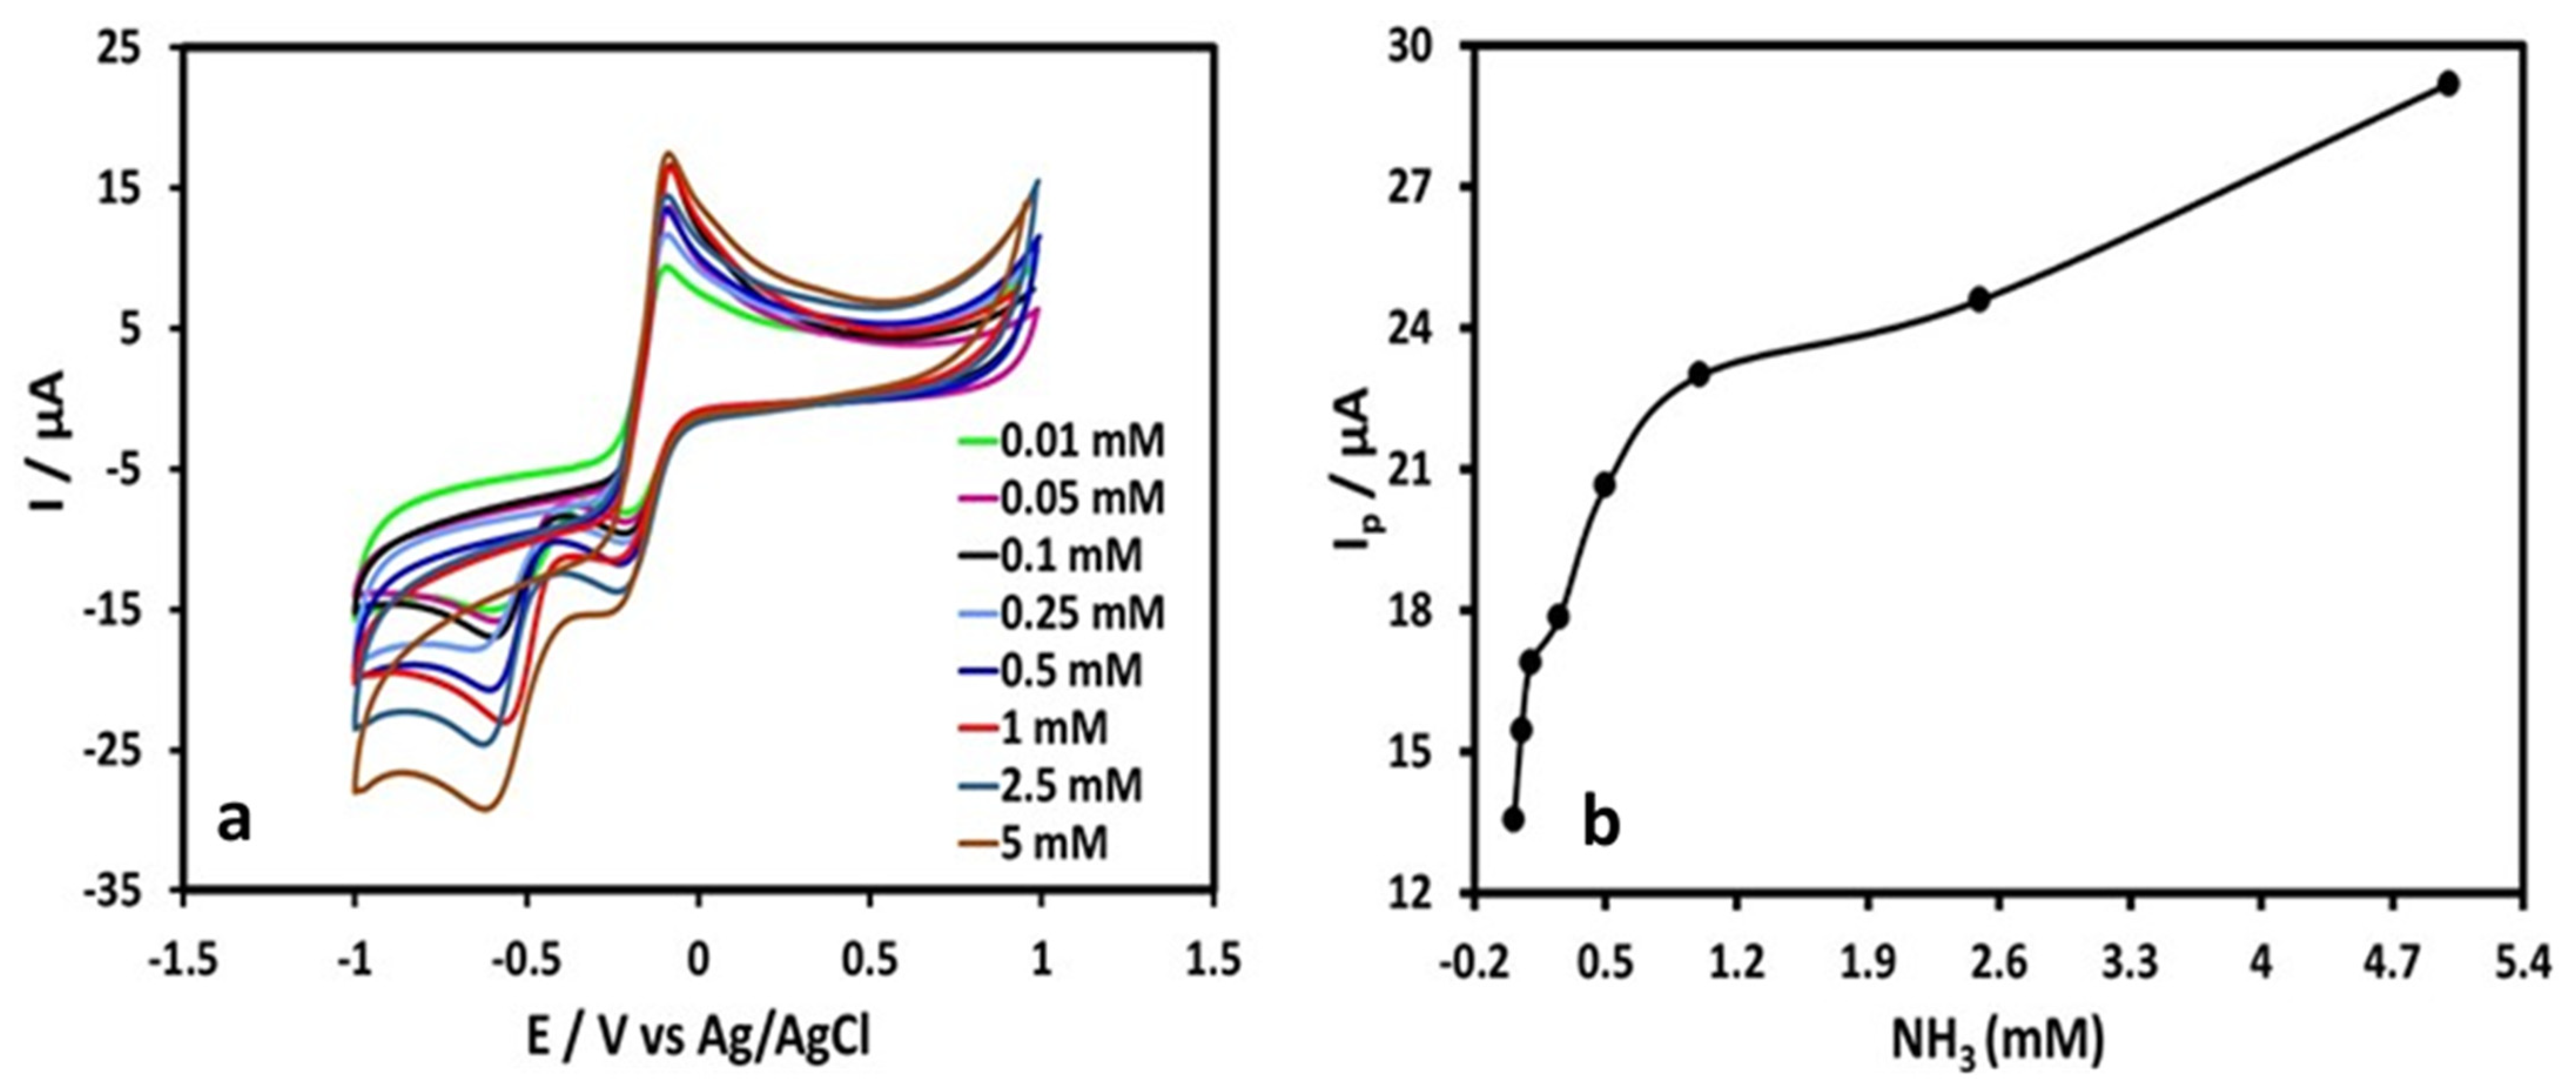
3.11. Effect of NH3 Concentration

Figure 8a shows the CVs of Cu2O/GCE with different concentrations of NH3 coated on it. The CVs were recorded under the same experimental conditions in 0.1 M pH 7 phosphate buffer and the concentrations of NH3 were 0.01, 0.05, 0.1, 0.25, 0.5, 1, 2.5, and 5 mM, respectively. The current of the second cathodic peak significantly increased with the increasing concentration of NH3. In Figure 8b, the reduction peak current as a function of the concentration of NH3 is plotted. It was observed that the reduction peak current rapidly increased at low concentrations, followed by a gradual increase at high concentrations. This phenomenon is also attributable to the adsorption of NH3 on the surface of Cu2O/GCE [54].

3.12. Effect of Changing the Vertex Potential

Further insights regarding the reduction of the copper-ammonia complex were extracted by inspecting the role of the vertex potential [36,59]. Figure 9a elaborates on the CV fetched by starting at OCV and sweeping between +0.2 V–−0.1 V. As discussed above, at a sufficiently positive potential, the majority of Cu2O was oxidized into CuO, thus providing less positive E1 potential. However, the appearance of two reduction peaks suggested that the copper-ammonia complex was successfully formed at such potential bias. The oxidation peak, which was due to the oxidation of interfacial Cu2O, was slightly shifted toward a more positive potential and the associated cathodic peak appeared depressed, whereas the second cathodic peak was broad and higher in intensity, as compared to Figure 6c. Thus, a vertex potential less positive than +1.0 V also consisted of two reduction peaks and one oxidation peak, which suggested the utilization of a positive potential of less than +1.0 V may also be exploited in the detection of NH3 over the Cu2O/GCE.
In another potential bias (Figure 9b), from −0.4 V to +1.0 V, there was an oxidation peak that appeared due to the oxidation of Cu2O to CuO, and an associated reduction peak was observed. In Figure S3 (Supplementary Information), the CV initiated at OCV with the first vertex potential was the same as in Figure 6b; however, the negative vertex potential was fixed at −0.4 V. The depressed reduction peak was due to the reduction of CuO into Cu2O and, at a potential more negative than this, the deposition of Cu was possible. This means that, while reversing the scan from −0.4 V, there should be no oxidation peak, as the deposition of Cu was not undertaken. However, the appearance of a sharp and well-shaped oxidation peak established our assumption that the oxidation peak was due to the conversion of interfacial Cu2O into CuO and not due to Cu deposited at the electrode surface limited by adsorption. These observations illustrate the importance of the changing vertex potentials that may notably affect the detection procedure.

3.13. Effect of the Supporting Electrolyte

The detection of NH3 using the Cu2O/GCE in two more neutral pH-supporting electrolyte solutions, such as 0.1 M KCl and 0.1 M Na2SO4, was tested. In both of the supporting electrolyte solutions, the CV with 10 µL of 1 mM NH3-coated Cu2O/GCE exhibited distinctly strong oxidation behavior, but no single reduction peak was witnessed (Figure 10a). The significant increase in the intensity of the oxidation peak current suggested that the electrodeposition of Cu during the cathodic sweep was significant as a result of a huge oxidation peak due to the anodic stripping of Cu observed in both KCl and Na2SO4. No reduction peak was observed; thus, one thing was apparent, the copper-ammonia complex did not take place in these supporting electrolyte solutions, therefore, the pH 7 phosphate buffer was the ideal choice for the detection of NH3.

3.14. Effect of pH

The pH study of NH3/Cu2O/GCE was carried out in the range of 4–10, and the obtained CVs are shown in Figure 10b. Due to the deposition of Cu at pH 4 and 5 during the cathodic sweep, the formed thin film was not stable, and resulted in a huge oxidation peak, as reported in the literature [26,45]. In other words, the copper-ammonia complex formation may take place in a neutral or basic medium. As can be seen, from within the pH range 6–10, under optimal conditions, the NH3/Cu2O/GCE resulted in typical CV curves with three distinct redox peaks. The peak current versus pH plot in Figure 10c showed a gradual increase in the reduction current of the second cathodic peak from 6 to 7, while at pH 8 and 9, the current remained stable and then increased again at pH 10. These findings suggest the electrochemical detection of NH3 at pH 7 or higher. So, for neutrality, pH 7 was preferred for further studies. Moreover, the peak potential versus pH plot (Figure 10d) displays a cathodic shift in the reduction peak potential of the second peak, which indicates the participation of protons in the reduction process of the copper-ammonia complex.

3.15. Effect of SWV Parameters

For the optimum detection of NH3 in 0.1 M pH 7 phosphate buffer, the SWV response of the prepared NH3/Cu2O/GCE was recorded. The SWV signal may be influenced by the variation in pulse amplitude, frequency, and step potential [53,54]. All three parameters are crucial for obtaining a sensitive SWV signal; therefore, the optimization of these parameters was performed, and the results are presented in Table 1. At first, the pulse amplitude was varied by keeping the other two parameters constant. The peak current increased with the increase in the pulse amplitude from 25 mV to 50 mV, followed by a gradual decrease. The maximum peak current observed at 50 mV was therefore chosen as the optimum value. The variation in the peak current with changing frequency reached the maximum at 50 ms; afterward, the peak shape was distorted and broad. The increase in the step potential resulted in a gradual increase in the peak current; however, the smooth and well-shaped SWV signal was observed at −10 mV. Thus, a 50 mV pulse amplitude, 50 ms frequency, and a −10 mV step potential were chosen as the optimum values for SWV investigations.

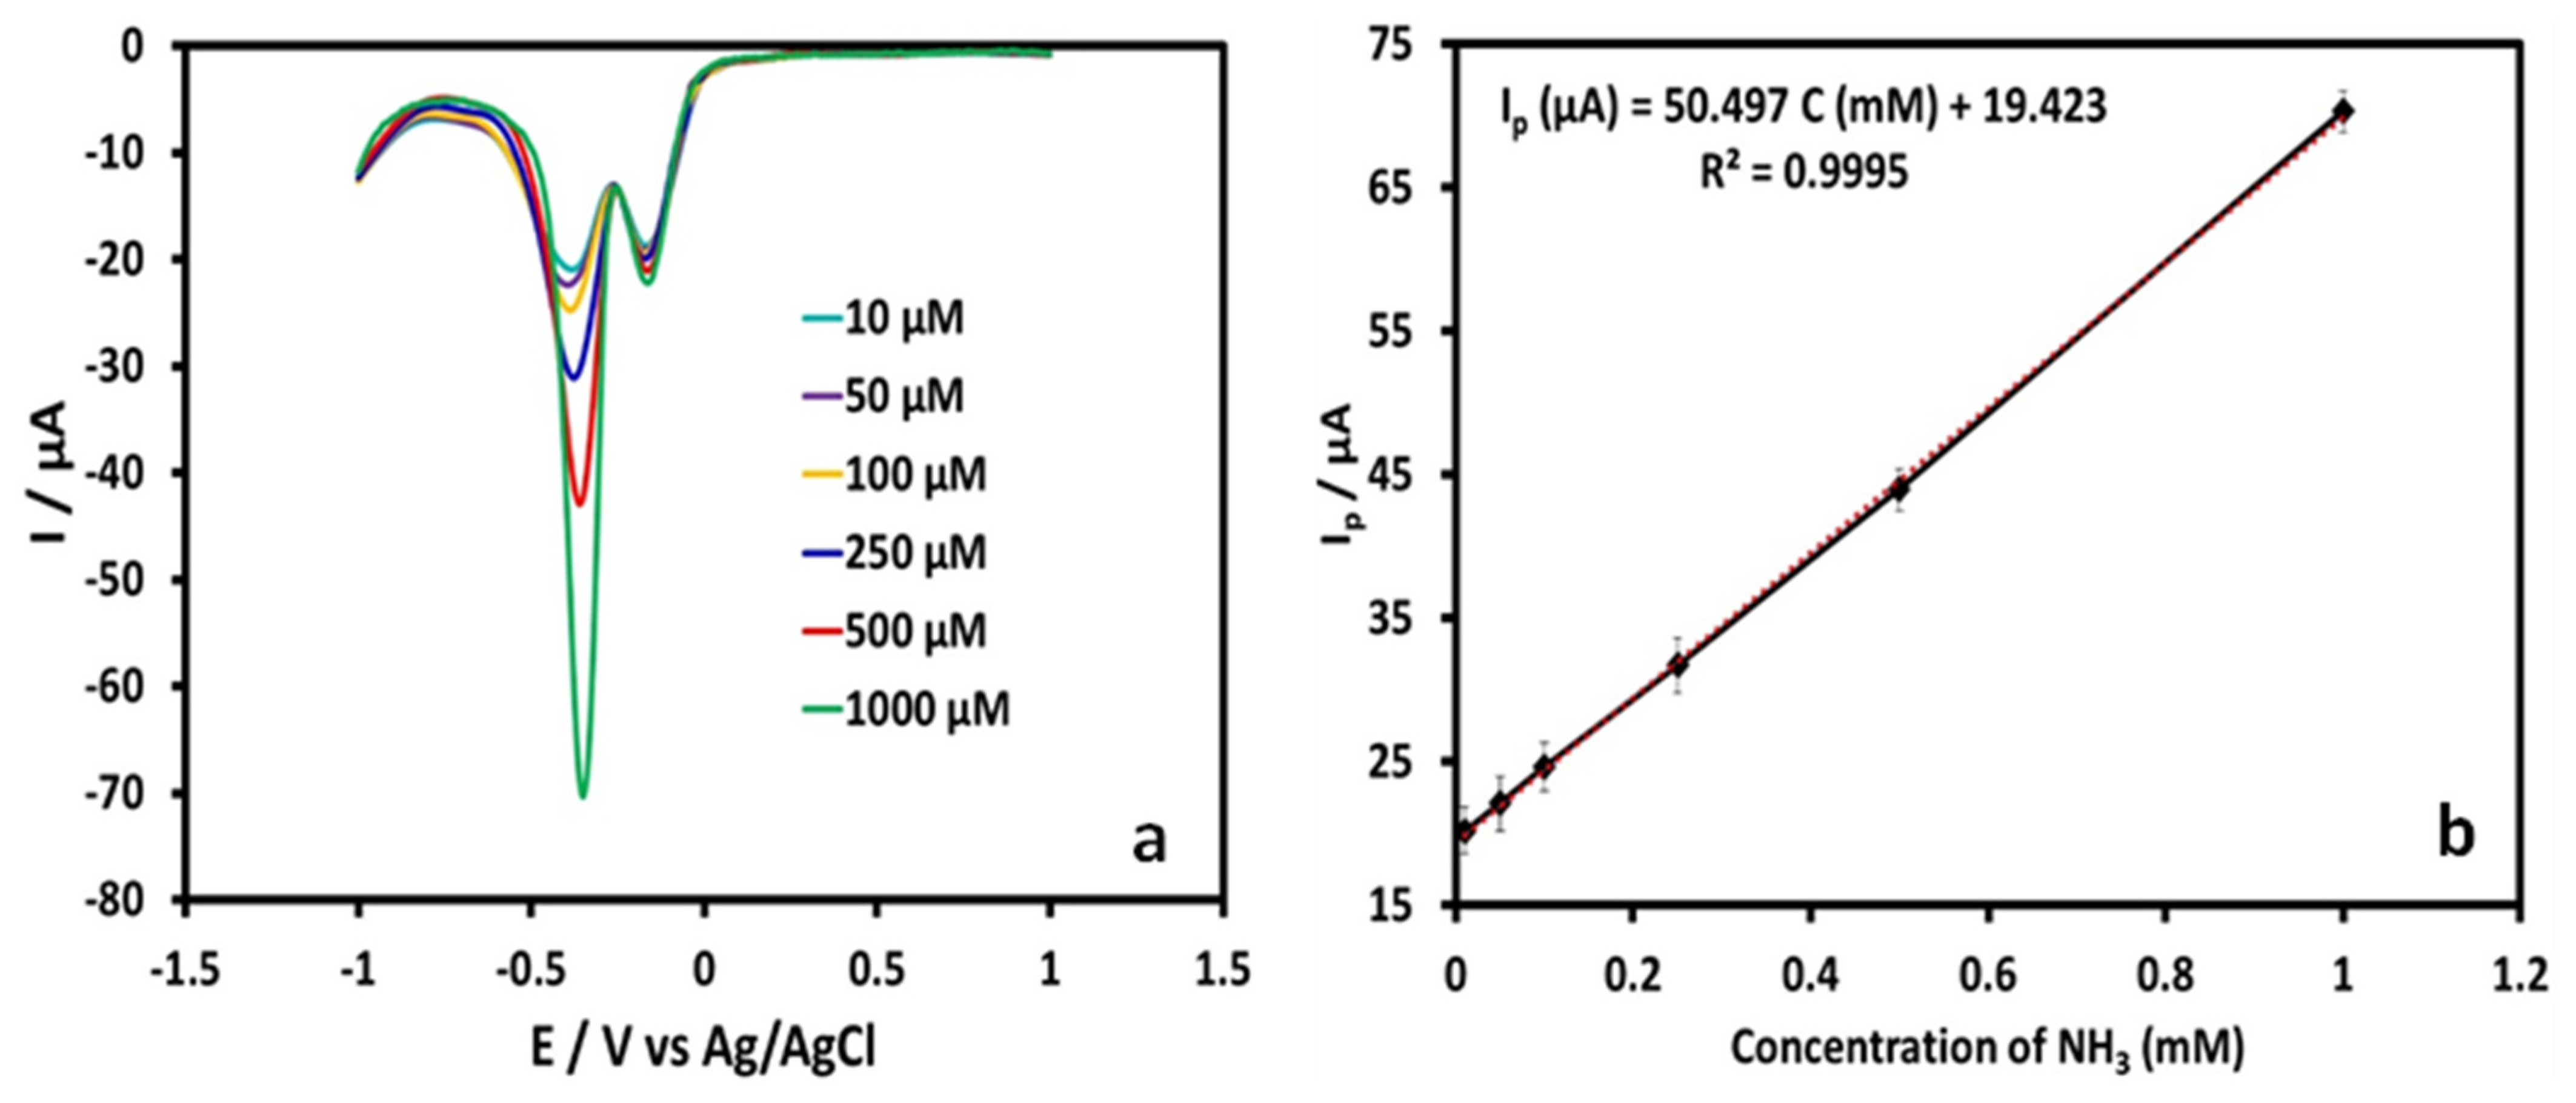
3.16. Analytical Response

The SWV analysis of NH3/Cu2O/GCE showed a strong signal under optimum conditions. Figure 11a shows the SWVs of Cu2O/GCE with different NH3 concentrations in the range of 10 µM to 1000 µM. Well-defined peaks proportional to the concentration of NH3 were observed. The linear regression equation (Figure 11b) was Ip (µA) = 50.497 C (µM) + 19.423 (R2 = 0.9995) with a detection limit (3.3 × standard deviation of blank/slope) of 6.23 µM determined at a single to noise ratio of 3, which was commensurate with the so far reported with a MWCNT/Cu nanocomposite paste electrode [17], considering the present work based on the NH3 surface modification, and enabled the quick on-site testing of NH3 in environmental samples. The sensor fabrication steps, as well as the detection medium, are important parameters to consider while developing an electrochemical sensor. As described in Table 2, though sensitive, most of the fabricated electrodes for NH3 detection had complex structures that limited their widespread use and detected NH3 through oxidation in very alkaline solutions. In comparison, the fabrication of NH3/Cu2O/GCE was a two-step procedure and detection was unique in a neutral medium, which can easily be combined with disposable SPCE (screen-printed carbon paste electrode) for the portable detection of NH3.
The repeatability variation coefficients calculated as relative standard deviations (RSD) at two concentrations, such as 50 µM and 500 µM, were 3.1% and 2.6%, displaying a good repeatability of the modified electrode. The reproducibility variation coefficients, also estimated at these concentrations using three separately fabricated NH3/Cu2O/GCE, were 2.1% and 2.9%, respectively, demonstrating excellent fabrication reproducibility. Also, the influence of interfering species was investigated. The Cu2O thin film structure stability was investigated by performing two successive CV scans of the same modification. The results are provided in Figure S4, Supplementary Information. The successive scans showed the same characteristic peaks, two reductions, and one oxidation. The oxidation and first reduction peaks were due to the Cu2O/CuO couple and were mainly unaffected. This also means that the Cu2O thin film structure was still intact, however, the second reduction peak was drastically depressed and decreased in intensity because most of the NH3 was removed from the modified surface by dissolution and went into the solution, and because the copper-ammonia complex reduction is limited by the adsorption, the decrease in peak intensity was rational. Therefore, it was preferred to freshly prepare NH3/Cu2O/GCE for each measurement because the detection of NH3 relied on the first cathodic scan. The ions used were K+, Na+, Zn2+, Ca2+, Cu2+, SO4−2, Cl, NO2, and NO3. Virtually no interfering effects were observed for anions. The reason for this was due to the negatively functionalized surface of NH3/Cu2O/GCE, which repelled the anions. However, Zn2+ and Cu2+ faintly influenced the SWV single due to its affinity toward NH3.

3.17. NH3 Recovery

The recovery of NH3 was demonstrated in the drinking water sample. The pH of the real sample solution was maintained at pH 7. First, no second cathodic peak was observed when Cu2O/GCE was immersed in the real sample solution and the SWV signal was acquired under the optimized conditions. Subsequently, an amount of stock NH3 solution was drop-coated on the Cu2O/GCE surface, and recovery of the added NH3 was observed to be good for three determinations. The results are summarized in Table 3 and imply that the fabricated NH3/Cu2O/GCE was capable of NH3 determination in real drinking water samples.

4. Conclusions

The simple, intelligent, fast, and portable electrochemical detection of NH3 by drop coating on Cu2O/GCE was successfully demonstrated in a neutral medium. The detection was based on the chemical complexation between CuO and NH3 at the modified electrode surface and its subsequent reduction in the reverse direction. The fabrication of Cu2O/GCE followed by NH3 covering was also very simple. The approach is more promising and reliable than the usual detection of NH3 and could benefit the on-site detection of NH3 by utilizing disposable carbon electrodes and portable electrochemical instruments.

Supplementary Materials

The following supporting information can be downloaded at: https://www.mdpi.com/article/10.3390/surfaces6040029/s1, Figure S1. SEM image of bare GCE; Figure S2. CV curves of Cu2O/GCE and NH3/Cu2O/GCE initiated at open circuit voltage to a vertex potential +1.0 V and end at +1.0 V; Figure S3. CV curves of NH3/Cu2O/GCE initiated at open circuit voltage to a vertex potential +1.0 V and end at +1.0 V. The second vertex potential was −0.4 V; Figure S4. Two successive CV curves of NH3/Cu2O/GCE initiated at open circuit voltage to a vertex potential +1.0 V and end at +1.0 V.

Author Contributions

S.A.K.: Conceptualization, Project Administration, Funding Acquisition. A.N.K.: Investigation, Conceptualization, Methodology, Supervision, Writing—original draft, Writing—review and editing. B.A.-J.: Investigation, Methodology, Software, Writing—original draft. L.A.T.: Investigation, Software. M.A.: Methodology, Software, Investigation. W.A.B.: Funding Acquisition, Methodology. A.H.: Methodology, Writing—review and editing. M.T.S.: Conceptualization, Project Administration, Investigation, Methodology, Supervision, Writing—original draft, Writing—review and editing. All authors have read and agreed to the published version of the manuscript.

Funding

This project was funded by the Deanship of Scientific Research (DSR) at King Abdulaziz University, Jeddah, under grant no. (G-652-247-38). The authors, therefore, acknowledge with thanks DSR for technical and financial support.

Data Availability Statement

Data will be made available on request.

Acknowledgments

The authors would like to acknowledge the Department of Chemistry and Center of Excellence in Environmental Studies, King Abdualziz University, and Ministry of Higher Education, Kingdom of Saudi Arabia, for providing the facilities to carry out this research work.

Conflicts of Interest

The authors declare that they have no known competing financial interests or personal relationships that could have appeared to influence the work reported in this paper.

References

  1. Buzzeo, M.C.; Giovanelli, D.; Lawrence, N.S.; Hardacre, C.; Seddon, K.R.; Compton, R.G. Elucidation of the Electrochemical Oxidation Pathway of Ammonia in Dimethylformamide and the Room Temperature Ionic Liquid, 1-Ethyl-3-methylimidazolium bis (trifluoromethylsulfonyl) imide. Electroanal. Int. J. Devoted Fundam. Pract. Asp. Electroanal. 2004, 16, 888–896. [Google Scholar] [CrossRef]
  2. Bhogadia, M.; Edgar, M.; Hunwin, K.; Page, G.; Grootveld, M. Detection and Quantification of Ammonia as the Ammonium Cation in Human Saliva by 1H NMR: A Promising Probe for Health Status Monitoring, with Special Reference to Cancer. Metabolites 2023, 13, 792. [Google Scholar] [CrossRef] [PubMed]
  3. Arya, S.; Riyas, M.; Sharma, A.; Singh, B.; Prerna Bandhoria, P.; Khan, S.; Bharti, V. Electrochemical detection of ammonia solution using tin oxide nanoparticles synthesized via sol–gel route. Appl. Phys. A 2018, 124, 1–7. [Google Scholar] [CrossRef]
  4. Zhao, Y.; Shi, R.; Bian, X.; Zhou, C.; Zhao, Y.; Zhang, S.; Wu, F.; Waterhouse, G.I.; Wu, L.Z.; Tung, C.H.; et al. Ammonia detection methods in photocatalytic and electrocatalytic experiments: How to improve the reliability of NH3 production rates? Adv. Sci. 2019, 6, 1802109. [Google Scholar] [CrossRef]
  5. Siribunbandal, P.; Kim, Y.H.; Osotchan, T.; Zhu, Z.; Jaisutti, R. Quantitative colorimetric detection of dissolved ammonia using polydiacetylene sensors enabled by machine learning classifiers. ACS Omega 2002, 7, 18714–18721. [Google Scholar] [CrossRef] [PubMed]
  6. Biswas, A.; Ghosh, B.; Dey, R.S. Refining the spectroscopic detection technique: A pivot in the electrochemical ammonia synthesis. Langmuir 2023, 39, 3810–3820. [Google Scholar] [CrossRef]
  7. Panchompoo, J.; Compton, R.G. Electrochemical detection of ammonia in aqueous solution using fluorescamine: A comparison of fluorometric versus voltammetric analysis. J. Electrochem. 2012, 18, 437. [Google Scholar]
  8. Khan, M.A.; Qazi, F.; Hussain, Z.; Idrees, M.U.; Soomro, S.; Soomro, S. Recent trends in electrochemical detection of NH3, H2S and NOx gases. Int. J. Electrochem. Sci. 2017, 12, 1711–1733. [Google Scholar] [CrossRef]
  9. Ji, X.; Banks, C.E.; Compton, R.G. The direct electrochemical oxidation of ammonia in propylene carbonate: A generic approach to amperometric gas sensors. Electroanal. Int. J. Devoted Fundam. Pract. Asp. Electroanal. 2006, 18, 449–455. [Google Scholar] [CrossRef]
  10. Ji, X.; Compton, R.G. Determination of ammonia based on the electrochemical oxidation of N, N′-diphenyl-1, 4-phenylenediamine in propylene carbonate. Anal. Sci. 2007, 23, 1317–1320. [Google Scholar] [CrossRef]
  11. Zolotov, S.A.; Vladimirova, E.V.; Dunaeva, A.A.; Shipulo, E.V.; Petrukhin, O.M.; Vatsuro, I.M.; Kovalev, V.V. Determination of the ammonium ion by voltammetry at the liquid-liquid interface using calixarenes as neutral carriers. Russ. J. Electrochem. 2014, 50, 940–946. [Google Scholar] [CrossRef]
  12. Oudenhoven, J.F.M.; Knoben, W.; Van Schaijk, R. Electrochemical detection of ammonia using a thin ionic liquid film as the electrolyte. Procedia Eng. 2015, 120, 983–986. [Google Scholar] [CrossRef]
  13. Vidal-Iglesias, F.J.; García-Aráez, N.; Montiel, V.; Feliu, J.M.; Aldaz, A. Selective electrocatalysis of ammonia oxidation on Pt (1 0 0) sites in alkaline medium. Electrochem. Commun. 2003, 5, 22–26. [Google Scholar] [CrossRef]
  14. Bunce, N.J.; Bejan, D. Mechanism of electrochemical oxidation of ammonia. Electrochim. Acta 2011, 56, 8085–8093. [Google Scholar] [CrossRef]
  15. Le Vot, S.; Roué, L.; Bélanger, D. Study of the electrochemical oxidation of ammonia on platinum in alkaline solution: Effect of electrodeposition potential on the activity of platinum. J. Electroanal. Chem. 2013, 691, 18–27. [Google Scholar] [CrossRef]
  16. De Mishima, B.L.; Lescano, D.; Holgado, T.M.; Mishima, H.T. Electrochemical oxidation of ammonia in alkaline solutions: Its application to an amperometric sensor. Electrochim. Acta 1998, 43, 395–404. [Google Scholar] [CrossRef]
  17. Valentini, F.; Biagiotti, V.; Lete, C.; Palleschi, G.; Wang, J. The electrochemical detection of ammonia in drinking water based on multi-walled carbon nanotube/copper nanoparticle composite paste electrodes. Sens. Actuators B Chem. 2007, 128, 326–333. [Google Scholar] [CrossRef]
  18. Din, M.I.; Rehan, R. Synthesis, characterization, and applications of copper nanoparticles. Anal. Lett. 2017, 50, 50–62. [Google Scholar] [CrossRef]
  19. Usman, M.S.; Ibrahim, N.A.; Shameli, K.; Zainuddin, N.; Yunus, W.M.Z.W. Copper nanoparticles mediated by chitosan: Synthesis and characterization via chemical methods. Molecules 2012, 17, 14928–14936. [Google Scholar] [CrossRef]
  20. Ramyadevi, J.; Jeyasubramanian, K.; Marikani, A.; Rajakumar, G.; Rahuman, A.A. Synthesis and antimicrobial activity of copper nanoparticles. Mater. Lett. 2012, 71, 114–116. [Google Scholar] [CrossRef]
  21. Gawande, M.B.; Goswami, A.; Felpin, F.X.; Asefa, T.; Huang, X.; Silva, R.; Zou, X.; Zboril, R.; Varma, R.S. Cu and Cu-based nanoparticles: Synthesis and applications in catalysis. Chem. Rev. 2016, 116, 3722–3811. [Google Scholar] [CrossRef] [PubMed]
  22. Kodasi, B.; Joshi, S.D.; Kamble, R.R.; Keri, R.S.; Bayannavar, P.K.; Nesaragi, A.R.; Dixit, S.; Vootla, S.K.; Metre, T.V. Cu microcrystals garnished with copper nanoparticles catalyzed one-pot facile synthesis of novel 1, 2, 3-triazoles via click chemistry as antifungal agents. Appl. Organomet. Chem. 2022, 36, e6664. [Google Scholar] [CrossRef]
  23. Kang, W.; Pei, X.; Bange, A.; Haynes, E.N.; Heineman, W.R.; Papautsky, I. Copper-based electrochemical sensor with palladium electrode for cathodic stripping voltammetry of manganese. Anal. Chem. 2014, 86, 12070–12077. [Google Scholar] [CrossRef] [PubMed]
  24. Lete, C.; Spinciu, A.M.; Alexandru, M.G.; Calderon Moreno, J.; Leau, S.A.; Marin, M.; Visinescu, D. Copper (II) oxide nanoparticles embedded within a PEDOT matrix for hydrogen peroxide electrochemical sensing. Sensors 2022, 22, 8252. [Google Scholar] [CrossRef] [PubMed]
  25. Bonthula, S.; Bonthula, S.R.; Pothu, R.; Srivastava, R.K.; Boddula, R.; Radwan, A.B.; Al-Qahtani, N. Recent Advances in Copper-Based Materials for Sustainable Environmental Applications. Sustain. Chem. 2023, 4, 246–271. [Google Scholar] [CrossRef]
  26. Grujicic, D.; Pesic, B. Reaction and nucleation mechanisms of copper electrodeposition from ammoniacal solutions on vitreous carbon. Electrochim. Acta 2005, 50, 4426–4443. [Google Scholar] [CrossRef]
  27. Zhybak, M.T.; Vagin, M.Y.; Beni, V.; Liu, X.; Dempsey, E.; Turner, A.P.; Korpan, Y.I. Direct detection of ammonium ion by means of oxygen electrocatalysis at a copper-polyaniline composite on a screen-printed electrode. Microchim. Acta 2016, 183, 1981–1987. [Google Scholar] [CrossRef]
  28. Xiong, J.; Wang, Y.; Xue, Q.; Wu, X. Synthesis of highly stable dispersions of nanosized copper particles using L-ascorbic acid. Green Chem. 2016, 13, 900–904. [Google Scholar] [CrossRef]
  29. Khan, A.; Rashid, A.; Younas, R.; Chong, R. A chemical reduction approach to the synthesis of copper nanoparticles. Int. Nano Lett. 2016, 6, 21–26. [Google Scholar] [CrossRef]
  30. Chandra, S.; Kumar, A.; Tomar, P.K. Synthesis and characterization of copper nanoparticles by reducing agent. J. Saudi Chem. Soc. 2014, 18, 149–153. [Google Scholar] [CrossRef]
  31. Shikha, J.A.I.N.; Ankita, J.A.I.N.; Kachhawah, P.; Devra, V. Synthesis and size control of copper nanoparticles and their catalytic application. Trans. Nonferrous Met. Soc. China 2015, 25, 3995–4000. [Google Scholar]
  32. Ali Soomro, R.; Tufail Hussain Sherazi, S.; Memon, N.; Raza Shah, M.; Hussain Kalwar, N.; Richard Hallam, K.; Shah, A. Synthesis of air stable copper nanoparticles and their use in catalysis. Adv. Mater. Lett. 2014, 5, 191–198. [Google Scholar] [CrossRef]
  33. Sood, A.; Arora, V.; Shah, J.; Kotnala, R.K.; Jain, T.K. Ascorbic acid-mediated synthesis and characterisation of iron oxide/gold core–shell nanoparticles. J. Exp. Nanosci. 2016, 11, 370–382. [Google Scholar] [CrossRef]
  34. Bashami, R.M.; Soomro, M.T.; Khan, A.N.; Aazam, E.S.; Ismail, I.M.; El-Shahawi, M.S. A highly conductive thin film composite based on silver nanoparticles and malic acid for selective electrochemical sensing of trichloroacetic acid. Anal. Chim. Acta 2018, 1036, 33–48. [Google Scholar] [CrossRef] [PubMed]
  35. Palomba, M.; Carotenuto, G.; Longo, A. A Brief Review: The Use of L-Ascorbic Acid as a Green Reducing Agent of Graphene Oxide. Materials 2022, 15, 6456. [Google Scholar] [CrossRef] [PubMed]
  36. Stojanov, L.; Rafailovska, A.; Jovanovski, V.; Mirceski, V. Electrochemistry of Copper in Polyacrylic Acid: The Electrode Mechanism and Analytical Application for Gaseous Hydrogen Peroxide Detection. J. Phys. Chem. C 2022, 126, 18313–18322. [Google Scholar] [CrossRef]
  37. Yabuki, A.; Tanaka, S. Oxidation behavior of copper nanoparticles at low temperature. Mater. Res. Bull. 2011, 46, 2323–2327. [Google Scholar] [CrossRef]
  38. Yoon, J.; Choi, D.J.; Kim, Y.H. Fabrication of CuO and Cu2O nanoparticles in a thick polyimide film by post heat treatment in a controlled-atmosphere. J. Nanosci. Nanotechnol. 2011, 11, 796–800. [Google Scholar] [CrossRef]
  39. Umer, A.; Naveed, S.; Ramzan, N.; Rafique, M.S.; Imran, M. A green method for the synthesis of copper nanoparticles using L-ascorbic acid. Matéria 2014, 19, 197–203. [Google Scholar] [CrossRef]
  40. Nguyen, V.T.; Trinh, K.S. In situ deposition of copper nanoparticles on polyethylene terephthalate filters and antibacterial testing against Escherichia coli and Salmonella enterica. Braz. J. Chem. Eng. 2020, 36, 1553–1560. [Google Scholar] [CrossRef]
  41. Kim, Y.; Kim, M.G. HPLC-UV method for the simultaneous determinations of ascorbic acid and dehydroascorbic acid in human plasma. Transl. Clin. Pharmacol. 2016, 24, 37–42. [Google Scholar] [CrossRef]
  42. Qi, F.; Huang, H.; Wang, M.; Rong, W.; Wang, J. Applications of antioxidants in dental procedures. Antioxidants 2022, 11, 2492. [Google Scholar] [CrossRef] [PubMed]
  43. Koliou, E.K.; Ioannou, P.V. Preparation of dehydro-L-ascorbic acid dimer by air oxidation of L-ascorbic acid in the presence of catalytic amounts of copper (II) acetate and pyridine. Carbohydr. Res. 2005, 340, 315–318. [Google Scholar] [CrossRef] [PubMed]
  44. Shafiey Dehaj, M.; Zamani Mohiabadi, M. Experimental study of water-based CuO nanofluid flow in heat pipe solar collector. J. Therm. Anal. Calorim. 2019, 137, 2061–2072. [Google Scholar] [CrossRef]
  45. Zhang, Z.; Wang, P. Highly stable copper oxide composite as an effective photocathode for water splitting via a facile electrochemical synthesis strategy. J. Mater. Chem. 2012, 22, 2456–2464. [Google Scholar] [CrossRef]
  46. Sudha, V.; Murugadoss, G.; Thangamuthu, R. Structural and morphological tuning of Cu-based metal oxide nanoparticles by a facile chemical method and highly electrochemical sensing of sulphite. Sci. Rep. 2021, 11, 3413. [Google Scholar] [CrossRef]
  47. Kader, D.A.; Rashid, S.O.; Omer, K.M. Green nanocomposite: Fabrication, characterization, and photocatalytic application of vitamin C adduct-conjugated ZnO nanoparticles. RSC Adv. 2023, 13, 9963–9977. [Google Scholar] [CrossRef]
  48. Li, J.; Mei, Z.; Liu, L.; Liang, H.; Azarov, A.; Kuznetsov, A.; Liu, Y.; Ji, A.; Meng, Q.; Du, X. Probing defects in nitrogen-doped Cu2O. Sci. Rep. 2014, 4, 7240. [Google Scholar] [CrossRef]
  49. Zhao, W.; Fu, W.; Yang, H.; Tian, C.; Li, M.; Li, Y.; Zhang, L.; Sui, Y.; Zhou, X.; Chen, H.; et al. Electrodeposition of Cu2O films and their photoelectrochemical properties. CrystEngComm 2011, 13, 2871–2877. [Google Scholar] [CrossRef]
  50. Won, Y.H.; Stanciu, L.A. Cu2O and Au/Cu2O particles: Surface properties and applications in glucose sensing. Sensors 2012, 12, 13019–13033. [Google Scholar] [CrossRef]
  51. Aziz, G.E.N.Ç. Hydrothermal Synthesis of Cuprous Oxide Nanoflowers and Characterization of Their Optical Properties. Süleyman Demirel Üniv. Fen Bilim. Enst. Derg. 2018, 22, 397–401. [Google Scholar]
  52. Mowbray, R. Morphological Control of Copper and Cuprous Oxide Nanoparticles via Synthesis and Oxidation/Reduction Reactions. Ph.D. Thesis, University of Colorado at Boulder, Boulder, CO, USA, 2013. [Google Scholar]
  53. Bashami, R.M.; Hameed, A.; Aslam, M.; Ismail, I.M.; Soomro, M.T. The suitability of ZnO film-coated glassy carbon electrode for the sensitive detection of 4-nitrophenol in aqueous medium. Anal. Methods 2015, 7, 1794–1801. [Google Scholar] [CrossRef]
  54. Kosa, S.A.M.; Khan, A.N.; Ahmed, S.; Aslam, M.; Bawazir, W.A.; Hameed, A.; Soomro, M.T. Strategic Electrochemical Determination of Nitrate over Polyaniline/Multi-Walled Carbon Nanotubes-Gum Arabic Architecture. Nanomaterials 2022, 12, 3542. [Google Scholar] [CrossRef] [PubMed]
  55. Islam, M.M.; Diawara, B.; Maurice, V.; Marcus, P. Bulk and surface properties of Cu2O: A first-principles investigation. J. Mol. Struct. THEOCHEM 2009, 903, 41–48. [Google Scholar] [CrossRef]
  56. Zhang, W.; Yin, J.; Min, F.; Jia, L.; Zhang, D.; Zhang, Q.; Xie, J. Cyclic voltammetry analysis of copper electrode performance in Na2WO4 solution and optical property of electrochemical synthesized CuWO4 nanoparticles. J. Alloys Compd. 2017, 690, 221–227. [Google Scholar] [CrossRef]
  57. Han, U.B.; Lee, J.S. Integration scheme of nanoscale resistive switching memory using bottom-up processes at room temperature for high-density memory applications. Sci. Rep. 2016, 6, 28966. [Google Scholar] [CrossRef]
  58. Mohammadzadeh, S.; Zare, H.R.; Khoshro, H. Electrochemical study of Cu2O/CuO composite coating produced by annealing and electrochemical methods. J. Iran. Chem. Soc. 2019, 16, 2719–2729. [Google Scholar] [CrossRef]
  59. Ramos, A.; Miranda-Hernández, M.; González, I. Influence of chloride and nitrate anions on copper electrodeposition in ammonia media. J. Electrochem. Soc. 2001, 148, C315. [Google Scholar] [CrossRef]
  60. Hench-Cabrera, A.E.; Quiroga-González, E. Direct electrochemical detection mechanism of ammonia in aqueous solution using Cu-decorated Si microelectrodes. J. Electrochem. Sci. Eng. 2023. [Google Scholar] [CrossRef]
  61. Wang, J.; Diao, P. Simultaneous detection of ammonia and nitrate using a modified electrode with two regions. Microchem. J. 2020, 154, 104649. [Google Scholar] [CrossRef]
  62. Zhang, L.; Liu, T.; Ren, R.; Zhang, J.; He, D.; Zhao, C.; Suo, H. In situ synthesis of hierarchical platinum nanosheets-polyaniline array on carbon cloth for electrochemical detection of ammonia. J. Hazard. Mater. 2020, 392, 122342. [Google Scholar] [CrossRef] [PubMed]
Scheme 1. Schematic representation of the preparation of NH3/Cu2O/GCE and CV analysis.
Surfaces 06 00029 sch001
Figure 1. Absorption spectra of CuNPs at different time intervals and color transformation.
Surfaces 06 00029 g001
Figure 2. FTIR analysis of pure ascorbic acid and Cu2O/GCE.
Surfaces 06 00029 g002
Figure 3. XRD diffraction pattern of Cu2O/GCE. Asterisks mark the diffractions peaks from ascorbic acid adduct.
Surfaces 06 00029 g003
Figure 4. High-resolution XPS spectra of Cu2O thin film (a) Cu2p and (b) O1s.
Surfaces 06 00029 g004
Figure 5. SEM images of Cu2O/GCE at different magnifications (a,b) 1500×, (c) 15,000×, and (d) 35,000×.
Surfaces 06 00029 g005
Figure 6. (a) Nyquist plot of GCE and Cu2O/GCE, (b) CV curves of GCE, Cu2O/GCE, and NH3/Cu2O/GCE in 0.1 M pH 7 phosphate buffer, (c) Cu2O/GCE coating of different volumes and (d) effect of scan rate.
Surfaces 06 00029 g006
Figure 7. Plot of (a) the peak current versus the scan rate and (b) the logarithm of the peak current versus the logarithm of the scan rate.
Surfaces 06 00029 g007
Figure 8. (a) CV curves of Cu2O/GCE with different concentrations of NH3 and (b) plot of peak current versus concentration of NH3.
Surfaces 06 00029 g008
Figure 9. CV curves of NH3/Cu2O/GCE were obtained within the potential window of (a) +0.2 V and −1.0 V and (b) −0.4 V and +1.0 V.
Surfaces 06 00029 g009
Figure 10. (a) CV curves of NH3/Cu2O/GCE in 0.1 M KCl and 0.1 M Na2SO4, (b) in different pH, (c) peak current versus pH plot, and (d) peak potential versus pH plot.
Surfaces 06 00029 g010
Figure 11. (a) SWV signal of Cu2O/GCE with NH3 in the concentration range of 10 µM to 1000 µM and (b) peak current versus concentration of NH3 plot.
Surfaces 06 00029 g011
Table 1. SWV peak current and shape optimization.
Pulse Amplitude/mVFrequency/msStep Potential/mVIp/µA
Pulse amplitude
2550−10−65.52
5050−10−70.32
7550−10−68.11
10050−10−63.54
Frequency
2510−10−37.04
2525−10−56.21
2550−10−70.32
25100−10−89.15
Step potential
2550−5−52.17
2550−10−70.32
2550−15−77.63
2550−20−91.51
Table 2. Comparison of various fabrication and detection procedures for detecting NH3.
Electrode SystemDirect/Indirect DetectionDetection TechniqueSupporting ElectrolyteLinear RangeLODReferences
NH3/Cu2O NPs/GCEThrough complex formation/indirectSWV0.1 M Phosphate buffer, pH 70.01–1 mM6.23 µMThis work
MWCNT/Cu paste electrodeThrough complex formation/indirectDPV50 mM Carbonate buffer, pH 103–100 µM3.47 µM[17]
Pt-working-microfabricated electrodeOxidation/directCVIonic liquid1–20 ppm1 ppm[12]
GCEThrough chemical reaction/oxidation/indirectSWV0.1 M Borate buffer, pH 90–60 µM0.71 µM[7]
Pt/ITOOxidation/directLSW0.5 M KOH0.27–5 µM3.946 µM[61]
Pt-PANI-CCOxidation/directDPV1 M KOH0.5–550 µM77.2 nM[62]
SnO2Oxidation/directCVPhosphate buffer--[3]
Table 3. Determination of NH3 in drinking water samples using the proposed method.
Detected (mM)Added (mM)Measured (mM)Recovery (%)
00.010.0098298.2 ± 4.59
00.050.0483896.7 ± 4.87
00.10.099199.1 ± 4.13
Recovery is expressed as average ± relative standard deviation (n = 3).
Disclaimer/Publisher’s Note: The statements, opinions and data contained in all publications are solely those of the individual author(s) and contributor(s) and not of MDPI and/or the editor(s). MDPI and/or the editor(s) disclaim responsibility for any injury to people or property resulting from any ideas, methods, instructions or products referred to in the content.

