Article

Thin Luminous Tracks of Particles Released from Electrodes with A Small Radius of Curvature in Pulsed Nanosecond Discharges in Air and Argon

by
Victor F. Tarasenko
*,
Dmitry V. Beloplotov
,
Alexei N. Panchenko
and
Dmitry A. Sorokin
Laboratory of Optical Radiation, Institute of High Current Electronics, Siberian Branch (SB), Russian Academy of Sciences, Akademicheskii Av. 2/3, Tomsk 634055, Russia
*
Author to whom correspondence should be addressed.
Surfaces 2023, 6(2), 214-226; https://doi.org/10.3390/surfaces6020014
Submission received: 11 May 2023 / Revised: 7 June 2023 / Accepted: 13 June 2023 / Published: 14 June 2023
(This article belongs to the Collection Featured Articles for Surfaces)

Abstract

:
Features of the nanosecond discharge development in a non-uniform electric field are studied experimentally. High spatial resolution imaging showed that thin luminous tracks of great length with a cross-section of a few microns are observed against the background of discharge glow in air and argon. It has been established that the detected tracks are adjacent to brightly luminous white spots on the electrodes or in the vicinity of these spots, and are associated with the flight of small particles. It is shown that the tracks have various shapes and change from pulse to pulse. The particle tracks may look like curvy or straight lines. In some photos, they can change their direction of movement to the opposite. It was found that the particle’s track abruptly breaks and a bright flash is visible at the break point. The color of the tracks differs from that of the spark leaders, while the bands of the second positive nitrogen system dominate in the plasma emission spectra during the existence of a diffuse discharge. Areas of blue light are visible near the electrodes as well. The development of glow and thin luminous tracks in the gap during its breakdown is revealed using an ICCD camera. Physical reasons for the observed phenomena are discussed.

1. Introduction

At present, a breakdown of highly overvoltaged gas-filled gaps continues to be intensively investigated. In the course of the research, much attention is paid to the study of nanosecond diffuse discharges in atmospheric air, formed in an inhomogeneous electric field [1,2,3,4,5,6]. The formation of such discharges is accompanied by the generation of runaway electrons and X-rays [1,3,6], and the discharges themselves find practical applications in various scientific and technical fields. Thus, the diffuse discharge formed in the gap with a cathode with a small radius of curvature is used to clean surfaces from carbon, as well as to improve adhesion, to oxidize, and to harden a surface of various metals [7]. The use of pointed cathodes makes it possible to form diffuse discharges in pressured gases in a wide range of experimental conditions [1,2,3,4,5,6]. The diffuse discharge in air at pressure <460 Torr in a gap with a positive pointed electrode feeding by a short voltage pulse was obtained in the last century; see, for example, [8]. A diffuse discharge in atmospheric-pressure air in a gap with an anode with a small radius of curvature was first implemented in [9].
When a voltage pulse duration was increased up to ≥10 ns, microchannels with an increased electron number density ne were observed near a cathode with a small radius of curvature on the background of the diffuse discharge. Additionally, microcraters were found on the surface of a flat anode. They were localized at the contact point of the channels with the flat electrode [10,11,12,13]. It was shown in [11,12,13] that a large number of microdamages with diameters from 1 to 20 μm are formed on flat metal anodes. The microdamage number and size were determined by the voltage pulse parameters and the discharge gap length. The authors of the previously mentioned studies found by laser interferometry that the erosion of electrodes is associated with the appearance of microchannels in the diffuse discharge plasma. In addition, it was suggested in [10] that a decrease in the number density of particles in the microchannels is due to heating. The gas heating facilitates reaching the threshold for the generation of runaway electrons and makes it possible to detect X-ray bremsstrahlung.
Microchannels in the plasma of pulsed discharges in atmospheric air in point-plane gaps of a few millimeters long were also found in [14,15,16] for both voltage pulse polarities. Therewith, jets with a high concentration of ionized particles were detected near the electrodes in the case of spark breakdown. It was confirmed (see, e.g., [8]) that those bright spots appear first on the electrode with a small radius of curvature. It was established in [15,16] using multi-frame laser interferometry with a high temporal resolution, that in short gaps and at high electric field strength near an electrode with a small radius of curvature, the breakdown is caused by the rapid (within 1 ns) explosive appearance of micron-sized cathode and anode spots. The spots were found to consist of highly ionized plasma with ne ~ 1019–1020 cm−3, and spark channels of small diameter are formed from these spots. However, the stages of formation of primary streamers and a diffuse discharge with ne ≤ 1014 cm−3 were not studied and there was no information about the observation of particle tracks in [14,15,16]. Also, runaway electrons or X-rays, which contribute to the formation of diffuse discharges in atmospheric air and other gases were not registered.
It should be noted the studies of the initial stage of discharge in an inhomogeneous electric field were carried out in [17,18,19]. It was established in [17] that after the appearance of a bright spot on the cathode with a small radius of curvature, a short anode-directed spark leader moving at low speed is formed. Then, after a short time, bright spots appear on the flat anode, and cathode-directed spark leaders emerge from them. The front of the cathode-directed spark leaders has a high speed and reaches the front of anode-directed leaders near the cathode. After the spark leaders meet, a spark channel is formed in the gap.
The breakdown between two pointed electrodes in nitrogen and its mixture with water vapor was studied in [18]. Capturing with an ICCD camera showed that the breakdown begins with the formation of a streamer at the positive pointed electrode, and then the diffuse discharge is formed, which passes into the spark. In [19] a streak camera was used to investigate the discharge dynamics in air and nitrogen. Based on results obtained, it was stated that two stages of a “streamerless” spark discharge are observed at atmospheric gas pressure. The plasma radiation is dominated by the second positive and first negative nitrogen systems at the first stage with the duration of about 2 ns, while the emission of NO* molecules and the first positive nitrogen system predominates during the second one. It can be assumed that in [19], as in [1,2,3,17], the diffuse discharge was formed at the first stage due to streamers, and the diffuse discharge mainly radiates on the transitions of the second positive nitrogen system [17].
Note that in the works cited above, luminous tracks of particles were not observed in discharges at atmospheric-pressure air. However, it is well known that on the cathode of vacuum discharges, bright spots are formed, from which particles of various sizes fly apart [20]. Glowing tracks of plasma crystals were observed in a high-frequency discharge at low argon pressures in [21].
Finally, tracks of luminous particles in atmospheric air discharge, formed by nanosecond voltage pulses, were discovered in recent works [22,23]. Figure 3 in [22] shows an image in which two streamers propagate from a particle in opposite directions. Straight particle tracks initiated from a tungsten wire cathode were shown in Figure 4a of this article at a generator voltage of 120 kV and a hydrogen pressure of 30 Torr, whereas no tracks were observed in hydrogen and other gases at atmospheric pressure. In addition, nanoparticles with sizes of ≈500 nm or less were found on the polyamide chamber wall at the air pressure of 100 Torr; see Figure 4b in [22].
The aim of this work is to study the discharge plasma radiation between two electrodes with a small radius of curvature in air and argon with a high spatial resolution and to confirm the appearance of thin luminous tracks.
Simultaneously, voltage and discharge current pulses were measured with a picosecond time resolution. The emission spectra and the glow of streamers and diffuse discharge, including those with spots on the electrodes and tracks, were recorded with an ICCD camera as well.

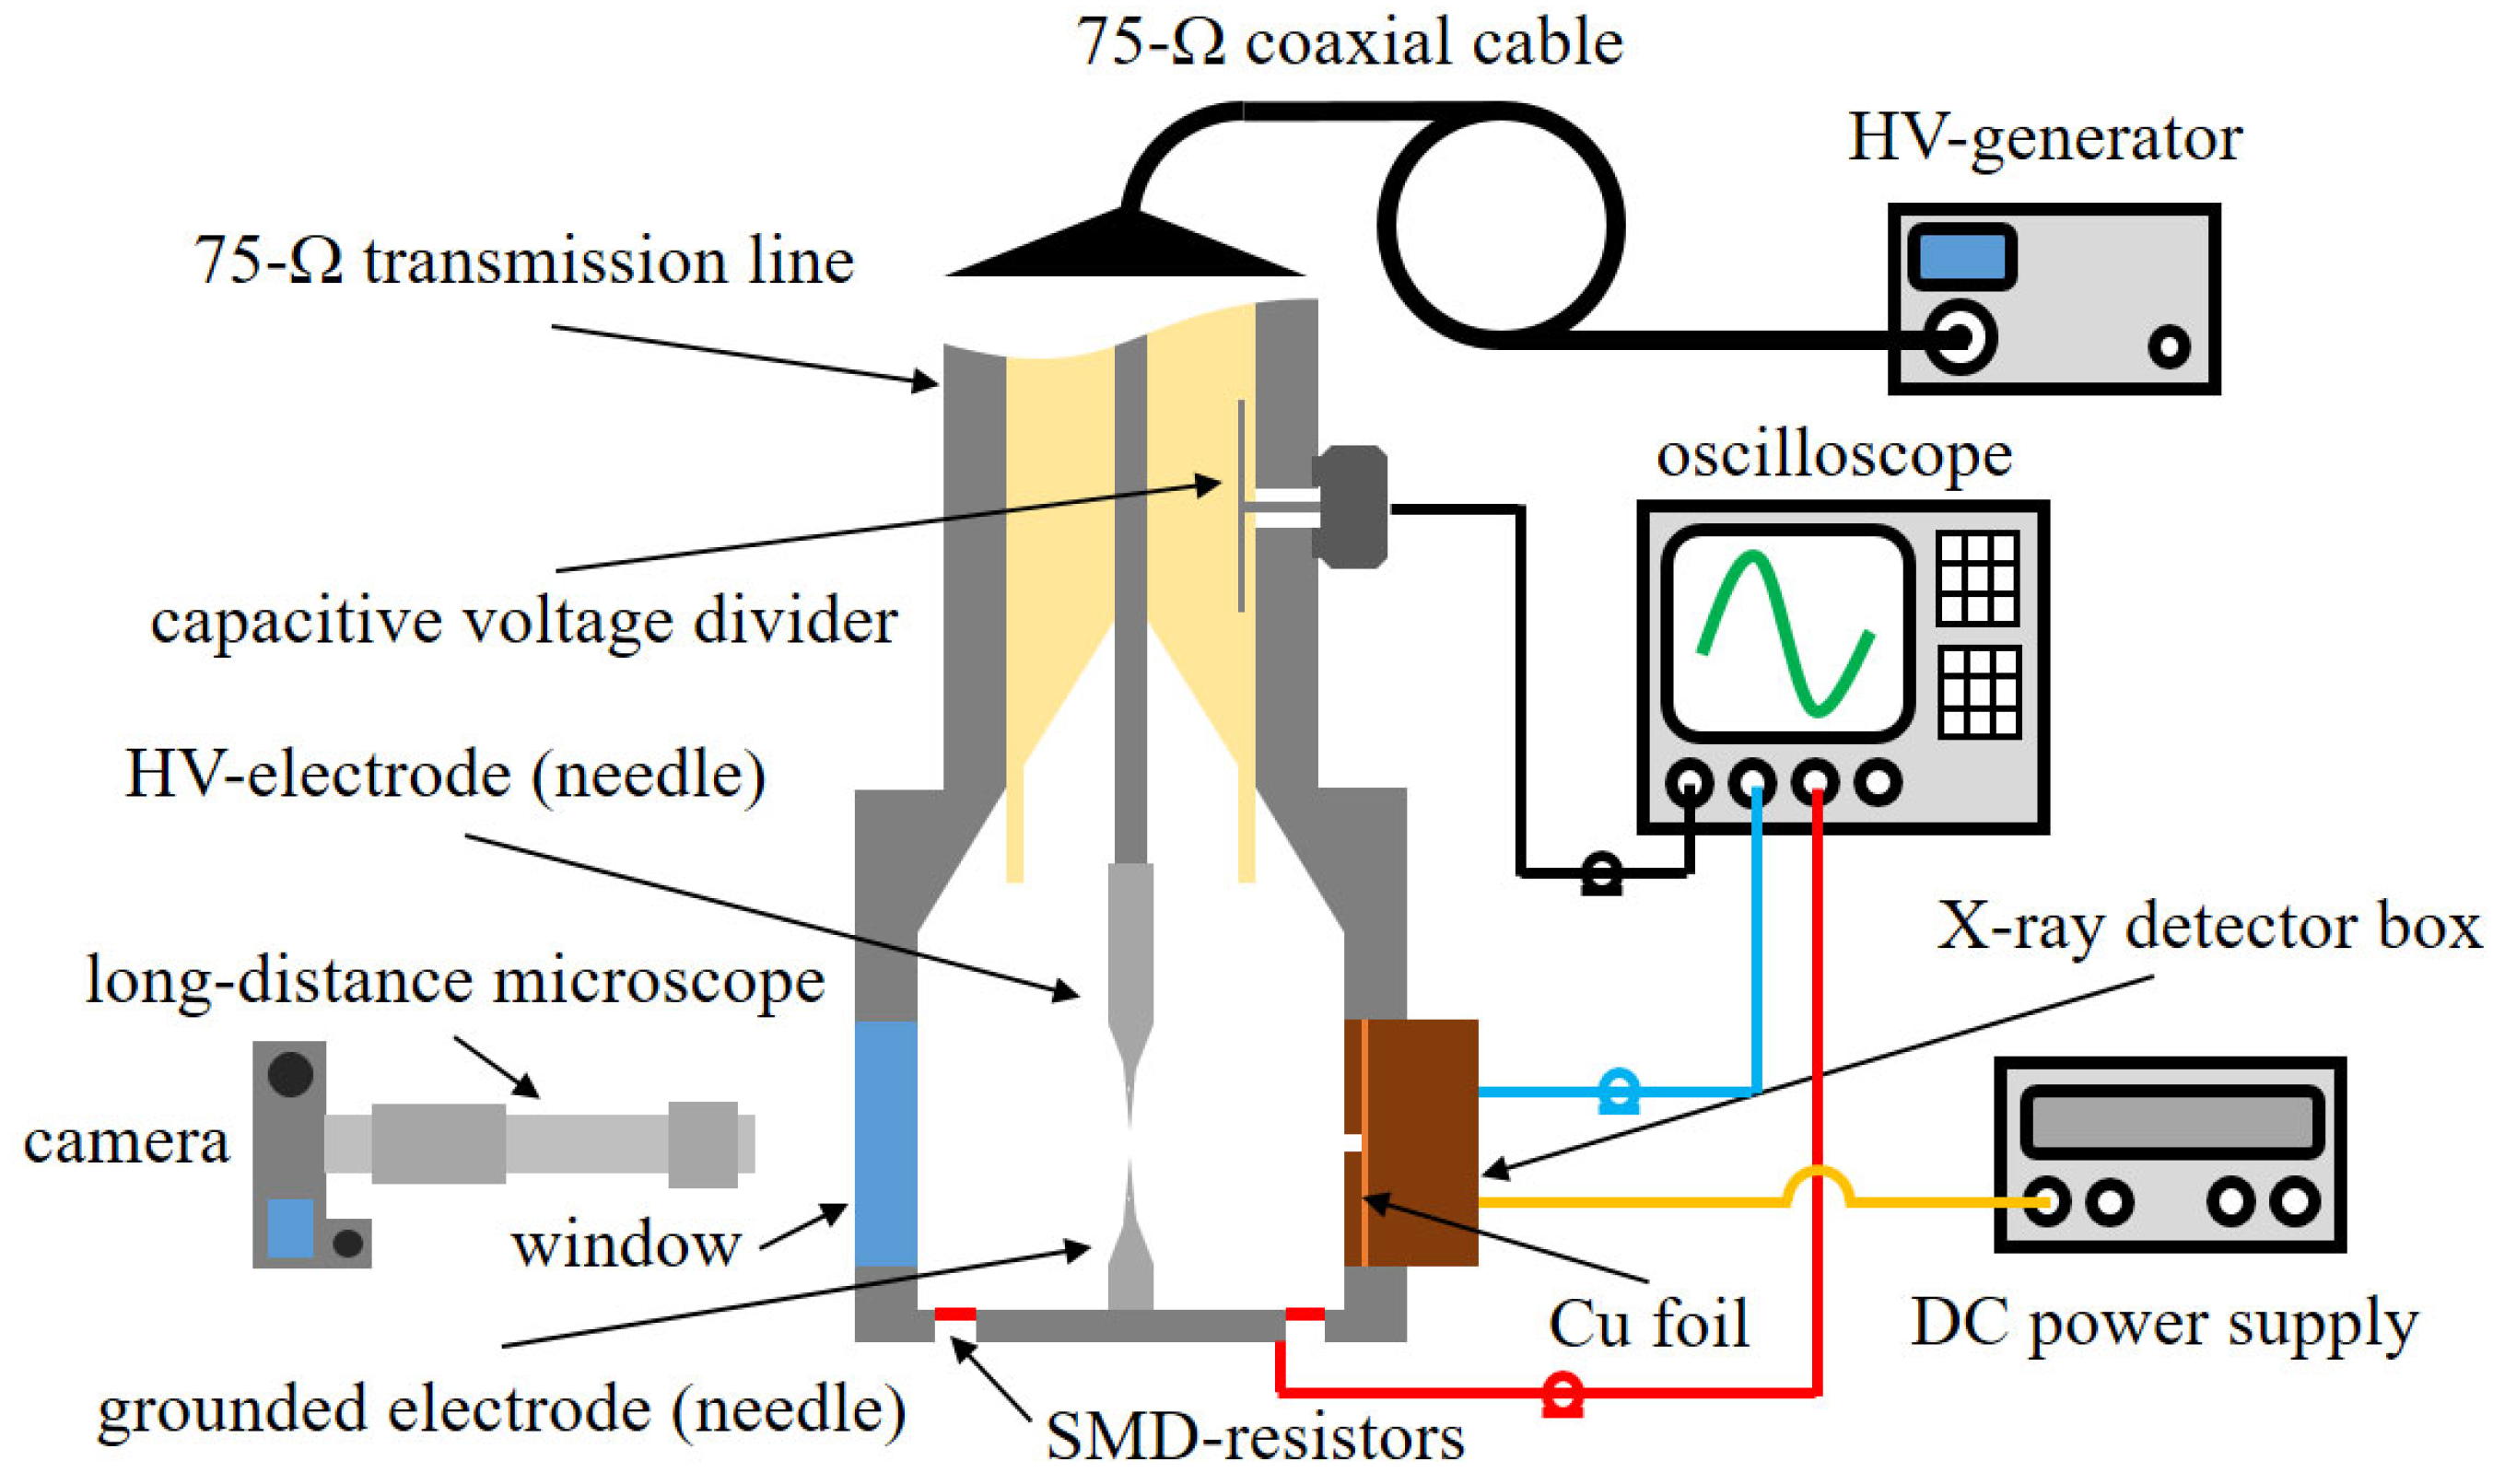
2. Materials and Methods

An experimental setup similar to that described in detail in [24] is shown in Figure 1. Voltage pulses from GIN-55-01 (negative polarity) or GIN-50-1 (positive polarity) generators, the principle of operation of which is described in [25], were applied via a transmission line to electrodes located in a discharge chamber with side windows made from fused quartz.
The GIN-55-01 generator produces voltage pulses with an amplitude in the incident wave up to −38 kV and a duration (full width at half maximum; FWHM) of τ0.5 ≈ 0.7 ns. Most of the results presented in this paper were obtained with the voltages pulses of −18 and −33 kV. The GIN-50-1 generator forms voltage pulses with an amplitude in the incident wave up to +25 kV and the FWHM of τ0.5 ≈ 10 ns. A pulse rise time was τ0.1–0.9 ≈ 3 ns. Most of the results presented in this paper were obtained with voltage pulse amplitudes of +6, +11 and +16 kV. At idle, their amplitudes doubled. The presence of X-ray radiation from the discharge was measured with an HR-GaAs:Cr X-ray detector, described in [26], which was installed instead of the window behind a 20-μm-thickness copper foil. This X-ray detector with a 3-mm-diameter semiconductor sensor input window had a high sensitivity but the pulse response was about 2 ns.
The discharge chamber was connected to the high-voltage generator by two 1 m length coaxial transmission lines (Z = 75 Ohm) and a 3 m length coaxial high-voltage cable. The transmission line near the discharge chamber had built-in capacitive voltage dividers, which were located near the discharge chamber and at a distance of 2 m from it. Such an arrangement of the dividers made it possible to measure the incident and reflected voltage waves and reconstruct the voltage across the gap. The discharge current was measured by a current shunt with a resistance of 8.7 mΩ, assembled from thin-film SMD resistors (Vishay Intertechnology).
The large total length of the two lines made it possible to record a series of reflected voltage pulses from the discharge gap and the generator, whose resistance decreased to fractions of an ohm within ~10 ns. The reflected voltage pulses in the absence of the gap breakdown returned to it after ≈50 ns with the opposite polarity. In the case of the gap breakdown, it was possible to determine the energy deposited into the discharge plasma from recorded current and voltage waveforms, both in the main pulse and in reflected decayed pulses. When the diffuse discharge was formed in the gap, the impedance of the coaxial line and the plasma resistance for some time turn out to be close. This leads to efficient energy transfer to the discharge plasma, and the mode of energy input can be changed with air pressure and the generator voltage. In particular, the main part of the energy can be transferred to the discharge plasma from the first voltage pulse arriving at the gap, which greatly reduces the effect of reflected pulses on the discharge radiation characteristics.
The 4-mm-length gap was formed by two needles with a base diameter of 0.75 mm. Their length after a long training was 5.5 mm, and the radii of curvature were ≈100 µm for the potential needle and ≈300 µm for the grounded one. Therein, the grounded needle during the preliminary training changed its shape over a longer length and became blunt. As a result, the radius of curvature of the transition region from the end surface of the tip with a radius of 300 µm to the surface of the cone at the tip of the needle was ≈100 µm. The training procedure with multiple pulses was used in the experiments to ensure that the shape of the needles did not change significantly from pulse to pulse. As is known (see, for example, [27]) if bright spots are formed on the electrodes in a diffuse discharge, the surfaces of both electrodes are eroded. Therefore, the radius of curvature of sharp needles changes significantly due to the melting of the tip after one nanosecond voltage pulse [8]. In the case of low energies per pulse and large radii of curvature of the tips, micrometer-sized craters form on their surface, but the general shape of the needles changes insignificantly [27]. In our experiments, the GIN-55-01 generator provides an energy input of 8 mJ to the matched load with a resistance of 75 Ω at a voltage pulse amplitude of –33 kV and only 3.5 mJ at –18 kV.
The signals from the capacitive voltage divider and the current shunt were transferred to a Tektronix MSO64B oscilloscope (8 GHz, 20 GS/s).
Integral images of the discharge plasma glow in the gap were captured with a Canon EOS 2000D SLR camera (number of pixels 24.1 Mpx, matrix size 22.3 × 4.9 mm2, pixel size 3.72 μm) equipped with a K2 DistaMax long-distance microscope (Infinity Photo-Optical Company, Centennial, CO, USA) with a CF-3 objective. According to the datasheet, the microscope in this configuration provided a magnification of 3.56 with a maximum resolution of 1.7 µm. The exposure duration of the camera was 1 s, and the sensitivity varied in the range of 100–3200 ISO. The spectral composition of the discharge radiation was determined using an OceanOptics HR2000 spectrometer with a known spectral sensitivity in the range of 180–1100 nm. A four-frame HSFC PRO ICCD camera was used to observe the discharge development dynamics.
The chamber was evacuated with a fore-vacuum pump and filled with atmospheric air with a relative humidity of 23% or argon with purity no worse than 99.99%. Atmospheric air at pressures of 30, 100, 300 and 760 Torr and argon at pressures of 100 and 760 Torr were used in experiments.

3. Results

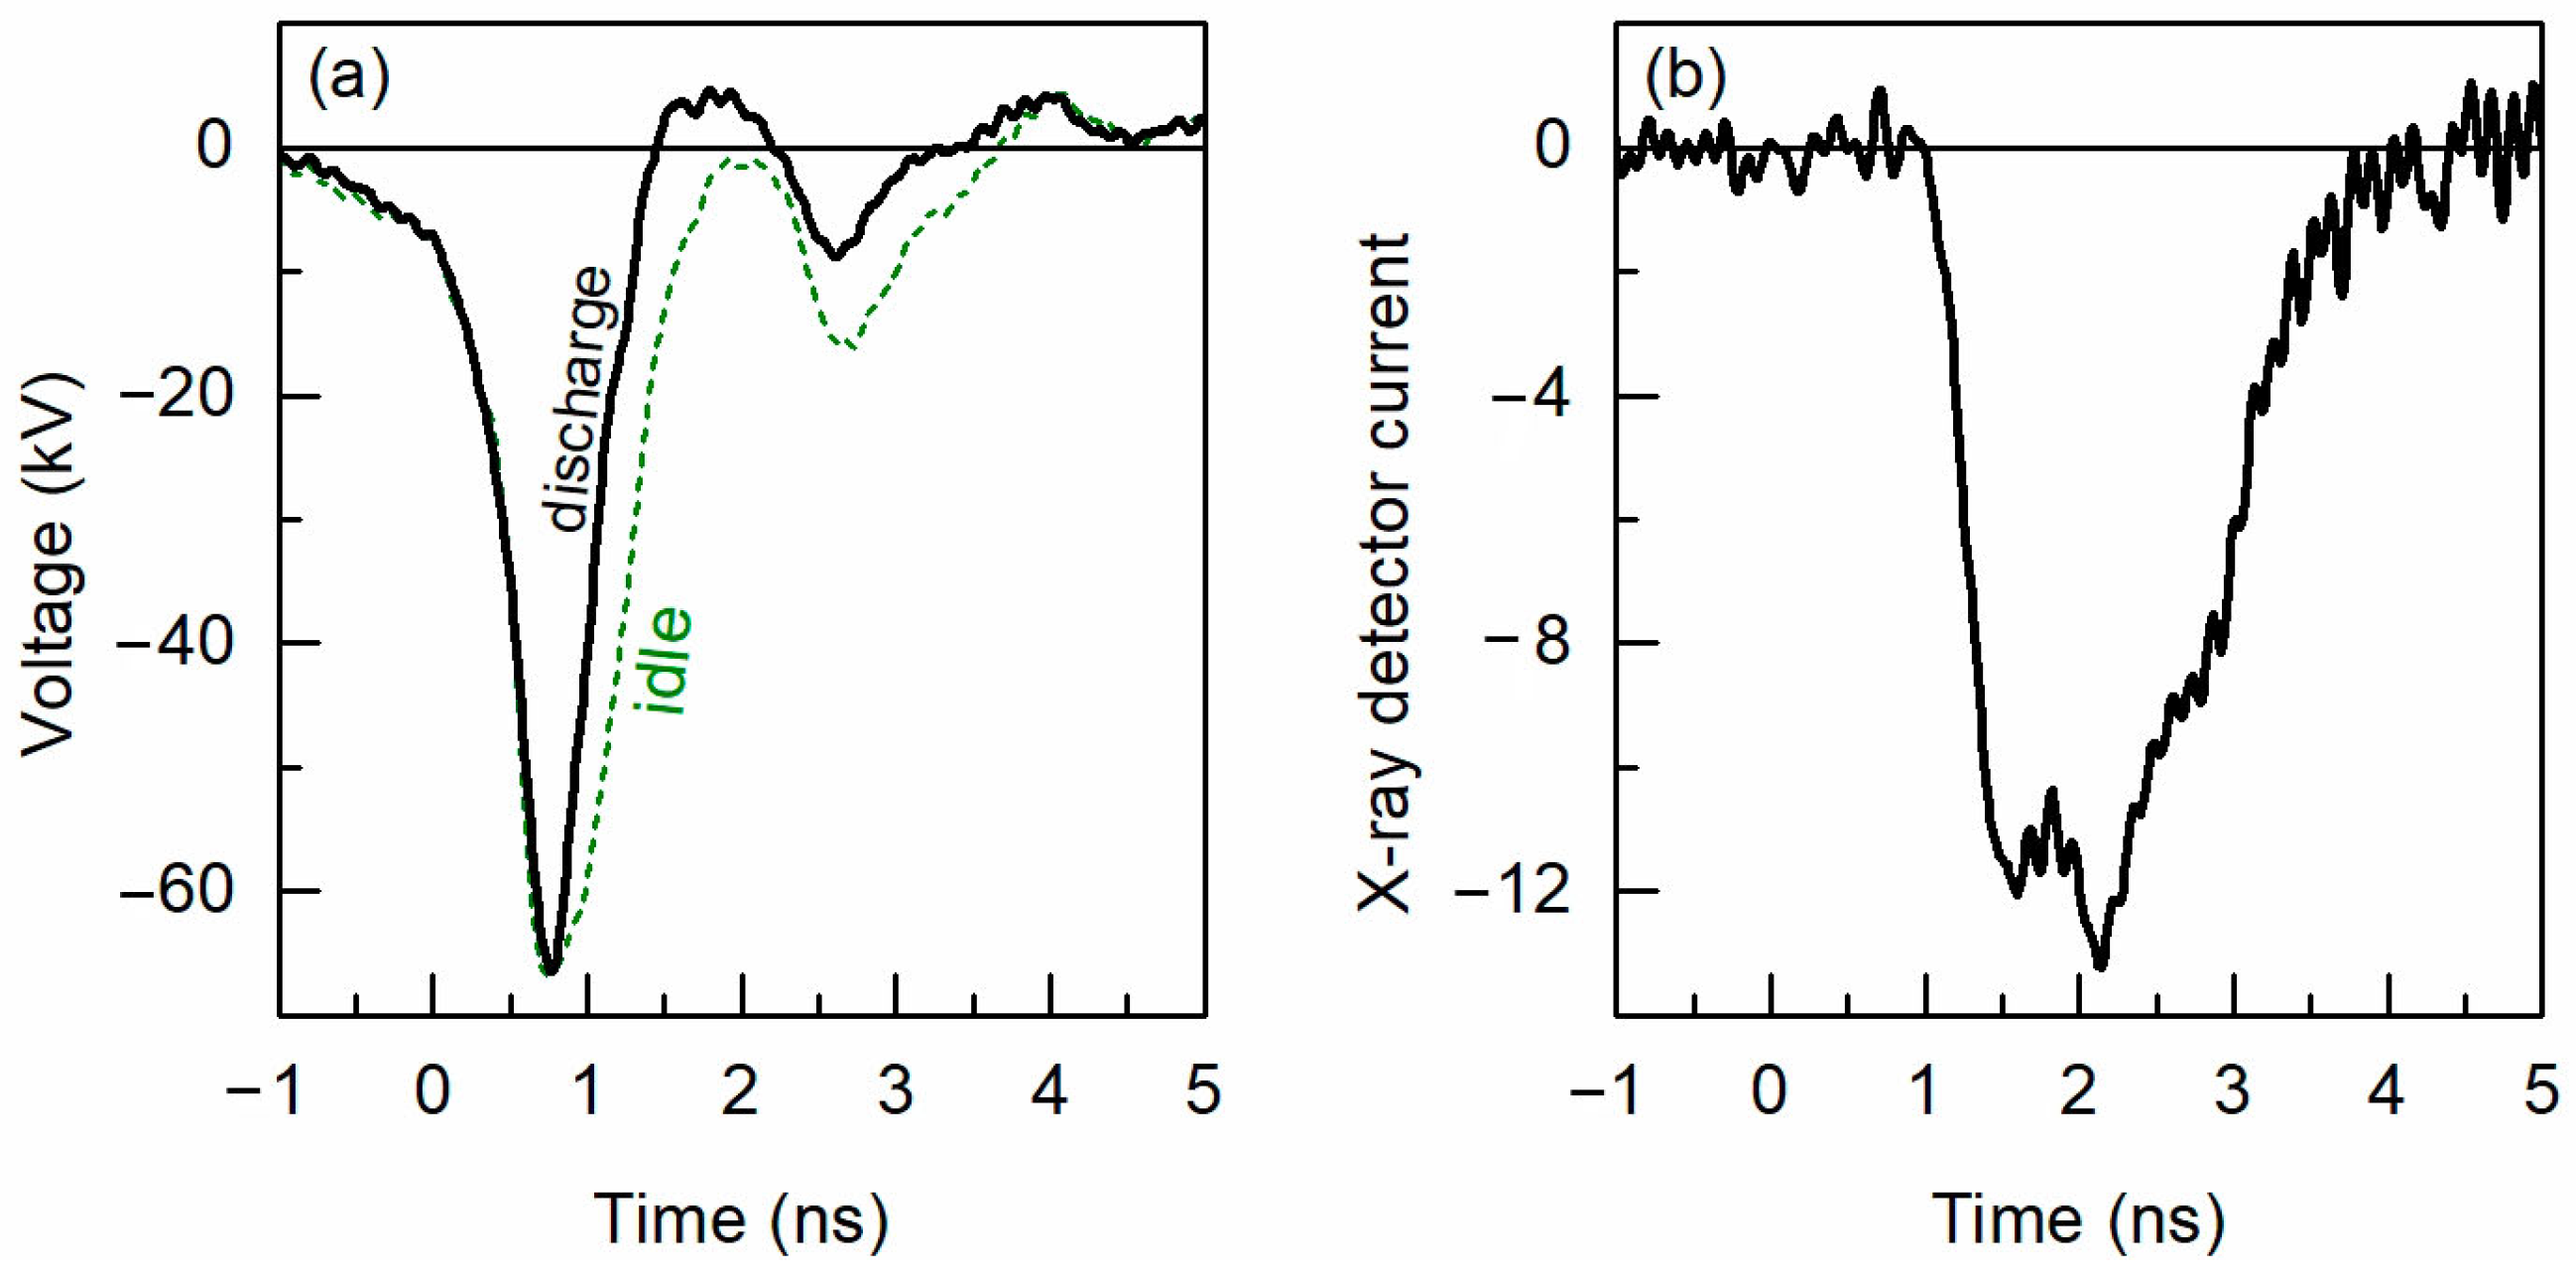
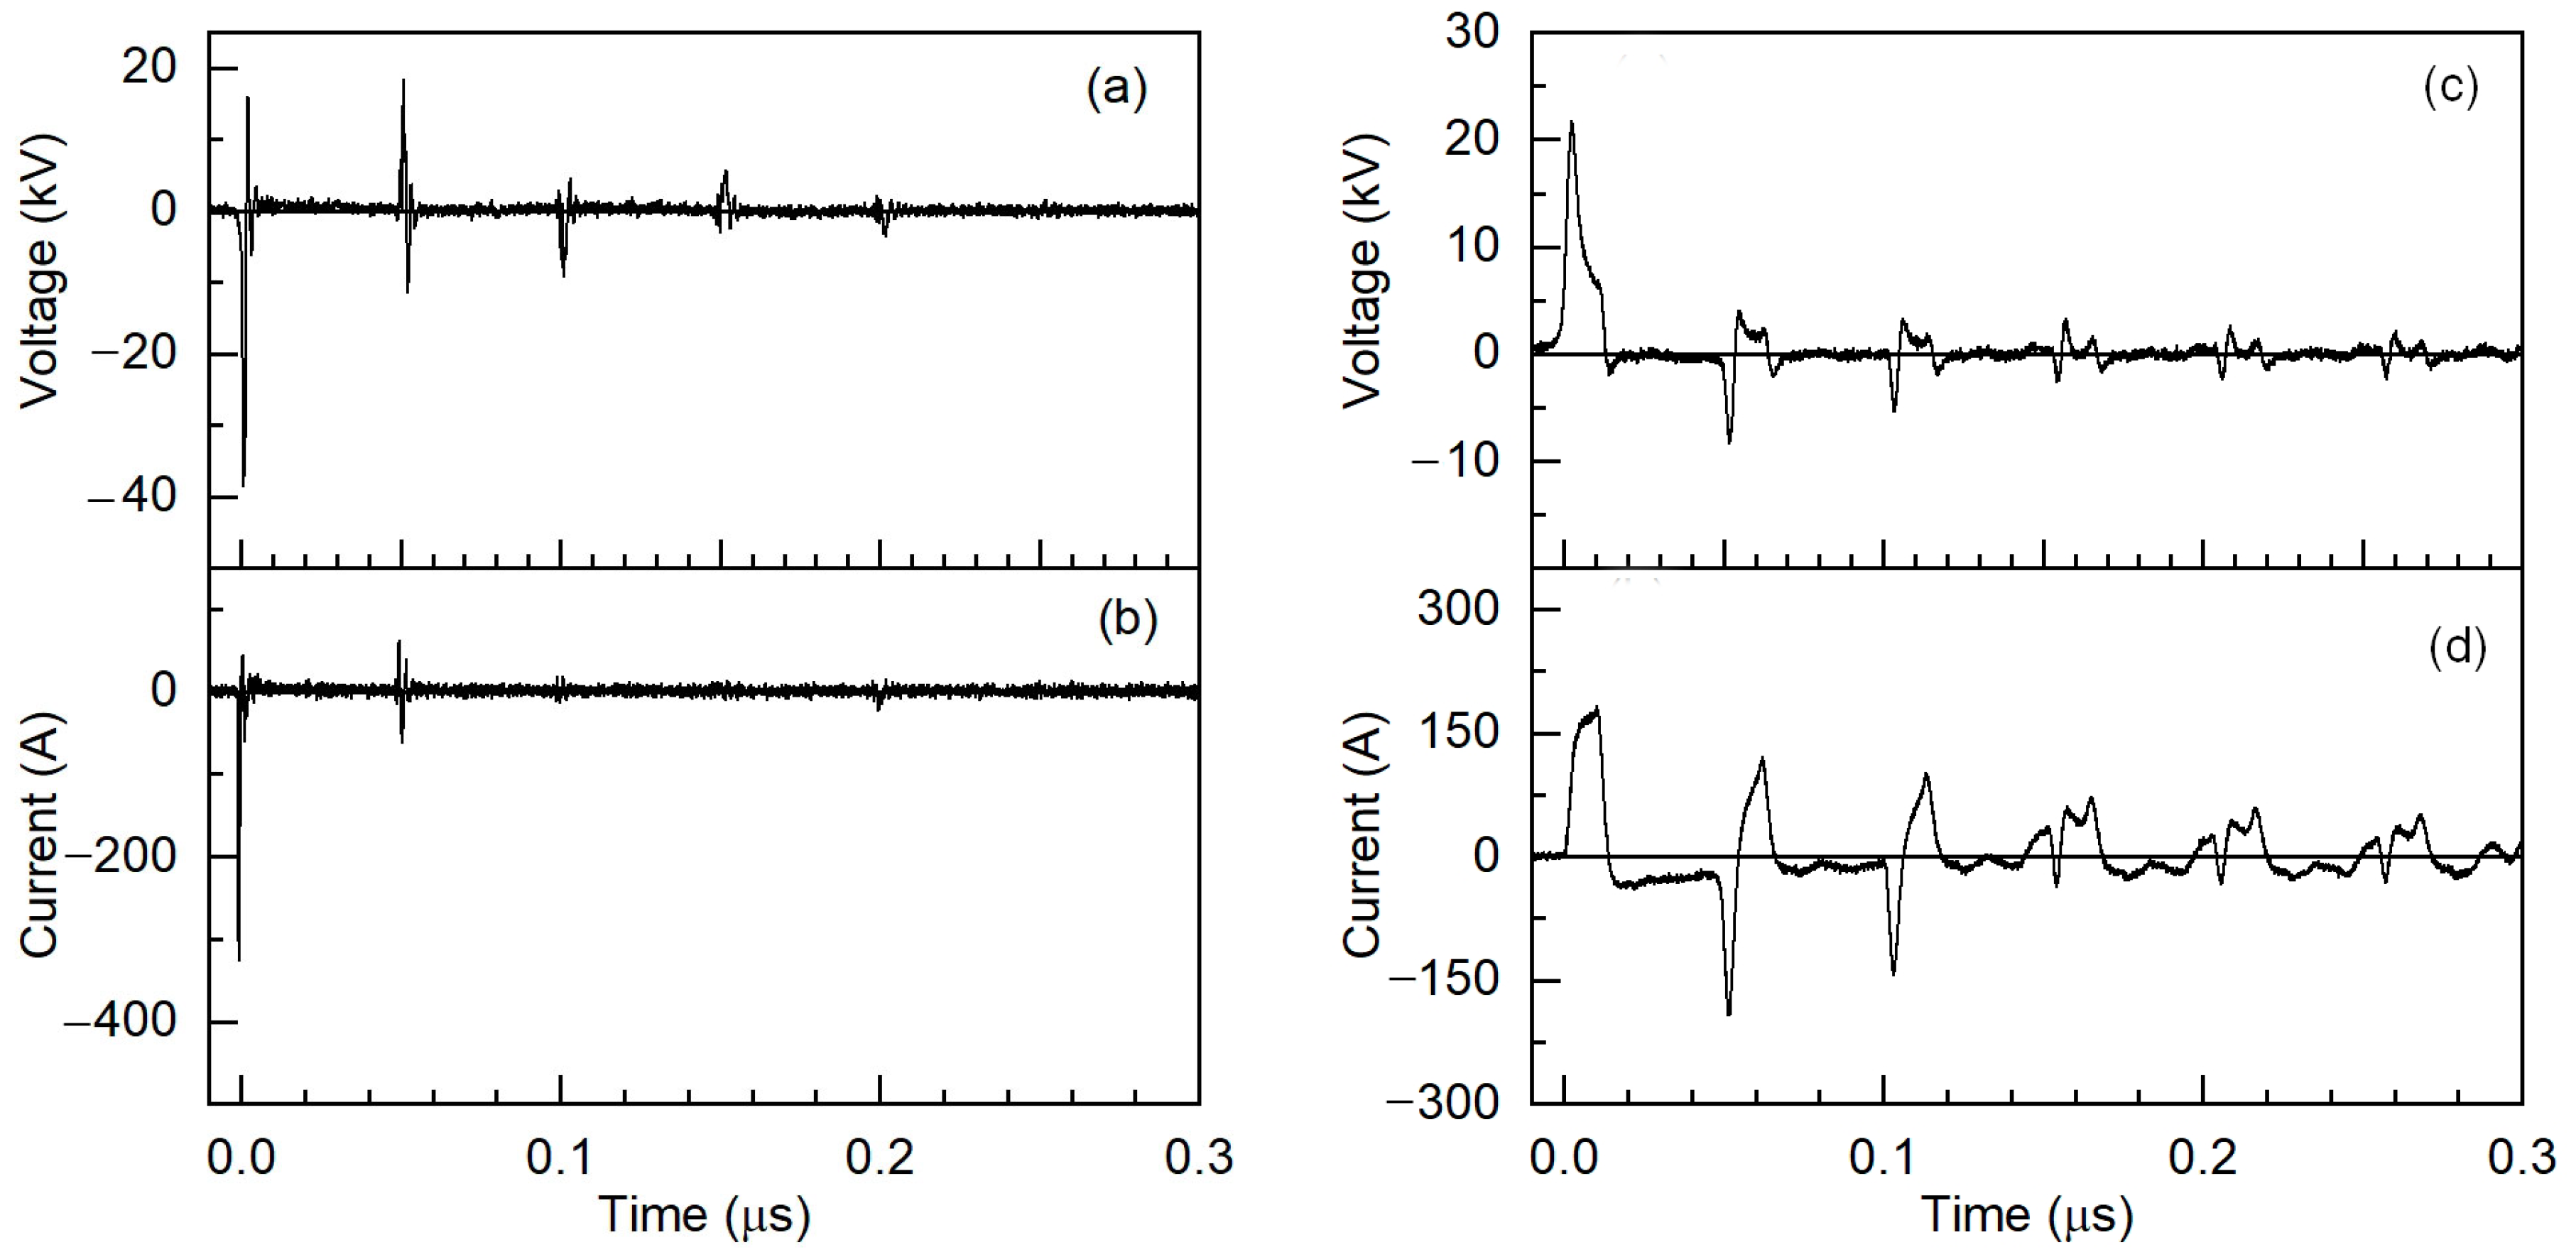
3.1. Measurement of Voltage, Discharge Current and X-ray Radiation

The characteristics of discharge formed in a non-uniform electric field were studied during first step. The task was to measure the features of breakdown and to determine whether runaway electrons (RAEs) are generated in discharge when luminous tracks of particles with micron dimensions are observed. It was found that the RAE generation occur under the conditions of our experiments. This follows from the formation of the diffuse discharge at elevated pressures without an additional pre-ionization source. Studies of the diffuse discharge formation with the measurement of the runaway electron current and X-ray radiation (XR) were performed in many works; see, for example, [10,28,29]. In our previous studies [1,3,30] under similar experimental conditions, runaway electrons were recorded behind a flat foil anode with a collector having the picosecond temporal resolution.
In this work, it was difficult to mount a collector behind the anode or near it to detect runaway electrons; therefore, XR pulses were measured to prove the RAE generation. The runaway electrons were decelerated on a grounded electrode and chamber walls and produced X-ray quanta propagating in different directions. X-rays were recorded through a side window covered with copper foil. Waveforms of the voltage across the gap in the idle mode and in the case of the gap breakdown along with an XR pulse are shown in Figure 2. When using two flat electrodes at the same air pressure and voltage pulse amplitude, RAE and XR pulses were not registered.
As expected, the XR pulse amplitude increased with increasing the generator voltage and decreasing the gas pressure. The XR pulse duration corresponded to the detector pulse response; see the data in [26]. The presence of XR, along with a diffuse discharge formation definitely, confirms the generation of runaway electrons.
The RAE current pulse under similar conditions in atmospheric air is much shorter and amounts to ≈100 ps [1,3]. When using the GIN-50-1 generator, due to its positive polarity and screening of the grounded cathode by the chamber walls along with the lower amplitude of the voltage pulse and its larger rise time, the sensitivity of the X-ray sensor was insufficient in atmospheric air. In addition, soft X-rays were absorbed by the copper foil. However, even with the positive voltage pulses, a diffuse discharge was first formed in the gap, which then contracted with an increase in the air pressure and voltage pulse amplitude. This conclusion follows from an analysis of images, which show the diffuse discharge, and emission spectra from the gap. These data will be described further in Section 3.3.
The breakdown voltage depended on the gas pressure and the generator parameters. Waveforms of the voltage across the gap and the discharge current in atmospheric air obtained with both generators are shown in Figure 3.
With the amplitude in the incident wave of −33 kV, the breakdown of the gap occurred within the first voltage pulse at ≈−37 kV and was accompanied by a discharge current with an amplitude of ≈324 A (see first pulses in Figure 3a). The second voltage pulse (the first reflected one) had a complex shape. Its beginning part was positive. This occurs due to the reflection of a part of the pulse from the discharge gap before its breakdown and subsequent reflection from the generator, for which impedance decreased to a few ohms within 10 ns. The second part of the pulse had a negative polarity, which is associated with a sub-nanosecond breakdown time and sharp drop in the discharge plasma resistance to a value lower than the transmission line impedance. It follows from Figure 3a,b that the main portion of electric energy is deposited into the gas-discharge load during the first voltage pulse. The second pulse of the discharge current has the low amplitude, and the parameters of the third one are completely negligible.
When working with the GIN-50-1 generator at the voltage pulse amplitude of U0 = +11 kV (22 kV in the idle mode) the gap breakdown during the first pulse occurs at air pressure not higher than 100 Torr (see Figure 3c,d). Therewith, the gap breakdown occurs immediately after reaching the open circuit voltage at the beginning of the flat top of the first pulse; see Figure 3c. It is evident from the current and voltage waveforms that the main energy input into the discharge plasma was provided during the first voltage pulse. The amplitude of the reflected voltage pulses significantly decreased, but the discharge current pulses during the reflected voltage pulses had relatively large amplitudes. This is explained by the discharge contraction and sharp decrease in the plasma resistance. The gap breakdown can occur during one of the reflected voltage pulses when air pressure was increased to 760 Torr and (or) U0 was increased.
From the data in Figure 3, as well as from the voltage and current waveforms obtained under different U0 and p, it follows that the gap breakdown conditions could be changed by varying the air pressure and the generator voltage. As will be shown below, the breakdown conditions have a strong effect on the discharge plasma glow and the formation of the thin luminous tracks.

3.2. Radiation Characteristics of the Discharge Formed by Negative Voltage Pulses

The most important data were obtained in our work using the long-focus microscope with a spatial resolution of 1.7 μm, which was apparently used for the first time to study the nanosecond discharge in a non-uniform electric field. Figure 4 demonstrates images of the interelectrode gap and the discharge plasma glow in air at a pressure of 760 Torr and its relative humidity of 23%.
These images show that different areas can be distinguished in the discharge region by their the electric field strength is higher that the critical one, streamers develop along their r brightness, color and shape. A program for correction of the levels of brightness and contrast of the images was used for analyzing the image to show the diffuse discharge emission and highlight the thin luminous tracks (TLTs) initiated by metal particles released from the electrodes. This was necessary because of the high brightness of white (1) and blue spots (3) observed at the electrodes. The glow of these spots dominates the original image; see Figure 4b. Spark leaders (2), which start from white bright spots, are also visible in this figure. However, in this case, the glow of the diffuse discharge and TLTs are practically invisible. We note once again that for the diffuse discharge formation at a high gas pressure, runaway electrons are required [1,3]. The glow of the diffuse discharge, which occupies the whole gap, and TLT (4) become visible in the image only after correction of the luminosity and contrast levels, see Figure 4c,d. Moreover, the tracks are more visible in areas without the diffuse discharge; see, for example, the track in the lower left corner in Figure 4d.
The TLT color (4), as can be seen from Figure 4c,d, differs from that of the spark leader (2), which indicates different mechanisms of their formation. The minimal track cross-section did not exceed 2 μm, which corresponds to the microscope spatial resolution. The size of the particles that lead to the formation of thin luminous tracks should be smaller. Thus, the transverse particle size on the chamber wall was ≈500 nm and less [22]. The width of the observed tracks was also affected by their position relative to the gap center. When moving away from the plane of the objective focus, tuned to the central axis of the discharge, the image was blurred and became wider.
The shapes of the tracks and their lengths are very diverse and changed from pulse to pulse. However, TLTs always adjoined the region of bright white spots on the electrodes or their periphery. TLTs could sharply reverse their direction of propagation; see Figure 4d, in the region above the left electrode. Therewith several tracks can adjoin one bright spot, including those on the periphery of the white bright spot. Such a straight long track (4*) is seen in Figure 4d. Current and voltage waveforms, taken simultaneously with these images, practically did not change from pulse to pulse and were close to those shown in Figure 3a. However, the shape and position of the white and blue spots near the electrodes, the shape and the number of spark leaders and TLTs changed from pulse to pulse. In addition, TLTs always adjoined bright white spots, which indicates the escape of particles from a part of the electrode surface, on which the bright white spots appear. For the appearance of a large number of TLTs, bright white spots should be located on the tips of the electrodes. The probability of such an arrangement of bright spots increased with an increase in voltage and a decrease in air pressure.
Spectral measurements showed that with the GIN-55-01 generator in the whole pressure range (760, 300, 100 and 30 Torr), the bands of the second positive nitrogen system (2+), peak intensity on C3Πu(v = 0) → B3Πg(v = 0) transition at 337.1 nm, dominates in the diffuse discharge glow as it is shown in Figure 5. Therewith emission of white and blue spots dominating in the visible region in the images in Figure 4, is not visible in the spectrum, which shows the spectral energy density of radiation W. This can be associated with the low W value in individual lines and bands of white and blue spots compared to the UV emission of the 2+ system and wide spectral range of the spot emission.

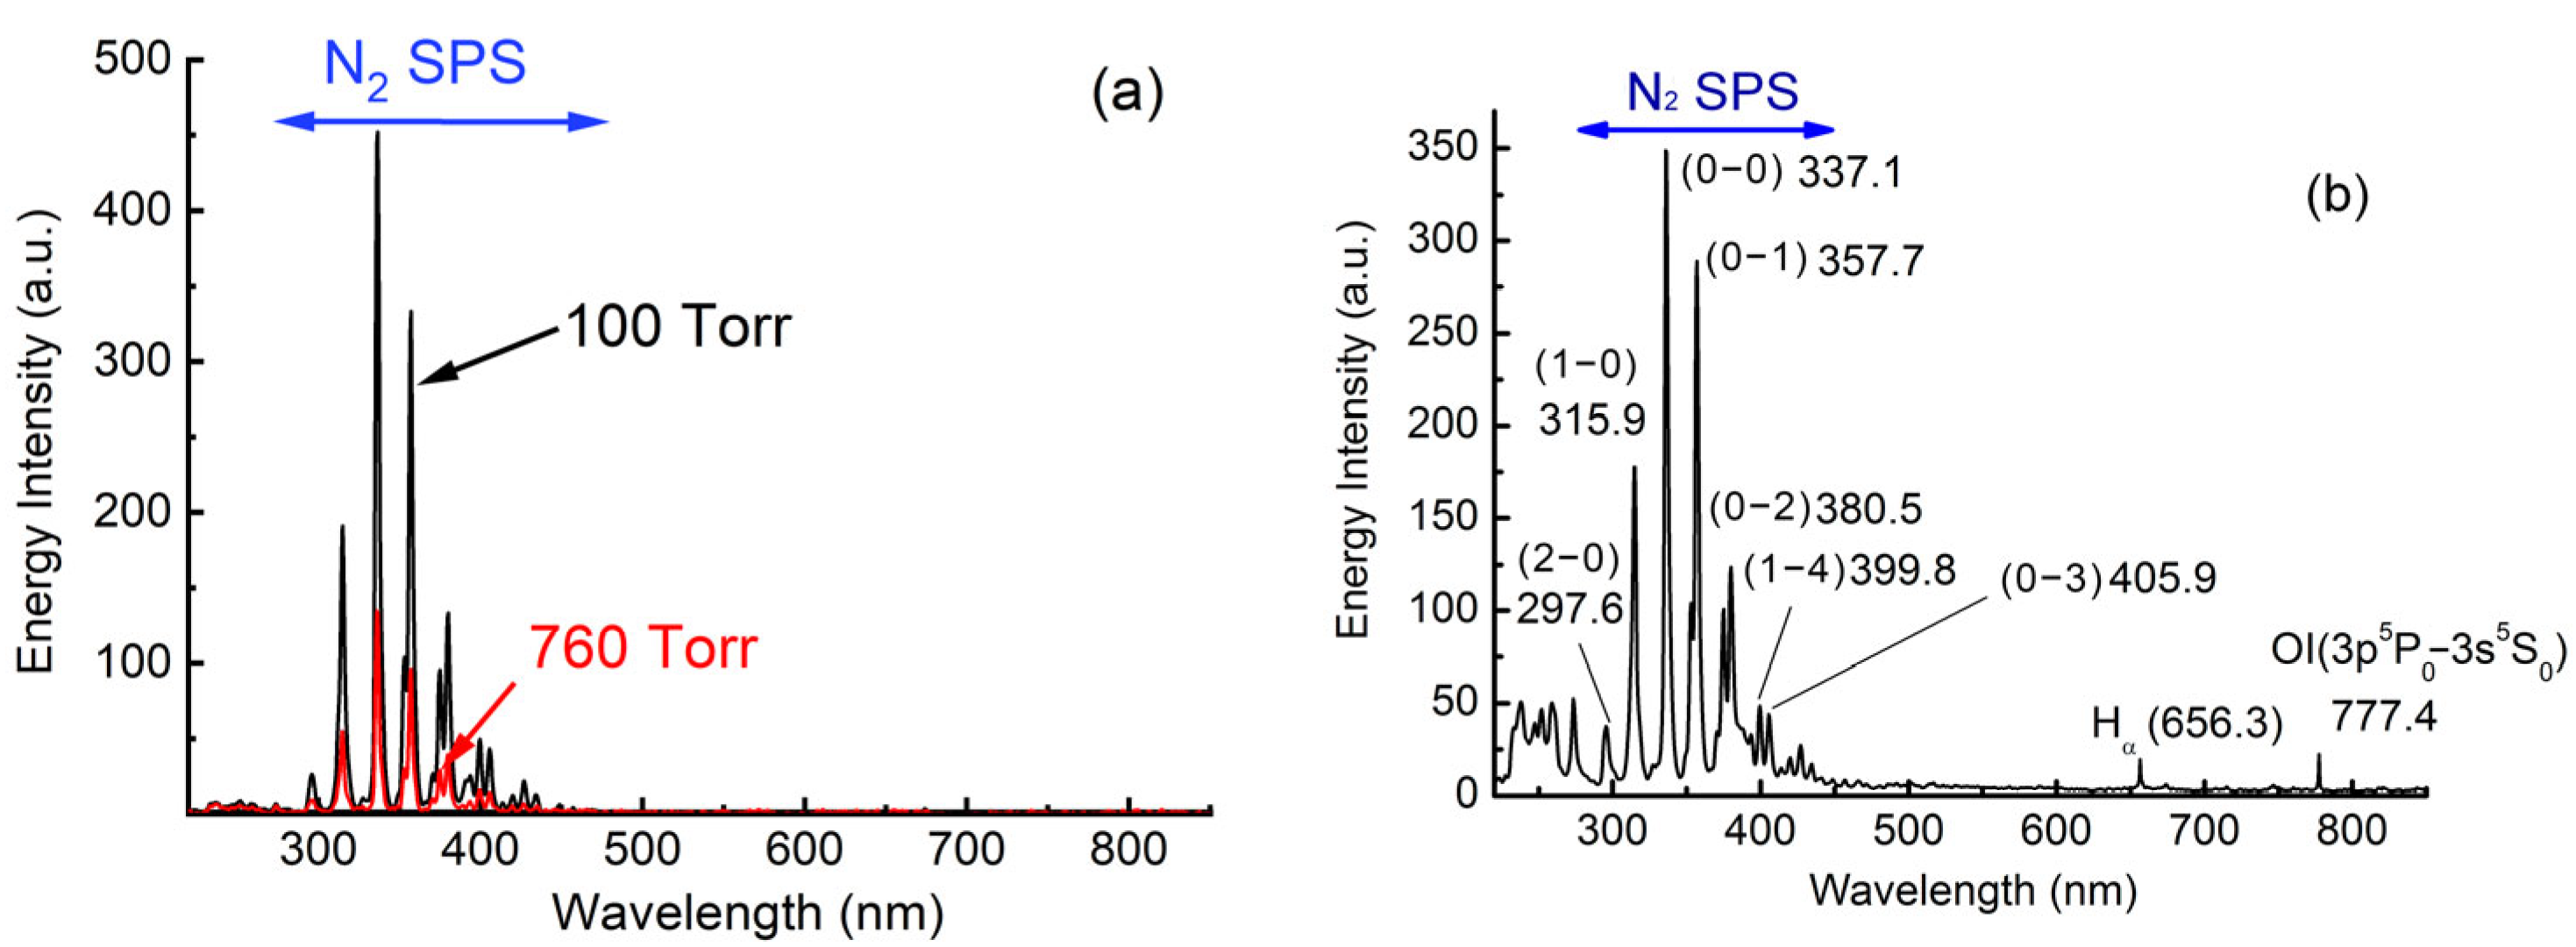
3.3. Optical Parameters of Discharge Radiation Formed by Positive Voltage Pulses

Images of the discharge plasma glow obtained with the GIN-50-1 generator, providing voltage pulses with positive polarity and the FWHM of ≈10 ns, are shown in Figure 6. Changing voltage pulse parameters affected the characteristics of the discharge. The diffuse discharge without any spark channels is seen in the corrected images only at low voltage amplitude in the incident wave (not higher +6 kV) and air pressures of 30 and 100 Torr; see Figure 6a. Therewith, both curved tracks with a change in the direction of motion to the opposite (4) and straight tracks (4*) are observed. Spark leaders (2) and blue glow regions (3) were also formed, but the discharge constriction did not occur.
Formation of a wide spark channel was seen in the gap when U0 and air pressure were increased to +11 kV and 100 Torr, respectively; see Figure 6b. The discharge constriction is confirmed with the current and voltage waveforms, shown in Figure 3b, which indicate a sharp decrease in the discharge plasma resistance. Note that particle tracks were also recorded in atmospheric air, but the probability of their appearance decreases with the GIN-50-1 generator.
Spectra recorded at different pressures (760, 100 and 30 Torr) with the GIN-50-1 generator showed that bands of the second positive nitrogen system dominate in discharge glow only at p = 30 Torr and U0 = 6 kV; see Figure 5b. However, even under these conditions, visible and UV broadband radiation appear in the spectra. The intensity and bandwidth of this radiation increase with air pressure and amplitude of the voltage pulse. The broadband radiation with wavelengths <280 nm, as was established earlier in [17], is emitted from bright white spots on the electrodes, spark leaders, the spark channel and observed in different gases (He, H2, CO, Xe, CO2). The total radiation energy density W from discharge in atmospheric air exceeds the most intense band of 2+ nitrogen system at 337.1 nm. The number of registered TLTs decreases as well.
TLTs were observed when air was replaced with argon; see Figure 6c. However, the number of TLTs in a single pulse and the number of pulses in which thin luminous tracks were observed decreased. From the comparison of Figure 6b,c, it follows that only one track is visible in argon, which is adjacent to the grounded electrode of negative polarity, ceteris paribus. The number of TLTs in air is an order of magnitude greater, and the tracks originate from bright white spots on both electrodes, as in Figure 6b.
Studies of the formation of streamers and diffuse discharge with the ICCD camera showed that TLTs are not observed on the background of streamers forming diffuse dis-charge and on the background of the diffuse discharge with bright spots on the electrodes. However, the appearance of TLTs were detected when photographing the gap with a 5-µs-delay relative to the beginning of the voltage pulse (Figure 7).
The obtained data show that TLTs are formed with a microsecond delay relative to the first and reflected voltage pulses. It is difficult to register them on integrated photo-graphs due to their low radiation intensity compared to that of diffuse and spark dis-charges. Apparently, for these reasons, TLTs were not found in [10,12,16,18,19]. Capturing with the ICCD camera also showed that the speed of particles can be different for the tracks with different transverse size. Figure 7b shows that the length of the thin track in this image is greater than that of a track with a large transverse dimension. In the future, it is planned to study in detail the properties of particles that form tracks.

4. Discussion

From the analysis of about 200 images, the number of which was more than 300, the following conclusions can be made.
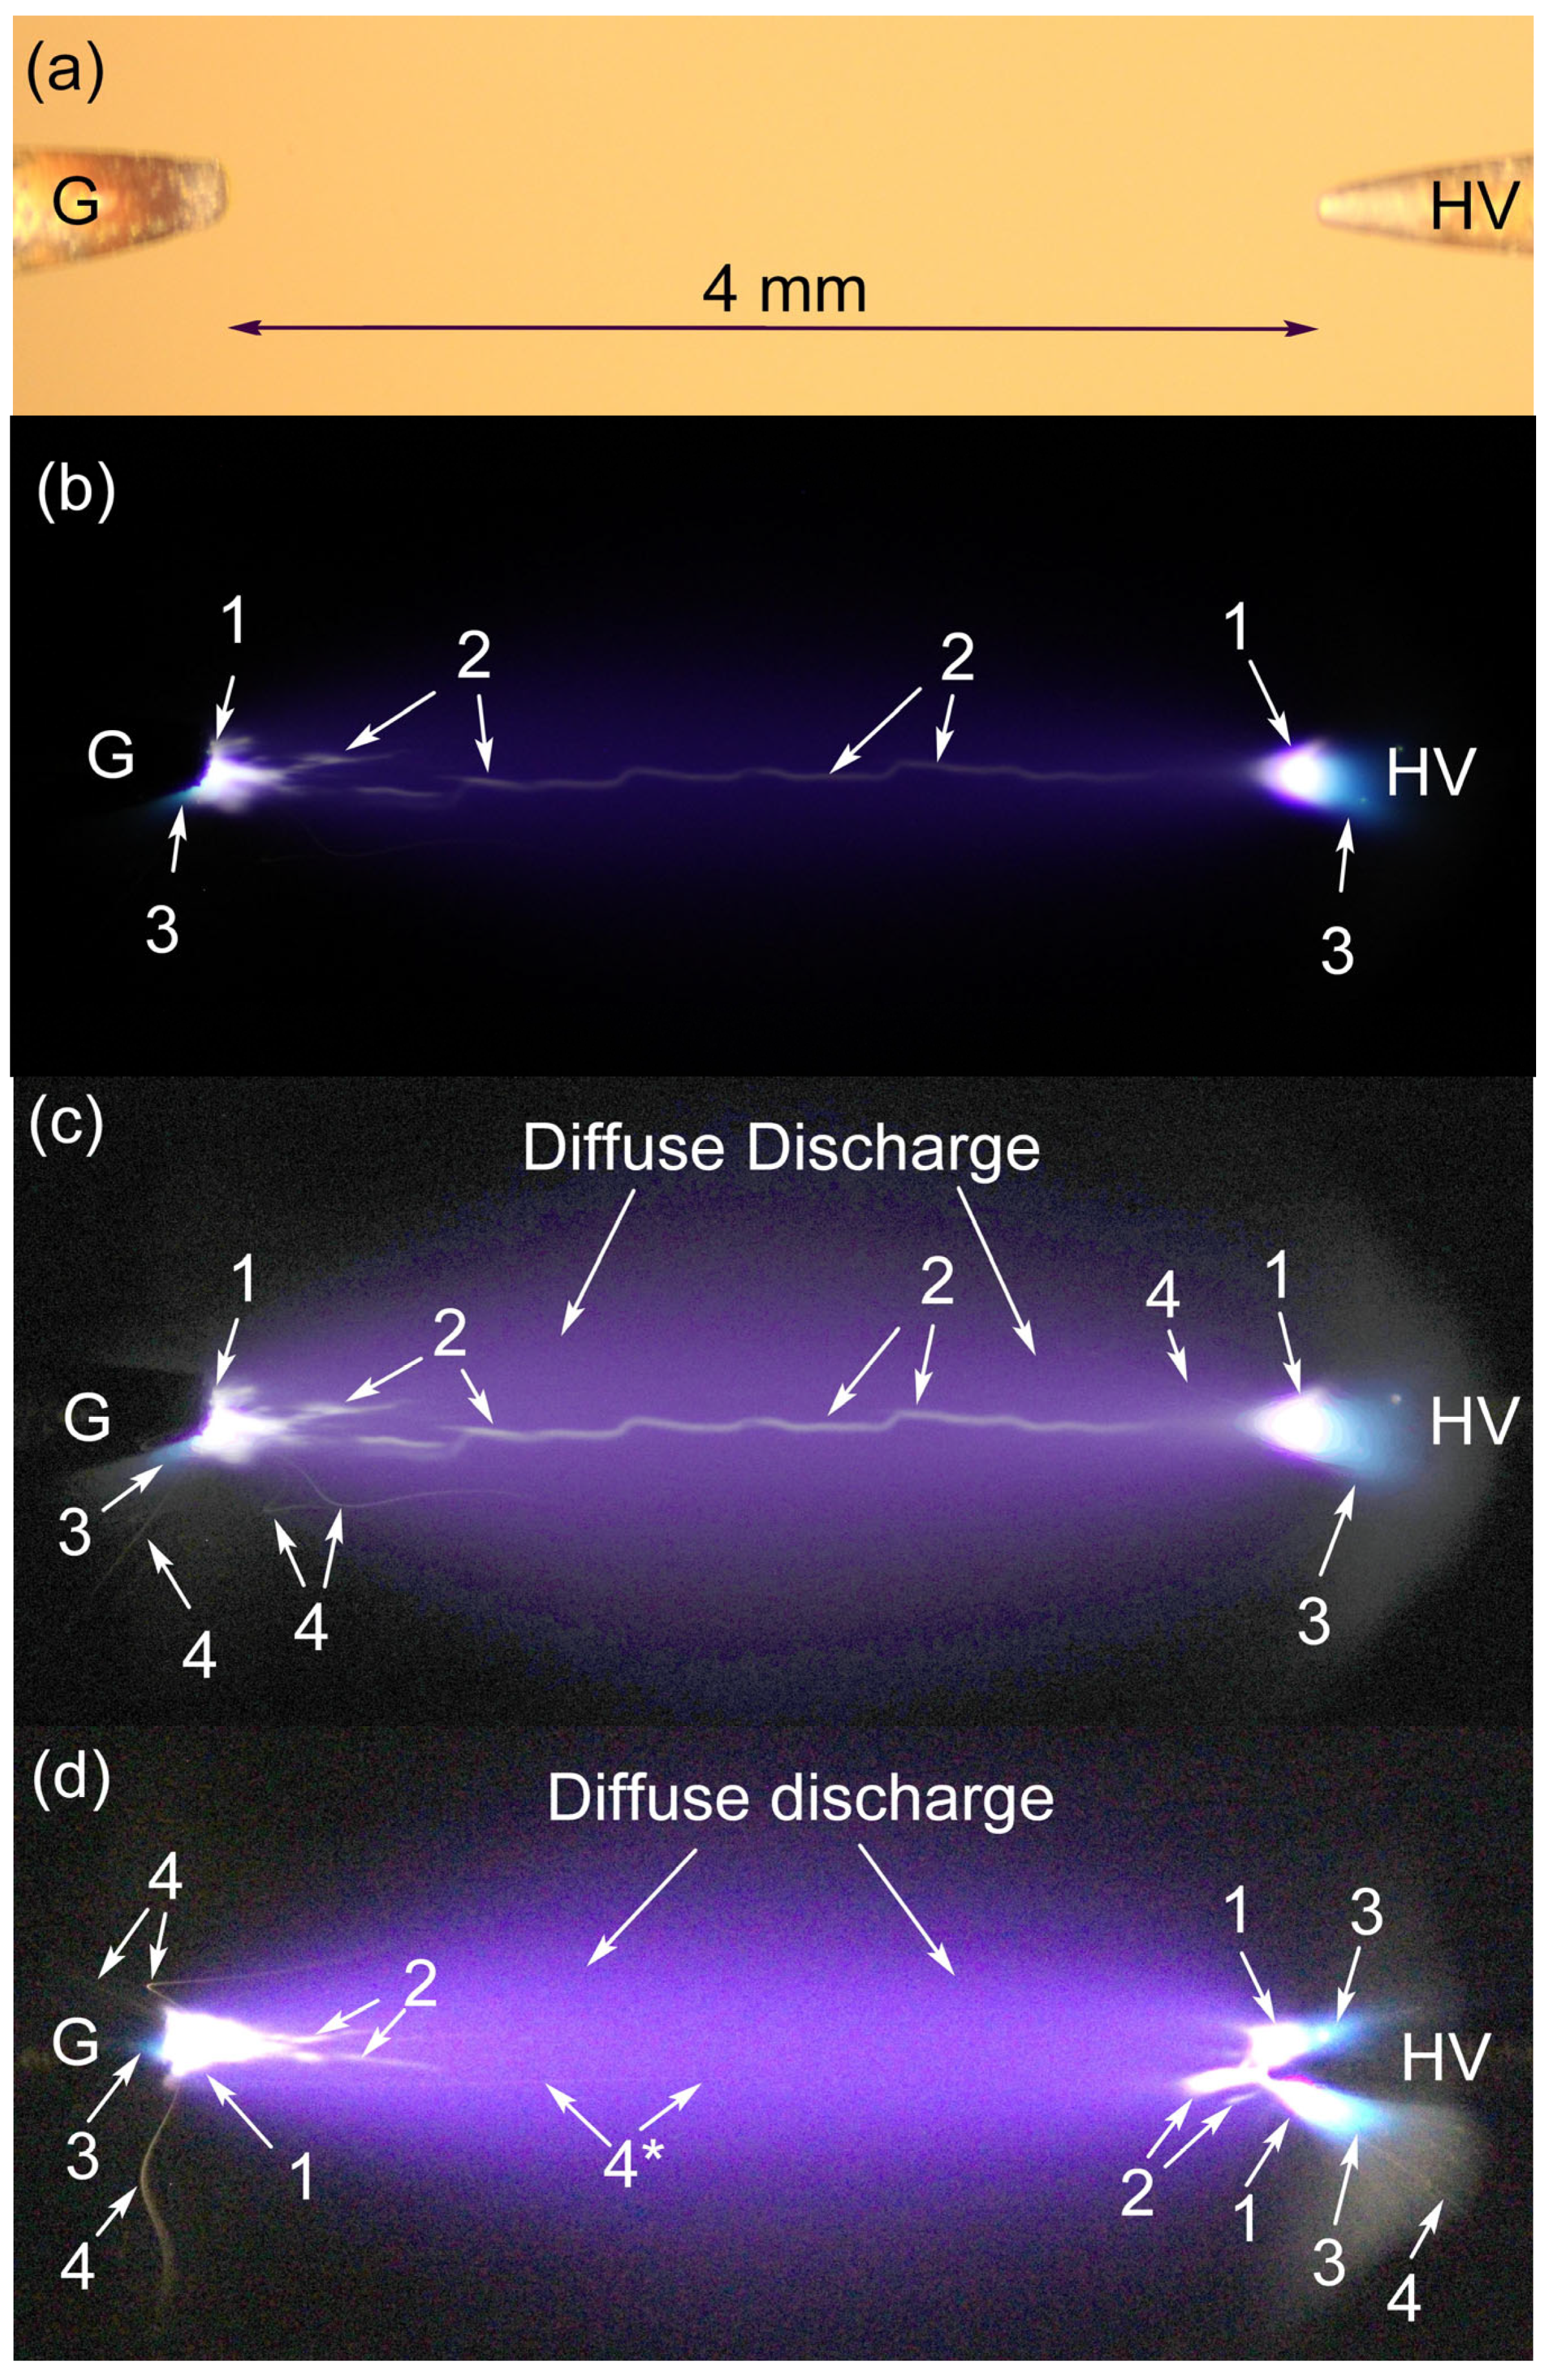
  • TLTs are formed mainly from the part of the electrode surface with bright white spots appearing. The shape and number of the tracks vary from pulse to pulse and depend on the gas kind and pressure, as well as the voltage pulse amplitude.
  • A decrease in the voltage pulse amplitude from the GIN-55-01 generator usually reduces the length of the TLTs, and their number. As the number of visible TLTs decreases with the gas pressure, while their apparent length shortens. At the pressure of 30 Torr, short TLTs were observed only at U0 = −18 kV. A decrease in the amplitude of the voltage pulse from the GIN-55-01 generator usually shortens the length of the TLTs and reduces their number. The number of visible TLTs also becomes smaller and their apparent length shortens at low gas pressure. At a pressure of 30 Torr and U0 = −18 kV, only short TLTs were observed.
  • TLTs can change their direction of movement and to the opposite one.
  • TLT can be connected to both high-voltage and grounded electrodes.
  • Discharge constriction does not limit the appearance of TLTs.
  • The blue glow near the electrodes are connected with iron vapor radiation. When changing the electrode material, the radiation color changes [22,31,32].
The formation of TLTs can be explained in the following way. The observed tracks are traces of hot metal particles that fly out of the electrode surface in the area of its contact with the dense plasma. Therefore, the TLT color differs from that of the spark leaders. Initial plasma is formed due to heating and thermal explosion of micro-inhomogeneities through which a current with a high-density flows [27]. As was shown in [33,34,35,36], a decrease in the breakdown voltage in a vacuum cannot be associated only with explosive electron emission from the cathode. Various phenomena must be considered to understand the limitations of the electrical strength of vacuum insulation. Thus, the calculations made in [36] show that the cathode material is subjected to destructive mechanical stresses in an unheated region, the size of which significantly exceeds the size of the explosive electron emission center. As a result, the appearance of a primary cathode spot during vacuum breakdown and the plasma formation near the electrode surface result in multiple local destructions on the periphery of the electrode surface under the action of mechanical stresses.
In our conditions, as the spot sizes increased, some of the spots initiated TLTs. Moreover, the tracks were observed from the electrode surface with both voltage pulse polarities. The visible luminescence of TLTs is explained by their comparatively high temperature. Particles can be heated by their interaction with air, including their oxidation. The sharp curves of the tracks and the change in direction of their movement can be explained by a change in the polarity and magnitude of the TLTs charge along with the change in the voltage polarity across the gap-reflected pulses. However, experiments with the ICCD camera showed that the appearance of particles from the electrodes occurs after the attenuation of the reflected voltage pulses. It has been established that TLTs during one voltage pulse from the generator are adjacent to both electrodes. There are pulses in which a large number of TLTs are in contact with one bright spot, and some of the TLTs are in contact with the electrode at the periphery of the bright spots. It can be assumed that the appearance of TLTs in our experiments is associated with an increase in the electric field near electrodes with a small radius of curvature, and the appearance of a dense plasma near the electrodes as in vacuum discharges (see, e.g., [33,34,35,36]). This leads to the departure of micro- and nanoparticles of metal from the electrode surface under the influence of mechanical stresses.
High voltage pulses with short rise times can increase mechanical stresses. Apparently, this is not enough. Additional amplification of the electric field is necessary, and the explosion of microprotrusions on the electrodes due to the formation of plasma (white bright spots) can provide electric field enhancement. The formation of bright spots on the electrodes in vacuum was discussed in [36].
It can also be assumed that nanoparticles increase the electric field strength in the region of their appearance and at a distance from the electrodes. This can lead to the formation of thin streamers with high electron number density, if the strength of the reduced electric field in this region is higher than the critical one

5. Conclusions

The plasma of nanosecond discharges formed in an inhomogeneous electric field was studied with a high spatial resolution using a long-distance microscope. Thin luminous tracks with a minimum transverse size of less than 2 μm were found against the background of the diffuse discharge in air and argon between the electrodes, as well as on the side of the electrodes. It has been established that TLTs are usually adjacent to bright spots on the electrodes, have a variety of shapes, and can change the direction of their movement to the opposite. Their length in atmospheric air can reach the length of the discharge gap.
We assume that the TLT formation is associated with the release of metal particles from the surface of the electrodes under the influence of stresses that arise due to mechanical phenomena. In this case, the amplification of the electric field due to the shape of the electrodes and the formation of a dense plasma via a thermal explosion of microprotrusions affect the TLT occurrence. A similar phenomenon is observed in vacuum discharges due to explosive electron emission [33,34,35,36]. TLTs in diffuse discharges in air, argon, and apparently, in other gases, are in contact with both electrodes, in contrast to discharge in vacuum.
The tracks differ in color from the spark leaders, which lead to the formation of spark channels in diffuse discharges. In addition, the metal particles releasing from the surface of electrodes, can enhance the electric field strength in the region of their appearance during voltage pulses and initiate the development of streamers. It the electric field strength is higher that the critical one, streamers develop along their path. The trajectories of TLTs and streamers should coincide in separate sections of their path and be straight, which was recorded in many pulses; see Figure 4b.

Author Contributions

Conceptualization, writing original draft, V.F.T.; experiments, analysis, methodology, D.V.B. and A.N.P.; editing, project administration, D.A.S. All authors have read and agreed to the published version of the manuscript.

Funding

This research was supported by the Ministry of Science and Higher Education of the Russian Federation within Agreement no. 075-15-2021-1026 of 15 November 2021.

Data Availability Statement

Data are contained within the paper.

Conflicts of Interest

The authors declare no conflict of interest. The funders had no role in the design of the study; in the collection, analyses, or interpretation of data; in the writing of the manuscript, or in the decision to publish the results.

References

  1. Tarasenko, V.F.; Baksht, E.K.; Burachenko, A.G.; Kostyrya, I.D.; Lomaev, M.I.; Rybka, D.V. Generation of supershort avalanche electron beams and formation of diffuse discharges in different gases at high pressure. Plasma Devices Oper. 2008, 16, 267–298. [Google Scholar] [CrossRef]
  2. Chng, T.L.; Brisset, A.; Jeanney, P.; Starikovskaia, S.M.; Adamovich, I.V.; Tardiveau, P. Electric field evolution in a diffuse ionization wave nanosecond pulse discharge in atmospheric pressure air. Plasma Sources Sci. Technol. 2019, 28, 9LT02. [Google Scholar] [CrossRef]
  3. Tarasenko, V.F. Runaway electrons in diffuse gas discharges. Plasma Sources Sci. Technol. 2020, 29, 34001. [Google Scholar] [CrossRef]
  4. Černák, M.; Hoder, T.; Bonaventura, Z. Streamer breakdown: Cathode spot formation, Trichel pulses and cathode-sheath instabilities. Plasma Sources Sci. Technol. 2019, 29, 13001. [Google Scholar] [CrossRef]
  5. Brisset, A.; Tardiveau, P.; Gazeli, K.; Bournonville, B.; Jeanney, P.; Ouaras, K.; Magne, L.; Pasquiers, S. Experimental study of the effect of water vapor on dynamics of a high electric field non-equilibrium diffuse discharge in air. J. Phys. D Appl. Phys. 2021, 54, 215204. [Google Scholar] [CrossRef]
  6. Huang, B.; Zhang, C.; Ren, C.; Shao, T. Guiding effect of runaway electrons in atmospheric pressure nanosecond pulsed discharge: Mode transition from diffuse discharge to streamer. Plasma Sources Sci. Technol. 2022, 31, 114002. [Google Scholar] [CrossRef]
  7. Erofeev, M.; Lomaev, M.; Ripenko, V.; Shulepov, M.; Sorokin, D.; Tarasenko, V. Generators of Atmospheric Pressure Diffuse Discharge Plasma and Their Use for Surface Modification. Plasma 2019, 2, 27–38. [Google Scholar] [CrossRef] [Green Version]
  8. Korolev, I.D.; Kuzmin, V.A.; Mesiats, G.A. Nanosecond Gas Discharge in an Inhomogeneous Field with Explosive Processes on the Electrodes. Sov. Phys. Technol. Phys. 1980, 25, 418–420. [Google Scholar]
  9. Kostyrya, I.D.; Tarasenko, V.F. Formation of a volume discharge in air at atmospheric pressure upon application of nanosecond high-voltage pulses. Russ. Phys. J. 2004, 47, 1314–1316. [Google Scholar] [CrossRef]
  10. Rep’ev, A.G.; Repin, P.B.; Pokrovskiĭ, V.S. Microstructure of the current channel of an atmospheric-pressure diffuse discharge in a rod-plane air gap. Technol. Phys. 2007, 52, 52–58. [Google Scholar] [CrossRef]
  11. Almazova, K.I.; Belonogov, A.N.; Borovkov, V.V.; Kurbanismailov, V.S.; Khalikova, Z.R.; Omarova, P.K.; Ragimkhanov, G.B.; Tereshonok, D.V.; Trenkin, A.A. Investigation of the microchannel structure in the initial phase of the discharge in air at atmospheric pressure in the “pin (anode)-plane” gap. Phys. Plasmas 2020, 27, 123507. [Google Scholar] [CrossRef]
  12. Almazova, K.I.; Belonogov, A.N.; Borovkov, V.V.; Khalikova, Z.R.; Ragimkhanov, G.B.; Tereshonok, D.; Trenkin, A. Investigation of plasma properties in the phase of the radial expansion of a spark channel in the ‘pin-to-plate’ geometry. Plasma Sources Sci. Technol. 2021, 30, 95020. [Google Scholar] [CrossRef]
  13. Almazova, K.I.; Belonogov, A.N.; Borovkov, V.V.; Kurbanismailov, V.S.; Ragimkhanov, G.B.; Tren’kin, A.A.; Tereshonok, D.V.; Khalikova, Z.R. Plasma and Gas-Dynamic Near-Electrode Processes in the Initial Phase of a Microstructured Spark Discharge in Air. Technol. Phys. Lett. 2020, 46, 737–740. [Google Scholar] [CrossRef]
  14. Parkevich, E.V.; Ivanenkov, G.V.; Medvedev, M.A.; Khirianova, A.I.; Selyukov, A.S.; Agafonov, A.V.; Mingaleev, A.R.; Shelkovenko, T.A.; Pikuz, S.A. Mechanisms responsible for the initiation of a fast breakdown in an atmospheric discharge. Plasma Sources Sci. Technol. 2018, 27, 11LT01. [Google Scholar] [CrossRef]
  15. Parkevich, E.; Medvedev, M.; Khirianova, A.; Ivanenkov, G.; Selyukov, A.; Agafonov, A.; Shpakov, K.V.; Oginov, A. Extremely fast formation of anode spots in an atmospheric discharge points to a fundamental ultrafast breakdown mechanism. Plasma Sources Sci. Technol. 2019, 28, 125007. [Google Scholar] [CrossRef]
  16. Smaznova, K.; Khirianova, A.; Parkevich, E.; Medvedev, M.; Varaksina, E.; Khirianov, T.; Oginov, A.; Selyukov, A. Precise optical registration of fine-structured electrical sparks and related challenges. Opt. Express 2021, 29, 35806–35819. [Google Scholar] [CrossRef]
  17. Tarasenko, V.F.; Lomaev, M.I.; Sorokin, D.A.; Kozyrev, A.V.; Baksht, E.K. Spark discharge formation in an inhomogeneous electric field under conditions of runaway electron generation. J. Appl. Phys. 2012, 111, 23304. [Google Scholar] [CrossRef]
  18. Van der Horst, R.M.; Verreycken, T.; van Veldhuizen, E.M.; Bruggeman, P.J. Time-resolved optical emission spectroscopy of nanosecond pulsed discharges in atmospheric-pressure N2 and N2/H2O mixtures. J. Phys. D Appl. Phys. 2012, 45, 345201. [Google Scholar] [CrossRef] [Green Version]
  19. Patel, K.; Saha, A.; Zhou, T.; Meyer, T.R.; Bane, S.; Satija, A. Spectrally filtered ps–ns emission dynamics of atmospheric-pressure nanosecond pulsed plasmas. Appl. Phys. Lett. 2022, 120, 14101. [Google Scholar] [CrossRef]
  20. Beilis, I. Plasma and Spot Phenomena in Electrical Arcs; Springer Series on Atomic, Optical and Plasma Physiscs; Springer: Cham, Switzerland, 2020; Volume 113, pp. 255–283. [Google Scholar] [CrossRef]
  21. Syrovatka, R.A.; Lipaev, A.M.; Naumkin, V.N.; Klumov, B.A. Plasma Crystal in (3 + 1) Dimensions. JETP Lett. 2022, 116, 834–869. [Google Scholar] [CrossRef]
  22. Tarasenko, V.; Vinogradov, N.; Beloplotov, D.; Burachenko, A.; Lomaev, M.; Sorokin, D. Influence of Nanoparticles and Metal Vapors on the Color of Laboratory and Atmospheric Discharges. Nanomaterials 2022, 12, 652. [Google Scholar] [CrossRef] [PubMed]
  23. Lomaev, M.; Tarasenko, V.; Shulepov, M.; Beloplotov, D.; Sorokin, D. Nano-and Microparticles of Carbon as a Tool for Determining the Uniformity of a Diffuse Discharge Exposure. Surfaces 2023, 6, 40–52. [Google Scholar] [CrossRef]
  24. Panchenko, A.N.; Beloplotov, D.V.; Kozevnikov, V.V.; Sorokin, D.A.; Tarasenko, V.F. Wide Emission Bands of Plasma of a Sub-Nanosecond Discharge in Xenon and Inaccuracies in Their Measurements. IEEE Trans. Plasma Sci. 2021, 49, 1614–1620. [Google Scholar] [CrossRef]
  25. Efanov, V.M.; Efanov, M.V.; Komashko, A.V.; Kriklenko, A.V.; Yarin, P.M.; Zazoulin, S.V. Ultra-Wideband, Short Pulse Electromagnetics; Springer: New York, NY, USA, 2010; pp. 301–305. [Google Scholar] [CrossRef]
  26. Chsherbakov, I.; Lozinskaya, A.; Mihaylov, T.; Novikov, V.; Shemeryankina, A.; Tolbanov, O.; Tyazhev, A.; Zarubin, A.; Beloplotov, D.; Tarasenko, V. Response of HR-GaAs:Cr sensors to subnanosecond X- and β-ray pulses. J. Instrum. 2019, 14, C12016. [Google Scholar] [CrossRef]
  27. Korolev, Y.D.; Mesyats, G.A. Field-Emission and Explosive Processes in Gas Discharges; Nauka: Novosibirsk, Russia, 1982; 255p. (In Russian) [Google Scholar]
  28. Tarasova, L.V.; Khudyakova, L.N.; Loiko, T.V.; Tsukerman, V.A. Fast Electrons and X-ray from Nanosecond Gas Discharges at Pressures 0.1–760 Torr. Sov. Phys. Technol. Phys. 1974, 19, 351–355. [Google Scholar]
  29. Babich, L.P. High-Energy Phenomena in Electric Discharges in Dense Gases: Theory, Experiment, and Natural Phenomena; ISTC Science and Technology Series; Futurepast Incorporated: Arlington, TX, USA, 2003; Volume 2, 358p. [Google Scholar]
  30. Beloplotov, D.V.; Genin, D.E.; Pechenitsin, D.S. The polarity effect of nanosecond voltage pulses on the propagation of streamers in a point-to-plane gap filled with air. Jpn. J. Appl. Phys. 2020, 59, SHHC06. [Google Scholar] [CrossRef]
  31. Tarasenko, V.F.; Beloplotov, D.V.; Lomaev, M.I. Colored Diffuse Mini Jets in Runaway Electrons Preionized Diffuse Discharges. IEEE Trans. Plasma Sci. 2016, 44, 386–392. [Google Scholar] [CrossRef]
  32. Beloplotov, D.V.; Lomaev, M.I.; Sorokin, D.A.; Tarasenko, V.F. Blue and green jets in laboratory discharges initiated by runaway electrons. J. Phys. Conf. Ser. 2015, 652, 012012. [Google Scholar] [CrossRef] [Green Version]
  33. Nefedtsev, E.V.; Onischenko, S.A. Position of erosion marks on the surface of single-crystal and coarse-grained cathodes after a short-pulse vacuum spark. In Proceedings of the 2020 29th International Symposium on Discharges and Electrical Insulation in Vacuum (ISDEIV), Padova, Italy, 26–30 September 2021; pp. 23–26. [Google Scholar] [CrossRef]
  34. Yakovlev, E.V.; Petrov, V.I.; Onischenko, S.A.; Nefedtsev, E.V. Short-pulse breakdown of near-cathode sheath in the presence of a local magnetic field. In Proceedings of the 2020 29th International Symposium on Discharges and Electrical Insulation in Vacuum (ISDEIV), Padova, Italy, 26–30 September 2021; pp. 81–84. [Google Scholar] [CrossRef]
  35. Korsbäck, A.; Djurabekova, F.; Wuensch, W. Statistics of vacuum electrical breakdown clustering and the induction of follow-up breakdowns. AIP Adv. 2022, 12, 115317. [Google Scholar] [CrossRef]
  36. Nefedtsev, E.V.; Onischenko, S.A. Modification of the Cathode Material around the Explosive Electron Emission Centers in the Spark Stage of Vacuum Breakdown. Technol. Phys. Lett. 2022, 48, 69–71. [Google Scholar] [CrossRef]
Figure 1. Schematic diagram of the experimental setup [25].
Surfaces 06 00014 g001
Figure 2. Waveforms of voltage pulses across the gap at no load operation (idle) and in the case of discharge formation (a); X-ray bremsstrahlung pulse from the side window behind 20-µm-thickness copper foil. Air pressure p = 760 Torr, the voltage pulse amplitude in the incident wave is U0 = –34 kV, generator GIN-55-01 (b).
Surfaces 06 00014 g002
Figure 3. Waveforms of the volatge and current obtained with the GIN-55-01 generator, U0 = −33 kV, air pressure p = 760 Torr (a,b), and with the GIN-50-1 generator, U0 = +11 kV, p = 100 Torr (c,d). The reflected voltage and current pulses arriving with a delay of ≈50 ns are seen after the first pulses.
Surfaces 06 00014 g003
Figure 4. The discharge gap image: G and HV are grounded and high-voltage electrodes (a); original image of the glow in the discharge gap (b); the same image after adjusting the brightness and contrast levels (c); image after correction of brightness and contrast levels, obtained under the same conditions as in (c), but with another voltage pulse (d); 1—bright white spots on the electrodes on and near, 2—spark leaders, 3—areas of blue glow near the electrodes, 4—thin luminous tracks with curves, 4*—straight luminous track. Air pressure p ≈ 760 Torr, the voltage pulse amplitude in the incident wave U0 = −33 κB.
Surfaces 06 00014 g004
Figure 5. Emission spectra of the discharge plasma obtained with the GIN-55-1 generator, U0 = −33 kV (a) and GIN-50-1 generator, U0 = +6 kV (b). The pulse repetition rate is 10 Hz. (vi) − (vj) denotes transitions of the nitrogen 2+ system in nm.
Surfaces 06 00014 g005
Figure 6. Images of the discharge after correction of the brightness and contrast levels, obtained in air (a,b) and argon (c) at p = 100 Torr for different amplitudes of the voltage +U0 in the incident wave from the GIN-50-1 generator. G and HV designate grounded and high-voltage electrodes. 1—bright white spots on the electrodes near the tips, 2—spark leaders, 3—glowing blue area near the electrodes, 4—thin luminous tracks with curves, 4*—straight track.
Surfaces 06 00014 g006aSurfaces 06 00014 g006b
Figure 7. ICCD images of discharge plasma glow in air at p = 760 Torr demonstrating the thin luminous tracks 4. Single pulse mode, U0 = +16 kV, GIN-50-1 generator. (a) 5th–10th μs (inclusively), (b) 45th–65th μs, (c) 5th–105th μs. The run of the ICCD camera was synchronized with applying of a voltage pulse to the gap.
Surfaces 06 00014 g007
Disclaimer/Publisher’s Note: The statements, opinions and data contained in all publications are solely those of the individual author(s) and contributor(s) and not of MDPI and/or the editor(s). MDPI and/or the editor(s) disclaim responsibility for any injury to people or property resulting from any ideas, methods, instructions or products referred to in the content.

