Article

Co3O4 Nanopetals on Si as Photoanodes for the Oxidation of Organics

1
Department of Chemical Sciences, University of Padova, via Marzolo 1, 35121 Padova, Italy
2
Physics and Astronomy Department, University of Padova, via Marzolo 6, 35121 Padova, Italy
*
Author to whom correspondence should be addressed.
Surfaces 2019, 2(1), 41-53; https://doi.org/10.3390/surfaces2010004
Submission received: 13 November 2018 / Revised: 8 January 2019 / Accepted: 9 January 2019 / Published: 11 January 2019
(This article belongs to the Special Issue Electrochemical Surface Science: Basics and Applications)

Abstract

:
Cobalt oxide nanopetals were grown on silicon electrodes by heat-treating metallic cobalt films deposited by DC magnetron sputtering. We show that cobalt oxide, with this peculiar nanostructure, is active towards the photo-electrochemical oxidation of water as well as of organic molecules, and that its electrochemical properties are directly linked to the structure of its surface. The formation of Co3O4 nanopetals, induced by oxidizing annealing at 300 °C, considerably improves the performance of the material with respect to simple cobalt oxide films. Photocurrent measurements and electrochemical impedance are used to explain the behavior of the different structures and to highlight their potential application in water remediation technologies.

Graphical Abstract

1. Introduction

The photoelectrochemical oxidation of water is a major topic in modern chemical engineering; key technologies, such as the production of hydrogen and oxygen as renewable fuels [1] and the quantification [2] and abatement of organic pollutants [3,4] in the field of water remediation, in fact, depend on it. The cornerstone for the development of scalable Photoelectrochemical Water Oxidation (PEC-WO) processes is to find cost-effective, active, and durable semiconducting photo-electrodes able to sustain oxygen evolution reaction (OER) for long periods of time. To this end, silicon is a preferred material, as it possesses a suitable band gap and is readily available. The amount of oxygen produced by Si photoelectrodes, however, is usually small. More importantly, the performances of silicon photoanodes decay rapidly due to corrosion. To overcome these problems, Si-based water-splitting electrodes require the use of a thin (210 nm) protective coating; the thickness of the coating should be precisely controlled, as a layer which is too thick is reported to hamper the performance of the underlying Si [5,6]. The metals commonly used for this purpose are Ru [7], Ni [8], NiOx [9], Ir [10], Cu [11], CuOx [12], MnOx [13], Co, and CoOx [14].
Cobalt oxide, in particular, has been shown to be effective as a protective layer in a variety of conditions [15,16], as it is particularly stable in the strongly basic conditions employed for the electro-oxidation of water. The use of Co3O4 thin films as passivating layers was also explored by Yang et al. [17], who obtained a stable photocurrent as high as 17 mA/cm−2 in 1 M potassium hydroxide (KOH; pH = 13.6). On the other hand, thanks to its absorption in the visible range, cobalt oxide has also been used as a visible light sensitizer to increase the activity of wide band-gap photoanodes at longer wavelengths [18,19,20].
In this work, we show that cobalt oxide is an active participant in the electrochemical oxidation of water under visible light irradiation, and that it can be effectively used as a stand-alone photoanode. The thermal oxidation of a Co film, deposited by Direct Current (DC) magnetron sputtering on n-Si(100), forms p-type Co3O4 layers. These systems are electrodes with a stable anodic photocurrent in both neutral Na2SO4 and NaOH solutions. Moreover, we demonstrate that the controlled nano-structuring of the cobalt oxide structure produces significant improvements in photoelectrode performance. We further apply these findings to the oxidation of various organic molecules, and show that the photocurrent increases proportionally with the organic content of the solution [21,22], indicating that cobalt oxide photoanodes can be a promising material for applications in water remediation, as well as a greener, more efficient alternative for the determination of chemical oxygen demand (COD), with respect to commonly used dichromate methods [23]. In particular, we will show that different thermal treatments of the Co layer give rise to different nanostructures characterized by different electrical and sensing properties.

2. Materials and Methods

2.1. Sample Preparation

The substrates used were n-type Si(100) wafer, preliminarily washed in H2SO4:H2O2 at 90 °C. The native silicon oxide passivation layer, whose typical thickness is about 2 nm [24], was not removed prior to deposition. To this respect, it is worth mentioning that there are several examples in the literature of Si-based photoanodes where the presence of the native silica layer was found to improve the photo-electrochemical performances; some authors suggested that the silica layer may act as an adhesive between the substrate and the deposited film [6]. 50 nm-thick Co films were deposited on the Si substrates by DC magnetron sputtering, with a deposition rate of 1 Å/s. The deposited films were annealed in O2 flux at different temperature values, as detailed in Table 1.

2.2. Structural and Morphological Characterizations

The thickness of the deposited films was measured by Atomic Force Microscopy (AFM) using a NT-MDT PRO Solver microscope (NT-MDT, Moscow, Russia).
Scanning Electron Microscopy (SEM) measurements were carried out with a Zeiss Sigma HDF Field-Emission Scanning Electron Microscopy (FE-SEM), equipped with InLens, Secondary Electrons (SE), and Backscattered Electrons (BSE) detectors for the imaging (Zeiss, Jena, Germany).
Grazing Incidence X-ray Diffraction (GIXRD) spectra were collected with an X’Pert Pro diffractometer (incidence angle = 1 deg) using the Cu Kα radiation. The GIXRD analysis was performed by using MAUD software (University of Trento, Italy) [25].
Surface composition was determined by using X-ray Photoelectron Spectroscopy (XPS) measurements, performed on a custom-built Ultra High Vacuum (UHV) chamber (base pressure = 5 × 10⁻¹⁰ mbar) equipped with a non-monochromatized, double-anode X-ray source (Omicron DAR-400, Scienta-Omicron GmbH, Uppsala, Sweden), a hemispherical electron analyzer (Omicron EA-125, Scienta-Omicron GmbH, Uppsala, Sweden), and a 5-channeltron detector assembly. The electron analyzer had an acceptance angle of ±4°, and the diameter of the analyzed area was 3 mm. The spectra were acquired with Mg Kα radiation.

2.3. Electrochemical Measurements

Electrochemical measurements to test the activity were performed either in 0.1 M sodium sulphate or in 0.1 M sodium hydroxide in milliQ water. The measurements were made with Autolab PGSTAT204 potentiostat (Metrohm, Utrecht, The Netherlands) in a Teflon PhotoElectroChemical (PEC) cell. A Pt coil wire and Ag/AgCl electrode were used as the counter electrode and reference electrode, respectively. The samples were mounted outside the cell and kept in position by an O-ring seal. The electrical contact was obtained by a metal tip which was firmly pressed onto the back of the Si wafer by a spring. All samples were illuminated from the front. Photoelectrochemical experiments were carried out with a white LED with an intensity of about 100 mW/cm2. The light intensity was measured using a photodiode at the same distance from the light source as the sample; the light was passing through the electrolyte solution, and the quartz window mounted on the cell. The light intensity was controlled by the optical bench (Metrohm-Autolab) coupled to the Autolab PGSTAT204 instrument (Metrohm, Utrecht, The Netherlands). All Linear Sweep Voltammetry (LSV) measures have been obtained with a scan rate of 5 mV/s. Electrochemical Impedance Spectroscopy (EIS) data were obtained under illumination, and in the dark condition, the voltage amplitude for EIS measurements was ±10 mV with the frequency range set from 105 Hz to 100 Hz, performing 50 points with logarithmic distribution.

3. Results and Discussion

3.1. Structure and Activity

In Figure 1a–c, the FE-SEM top-view images of the three electrodes are shown. The heating process of the Co metallic film at 300 °C for 4 h (sample labeled PETAL) induces the growth of nanopetals from the layer underneath (Figure 1a). The petals’ surface, ≈100–200 nm wide, is preferentially normal to the original film surface, and the petal thickness is limited to about 10 nm. These structures are similar to others which have previously been observed [26]. The petal formation is dependent on the annealing temperature. Indeed, a similar treatment performed at 450 °C (sample labeled NOPETAL, Figure 1c) induces the formation of a rough surface characterized by relatively large grains and with no nanopetals. If the PETAL sample is further treated at 450 °C (sample labeled HYBRID), the nanopetals are less visible (Figure 1b), and the overall surface morphology is intermediate between that of sample PETAL and of sample NOPETAL. The GIXRD patterns of the three samples (Figure 1d) are all very similar and show the signature of Co3O4 nanocrystals, whose average size is about 25 nm for the sample PETAL, 40 nm for the HYBRID one, and 50 nm for the NOPETAL one.
The different surface morphology has a direct impact on the electrochemical properties of the material towards the oxidation of water. A sketch of the electronic band structure of the prepared electrodes is shown in Figure 1e, where the n-Si substrate and the Co3O4 layer (p-type semiconductor, as shown below) form a “tunneling” p-n junction with an interposed SiOx dielectric barrier [27]. An approximate position of the Valence Band (VB) and Conduction Band (CB) edges of the materials, before the junction is formed, can be easily derived from Pearson absolute electronegativity values [28], where the band-gap values are the ones reported in the literature for Si(100), native SiO2 [29], and Co3O4 [30]. After Fermi-level alignment, the approximate position of the CB and VB edges can be obtained for the sample PETAL from the Mott-Schottky (MS) plots (see SI Figure S2, curve acquired at 2000 Hz) using the formulas [31,32,33]: Ecb(V) = Vfb + 0.1 for Si(100) and Evb(V) ≈ Vfb for Co3O4, where Vfb is the flat-band potential obtained from the MS plots (Vfb = 0.95 V vs. RHE for Si and Vfb = 1.66 V vs. RHE for Co3O4 at 2000 Hz). Different values of Vfb can be obtained in the case of samples NOPETAL and HYBRID due their different nanostructuration [34]. The sketch of Figure 1e indicates that, after the junction has formed, there is an electron migration from Si to Co3O4 that shifts the VB edge of Co3O4 slightly above the VB of Si(100).
Electrochemical measurements were carried out either in 0.1 M NaOH or in Na2SO4, the former being the ideal condition for water oxidation, the latter being more relevant for sensing and water remediation. In fact, in NaOH electrolytes, the difference in the photocurrent values after the addition of small volumes of different analytes (EtOH, glucose, etc.) is less evident, since it is overshadowed by the already high photocurrent value due to hydroxyls oxidation. As shown in Figure 2a, the samples HYBRID and NOPETAL show similar current outputs with respect to water oxidation, despite the different surface morphology. The current for the sample PETAL, on the other hand, is at least three times higher in sodium sulphate, and almost two times higher in alkaline conditions, with a concomitant shift of the onset potential (SI Figure S1).
For the sample PETAL, if a source of carbon like EtOH, MeOH, or glucose is added to the sodium sulphate solution, a clear enhancement of the photocurrent is seen (Figure 2c), indicating that the mineralization process is the decomposition of organic substances and can be described with the reaction [2]: CyHmOjNkXq + (2y − j)H2O → yCO2 + q X + kNH3 + (4y − 2j + m − 3k)H+ + (4y − 2j + m −3k − q)e.
The process is partly due to electron capture by holes on the Co3O4 surface (the other reaction that leads to the mineralization to CO2 involves the reaction with hydroxyl radicals generated during the oxidation of water). The electrode response to chopped illumination is characterized by ”spike and overshoot” photocurrent transients. We attribute the photocurrent spikes of Figure 2c (blue and orange curves) to a high degree of electron and hole recombination on the surface, and to the formation of surface states (trap-states). This is a known behavior which is described, for instance, in [35,36]. When the light is turned on, holes generated in the space-charge region are swept rapidly towards the semiconductor electrolyte junction. Due to the slow kinetics of the four-hole oxidation of water to molecular oxygen, the concentration of holes increases considerably at the interface, until the rate of arrival of holes is balanced in the steady state by the rates of charge transfer and recombination. Since surface recombination leads to a flux of electrons towards the surface, the resulting photocurrent transient is the sum of the hole and electron contributions. A careful analysis of Figure 2c also shows that as soon as a hole scavenger such as glucose is added, the cathodic spikes are strongly attenuated.
It is worth reminding that, quite often, the COD value is obtained by measuring the total charge due to the photocurrent after the degradation to CO2 is complete (see Figure 3a), and its value is expressed as mg O2/L, according to the equation [2]:
COD ( O 2 mg / L ) = nC 4 × 32000 = Q 4 FV × 32000 = K × Q
where n is the number of electrons, C is the concentration of substances, Q is the charge passed, V is the volume of the solution, and F is the Faraday constant. We report in Figure 2b the total charge due to the mineralization process for five different substances, as a function of theoretical COD (mg O2/L). This graph suggests that the charge is directly correlated to the theoretical COD values—in other words, the higher the theoretical COD value, the higher the charge.
To better highlight the proportionality between the photocurrent/charge and organic content, as well as to verify the concentration range to obtain a linear response, further tests were conducted with glucose as a proof-of-concept carbon source, using the PETAL sample as an electrode. Since the current arising from the oxidation of water is lower in sodium sulfate, the current generated by the oxidation process of the organic molecule can be better highlighted. For this reason, the quantification of different concentrations of glucose was reported in a sodium sulfate solution (Figure 2d).
All samples show a linear response with glucose concentration, with the sample PETAL showing the widest linear range of 0.4–4.2 mM (see SI, Table S1), a sensitivity of 7.5 ± 0.1 µA/cm2mM−1, a limit of detection (LOD) of 2.3 ± 0.2 µM, and a limit of quantification (LOQ) of 7.7 ± 0.6 µM (The limit of detection (LOD) and limit of quantification (LOQ) were calculated from the standard deviation (σ) of the linear part of LSV measurements (Figure 2a) and from the slope (b) of the calibration curve (Figure 2d). For LOD, we considered Δj = 3σ as the minimum value of Δj to detect glucose (LOD = 3σ/b), while for LOQ, we considered it to be Δj = 10σ (LOD = 10σ/b). The error was calculated using the propagation formula). Sensitivity and linear range are comparable with some of the values found in the literature for metal oxide nanostructures [38].
Considering a previous report which demonstrates that a passivating film with a thickness of 10 nm is enough to significantly hamper the photoelectro-catalytic activity of silicon [6], we can safely state that the surface of the Co3O4 nanostructured layer (whose average thickness after annealing is about 80 nm) is the only active species in the present scenario. This observation is supported by Mott-Schottky plots (see SI, Figure S2), which show a positive slope (n-type behavior of the silicon wafer) in the dark, but a negative slope (p-type behavior of Co3O4) under illumination, showing that cobalt oxide dominates the photoelectrochemical behavior of the electrode. In this case, the completely different shape of the MS plots under illumination is probably due to inhomogeneities of the electrical field and formation of surface states in the layer where the photocurrent is built up, as recently described in a paper by Kirchartz et al. [39].
To further probe the performance of our nanostructured cobalt oxide layers, phthalate was chosen as the next target molecule. Phthalates form a class of extremely common plasticizers and pollutants, which, due to their large diffusion, cause serious concerns for human health [40]. A long-term test showed that after more than 10 h, the photocurrent had gradually decreased to the value of the clean solution, containing only Na2SO4. In this case, it was possible to calculate the value of COD according to Equation 1, and the proportionality constant K was found to be 1.594 × 10⁻⁴ O2 mg/L × C, a value similar to the ones found in the literature [2], indicating that the mineralization process is mainly due to interaction with hydroxyl radicals. Moreover, X-ray photoelectron spectra (XPS), taken on an as-prepared electrode and on the electrode after the long-term test, showed no significant changes in the 2p peaks of cobalt; in particular, satellites which can be related to Co(II) oxides/hydroxides are absent [41] (Figure 3b), highlighting the excellent stability of the cobalt oxide surface even after prolonged operation.

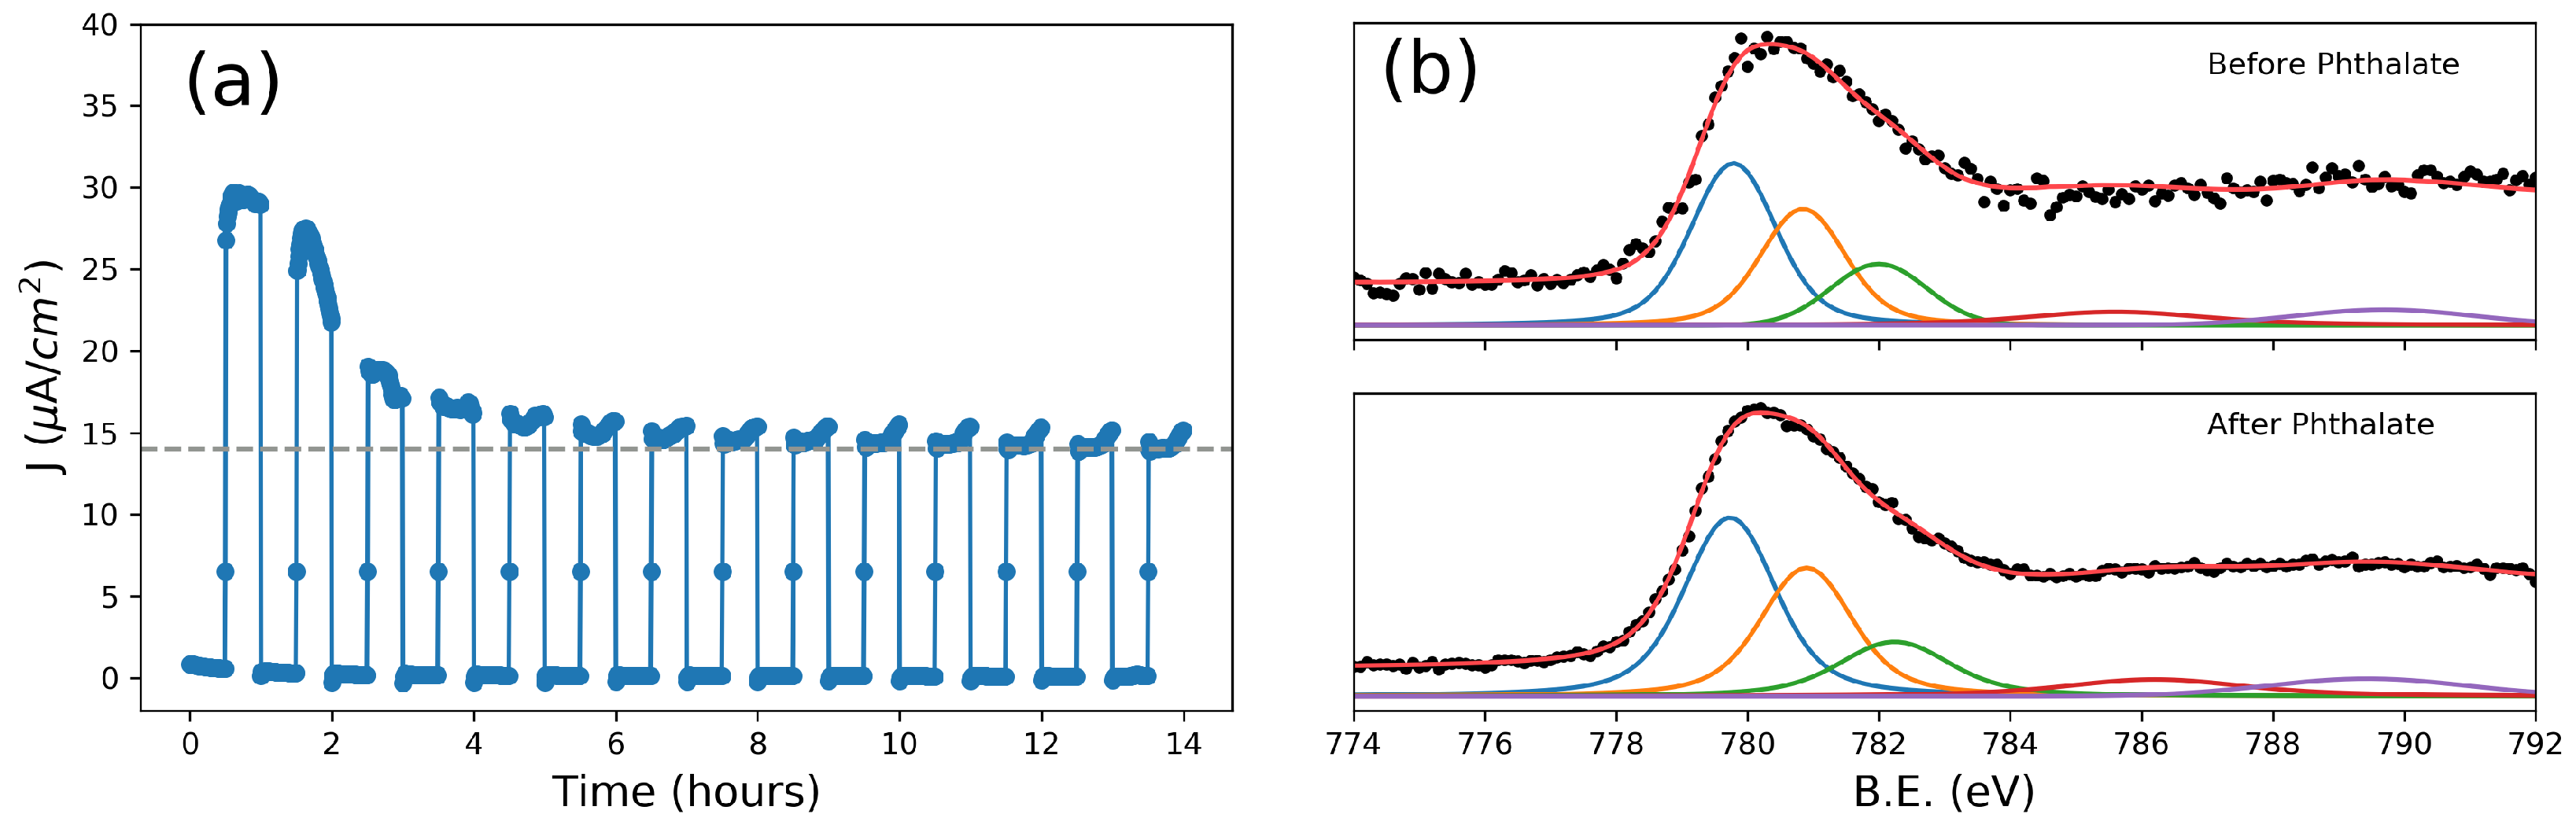
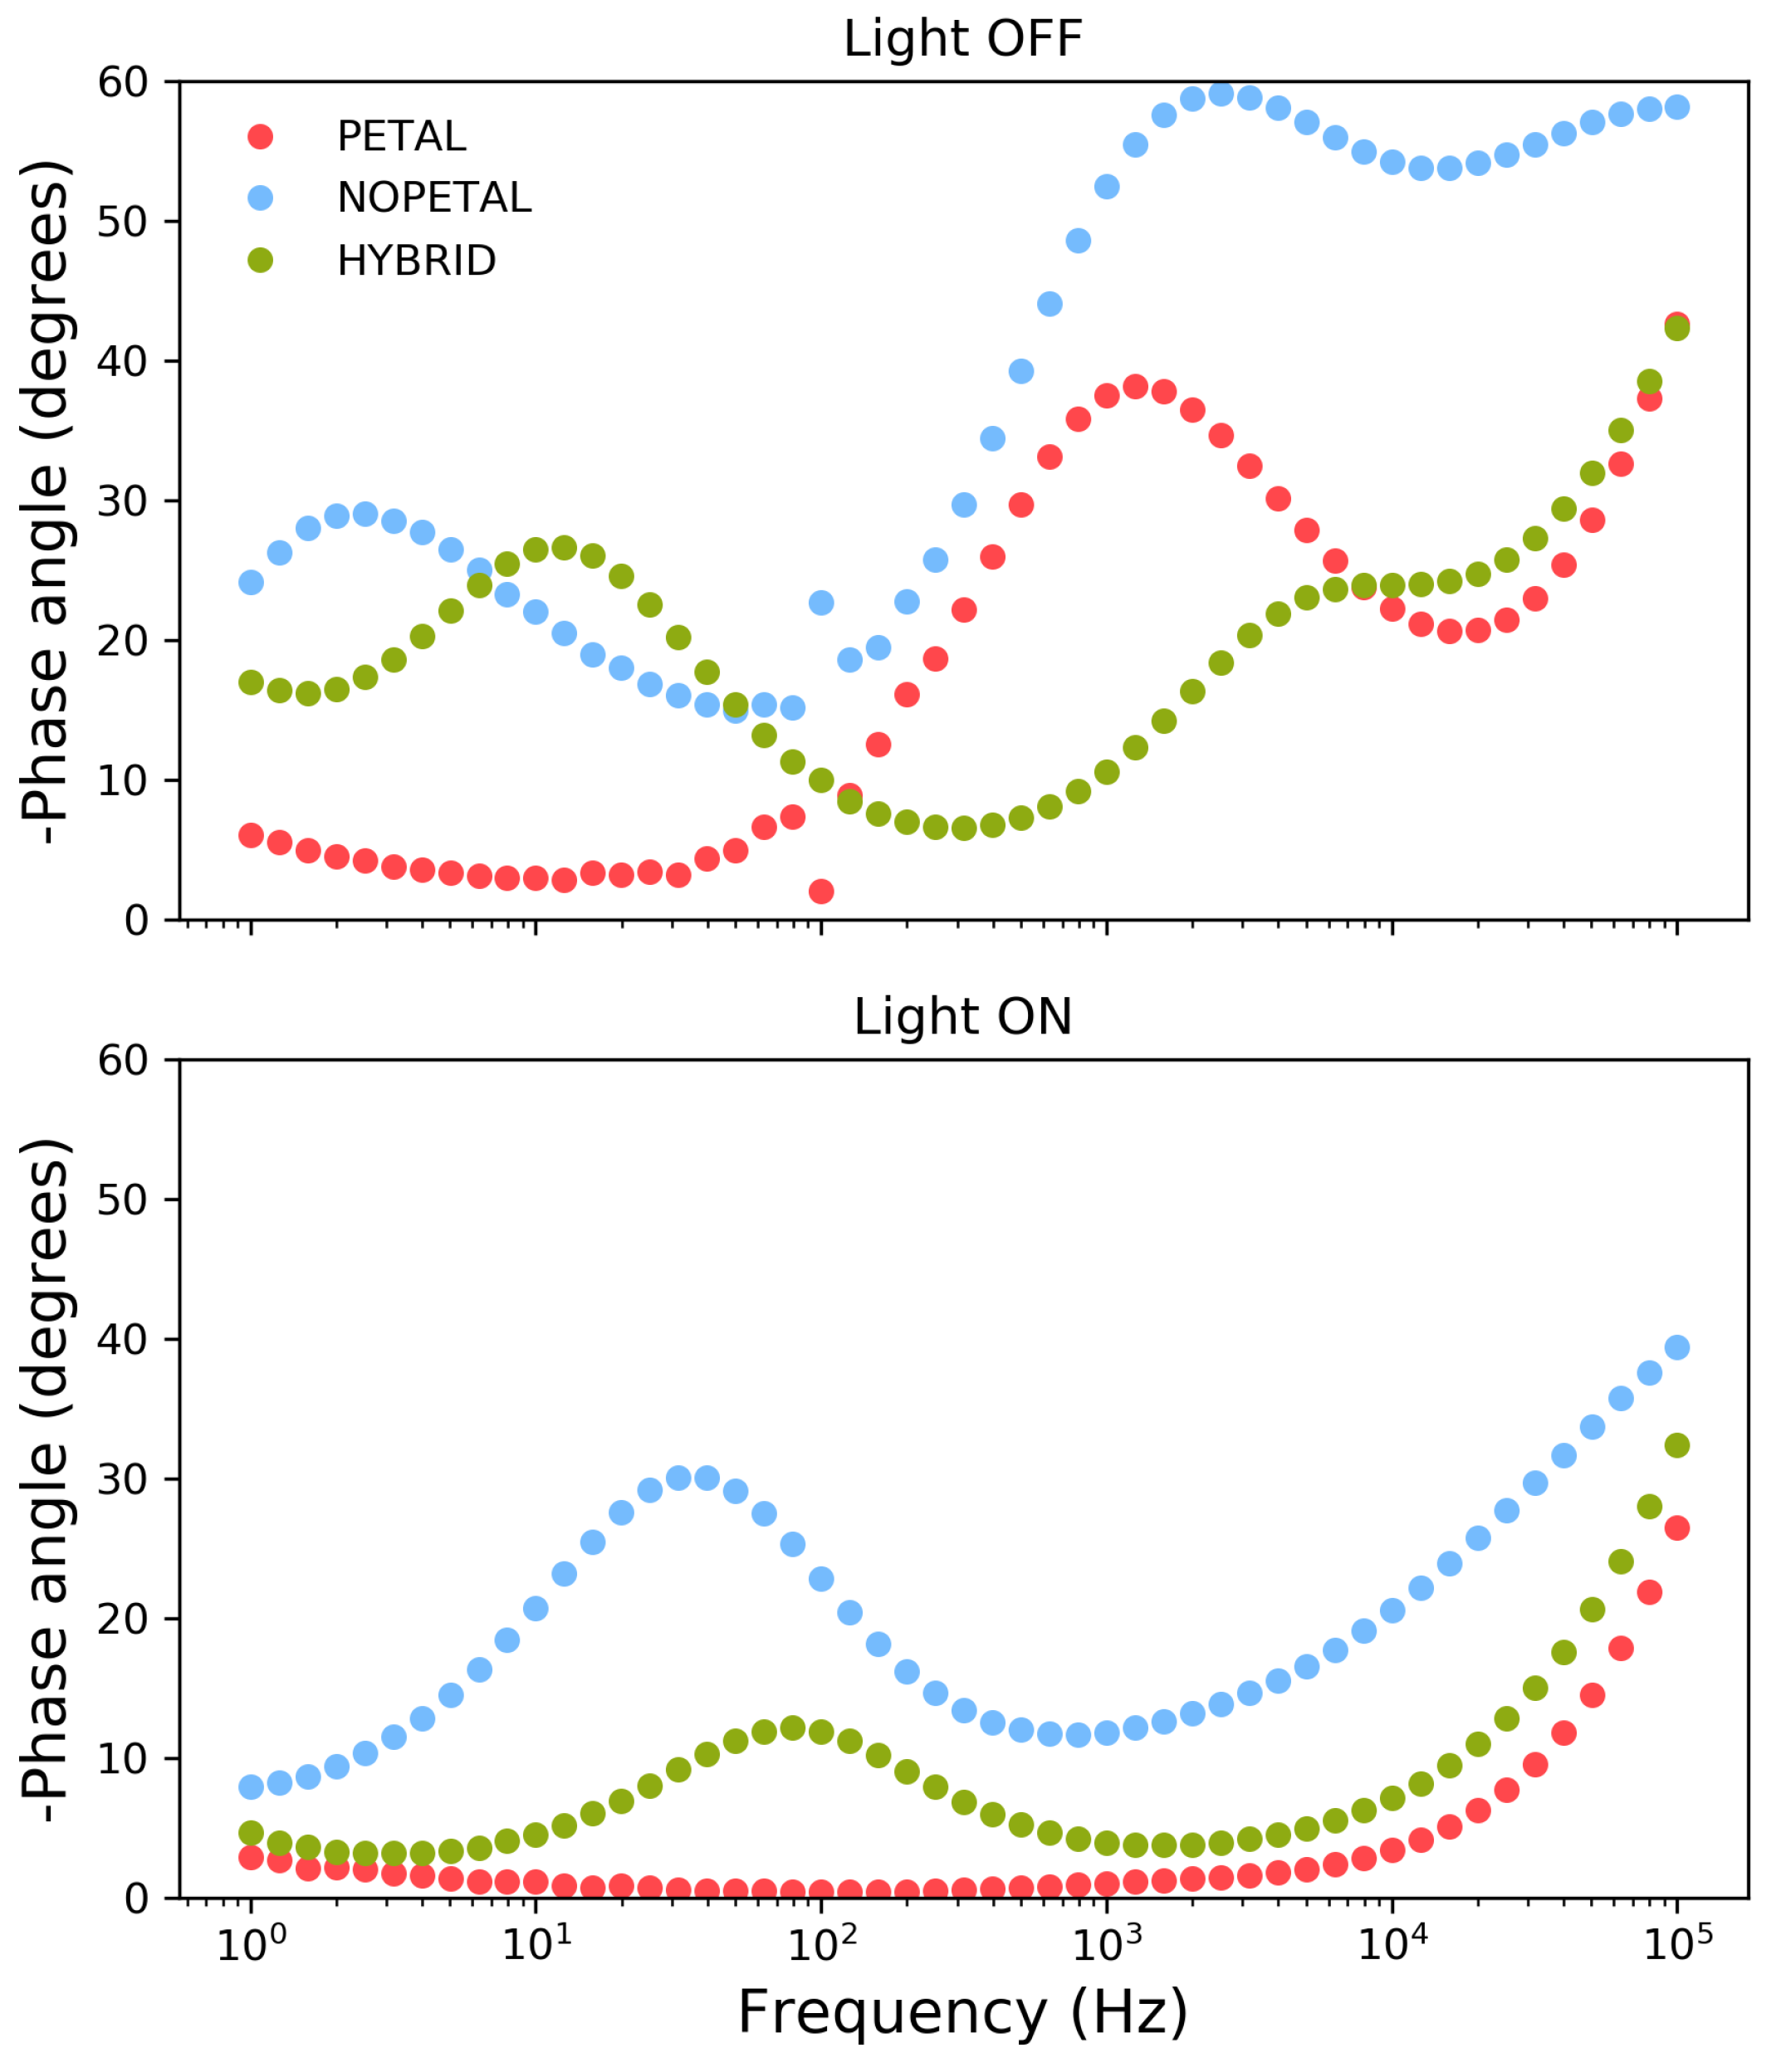
3.2. Mechanistic Analysis

To fully characterize the effect of the surface structure of Co3O4 on its electrochemical properties, glucose was chosen for further analyses. In the literature, the oxidation of glucose is said to be caused by the presence of Co3+ and Co4+ surface states according to the following reaction sequence [42,43]:
Co3O4 + OH + H2O ↔ 3CoOOH + e (0.3 V vs. Ag/AgCl)
CoOOH + OH ↔ CoO2 + H2O + e (0.6 V vs. Ag/AgCl)
2CoO2 + C6H12O6 (glucose) → 2CoOOH + C6H10O6 (gluconolactone)
In the present case, cyclic voltammetries, acquired in NaOH electrolyte, as in the case of Co3O4 nanofibers [44], (CVs, SI Figure S3) never clearly showed the presence of oxidation peaks at about 0.3 V and 0.6 V vs. Ag/AgCl. We attribute this behavior to a much lower surface area of our samples compared with the examples found in the literature, where Co3O4 nano-structrures characterized by a very high surface area were used [45]. Moreover, it is likely that a different mechanism was involved in our case, since an enhancement in the anodic (photo)current appeared only when the sample surface was illuminated.
The effect of light is likely a combination of the population of the conduction band of the silicon substrate, which allows the current to tunnel through the Co3O4/SiO2/Si junction, as well as the creation of active cobalt species on the surface of the electrode. The electrochemical impedance spectra (EIS) reported in Figure 4 and performed in the dark and under illumination with a white LED in Na2SO4 electrolyte, also highlight the presence of two different contributions to the electrochemical properties of the electrodes. EIS experiments were performed at two different overpotentials in order to investigate the behavior of the polarized electrode both with (1 V) and without (0.1 V) the presence of electrochemical reactions.
In the dark, significant differences were already apparent between the NOPETAL and the PETAL layers. At low bias (100 mV vs. Ag/AgCl), the PETAL layer has two contributions of comparable magnitude, one in the low frequency range and one in the high frequency one. The NOPETAL layer shows a major contribution at low frequency, which largely overshadows the high-frequency semi-circle. At low bias, the same behavior is present even when the sample is illuminated. For both samples PETAL and HYBRID, on the other hand, there is a stark decrease in the low-frequency contribution when the LED is turned on. This information can be taken as an indication that, for samples PETAL and HYBRID, the lower-frequency part of the spectrum is dominated by the contribution of surface states. For sample PETAL in particular, a description with three time constants can also be proposed; in this scenario, the second time constant (roughly in the range 10 kHz–150 Hz) disappears when the sample is illuminated. Such an interpretation would suggest the second contribution being due to the space charge layer.
At a bias of 1 V in the dark, the low-frequency contribution remains dominant for both NOPETAL and HYBRID layers; it is significant that, with the increase in bias, the impedance of the high-frequency component for the sample NOPETAL increases. Conversely, in the case of the PETAL layer, the high-frequency contribution remains relatively unvaried, while there is an increase in the mid/low frequency semi-circle, a behavior consistent with the application of a bias at a blocking electrode-solution interface. These results indicate that the structuring of the Co3O4 layer in sample PETAL is also beneficial for the electrical connection with the underlying silicon substrate.
When the electrodes are illuminated at 1 V, Nyquist plots indicate a similar overall decrease in impedance across the entire frequency range for all samples. For samples NOPETAL and HYBRID , a significant impedance response is also present at lower frequencies; a closer inspection of the behavior of the phase angle reveals significant differences in the behavior of the three surface structures in this region (Figure 5). While the PETAL layer shows near-ideal resistive behavior across the frequency spectrum up to 100 Hz, a residual RC contribution at low frequency remains for the NOPETAL and HYBRID layers. We also note that, upon illumination, the phase behavior, as a function of the frequency, is intermediate between the ones of the HYBRID and PETAL layers, corresponding to the fact that the surface morphology is also in between the two (see Figure 1a–c).The overall picture suggests that the formation of surface states (i.e., CoOOH or CoO2) is linked to the presence of the petal-like structures. The time constant visible in Figure 5 with light on, at around 50 Hz, can then be linked to the charge transfer resistance between the electrode and the species in the solution. For sample NOPETAL , there is significant resistance probably given by the fact that the reaction mechanism largely does not directly involve the formation of surface states on the cobalt oxide surfaces. At the opposite extreme, sample PETAL does not have significant contributions in this region due to the direct involvement of Co3O4 surface states in the reaction, which form a low impedance pathway for electrons. Sample HYBRID lies in between; as can be seen in Figure 1, some petal-like structures can be spotted in sample HYBRID, but most of them were destroyed by the thermal treatment.
This qualitative description, implying that the existence of surface states is linked to the presence of petal-like structures, is confirmed by fitting the impedance data by an equivalent circuit (EC), containing, in the case of sample PETAL, three RQ elements corresponding to the Co3O4 interface with a SiOx/Si, Co3O4 space charge region (characterized by the presence of surface states) and the double layer at the interface with the electrolyte [46]. In the case of samples HYBRID and NOPETAL, the EC consists in only two RQ (Q = CPE) elements, relatable to the Co3O4/SiOx/Si interface and Helmholtz layer, confirming the fact that the contribution to the overall process of surface states in these samples is negligible. A table containing the calculated resistances and CPE values, in the three cases, is reported in the Supplementary Materials (Table S2).
The significantly different behavior of the sample PETAL is then to be assigned to a particularly favorable interplay of surface area and the creation of active surface states, showing that nanostructuring is not merely morphological, but has important implications on the electronic structure of the Co3O4 at the interface with the solution. It should be noted that one further element which could contribute to the improved performance of the PETAL sample is the change in the wettability of the surface, which can play an important role when gas-evolving reactions are involved [47]. Further experiments are needed to clarify this point. The possibility of combining the effect of surface structuring, as described herein, with the creation of oxygen vacancies through surface doping [48] makes cobalt oxide photoelectrodes a promising new substrate for the engineering of simple, stable, and effective photoanodes.

4. Conclusions

Nanostructured cobalt oxide layers obtained by oxidation of a 50 nm Co film deposited on 100 n-Si by DC-magnetron sputtering have been produced. The choice of the annealing parameters allowed for the production of a Co3O4 layer decorated with nanopetals. This system can form a versatile and durable photoanode, and has been tested as a sensor for different water-soluble organic molecules in a sodium sulphate solution, obtaining, for glucose, a sensitivity of 7.5 ± 0.1 mA cm−2M−1. This nanostructured electrode can also be effective for water remediation. Indeed, we have shown that under positive bias and visible light illumination, the phthalate gets completely mineralized after about 6 h of electrochemical work. Moreover, the composition of the Co3O4 nanopetal layer after repeated sensing experiments and electrochemical work under the application of illumination and bias is virtually identical to that of the as-grown electrode, as shown by XPS analysis. Different layer morphologies can be obtained by specific thermal treatments which remarkably influence the electrical properties of these electrodes, as proven by EIS measurements and, consequently, their sensing properties. We believe that this nanostructured electrode, formed by Co3O4 nanopetals on Si, can be quite easily engineered to produce sensing devices or larger-area electrodes for water remediation applications.

Supplementary Materials

The following are available at https://www.mdpi.com/2571-9637/2/1/4/s1, Figure S1: Linear sweep voltammetry (5 mV/s) under illumination of the PETAL sample in different electrolyte solutions; Figure S2: Mott-Schottky plots of the prepared samples in the dark and under illumination in Na2SO4; Figure S3: Cyclic voltammetry performed on sample PETALS, in 0.1 M NaOH and 5 mM glucose with scan rate of 40 mV/s in the dark and with illumination; Table S1: Sensing in Sodium Sulphate 0.1 M at 1 V vs. Ag/AgCl; Table S2: Equivalent Circuit parameters.

Author Contributions

Investigation, L.G., L.B.; investigation, writing–original draft preparation, G.A.R.; conceptualization, investigation, writing–review and editing: N.M., B.K., C.M.; writing–review and editing: G.M.

Funding

This research was partially funded by Università degli Studi di Padova, Physics and Astronomy Department, grant number BIRD178923/17. Authors gratefully acknowledge the Italian Minister of University (MIUR) for financial support to the SMARTNESS (Solar driven chemistry: new materials for photo- and electrocatalysis) financed thorough the PRIN 2015K7FZLH.

Acknowledgments

We thank Alessandro Michieletto for helpful discussions.

Conflicts of Interest

The authors declare no conflict of interest. The founding sponsors had no role in the design of the study; in the collection, analyses, or interpretation of data; in the writing of the manuscript, and in the decision to publish the results.

Abbreviations

The following abbreviations are used in this manuscript:
UHVUltra High Vacuum
FE-SEMField Emission- Scanning Electron Microscopy
GIXRDGrazing Incidence X-Ray Diffraction
VBValence Band
CBConduction Band
EISElectrochemical Impedance Spectroscopy
PECPhotoElectroChemical
CODChemical Oxygen Demand
LSVLinear Sweep Voltammetry
XPSX-Ray Photoelectron Spectroscopy

References

  1. Cesar, I.; Sivula, K.; Kay, A.; Zboril, R.; Grätzel, M. Influence of Feature Size, Film Thickness, and Silicon Doping on the Performance of Nanostructured Hematite Photoanodes for Solar Water Splitting. J. Phys. Chem. C 2009, 113, 772–782. [Google Scholar] [CrossRef]
  2. Zhang, J.; Zhou, B.; Zheng, Q.; Li, J.; Bai, J.; Liu, Y.; Cai, W. Photoelectrocatalytic COD determination method using highly ordered TiO2 nanotube array. Water Res. 2009, 43, 1986–1992. [Google Scholar] [CrossRef]
  3. Ganiyu, S.O.; Zhou, M.; Martínez-Huitle, C.A. Heterogeneous electro-Fenton and photoelectro-Fenton processes: A critical review of fundamental principles and application for water/wastewater treatment. Appl. Catal. B Environ. 2018, 235, 103–129. [Google Scholar] [CrossRef]
  4. Garcia-Segura, S.; Brillas, E. Applied photoelectrocatalysis on the degradation of organic pollutants in wastewaters. J. Photochem. Photobiol. C Photochem. Rev. 2017, 31, 1–35. [Google Scholar]
  5. Shi, Y.; Han, T.; Gimbert-Suriñach, C.; Song, X.; Lanza, M.; Llobet, A. Substitution of native silicon oxide by titanium in Ni-coated silicon photoanodes for water splitting solar cells. J. Mater. Chem. A 2017, 5, 1996–2003. [Google Scholar] [CrossRef]
  6. Han, T.; Shi, Y.; Song, X.; Mio, A.; Valenti, L.; Hui, F.; Privitera, S.; Lombardo, S.; Lanza, M. Ageing mechanisms of highly active and stable nickel-coated silicon photoanodes for water splitting. J. Mater. Chem. A 2016, 4, 8053–8060. [Google Scholar] [CrossRef]
  7. Li, L.; Duan, L.; Xu, Y.; Gorlov, M.; Hagfeldt, A.; Sun, L. A photoelectrochemical device for visible light driven water splitting by a molecular ruthenium catalyst assembled on dye-sensitized nanostructured TiO2. Chem. Commun. 2010, 46, 7307–7309. [Google Scholar] [CrossRef]
  8. Kenney, M.J.; Gong, M.; Li, Y.; Wu, J.Z.; Feng, J.; Lanza, M.; Dai, H. High-Performance Silicon Photoanodes Passivated with Ultrathin Nickel Films for Water Oxidation. Science 2013, 342, 836–840. [Google Scholar] [CrossRef]
  9. Sun, K.; McDowell, M.T.; Nielander, A.C.; Hu, S.; Shaner, M.R.; Yang, F.; Brunschwig, B.S.; Lewis, N.S. Stable Solar-Driven Water Oxidation to O2(g) by Ni-Oxide-Coated Silicon Photoanodes. J. Phys. Chem. Lett. 2015, 6, 592–598. [Google Scholar] [CrossRef]
  10. Chen, Y.W.; Prange, J.D.; Duehnen, S.; Park, Y.; Gunji, M.; Chidsey, C.E.D.; McIntyre, P.C. Atomic layer-deposited tunnel oxide stabilizes silicon photoanodes for water oxidation. Nat. Mater. 2011, 10, 539–544. [Google Scholar] [CrossRef]
  11. Du, J.; Chen, Z.; Ye, S.; Wiley, B.J.; Meyer, T.J. Copper as a Robust and Transparent Electrocatalyst for Water Oxidation. Angew. Chem. Int. Ed. 2015, 54, 2073–2078. [Google Scholar] [CrossRef]
  12. Yu, F.; Li, F.; Zhang, B.; Li, H.; Sun, L. Efficient Electrocatalytic Water Oxidation by a Copper Oxide Thin Film in Borate Buffer. ACS Catal. 2015, 5, 627–630. [Google Scholar] [CrossRef]
  13. Strandwitz, N.C.; Comstock, D.J.; Grimm, R.L.; Nichols-Nielander, A.C.; Elam, J.; Lewis, N.S. Photoelectrochemical Behavior of n-type Si(100) Electrodes Coated with Thin Films of Manganese Oxide Grown by Atomic Layer Deposition. J. Phys. Chem. C 2013, 117, 4931–4936. [Google Scholar] [CrossRef] [Green Version]
  14. Artero, V.; Chavarot-Kerlidou, M.; Fontecave, M. Splitting Water with Cobalt. Angew. Chem. Int. Ed. 2011, 50, 7238–7266. [Google Scholar] [CrossRef]
  15. Kosmala, T.; Calvillo, L.; Agnoli, S.; Granozzi, G. Enhancing the Oxygen Electroreduction Activity through Electron Tunnelling: CoOx Ultrathin Films on Pd(100). ACS Catal. 2018, 8, 2343–2352. [Google Scholar] [CrossRef]
  16. Bae, D.; Mei, B.; Frydendal, R.; Pedersen, T.; Seger, B.; Hansen, O.; Vesborg, P.C.K.; Chorkendorff, I. Back-Illuminated Si-Based Photoanode with Nickel Cobalt Oxide Catalytic Protection Layer. ChemElectroChem 2016, 3, 1546–1552. [Google Scholar] [CrossRef] [Green Version]
  17. Yang, J.; Walczak, K.; Anzenberg, E.; Toma, F.M.; Yuan, G.; Beeman, J.; Schwartzberg, A.; Lin, Y.; Hettick, M.; Javey, A.; et al. Efficient and Sustained Photoelectrochemical Water Oxidation by Cobalt Oxide/Silicon Photoanodes with Nanotextured Interfaces. J. Am. Chem. Soc. 2014, 136, 6191–6194. [Google Scholar] [CrossRef] [Green Version]
  18. Ramakrishnan, V.; Kim, H.; Park, J.; Yang, B. Cobalt oxide nanoparticles on TiO2 nanorod/FTO as a photoanode with enhanced visible light sensitization. RSC Adv. 2016, 6, 9789–9795. [Google Scholar] [CrossRef]
  19. Maeda, K.; Ishimaki, K.; Tokunaga, Y.; Lu, D.; Eguchi, M. Modification of Wide-Band-Gap Oxide Semiconductors with Cobalt Hydroxide Nanoclusters for Visible-Light Water Oxidation. Angew. Chem. Int. Ed. 2016, 55, 8309–8313. [Google Scholar] [CrossRef]
  20. Maeda, K.; Ishimaki, K.; Okazaki, M.; Kanazawa, T.; Lu, D.; Nozawa, S.; Kato, H.; Kakihana, M. Cobalt Oxide Nanoclusters on Rutile Titania as Bifunctional Units for Water Oxidation Catalysis and Visible Light Absorption: Understanding the Structure—Activity Relationship. ACS Appl. Mater. Interfaces 2017, 9, 6114–6122. [Google Scholar] [CrossRef]
  21. Wang, C.; Wu, J.; Wang, P.; Ao, Y.; Hou, J.; Qian, J. Photoelectrocatalytic determination of chemical oxygen demand under visible light using Cu2O-loaded TiO2 nanotube arrays electrode. Sens. Actuators B Chem. 2013, 181, 1–8. [Google Scholar]
  22. Zhang, Z.; Chang, X.; Chen, A. Determination of chemical oxygen demand based on photoelectrocatalysis of nanoporous TiO2 electrodes. Sens. Actuators B Chem. 2016, 223, 664–670. [Google Scholar]
  23. Hejzlar, J.; Kopáček, J. Determination of low chemical oxygen demand values in water by the dichromate semi-micro method. Analyst 1990, 115, 1463–1467. [Google Scholar] [CrossRef]
  24. Raider, S.; Flitsch, R.; Palmer, M. Oxide Growth on Etched Silicon in Air at Room Temperature. J. Electrochem. Soc. 1975, 122, 413–418. [Google Scholar] [CrossRef]
  25. Lutterotti, L.; Chateigner, D.; Ferrari, S.; Ricote, J. Texture, Residual Stress and Structural Analysis of Thin Films Using a Combined X-Ray Analysis. Thin Solid Films 2004, 450, 34–41. [Google Scholar] [CrossRef]
  26. Yu, T.; Zhu, Y.; Xu, X.; Shen, Z.; Chen, P.; Lim, C.T.; Thong, J.L.; Sow, C.H. Controlled Growth and Field-Emission Properties of Cobalt Oxide Nanowalls. Adv. Mater. 2005, 17, 1595–1599. [Google Scholar] [CrossRef]
  27. Xie, X.; Chung, H.; Sow, C.; Wee, A. Oxide growth and its dielectrical properties on alkylsilated native-SiO2/Si surface. Chem. Phys. Lett. 2004, 388, 446–451. [Google Scholar] [CrossRef]
  28. Xu, Y.; Schoonen, M.A. The absolute energy positions of conduction and valence bands of selected semiconducting minerals. Am. Mineral. 2000, 85, 543. [Google Scholar] [CrossRef]
  29. Grządziel, L.; Krzywiecki, M.; Peisert, H.; Chassé, T.; Szuber, J. Photoemission study of the Si(111)-native SiO2/copper phthalocyanine (CuPc) ultra-thin film interface. Org. Electron. 2012, 13, 1873–1880. [Google Scholar]
  30. Qiao, L.; Xiao, H.Y.; Meyer, H.M.; Sun, J.N.; Rouleau, C.M.; Puretzky, A.A.; Geohegan, D.B.; Ivanov, I.N.; Yoon, M.; Weber, W.J.; Biegalski, M.D. Nature of the band gap and origin of the electro-/photo-activity of Co3O4. J. Mater. Chem. C 2013, 1, 4628–4633. [Google Scholar] [CrossRef]
  31. Guo, W.; Chemelewski, W.D.; Mabayoje, O.; Xiao, P.; Zhang, Y.; Mullins, C.B. Synthesis and Characterization of CuV2O6 and Cu2V2O7: Two Photoanode Candidates for Photoelectrochemical Water Oxidation. J. Phys. Chem. C 2015, 119, 27220–27227. [Google Scholar] [CrossRef]
  32. Hsu, Y.K.; Yu, C.H.; Chen, Y.C.; Lin, Y.G. Synthesis of novel Cu2O micro/nanostructural photocathode for solar water splitting. Electrochim. Acta 2013, 105, 62–68. [Google Scholar] [CrossRef]
  33. Cardon, F.; Gomes, W.P. On the determination of the flat-band potential of a semiconductor in contact with a metal or an electrolyte from the Mott-Schottky plot. J. Phys. D Appl. Phys. 1978, 11, L63. [Google Scholar]
  34. Muñoz, A. Semiconducting properties of self-organized TiO2 nanotubes. Electrochim. Acta 2007, 52, 4167–4176. [Google Scholar] [CrossRef]
  35. Dunn, H.K.; Feckl, J.M.; Müller, A.; Fattakhova-Rohlfing, D.; Morehead, S.G.; Roos, J.; Peter, L.M.; Scheu, C.; Bein, T. Tin doping speeds up hole transfer during light-driven water oxidation at hematite photoanodes. Phys. Chem. Chem. Phys. 2014, 16, 24610–24620. [Google Scholar] [CrossRef] [Green Version]
  36. Berger, T.; Monllor-Satoca, D.; Jankulovska, M.; Lana-Villarreal, T.; Gómez, R. The Electrochemistry of Nanostructured Titanium Dioxide Electrodes. ChemPhysChem 2012, 13, 2824–2875. [Google Scholar] [CrossRef]
  37. Chuang, T.; Brundle, C.; Rice, D. Interpretation of the X-ray photoemission spectra of cobalt oxides and cobalt oxide surfaces. Surf. Sci. 1976, 59, 413–429. [Google Scholar] [CrossRef]
  38. Dhara, K.; Mahapatra, D.R. Electrochemical nonenzymatic sensing of glucose using advanced nanomaterials. Microchim. Acta 2017, 185, 49. [Google Scholar] [CrossRef]
  39. Zonno, I.; Martinez-Otero, A.; Hebig, J.C.; Kirchartz, T. Understanding Mott-Schottky Measurements under Illumination in Organic Bulk Heterojunction Solar Cells. Phys. Rev. Appl. 2017, 7, 034018. [Google Scholar] [CrossRef]
  40. Zarean, M.; Keikha, M.; Poursafa, P.; Khalighinejad, P.; Amin, M.; Kelishadi, R. A systematic review on the adverse health effects of di-2-ethylhexyl phthalate. Environ. Sci. Pollut. Res. 2016, 23, 24642–24693. [Google Scholar] [CrossRef]
  41. Biesinger, M.C.; Payne, B.P.; Grosvenor, A.P.; Lau, L.W.; Gerson, A.R.; Smart, R.S. Resolving surface chemical states in XPS analysis of first row transition metals, oxides and hydroxides: Cr, Mn, Fe, Co and Ni. Appl. Surf. Sci. 2011, 257, 2717–2730. [Google Scholar] [CrossRef]
  42. Fan, S.; Zhao, M.; Ding, L.; Liang, J.; Chen, J.; Li, Y.; Chen, S. Synthesis of 3D hierarchical porous Co3O4 film by eggshell membrane for non-enzymatic glucose detection. J. Electroanal. Chem. 2016, 775, 52–57. [Google Scholar] [CrossRef]
  43. Li, M.; Han, C.; Zhang, Y.; Bo, X.; Guo, L. Facile synthesis of ultrafine Co3O4 nanocrystals embedded carbon matrices with specific skeletal structures as efficient non-enzymatic glucose sensors. Anal. Chim. Acta 2015, 861, 25–35. [Google Scholar] [CrossRef]
  44. Ding, Y.; Wang, Y.; Su, L.; Bellagamba, M.; Zhang, H.; Lei, Y. Electrospun Co3O4 nanofibers for sensitive and selective glucose detection. Biosens. Bioelectron. 2010, 26, 542–548. [Google Scholar] [CrossRef]
  45. George, G.; Anandhan, S. A comparative study on the physico–chemical properties of sol–gel electrospun cobalt oxide nanofibres from two different polymeric binders. RSC Adv. 2015, 5, 81429–81437. [Google Scholar] [CrossRef]
  46. Lopes, T.; Andrade, L.; Ribeiro, H.A.; Mendes, A. Characterization of photoelectrochemical cells for water splitting by electrochemical impedance spectroscopy. Int. J. Hydrog. Energy 2010, 35, 11601–11608. [Google Scholar] [CrossRef] [Green Version]
  47. Xu, W.; Lu, Z.; Sun, X.; Jiang, L.; Duan, X. Superwetting Electrodes for Gas-Involving Electrocatalysis. Acc. Chem. Res. 2018, 51, 1590–1598. [Google Scholar] [CrossRef]
  48. Wang, S.; He, T.; Yun, J.H.; Hu, Y.; Xiao, M.; Du, A.; Wang, L. New Iron-Cobalt Oxide Catalysts Promoting BiVO4 Films for Photoelectrochemical Water Splitting. Adv Funct. Mater. 2018, 28, 1802685. [Google Scholar] [CrossRef]
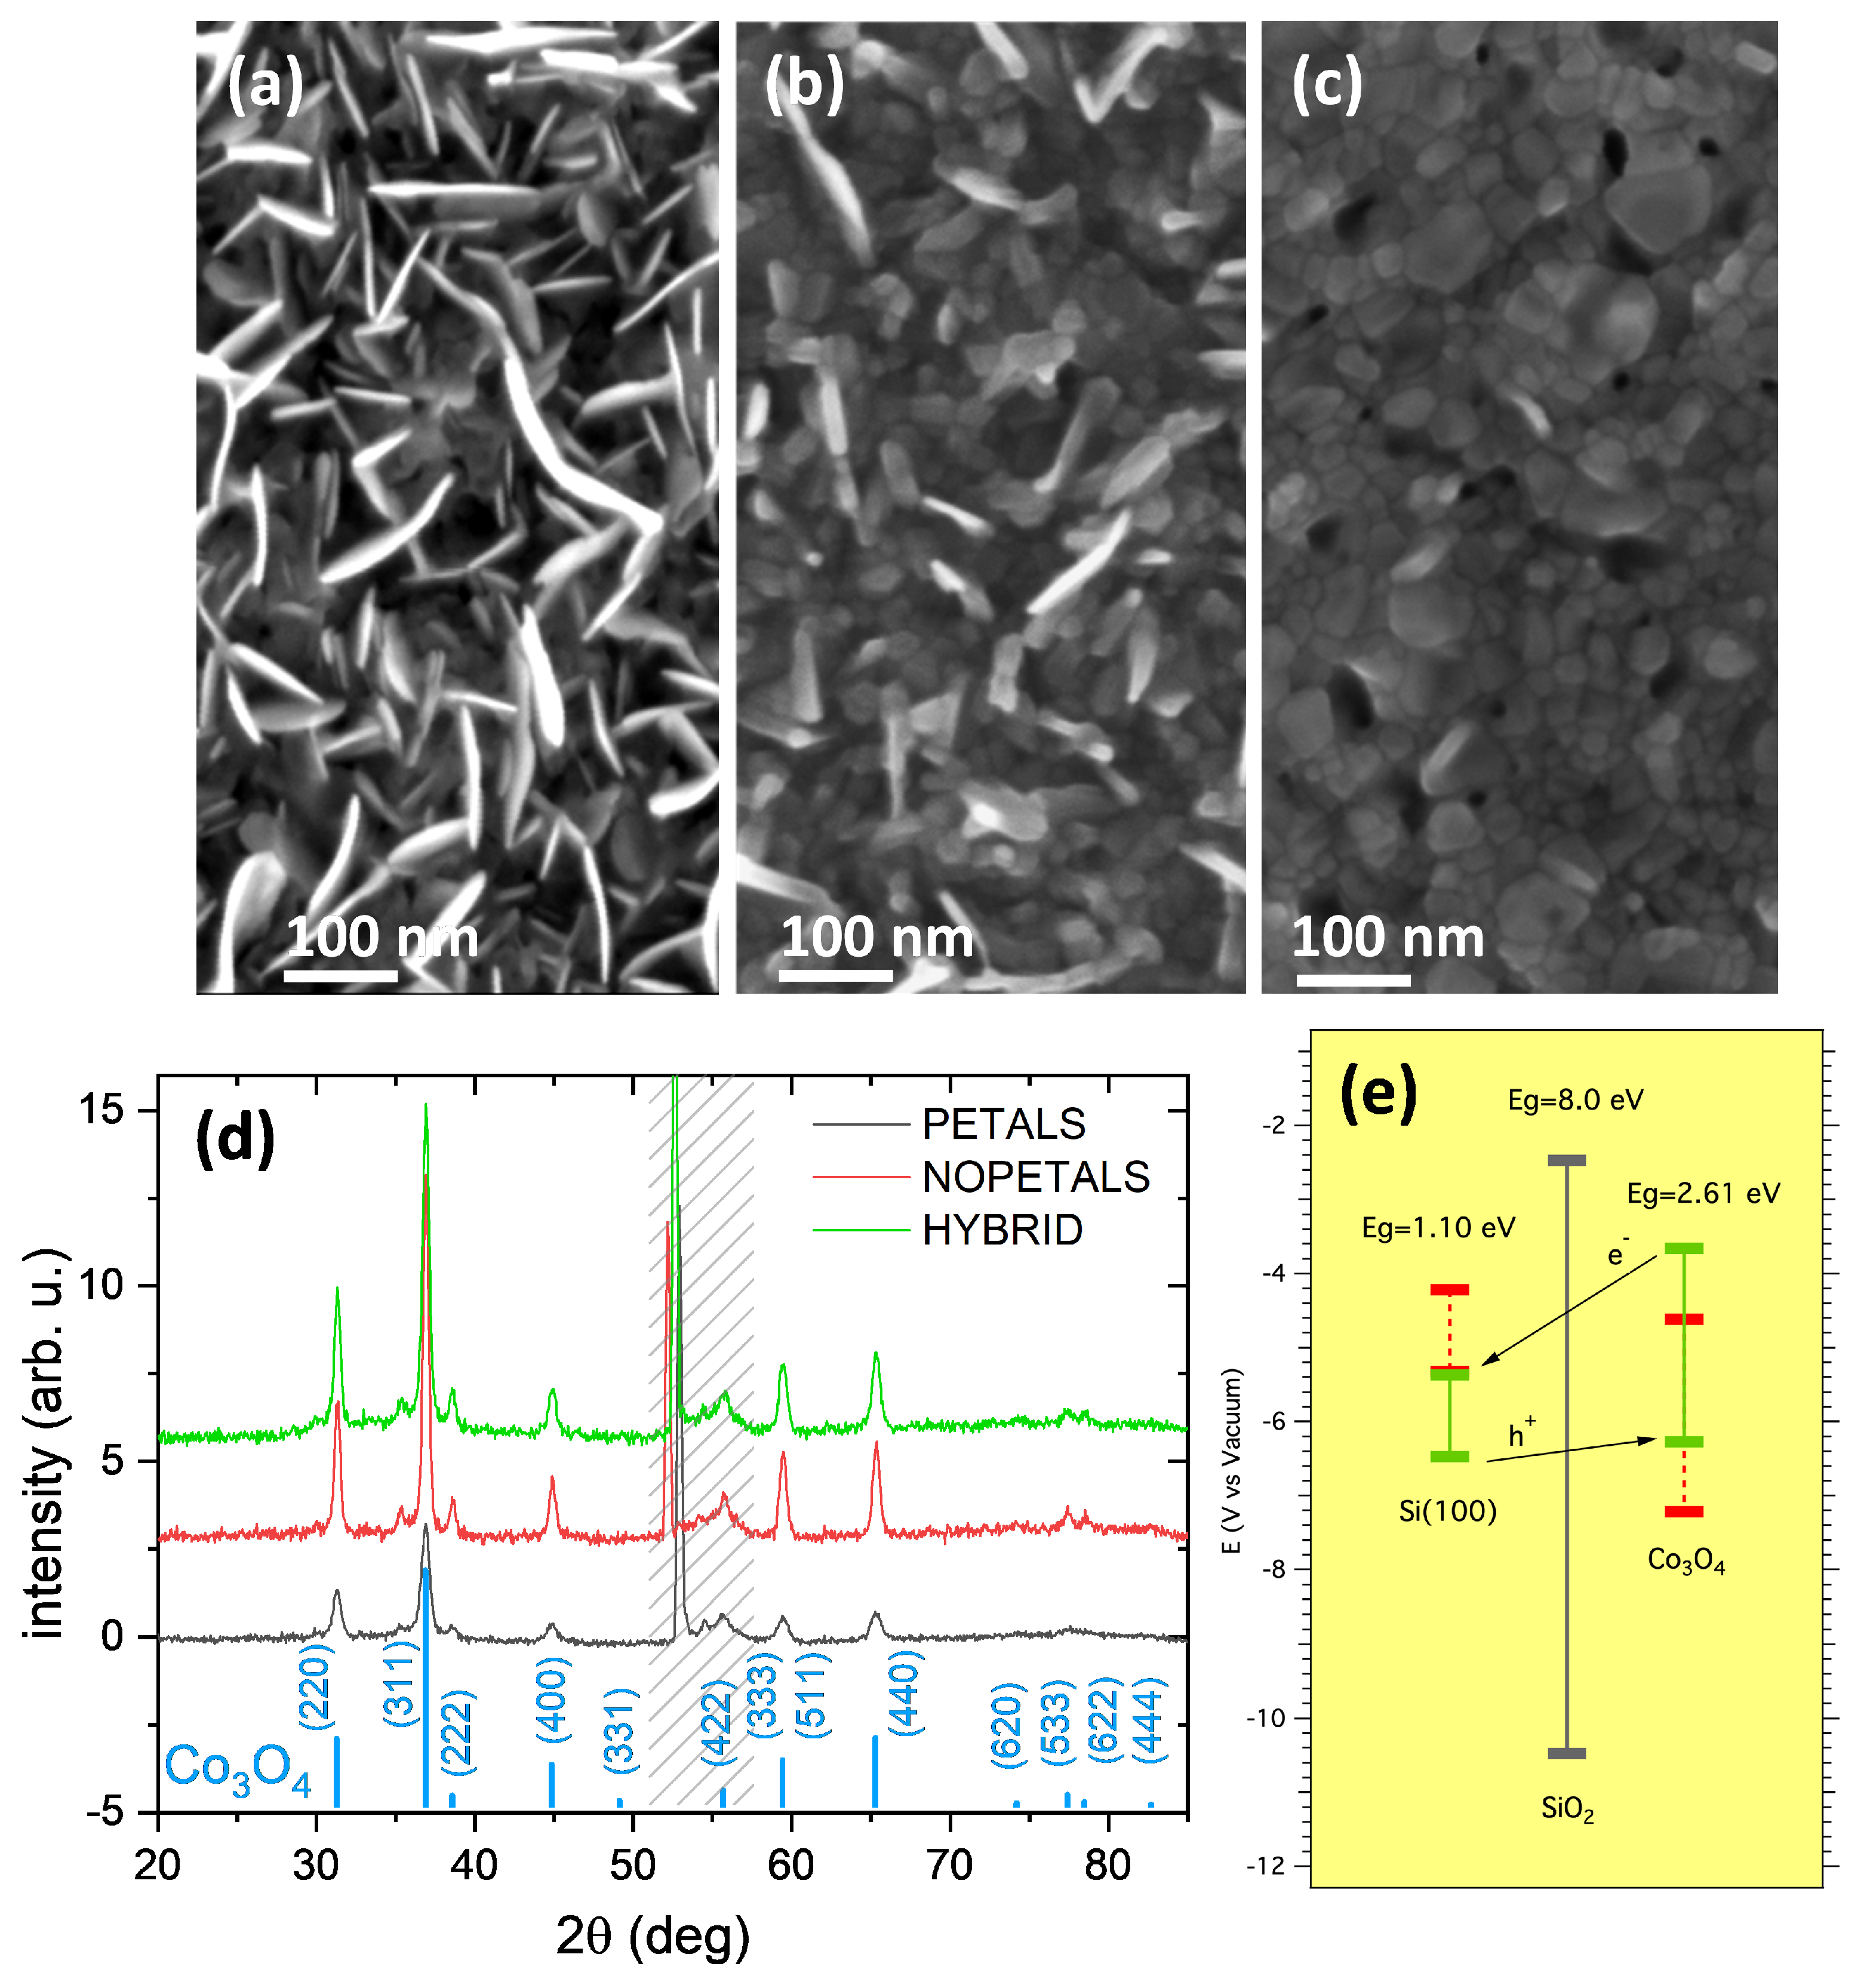
Figure 1. (ac) FE-SEM top-view images of the samples PETAL (a), HYBRID (b), and NOPETAL (c). (d) Corresponding Grazing Incidence X-ray Diffraction (GIXRD) patterns. The Co3O4 reflections are marked (ICSD-63164). In the dashed region, a spurious diffraction signal from the Si substrate is visible (the X-ray penetration depth is about 80 nm). (e) Sketch of the electronic energy bands of the prepared electrodes. The theoretical positions of edges CB and VB, obtained from Pearson’s electronegativity values, are in red. The approximate positions of CB and VB edges, after the junction is formed, obtained from Mott-Schottky plots (SI. Figure S2) are indicated by green bars.
Surfaces 02 00004 g001
Figure 2. (a) LSV in 0.1 M Na2SO4 and 0.1 M NaOH of the three samples in dark and illuminated conditions; (b) charge values at 1V vs. Ag/AgCl, from chronoamperometries (pH = 6), as a function of theoretical Chemical Oxygen Demand (COD) of the sample PETAL with different organic molecules in a 0.1 M sodium sulphate solution; (c) LSV with chopped illumination of the sample PETAL in sodium sulphate before (orange) and after (blue) the addition of glucose. The behavior of the bare silicon electrode is also shown for reference (black curve); (d) photocurrent dependence of sample PETAL at 1 V vs. Ag/AgCl on the concentration of glucose.
Surfaces 02 00004 g002
Figure 3. (a) Photocurrent at 0.95 V vs. Ag/AgCl of the layer PETAL over time in a 3 mM phthalate, 0.1 M sodium sulphate solution (pH = 6); (b,c) fitted X-ray photoelectron spectroscopy (XPS) spectra [37] of the Co 2p3/2 orbitals taken before (b) and after (c) 14 h of phthalate oxidation.
Surfaces 02 00004 g003
Figure 4. Comparison of Nyquist impedance spectra for the PETAL , NOPETAL , and HYBRID layers. (ac) Spectra taken at 0.1 V; (df) spectra taken at 1 V. In all figures, spectra recorded in the dark are presented in blue, while spectra recorded under illumination are presented in orange. All spectra have been acquired in 0.1 M Na2SO4 electrolyte. Solid lines were obtained by fitting the EIS spectra with the EC (equivalent circuit) represented in the upper part of each panel. CPE indicates a constant phase element, Rs indicates the solution resistance. The inset of Figure (d) shows an enlargement of the fitting results at low impedance values.
Surfaces 02 00004 g004
Figure 5. Phase angle spectra recorded at 1 V in 0.1 M sodium sulphate for samples PETAL (red), NOPETAL (blue), and HYBRID (green).
Surfaces 02 00004 g005
Table 1. Details of the post-deposition annealing performed in pure oxygen flux.
Sample NameTreatment Conditions
PETAL4 h at 300 °C
HYBRID4 h at 300 °C + 1 h at 450 °C
NOPETAL1 h at 450 °C

