Article

Effects of the Interfacial Structure on the Methanol Oxidation on Platinum Single Crystal Electrodes

by
Mohammad Ali Kamyabi
1,2,
Ricardo Martínez-Hincapié
2,
Juan M. Feliu
2,* and
Enrique Herrero
2,*
1
Department of Chemistry, Faculty of Science, University of Zanjan, Zanjan 45371-38791, Iran
2
Instituto de Electroquímica, Universidad de Alicante, Apdo. 99, E-03080 Alicante, Spain
*
Authors to whom correspondence should be addressed.
Surfaces 2019, 2(1), 177-192; https://doi.org/10.3390/surfaces2010014
Submission received: 11 February 2019 / Revised: 27 February 2019 / Accepted: 1 March 2019 / Published: 12 March 2019
(This article belongs to the Special Issue Electrochemical Surface Science: Basics and Applications)

Abstract

:
Methanol oxidation has been studied on low index platinum single crystal electrodes using methanol solutions with different pH (1–5) in the absence of specific adsorption. The goal is to determine the role of the interfacial structure in the reaction. The comparison between the voltammetric profiles obtained in the presence and absence of methanol indicates that methanol oxidation is only taking place when the surface is partially covered by adsorbed OH. Thus, on the Pt(111) electrode, the onset for the direct oxidation of methanol and the adsorption of OH coincide. In this case, the adsorbed OH species are not a mere spectator, because the obtained results for the reaction order for methanol and the proton concentrations indicate that OH adsorbed species are involved in the reaction mechanism. On the other hand, the dehydrogenation step to yield adsorbed CO on the Pt(100) surface coincides with the onset of OH adsorption on this electrode. It is proposed that adsorbed OH collaborates in the dehydrogenation step during methanol oxidation, facilitating either the adsorption of the methanol in the right configuration or the cleavage of the C—H bond.

Graphical Abstract

1. Introduction

The methanol (MeOH) oxidation reaction has attracted significant attention in the last decades, both from a fundamental and applied point of view [1,2,3,4,5]. From the fundamental approach, methanol is a small organic molecule and the knowledge acquired by studying its oxidation mechanism can be later transferred to more complex organic molecules. In fact, its mechanism can serve as a model for the oxidation of more complex alcohols, such as ethanol or ethylene glycol. On the applied side, methanol can be used as a fuel in fuel cells. When compared with hydrogen as fuel, methanol presents several practical advantages: It is liquid at room temperature with a high volumetric energy density and does not require the deployment of new distribution channels for its use. However, the anodic over-potentials are significantly higher than those measured for the hydrogen oxidation reaction. For this reason, the development of more effective electrocatalysis for the oxidation reaction is needed if methanol is going to be employed as fuel. The intelligent design of more efficient electrocatalysts requires a deep knowledge of the reaction mechanism.
Among all pure metals, platinum is the best electrocatalyst for the oxidation reaction. In the complete oxidation, six electrons are exchanged according to:
CH3OH + H2O → CO2 + 6H+ + 6e
It is now generally accepted that the oxidation mechanism takes place following a dual path mechanism [1]. In one of the paths, adsorbed CO is formed, which is considered a poisoning intermediate, because it is strongly adsorbed on the surface and its oxidation requires high potentials. On the other hand, the second path avoids the formation of CO and goes through an active intermediate [1]. In a reaction in which six electrons are exchanged, several intermediates are involved, and as has been proposed, the two paths may share some intermediates [6,7]. As happens in any reaction in which adsorbed intermediates are involved, the reactivity is very dependent on the surface structure [8,9,10,11,12,13,14]. Moreover, not only the surface structure, that is, the local arrangement of the surface atoms, affects reactivity, but also the interfacial structure and composition. First, the comparison between ultra-high vacuum and electrochemical environments indicates that the bonding mode of the methanol molecule is clearly affected by the presence of the interfacial water [10] because the proposed intermediates and their binding modes are different. Second, the presence of specifically adsorbed anions on the electrode surface inhibits the reactivity [11]. Thus, currents in the presence of sulfate or phosphate are significantly smaller than those measured in perchloric acid solutions. Additionally, other factors that affect the interfacial structure should be considered, such as, solution pH, and electrode charge. In all the cases, all these parameters modify the interaction between the methanol molecule and the surface, which in turn controls the reaction mechanism.
In order to have a deeper knowledge of the effects of interfacial on the methanol oxidation reaction, experiments in solutions with pH values ranging between one and five have been carried out. Due to the large impact of the specific adsorption of anions on the methanol oxidation currents [11], electrolyte solutions should have an adequate buffering capacity without containing anions that can adsorb strongly on the surface. For that purpose, mixtures of perchloric acid and fluoride have been used because perchlorate and fluoride anions do not adsorb strongly on the electrode surface and the pKa of HF/F- is 3.15 [15,16]. Furthermore, to better explore the relationship between the interfacial structure and the reactivity, methanol concentrations between 10−4 and 10−1 M have been used. The low concentration regime will allow detecting the modification of the adsorption behavior of the electrode due to the presence of methanol and relating them with the oxidation mechanism and its selectivity.

2. Materials and Methods

Low index platinum single crystal electrodes, namely Pt(111), Pt(100), and Pt(110), were fabricated from small single crystal beads (ca. 2.5 mm diameter). These beads were oriented, cut, and polished until mirror finish using the procedure described by Clavilier [17,18]. Prior to any experiment, the electrodes were cleaned by flame annealing, cooled down in a H2/Ar atmosphere and protected with water in equilibrium with this gas mixture [19]. The protected electrodes were immersed in the electrolyte solution at a controlled potential (0.1 V) in meniscus configuration so that only the surface with the desired orientation is in contact with the solution. For the Pt(111) and Pt(100), this procedure leads to the formation of a well-ordered surface with the nominal orientation [20,21]. Due to the reconstruction phenomena undergone by the Pt(110) surfaces, which is strongly affected by the treatment, the surface presented here corresponds to the (1 × 2) or (1 × 1)/(1 × 2) structure with major (1 × 2) contribution [22,23]. Thus, the observed behavior should correspond with that expected for the (1 × 2) surface, although contributions from the (1 × 1) cannot be discarded. The cleanliness of the electrode surface and the solutions were checked by voltammetry in the absence of methanol. The characteristic voltammetric profiles of the different electrodes, which are stable upon cycling when clean solutions are used, were obtained.
Experiments were carried out at room temperature, 22 °C, in classical two-compartment electrochemical cells de-aerated by using Ar (N50, Air Liquide, Paris, France, in all gases used), including a large platinum counter electrode and a Reversible Hydrogen (N50) Electrode (RHE) as reference. The solutions were prepared using concentrated HClO4 (for analysis, Merck KGaA, Darmstadt, Germany), NaF (99.99%, Suprapur, Merck KGaA, Darmstadt, Germany), KClO4 (Suprapur, Merck KGaA, Darmstadt, Germany), and ultrapure water (Purelab Ultra, Elga, High Wycombe, United Kingdom). Solutions with a pH between two and five were prepared using mixtures of NaF and HClO4 so that the buffering capacity is high enough to maintain the interfacial pH constant. Voltammograms were recorded using a potentiostat (EA161, eDAQ, Sydney, Australia) and a digital recorder (ED401, eDAQ, Sydney, Australia) in a hanging meniscus configuration.

3. Results

3.1. Pt(111) Electrode

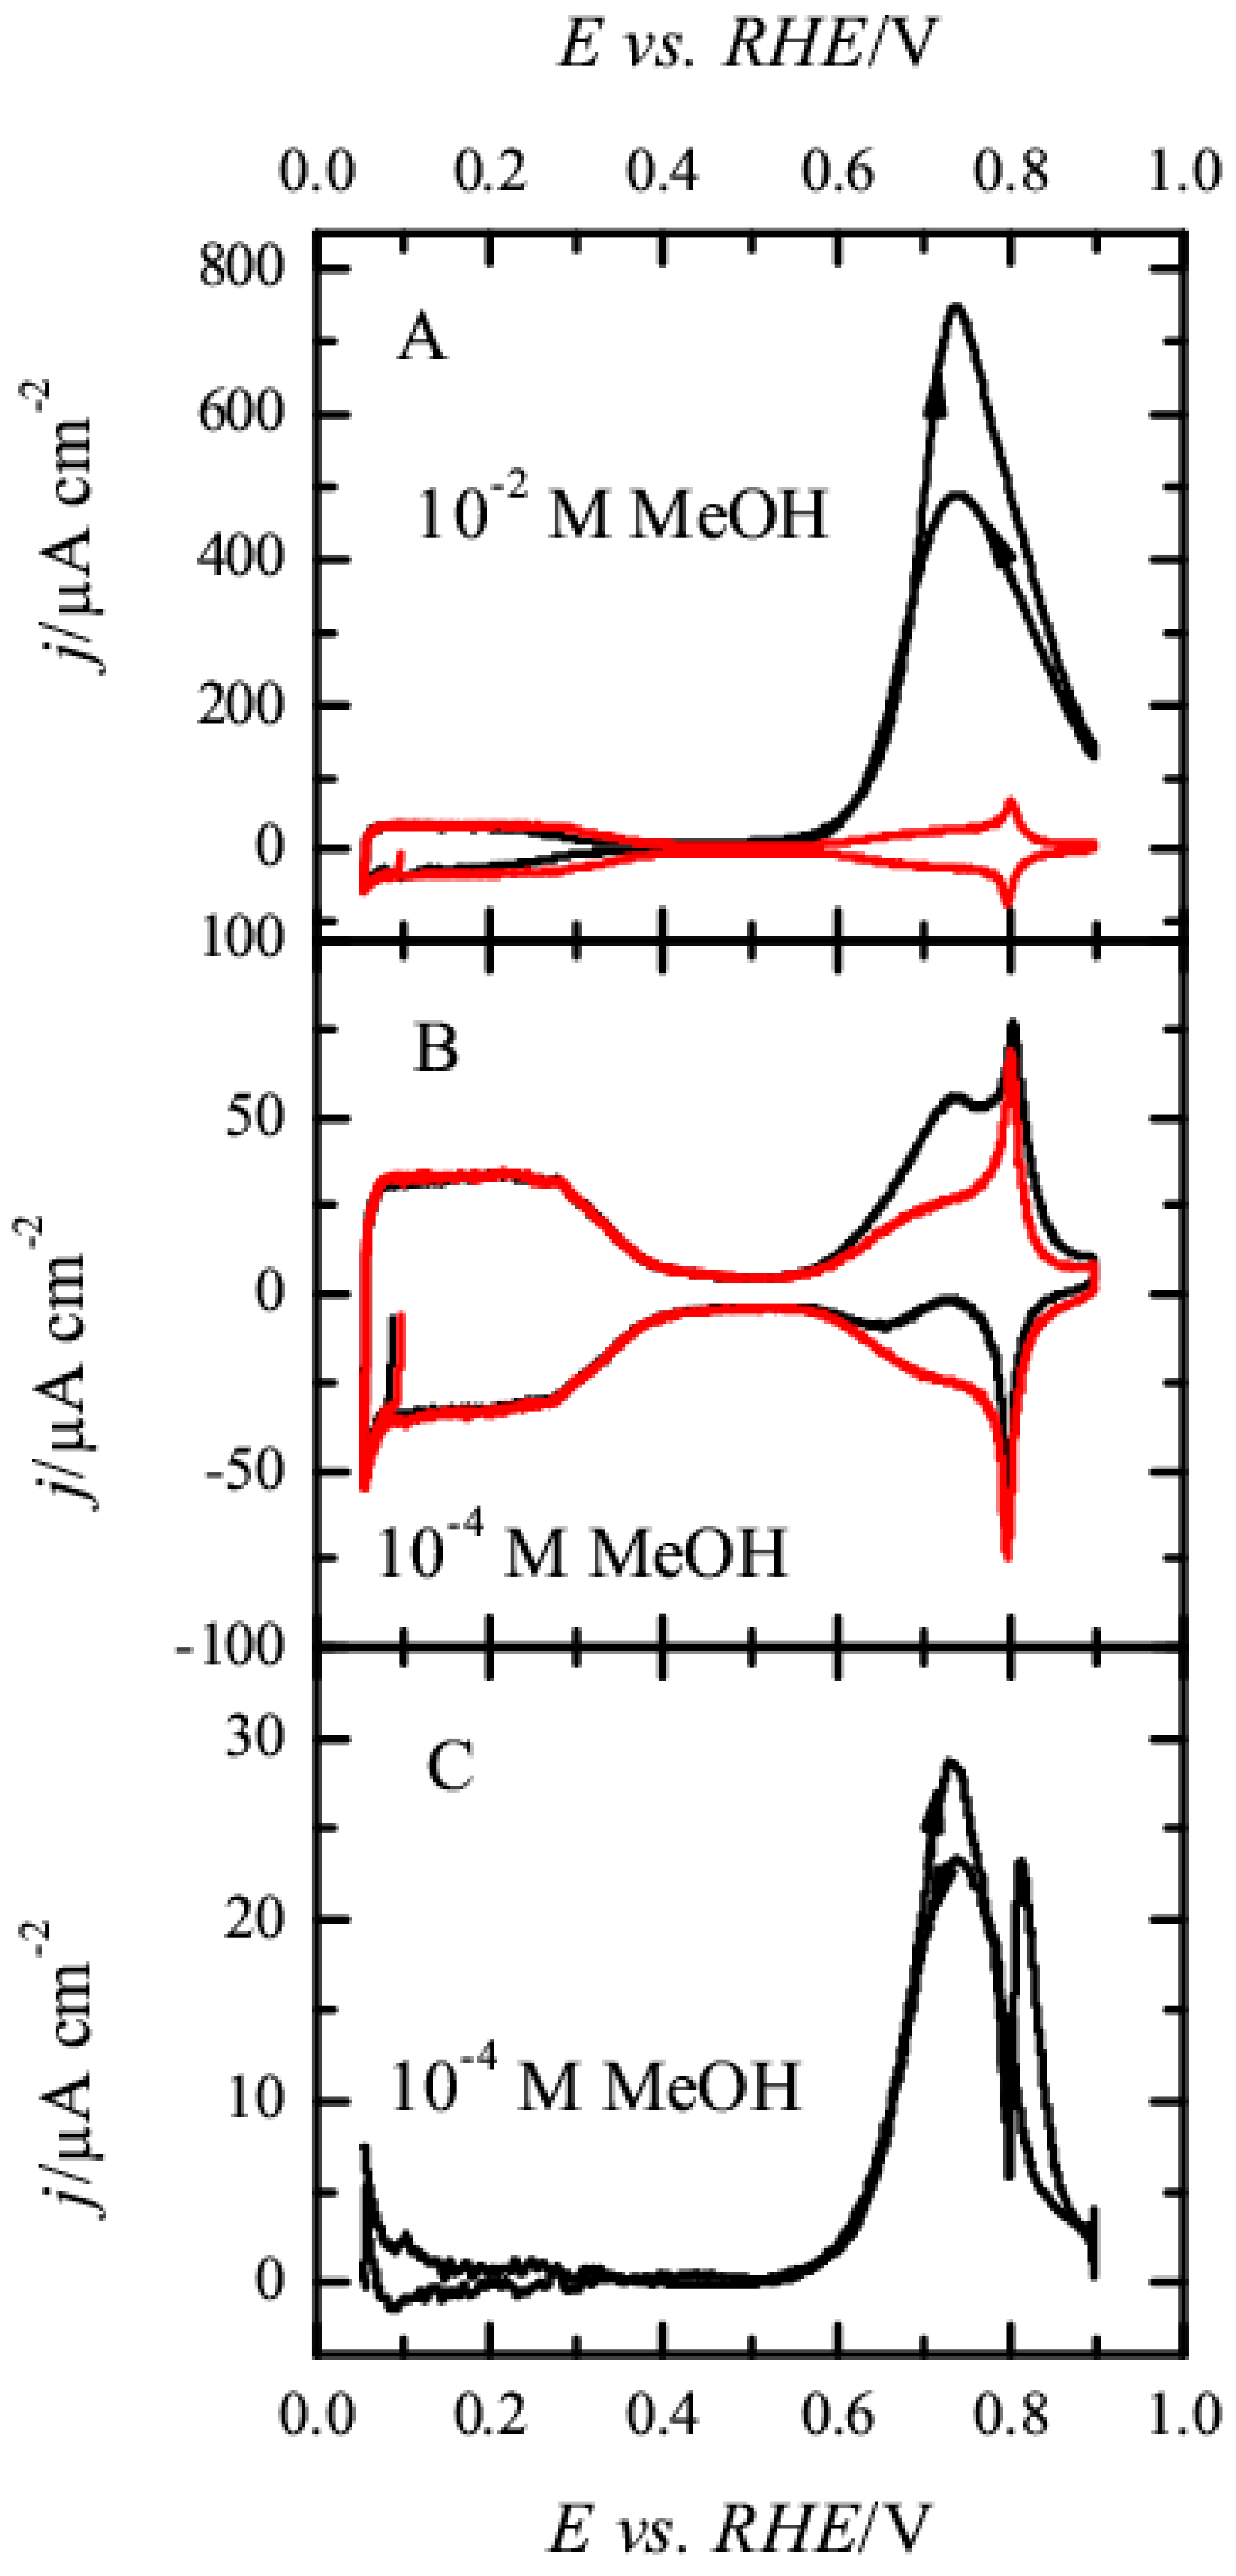
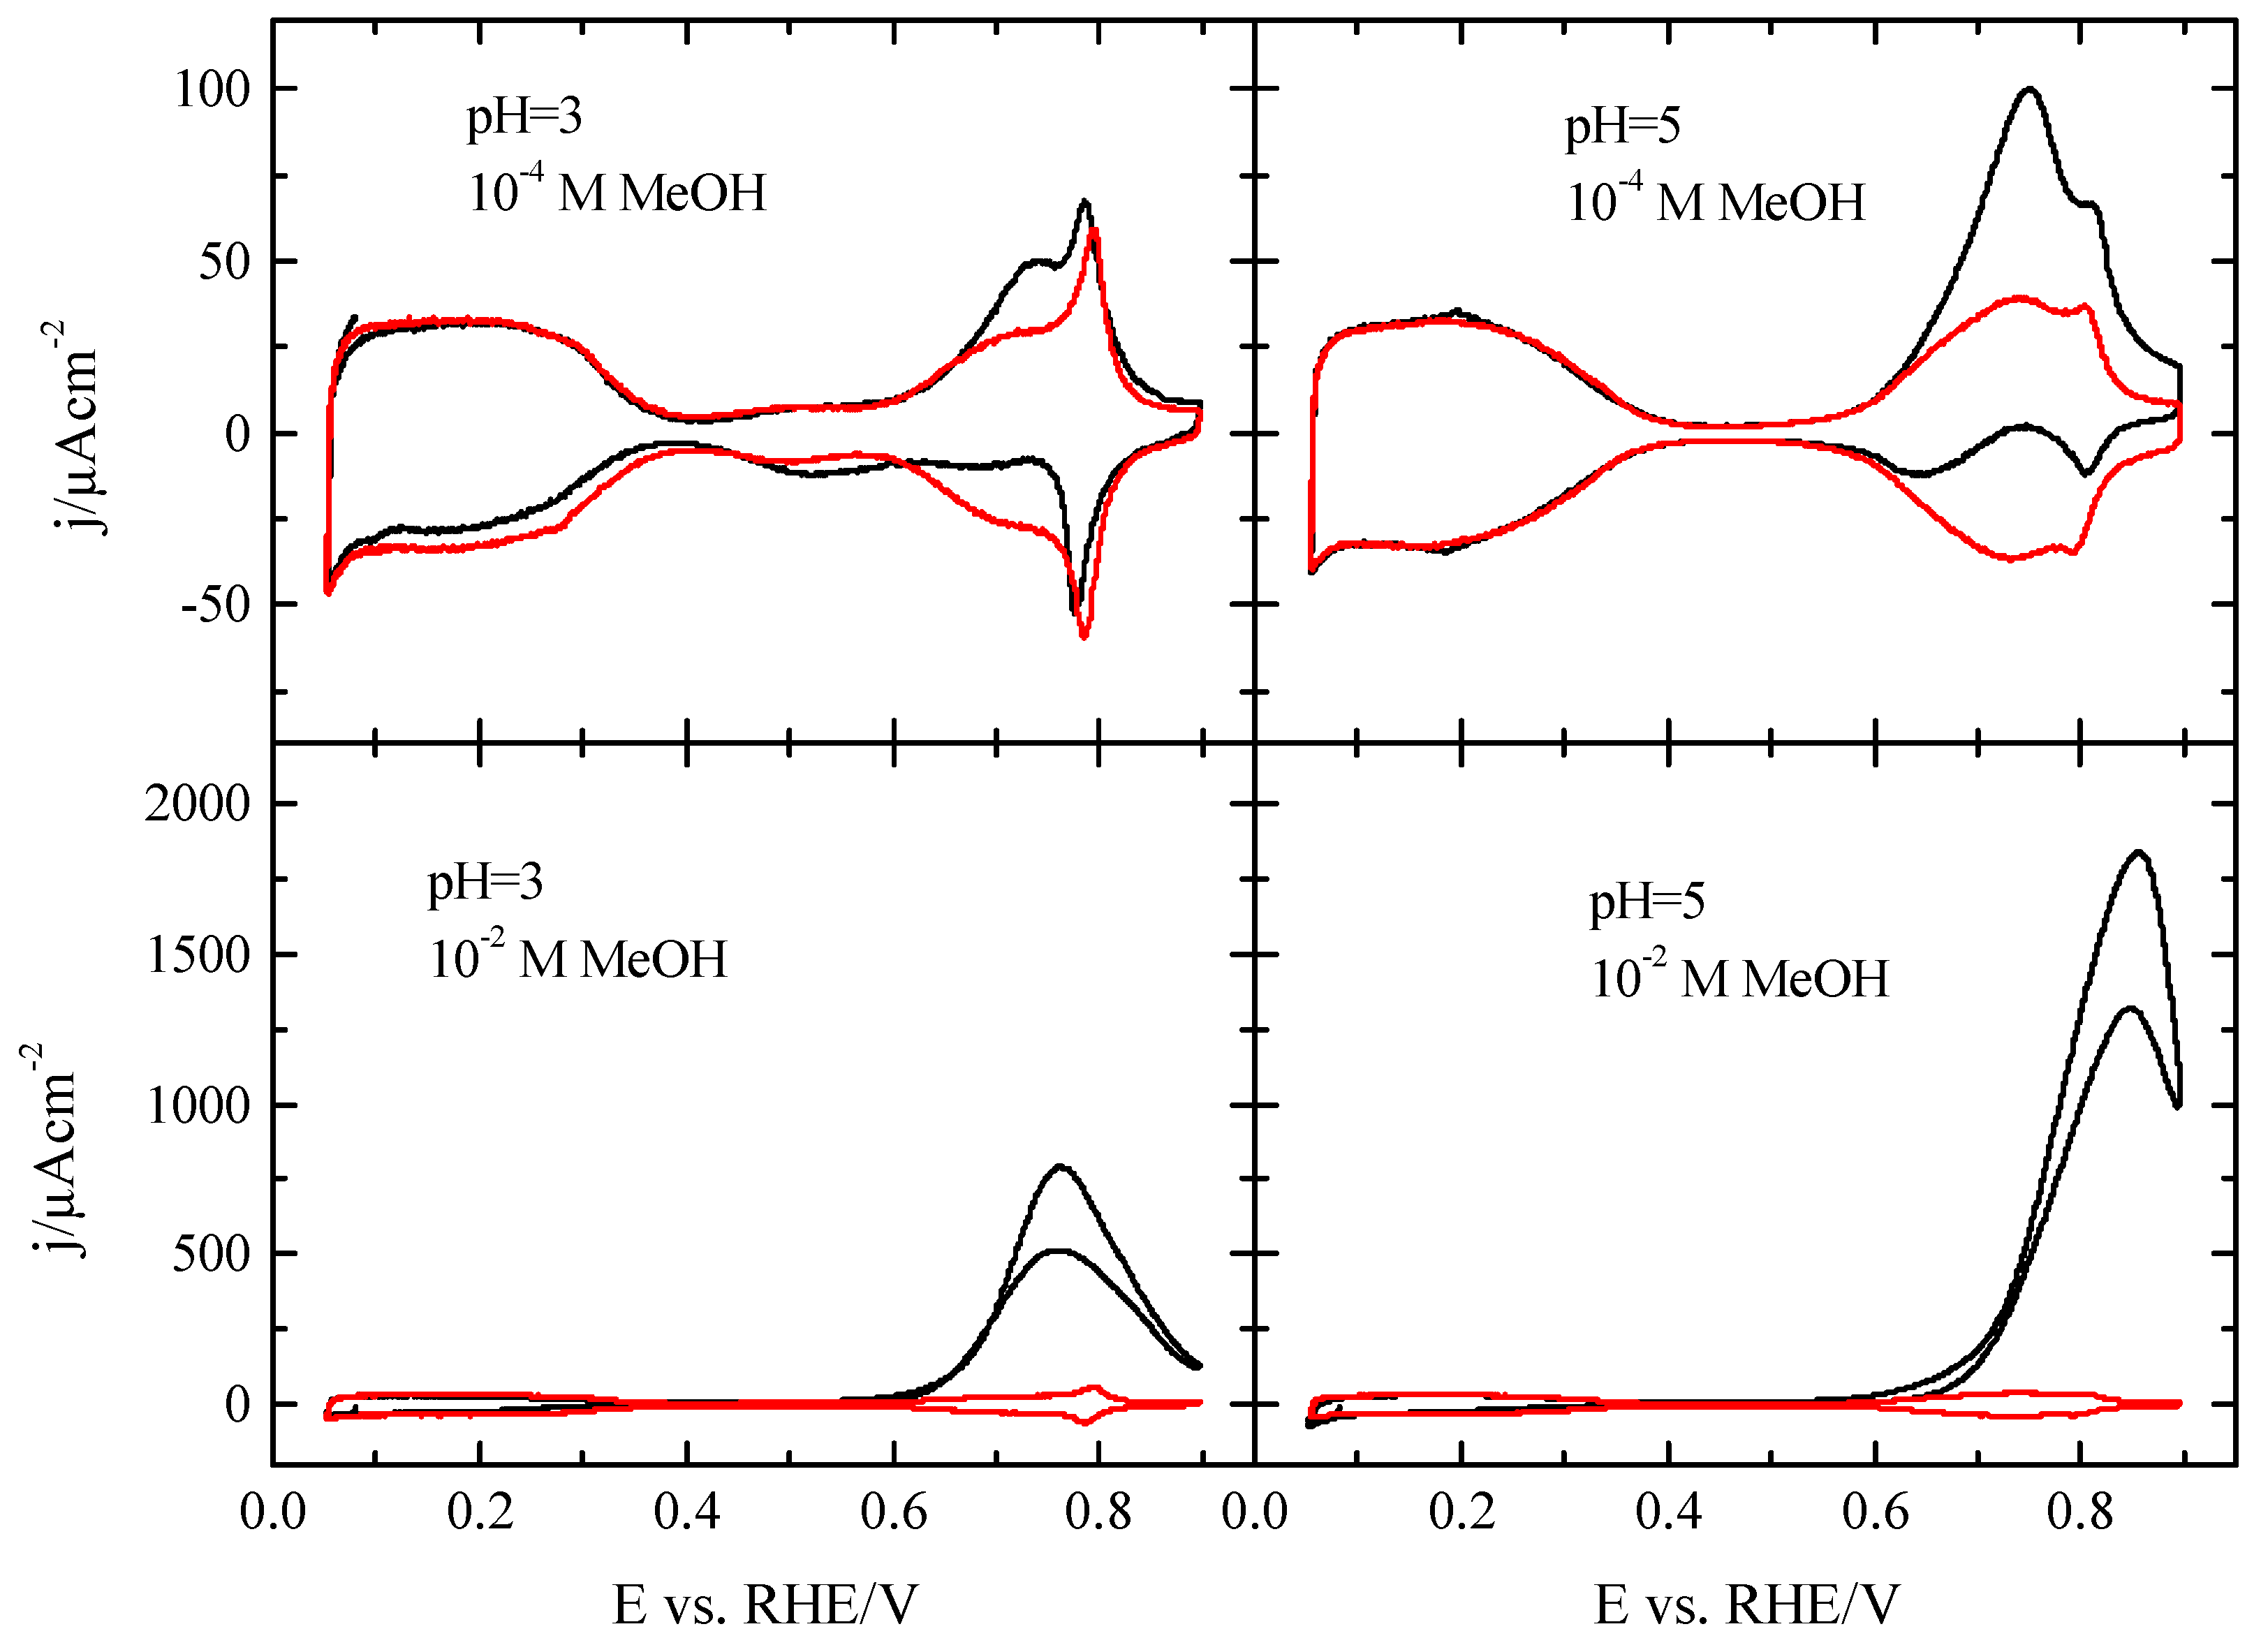
Figure 1 shows the voltammetric profiles of the Pt(111) electrode in 0.1 M HClO4 with two different methanol concentrations: 10−2 and 10−4 M and the comparison with that recorded in the absence of methanol for the same electrolyte solution. The comparison between the blank voltammogram of the Pt(111) electrode and those obtained in the presence of methanol allows correlating the interfacial structure with the reactivity. Moreover, relevant information regarding the oxidation mechanism can be obtained from this comparison, depending on the examined region. As aforementioned, it is generally accepted that methanol oxidation reaction occurs through a dual path mechanism, in which a path involves the formation of adsorbed CO, a poisoning intermediate, and a second path going through an active intermediate. Due to the high number of electrons exchanged in the process, both paths should be interconnected and can share some intermediates leading to a complex mechanism [6,7]. The voltammetric profile in the supporting electrolyte can be divided into three regions, hydrogen adsorption region below 0.4 V, the OH adsorption region above 0.6 V, and the double lager region between 0.4 and 0.6 V. The analysis of the modifications of the profiles in these regions will allow obtaining relevant data for the oxidation mechanism.
The profile measured for 10−2 M has the typical shape of those obtained at higher methanol concentrations, with an effective onset potential of ca. 0.6 V [14,24], which coincides with the onset of the OH adsorption process. The large currents measured for this concentration prevents detailed analysis of the effects of the surface composition in the methanol oxidation in this region. To diminish oxidation currents and to establish whether the OH adsorption process is affected by the reaction, currents were recorded for 10−4 M methanol. For this concentration (Figure 1B), modifications of the blank voltammetry recorded in the absence of methanol are only observed in the region where OH is adsorbed. Thus, in the positive scan direction, a new peak appears at ca. 0.72 V, apparently superimposed with the original OH adsorption signal, because some of the characteristic features of this region, such as the spike at 0.80 V, are still visible. On the other hand, the profile in the negative scan direction shows complex behavior, which is clearly a consequence of the addition of two different signals: the negative currents associated with the reductive desorption of adsorbed OH and the positive current of the methanol oxidation reaction. To determine whether OH adsorption process is affected by methanol, the blank voltammetric profile obtained in the supporting electrolyte has been subtracted from that measured for the 10−4 M methanol concentration (Figure 1C). As can be seen, the resulting voltammetric profile has the same shape as that recorded with larger methanol concentrations, and the only difference is the absolute values of the currents, which are proportional to the methanol concentration. It should be stressed that a spike at 0.80 V in the blank voltammogram, which has been associated to changes in the OH adsorption mode depending on the water structure, is very sensitive to the actual composition of the solution [25]. The presence of traces of species in concentrations well below 10−6 M alters the currents in this region. In this case, the subtraction of the two profiles shows a bipolar peak in this region that is only due to the change in the composition of the interface, but not related to the oxidative process of methanol. Then, the subtracted voltammetric profile demonstrates that the OH adsorption process between 0.6 and 0.9 V is also occurring in the presence of methanol and that the interfacial structure of the electrode is not significantly affected by the presence of methanol.
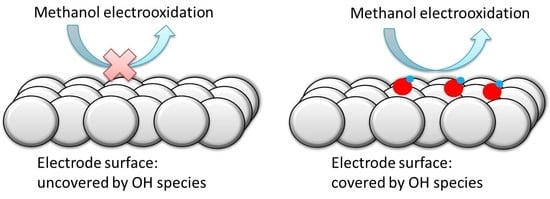
These results clearly show that significant oxidation currents are only recorded in the region where OH is adsorbed, implying that the oxidation of methanol is taking place on a surface partially covered by OH. Moreover, during the spike at 0.80 V, there is a change in the reactivity and the completion of the OH layer at 0.85 V leads to the inhibition of the methanol oxidation reaction. Thus, according to these results, adsorbed OH seems to be required for the oxidation of methanol, but also some free sites where the methanol molecule could interact with the electrode.
The inspection of the hydrogen adsorption and double layer regions can be used to provide information on the type of intermediates that are formed during the oxidation reaction. Probably, CO is the most important intermediate, because its oxidation, which occurs through a well-characterized Langmuir-Hishenlwood mechanism, requires the presence of adsorbed OH on the surface [26]. Thus, rates for the CO oxidation reaction on Pt are only significant above 0.7 V, and if CO is formed below this potential value, adsorbed CO molecules are accumulated on the surface [12,14,27]. The accumulation of CO on the surface blocks hydrogen adsorption and the hydrogen adsorption charge recorded below 0.4 V diminishes [28]. As can be seen, in 10−4 M methanol, the accumulation of CO is negligible because the profile in the hydrogen region for this concentration overlaps with that recorded in the absence of methanol. This fact implies that if CO is formed during the oxidation, it is oxidized at the same rate that is produced and the accumulation during the time of the experiment is negligible. For higher concentrations, there is a small diminution in the hydrogen adsorption charge, implying that some CO has been accumulated on the electrode surface. However, the amount of CO accumulated is very small. In fact, chronoamperometric measurements indicate that CO formation takes place exclusively above 0.5 V and that the rate for this surface is the lowest of all the single crystal electrodes studied [14].
Additionally, other possible intermediates may be formed and adsorb on the electrode surface giving rise to characteristic signals. One of the possible intermediates in the oxidation of methanol is formic acid. However, the observed behavior is not compatible with the formation of a measurable amount of formic acid. In the acidic media, formic acid adsorbs on the platinum electrode as formate in the bidentate configuration. The adsorption of formate modifies the voltammogram so that the typical shape corresponding to OH adsorption above 0.6 V disappears and a new signal between 0.4 and 0.6 V can be observed [29]. Moreover, formic acid is readily oxidized on the Pt(111) electrode above 0.35 V [30,31]. None of these new signals appear on the recorded voltammograms, even for the highest recorded concentration (0.1 M). Thus, the measured profile between 0.4 and 0.6 V in the presence of methanol matches that recorded in its absence, implying that formic acid is not being formed at significant concentrations during the oxidation of methanol on this electrode surface in the present conditions. It should be mentioned that a small fraction of formic acid has been detected by HPLC analysis after long electrolysis time (ca. 15 min) and with high methanol concentrations [32]. Clearly, the electrolysis time and the solution concentration affect the product distribution. On the other hand, the presence of methyl formate detected by mass spectroscopy [13,27] appears to be a consequence of the attack of a methanol molecule in solution to some intermediate species adsorbed on the surface and not as a result of the esterification reaction between solution methanol and formic acid produced in the partial oxidation of methanol [33,34].
From all these results, it can be concluded that the absence of significant modifications in the interfacial structure, in the presence of methanol (aside that relate to the small amount of CO accumulated on the surface), indicates that the different adsorbed intermediates of the reaction are not strongly adsorbed and their interaction with the surface must be weak. In fact, when anions are strongly adsorbed, such as sulfate or phosphate added to the supporting electrolyte, the oxidation currents diminish significantly, because methanol adsorbates cannot compete for the adsorption sites with the strongly adsorbed sulfate or phosphate [14,
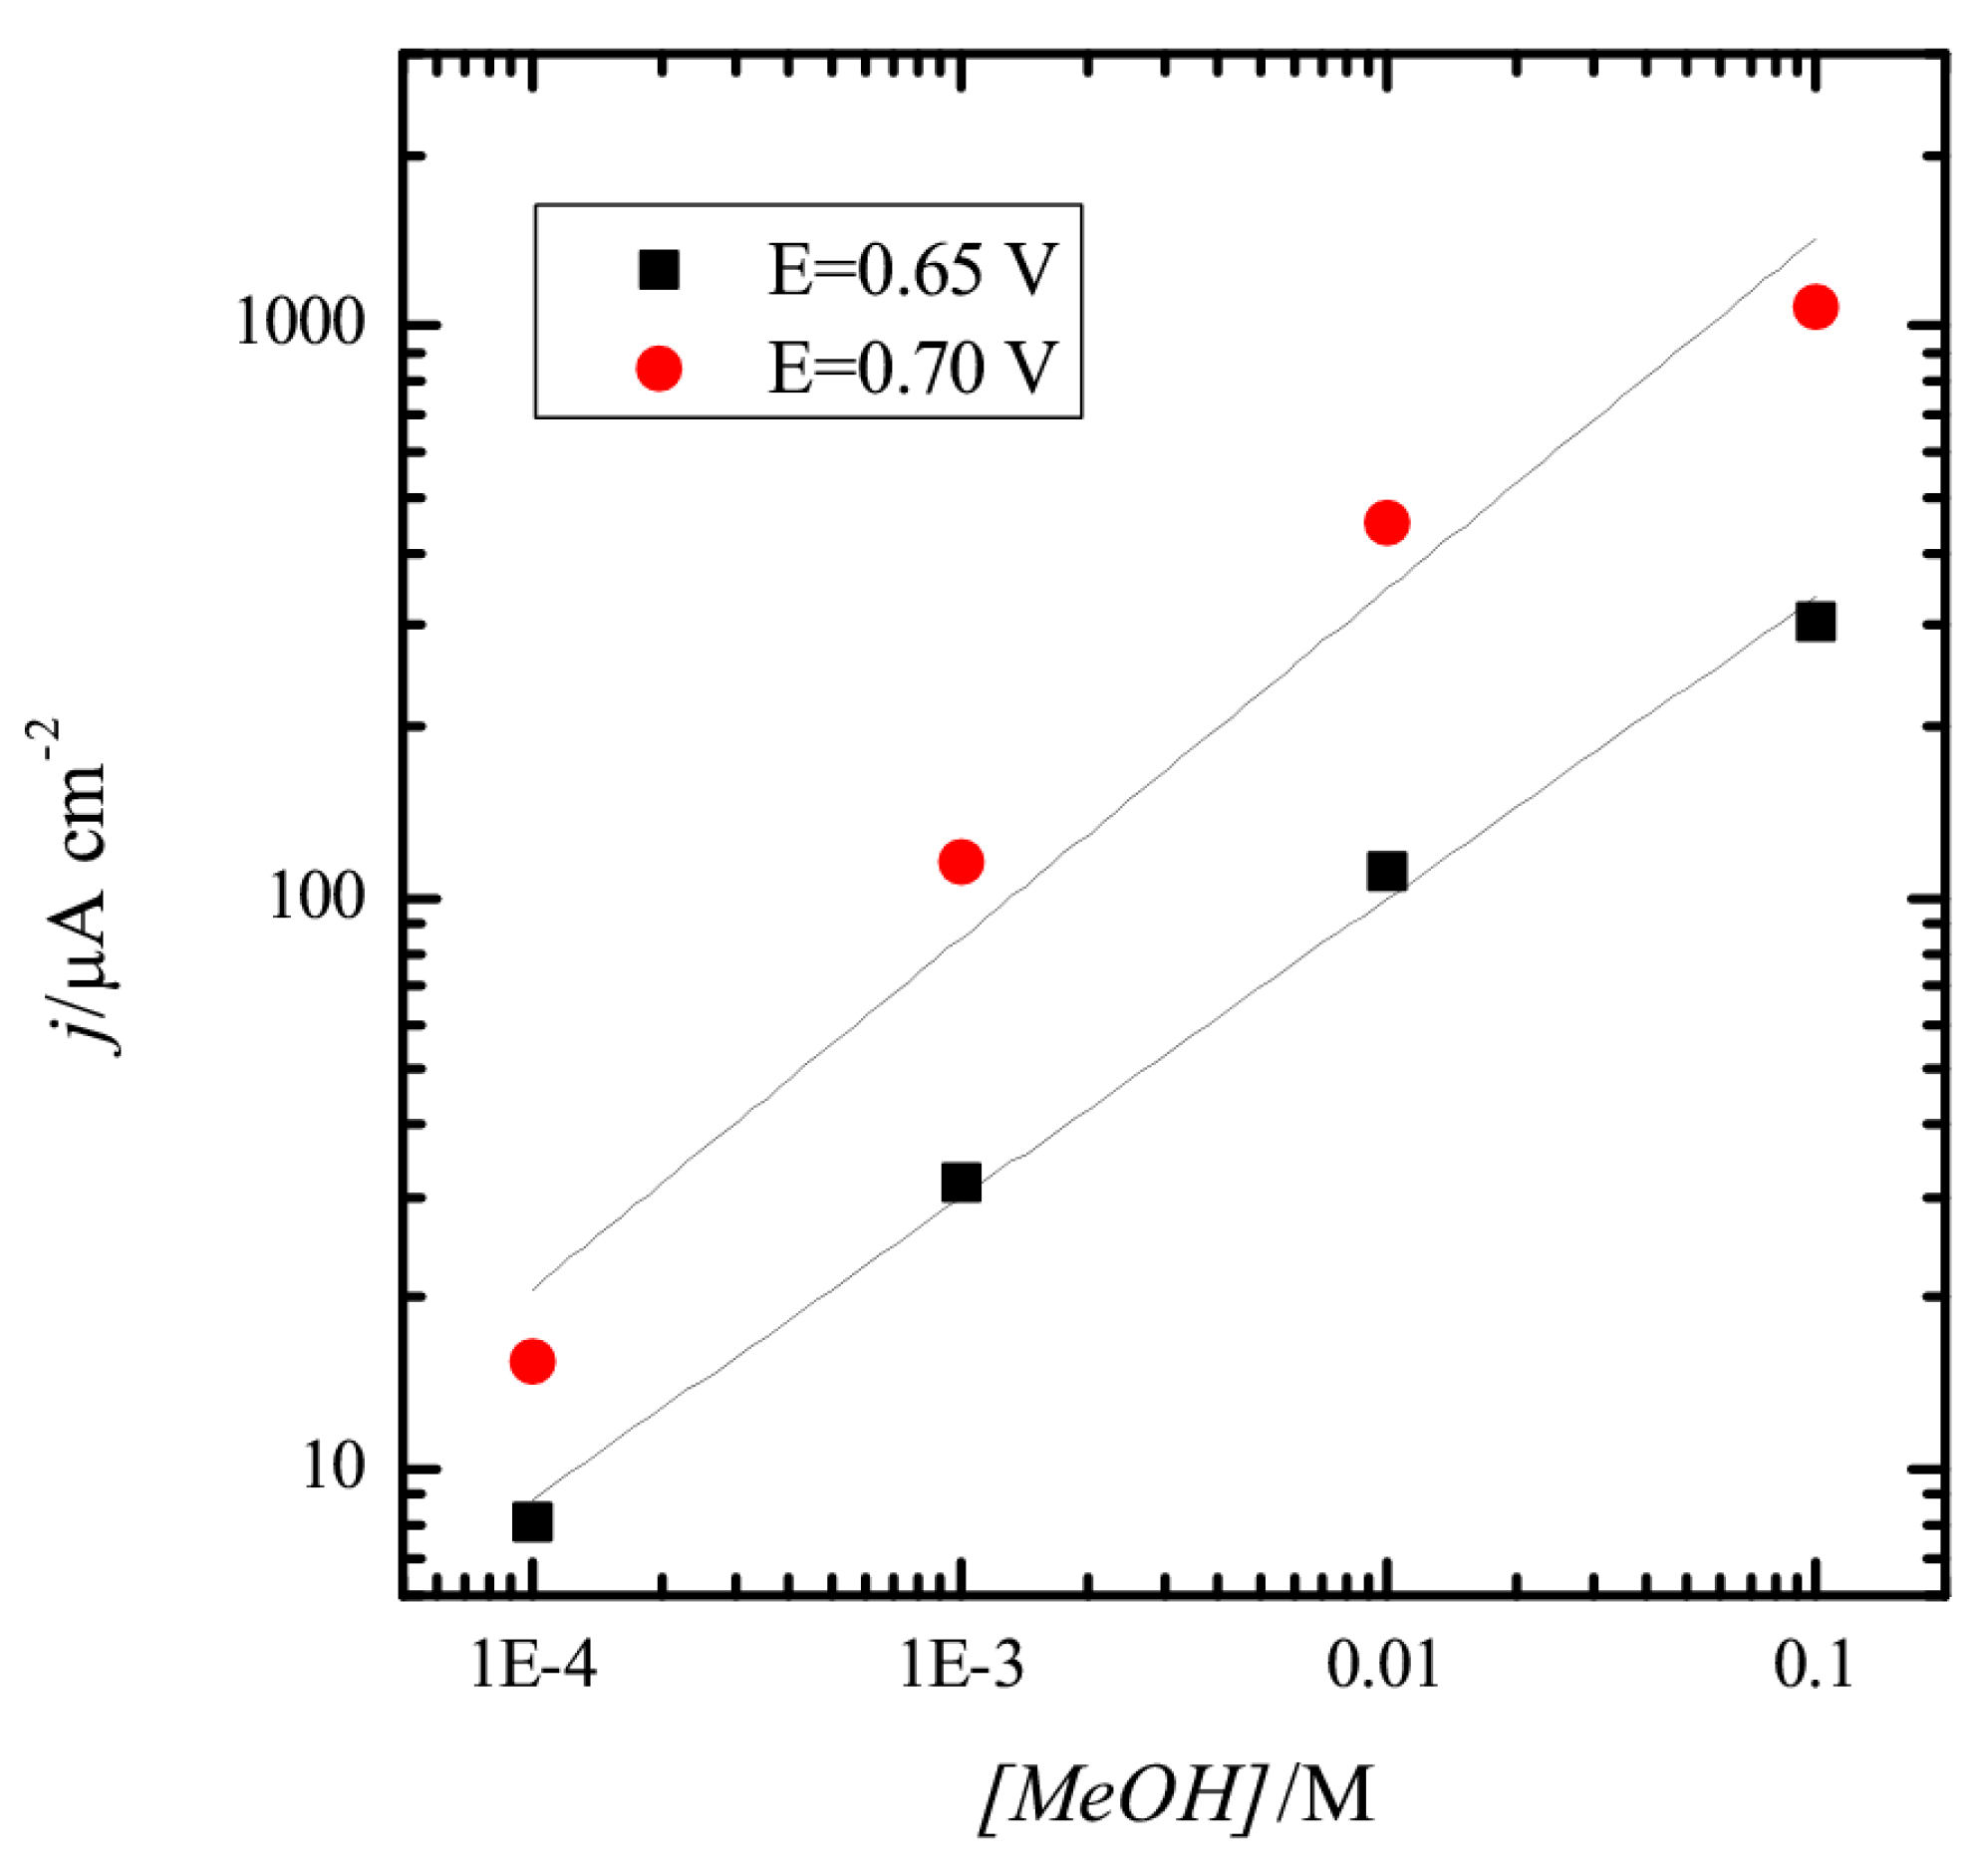
24]. However, the presence of adsorbed OH seems to be required for the oxidation. To further prove this relationship between adsorbed OH and methanol oxidation, the reaction order for methanol was calculated. For this, the current densities measured at 0.65 and 0.75 V after subtraction of the current density at these potentials in the blank voltammogram are plotted vs. the electrode potential in a double logarithmic graph (Figure 2). As can be seen, a linear relationship is observed for 0.65 V with a slope of 0.53. For 0.70 V, there is a clear deviation from linearity, especially for 0.1 M methanol, where currents are smaller than those predicted from the behavior observed for low concentrations, and the measured slope is 0.62. The fractional reaction orders and the dependence with the electrode potential and OH coverage clearly indicate that the reaction mechanism is complex, and OH should be involved in the process.
Additionally, the comparison with the observed behavior for formic acid will also provide some additional insight. The onset of formic acid oxidation (in the absence of previously formed CO) matches the onset of formate adsorption because the adsorption of formate in the favorable configuration is required for the oxidation [35,36]. This adsorption process starts at a potential where hydrogen is desorbed and the adsorption strength of formate is larger than that of OH because OH adsorption is blocked in its presence. On the other hand, the results presented here indicate that the interaction of methanol (and that of the intermediates except for CO) is weak. For this reason, it would be expected that the interaction of methanol with the surface was more favorable in the double layer region because there are no other adsorbed species on the surface. However, the currents in this region are negligible and only where OH is adsorbed, oxidation currents are recorded, reinforcing the relationship between methanol oxidation and adsorbed OH. Additionally, it should be mentioned that the detection of soluble intermediate products increases when sulfuric acid is used as supporting electrolyte [13,27,32]. The presence of adsorbed sulfate prevents the adsorption of OH and the possible intermediates, and thus, the oxidation of methanol becomes more difficult and increasing amounts of partial oxidation products are formed.
Regarding the role of adsorbed OH in this process, previous results with isotopically labeled methanol and water indicate that the cleavage of the C-H bond is involved in the rate determining step [24]. Then, adsorbed OH should be involved in positioning the methanol molecule in the right configuration for the cleavage and/or in interacting with one of the hydrogen atoms of the methanol molecule in such a way that the activation energy of this (these) step(s) is (are) diminished. This interpretation agrees with the higher amount of partial oxidation products obtained when the adsorption of OH is hindered by the presence of specifically adsorbed anions. This is not the only role of OH in the oxidation mechanism because it is also required for the oxidation of CO in the Langmuir-Hinshelwood mechanism [26,37,38].
Additional effects of the interfacial structure in the oxidation reaction can be obtained by changing the solution pH. Two interfacial parameters are affected, the electrode surface charge and the water structure. The equilibrium potential for the methanol oxidation reaction shifts 59 mV per pH unit, as the RHE scale does. For this reason, it is expected that the methanol oxidation reaction occurs in the same potential region in the RHE scale. However, as the solution pH increases, the electrode potentials for the oxidation in a pH-independent potential scale, such as the Standard Hydrogen Scale (SHE) scale, shift to more negative potential values. Since the potential of zero free charge of the Pt(111) surface is constant and pH-independent (0.28 V vs. SHE [39]), as the pH increases, the electrode charge becomes more negative, and thus, affecting the interaction of the species with the surface. Additionally, water structure also changes, altering the interaction of the molecules with water, which in turn can influence the reactivity.
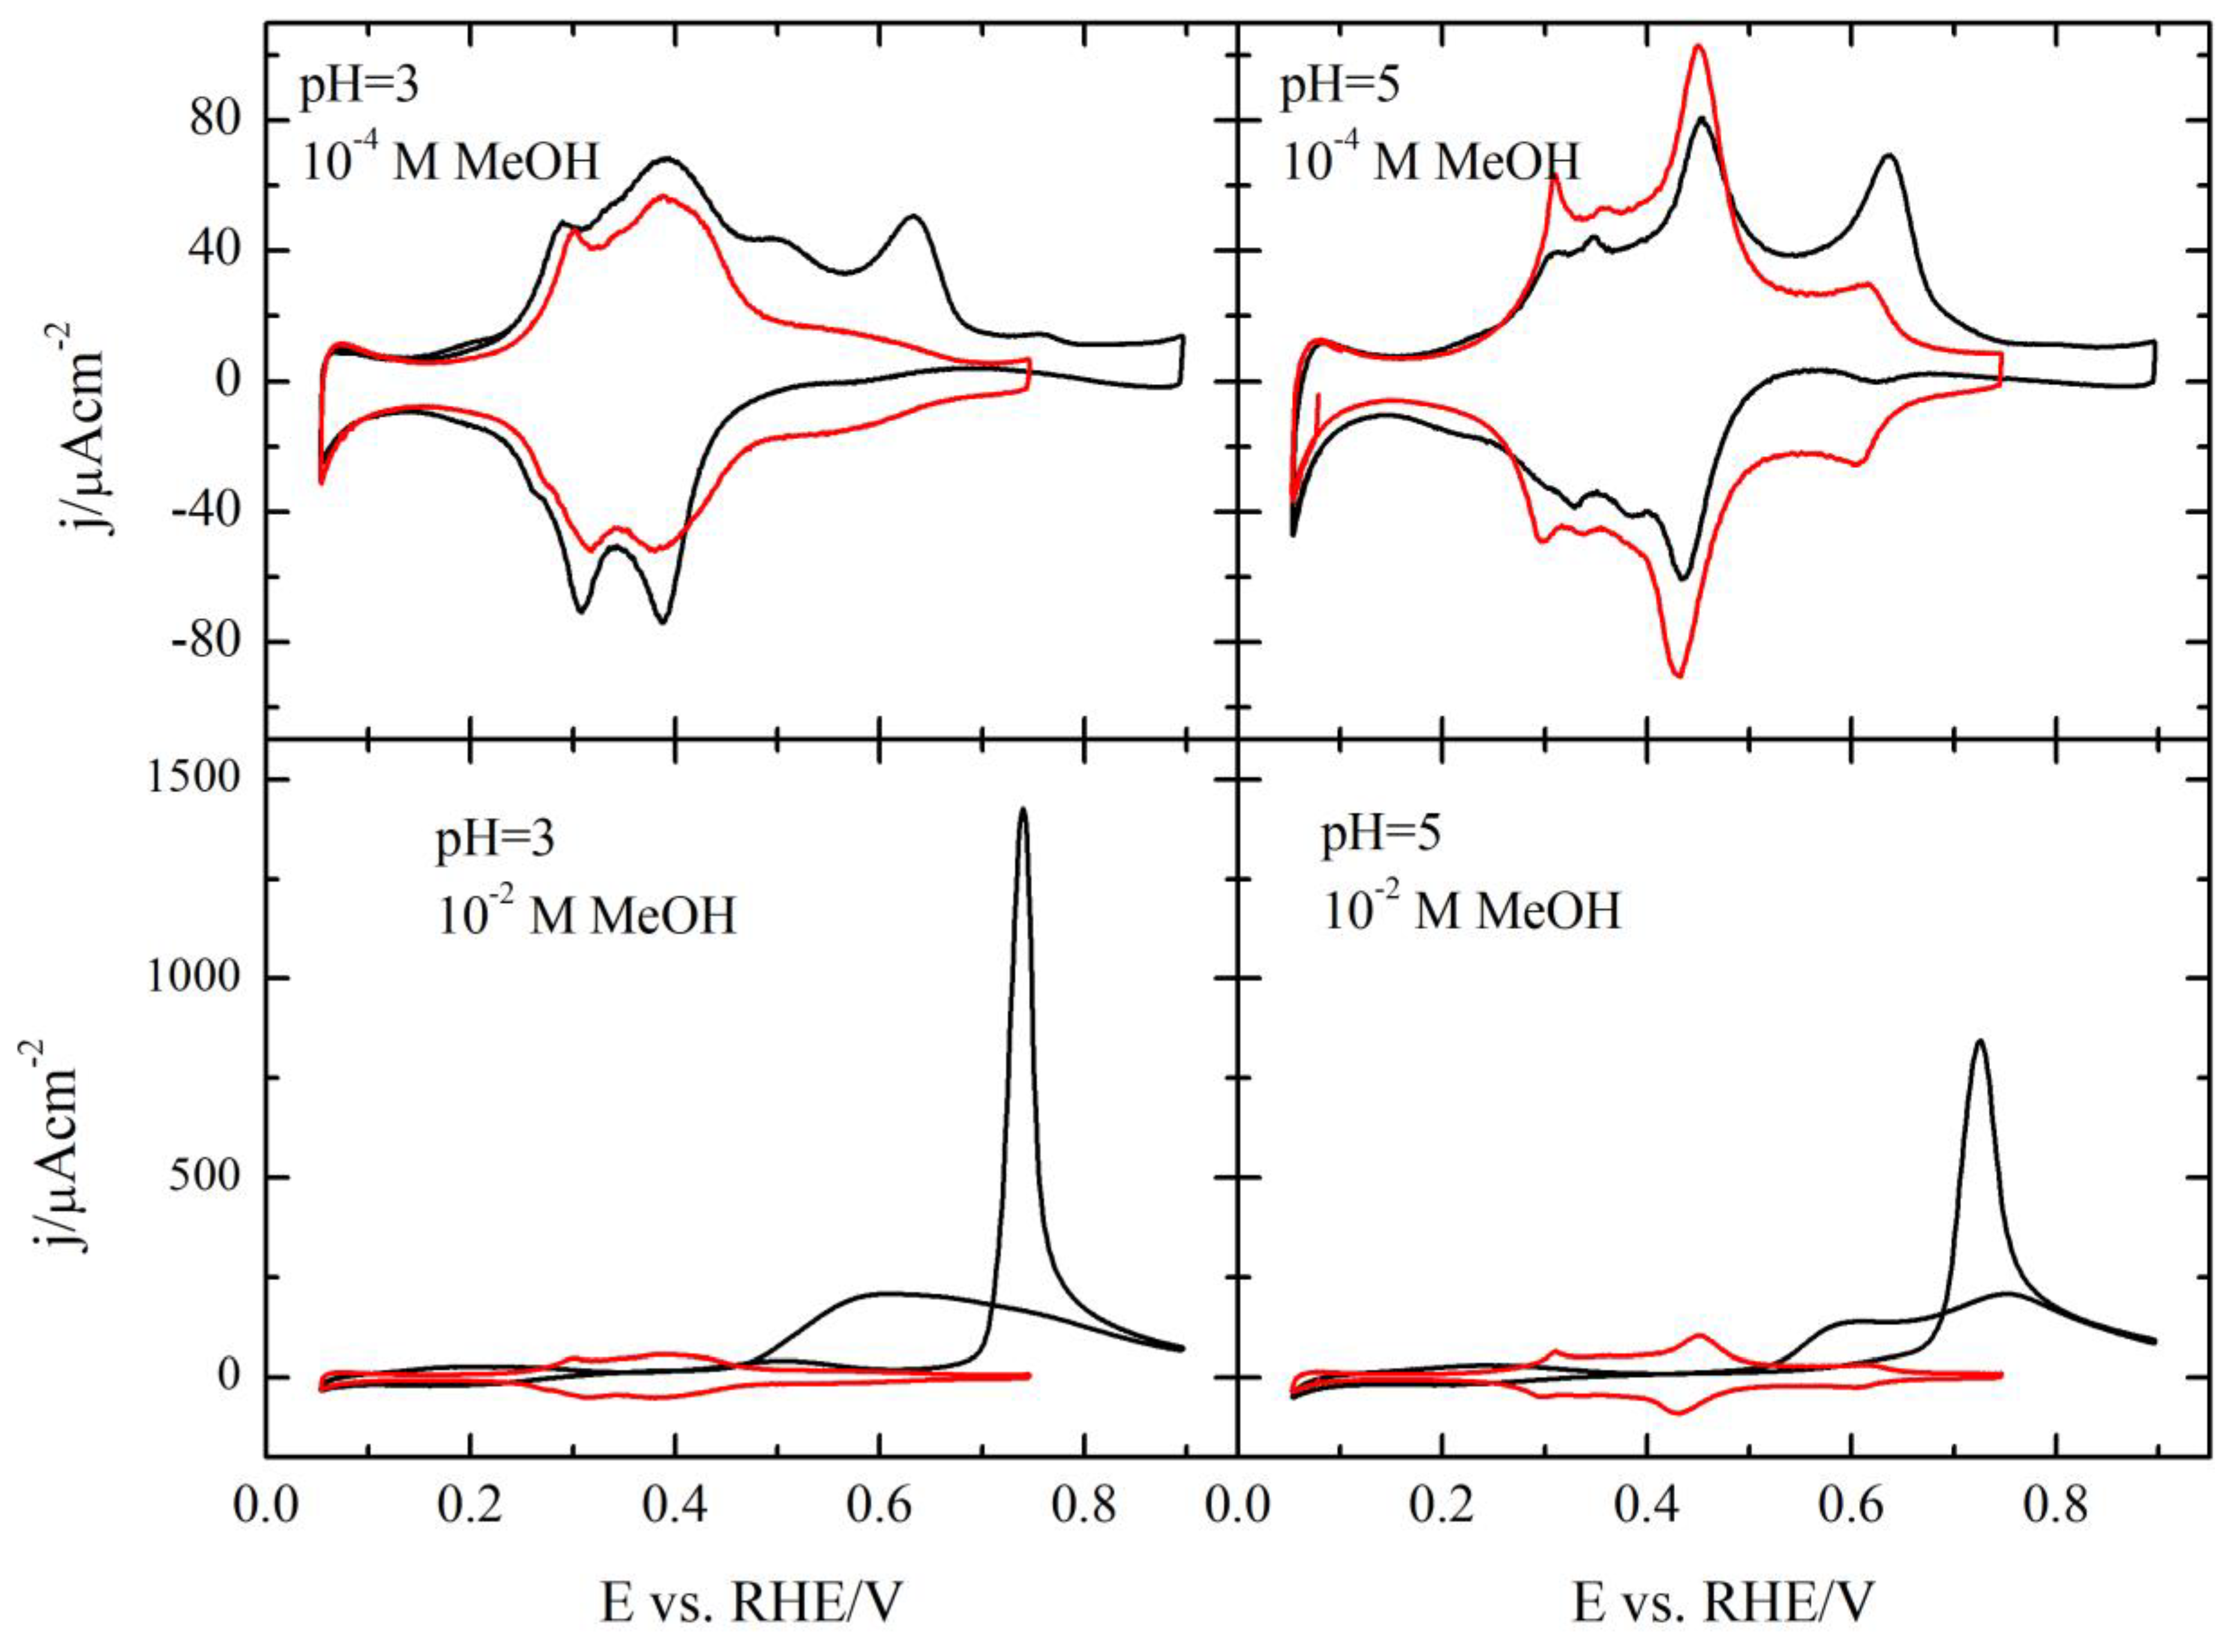
To study those effects, the methanol oxidation reaction was investigated in different pH solutions up to a pH value of 5 (Figure 3). As can be seen, the qualitative behavior of the electrode is independent of the solution pH, and the oxidation of methanol is only taking place in the region where OH is adsorbed. Thus, at 10−4 M methanol, an oxidation wave is observed as superimposed with the OH adsorption in the positive scan direction, whereas in the negative direction, the profile is more complex, as happens for pH = 1. Additionally, the profile in the hydrogen region overlaps with the measured in the absence of methanol, which implies that CO is not accumulated on this surface. For higher concentrations, the general shape of the voltammogram in methanol containing solutions do not change with the pH, showing a broad wave, whose onset potential coincides with that of OH adsorption and currents in the negative scan direction, which are slightly smaller than those recorded in the positive direction. However, a detailed analysis shows some modifications with pH, as discussed below.
The detailed analysis of the different effects require that the profiles at different pH values are compared. Figure 4 shows the voltammetric profiles of the Pt(111) electrode in the presence and absence of methanol for the different pH values. As can be seen, the changes in the blank voltammetric profile are small, especially for pH values lower than four. The onset for the OH adsorption is the same and the only major modifications are observed for the spike, which tends to disappear and as the solution pH increases, in a clear evolution to the profile recorded in alkaline media [40]. Despite these minimal changes, the oxidation of methanol is clearly affected by the pH. As shown in 
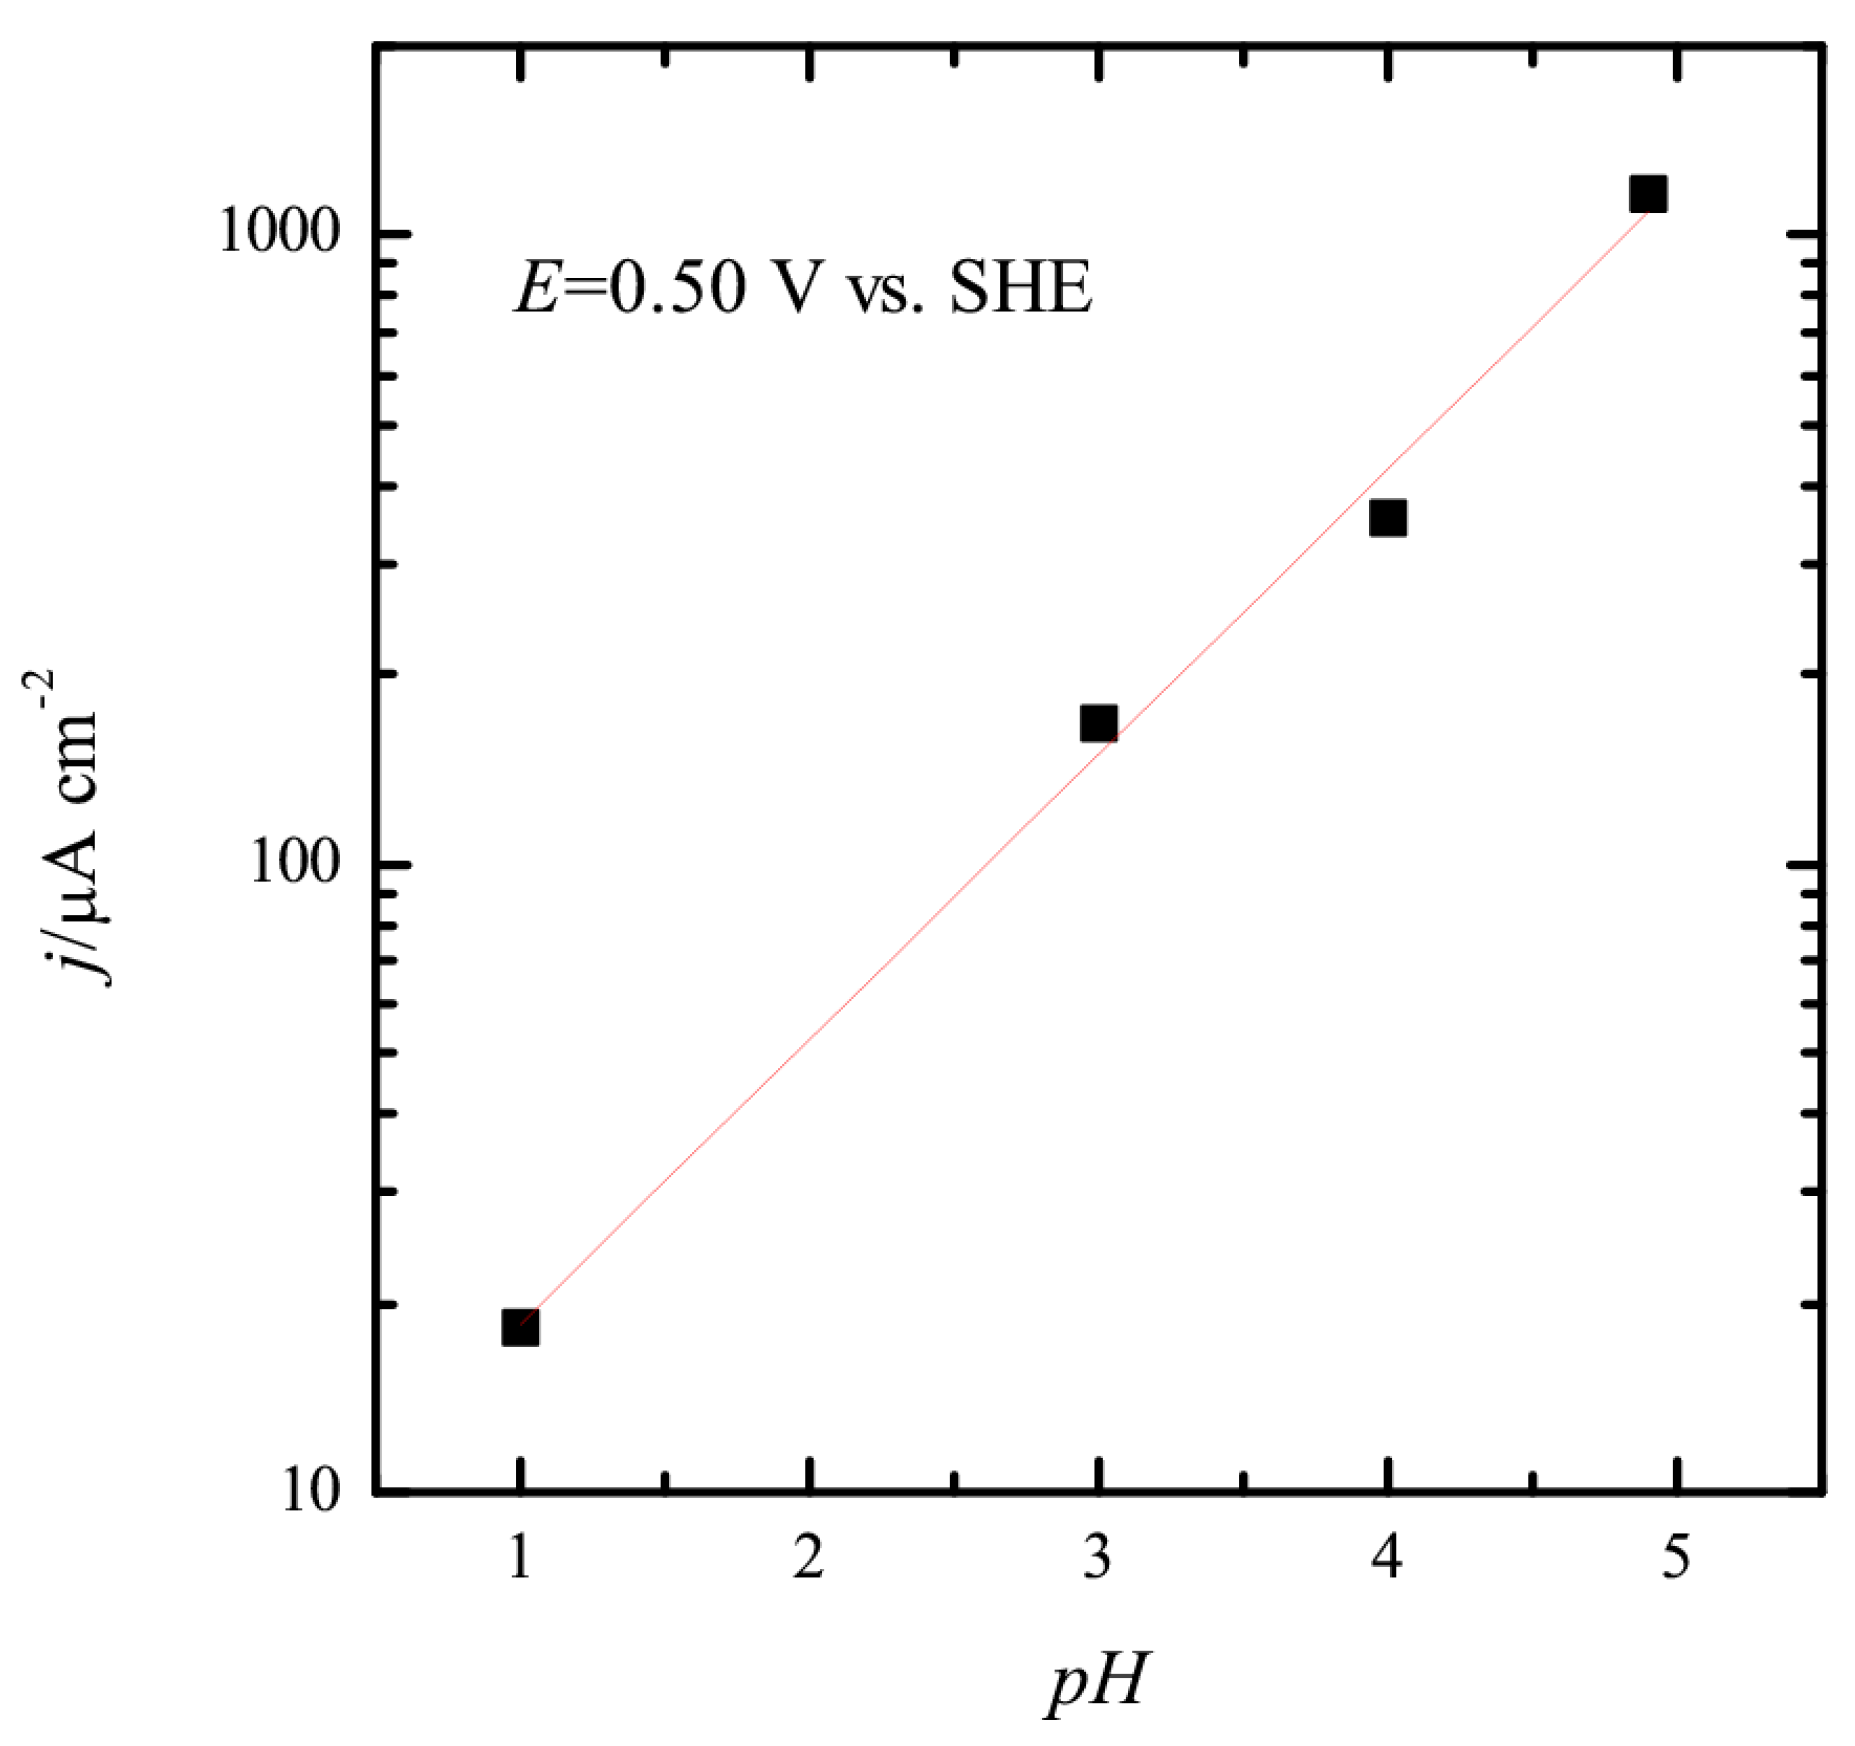
Figure 4B, the onset of the oxidation displaces to more positive potentials in the RHE scale and the current increases. Clearly, the changes in the interfacial properties are affecting this reaction. Additional information on that can be obtained calculating the reaction order for protons. For an irreversible reaction, reaction orders should be calculated at a constant potential value, in this case, in the SHE scale. Thus, when plotting the measured current at 0.5 V vs. SHE as a function of the pH in a double logarithm scale, a linear relationship is obtained in which the slope is ca. 0.45 (Figure 5). This value implies that the reaction order with respect to the proton concentration is –0.45. While the fractional orders are difficult to explain with simple mechanisms, the straightforward interpretation would be that protons are released before the rate-determining step. This observed behavior is in good agreement with the isotopic effect observed [11], which also indicate that the release of protons is involved in the rate determining step. An additional effect that should be taken into account when analyzing this behavior is the effect of the surface electrode charge. Since the potential of zero free charge is 0.28 V vs. SHE, as the pH increases, the region in which methanol oxidation takes place moves from positive charge to neutral values. Thus, the interaction between the species involved in the reaction (OH and methanol) and the surface is modified and affects the reaction rates. In this sense, for the oxygen reduction reaction, it has been proposed that higher rates obtained in neutral values are related to the surface charge values [41]. For neutral pH values, the charge of the surface is neutral in the onset of the ORR. The observed behavior for methanol shows a very similar dependence.

3.2. Pt(100) and Pt(110) Electrodes

The major difference between the behavior of the Pt(111) electrode and the other two basal planes is the presence/absence of a pure double layer region where no specific adsorption occurs. For the Pt(110) and Pt(100) electrodes, OH is readily adsorbed at low potentials when hydrogen is being desorbed [23,42,43,44,45], and thus there is no pure double layer region. Then, any molecule that interacts with the surface should either compete with hydrogen or OH for the adsorption sites. Additionally, the overlapping of the two regions prevents the determination of the potential of zero free charge.
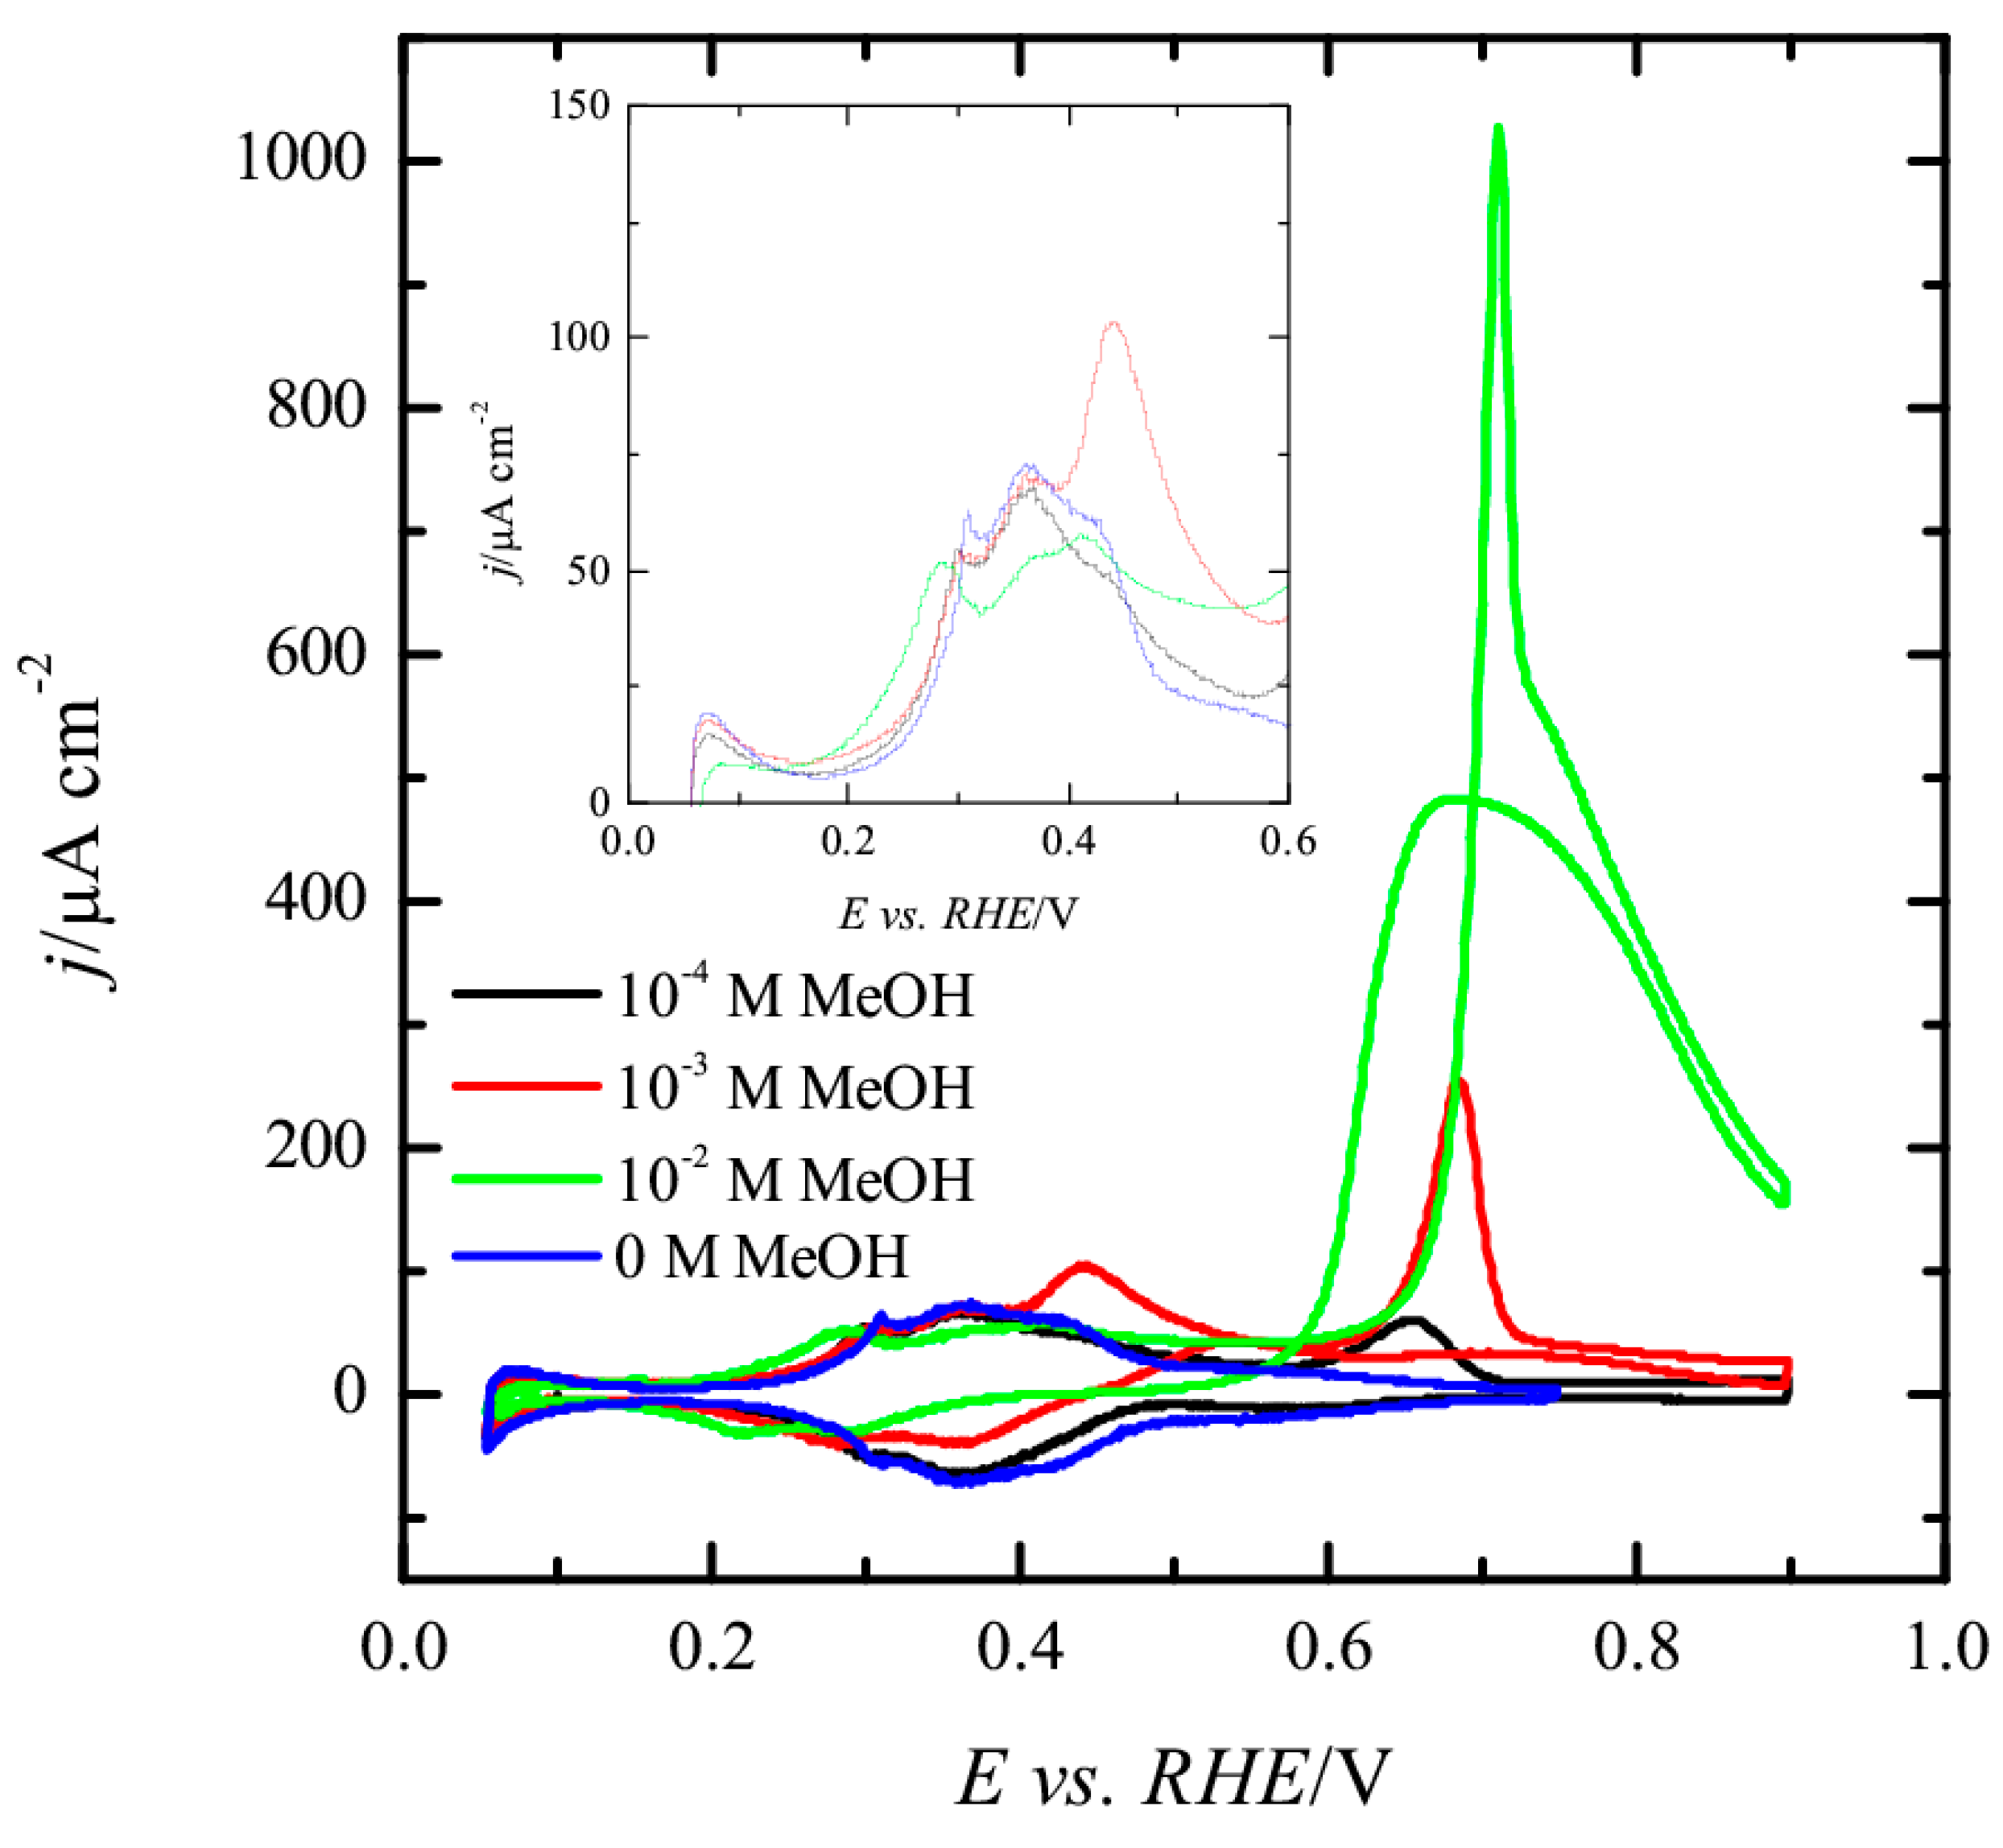
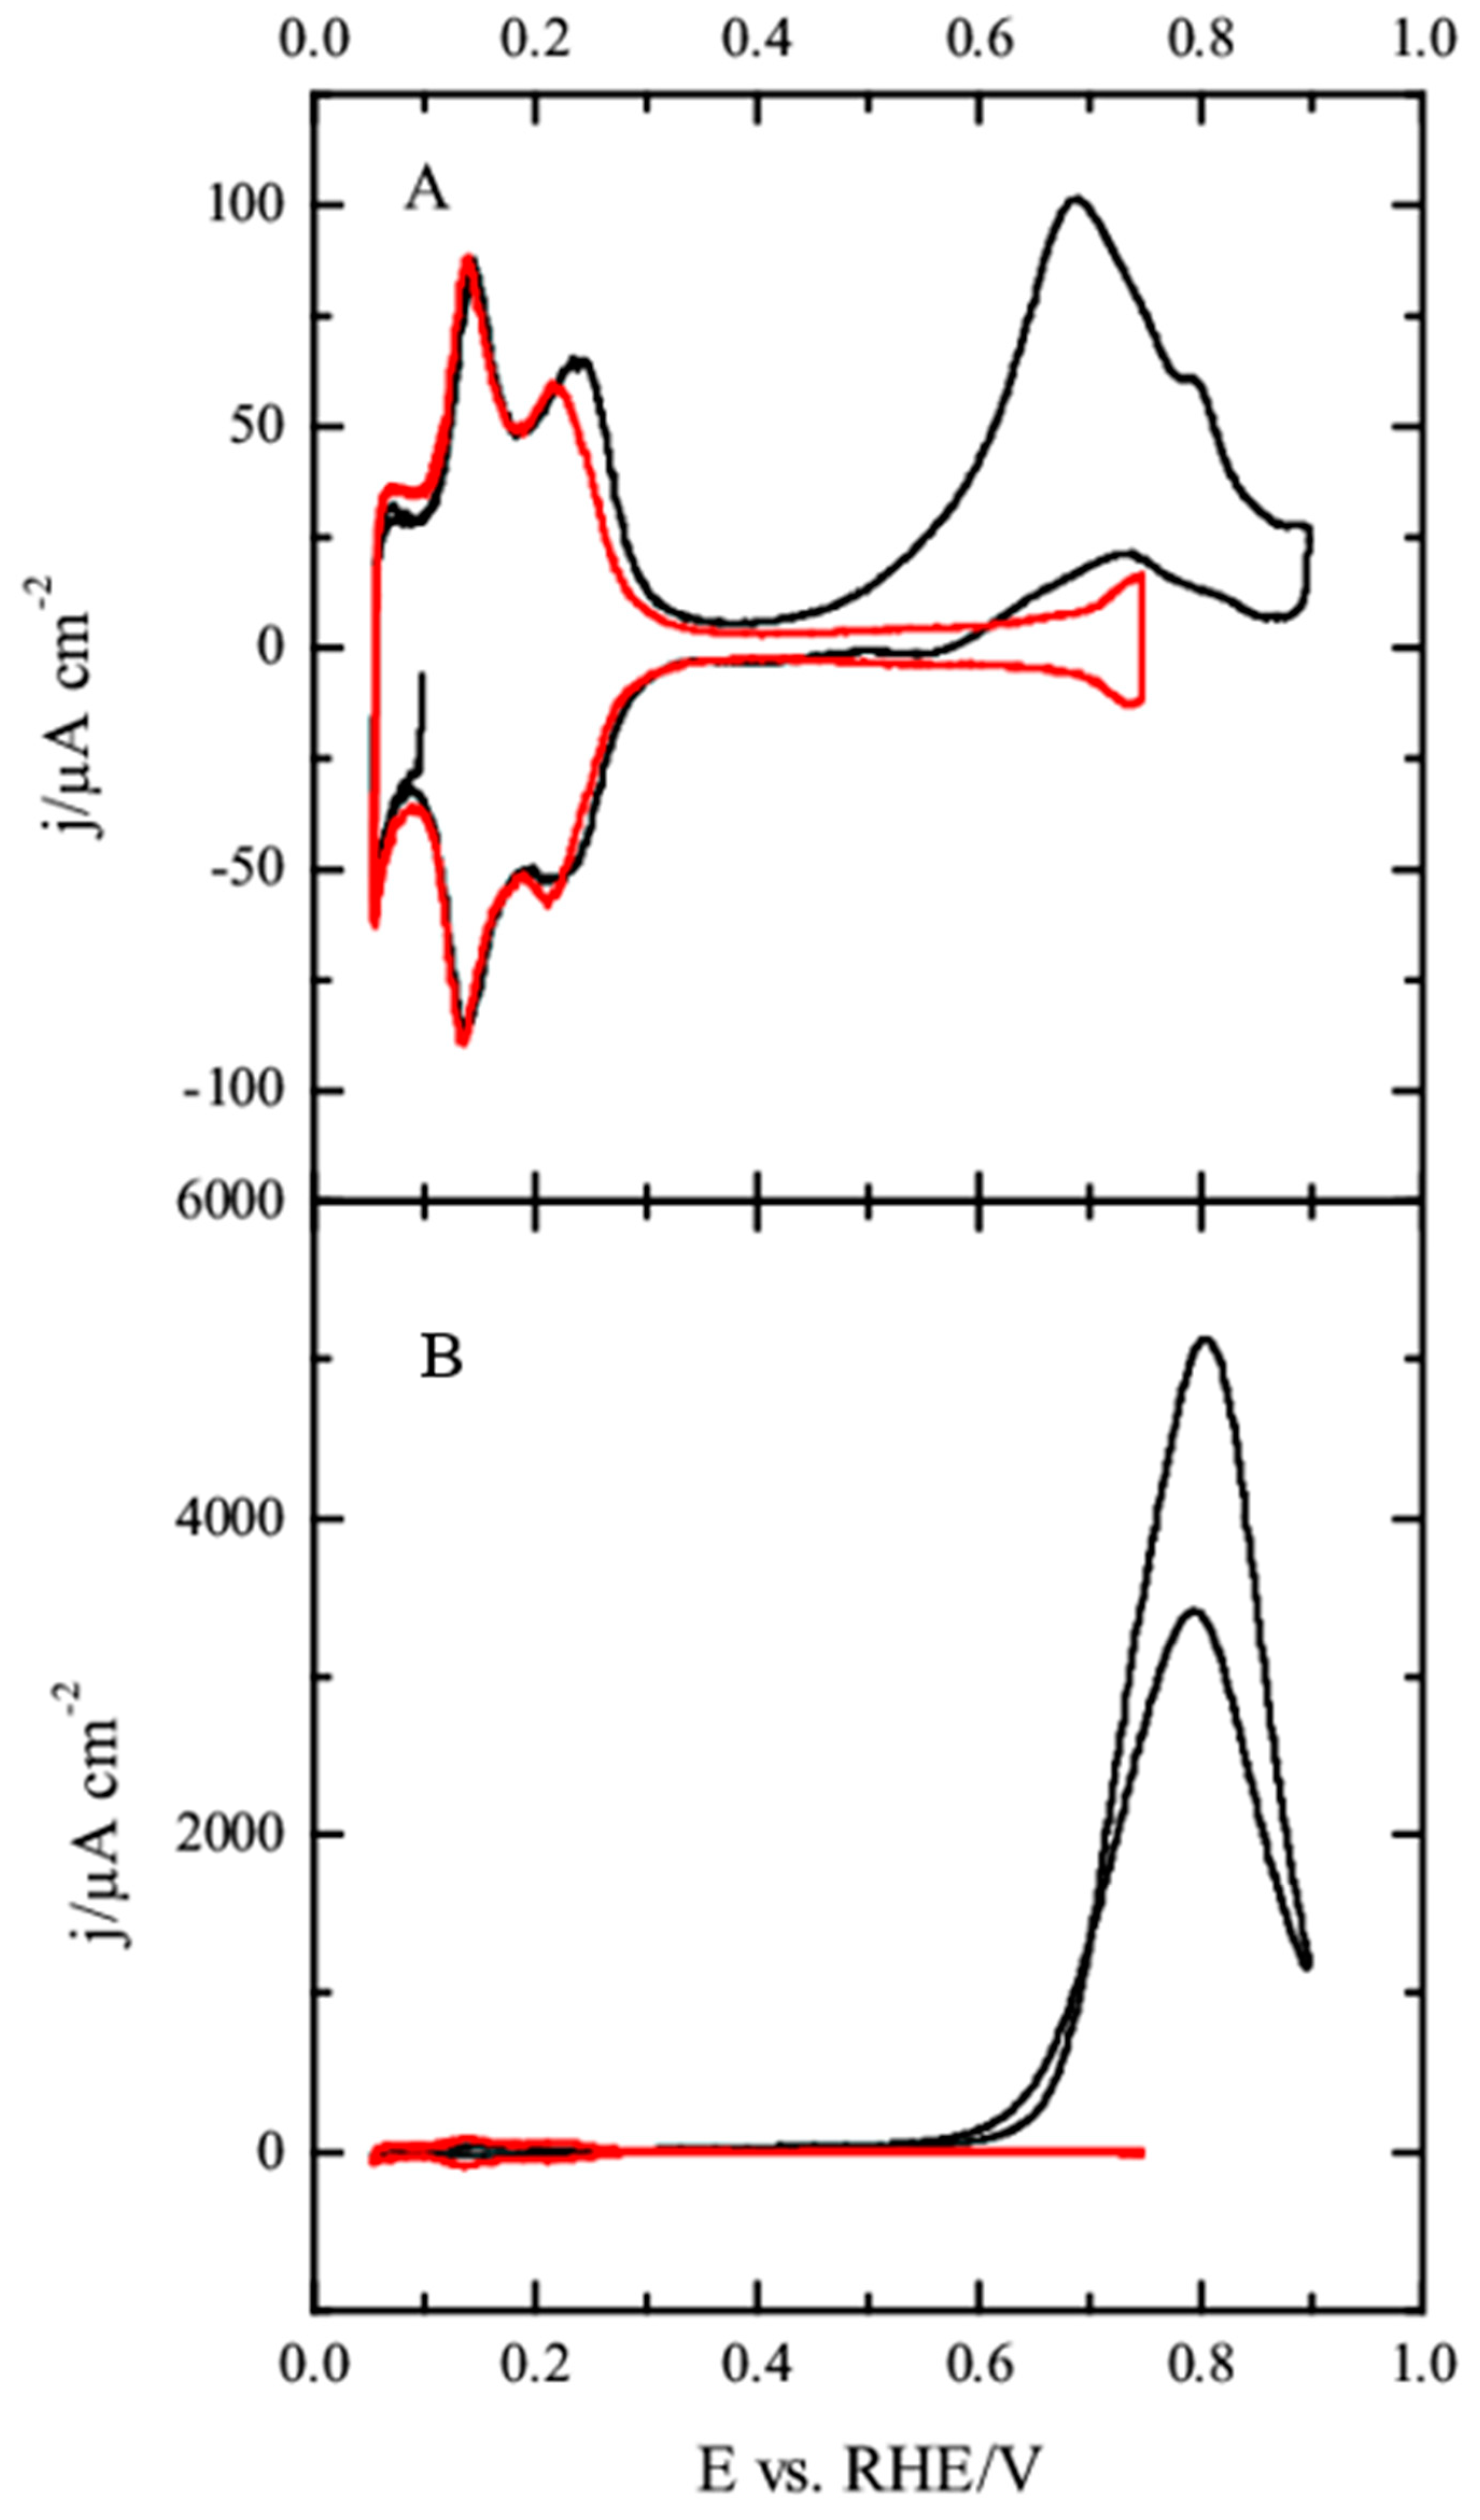
For the Pt(100) electrode (Figure 6), hydrogen is adsorbed on the surface between 0.05 and 0.45 V and the OH adsorption occurs in a broad wave between 0.45 and 0.7 V, just after the desorption of hydrogen from the surface [43,45]. In the presence of 10−4 M methanol, the only significant modification is the appearance of a peak at ca. 0.65 V in the positive scan direction, and a small diminution in the hydrogen adsorption charge. Unlike the Pt(111) electrode, this peak is only visible in the positive scan direction, and thus should be related to the oxidation of some CO molecules that have been accumulated on the electrode surface at low potentials. However, the amount of CO accumulated on the surface is very small and negligible currents are recorded in the negative scan direction. As the methanol concentration increases, this CO oxidation peak increases in charge and shifts to more positive potentials. In parallel, hydrogen adsorption charge below 0.45 V diminishes due to the blockage of hydrogen adsorption sites by CO. Additionally, a second oxidation wave after this peak CO emerges both in the positive and negative scan directions. This wave shows a hysteresis between both scan directions, which is clearly visible for the solution containing 10−2 M methanol, and should be related to the accumulation of CO in the positive scan direction at potentials below 0.6 V. Thus, the presence of adsorbed CO in the positive scan direction hinders the oxidation of additional molecules of methanol on the surface. After the oxidation of CO, methanol molecules can interact with the surface and give additional oxidation current contributions. In the negative scan direction, any CO formed during the reaction can be readily oxidized at potentials higher than 0.6 V, giving rise to the hysteresis between both scan directions.
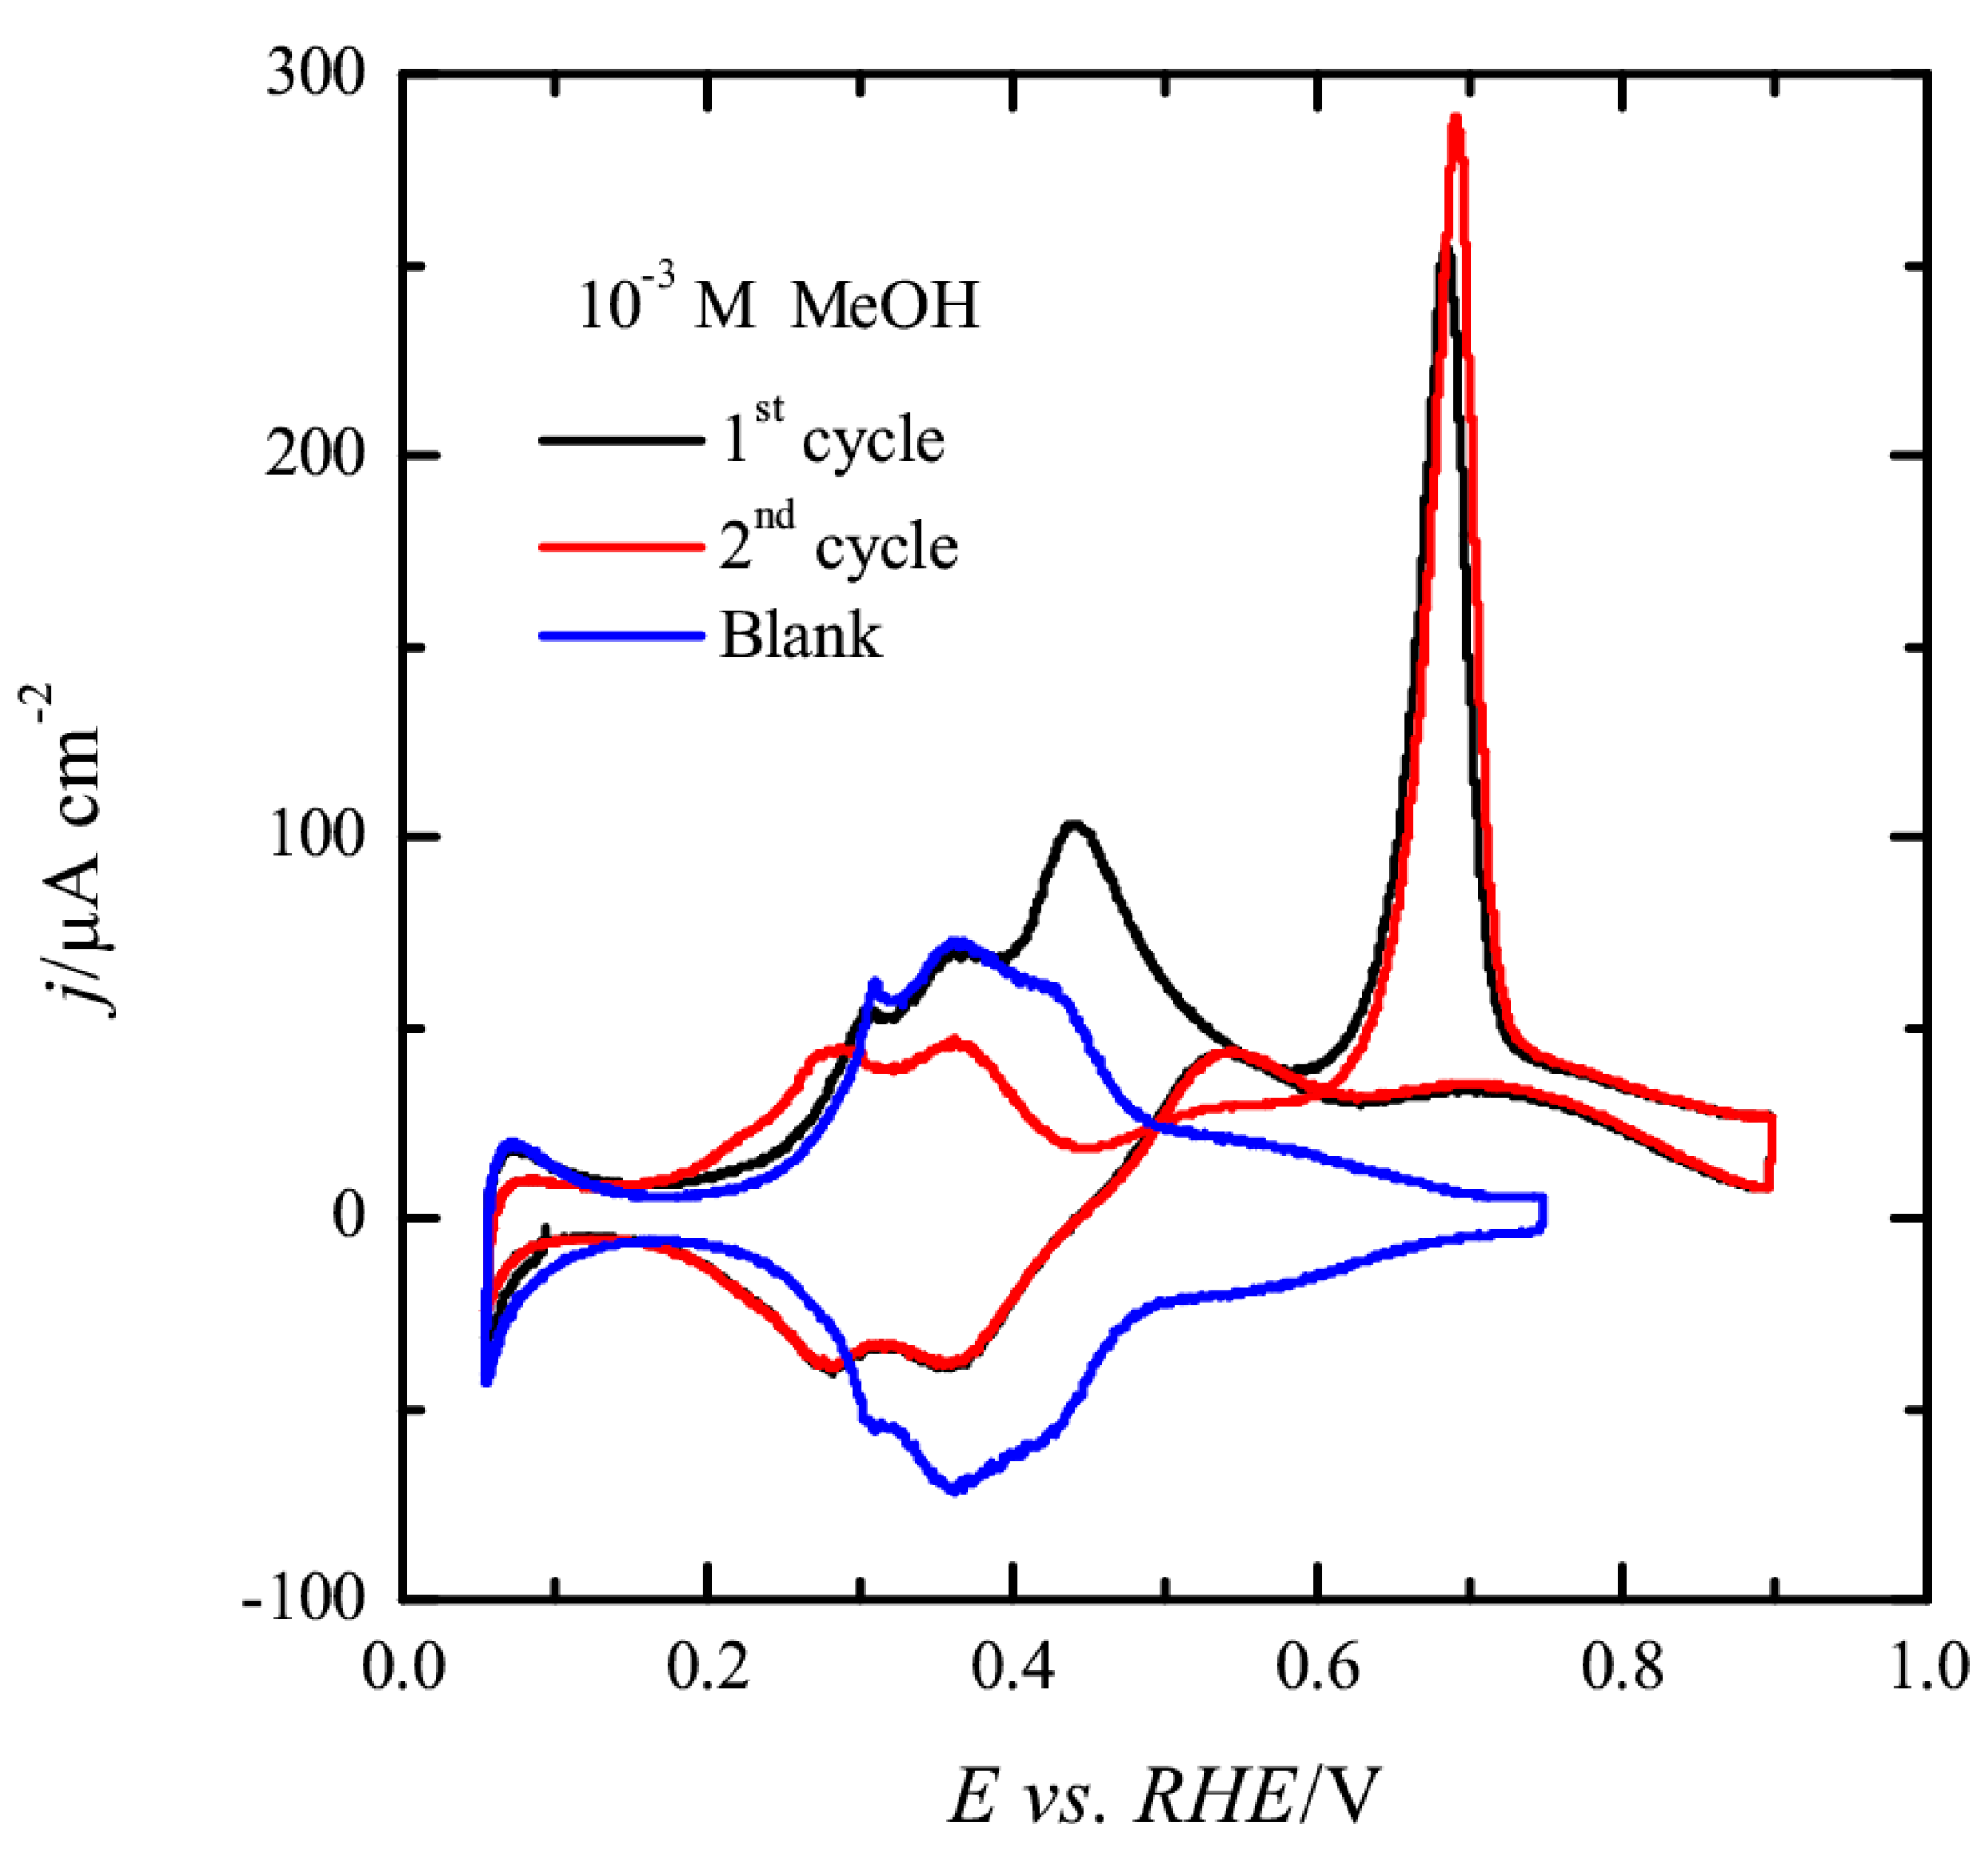
The process of CO formation on the electrode surface can be followed for the 10−3 M methanol concentration (Figure 7). As can be seen, the voltammogram for the first scan in the presence of 10−3 M methanol overlaps with that recorded in the absence of methanol until 0.45 V, implying that no CO has been accumulated on the surface up to this potential value. Coinciding with the onset of OH adsorption, some additional currents are observed. These currents should correspond to the formation of CO from methanol according to the reaction
CH3OH → CO + 4H+ + 4e,
In fact, the analysis of the transient currents shows that CO is formed between 0.45 and 0.6 V [14], implying that the formation of CO is only taking place in the region where OH is adsorbed. In the negative scan direction, some additional currents are observed in this region, which are also related to the formation of CO, as revealed by the significant diminution of the hydrogen adsorption charge observed below 0.4 V. After this first scan, the second scan does not show the currents at 0.45 V, because CO is already adsorbed on the surface. It should be noted that the following scans are identical to the second scan. For the 10−2 M methanol concentration, the process of CO formation is not as visible as in 10−3 M (inset of Figure 6). While currents are recorded between 0.4 and 0.6 V, the peak is not well developed. It should be highlighted that, for this concentration, the results are very dependent on how the meniscus is formed. This fact implies that CO is being formed during the immersion of the electrode and the meniscus formation. While the electrode is immersed at a controlled potential (0.1 V), a few ms are required to establish the imposed potential. Due to the higher concentrations and the concomitant higher reaction rates, CO is being formed during this process. As can be seen in Figure 6 for this concentration, hydrogen desorption states have been displaced to lower potential values and hydrogen desorption charge is smaller, which is the characteristic behavior of a Pt(100) surface partially covered by CO [46]. Thus, a lower amount of CO can be formed in the positive scan, resulting in a less defined peak for this process.
Regarding the behavior of the methanol oxidation reaction on the Pt(100) electrode in different pH solutions (Figure 8), the general behavior is the same as that recorded in 0.1 M HClO4. In the positive scan direction, the peak associated with the oxidation of the accumulated CO can be observed, followed by the presence of a second oxidation wave, which is also visible in the negative scan direction. In general, no significant variation of the currents is observed, and the measured currents in the broad wave in the negative scan direction are almost independent of the pH. The observed changes, especially in the shape of the peak associated with the oxidation of CO and the broad wave are probably related to the changes in the OH adsorption mode. The voltammograms in absence of methanol show a progressive evolution from the profile measured at pH = 1 (Figure 7) to that obtained in alkaline solutions [47]. While the OH coverage is not significantly affected by the pH, the differences in the voltammograms reflect that the energetics of the OH adsorption process is altered by pH [47]. If, as proposed, OH involved in the reaction, the changes in the energetics should imply changes in the kinetics, that in this cases are translated in changes of the voltammetric shape. On the other hand, a reaction order cannot be obtained using this wave due to experimental problems. In this case, the raising part of the curve in the negative scan direction (that appearing between 0.6 and 0.7 V) should be used because it is not affected by the presence of adsorbed CO or any other inhibition process related to the formation of a compact OH layer. However, this region is very is very narrow and when curves are transformed in the SHE scale, the regions for the different pH do not overlap, preventing the accurate measurement of the current for the different pH values at a constant potential vs. SHE. Nevertheless, the observed behavior is similar to that observed for oxygen reduction, where currents are almost independent of the solution pH [41].
For the Pt(110) electrode, the voltammogram for the oxidation of methanol shows a wave with a complex shape in the positive scan, whose onset is located at ca. 0.5 V in 10−4 M methanol, whereas, in the negative scan direction, the currents are almost negligible (Figure 9). These small currents cannot be assigned to the formation of adsorbed CO since the voltammetric profile in the low potential region overlaps with that measured in the absence of methanol. It should be noted that the signals appearing in the blank voltammogram between 0.06 and 0.30 V contain contributions both from hydrogen and OH adsorption. Then, the low currents recorded in the negative scan direction should be assigned to the oxidation of the surface, which is an irreversible process that occurs for this electrode above 0.8 V. As the concentration increases, the current also increases. However, the peak current difference between the positive and negative scan directions remains, due to the oxidation of the surface. It should be stressed that the oxidation of methanol is taking place, also on this electrode, on a surface partially covered by OH, reinforcing the connection between adsorbed OH and methanol oxidation. On the other hand, the solution pH effect on this surface is very similar to that described for the Pt(100) electrode. It should be noted that the voltammograms for this surface are very sensitive to the actual structure of the electrode, likely related to the fraction of the surface having the (1 × 2) reconstruction. This ratio depends, in turn, on the annealing conditions [23], so that the measured currents for the methanol oxidation reaction for this electrode show large variability.

4. Conclusions

The use of diluted methanol solutions with different pH has allowed establishing relationships between the interfacial structure and the reactivity. First, the results indicate that methanol oxidation is only taking place when the surface is partially covered by adsorbed OH. Thus, the dehydrogenation step to yield adsorbed CO on the Pt(100) surface starts on the same electrode potential for the onset of OH adsorption on this electrode. On the other hand, on the Pt(111) electrode, where CO is not accumulated, the onset for the direct oxidation of methanol and the adsorption of OH coincide. In this case, the adsorbed OH species are not a mere spectator, because the obtained results for the reaction order for methanol and the proton indicate that OH adsorbed species are involved in the reaction mechanism. Since previous results show that the rate determining step in the methanol oxidation reaction is a dehydrogenation step, probably adsorbed OH collaborates in this step, facilitating either the adsorption of the methanol in the right configuration or the cleavage of the C—H bond so that the activation energy is minimized. These results are important for the computational modeling of the reaction because adsorbed OH should be incorporated in the model to reflect the real interfacial structure.

Author Contributions

Conceptualization, J.M.F. and E.H.; methodology, E.H.; validation, M.A.K. and R.M.-H.; formal analysis, E.H. and R.M.-H.; investigation, M.A.K. and R.M.-H.; writing—original draft preparation, E.H.; writing—review and editing, M.A.K., R.M.-H., J.M.F. and E.H; visualization, R.M.-H. and E.H.; supervision, J.M.F. and E.H.; project administration, J.M.F. and E.H.; funding acquisition, J.M.F. and E.H.

Funding

This research was funded by the MINECO (Spain), grant number CTQ2016-76221-P.

Conflicts of Interest

The authors declare no conflict of interest.

References

  1. Parsons, R.; Vandernoot, T. The oxidation of small organic molecules: A survey of recent fuel cell related research. J. Electroanal. Chem. 1988, 257, 9–45. [Google Scholar] [CrossRef]
  2. Sriramulu, S.; Javi, T.D.; Stuve, E.M. Kinetic Modeling of Electrocatalytic Reactions: Methanol Oxidation on Platinum Electrodes. In Interfacial Electrochemistry, Theory, Experiments and Applications; Wieckowski, A., Ed.; Marcel Dekker: New York, NY, USA, 1998; p. 793. [Google Scholar]
  3. Iwasita, T. Electrocatalysis of methanol oxidation (vol 47, pg 3663, 2001). Electrochim. Acta 2002, 48, 289. [Google Scholar] [CrossRef]
  4. Markovic, N.M.; Ross, P.N. Surface science studies of model fuel cell electrocatalysts. Surf. Sci. Rep. 2002, 45, 117–229. [Google Scholar] [CrossRef]
  5. Koper, M.T.M.T.M.; Lai, S.C.C.S.; Herrero, E. Mechanisms of the Oxidation of Carbon Monoxide and Small Organic Molecules at Metal Electrodes. In Fuel Cell Catalysis: A Surface Science Approach; Koper, M.T.M., Ed.; John Wiley & Sons, Inc.: Hoboken, NJ, USA, 2009; pp. 166–171. ISBN 978-0-470-13116-9. [Google Scholar]
  6. Cohen, J.L.; Volpe, D.J.; Abruna, H.D. Electrochemical determination of activation energies for methanol oxidation on polycrystalline platinum in acidic and alkaline electrolytes. Phys. Chem. Chem. Phys. 2007, 9, 49–77. [Google Scholar] [CrossRef] [PubMed]
  7. Neurock, M.; Janik, M.; Wieckowski, A. A first principles comparison of the mechanism and site requirements for the electrocatalytic oxidation of methanol and formic acid over Pt. Faraday Discuss. 2009, 140, 363–378. [Google Scholar] [CrossRef]
  8. Clavilier, J.; Lamy, C.; Leger, J.M. Electrocatalytic Oxidation of Methanol on Single-Crystal Platinum-Electrodes—Comparison with Polycrystalline Platinum. J. Electroanal. Chem. 1981, 125, 249–254. [Google Scholar] [CrossRef]
  9. Lamy, C.; Leger, J.M.; Clavilier, J.; Parsons, R. Structural effects in electrocatalysis: A comparative study of the oxidation of CO, HCOOH and CH3OH on single crystal Pt electrodes. J. Electroanal. Chem. 1983, 150, 71–77. [Google Scholar] [CrossRef]
  10. Franaszczuk, K.; Herrero, E.; Zelenay, P.; Wieckowski, A.; Wang, J.; Masel, R.I.I. A comparison of electrochemical and gas-phase decomposition of methanol on platinum surfaces. J. Phys. Chem. 1992, 96, 8509–8516. [Google Scholar] [CrossRef]
  11. Herrero, E.; Franaszczuk, K.; Wieckowski, A. Electrochemistry of methanol at low index crystal planes of platinum. An integrated voltammetric and chronoamperometric study. J. Phys. Chem. 1994, 98, 5074–5083. [Google Scholar] [CrossRef]
  12. Housmans, T.H.M.; Koper, M.T.M. Methanol oxidation on stepped Pt n(111) x (110) electrodes: A chronoamperometric study. J. Phys. Chem. B 2003, 107, 8557–8567. [Google Scholar] [CrossRef]
  13. Lai, S.C.S.; Lebedeva, N.P.; Housmans, T.H.M.; Koper, M.T.M. Mechanisms of carbon monoxide and methanol oxidation at single-crystal electrodes. Top. Catal. 2007, 46, 320–333. [Google Scholar] [CrossRef]
  14. Grozovski, V.; Climent, V.; Herrero, E.; Feliu, J.M. The role of the surface structure in the oxidation mechanism of methanol. J. Electroanal. Chem. 2011, 662, 43–51. [Google Scholar] [CrossRef]
  15. Martínez-Hincapié, R.; Sebastián-Pascual, P.; Climent, V.; Feliu, J.M. Exploring the interfacial neutral pH region of Pt(111) electrodes. Electrochem. Commun. 2015, 58, 62–64. [Google Scholar] [CrossRef] [Green Version]
  16. Sebastián, P.; Martínez-Hincapié, R.; Climent, V.; Feliu, J.M. Study of the Pt(111) | electrolyte interface in the region close to neutral pH solutions by the laser induced temperature jump technique. Electrochim. Acta 2017, 228, 667–676. [Google Scholar] [CrossRef]
  17. Clavilier, J.; Faure, R.; Guinet, G.; Durand, R. Preparation of monocrystalline Pt microelectrodes and electrochemical study of the plane surfaces cut in the direction of the {111} and {110} planes. J. Electroanal. Chem. 1980, 107, 205–209. [Google Scholar] [CrossRef]
  18. Korzeniewski, C.; Climent, V.; Feliu, J. Electrochemistry at Platinum Single Crystal Electrodes. In Electroanalytical Chemistry A Series of Advances: Volume 24; CRC Press: Boca Raton, FL, USA, 2011; pp. 75–170. ISBN 978-1-4398-3750-4. [Google Scholar]
  19. Clavilier, J.; Elachi, K.; Petit, M.; Rodes, A.; Zamakhchari, M.A. Electrochemical Monitoring of the Thermal Reordering of Platinum Single-Crystal Surfaces after Metallographic Polishing from the Early Stage to the Equilibrium Surfaces. J. Electroanal. Chem. 1990, 295, 333–356. [Google Scholar] [CrossRef]
  20. Herrero, E.; Orts, J.M.; Aldaz, A.; Feliu, J.M. Scanning tunneling microscopy and electrochemical study of the surface structure of Pt(10,10,9) and Pt(11,10,10) electrodes prepared under different cooling conditions. Surf. Sci. 1999, 440, 259–270. [Google Scholar] [CrossRef]
  21. García-Aráez, N.; Climent, V.; Herrero, E.; Feliu, J.M. On the electrochemical behavior of the Pt(1 0 0) vicinal surfaces in bromide solutions. Surf. Sci. 2004, 560, 269–284. [Google Scholar] [CrossRef]
  22. Markovic, N.M.; Grgur, B.N.; Lucas, C.A.; Ross, P.N. Surface electrochemistry of CO on Pt(110)-(1x2) and Pt(110)-(1x1) surfaces. Surf. Sci. 1997, 384, L805–L814. [Google Scholar] [CrossRef]
  23. Attard, G.A.; Hunter, K.; Wright, E.; Sharman, J.; Martínez-Hincapié, R.; Feliu, J.M. The voltammetry of surfaces vicinal to Pt{110}: Structural complexity simplified by CO cooling. J. Electroanal. Chem. 2017, 793, 137–146. [Google Scholar] [CrossRef] [Green Version]
  24. Herrero, E.; Wieckowski, A. Electrochemistry of Methanol at Low Index Crystal Planes. J. Phys. Chem. 1994, 98, 5074–5083. [Google Scholar] [CrossRef]
  25. Berna, A.; Climent, V.; Feliu, J.M. New understanding of the nature of OH adsorption on Pt(111) electrodes. Electrochem. Commun. 2007, 9, 2789–2794. [Google Scholar] [CrossRef]
  26. Angelucci, C.A.C.A.; Herrero, E.; Feliu, J.M.J.M. Modeling CO oxidation on Pt(111) electrodes. J. Phys. Chem. C 2010, 114, 14154–14163. [Google Scholar] [CrossRef]
  27. Housmans, T.H.M.; Wonders, A.H.; Koper, M.T.M. Structure Sensitivity of Methanol Electrooxidation Pathways on Platinum:  An On-Line Electrochemical Mass Spectrometry Study. J. Phys. Chem. B 2006, 110, 10021–10031. [Google Scholar] [CrossRef] [PubMed]
  28. Herrero, E.; Fernández-Vega, A.; Feliu, J.M.; Aldaz, A. Poison formation reaction from formic acid and methanol on Pt(111) electrodes modified by irreversibly adsorbed Bi and As. J. Electroanal. Chem. 1993, 350, 73–88. [Google Scholar] [CrossRef]
  29. Grozovski, V.; Vidal-Iglesias, F.J.; Herrero, E.; Feliu, J.M. Adsorption of formate and its role as intermediate in formic acid oxidation on platinum electrodes. ChemPhysChem 2011, 12, 1641–1644. [Google Scholar] [CrossRef] [PubMed]
  30. Grozovski, V.; Climent, V.; Herrero, E.; Feliu, J.M. Intrinsic activity and poisoning rate for HCOOH oxidation on platinum stepped surfaces. Phys. Chem. Chem. Phys. 2010, 12, 8822. [Google Scholar] [CrossRef] [PubMed]
  31. Perales-Rondón, J.V.; Herrero, E.; Feliu, J.M. Effects of the anion adsorption and pH on the formic acid oxidation reaction on Pt(111) electrodes. Electrochim. Acta 2014, 140, 511–517. [Google Scholar] [CrossRef] [Green Version]
  32. Batista, E.A.; Malpass, G.R.P.; Motheo, A.J.; Iwasita, T. New mechanistic aspects of methanol oxidation. J. Electroanal. Chem. 2004, 571, 273–282. [Google Scholar] [CrossRef]
  33. Abd-El-Latif, A.A.; Baltruschat, H. Formation of methylformate during methanol oxidation revisited: The mechanism. J. Electroanal. Chem. 2011, 662, 204–212. [Google Scholar] [CrossRef]
  34. Mostafa, E.; Abd-El-Latif, A.E.A.A.; Baltruschat, H. Electrocatalytic oxidation and adsorption rate of methanol at Pt stepped single-crystal electrodes and effect of Ru step decoration: A DEMS study. ChemPhysChem 2014, 15, 2029–2043. [Google Scholar] [CrossRef] [PubMed]
  35. Ferre-Vilaplana, A.; Perales-Rondón, J.V.V.; Buso-Rogero, C.; Feliu, J.M.M.; Herrero, E. Formic acid oxidation on platinum electrodes: A detailed mechanism supported by experiments and calculations on well-defined surfaces. J. Mater. Chem. A 2017, 5, 21773–21784. [Google Scholar] [CrossRef]
  36. Ferre-Vilaplana, A.; Perales-Rondón, J.V.; Feliu, J.M.J.M.; Herrero, E.; Perales-Rondón, J.V.; Feliu, J.M.J.M.; Herrero, E. Understanding the effect of the adatoms in the formic acid oxidation mechanism on Pt(111) electrodes. ACS Catal. 2015, 5, 645–654. [Google Scholar] [CrossRef]
  37. Bergelin, M.; Herrero, E.; Feliu, J.M.M.; Wasberg, M. Oxidation of CO adlayers on Pt(111) at low potentials: An impinging jet study in H2SO4 electrolyte with mathematical modeling of the current transients. J. Electroanal. Chem. 1999, 467, 74–84. [Google Scholar] [CrossRef]
  38. Lebedeva, N.P.; Rodes, A.; Feliu, J.M.; Koper, M.T.M.; van Santen, R.A. Role of crystalline defects in electrocatalysis: CO adsorption and oxidation on stepped platinum electrodes as studied by in situ infrared spectroscopy. J. Phys. Chem. B 2002, 106, 9863–9872. [Google Scholar] [CrossRef]
  39. Rizo, R.; Sitta, E.; Herrero, E.; Climent, V.; Feliu, J.M.J.M. Towards the understanding of the interfacial pH scale at Pt(111) electrodes. Electrochim. Acta 2015, 162, 138–145. [Google Scholar] [CrossRef]
  40. Vidal-Iglesias, F.J.; Arán-Ais, R.M.; Solla-Gullón, J.; Herrero, E.; Feliu, J.M. Electrochemical characterization of shape-controlled Pt nanoparticles in different supporting electrolytes. ACS Catal. 2012, 2, 901–910. [Google Scholar] [CrossRef]
  41. Briega-Martos, V.; Herrero, E.; Feliu, J.M.J.M. Effect of pH and Water Structure on the Oxygen Reduction Reaction on platinum electrodes. Electrochim. Acta 2017, 241, 497–509. [Google Scholar] [CrossRef]
  42. Gamboa-Aldeco, M.E.; Herrero, E.; Zelenay, P.S.; Wieckowski, A. Adsorption of bisulfate anion on a Pt(100) electrode: A comparison with Pt(111) and Pt(poly). J. Electroanal. Chem. 1993, 348, 451–457. [Google Scholar] [CrossRef]
  43. Climent, V.; Gómez, R.; Orts, J.M.; Feliu, J.M. Thermodynamic analysis of the temperature dependence of OH adsorption on Pt(111) and Pt(100) electrodes in acidic media in the absence of specific anion adsorption. J. Phys. Chem. B 2006, 110, 11344–11351. [Google Scholar] [CrossRef]
  44. Souza-Garcia, J.; Climent, V.; Feliu, J.M. Voltammetric characterization of stepped platinum single crystal surfaces vicinal to the (110) pole. Electrochem. Commun. 2009, 11, 1515–1518. [Google Scholar] [CrossRef]
  45. Gómez, R.; Orts, J.M.; Alvarez-Ruiz, B.; Feliu, J.M. Effect of temperature on hydrogen adsorption on Pt(111), Pt(110), and Pt(100) electrodes in 0.1 M HClO4. J. Phys. Chem. B 2004, 108, 228–238. [Google Scholar] [CrossRef]
  46. Herrero, E.; Feliu, J.M.; Aldaz, A. Poison formation reaction from formic acid on Pt(100) electrodes modified by irreversibly adsorbed bismuth and antimony. J. Electroanal. Chem. 1994, 368, 101–108. [Google Scholar] [CrossRef]
  47. Arán-Ais, R.M.; Figueiredo, M.C.; Vidal-Iglesias, F.J.; Climent, V.; Herrero, E.; Feliu, J.M. On the behavior of the Pt(1 0 0) and vicinal surfaces in alkaline media. Electrochim. Acta 2011, 58, 184–192. [Google Scholar] [CrossRef]
Figure 1. Voltammetric profiles of the Pt(111) electrode in (A) 0.1 M HClO4 + 10−2 M MeOH and (B) 0.1 M HClO4 + 10−4 M MeOH. The red trace shows the profile in absence of MeOH. (C) Subtraction of the profiles in panel B. Scan rate: 50 mV s−1.
Surfaces 02 00014 g001
Figure 2. Double logarithm plot for the current density measured at 0.65 and 0.70 V in 0.1 M HClO4 vs. MeOH concentration.
Surfaces 02 00014 g002
Figure 3. Voltammetric profiles of the Pt(111) electrode in pH = 3 (left column) and pH = 5 (right column) with different concentrations of MeOH. The red trace shows the profile in absence of MeOH. Scan rate: 50 mV s−1.
Surfaces 02 00014 g003
Figure 4. Dependence of the voltammetric profile of the Pt(111) with pH (A) in absence of methanol vs. RHE, (B) in 10−2 M MeOH vs. RHE and (C) in 10−2 M MeOH vs. SHE. For methanol oxidation, only the positive scan direction is shown. Scan rate 50 mV s−1.
Surfaces 02 00014 g004
Figure 5. Current density for the oxidation of methanol at 0.5 V vs. SHE as a function of the solution pH.
Surfaces 02 00014 g005
Figure 6. Voltammetric profiles of the Pt(100) electrode in 0.1 M HClO4 with different MeOH concentrations. Inset: magnification of the positive scan direction in the region between o and 0.6 V
Surfaces 02 00014 g006
Figure 7. First and second voltammetric scan for the Pt(100) electrode in 0.1 M HClO4 + 10−3 M MeOH. The blue trace shows the profile in absence of MeOH. Scan rate: 50 mV s−1.
Surfaces 02 00014 g007
Figure 8. Voltammetric profiles of the Pt(100) electrode in pH = 3 (left column) and pH = 5 (right column) with different concentrations of MeOH. The red trace shows the profile in absence of MeOH. Scan rate: 50 mV s−1.
Surfaces 02 00014 g008
Figure 9. Voltammetric profiles of the Pt(110) electrode in (A) 0.1 M HClO4 + 10−4 M MeOH and (B) 0.1 M HClO4 + 10−4 M MeOH. The red trace shows the profile in absence of MeOH. Scan rate: 50 mV s−1.
Surfaces 02 00014 g009

