Article

Re-Thinking Visitor Experience with Ancient Manuscripts via the Holographic Showcase: The Case of the Codex4D Project and Its First Public Results from a Mixed-Method Evaluation In Situ

CNR Institute of Heritage Science, Via Salaria km 29, 300 Monterotondo St., 00015 Rome, Italy
*
Author to whom correspondence should be addressed.
Heritage 2023, 6(9), 6035-6065; https://doi.org/10.3390/heritage6090318
Submission received: 25 May 2023 / Revised: 6 August 2023 / Accepted: 10 August 2023 / Published: 25 August 2023
(This article belongs to the Section Museum and Heritage)

Abstract

:
Ancient manuscripts are precious and fragile objects, preserved in libraries, museums, and archives. Some of them are masterpieces, made with several materials and insights, but generally they are not accessible to wide communities of users. The purpose of this study is to present the preliminary results of the Codex4D project: a holographic showcase, conceived for museums, presenting the first 4D model of an ancient manuscript to the public at the Science Festival in Genoa in 2022. The manuscript, preserved in the Angelica Library in Rome, has been represented in a multidimensional digital model, documenting both its visible and invisible aspects, on the surface and in the stratigraphic layers. We analysed the visitor experience: informal learning, the meaning-making process, interactions between visitors, and gesture-based interaction with the showcase. The methodology used for evaluation is based on four different qualitative methods (grounded theory, narrative inquiry, case study, and digital ethnography). We collected notes from observation, narratives from interviews, and answers from structured interviews. The main findings are patterns of the visitors’ experiences with a digital interactive 4D model of an ancient manuscript, supported by storytelling, and a list of design issues and possible improvements for the next version of the Codex4D holographic showcase.

1. Introduction

1.1. Aims of the Codex4D Project

In 2021, the project “Codex4D: four-dimensional journey to the centre of the manuscript” was started by the Institute of Heritage Science at CNR and the Department of Industrial Engineering at the University of Rome, Tor Vergata, thanks to funding from the Lazio Region. The project is concerned with the definition and testing of a methodological pipeline for the digital documentation and 3D exploration of information about visible content and elements that are no longer visible or hidden in the structure of ancient codices.
The aim is to document elements that enhance the knowledge of a manuscript, e.g., text parts buried in the binding and stratigraphies of the illuminations, as well as characterisations of the chemical–physical–biological nature of the materials, using a 3D model to which the fourth dimension of depth has been added.
We wanted to increase the documentation and knowledge of important ancient manuscripts, considered to be complex artefacts, made of different materials and preserved at the Angelica and Casanatense Libraries in Rome.
The approach is innovative, aimed at creating a multidisciplinary experience of the manuscript inside virtual and mixed reality environments, taking into consideration tangible and intangible values:
  • Form and structure;
  • Content and meaning;
  • Materials, execution techniques, and state of preservation.
All these typologies of content are integrated into a unique virtual multidimensional model. Superficial information is associated with the visible spectrum of light, RGB (the additive model of colours red, green, and blue), captured via standard photo cameras. RGB images were also used to produce a photogrammetric model of the object, via structures from motion techniques [1]. The invisible content associated with the sub-superficial layers was acquired via a thermal camera, and consisted of images in the medium infrared range [2]. These latter were able to provide information hidden at increasing levels of stratigraphic depth under the final pictorial layer, such as gilding preparation, preparatory drawings, repentance, censorships, and fragments of text buried under bindings.
In addition to the investigation based on “imaging” techniques, microbiological, punctual chemical, and physical analyses were conducted on individual points or small areas of the manuscript and its illuminations to understand the nature of the pigments, inks, and binders; preparations; their level of degradation; the presence of pathogens in the present or in the past through the identification of traces of genetic materials; and the general state of health of the artefact.
The interpretation of so much information can reconstruct the complex story of the artefact, including the significance of written and pictorial content, craftsmanship, conservation history, and cultural relations.
The relevant information has been mapped as “annotations” on the virtual multidimensional model, and as informative/semantic spots.
Definitively, in the Codex4D project we have designed and tested a new model of representation, visualisation, and narration of the cultural artefact via interactive applications that are the result of the interconnection between the humanities and diagnostic sciences. The aim is to converge multi-level information on an integrated model of knowledge and valorisation. This activity involves the development of:
  • Digitisation techniques;
  • Some 3D and 2D representation techniques;
  • Multi-level texturing;
  • The integration and contextualisation of cross-sectoral information into a 3D model;
  • Visualisation techniques;
  • The implementation of interaction and analysis tools;
  • The conception of narration techniques;
  • Protocols for evaluating the usefulness, impact, credibility and effectiveness of the experience from a cognitive point of view;
  • Models of social interaction with digital manuscripts.
In this paper, we present one of the results of the project: the Codex4D holographic showcase, conceived for museums and libraries, where the aforementioned elements are implemented following a narrative and moving style. The aim of this particular installation is to bring the attention of the general public to ancient manuscripts, as they are often inaccessible or difficult to understand despite their preciousness. In particular, the conception, the design, and the impact on the public of the holographic showcase will be discussed. In fact, its usability, its educational potential, and the behaviours elicited by the holographic showcase were measured and evaluated on the occasion of a public exhibition in Genoa in 2022, using different qualitative methods. The methodology of this evaluation and its results will be reported in detail.

1.2. Structure of the Paper

This paper is organized into five sections. Section 1, the introduction, presents the general context in which the Codex4D holographic showcase was conceived and developed, and the aims and the research activities carried out within the project. A brief discussion on the Italian and the international state of the art concerning manuscript projects is introduced, to contextualise this contribution and highlight the added value and the new research scenarios offered by the project.
The holographic showcase is also presented, as a mixed reality environment and a new communication format particularly suitable for museums. Finally, the holographic showcase specifically designed for the Codex4D project is described in detail, considering the exhibition context, media, languages, styles, interaction modes, and expected user experience.
Section 2 describes the materials, methods, and data used to evaluate the user experience. We summarise the methodology, based on grounded theory, ethnography, case study, and narrative inquiry. This section includes descriptions of the method, research questions, data collection, and analysis.
Section 3 presents the results of this pilot study about visitors’ experiences with a digital manuscript in 4D, and the overall impact of the holographic showcase. They are structured into research questions Q1, Q2, and Q3.
Section 4 is divided into two parts: a theoretical comparison between our results and results from other studies, and a description of possible future developments of the user experience research on holographic showcases dedicated to digital manuscripts in 4D. Section 5 summarises the conclusions.

1.3. The Codex4D Project in the International Scenario Related to Manuscripts

At the beginning of the project, a benchmark of the existing initiatives and studies regarding manuscripts (websites, applications, catalogues, scientific papers) was investigated, in order to contextualise our work in the Italian and international research landscape, and to understand which issues, still uncovered, we could have solved. What emerged from this benchmark can be summarised as follows:
  • The dialogue between diagnostic scientists and art historians/codicologists/palaeographers is still poor [3], apart from a few cases like the “Miniare” project from the Fitzwilliam Museum at Cambridge [4,5], aiming at creating a bridge between art history and diagnostics, despite the manuscript being documented and represented in 2D;
  • By far the most prevalent kind of digitisation is 2D, and it is dedicated to content (text, sheets, illuminations), sometimes accompanied by educational videos on the manuscript production phases (Bibliothèque National De France [6], British Library [7], Paul Getty Museum [8], Metropolitan Museum of Art [9], Bodleian Libraries, Oxford) [10];
  • There is a general lack of information on diagnostics/preservation/restoration status, with the exception of the aforementioned “Miniare” project;
  • In some cases, the semantic mapping of page content was applied (Codex Atlanticus, Biblioteca Ambrosiana) [11];
  • The concept of “annotations’’ is introduced, but on 2D digitisations (Utrecht Psalter website realised by the Utrecht University Library) [12]; at least one case of annotations contextualised on a 3D model exists: the virtual reality experience of a 15th Century illuminated Book of Hours [13], realized by the University of Southern California Dornsife in collaboration with the USC’s Archaeology Research Center, the School of Cinematic Arts, and Special Collections. Using digital photography and 3D modelling, a virtual model was created to be experienced within a VR environment, using a head-mounted display and haptic interfaces. Before this American project, PERCRO, at Scuola Sant’Anna in Pisa, realized the MUBIL project, with the NTNU University Library of Trondheim [14]: books were enriched with 3D objects, additional explanatory content such as pictures, drawings, videos, audio, and texts in Norwegian and English [15];
  • The standardisation of open and interoperable formats has been sometimes adopted (Vatican Library in collaboration with Stanford University Libraries) [16];
  • There is a general absence of 4D representations of manuscripts (surface, structure, and stratigraphy) with related information;
  • The communication of manuscripts to museum visitors is very difficult, due to their scant accessibility and intelligibility (low light, obsolete language, static pose); in a few cases, museums include a 2D digital gallery of the pages that can be browsed;
  • The introduction of online Italian catalogues (MANUS [17], OPAC [18]) and digital platforms in libraries serve to (a) facilitate book searches, (b) allow access to content in its digital version, and (c) support interaction with content (highlighting or annotation).
Ultimately, the manuscript is not valued as a complex object whose materials are transmitters of meaning and stories.
Therefore, the study of illuminated manuscripts requires a new interdisciplinary approach, as several scholars have evidenced [19].
The final purpose of the Codex4D project is to create (1) new approaches in the scientific visualisation of ancient manuscripts inside VR environments in the web (Codex4D Web App), mostly oriented towards an expert audience, and (2) new storytelling and interaction metaphors in museums via the holographic showcase, to promote greater curiosity and awareness of ancient manuscripts.
The project will be concluded at the end of 2023; however, the methodological approach has been clearly defined and relevant outcomes for different stakeholders and communities are already available.

1.4. Case Study

After some preliminary tests at the Casanatense Library to fix the general methodology, the project was developed on three main case studies at the Angelica Library in Rome:
(1)
Ms 1474, De Balneis Puteolanis [20], a poem by Pietro da Eboli, dated 1258/1266, of which three poses were acquired in 4D (cc.9v-10r, cc.12v-13r, cc.19v-20r);
(2)
Ms 1102, Divina Commedia by Dante Alighieri [21], dated 1351/1400, of which two poses were acquired in 4D (cc.4v-5r, cc.56v-57r);
(3)
Ms 459, Libro d’Ore [22], a prayer book for secular use, dated at the beginning of the XV century AD, of which three poses were acquired in 4D (closed book, cc.21v-22r, cc.67v-68r).
All of them are very precious manuscripts, in parchment and with illuminations and gliding.
This paper deals with the case study represented by the holographic showcase that was developed during the second year of the Codex4D project, related to the first manuscript, De Balneis Puteolanis, presented for the first time at the Science Festival in Genoa, in Autumn 2022 (Figure 1). More specifically, it discusses the results of the user experience evaluation.
De Balneis Puteolanis, Ms 1474, is a poem in Latin, composed by Pietro da Eboli [23], a poet at the Norman and then Swabian court, celebrating the therapeutic properties of the Pozzuoli baths in the Campania region. De Balneis Puteolanis obtained considerable success between the 13th and 15th centuries in southern Italy. The dating of Pietro da Eboli’s work is controversial. The original was lost and many copies were made over time, but this is the oldest known, possibly commissioned by Frederick II’s son, Manfred, to honour his father. In fact, according to the almost unanimous opinion of critics, the copy preserved at the Angelica Library is said to have been composed between 1258 and 1266 and dedicated to Frederick II of Swabia. It is made of parchment, and is beautifully illuminated; each composition celebrating the virtues of the baths is followed by a full-page illumination. The illustrated narrative does not merely transpose the text into figures, but enriches it with narrative, realistic, and descriptive details. The alteration of the original quire sequence of the manuscript and the loss of sheets leads in some cases to an incongruence between text and image, compromising the complementarity of the two facing pages [24].
The holographic showcase dedicated to this manuscript was presented in the context of the exhibition “The Heritage Sciences Languages: from Macro to Micro”, organised by the Institute of Heritage Science of the National Research Council (ISPC-CNR), which was held at the outbuilding of “Villa del Principe”, a Renaissance palace, from the 20th of October to the 1st of November 2022, in the wider context of the Science Festival that takes place every year in Genoa, Italy.
This exhibition occupied two adjacent spaces (Figure 2):
(1)
A large room (“Sala degli Argenti”) hosting the contents of five macro-areas related to ISPC research, projects, and instruments used to digitize and investigate cultural heritage, from aerial to ground scale, up to microscopic vision throughout the invisible elements of the material;
(2)
A small room where two multimedia installations let the public experience two projects more extensively. The first one was dedicated to E-RIHS, the European Research Infrastructure for Heritage Science [25], and specifically to the mobile and fixed laboratories, archives, and competences that CNR IPSC makes available to the international scientific community and museums; the second installation was dedicated to Codex4D. Thanks to the most advanced techniques and the holographic showcase, the manuscript became an “alive” and speaking object, engaging the public not only through its contents and meanings, but also through its materials, parchment, inks, and pigments.
The Codex4D exhibit included:
(a)
An introductory movie 1.5 min long, visible in loop on a 40” television, regarding the general purposes, methodologies, and activities of the Codex4D project;
(b)
A written panel introducing the project and contextualising it in the conceptual framework of the whole exhibition;
(c)
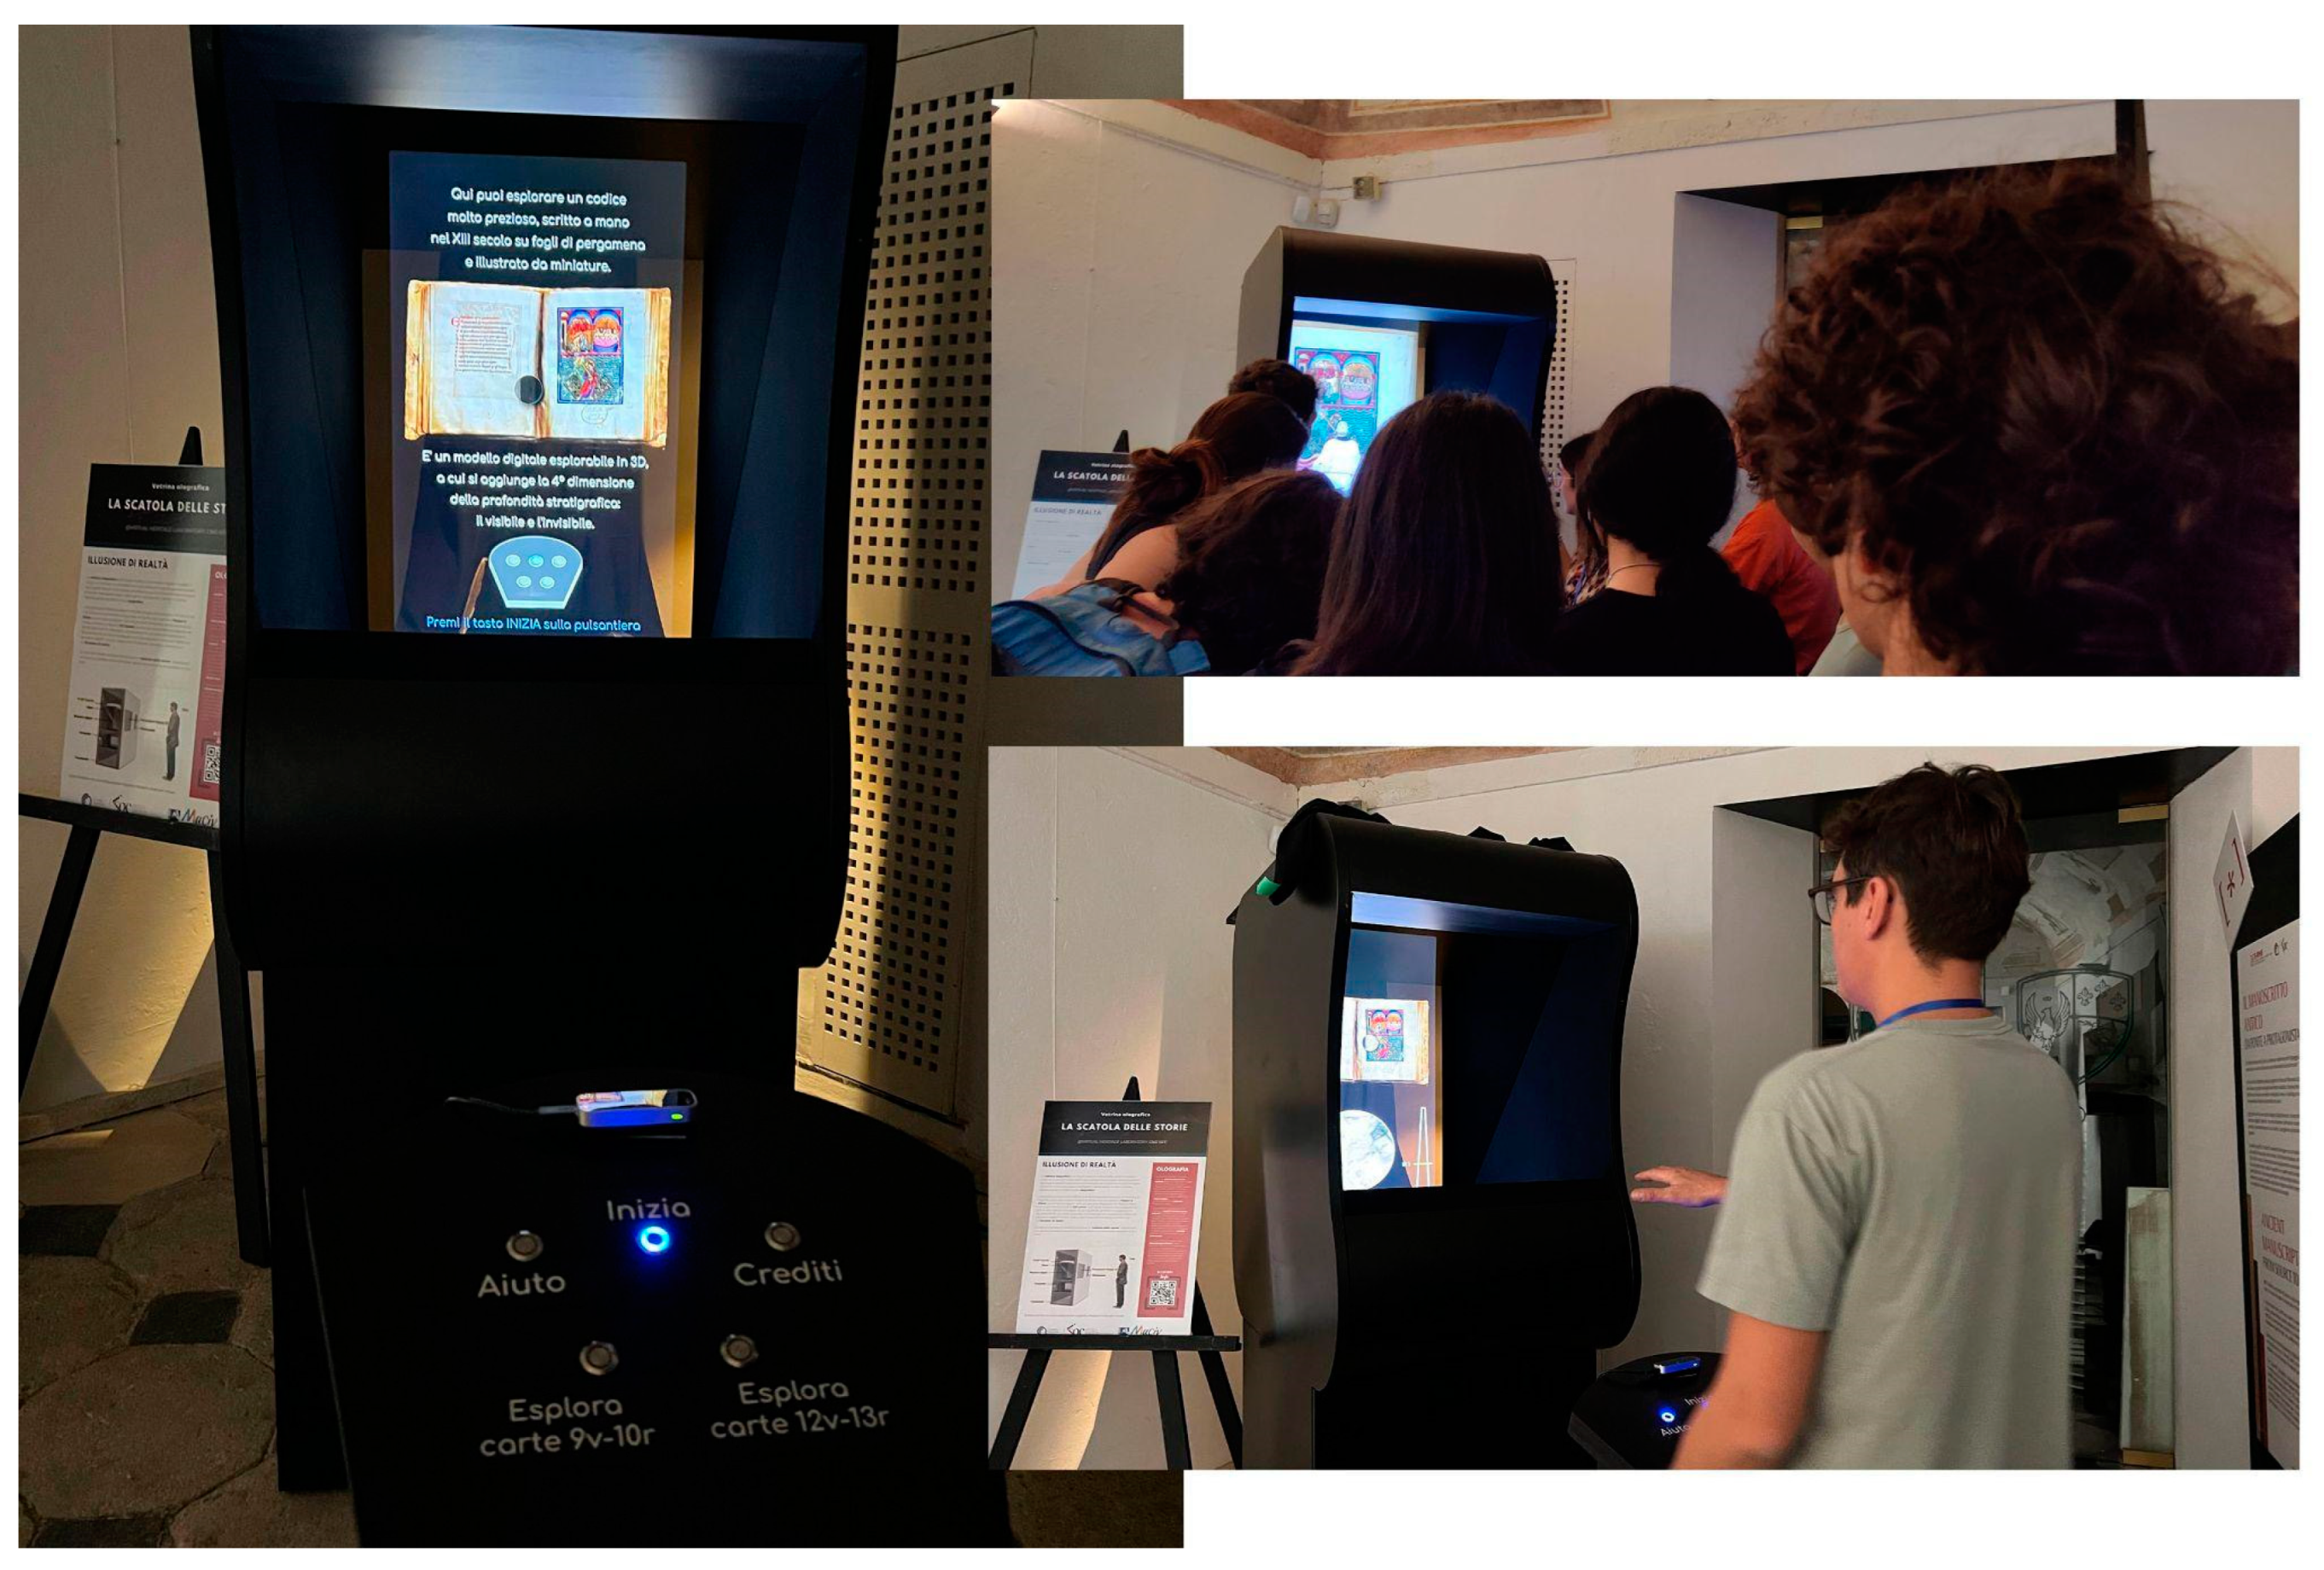
The holographic showcase that was the main core of the experience;
(d)
A smaller panel explaining what a holographic showcase is, its origins and potentialities in museums, and finally the scientific competences required for its implementation.
Most of the public entered the exhibition from the main entrance that led into the larger room, so the holographic showcase was the last installation of the visit.
However, a parallel gallery extended outside, along the longitudinal axis of the two rooms; this gallery led directly to the small room, offering the possibility of dividing the public into two flows, approaching the exhibition from opposite directions. Therefore, the Codex4D holographic showcase could be experienced at the beginning of the visit instead of at the end. The gallery offered an easy exit to the Renaissance garden, as well, where the public and exhibitors could take a rest.

1.5. The Holographic Showcase: Design of the Installation and Components

The holographic showcase is a mixed reality environment designed for museums, and it was created in 2016 by the CNR ISPC team and has been experimented with since then, in the context of the traveling exhibition of the CEMEC—Connecting European Early Medieval Collections—European project [26]. It was conceived as a small theatre, provided with lights, scenography, buttons, sensors, and software to manage multimedia events and interaction.
The holographic effect on which our showcase is based is called a Pepper’s Ghost projection [27]. It is derived from a theatrical technique that creates an optical illusion of reality for the audience (Figure 3) by means of a semi-transparent and semi-reflective surface placed between the audience and the stage. The actor/object is placed in a position invisible to the audience, usually a room below the stage, but he/she/it is reflected on the semi-reflective surface so that his/her/its image appears on the stage together with the real playing actors. It is a mixed reality environment, born in the XIX century. In our case, the theatrical mechanism is replicated with some differences, first of all the reduced size. The actor is replaced by an image projected by a screen.
The components of the holographic showcase are a monitor or a projector; a semi-reflective and semi-transparent inclined surface with an angle of 45°; a background scenography; and the entire hardware apparatus, consisting of a PC, sensors, an open-source electronic prototyping platform called Arduino Genuino, and light spots.
The software was written specifically for the installation. Thanks to real-time rendering techniques, special perspective studies, and the production of ad hoc videos, it was possible not only to simulate an object floating in the air, but also to create a visual interaction between the hologram and the reality.
The purpose of the holographic showcase is thus to evoke the sensory and narrative dimension of the museum object preserved inside [28] (Figure 4).
The hologram is an illusion of reality and thus the contents are mostly 3D; they seem to float in the empty space. The real and the digital co-exist in the same showcase. During the CEMEC project, we experienced this installation in many European museums with different audiences, collecting several hundreds of pieces of data about its usability and the visitors’ reactions [29].
The extremely positive results of these experiences led us to re-use and adapt the same format for manuscripts. Unfortunately, in this case it was not possible to include the original object in the showcase, due to the fragility of its materials. However, a physical scenography was created, to keep the effect of mixed reality. On the other hand, the Codex4D holographic showcase has implemented for the first time a 4D model, never seen before.
The holographic showcase can be adapted, in terms of dimensions and configuration, according to the needs of each specific exhibition (number and dimension of objects hosted inside the showcase), so its design is very flexible. On the occasion of the exhibition in Genoa, its measures were 2.10 m in height, 1 m in width, and 1.5 m in depth. The back was open on the scenography that, in this case, was outside the showcase stage.
The scenography was composed of an inkpot, a printed replica of a medieval candle holder, a paper sheet, a quill pen, a silver sphere (symbolising the technology), and a black curtain (Figure 5). The visualisation frame was vertical, with a ratio of 9:16. The image resolution, in pixels, was 1080 × 1920.
A totem was positioned in front of the showcase, 1 m away, and the user would stand in front of it. The totem has some buttons, useful for starting the experience by selecting a movie. A motion capture sensor allows the user to interact with the 4D models (see video demo [30]). The Leap Motion sensor [31] was used to track the hand movements. The buttons on the totem were equipped with two-colour LEDs programmed to give directions and visual feedback during the experience.
The software to manage the audiovisual streams and the interaction was developed with Vvvv [32], a visual programming platform known especially in the field of digital art.

1.6. User Experience Design, Content, Media, and Style of the Codex4D Holographic Showcase

1.6.1. Starting the Experience

The experience with the holographic showcase engages the user through an alternation of passive and active phases. Passive phases consist of the enjoyment of pre-rendered narrative movies regarding the manuscript; active phases require the user to interact using his/her hand, in order to explore content.
At the beginning of the experience, a standby animation invites the user to use the totem in front of him/her and push a button to start a piece of narrative content or to select a pose. A pose is a static configuration of the manuscript open on a specific page. The virtual manuscript, in fact, cannot be browsed page by page, in animation, because the 3D model is the result of a photogrammetric acquisition and it would have been very difficult (and costly) to enliven all the pages. For this reason, the user is required to select a preferred pose from a menu.
The user can also press the ‘help’ button to visualise some instructions useful to start the experience (Figure 6).

1.6.2. Narrative Style

The narrative movies adopt a theatrical style. As the holographic showcase is conceived as a little theatre, a purely descriptive and didactic approach would not have been appropriate. A small character, interpreted by an actress shot on a green screen, lives in the manuscript; she knows places and people painted in the illuminations (Figure 7).
She has become part of that wonderful world, she is as little as the other illuminated figures and she performs actions, moving and immersing in the thermal waters with the other bathers and using a magnifying lens to explore every surface and sub-surface detail. She can tell stories about her experience, about the meanings of the poem and of its figures, and she encourages the visitor to explore under the surface, to discover an immense and multidimensional world. While the female character is three-dimensional, since the actress is real and she was shot on a virtual set, the graphic style of the virtual animations is 2.5D. In the author wanted to create a stylistic connection between the bi-dimensionality of the manuscript sheets and the tri-dimensionality of the holographic showcase. For instance, the character is not allowed to walk autonomously along the depth axis, detaching herself from the world to which she belongs; to come closer to the user, in foreground, she needs to use a means of transport, such as boarding on a floating sheet, or entering and paddling inside a basin (Figure 8). Some examples can be found in the introductory movie to De Balneis Puteolanis [33].
In the holographic showcase, we play with the research data, using an emotional and poetic language and leading scientific communication towards new experiential scenarios and styles. In doing so, we hope to arouse in visitors a sense of surprise and curiosity about the manuscript, involving them in an engaging experience.
Each movie lasts about 1.5–2 min. In the first version of the holographic showcase presented in Genoa, the movies following this style were:
  • The general introduction to De Balneis Puteolanis;
  • Introduction to sheets 9v-10r;
  • Introduction to sheets 12v-13r.

1.6.3. Exploring the Contents: Gesture-Based Interaction
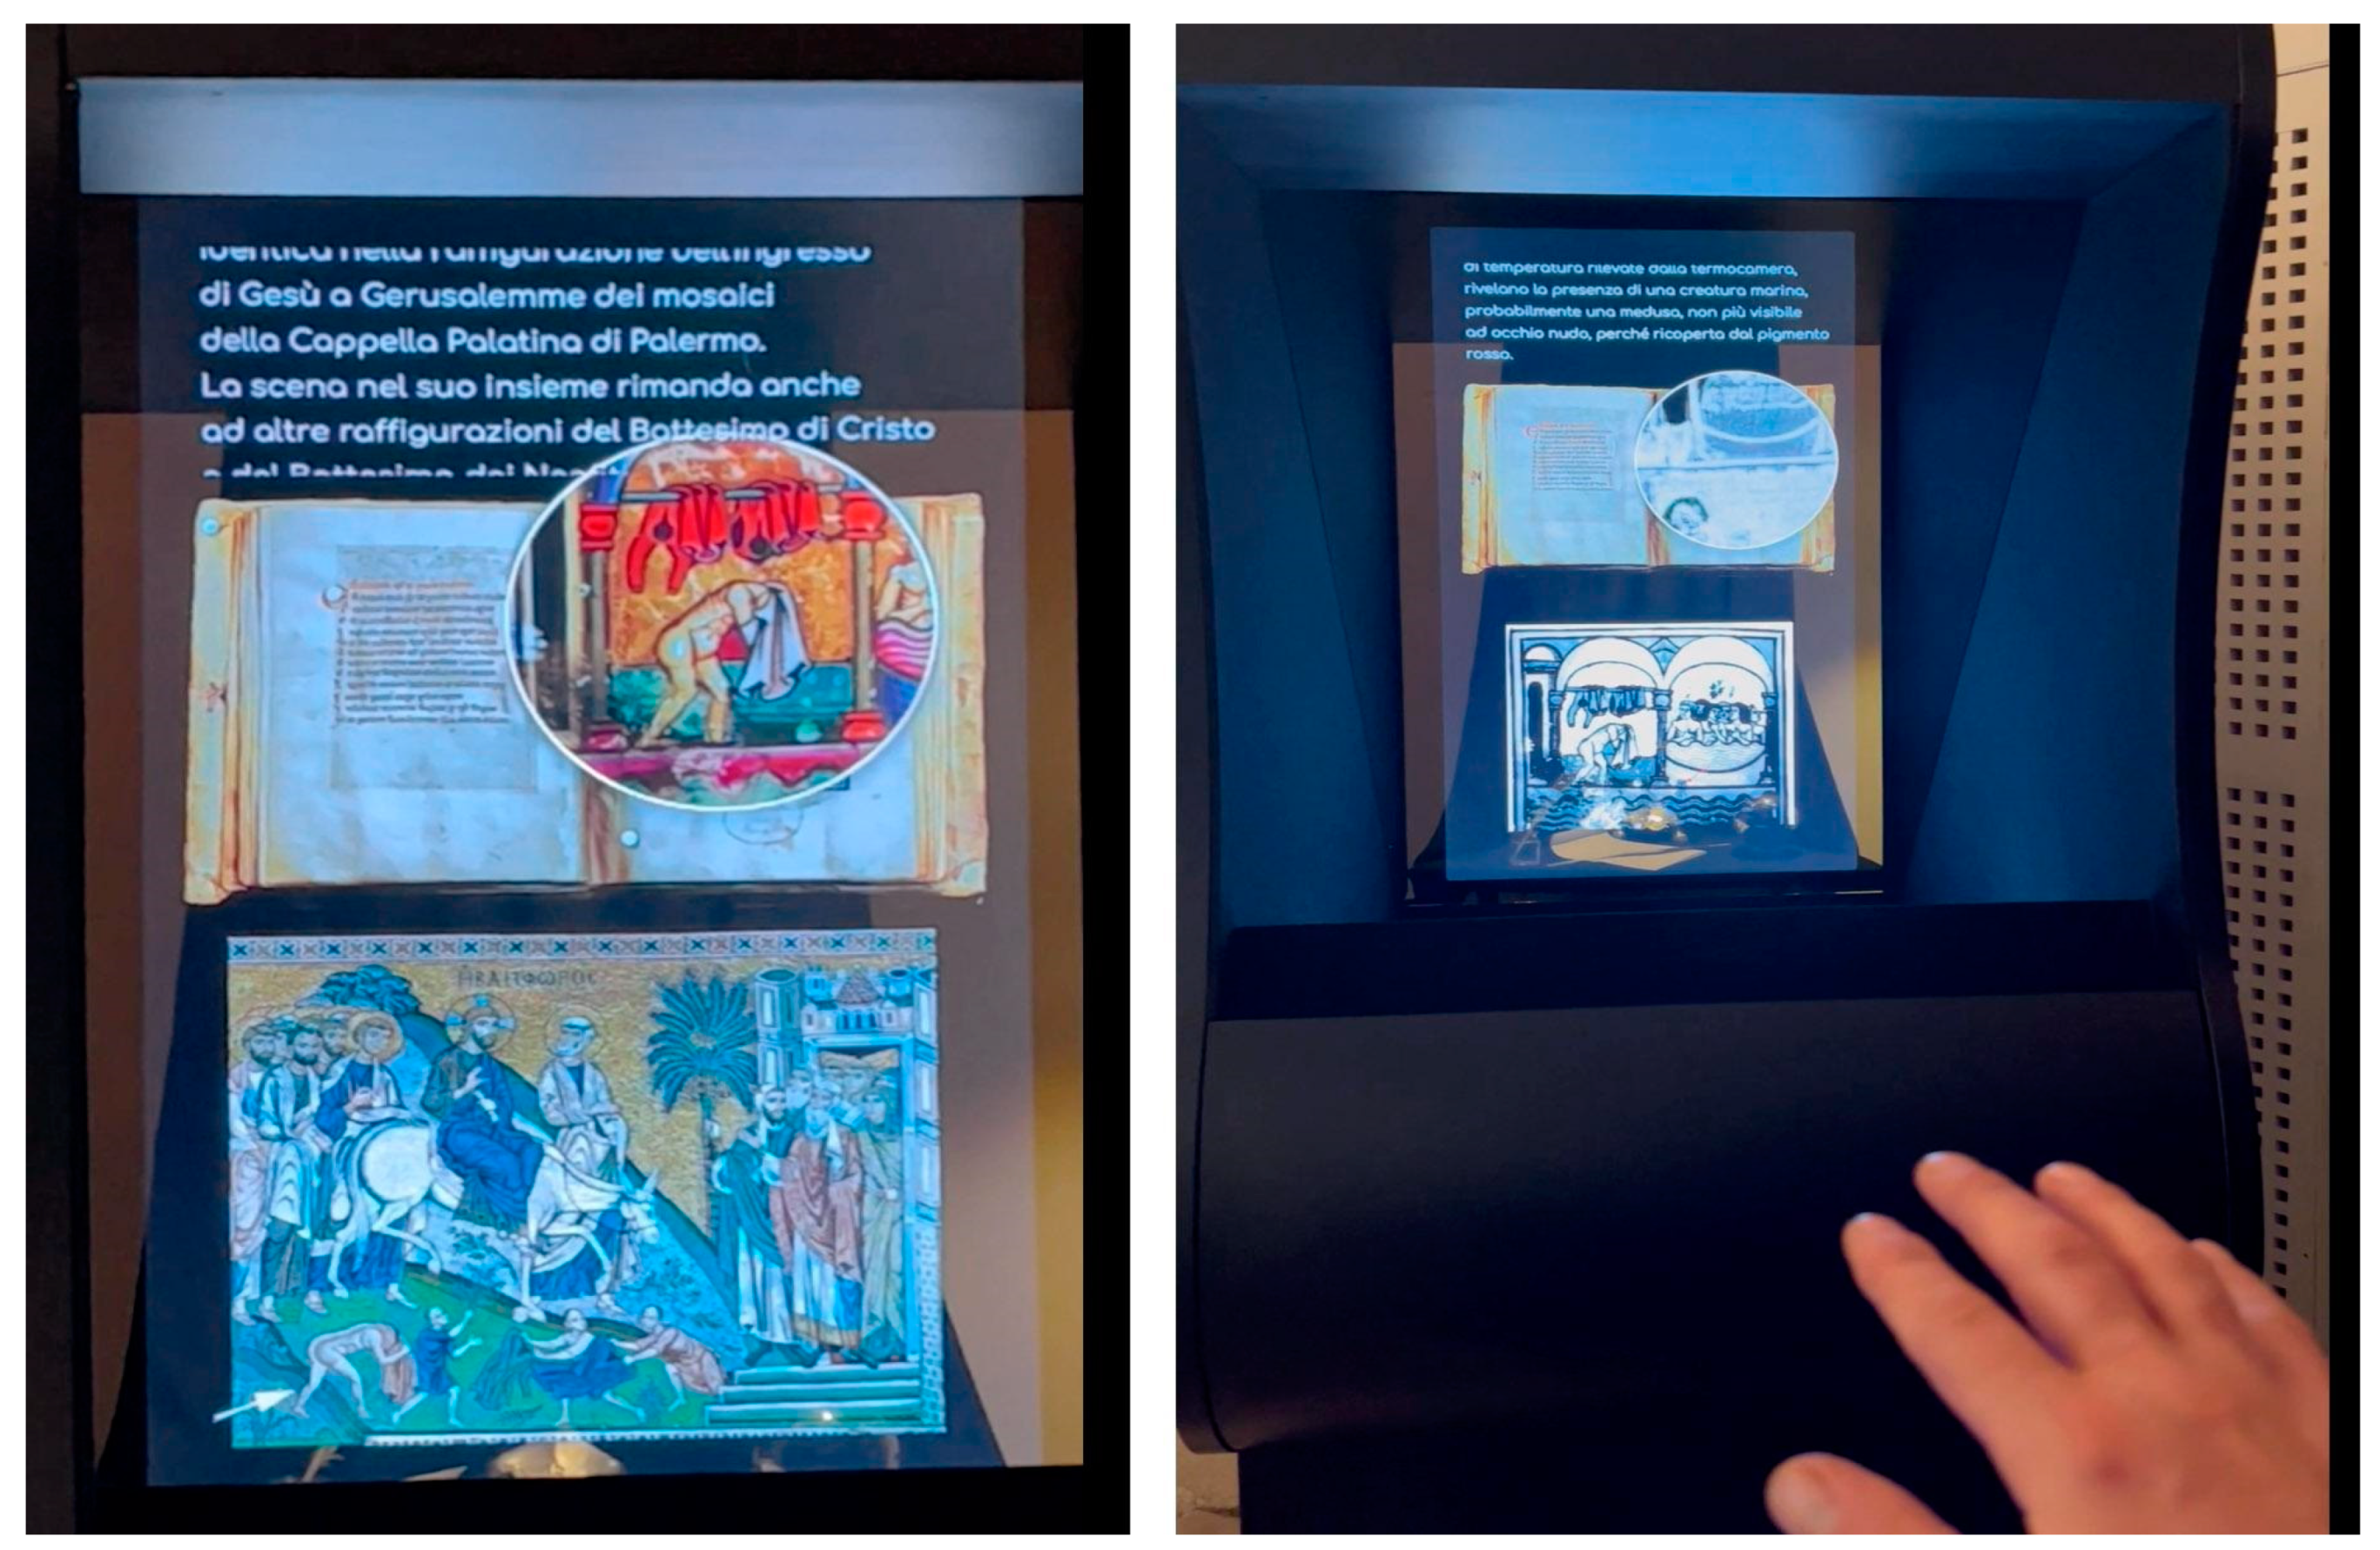
After the storytelling, the user is invited to interact more actively with the contents of the sheets, exploring the details and the annotations that are shown on the 4D model.
The interaction interface allows the user to select content directly using the movements of his/her hand (either the right or the left one); no devices are required, such as a mouse, joystick, or others. Hand movements are tracked by the Leap Motion sensor [31] and work as inputs of digital events in the virtual scene. For instance, by moving the hand in the air, horizontally and vertically, along the X and Y axes of the interactive space above the motion capture sensor, it is possible to explore the manuscript using a magnifying lens to observe every detail. Instead, moving the hand along the Z axis of the depth, it is possible to explore the 3D model in its stratigraphy, starting from the RGB surface through three progressive sub-surface IR layers.
Using the hand in the same way, it is possible to select annotations, as the video demo shows [30].
According to the author, this kind of natural interaction strengthens the sense of magic evoked by the hologram, and therefore the visitors’ engagement.

1.6.4. Annotations

Annotations correspond to very specific information points on the model and they are contextualised and visualised on the RGB or IR layers by means of small spheres, which can be selected by the user moving his/her hand on each of them and staying still for two seconds. Annotations can be related to the comprehension of written texts or iconographies, to symbolic meanings, translations, structure, materials, the state of preservation, and restorations. Thus, several disciplines are part of the same information system, such as art history, literature, biology, chemistry, and physics.
Information provided by each annotation includes (Figure 9):
  • A title in the upper part of the frame, consisting of the research question to which the following content tries to give an answer (for instance “is the sequence of the quires the original one?”);
  • A short written text (about 70–80 words) following the title and occupying the upper part of the frame, scrolling automatically inside a mask (so that the text is not visualised all together and does not seem too long to read);
  • An image, a drawing, a map, or a diagram in the lower part of the frame, pertinent to the content of the annotation (for instance an iconographic comparison, the result of an analysis, the distribution map of an element);
  • Two or three keywords related to the content of the annotation, written with a bigger and pulsing font; they appear only if no images are present in the annotation, in the lower part of the frame.
We established a predefined duration of the annotation scrolling, approximately 30 s; the user cannot stop or close it before the time has expired. At the end of the animation, the model becomes interactive again and another annotation can be selected. This restriction stemmed from the desire not to make the interaction too complex for the user, because it would have been necessary to introduce another hand gesture to close the annotation at will. Learning new gestures and performing them correctly is not always easy for users; we wanted the natural interaction to remain challenging but as simple as possible.
In any case, the user is never completely blocked: he/she can always push a button on the totem to skip the content and start a new one.
In cc.9v-10r, we implemented eight annotations; six of them were on the RGB layer and two on IR layers.
The same goes for cc.12v-13r; there were eight annotations, of which six were on the RGB layer and two on the IR layers.
The complete experience and viewing of all the content implemented in this version of the showcase takes approximately 30 min.
The showcase can be accessed by 3–4 people at a time, in a collective experience. One person at a time can lead the system, interacting with it; however, alternation among visitors is easy and immediate.
The system is designed in order to allow a simple change of role, for example from observer to driver, but we needed to carry out an evaluation to have some evidence about the quality of the user experience. This pilot study is described in the next paragraphs.

2. Materials, Data, and Methods for UX Evaluation

2.1. Analysing the Visitor Experience

2.1.1. Objectives and Research Questions

The presentation of the holographic showcase in Genoa is the first public result of the Codex4D project and the first opportunity to collect data about the visitors’ experience of the digital 4D manuscript in a mixed reality environment. For this reason, we decided to carry out a pilot study during the festival. The objectives of this study are to:
  • Understand the visitors’ informal learning patterns and meaning-making process;
  • Understand the interactions among visitors in situ;
  • Understand the interaction between the visitor and the interactive installation.
The three main research questions are:
  • Q1: What does the visitor remember after the experience and why did he/she visit the exhibition?
  • Q2: What does the visitor say and do during the experience, on his/her own or along with other visitors?
  • Q3. How can we improve the visitor experience?
    Q3.1: During the experience, is the visitor subject to any “pain points” [34] (term used in user experience research and usability to express difficulties during the interaction with the system)? If the visitor has any difficulties, how can we improve the experience?
    Q3.2: During and after the experience, what does the visitor like/dislike? If the visitor dislikes something, how can we improve the experience?
In previous projects carried out by CNR ISPC [26], the holographic showcase was used to present other artefacts, for example an ancient Avar sword or silver byzantine objects, but in 3D, without including the diagnostics imaging.
This is the first study regarding a showcase that allows visitors to explore a 4D model of a manuscript, discovering different layers of the digital artefact, in RGB and three levels of IR.

2.1.2. Methodology

A specific mixed method approach for interactive media in situ was used, based on a combination of grounded theory [35,36], digital ethnography [37], narrative inquiry [38], and case studies [39].
This combination, as a new methodology for visitor studies in situ, can be summed up as an ‘embodied constructivist GTM digital ethnography in situ’ [40]:
  • Embodied: the researcher is in the immersive environment with the visitors, without taking notes in front of them or recording a video or audio; the notes are written up immediately after each visitor observation session; and the researcher is focused on the observation;
  • Constructivist GTM: the researcher starts collecting observations and later triangulates the observations with the narratives from the same participants; the research process follows the constructivist GTM [35]; the researcher is aware of the potential bias in the interpretation of the experience; the researcher takes into account diversity (age, professions, gender, etc.) in his/her data collection and analysis; and applying the constructivist GTM [35] also means to perform different levels of “coding”;
  • Digital ethnography in situ: the researcher analyses a digital project in situ; this can be considered a subfield of digital ethnography [37], and the holographic showcase is not online but in situ, part of an exhibition in a historic house.
We compared this approach with other methods, tools, and results regarding digital installations in museums [41] and, more specifically, holographic showcases made by CNR ISPC [26,29]. We also integrated some of the tools available from the Interview Kit by Designers Italia and the last version of “Manual of Design” for public administrations in Italy [42,43].
As we described in the previous paragraphs, the system can be used by visitors playing different roles during a collaborative experience. For this reason, we applied the results from previous studies about visitor roles, exploring an interactive installation together [44].
Comparing all these previous studies, we designed a structured interview, a guide of ethnographic observation in the field, in order to answer Q3.1 and Q3.2. The categorization of visitors’ roles (driver, observer, navigator, helper, stopper, performer) has been integrated into the method, as part of the guide for observation in the field. We will provide a description of the roles in Section 3, “Results”.
We adopted the open interview method to answer Q1: we simply facilitated the visitor’s storytelling, applying the narrative inquiry [38] method, and asking what visitors remembered at the end of the visit, as we did in other previous studies about immersive environments and augmented reality [45].
According to embodied constructivist GTM digital ethnography in situ [40], the researcher in the field did not give any tasks to visitors. Specific tasks can be designed and used in museums [41]; however, in the context of a festival, based on data from previous events, we expected a very dense flow of visitors during the weekdays, already guided by staff and/or teachers. For these reasons, we chose to observe actors without any direct interaction with the visitors. When a direct interaction was required by the situation, the researcher took on the role of a helper, but without giving pre-designed tasks.
Data collection will be described in the next paragraph.

2.1.3. Data Collection

We took into consideration the context (the historic house hosting the exhibition, the exhibition design), the visitor path in the exhibition and the typology of event (an exhibition included in a very popular science festival in Italy), the main targets of the festival (school groups, families, researchers, professors, university students), the period (two weeks, including weekdays and holidays), and the post-pandemic rules in place for exhibitions and public events.
  • Context and visitor path: the holographic showcase was at the end or at the beginning of the visitor path in a smaller room, without windows, near another interactive multimedia installation, as we described in the previous paragraphs. A maximum of just 2 researchers/guides/customer services could be in the room, with a maximum of 10 visitors, with two chairs and no other seats for visitors. A glass door connected the room with the garden, which we identified as a possible space for interviews.
  • Event, period, target: we expected visitors to arrive in school groups during the week, for booked guided tours, while families, university students, professionals alone or in a couple, etc., were expected on holidays and at weekends. We expected the visitors to visit the exhibition as one of the events in the festival program and, for this reason, we expected that they had limited time for each installation.
Taking into consideration all these aspects, we collected the data in the following way:
  • Observation notes made in a notebook during the visit, later transcribing them in a structured observation form;
  • Narratives from the same visitors, with the open interview;
  • Data from structured interviews, later transcribed into an online form.
We collected observations in the exhibition space and collected the structured and open interviews in the garden, at the end of the visit and before that the visitors left the exhibition.
We did not give any gifts to the participants; the gadgets were available for all visitors. All participants agreed to be part of the study by their own free choice and informed written and signed consent was collected for each visitor. Moreover, we informed all visitors that the study was ongoing, with a text on the first panel, near one of the entrances to the room where the showcase was located.
We combined the data collection on weekdays, holidays, and at weekends in order to be able to listen to the point of views of all the different possible expected visitors. We did not collect interviews with schools, because they had a very limited time to visit the holographic showcase (around 15–20 min for each group, and some groups left the showcase after 7–10 min) before visiting another exhibition or moving to another festival event. The teachers had to book in advance for a specific slot during the week. We collected observations about the school groups, including students and teachers, and structured interviews. We held open interviews with all the other visitors, because they had the freedom to decide how long to stay in the exhibition and had time to take part in our research. All open interviews were conducted in the garden, offering to the visitors the possibility of sitting on a bench to relax after the visit. It is very important to take into consideration museum “fatigue” [46,47] and to have good acoustic conditions in which to record the interview. All open interviews were recorded with the visitors’ explicit consent and later transcribed. Only two students did not give consent to record the audio of the interview; in this case, we took notes during and after the interview.
We used the observations to answer research questions 1, 2, and 3; we used the open interviews to answer research questions 1 and 3 (time required: variable, based on personal availability, from 4/5 min to one hour), and we used the structured interviews to answer question 3 (time required: two minutes). However, all the data were triangulated for the quality [48] of the research and in order to analyse emerging patterns; as our approach is based on grounded theory, we left open the possibility of new questions, new categories, and patterns emerging from the data.

2.1.4. Data Analysis

Coding means “categorizing segments of data with a short name that simultaneously summarizes and accounts for each piece of data” [35]. Codes show how the researcher selects, separates, and sorts data before beginning to analytically study them.
Open coding is “the analytical process in which concepts are identified and their properties and dimensions discovered in the data” [36].
Glaser also talks about theoretical coding (1978) [49], initially based on 18 coding families but later extended to include others (1998). Charmaz suggests using these codes but without imposing a forced framework on the data: “They can help to interrogate yourself about whether these theoretical codes interpret all the data” [35].
Following Charmaz’s approach, we analysed the qualitative data by coding them as:
  • Comments and actions from the observations: we coded data in different steps; some emerging patterns were summarized with charts, and others were summarized in categories and relationships between categories, comparing them with previous studies (theoretical comparison);
  • Themes emerging from narratives from open interviews: we coded the narratives in different steps, from open coding to theoretical coding [35], comparing the emerging categories with categories and models from previous studies;
  • Patterns: we compared all data from observations and from interviews, looking for patterns.
Later, we also compared them with the data collected from structured interviews. We triangulated [48] some of the data already in the field, for example, by asking for confirmation during the open interview about our interpretation of a specific behaviour observed.
For 21 visitors, we have all the data from all tools; for 46 visitors, we have data from structured interviews and observations; and for the rest we only have observations. The data also include two interviews with staff members (in the role of exhibition guides) as special informants. In total, we took notes for 54 visitors; we focused our attention on 54 visitors. For school visits (large groups of 10–15 visitors, accompanied by teachers), we focused our attention on 1–3 students but described all the interactions and comments made by the group. The triangulation [48] was not only applied between sources, but also for time (weekday/weekend/national holiday) and point of view (visitors, customer service, project stakeholders).

3. Results

This section provides a concise and precise description of the results, their interpretation, and the conclusions that can be drawn. The results are organized by research questions.
  • Q1: What does the visitor remember after the experience and why did he/she visit the exhibition?
  • Q2: What does the visitor say and do during the experience, on his/her own or along with other visitors?
  • Q3. How can we improve the visitor experience?
    • Q3.1: During the experience, is the visitor subject to any “pain points” (term used in user experience research and usability to express difficulties encountered during the interaction)? If yes, how can we improve the experience?
    • Q3.2: During and after the experience, what does the visitor like/dislike? If the visitor dislikes something, how can we improve the experience?

3.1. Q1: What does the Visitor Remember after the Experience and Why Did They Visit the Exhibition?

The majority of visitors during the week were students, teachers, and people in retirement, and university students, families, groups of friends, couples, and single visitors came during the weekend and holidays.
The researcher asked them what they remembered after the visit. We collected 23 audio narratives, ranging from 4 min to 1 h long, transcribed in text. We copied the text into a table and coded them in different steps.

3.1.1. Learning

For the first coding, we divided the data in three main categories: informal learning, motivation, and prior knowledge.
In the following step, we compared the first initial categories with GLO (Global learning outcomes), a solid standard recognized for British museums. GLO categorizes learning in these “outcomes”: knowledge, understanding, inspiration/creativity/enjoyment, attitude, values, skills, and behaviours [50,51,52].
Knowledge can be/refer to:
  • Subject-specific (e.g., history, science);
  • Between and across subjects;
  • Specific artefacts, books, documents;
  • Site-specific (history, geography, use of site);
  • Locality, neighbourhood, region, country;
  • Self, personal matters, others.
Skills can be/refer to:
  • Subject-specific (mapping, estimating, painting);
  • Site-specific (how to use a library, archive, museum);
  • Practical (craft-based, manipulative, bodily-kinesthetic);
  • Transferable (working in teams, using a computer);
  • Key (numeracy, literacy, communication, ICT);
  • Critical and ethical thinking, social skills;
  • Other cognitive skills, problem-solving skills;
  • Emotional skills (managing anger, or powerful feelings).
Values, attitudes, feelings are about:
  • Motivation (to learn more, become interested, feel confident);
  • Oneself (positive personal identity, self-esteem, self-respect, confidence, independence);
  • Sense of personal achievement, sense of self in the community and regarding others (tolerance of difference);
  • Museums, archives, libraries; about a subject.
Creativity, inspiration, enjoyment can refer to:
  • Personal enrichment;
  • Fun;
  • Making new connections, lateral thinking, generation of new ideas or actions;
  • Making and producing things;
  • Invention;
  • Experimentation.
Behaviour refers to:
  • Doing more of something (reading, visiting an archive, learning);
  • Doing something different (visiting a museum for the first time, going to college, bringing others (family, friends));
  • Working in teams;
  • Employment, work placement.
In all the narratives, we were able to “code” a new learning outcome; for example, when the visitor describes what they learned about the manuscript, citing precise content. We provide six examples of quotations, one for each learning outcome:
  • I can see the map of colours here, as if they were in front of my eyes. I remember the red, the mercury” (new knowledge, student in chemistry);
  • It is a completely new way of understanding the object, because I can see the details of the images, the colours, they are not clear inside the library” (understanding, university professor in biology);
  • Can I take this showcase home? I really like how the data are presented” (inspiration, health operator);
  • I really like this new way of exploring the manuscript, it is interactive” (enjoyment, ancient book curator);
  • My wife is not digital native, she does not use technology often, but she was able to explore the content with her hand” (skill and behaviour, city council manager);
  • Latin is important for our culture” (value and attitude, engineer).
From all open interviews, one of the most relevant results was that all visitors learnt something new, because we coded at least one new learning outcome in each interview, including in the shortest ones.
As regards prior knowledge, visitors described in more depth, during the interview:
  • Their job;
  • Their subject of study;
  • Their hobbies.
More data about prior knowledge were also collected from the structured interviews and compared with the data from narratives: the level of knowledge about manuscripts and about holograms and previous experience with 4D models.

3.1.2. Motivation

The majority of visitors came to this exhibition because they wanted to visit the festival and discovered the exhibition from the festival program; few of them started the festival experience with this exhibition; some visitors came in off the street by chance; on the other hand, some visitors came from other cities just to see this exhibition. One family came back twice. A large number of visitors during the weekdays came as part of a school trip.
As regards motivation, after coding the data we categorized the visitors into six categories. Those categories can also be considered six typologies of visitors.
  • Festival lovers: visitors from Genoa who came to the festival and chose the exhibition from the festival program;
  • Focusing on cultural heritage: visitors who arrived from other cities because they wanted to visit this exhibition;
  • “Flaneures”/strollers: visitors from Genoa and tourists who came in off the street by chance or entered for other reasons (to see the historic house; to see other exhibitions, etc.);
  • Followers: visitors who came to the exhibition because another person planned the visit for them (e.g., children with parents, students with teachers) or because another person recommended it to them;
  • Exhibition lovers: visitors who came more than one time;
  • Experts in science communication: visitors working at the festival and who came during their free time in order to compare content and tools from different exhibitions at the festival.
For the next step, what patterns do we see if we compare the narratives with data from structured interviews and observations? The triangulation is described in the next paragraph.

3.1.3. Triangulation

Comparing the GLO in the narratives from interviews with prior knowledge and motivation, we can see five very clear patterns:
  • All the visitors remembered content linked to prior knowledge: new knowledge was built on prior knowledge. They summarized new knowledge in their narrative, but also enjoyment, inspiration, new understanding, and new skills regarding the experience of exploring a digital manuscript with a 4D model using their hands in a holographic showcase;
  • The majority of visitors had no prior experience of 4D models and holograms and a basic knowledge or no knowledge about ancient manuscripts. The majority of visitors, with basic/no prior knowledge about ancient manuscripts, were able to cite content from annotations and video introductions; visitors with prior knowledge about manuscripts expressed enjoyment and inspiration about the new way to explore and understand a manuscript;
  • Hobbies can be completely different from the person’s profession (for example, a town council manager very interested in history and in ancient books, an engineer very interested in iconographies from Asia, an employee with a background in economics who loves art, etc.);
  • Nobody came to the exhibition with the precise goal of seeing the holographic showcase about a manuscript; it was a surprise and a new experience for all of them. Nobody had explored a manuscript in this way before. For the majority of visitors, this was the first experience with manuscripts, holograms, and 4D models. The majority of visitors came from Genoa and from other cities in North Italy (Milan, Turin, Cuneo, etc.).
  • Visitors’ professions (Figure 10), subjects of study, and also hobbies emerged as the relevant aspects to take in consideration as a source for prior knowledge. We provide three quotations from the data, as examples:
    • The showcase looks like a video game console” (an engineer with video games as hobby);
    • I love the smell of the paper, I love libraries, archives…I like this new way of exploring a manuscript” (a city council manager with love for ancient books and a passion for history and archives);
    • Those iconographies (e.g., the falling temples of Babylon) came from far” (engineer with a strong interest in Asian cultures and holistic therapies).

3.2. Q2: What Does the Visitor Say and Do during the Experience, Alone or with Other Visitors?

Comparing the data in general from all three sources, other patterns emerged about learning, but also interactions between visitors and interaction with the showcase from comments and behaviours:
  • The strategy of offering guided tours to followers (students and children) and offering an exploratory visit to the other types of visitors who came at the weekends and on holiday was successful; the holographic showcase can be explored without a guide, if visitors have time and are motivated to do it. Children needed mediation for some of the content and the schools had a set time for the visit so the guide facilitated their first approach to the holographic showcase and its content (Figure 11).
  • The visit was a social event: all visitors interacted with someone or said something during the visit, but the quality of the audio in the room, from interviews and observations, was not good and visitors often did not hear some of the video content correctly (Figure 12).
  • The majority of visitors did not use the “help” function, and visitors’ learning styles to learn how to use the holographic showcase can be summarized in four categories, confirming what emerged in previous research (self-learner, peer-helped, imitator, guided; see theoretical comparison [53], Figure 13).
  • The majority of visitors smiled and/or were focused on the content (Figure 14). Some of them explicitly expressed their appreciation of the experience, especially visitors who learnt how to use the holographic showcase by themselves, in the “ahah moment” when they discovered the annotations and explored them. The interpretation of non-verbal communication, for example facial expression, is based on observation and the subjective interpretation of the researchers and was triangulated with comments made during the visit or interview. Visitors often smiled when they visualised specific content which was more interesting and enjoyable for them in the annotations or the video introductions. During group visits with teens, we observed some visitors also laughing, as part of the social experience, for example when one or more of them played the role of a performer. The definition of this role is provided on the next page, in point 8.
  • Only one visitor defined the experience as “immersive”, one visitor defined the soundtrack as “cinematographic”, and we observed that visitors were very focused, especially when they were alone or in a couple or in groups at the weekends.
  • In larger groups of more than three people, some visitors had difficulty properly seeing the content and they were less engaged and not focused on the experience. Some visitors were very tired when they arrived at the showcase, after a 1 h visit, and their fatigue affected the experience.
  • Observing visitors’ non-verbal communication, the majority of visitors had a positive experience. This also emerged from structured interviews, as engagement. The majority of visitors wanted to recommend this experience to a friend and they also wanted to learn more about manuscripts in the future (Figure 15). The chosen scale from 1 to 10 is based on the NPS test, a standard to measure user’s satisfaction in usability tests. In Figure 15, part a, we visualise all values in the standard scale, from 1 to 10. Nobody chose a value from 1 to 6 (there are no detractors) and this means that the majority of visitors were satisfied with the experience.
  • Visitors played different roles during the visits. The roles were observed, driver, navigator, helper, performer, and stopper.
  • Highly engaged visitors spent from 17 to 40 min observing/exploring from three to all annotations (two cases), but there was no correlation with the role played; also, some observers, who did not drive the system, smiled, made positive comments during the visit, and wanted to know more about the manuscripts and to suggest this experience to friends.
Regarding the different roles, we found a confirmation of what Schettino (2014) [44] observed in previous studies about the immersive environment PLACE-Hampi, providing the following description of the different roles:
  • The driver is the person who chose to operate the platform;
  • The driver can be an explorer: someone who tried to use the platform without any help and who learnt by observing previous visitors, by making mistakes or by being helped, or someone who asked for or received help from other visitors or the museum staff. The driver can also be an observer, taking over from previous drivers;
  • The observer is the person who chose not to operate the platform but to observe the panoramas chosen by the driver. The observer can be someone walking around, standing still or sitting on the floor. The observer can be a previous driver who gave other people a turn at operating the platform;
  • The navigator is the person who chose not to drive the platform directly but was on the platform, in some cases sometimes close to the driver, and who chose to give the driver suggestions about what content to explore and how to operate the platform. This person actively negotiated with the other visitors as to which panoramas to go to, sometimes just using words and sometimes also pointing to specific panoramas;
  • The helper is the person who helped visitors to drive the platform. Helpers were either visitors or members of the museum staff. A helper could be a person in a group (like a mother helping a child) or a visitor helping people in other groups (for example, someone who had already driven the platform and who explained the mechanism to someone in another group). The behaviour of the helpers was completely spontaneous. When the helpers were members of the museum staff, they either decided of their own volition to help or were asked for help, so their actions were based on an evaluation of what was happening in the space or after speaking with visitors;
  • The stopper is the person who asked visitors to stop using the platform/showcase/interactive installation; for example, a small child started crying/complaining and the mother decided to leave the space, visitors who came in as a couple and one of them asked the other to move on to the other rooms;
  • The performer is the person who chose to take an active role, “playing” with the projections/showcase/etc., using the installation in a new and unexpected way. They could create a kind of “performance” inside the experience, inspired by the content of the installation. These performances often made other visitors smile or laugh. As regards performers, we described in our notes two very unexpected behaviours:
    (a)
    Students from high schools engaged with the Latin and they “challenged” each other to translate parts of the text not translated;
    (b)
    Some young visitors played the role of performer, imitating the gesture of a magician in a very popular TV series on Netflix.
The performer role was observed during school visits and confirmed in two interviews with guides (triangulation of sources).

3.3. Q3. How Can We Improve the Visitor Experience?

  • Q3.1: During the experience, is the visitor subject to any “pain points” (term used in user experience research and usability to express difficulties during the interaction with showcases) during the experience? If the visitor says yes, how can we improve the experience?
Visitors who drive the experience learnt a new skill: how to use their hand to explore the digital manuscripts. From observations, visitors had some difficulties at the beginning, especially in finding the right point in the space in order to move from the surface to the other layers (IR); they needed to make some mistakes, but nobody left the showcase without having the opportunity to see the content. Moreover, from observations and open and structured interviews, the majority classified this interaction model as “easy”. From open interviews, we collected more comments about the hand interactions, triangulated with observation notes about the experience of the same visitor. Triangulating with what the festival staff members said during their interview, students commented that they preferred this interaction model, which was more challenging but more engaging. They, and also some adult visitors, also in retirement, commented that this interaction model was similar to some video games (Figure 16).
Visitors cannot control the text animation and scroll the annotation; they need to wait until the end of the animation before moving to another and, moreover, if by mistake they choose the same twice, they need to wait again; if they choose an annotation that does not interest them, they have to see it and they cannot stop or skip it. However, only one visitor (a user experience researcher at a university) clearly commented during the observation that she was interested in one specific annotation but she had to wait until the end of the text presentation before being able to choose another annotation. This pattern emerged by comparing observations and open interviews not only with visitors but also with festival staff members (Figure 16).
  • Q3.2: During and after the experience, what does the visitor like/dislike? If the visitor dislikes something, how can we improve the experience?
During the interviews, visitors were asked to say what they liked or disliked.
Some visitors did not find anything they did not like and added more information on what they really liked. In general, visitors liked the experience, comparing observations and what they said during the interview, and also the data about engagement from structured interviews.
From the interviews, some of the most often mentioned and appreciated content was the possibility of seeing the changes in the drawing and the detail of the sea animal deleted by the artist with red colour, the transcription and translation from Latin, the colours, and the maps of colours.
In general, visitors liked the experience of “traveling” through the book, “touching” an ancient book, exploring the illuminations with a zoom and seeing details, the possibility of seeing under the surface, the historical video introduction by a fictional character and, in general, the experience of understanding a complex, fragile, beautiful and precious object in more depth.
Some visitors found the video introductions too long, but they expressed this only in the open interview; in the structured interview, the majority of visitors said that the video introduction was the right length for them.
Visitors who chose the exploratory visit watched the video introduction and at least one of the other two videos.
From observations, the visit lasted from 4 to 40 min and the majority of visitors saw between three and six annotations. A few visitors came alone in their lunch break or at the weekend, exploring more than six annotations; one visitor saw all annotations and videos on one Saturday morning.
From observations and interviews, visitors felt more comfortable exploring all content if there were no other visitors in the room and they choose weekends to avoid the school guided tours.
Children had difficulties because of the size of the showcase; they could not see all the content but, at the same time, they were very curious, attracted by the storytelling and the character in the video introductions, comparing what we observed directly and what the guide, used as a special informant, told us in their interview (Table 1).
  • Q3.3: If the visitor dislikes something, how can we improve the experience?
The main goal of the evaluation is to improve the design. Some of the improvements are contextual: if the showcase is not in an exhibition with other interactive displays and at the end of the path, not during a festival for few weeks, but in museum or library for a temporary exhibition, visitors can have more time to just explore the showcase and its content. Some other improvements are in the area of content design, interaction design, and interface design.
  • Interaction design: visitors had difficulties finding the limits for the interaction area with their hands; we have to find a way to make the design easier and accessible for all visitors, reducing the pain points. For example, we can improve the interaction design and the interface; visitors need a visual support in order to understand the invisible limits of the interaction area and have better control over the transition from RGB to IR.
  • Content design: there were no specific critical pain points with the images and text, only that a couple of graphs of the chemical analysis could be re-designed to be less complex, highlighting the relevant part with colours. We could also make it easier for visitors to recognize a category of content (for example, if the content is in the biology or art history domain) and to recognize if they have already visited a specific point. The help button was not used, but we need more data in different contents before removing it. We want to try to provide video help, not only an image.
  • Sound: some visitors complained in the interviews about the poor quality of the sound in the room; they were not able to follow the storytelling when the exhibition space was full of visitors. In a library, we can improve it, providing headphones. Unfortunately, this will affect the interactions between visitors. In the library space, we will need to test how the experience will change, reducing the possibility for people to interact and make comments.
  • Showcase design and interface design: we also need to find a way to make it easier for children and their parents to enjoy the experience together, without the parents having to pick up their children because they cannot see all the content properly. Some solutions will be studied for the next exhibitions, in museums and libraries, for instance by creating some steps or a platform, or using high stools, taking into consideration safety issues.

4. Discussion

We here discuss the results and how we can interpret them from the point of view of previous studies.
We have to point out that this is a pilot study, and this is the first study about the use of a 4D model in a holographic showcase to present an ancient manuscript. There have been previous studies about holographic showcases, but they did not present this type of artefact, and there have been previous studies about 3D models, but not about 4D models, combining data and visualization data from different diagnostic methodologies.
We can compare our results with previous studies about interactive and immersive media in situ and with previous studies about holographic showcases.

4.1. Comparison with Previous Studies

4.1.1. Comparison with Previous Studies about Immersive and Interactive Environments “In Situ”

In previous studies about visitors’ behaviours in immersive interactive media in museums, it has been found that:
  • The visitors played almost the same roles observed in our previous studies [44]; we can say, from theoretical comparison, that those roles can be applied in more studies if the technology is used in order to design a space where the visitors can comment and interact among themselves;
  • In this study, we observed four learning styles [53]: it was confirmed that some visitors prefer to be guided, and some visitors prefer to explore by themselves and enjoy the “ah ah moment” when they discover and understand the interaction model;
  • The study also confirmed what emerged about engagement in Pietroni, Pagano, Poli (2016) [54]: the observer and driver can be both very engaged by the experience and usually, but not always, there is an exchange of roles during the visits;
  • In this study, the role of navigator emerged only in groups, families or friends, and the role of performers only during school visits. In previous studies [44], navigators and performers were also observed between visitors who met for the first time at the museum and who did not arrive together.

4.1.2. Comparison with Previous Studies about Showcases

In previous studies about visitors’ experiences with holographic showcases [26,29], we observed some common patterns; for example:
  • Museum fatigue can affect the showcase experience, when visitors have to stand and they cannot sit down and relax during the storytelling;
  • Children are attracted to the interactive and storytelling part, but the shape of the showcase is an obstacle as they cannot see the visual content properly.

4.1.3. Comparison with Previous Studies about Learning

“Prior knowledge exists not only at the level of concepts, but also at the levels of perception, focus of attention, procedural skills, modes of reasoning, and beliefs about knowledge” [55]. Our pilot study confirms what emerged from some previous studies in museums and galleries about GLO and prior knowledge; however, prior knowledge is not always built through people’s professions. Hobbies can be relevant for the visitors’ interpretation, learning, and making meaning processes. In other studies (Schettino and Kenderdine, 2011) [45], visitors often mentioned their prior experience about India, Indian culture, and Hinduism from travels, previous exhibitions, family history, religious beliefs, etc. The personal memories of an historic house (Villa Ciani, Lugano) were the prior knowledge cited by local visitors at the Villa Ciani 3D experience [56].

4.2. Future Research

We will analyse the showcase in a different context, for example as part of an exhibition in a museum or library. The context of the Science Festival meant there was a very large flow of schools on weekdays and they had a very limited time, in large groups, to interact with the showcase. Not all students had the opportunity to drive the platform and observe carefully from the right perspective. We will improve the design and we will analyse the impact of the new design, comparing the future results with the results from this first pilot study.

5. Conclusions

This is the first paper about visitor experiences of a 4D model of ancient manuscripts. These objects can usually be seen only in libraries or in the context of exhibitions where they are closed and protected inside a showcase, without any possibility for the visitors to explore or interact with contents. A holographic showcase was created to present content related to a very precious manuscript, Ms 1474 De Balneis Puteolanis from the mid-13th century, preserved at the Angelica Library in Rome, in innovative ways. The holographic showcase is a mixed reality environment, conceived to create a sensory and emotional experience of the cultural object, implementing dramatic narration and gesture-based interaction. Many aspects of the codex have been represented with the 4D virtual model: shape, structure, surface and stratigraphies, images, texts, stories, meanings, style, materials, techniques, and state of preservation. They converge into an integrated model of knowledge. The visitors alternated between phases of passive fruition, when they enjoyed the narrative development of the stories, and active fruition, when they were invited to interact, through mid-air hand movements, with the virtual model.
Thanks to the holographic interactive showcase, visitors had the possibility to explore the different layers of the 4D model: the surface with the illuminations, but also the images captured via the thermal camera.
The showcase was presented for the first time to the public in the context of the Science Festival in Genoa (Italy), in October 2022, which was an opportunity to evaluate the impact of this installation and the user experience. School groups with teachers and retired people came during weekdays, and university students, families, and other visitors during the weekends and on holidays.
A specific methodology was used, based on a combination of grounded theory [35,36], digital ethnography [37], narrative inquiry [38], and case studies [39].
This combination can be summed up as an ‘embodied constructivist GTM digital ethnography in situ’.
During the theoretical coding, we applied the GLO, the global learning outcomes, as categories in order to analyse visitors’ informal learning patterns. One of the key findings was that all visitors learnt something; coding the data and triangulating data, we can see new skills, knowledge, understanding, inspiration, enjoyment, attitudes, values, and behaviours.
The multidisciplinary approach has proved to be very successful: users with different ages, professions, fields of study, and levels of knowledge about manuscripts can find content interesting for them and they can connect them to their previous knowledge and experiences.
The majority of visitors enjoyed the experience: this clearly emerged when triangulating data from observations and open and structured interviews. The majority of visitors were highly focused, smiled during the experience and were highly engaged.
Nobody had explored a manuscript in this way before. After the visit, the majority of visitors wanted to recommend this experience to a friend and they also wanted to learn more about manuscripts in the future.
We observed a confirmation of patterns from previous studies about interactive installations; visitors can play different roles, as observer and driver [54], but also as navigator, helper, stopper, and performer [44].
Regarding “performer”, some young visitors, in school groups, played the role of a magician, imitating a character from a Netflix series; the experience can stimulate visitors’ imagination and also allow playful interaction. Some school groups played “a challenge” between them, translating the text from Latin: this was very unexpected behaviour.
Visitors who drove the experience learnt a new skill: how to use their hand to explore the digital manuscripts. Observations showed that visitors had some difficulties at the beginning, especially in finding the right point in the space in order to move from the surface to the other layers (IR), and they needed to learn by trial and error, but nobody left the showcase without having the opportunity to see the content.
From the data, we know what visitors liked and what they did not like and what the pain points were, but also what visitors especially liked. In general, visitors liked the experience of “traveling” through the book, “touching” a precious book, exploring the illuminations with a magnifying lens, and the possibility of seeing under the surface.
Visitors need visual support in order to better understand the invisible limits of the interaction area and gain better control of the transition from RGB to IR. We have to design a more accessible interface for children and for visitors in wheelchairs (for example, adding an element to the showcase, etc.).
The evaluation is part of the design process; we will use what we have learnt as designers from this experience to improve the showcase, the interface, the interaction model, and some content in future exhibitions.

Author Contributions

Conceptualization, E.P. and P.S.; methodology of UX Research, P.S.; methodology of holographic showcase, E.P. and E.d.; software, E.d.; validation, E.P.; formal analysis, P.S.; data collection, P.S.; data analysis, P.S.; resources, E.P. and E.d.; data curation of audio-visual content, E.P.; data curation of User Experience evaluation, P.S.; writing—original draft preparation, P.S. (Section 2, Section 3, Section 4 and Section 5), E.P. (Section 1 and Section 4) and E.d. (paragraph 1.4); writing—review and editing, E.P. and P.S.; visualization of audio-visual content, E.P. and E.d.; UX data visualisation, P.S.; supervision, E.P.; project administration, E.P.; funding acquisition, E.P. All authors have read and agreed to the published version of the manuscript.

Funding

This research was funded by FESR-POR LAZIO 2014–2020, Avviso pubblico “Gruppi di Ricerca 2020”, Det. n. G04052 del 04/04/2019, grant number CUP B79J21002850002.

Data Availability Statement

Data stored in the CNR cloud are for privacy reasons available only to ISPC CNR researchers. Audio (recorded interviews) will be stored from October 2022 until one year after the project. The visitors signed their informed consent before the interview.

Acknowledgments

Many thanks to Alessandra Chirivì, ISPC-CNR, for her support in data collection (12 structured interviews), as one of the observers in the field. Thanks also to our colleagues from CNR ISPC and the University of Rome, Tor Vergata, for producing scientific content implemented in the annotations; finally, our acknowledgments to the exhibition’s staff.

Conflicts of Interest

The funders had no role in the design of the study; in the collection, analyses, or interpretation of data; in the writing of the manuscript; or in the decision to publish the results.

References

  1. Remondino, F.; El-Hakim, S. Image-based 3D Modelling: A Review. Photogramm. Rec. 2006, 21, 269–291. [Google Scholar] [CrossRef]
  2. Mercuri, F.; Buonora, P.; Cicero, C.; Helas, P.; Manzari, F.; Marinelli, M.; Paoloni, S.; Pasqualucci, A.; Pinzari, F.; Romani, M.; et al. Metastructure of illuminations by infrared thermography. J. Cult. Herit. 2018, 31, 53–62. [Google Scholar] [CrossRef]
  3. Maniaci, M. Archeologia del Manoscritto. In Metodi, Problemi, Bibliografia Recente; Viella: Rome, Italy, 2022. [Google Scholar]
  4. Miniare Project by Fitzwilliam Museum. Available online: https://fitzmuseum.cam.ac.uk/research/projects/miniare (accessed on 21 May 2023).
  5. Illuminated Manuscripts in the Making. Available online: https://www.fitzmuseum.cam.ac.uk/illuminated/ (accessed on 21 May 2023).
  6. Bibliothèque National de France. Available online: https://archivesetmanuscrits.bnf.fr/ (accessed on 21 May 2023).
  7. British Library Medieval Manuscripts Blog. Available online: https://blogs.bl.uk/digitisedmanuscripts/https://codexsinaiticus.org/en/project/conservation_msi.aspx (accessed on 21 May 2023).
  8. The J. Paul Getty Museum. Manuscripts. Available online: https://www.getty.edu/art/manuscripts/ (accessed on 21 May 2023).
  9. The Metropolitan Museum of Art. The Art of Illumination. Available online: http://blog.metmuseum.org/artofillumination/introduction-a-book-of-hours/ (accessed on 21 May 2023).
  10. Bodleian Libraries, Oxford. Available online: https://digital.bodleian.ox.ac.uk/ (accessed on 21 May 2023).
  11. Ambrosiana Library. Codex Atlanticus by Leonardo da Vinci. Available online: https://codex-atlanticus.ambrosiana.it/#/ (accessed on 21 May 2023).
  12. The Annotated Utrecht Psalter. Available online: https://psalter.library.uu.nl/?_ga=2.178285985.482096169.1590082356-1397587295.1590082356 (accessed on 21 May 2023).
  13. Using Virtual Reality to Explore 15th Century Illuminated Manuscripts. Available online: https://dornsife.usc.edu/xrlab/neh-vr-exploration-of-illuminated-manuscripts/ (accessed on 21 May 2023).
  14. Angeletaki, A.; Carrozzino, M.; Johansen, S. MUBIL: Creating a 3D Experience of “Reading Books” in a Virtual Library Laboratory. Int. J. Herit. Digit. Era 2014, 3, 271–286. [Google Scholar] [CrossRef]
  15. Lorenzini, C.; Carrozzino, M.; Evangelista, C.; Tecchia, F.; Bergamasco, M.; Angeletaki, A. A Virtual Laboratory An immersive VR experience to spread ancient libraries heritage. In Proceedings of the 2015 Digital Heritage, Granada, Spain, 28 September–2 October 2015; pp. 639–642. [Google Scholar] [CrossRef]
  16. Digital Vatican Library. Project Overview Manuscripts and Annotations from All Thematic Pathways. Available online: https://spotlight.vatlib.it/overview (accessed on 21 May 2023).
  17. MANUS Online. Manuscripts in Italian Libraries. Available online: https://manus.iccu.sbn.it/en-US/ (accessed on 21 May 2023).
  18. OPAC SBN Catalogo del Servizio Bibliotecario Nazionale. Available online: https://opac.sbn.it/en-US/ (accessed on 21 May 2023).
  19. Maniaci, M.; Orofino, G. L’officina delle Bibbie atlantiche: Artigiani, scribi, miniatori. Problemi ancora aperti. In Come Nasce un Manoscritto Miniato. Scriptoria, Tecniche, Modelli e Materiali; D’Arcais, F.F., Crivello, F., Eds.; Franco Cosimo Panini: Modena, Italy, 2010; pp. 197–212. [Google Scholar]
  20. e Balneis Puteolanis Ms. 1474 in MANUS. Available online: https://manus.iccu.sbn.it//opac_SchedaScheda.php?ID=102297 (accessed on 21 May 2023).
  21. Divina Commedia Ms. 1102 in MANUS. Available online: https://manus.iccu.sbn.it//opac_SchedaScheda.php?ID=102213 (accessed on 21 May 2023).
  22. Coccia Desogus, P. Un Libro d’Ore francese nella Biblioteca Angelica di Roma. Miniatura 1993–1996, 5–6, 17–26. [Google Scholar]
  23. da Eboli, P. De Euboicis Aquis; Critical edition, translation and comment edited by De Angelis, T.; SISMEL Edizioni del Galluzzo: Florence, Italy, 2018. [Google Scholar]
  24. Maddalo, S. Il De Balneis Puteolanis di Pietro da Eboli. In Realtà e Simboli nella Tradizione Figurativa; Biblioteca Apostolica Vaticana: Vatican City, Vatican, 2003. [Google Scholar]
  25. European Research Infrastructure for Heritage Science. Available online: https://www.e-rihs.it/ (accessed on 21 May 2023).
  26. Pietroni, E.; Ferdani, D.; Forlani, M.; Pagano, A.; Rufa, C. Bringing the Illusion of Reality Inside Museums—A Methodological Proposal for an Advanced Museology Using Holographic Showcases. Informatics 2019, 6, 2. [Google Scholar] [CrossRef]
  27. Pepper, J.H. True History of the Ghost and All about Metempsychosis; Cambridge Library Collection: Cambridge, UK, 2012; ISBN 9781108044349. [Google Scholar]
  28. Pietroni, E.; Pagano, A. Stories beyond Museum Objects: The Case of the Kunágota Sword. In Crossoads. Travelling through Europe, 300–1000 AD.; Hupperetz, W., Mulvin, L.S., Schmauder, M., Eds.; WBOOKS: Zwolle, The Netherlands, 2017; pp. 198–201. ISBN 97 89 46258 2248. [Google Scholar]
  29. Pagano, A.; Pietroni, E.; Ferdani, D.; d’Annibale, E. User eXperience (UX) Evaluation for MR Cultural Applications: The CEMEC Holographic Showcases in European Museums. Appl. Syst. Innov. 2021, 4, 92. [Google Scholar] [CrossRef]
  30. Video Demo of the Codex4D Holographic Showcase Presented in Genoa. Available online: https://tube.rsi.cnr.it/w/vpLQti8aPJQzXPnuNSCdZP (accessed on 21 May 2023).
  31. Ultra Leap Motion Capture Sensor. Available online: https://www.ultraleap.com/product/ (accessed on 21 May 2023).
  32. VVVV Visual Live Programming Environment. Available online: https://visualprogramming.net/ (accessed on 21 May 2023).
  33. Introduction Movie to De Balneis Puteolanis. Available online: https://tube.rsi.cnr.it/w/o69t8sJkvGzP9s1yKK5f4P (accessed on 21 May 2023).
  34. Gibbson, S. Three Levels of Pain Points in Customer Experience. Available online: https://www.nngroup.com/articles/pain-points/ (accessed on 19 May 2023).
  35. Charmaz, K. Constructing Grounded Theory; Sage: London, UK, 2006. [Google Scholar]
  36. Strauss, A.; Corbin, J. Basics of Qualitative Research: Techniques and Procedures for Developing Grounded Theory, 2nd ed.; Sage: London, UK, 1998. [Google Scholar]
  37. Boellstorff, T.; Nardi, B.; Pearce, C.; Taylor, T.L. Ethnography and Virtual Worlds. A handbook of method; Princeton University Press: Princeton, NJ, USA, 2012. [Google Scholar]
  38. Czarniawska, B. Narratives in Social Science; Sage: London, UK, 2004. [Google Scholar]
  39. Yin, R.K. Case Study Research, Design and Methods, 3rd ed.; Sage: London, UK; New Delhi, India, 2003. [Google Scholar]
  40. Schettino, P. Home, sense of place and visitors’ interpretations of digital cultural immersive experiences in museums: An application of the “embodied constructivist GTM digital ethnography in situ” method. In Proceedings of the Digital Heritage International Congress, Marseille, France, 28 October–1 November 2013; IEEE Computer Society: Washington, DC, USA, 2013; pp. 721–724. [Google Scholar] [CrossRef]
  41. Pagano, A.; Pietroni, E.; Poli, C. An Integrated Methodological Approach to Evaluate Virtual Museums in Real Museum Contexts. In Proceedings of the 9th Annual International Conference of Education, Research and Innovation (ICERI), Seville, Spain, 14–16 November 2016; IATED Digital Library. pp. 310–321, ISBN 978-84-617-5895-1. [Google Scholar] [CrossRef]
  42. Designers Italia, Kit Interview. Available online: https://designers.italia.it/risorse-per-progettare/comprendere/interviste-soggetti-coinvolti/ (accessed on 24 May 2023).
  43. Designers Italia, Manuale Operativo di Design, Interviste. 2023. Available online: https://docs.italia.it/italia/designers-italia/manuale-operativo-design-docs/it/versione-corrente/doc/design-research/interviste.html (accessed on 24 May 2023).
  44. Schettino, P. Rethinking the immersive digital experience in museums. A crosscultural analysis of visitors’ behaviors based on roles. In Proceedings of the 9th International Conference on Cultural Attitudes towards Technology and Communication (CaTaC), Oslo, Norway, 18–20 June 2014. [Google Scholar]
  45. Schettino, P.; Kenderdine, S. Place-Hampi: Narratives of Inclusive Cultural Experience. Int. J. Incl. Mus. 2011, 3, 141–156. [Google Scholar] [CrossRef]
  46. Bitgood, S. Environmental psychology in museums, zoos, and other exhibition centers. In Handbook of Environmental Psychology; Bechtel, R., Churchman, A., Eds.; Wiley: Hoboken, NJ, USA, 2002; pp. 460–480. [Google Scholar]
  47. Davey, G. What is Museum Fatigue? Visit. Stud. Today 2005, 8, 17. [Google Scholar]
  48. Denzin, N. Strategies of multiple triangulation. In The Research Act in Sociology: A Theoretical Introduction to Sociological Method; McGraw-Hill: New York, NY, USA, 1970; pp. 297–313. [Google Scholar]
  49. Glaser, B.G. Theoretical Sensitivity; Sociology Press: Mill Valley, CA, USA, 1978. [Google Scholar]
  50. Hooper-Greenhill, E. Developing a Scheme for Finding Evidence of the Outcomes and Impact of Learning in Museums, Archives and Libraries: The Conceptual Framework; Report; University of Leicester: Leicester, UK, 2002; Available online: https://hdl.handle.net/2381/66 (accessed on 21 May 2023).
  51. Hooper-Greenhill, E. Measuring Learning Outcomes in Museums, Archives and Libraries: The Learning Impact Research Project (LIRP). Int. J. Heritage Stud. 2004, 10, 151–174. [Google Scholar] [CrossRef]
  52. Hooper-Greenhill, E. Museum and Education, Purpose, Pedagogy, Performance; Routledge: Abigdon, UK, 2007. [Google Scholar]
  53. Schettino, P. Immersive Learning. Learning Patterns inside Digital Cultural Immersive Experiences in Situ. In Proceedings of the European Distance and E Learning Network Annual Conference (EDEN), Re-Imaging Learning Environments, Budapest, Hungary, 14–17 June 2016. [Google Scholar]
  54. Pietroni, E.; Pagano, A.; Poli, C. Tiber Valley Virtual Museum: User experience evaluation in the National Etruscan Museum of Villa Giulia. In Proceedings of the 24th International Conference in Central Europe on Computer Graphics, Visualization and Computer Vision WSCG 2016, Plzeň, Czech Republic, 30 May–3 June 2016; Skala, V., Ed.; UNION Agency. University of West Bohemia: Plzeň, Czech Republic; pp. 97–106. [Google Scholar]
  55. Roschelle, J. Learning in interactive environments: Prior knowledge and new experience. In Public Institutions for Personal Learning: Establishing a Research Agenda; Falk, J.H., Dierking, L.D., Eds.; American Association of Museums: Washington, DC, USA, 1995; pp. 37–51. [Google Scholar]
  56. Schettino, P. Augmenting a historic house: Villa Ciani 3D. In Proceedings of the 3rd Digital Heritage International Congress (DigitalHERITAGE) Held Jointly with 24th International Conference on Virtual Systems & Multimedia (VSMM 2018), San Francisco, CA, USA, 26–30 October 2018; pp. 1–4. [Google Scholar] [CrossRef]
Figure 1. Codex4D holographic showcase dedicated to the manuscript “De Balneis Puteolanis”, presented in Genoa.
Heritage 06 00318 g001
Figure 2. Map of the exhibition “The Heritage Science Languages, from Macro to Micro”, at the “Villa del Principe” in Genoa.
Heritage 06 00318 g002
Figure 3. Pepper’s Ghost technique, from the theatre to the holographic showcase.
Heritage 06 00318 g003
Figure 4. The sensory dimension of the object has been recreated in the Codex4D holographic showcase.
Heritage 06 00318 g004
Figure 5. Scenography in the Codex4D holographic showcase.
Heritage 06 00318 g005
Figure 6. Left: instructions for how to interact with the installation; right: totem in front of the holographic showcase.
Heritage 06 00318 g006
Figure 7. The character shot on a green screen and then composed in the scene.
Heritage 06 00318 g007
Figure 8. The storyteller paddling in a basin to abandon the sheet and come closer to the user.
Heritage 06 00318 g008
Figure 9. Example of annotation in the holographic showcase.
Heritage 06 00318 g009
Figure 10. Demographic data from structured interviews: professions. The majority of visitors were high school students and teachers during the weekdays. The variety of professions during the weekend and holidays was higher.
Heritage 06 00318 g010
Figure 11. This is a figure from ethnographic observations: (a) the showcase was used by groups and by single visitors; (b) type of visit: guided visits were offered to schools and families, and for other groups and individual visitors we proposed the exploratory visit (33%), with or without a short introduction.
Heritage 06 00318 g011
Figure 12. The visit as a social event: (a) the majority of visitors interacted with other visitors, 91%; (b) the majority of visitors made comments during the visit, 75%.
Heritage 06 00318 g012aHeritage 06 00318 g012b
Figure 13. Learning patterns: (a) the majority of visitors did not use the help; (b) visitors who were guided, visitors learning by themselves, imitating or asking other visitors or guides for help.
Heritage 06 00318 g013aHeritage 06 00318 g013b
Figure 14. Facial expressions: (a) the researcher was able to recognize a facial expression; (b) interpretation of non-verbal communication (facial expression) by the researcher (ethnographic observation). The majority of visitors smiled or were very focused. Note: some visitors changed expressions during the visit, e.g., from very focused to smiling, etc.
Heritage 06 00318 g014aHeritage 06 00318 g014b
Figure 15. Engagement: (a) the majority of visitors (62%) would recommend the experience (value from 8 to 10, chosen by 37 participants) to a friend; (b) they would like (89%) to learn more about manuscripts.
Heritage 06 00318 g015aHeritage 06 00318 g015b
Figure 16. Triangulation between the structured interviews and observations: (a) for the majority of visitors, the interaction model, based on hand movements and the sensor recognizing the movements, was easy to use; (b) this was also confirmed by observations, but some visitors had some problems which are described in the notes and summarized in Table 1.
Heritage 06 00318 g016aHeritage 06 00318 g016b
Table 1. The three most mentioned pain points, from observations and open interviews.
PP1PP2PP3
Exploration of levels (from RGB to IR and from IR to RGB)Possibility of not seeing the images properly for visitors under 1 m 50Poor acoustic quality and difficulty following the stories
Visitors had problems finding the invisible limits and checking the interaction points in RGB because they involuntarily moved their body and the level changed from RGB to IRLimits on vision for children, young adults, and people in wheelchairsAcoustic limits when the space was crowded
Disclaimer/Publisher’s Note: The statements, opinions and data contained in all publications are solely those of the individual author(s) and contributor(s) and not of MDPI and/or the editor(s). MDPI and/or the editor(s) disclaim responsibility for any injury to people or property resulting from any ideas, methods, instructions or products referred to in the content.

