
Heritage Science Contribution to the Understanding of Meaningful Khipu Colours
 , , , , and
Abstract
:1. Introduction
2. Provenance
3. Description of the Khipus
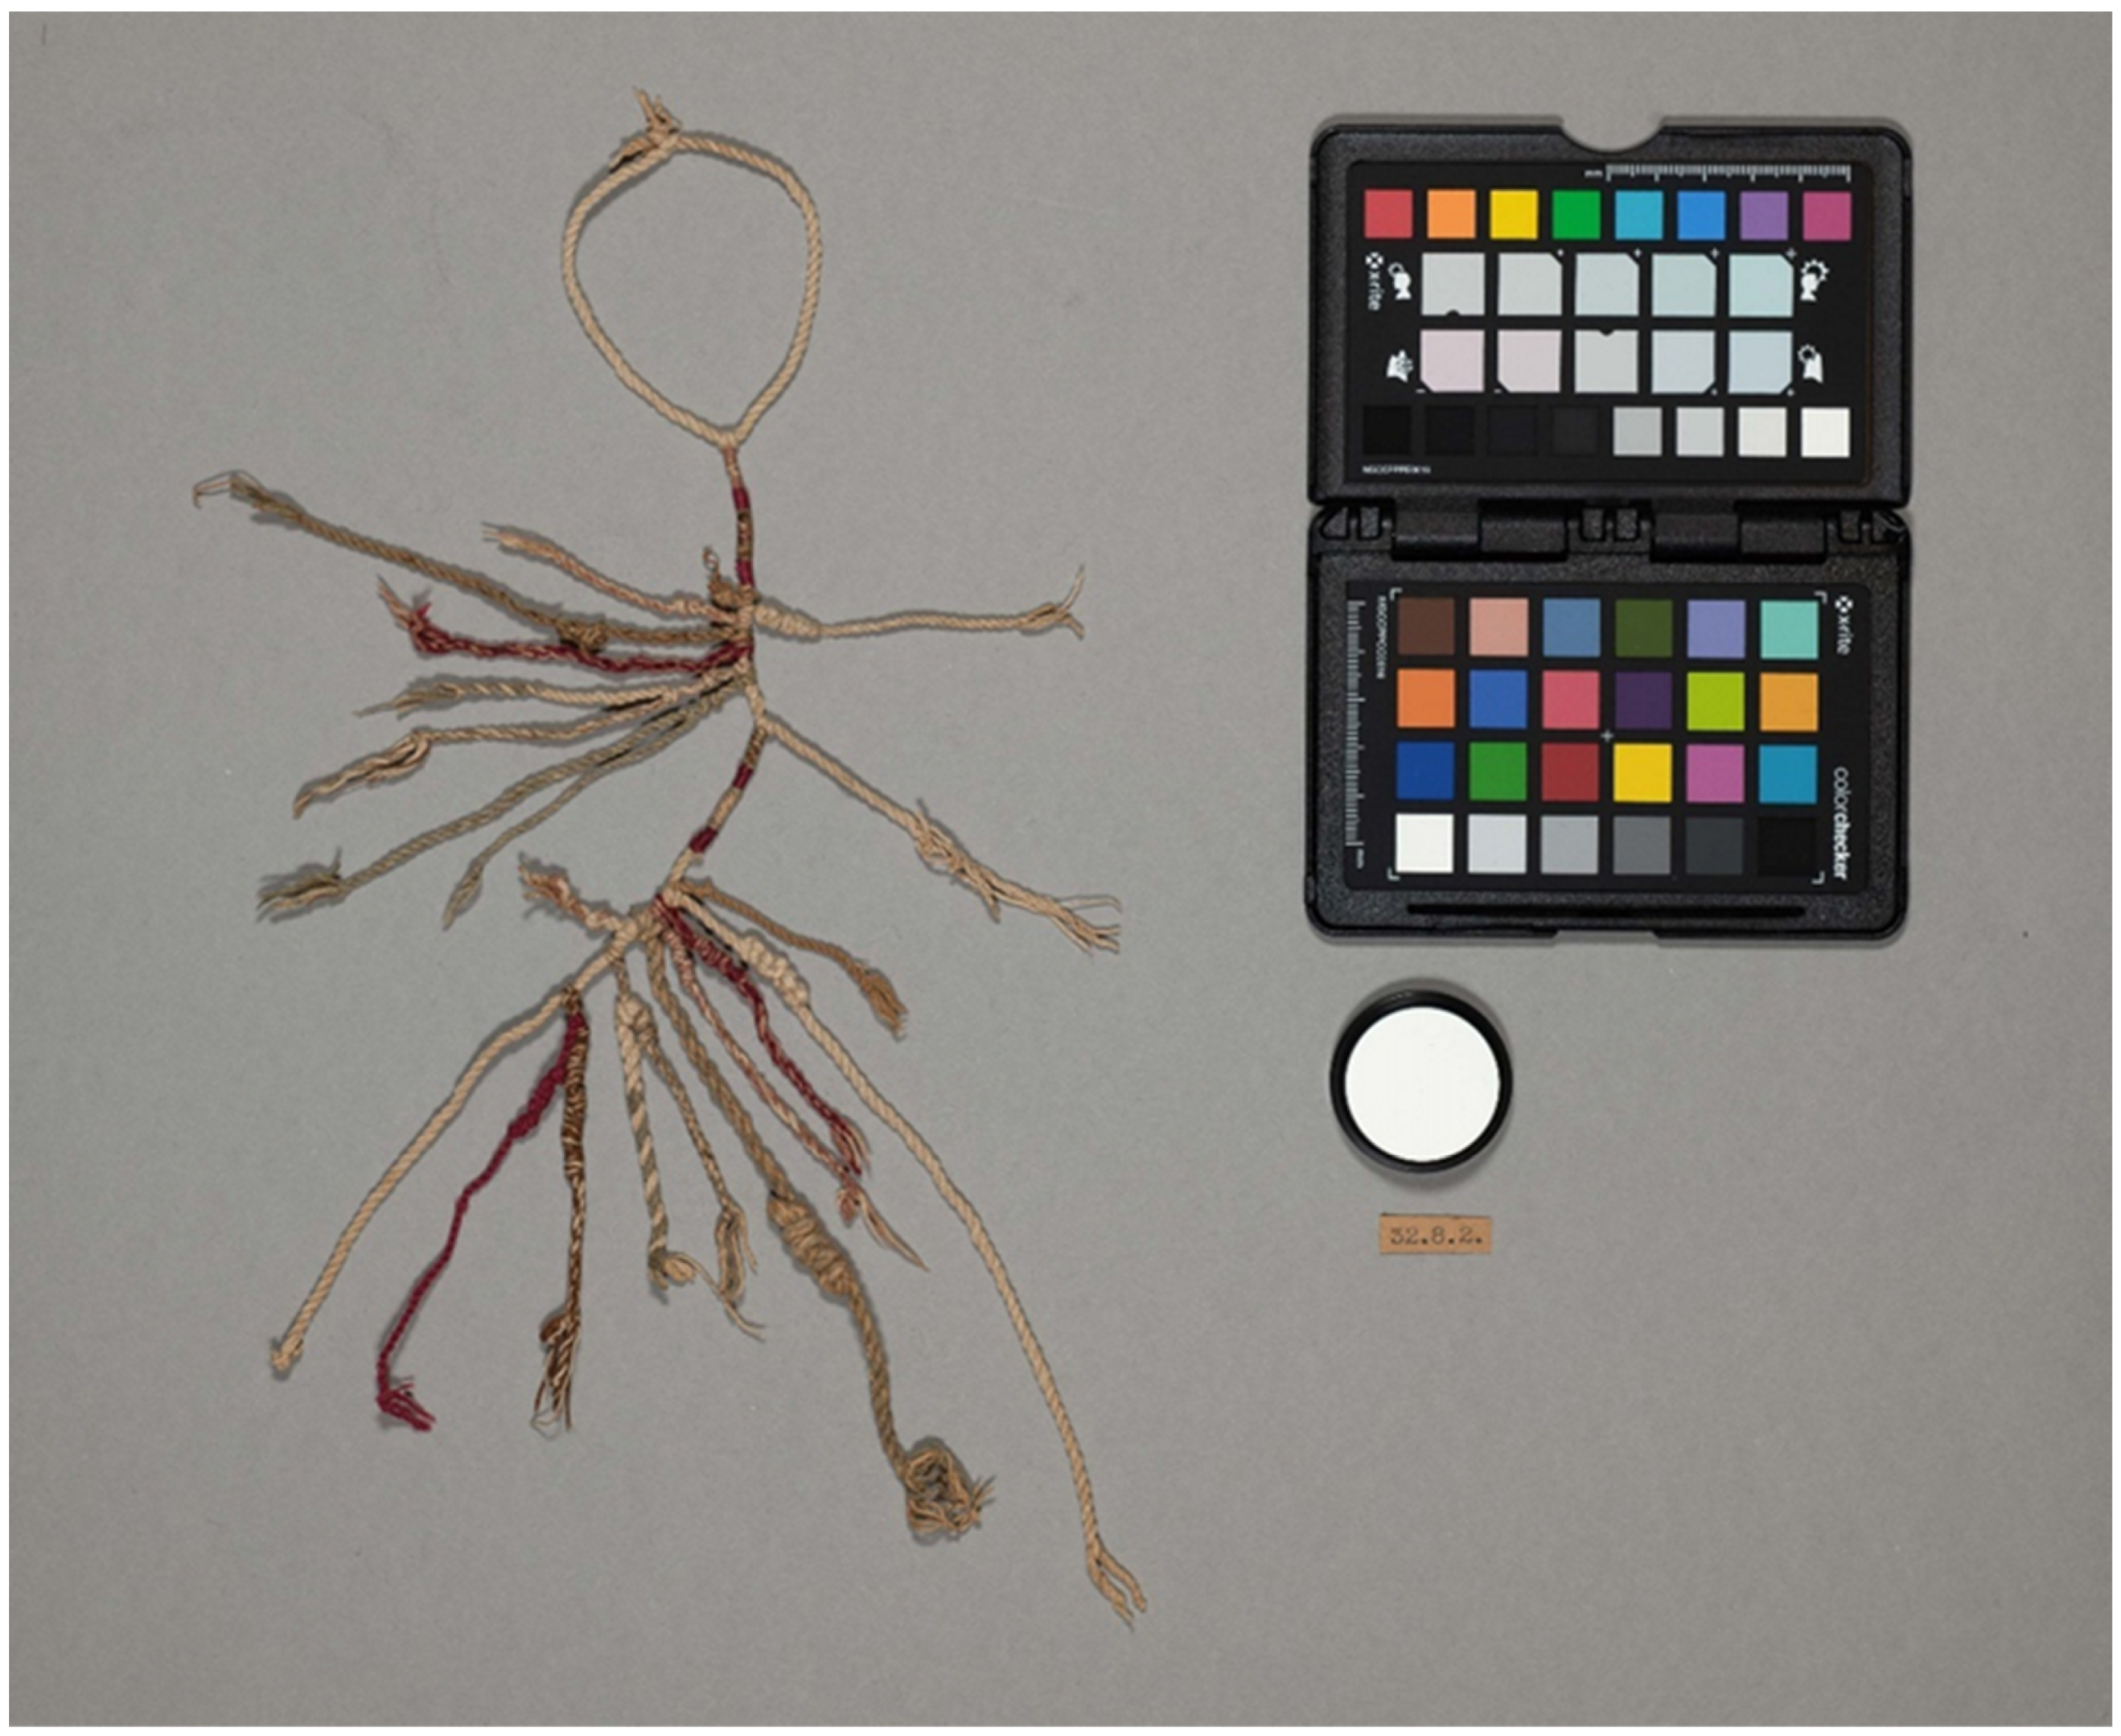
4. Khipu 1932.08.0002
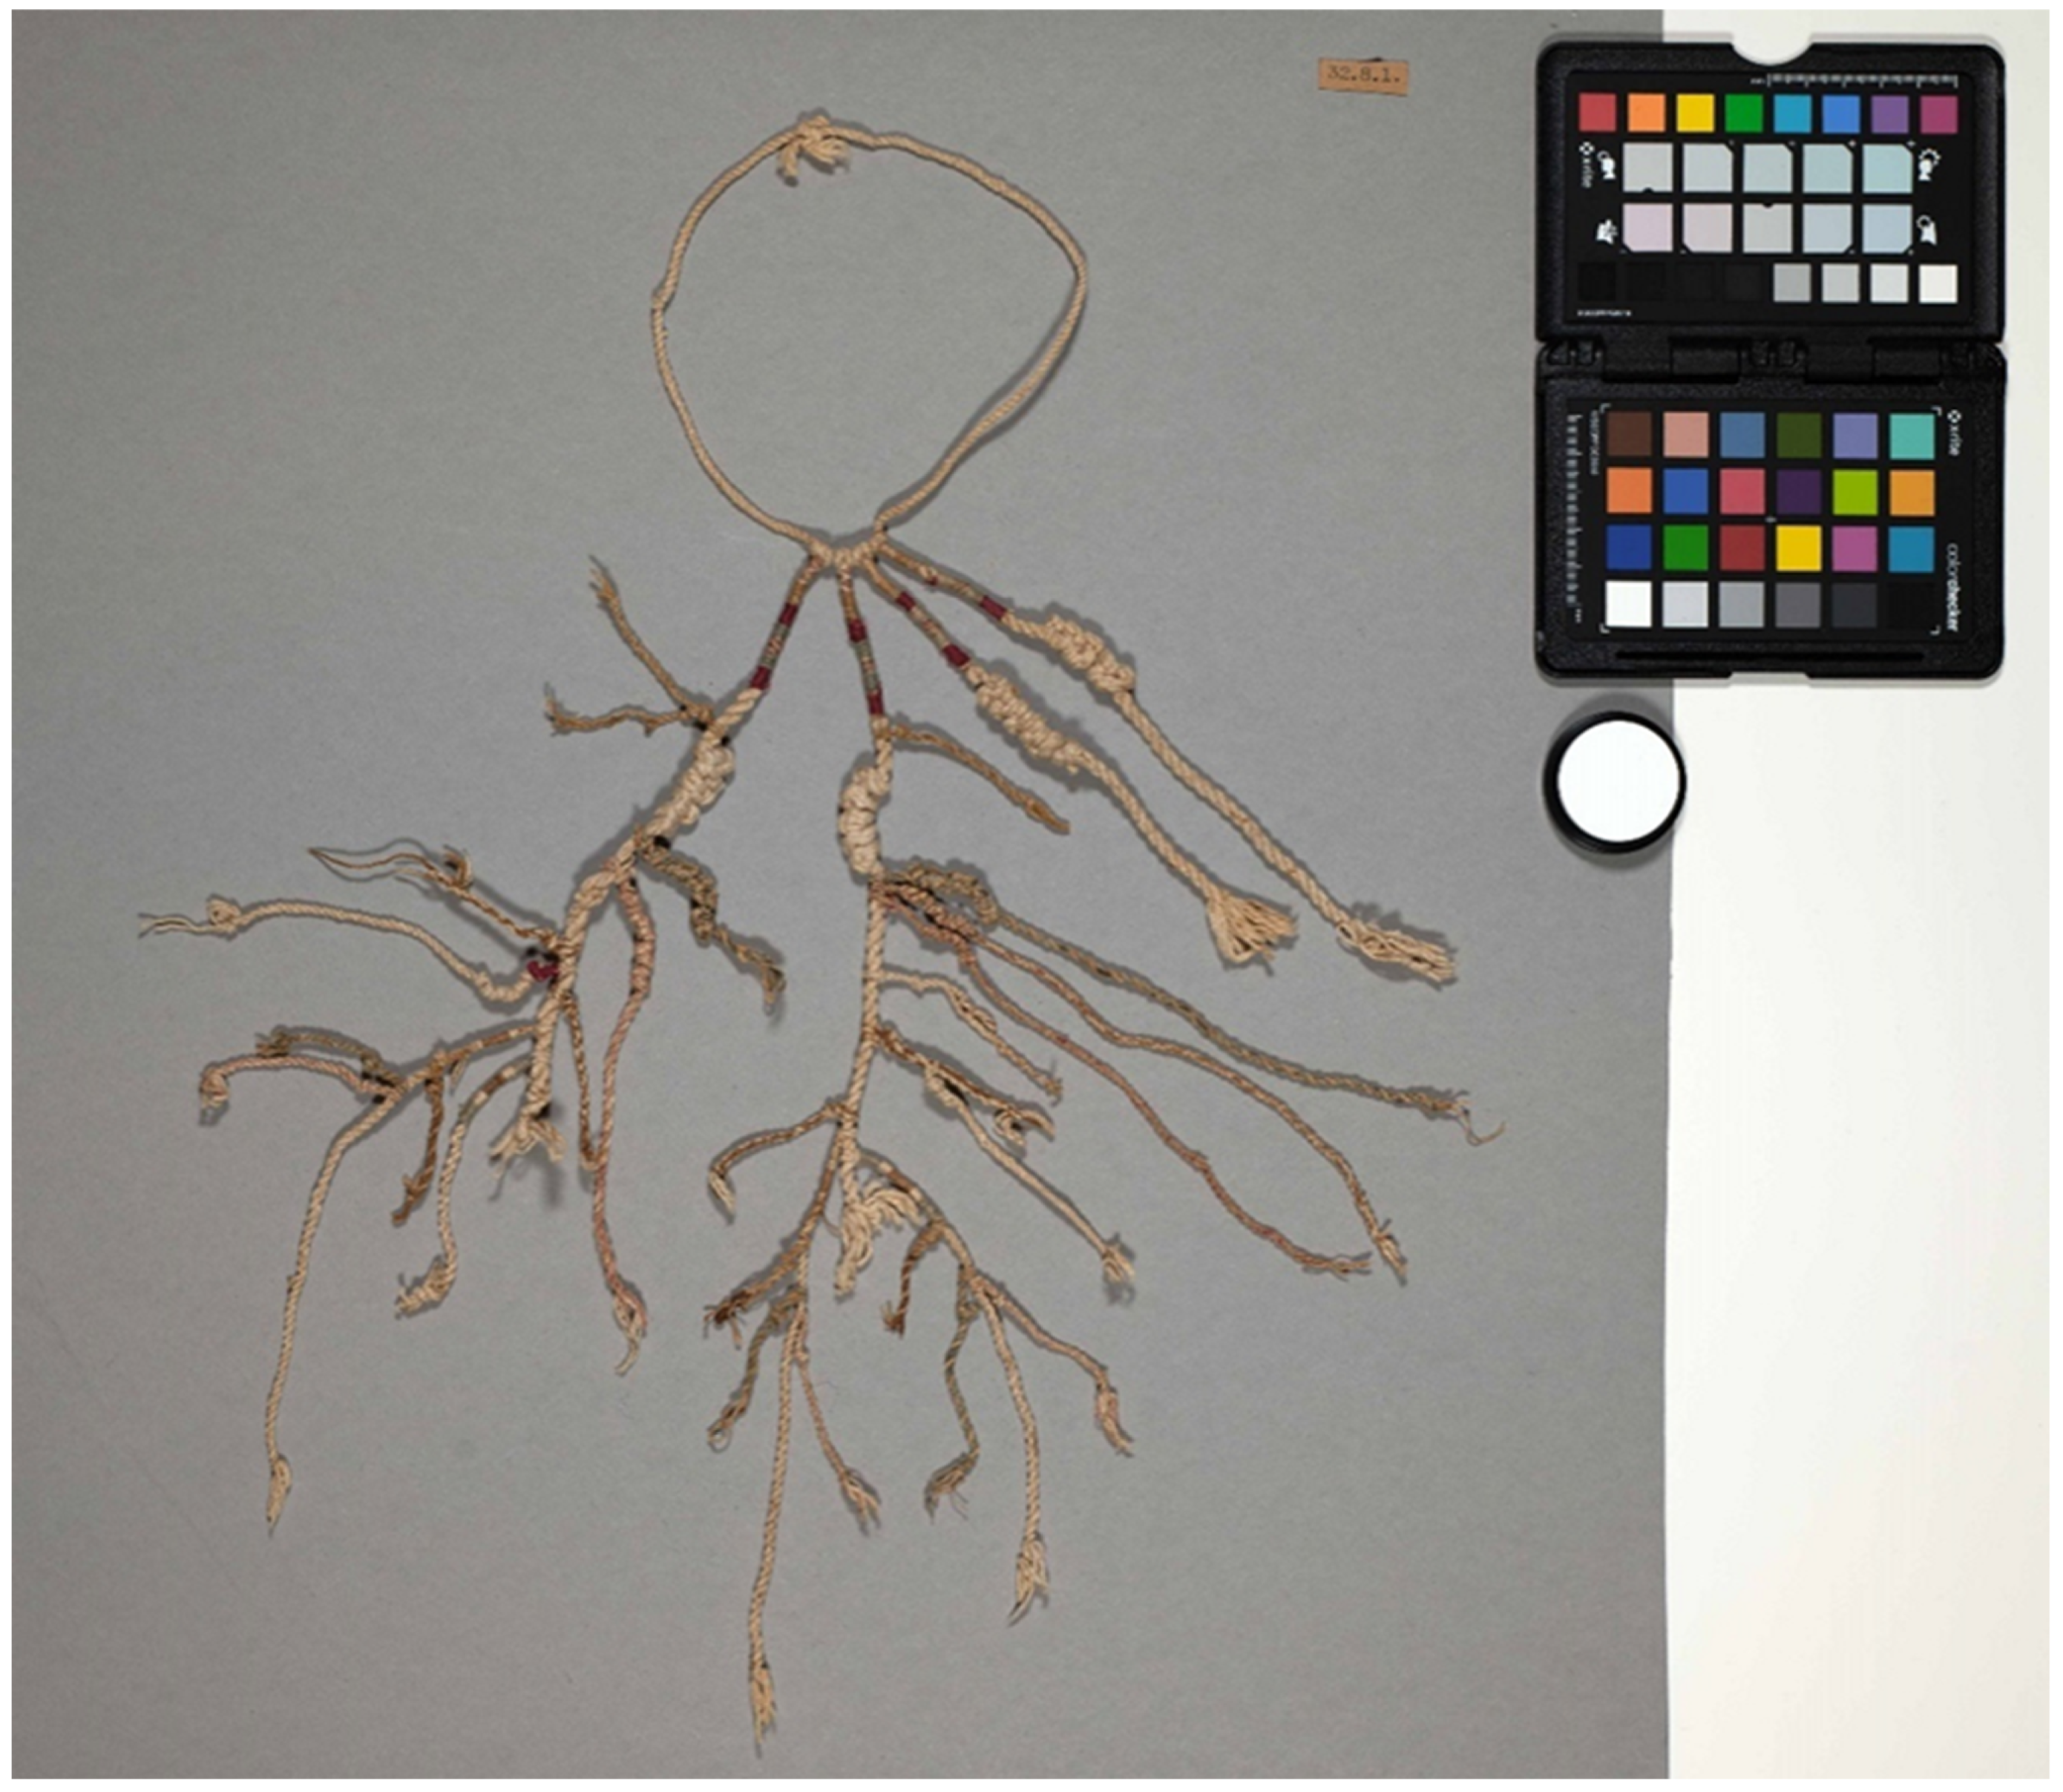
5. Khipu 1932.08.0001
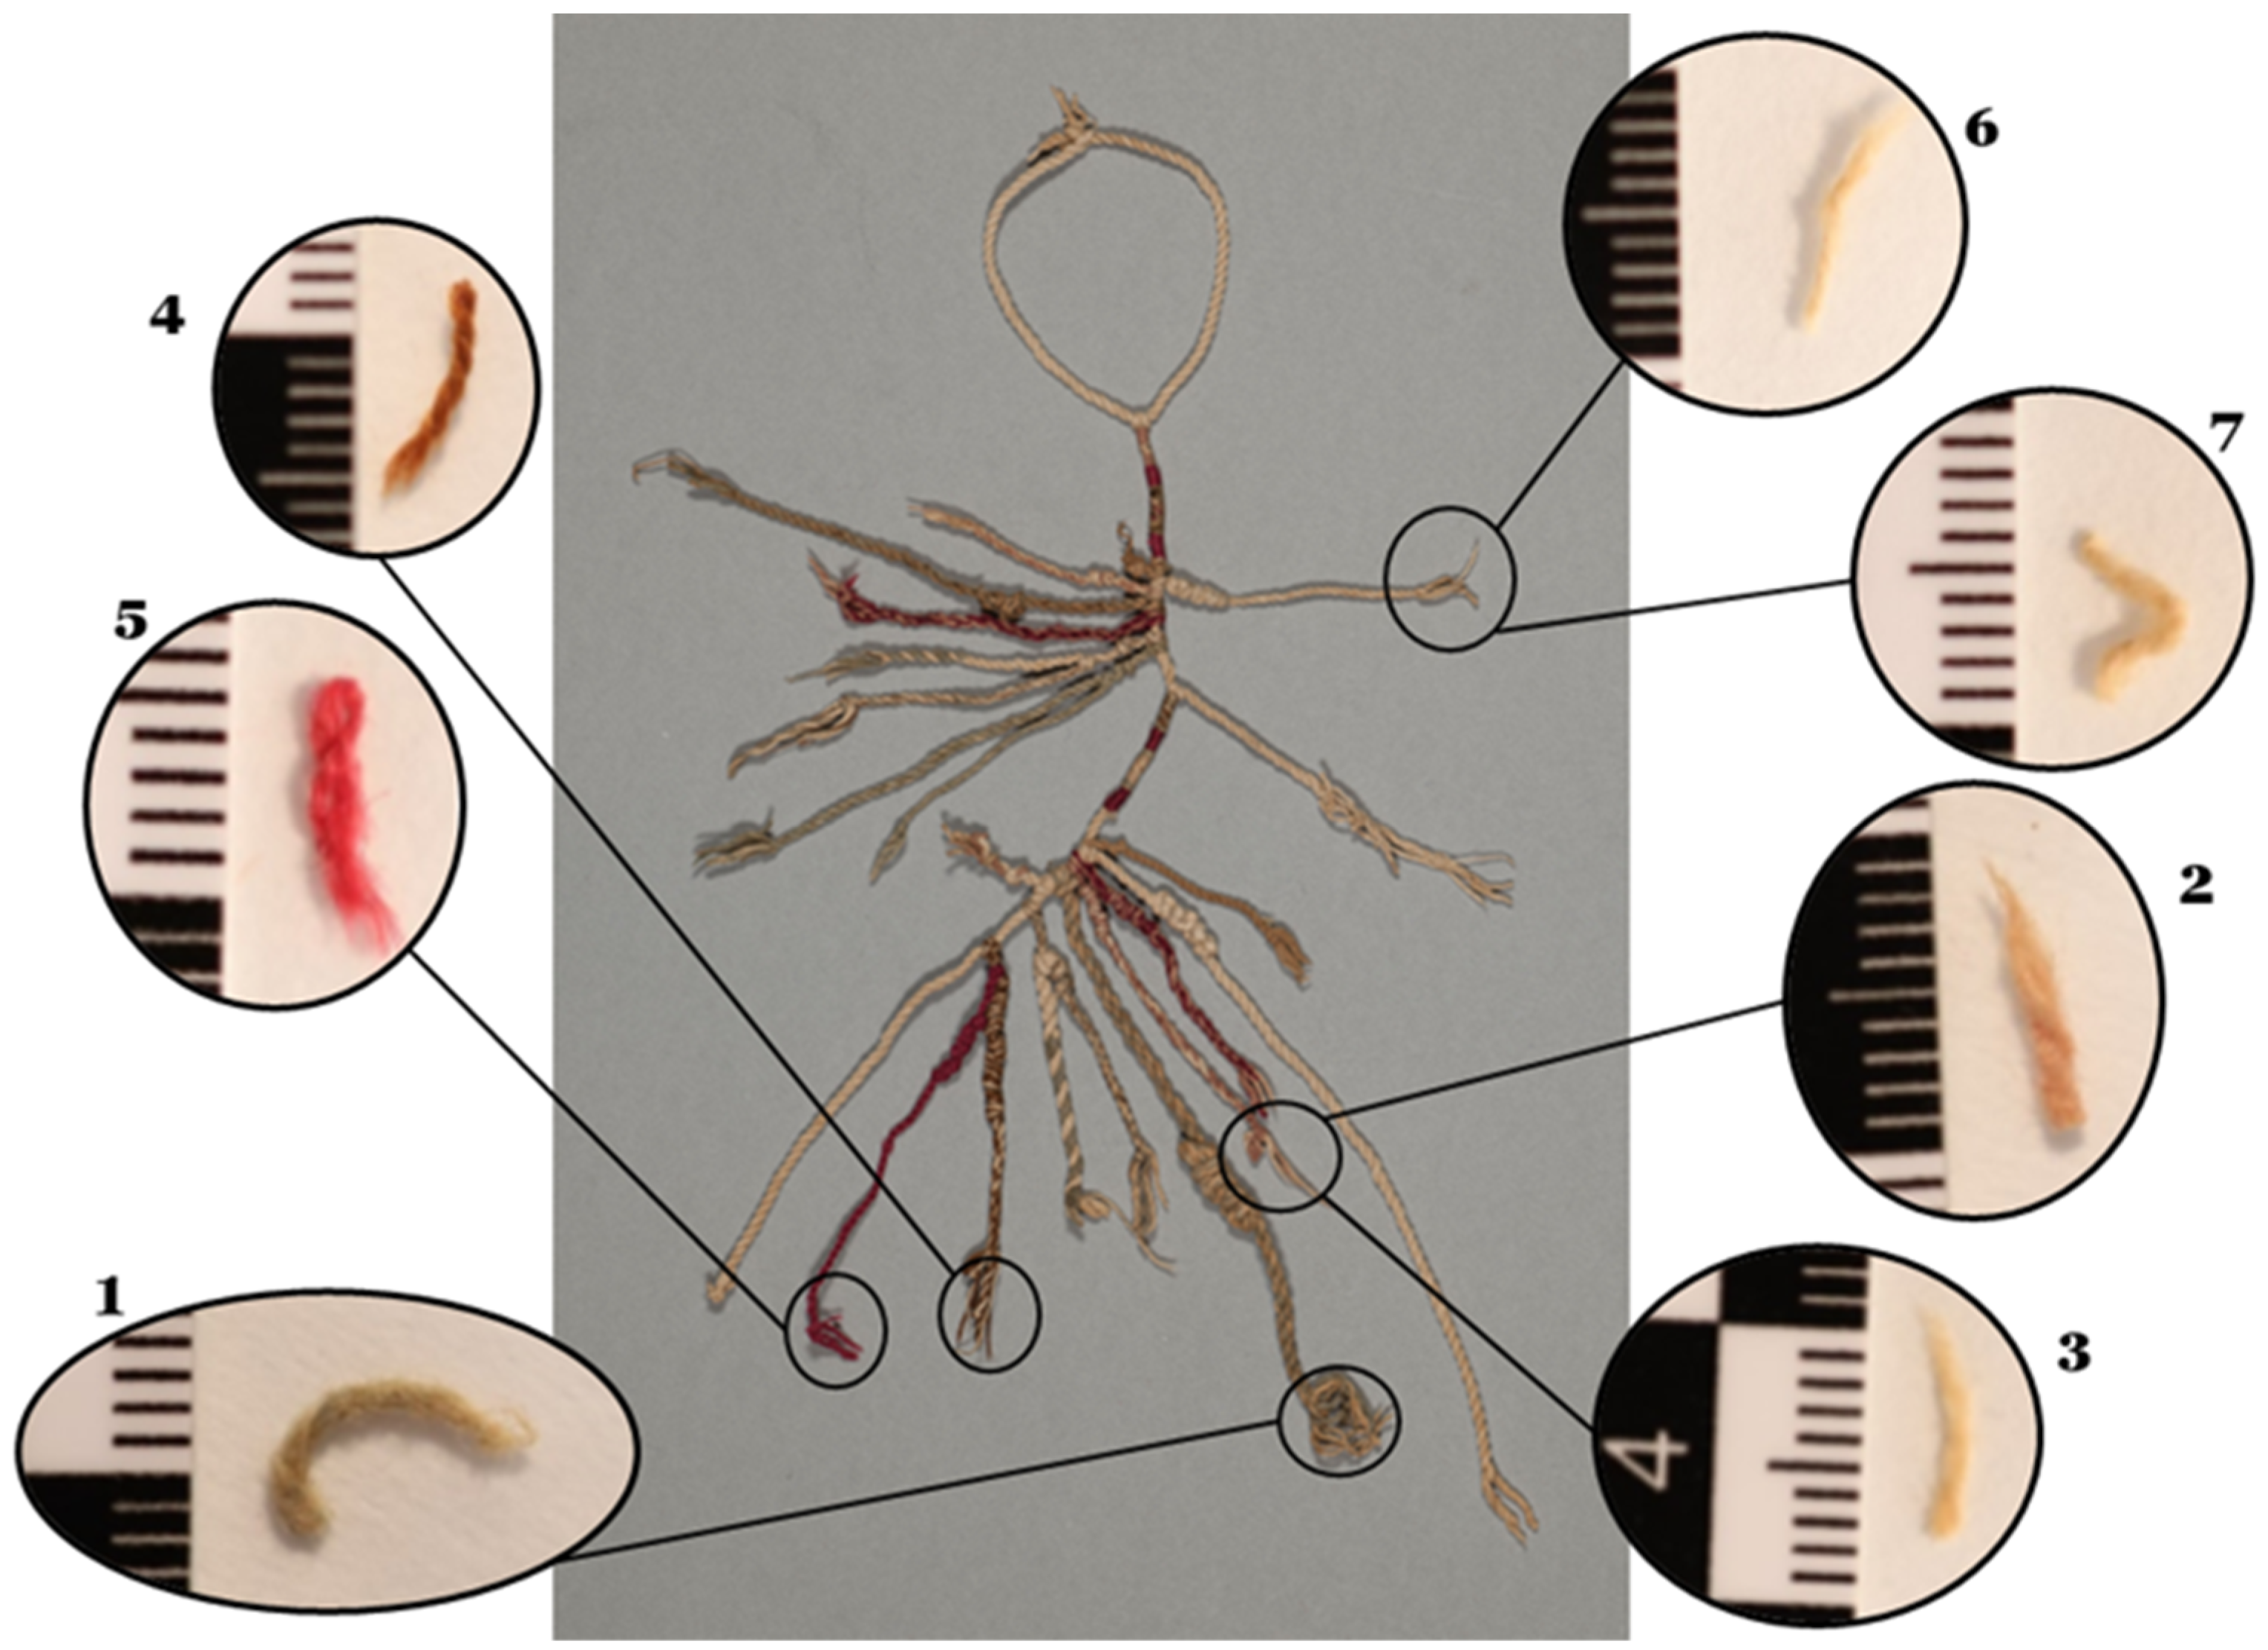
6. Sampling
7. Materials and Methods
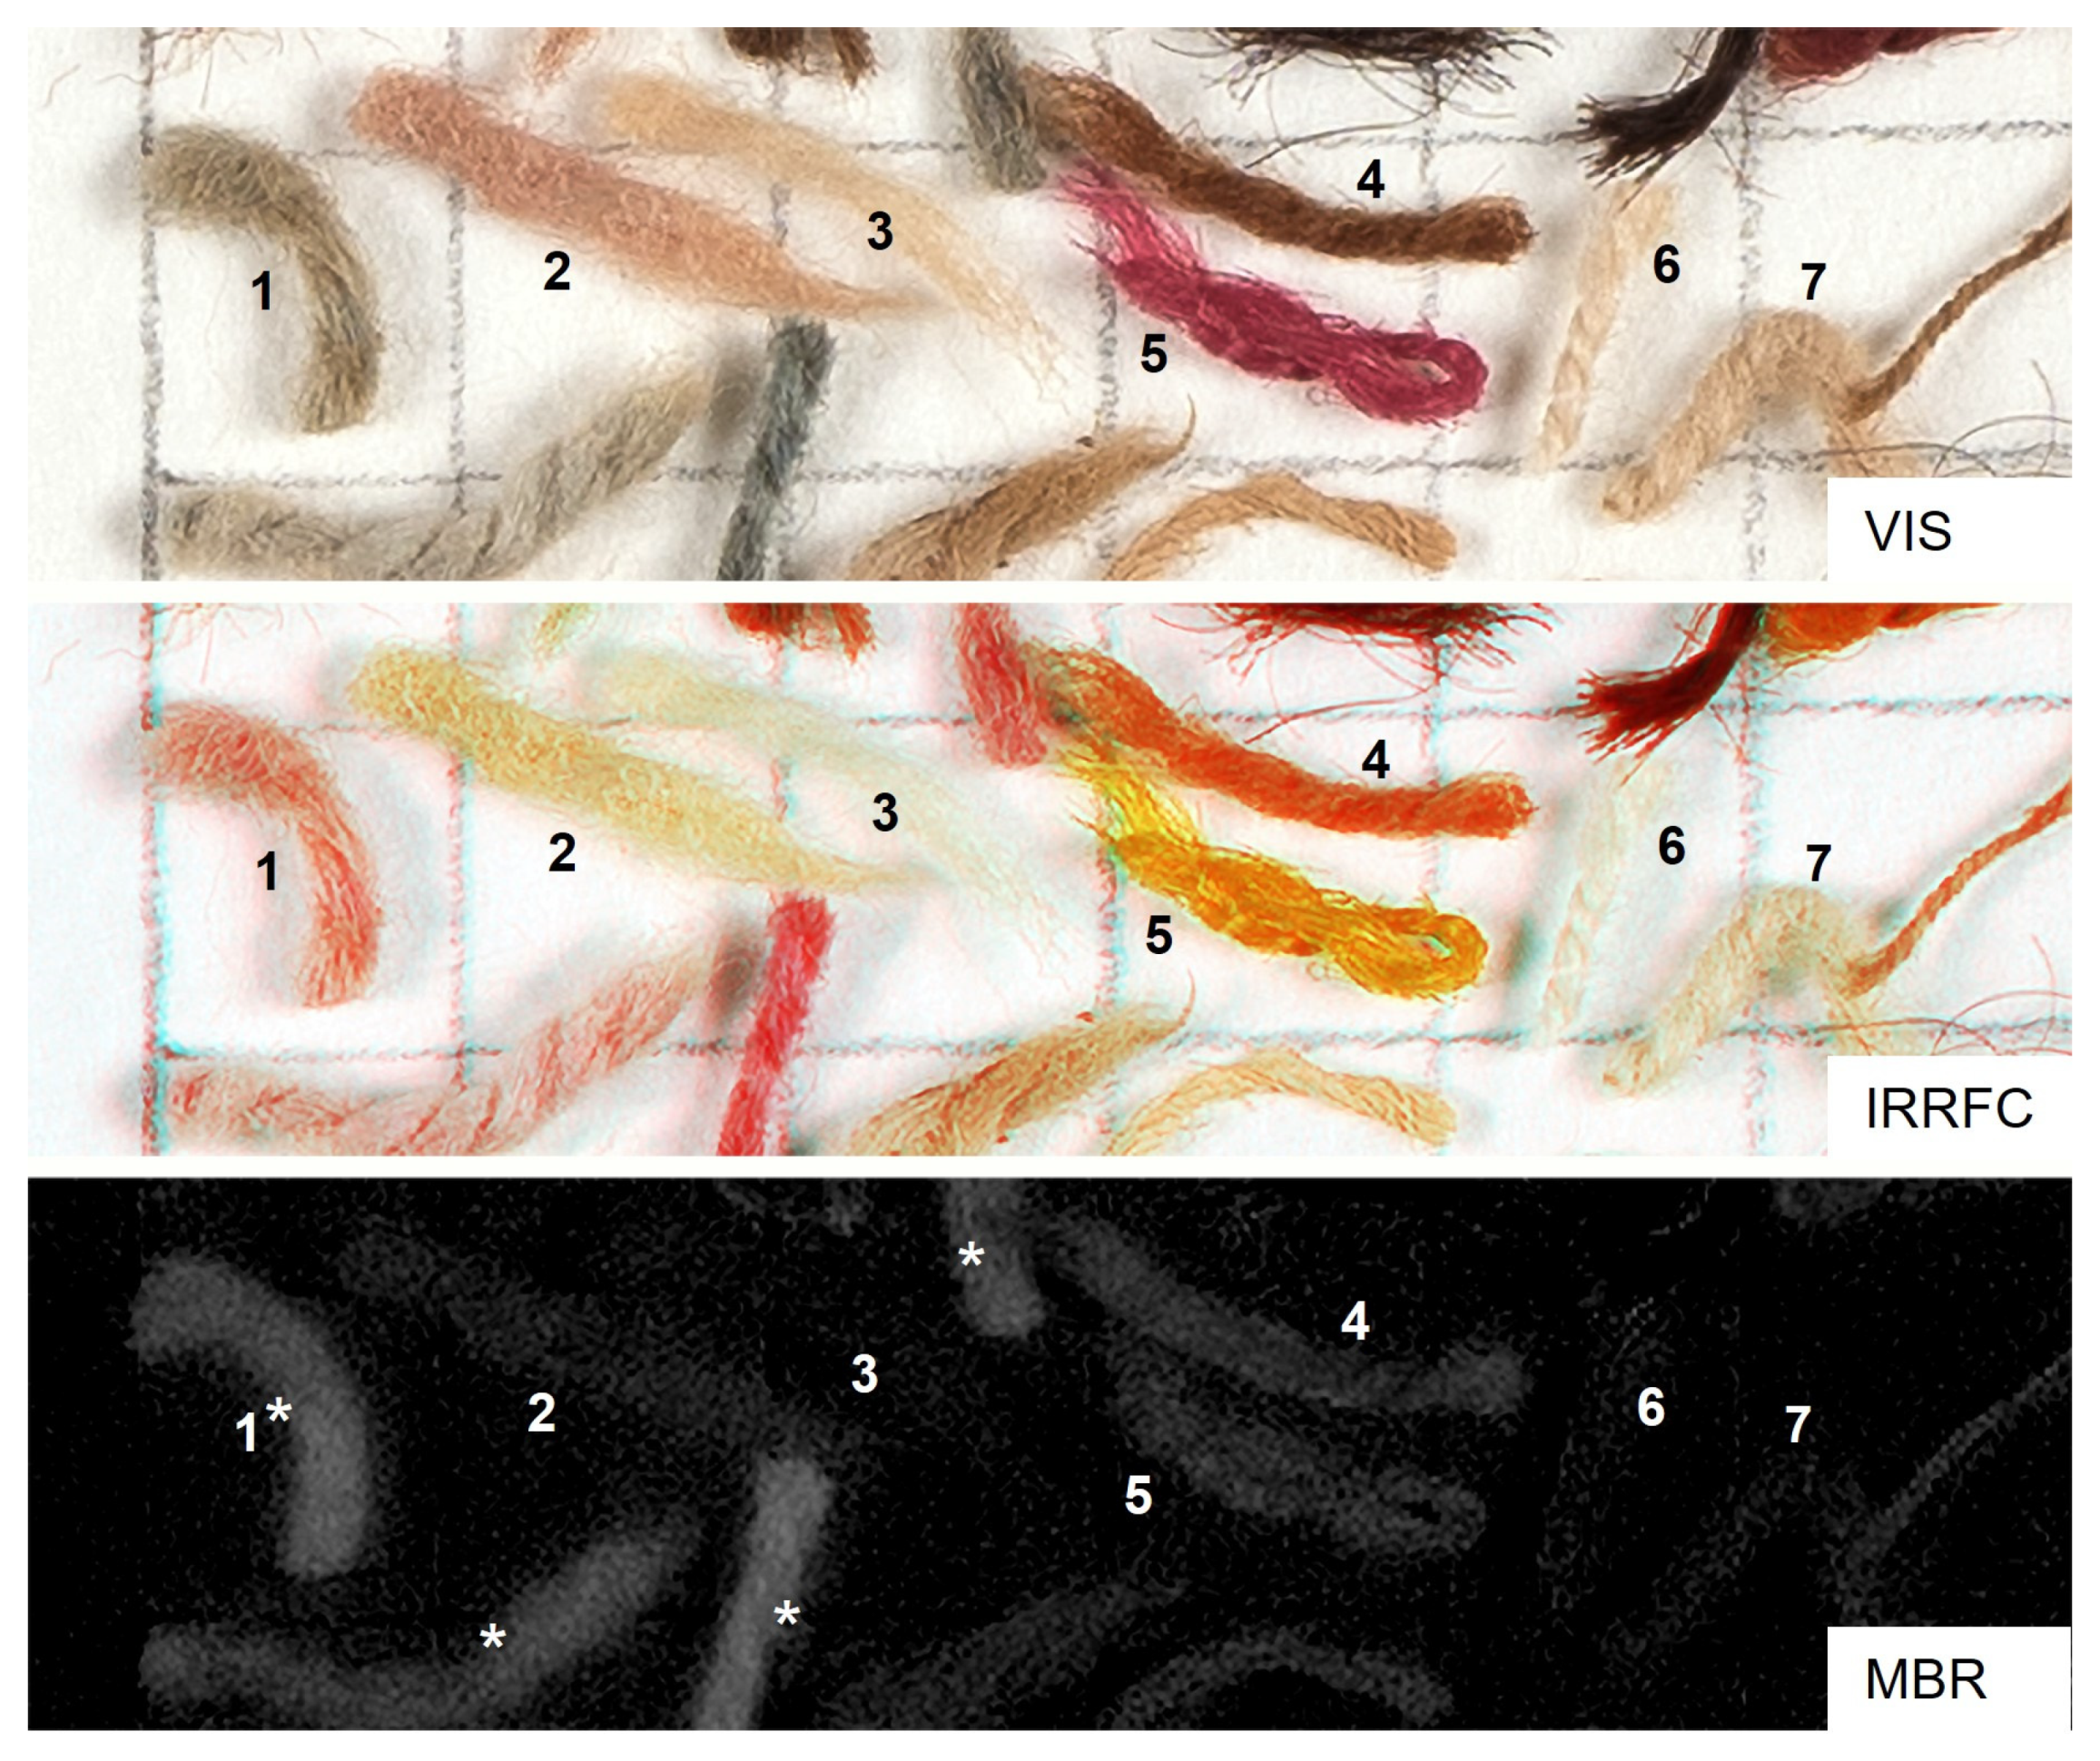
7.1. Multiband Imaging
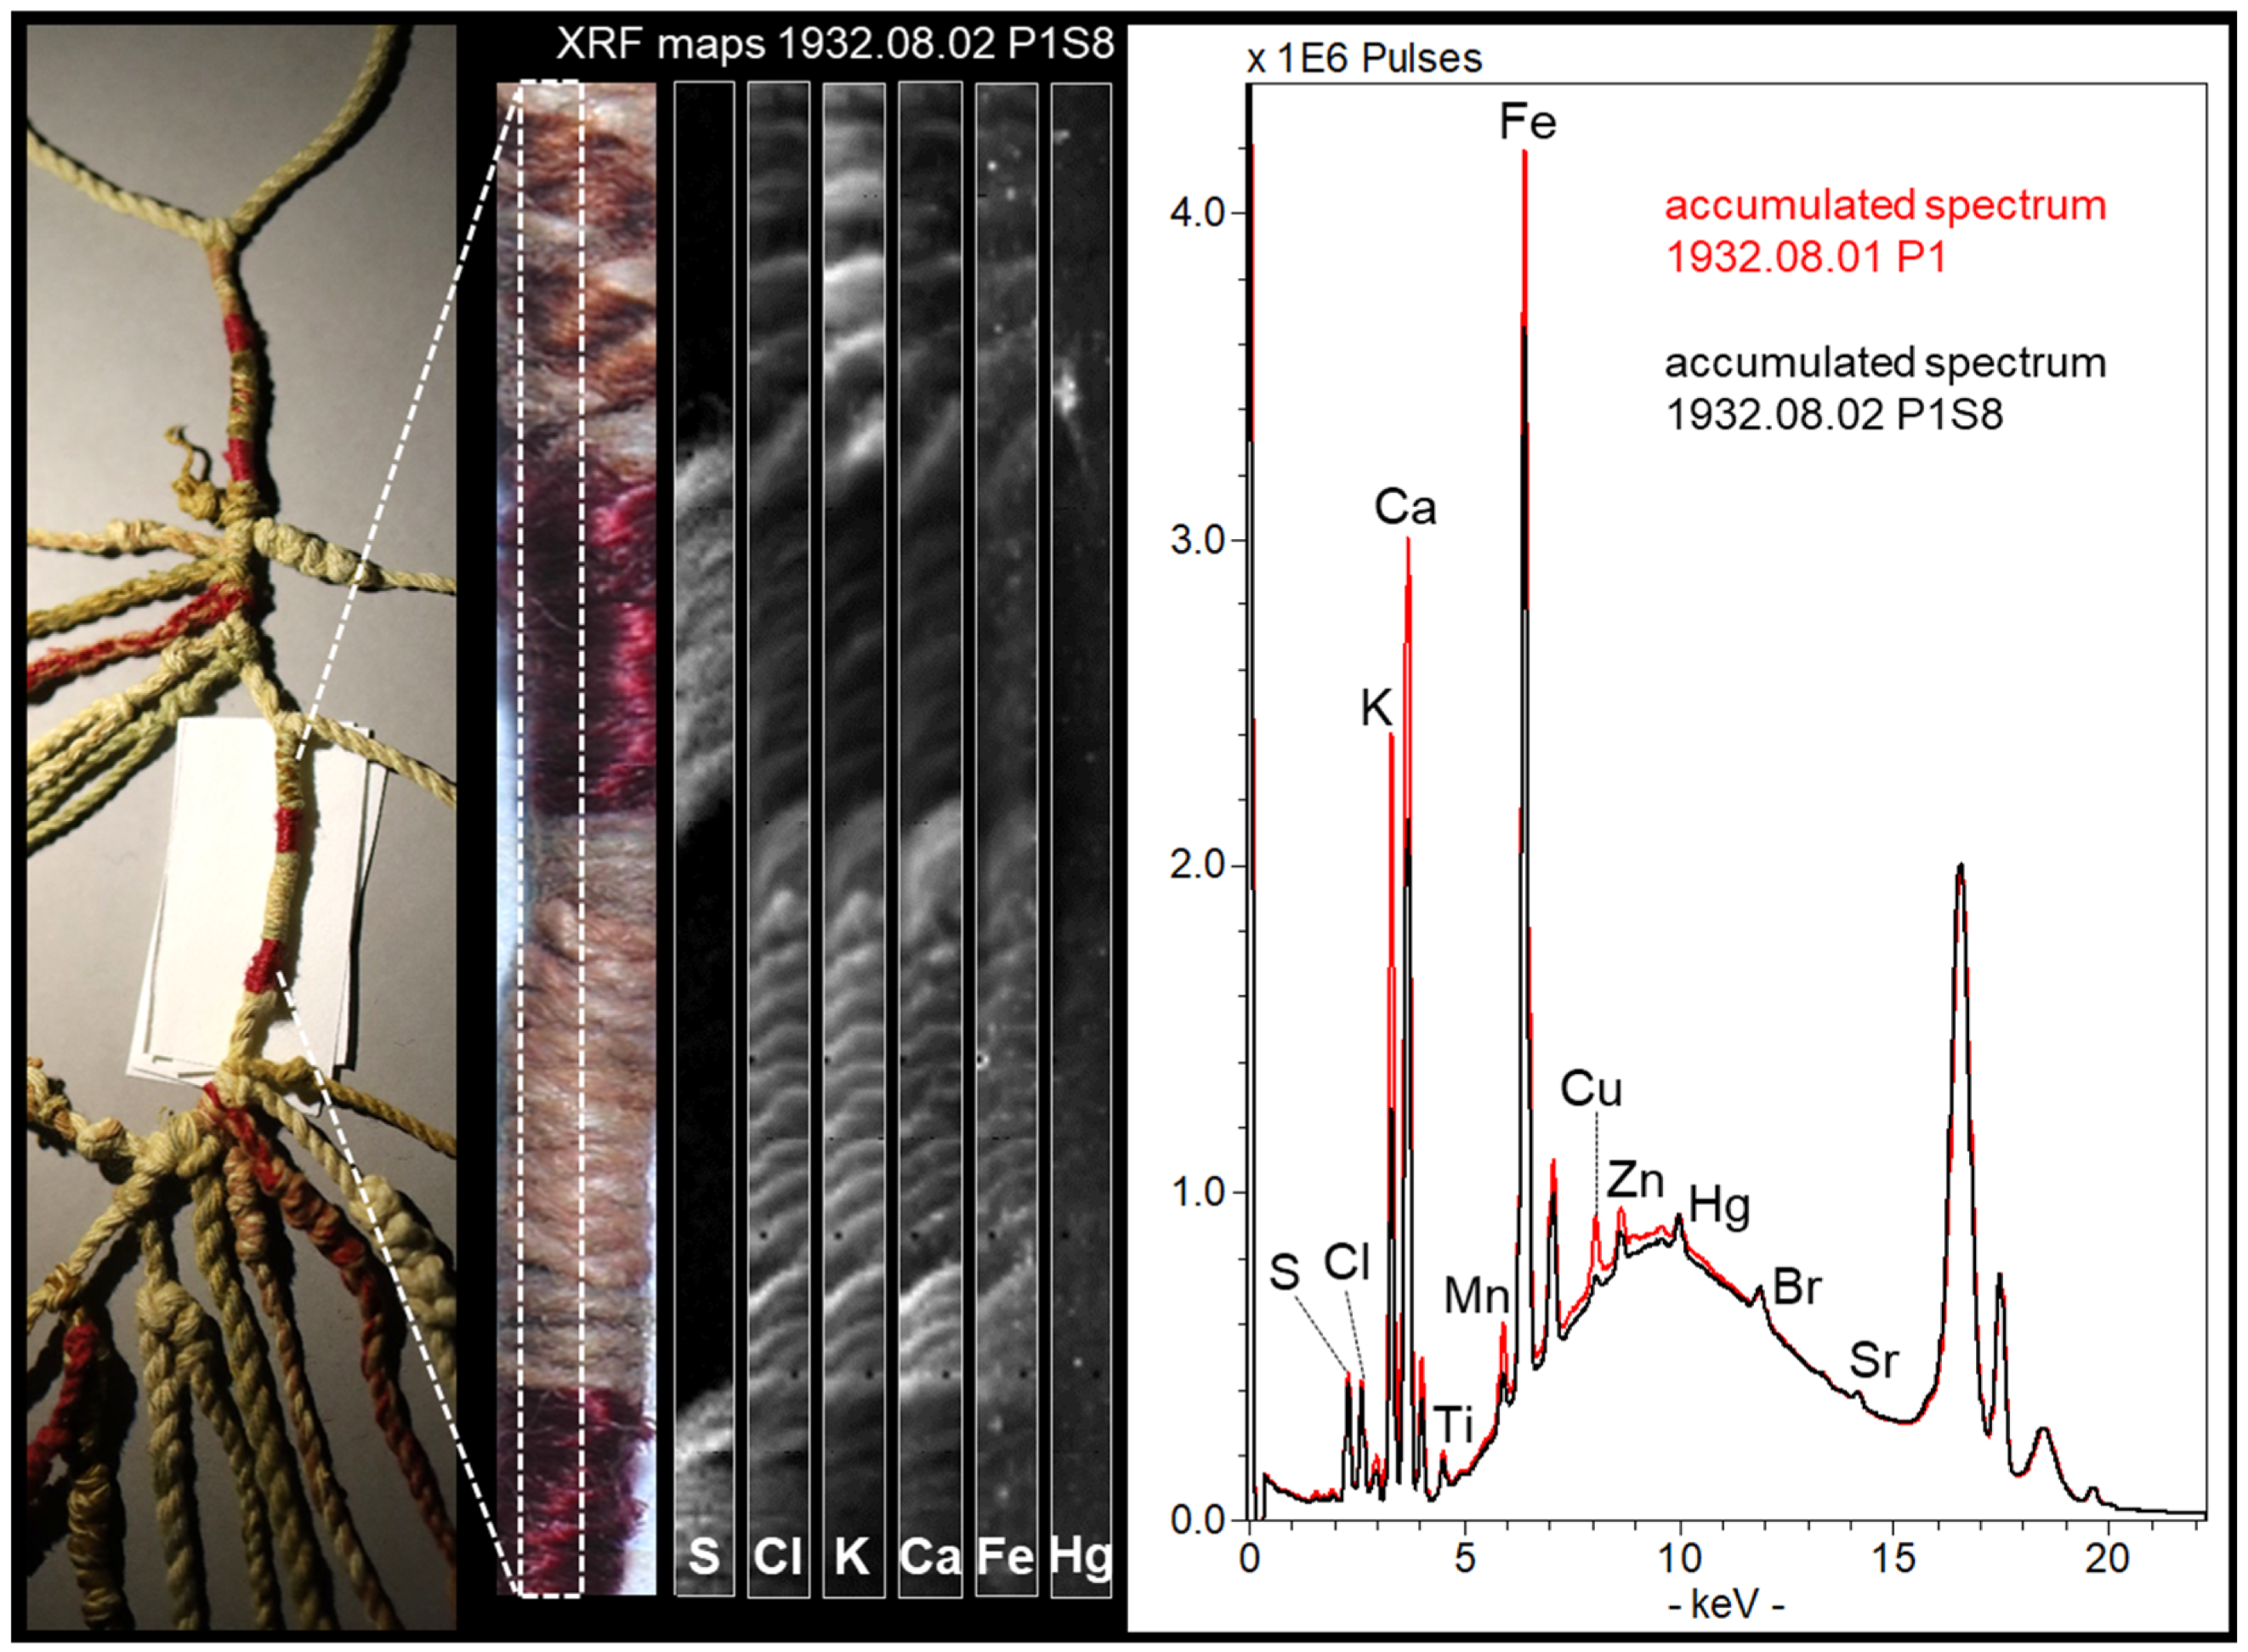
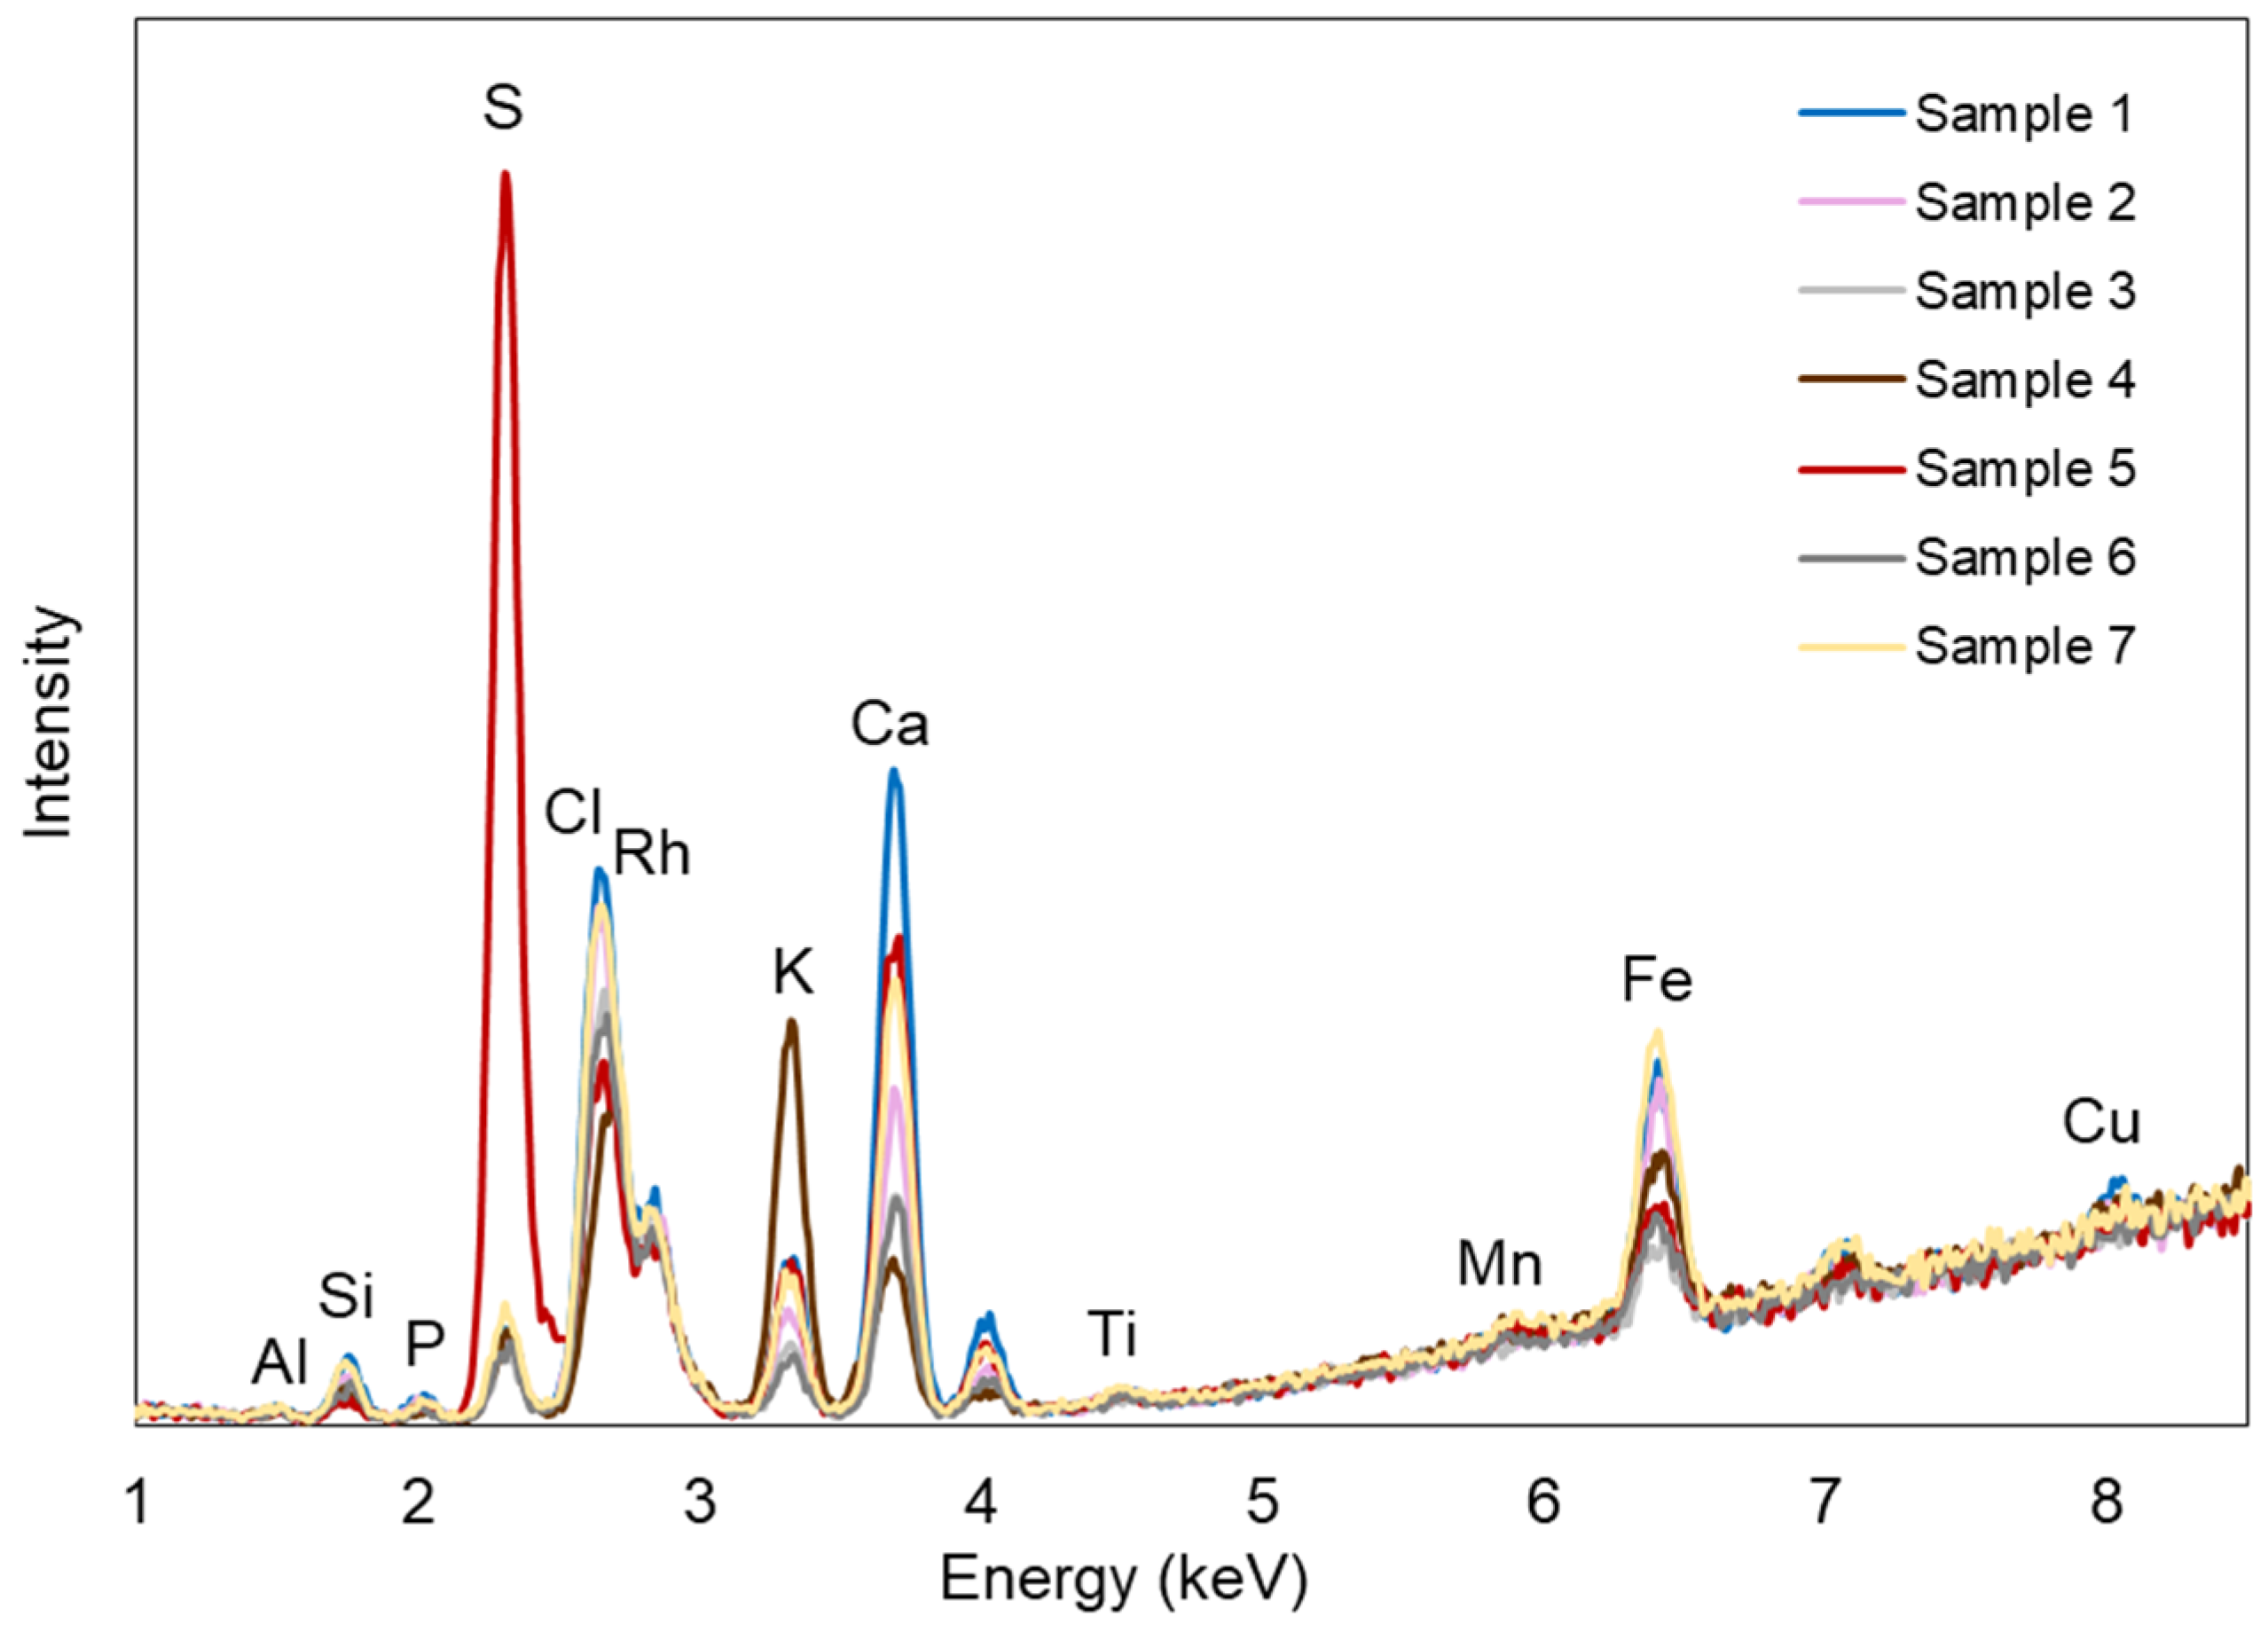
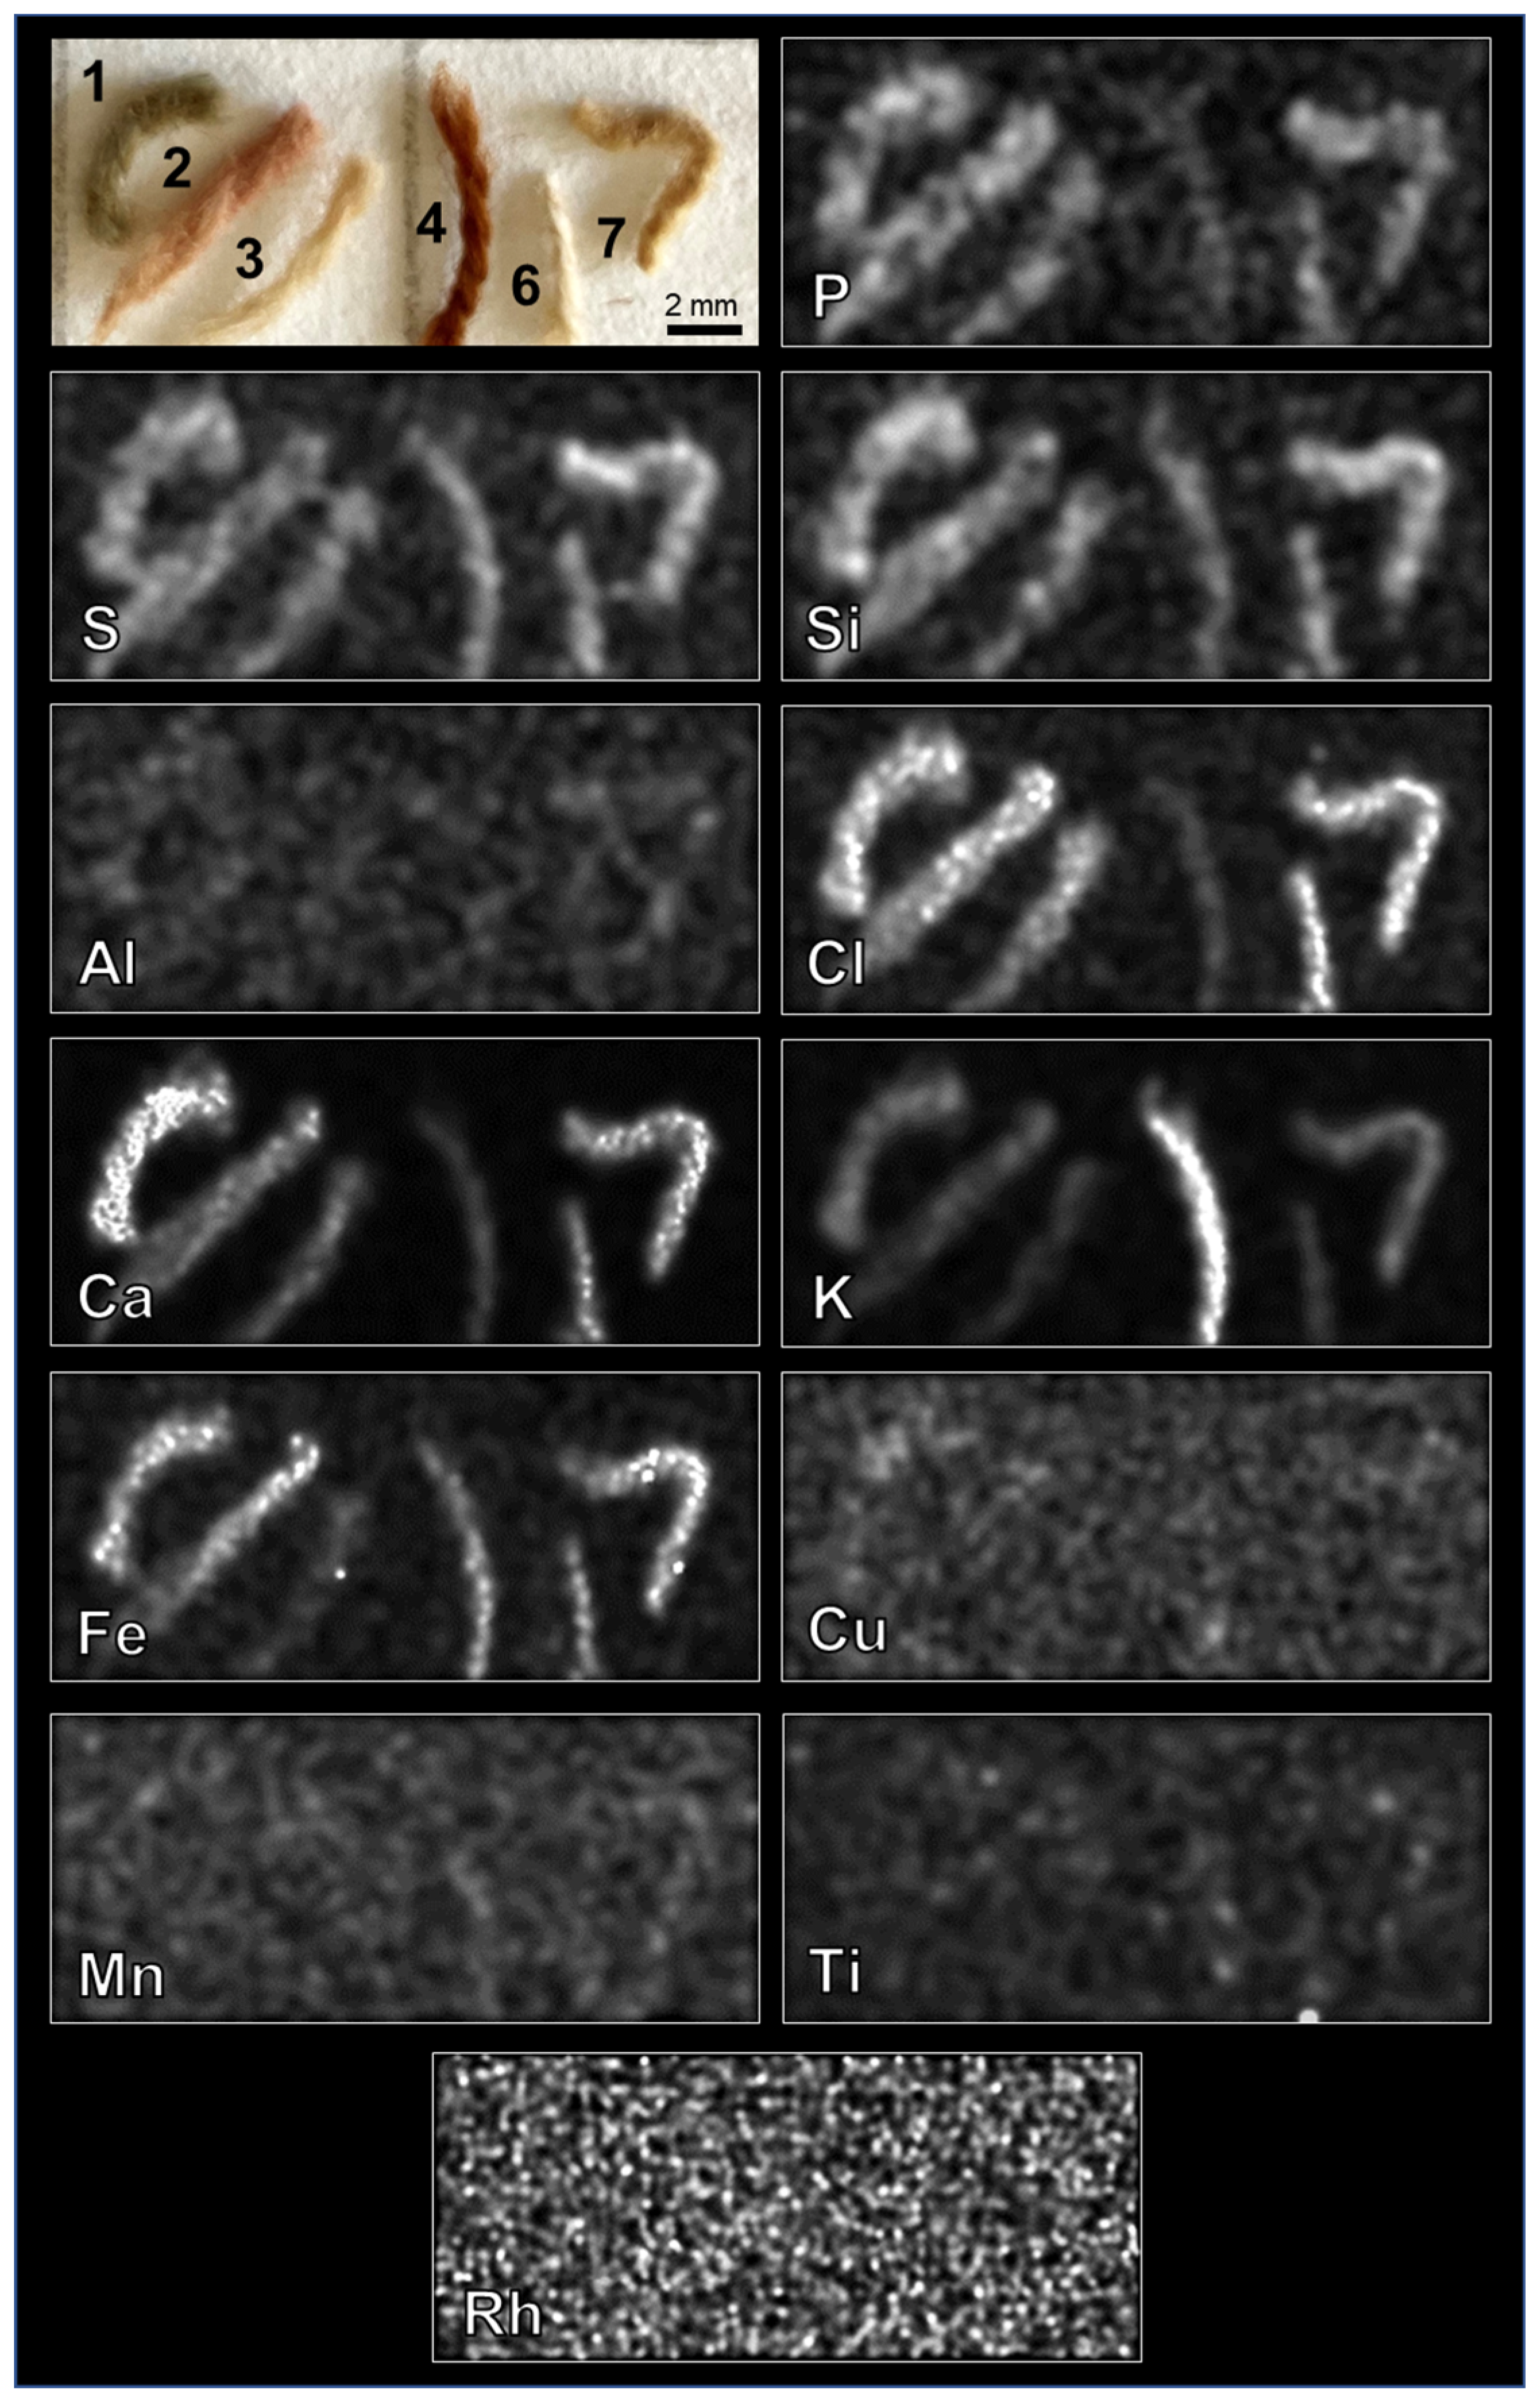
7.2. XRF
7.3. HPLC–HRMS
8. Results and Discussion
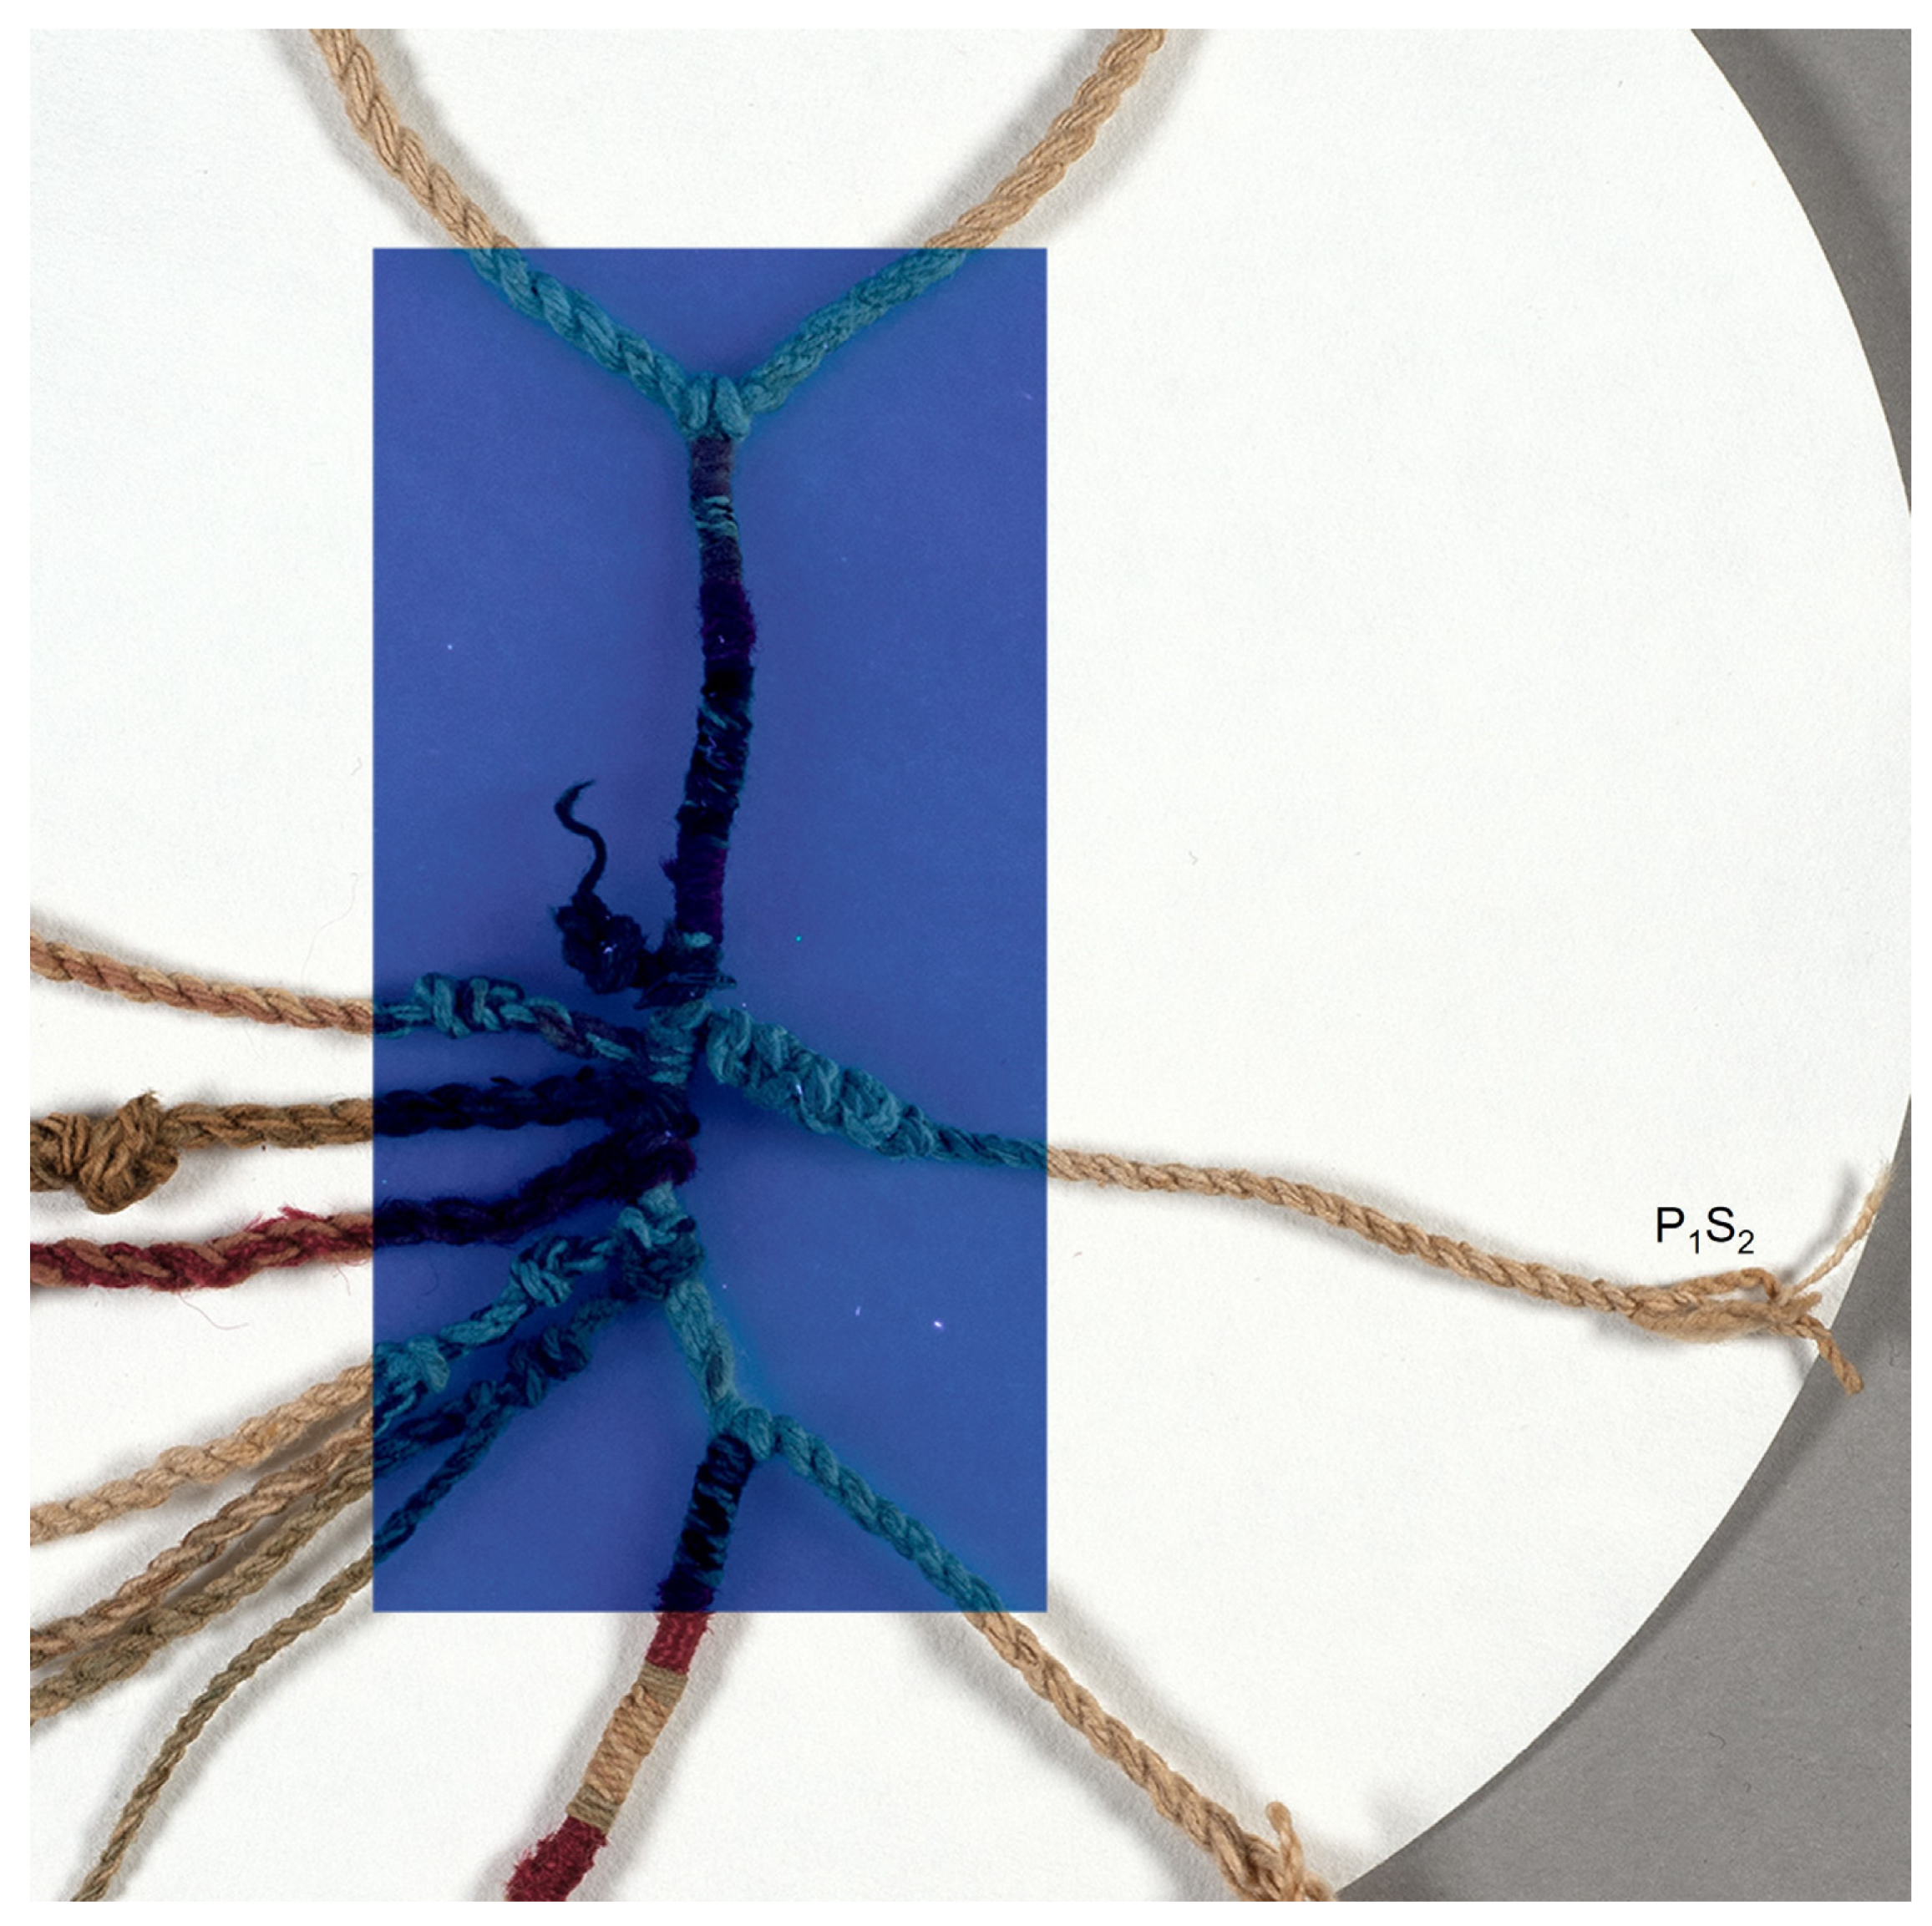
8.1. Multiband Imaging
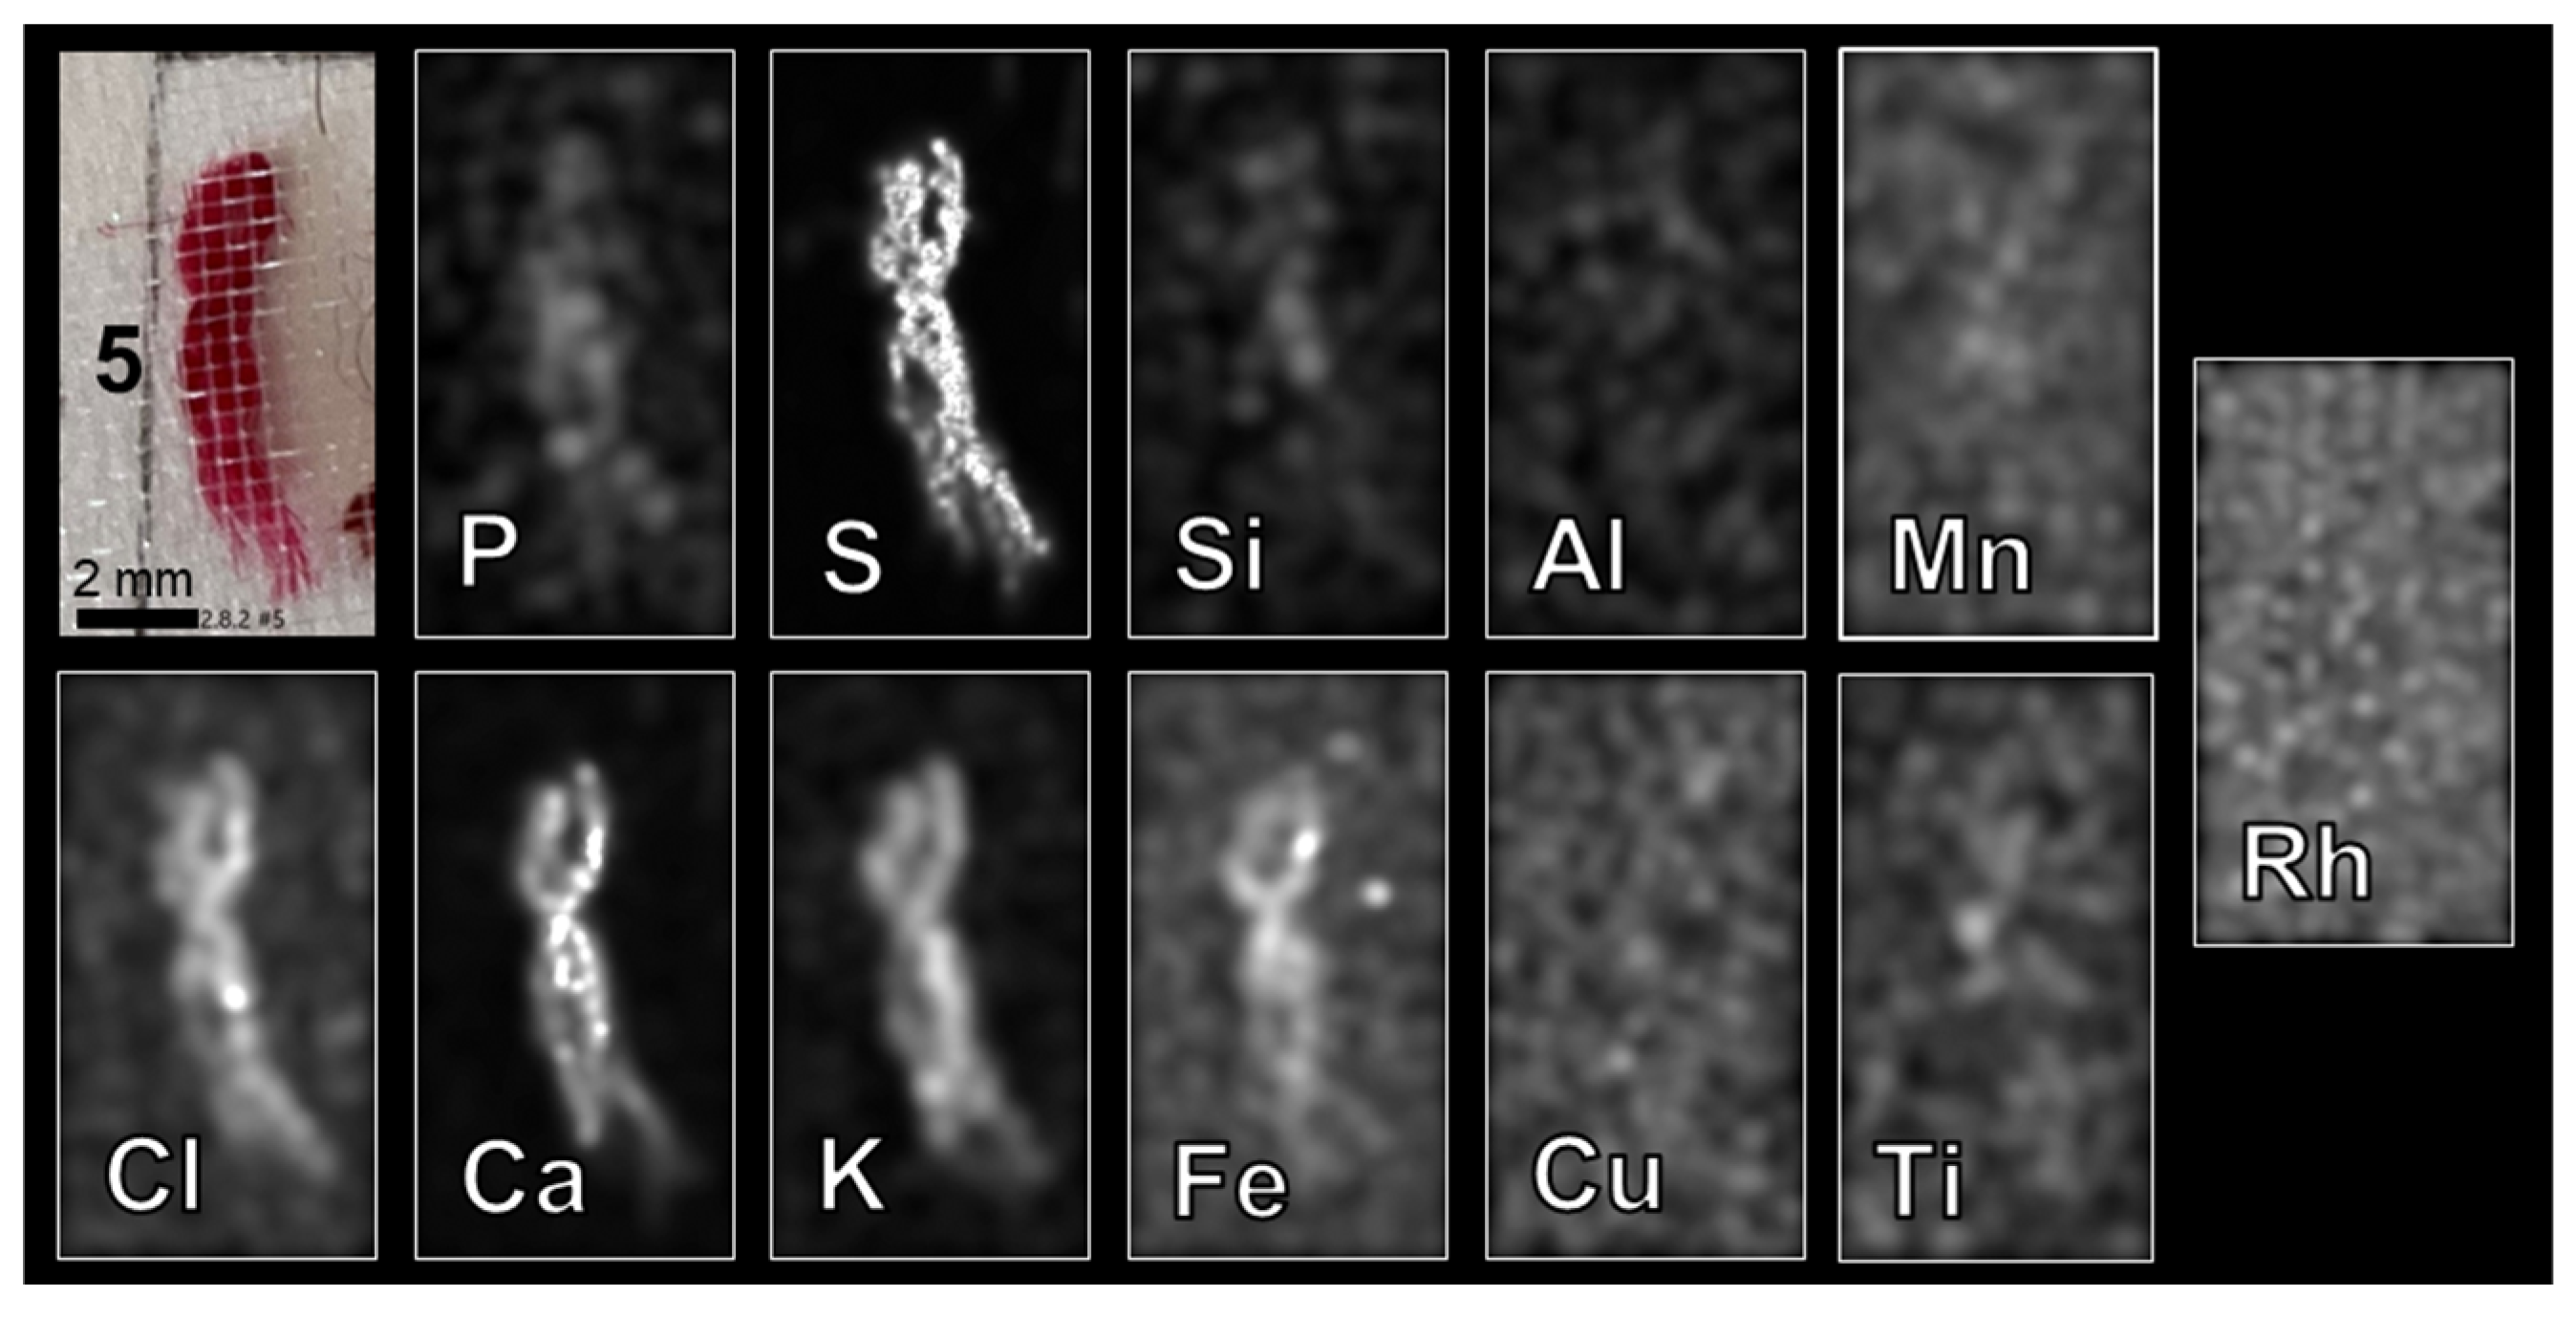
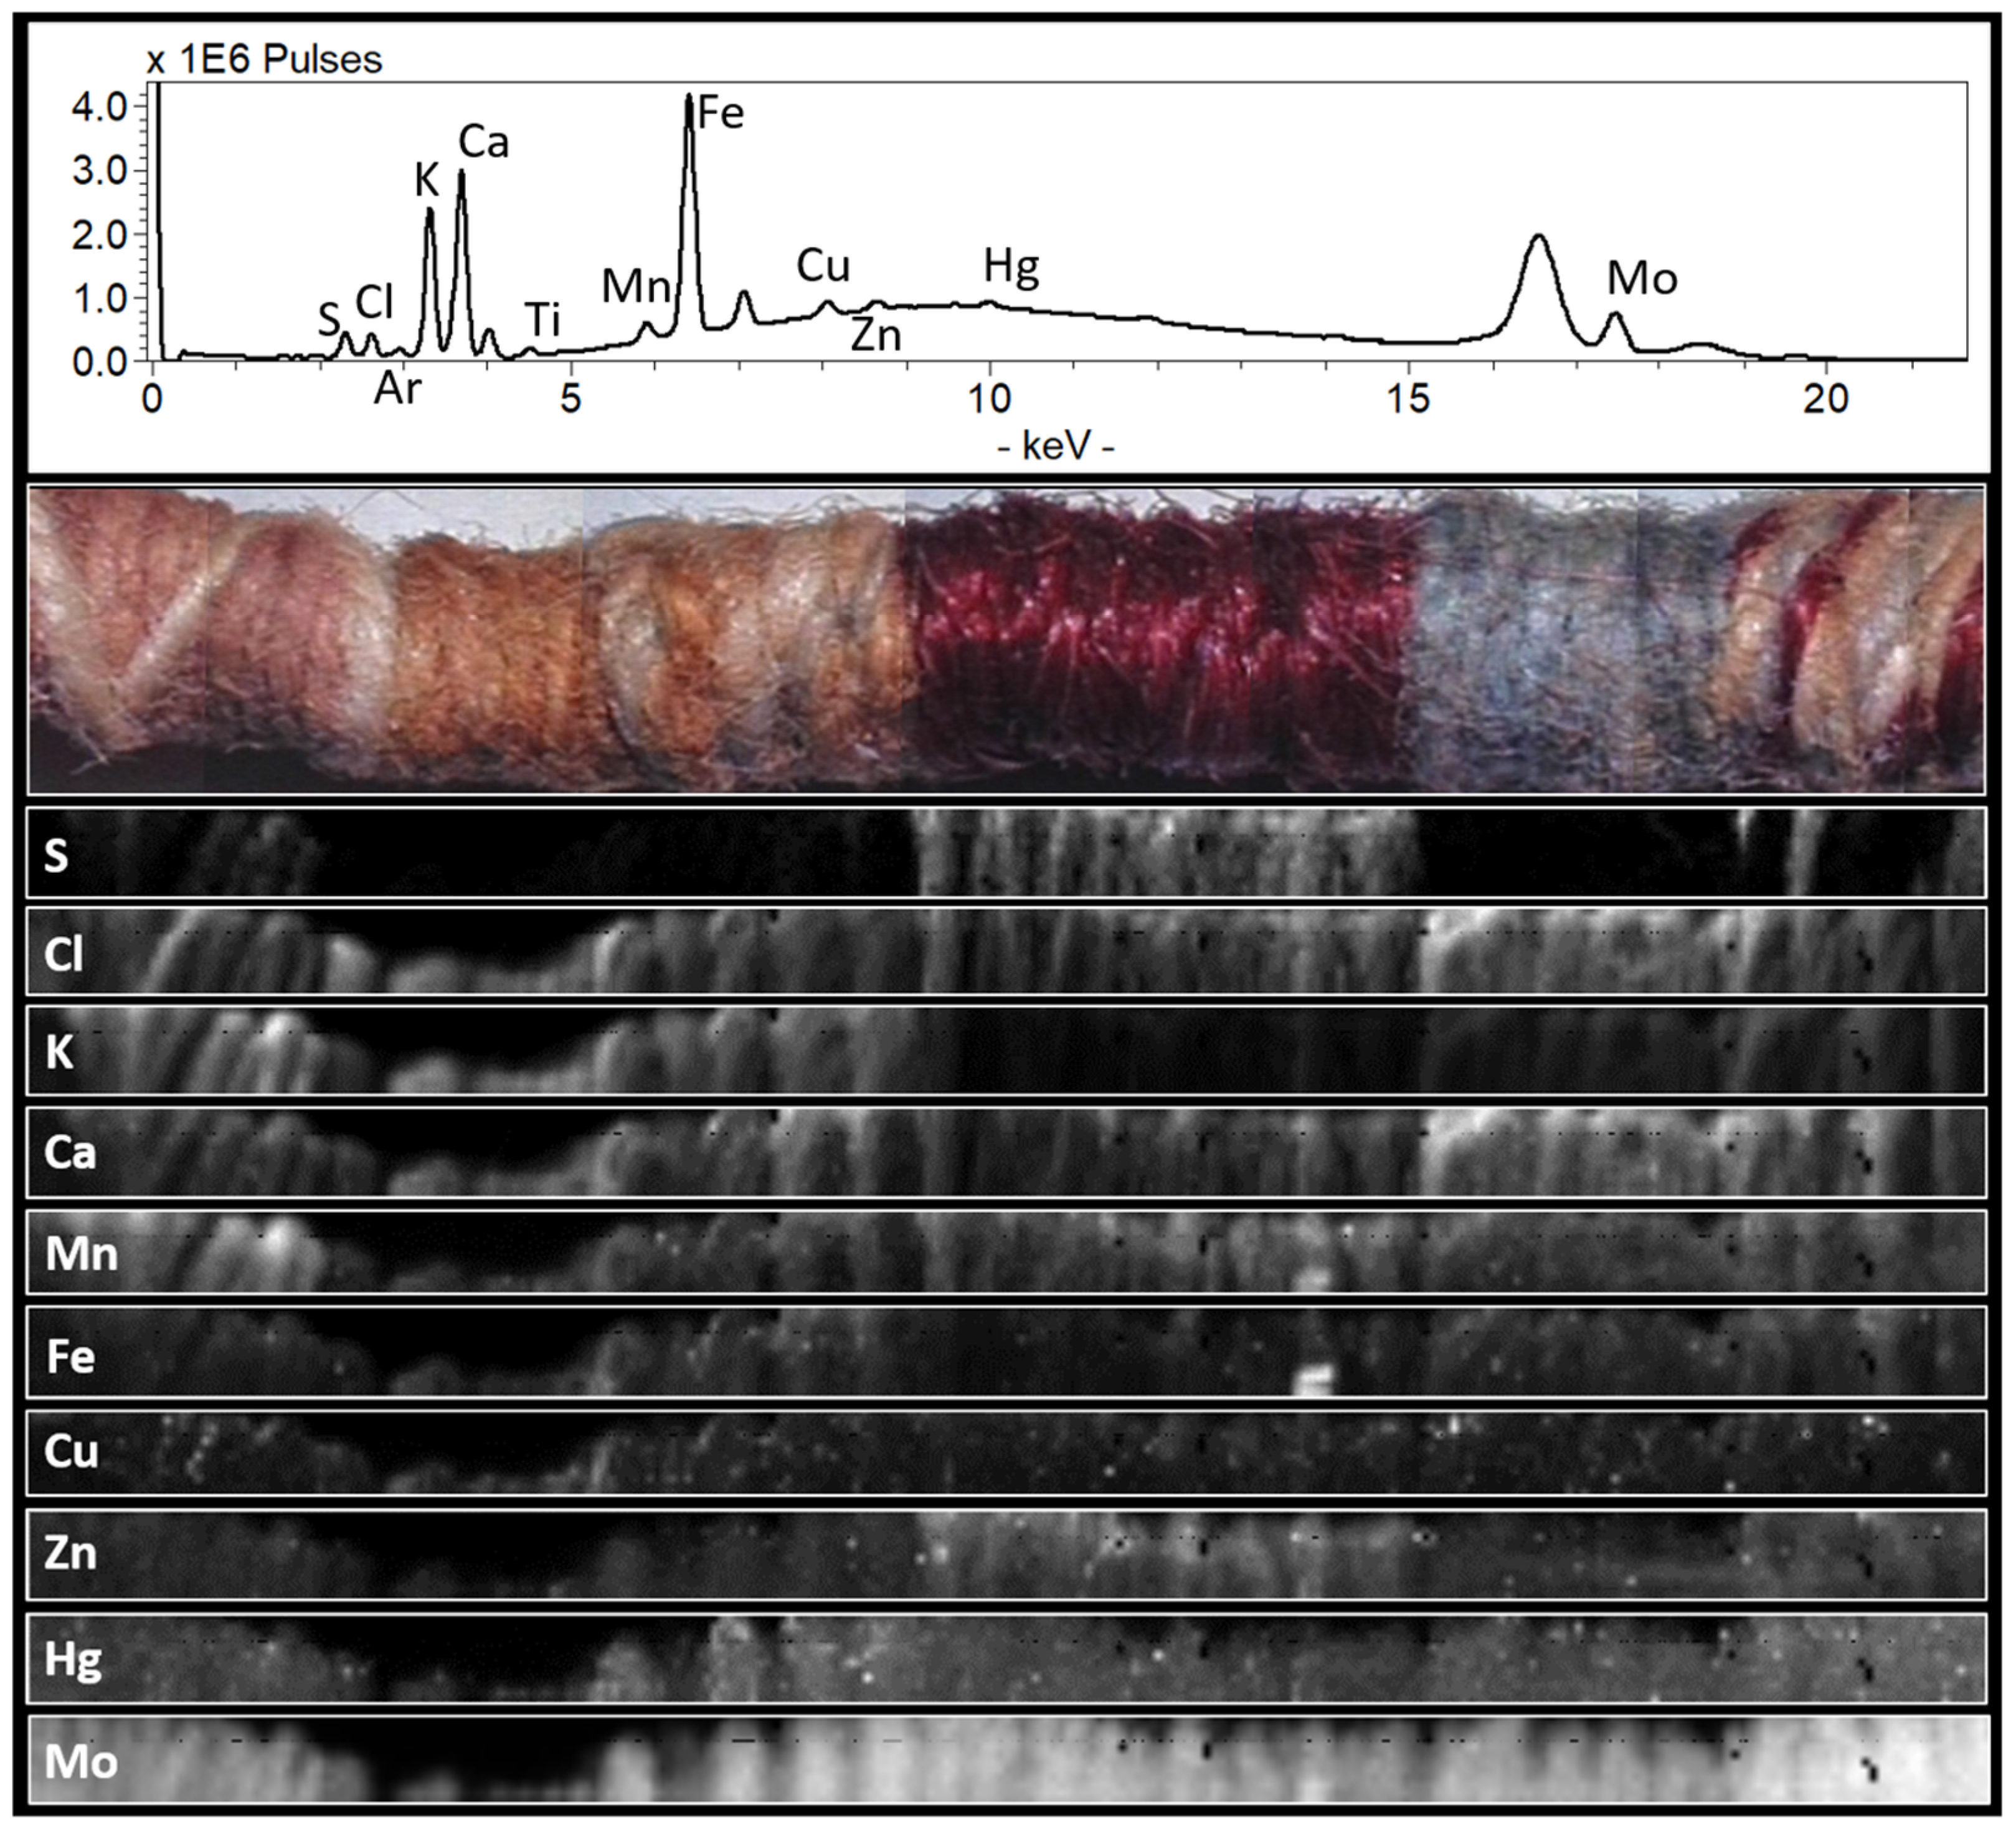
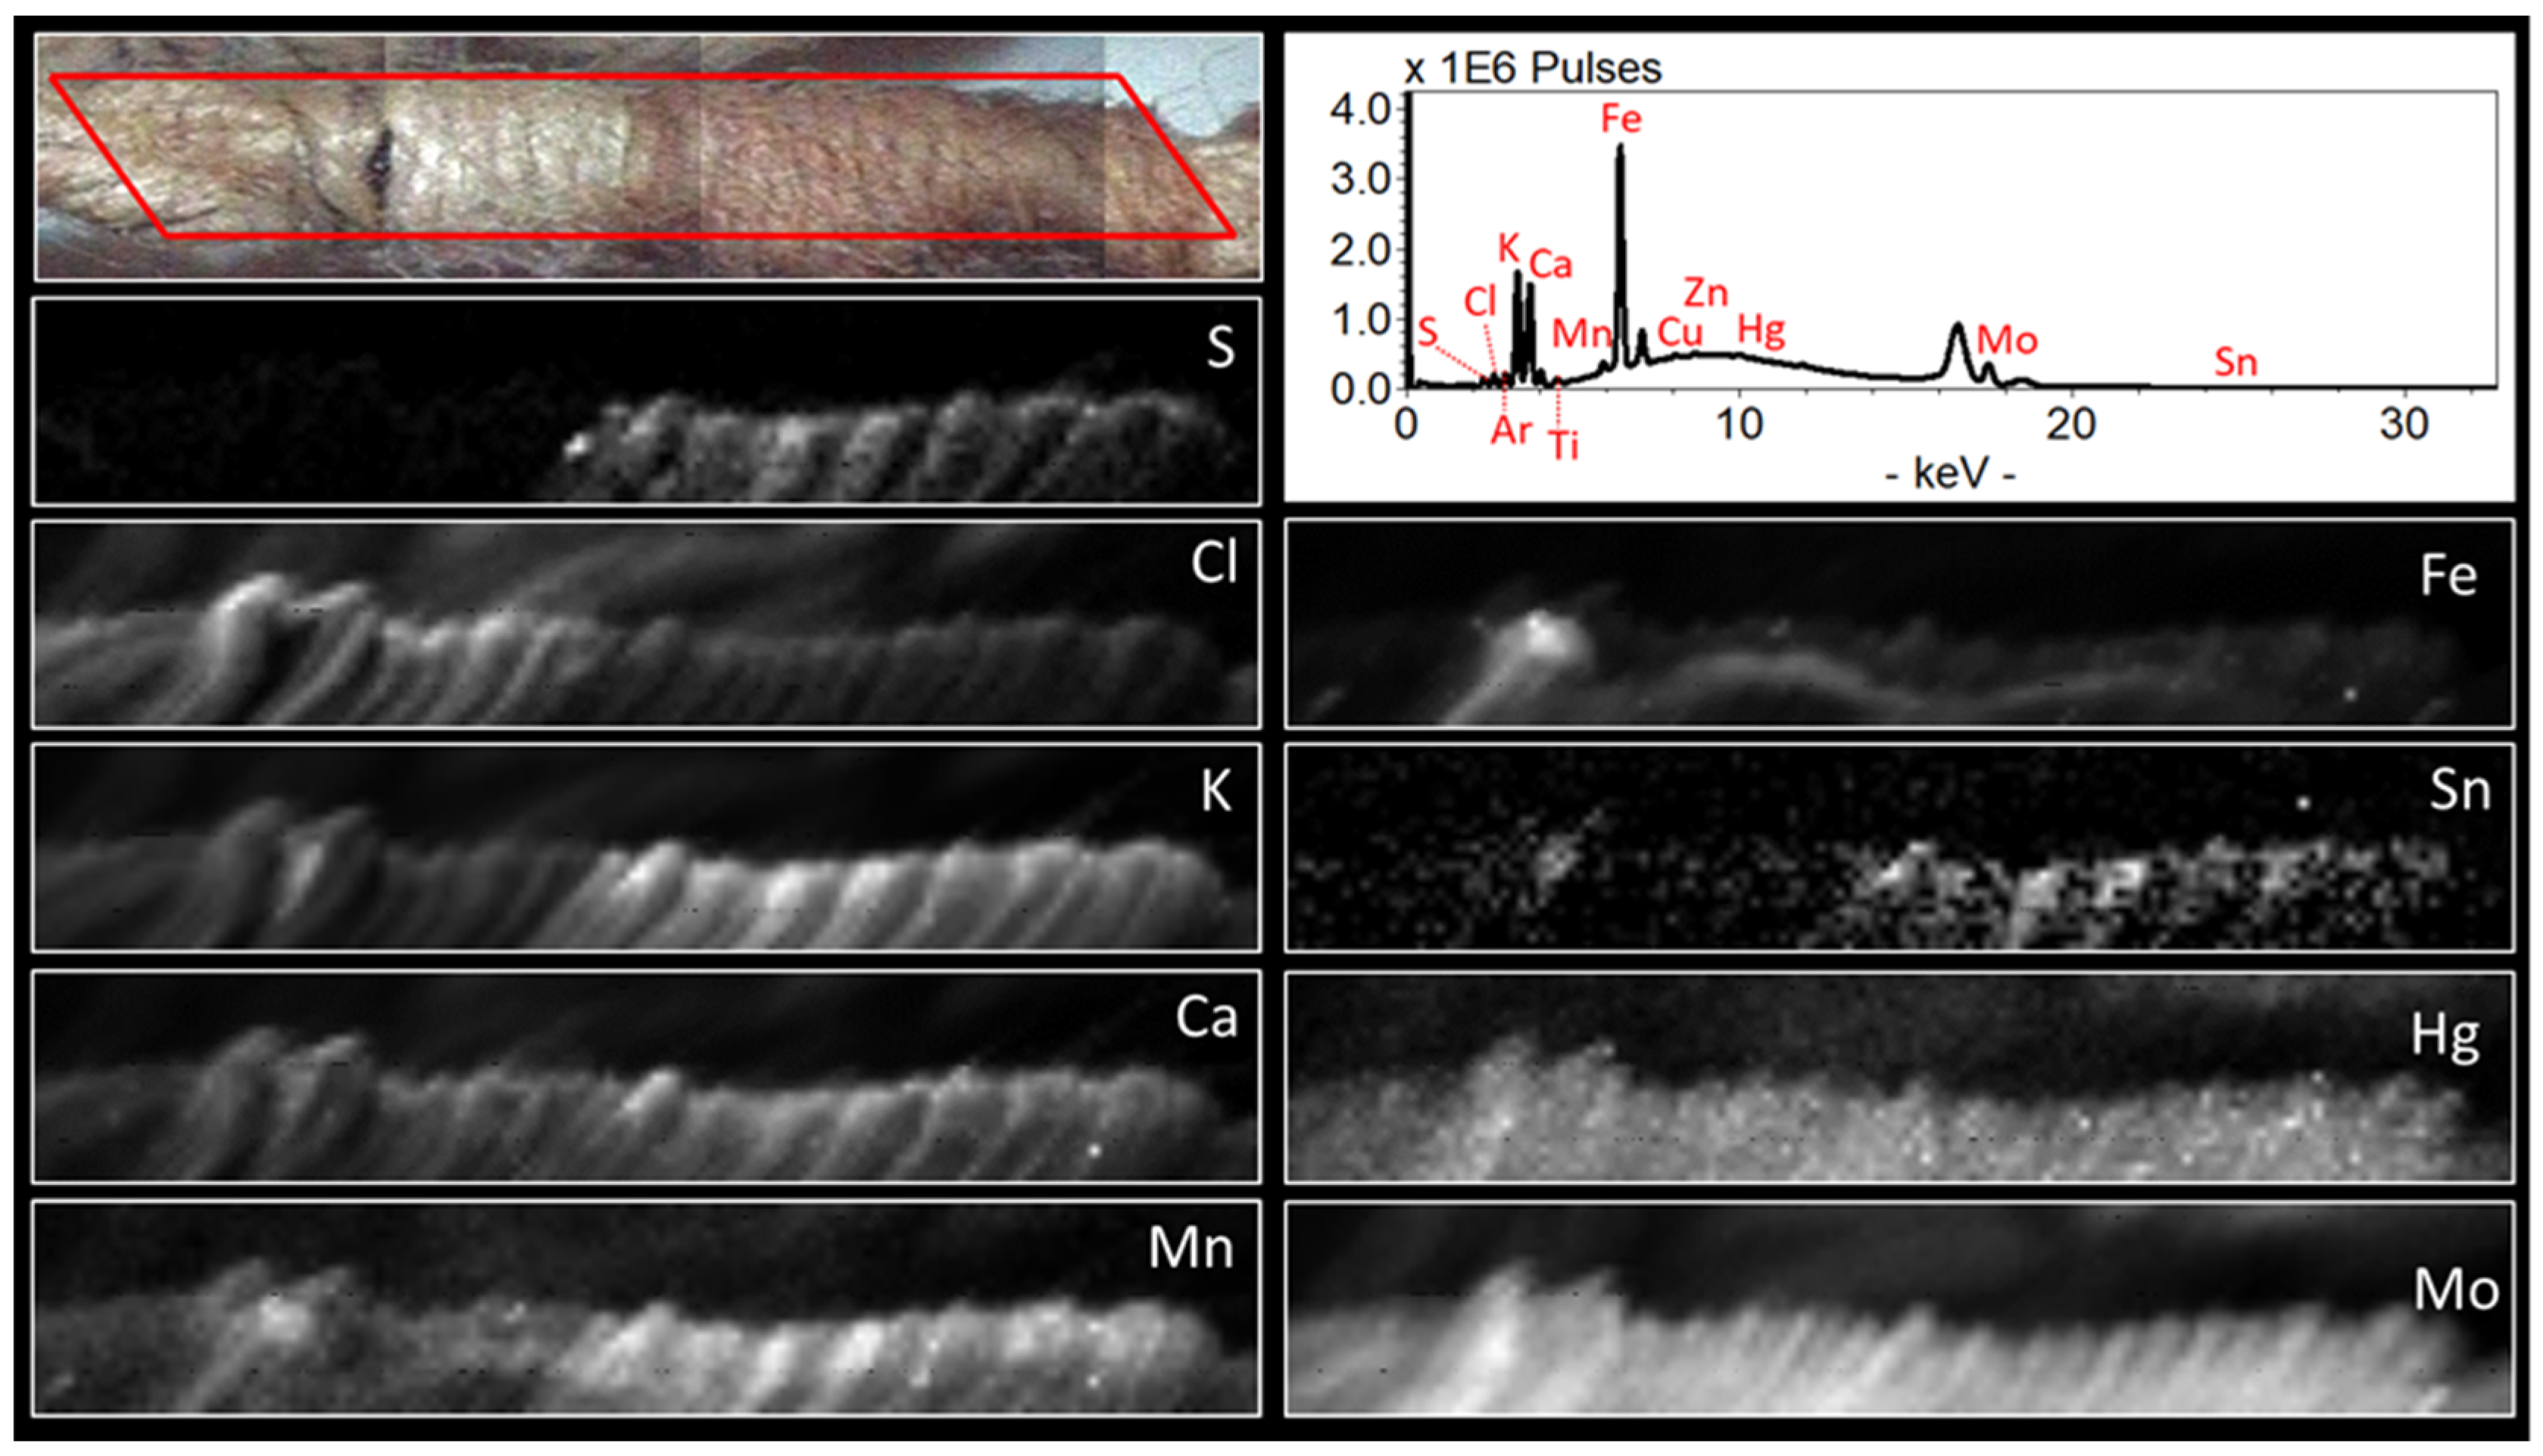
8.2. Analysis of the Inorganic Components
8.2.1. Aluminium
8.2.2. Silicon and Phosphorus
8.2.3. Sulphur
8.2.4. Chlorine
8.2.5. Potassium
8.2.6. Titanium
8.2.7. Iron and Manganese
8.2.8. Copper and Zinc
8.2.9. Mercury
8.2.10. Tin
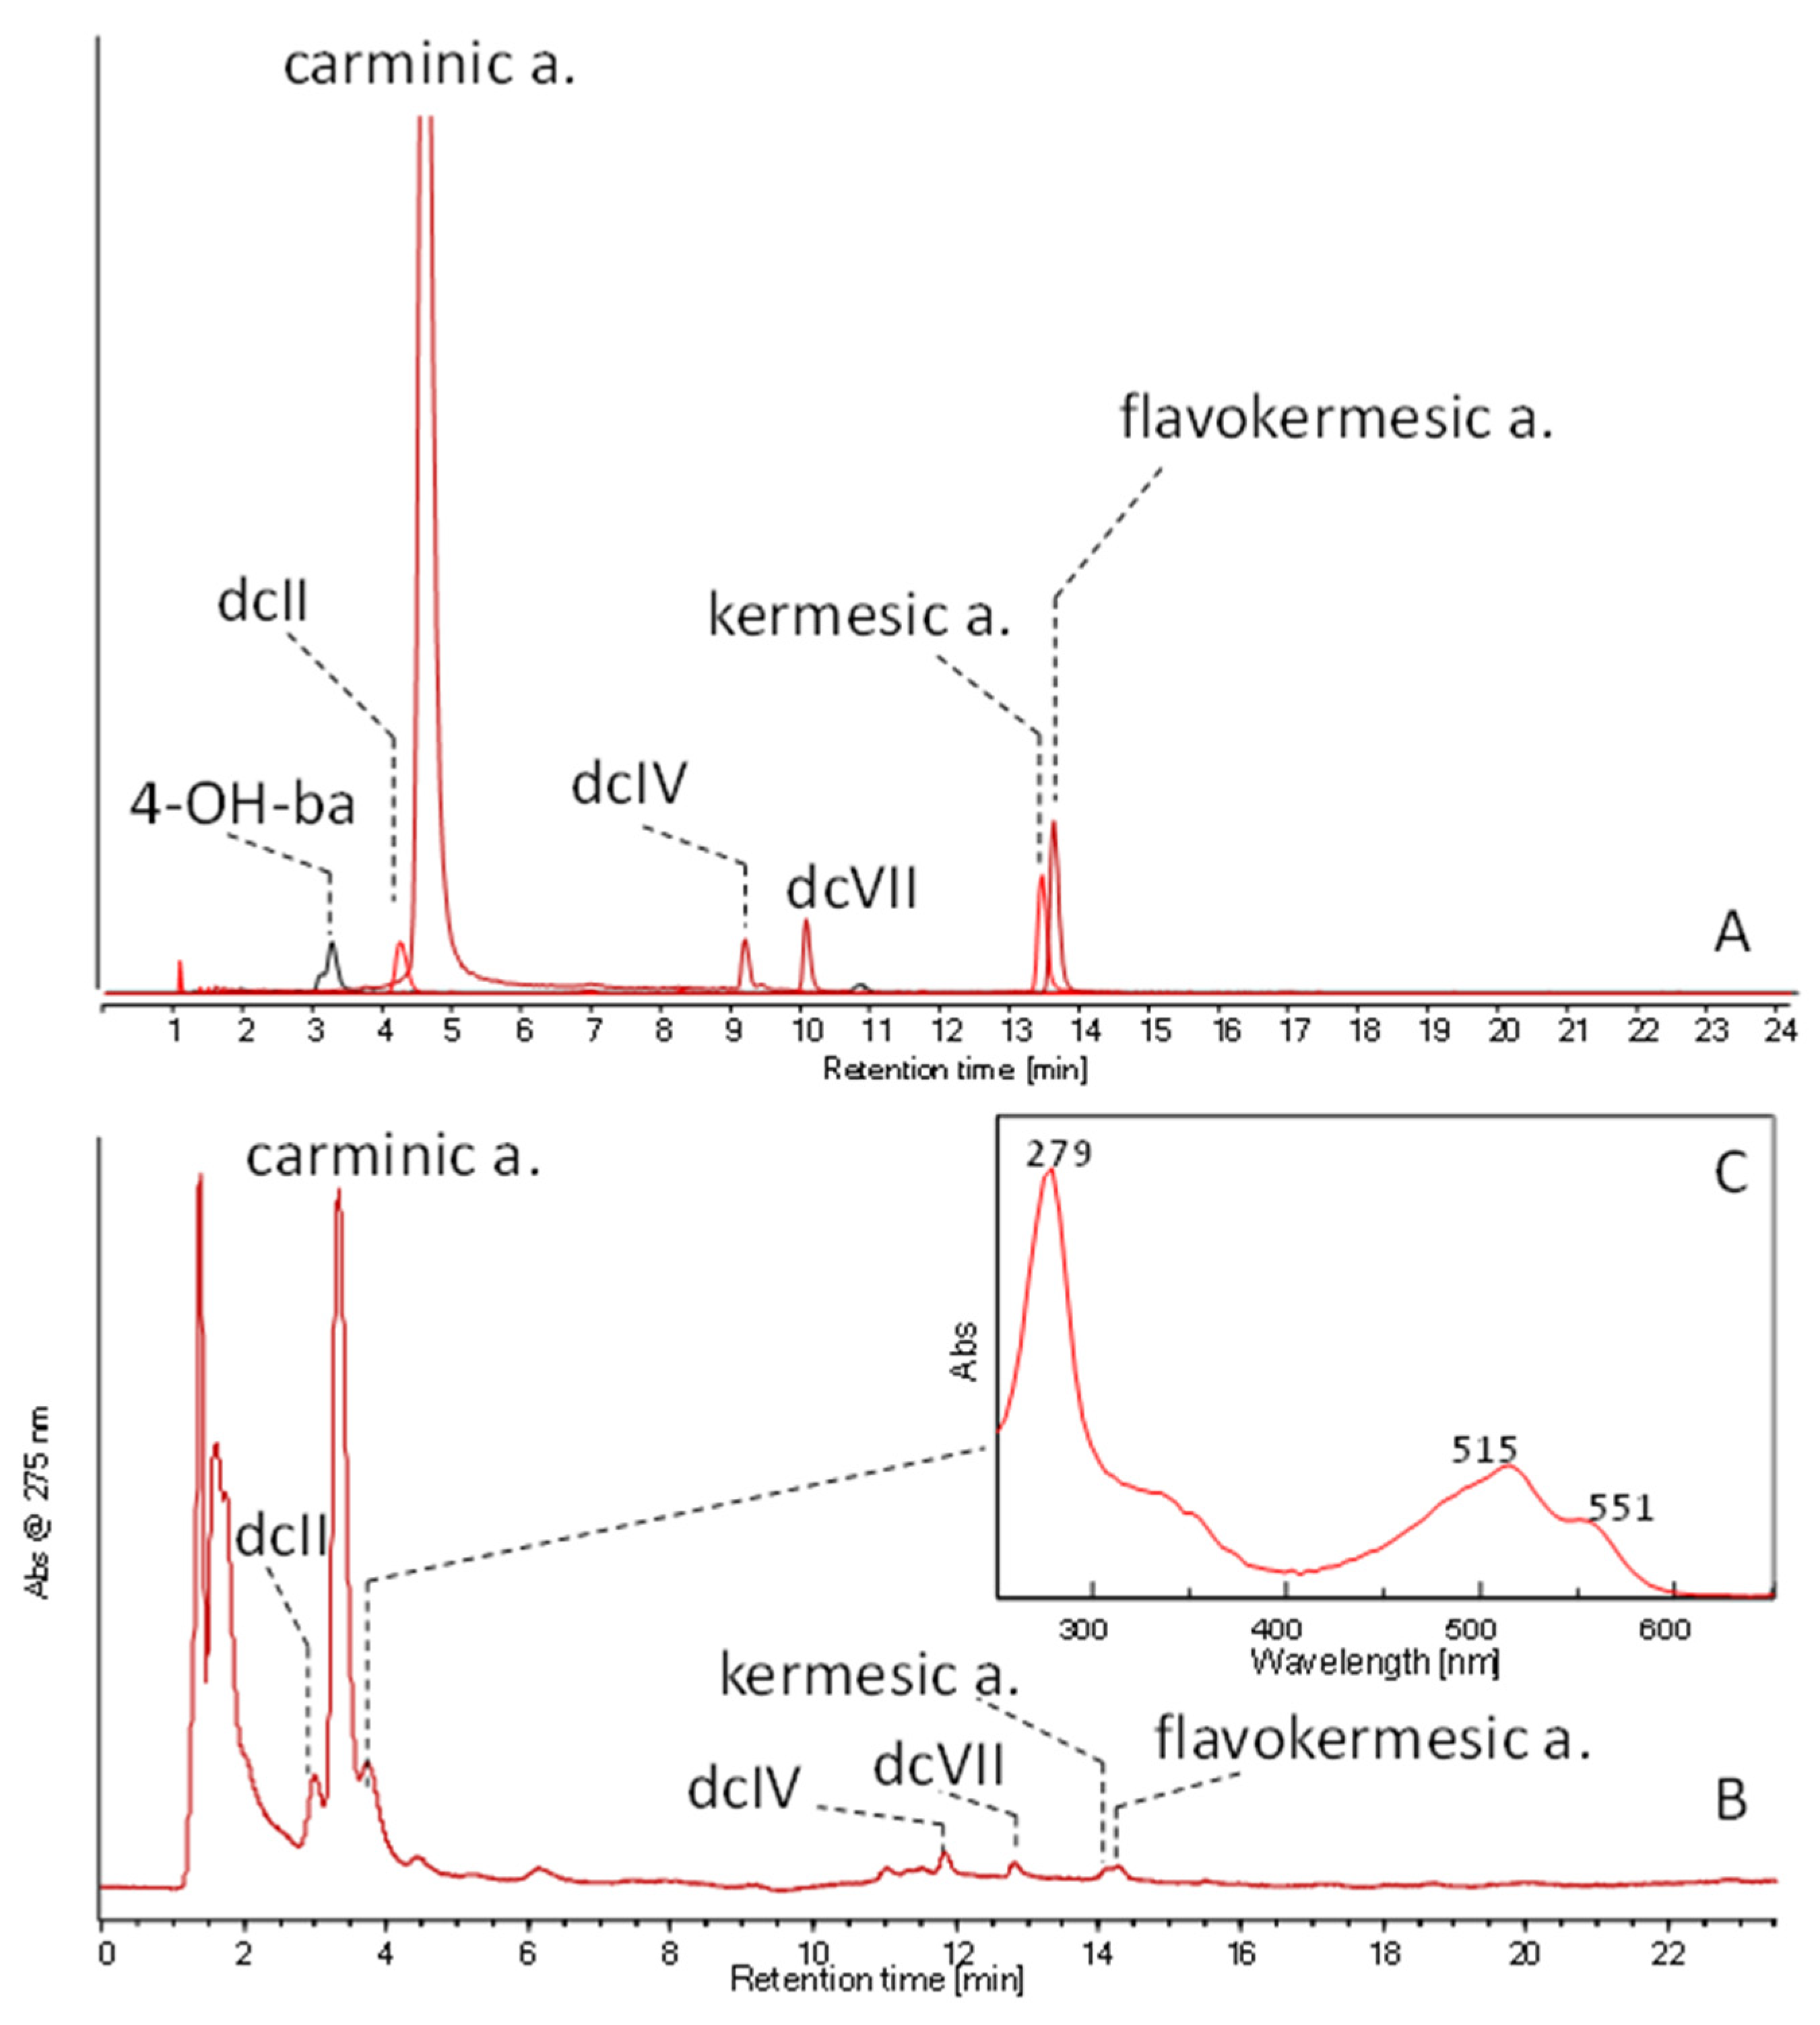
8.3. Analysis of the Organic Dyes
9. Conclusions
Supplementary Materials
Author Contributions
Funding
Institutional Review Board Statement
Informed Consent Statement
Data Availability Statement
Conflicts of Interest
References
- Urton, G. Inka History in Knots: Reading Khipus as Primary Sources; University of Texas Press: Austin, TX, USA, 2017. [Google Scholar]
- Palma, R. Sistema decimal entre los antiguos peruanos. In Mis Últimas Tradiciones Peruanas y Cachivachería; Casa Editorial Maucci: Barcelona, Spain, 1906. [Google Scholar]
- Locke, L. The Ancient Quipu, a Peruvian Knot Record. Am. Anthropol. 1912, 14, 325–332. [Google Scholar] [CrossRef]
- Hyland, S. Knot anomalies in a Late Horizon khipu. In Proceedings of the IX Jornadas Internacionales de Textiles Precolombinos y Amerindianos de Milán, Milan, Italy, 9–22 October 2022. [Google Scholar]
- Cieza de León, P.d. Segunda Parte de la Cronica del Peru; Imprenda de Manuel Gines Hernandez: Madrid, Spain, 1880. [Google Scholar]
- Acosta, J.d. Historia Natural y Moral de las Indias; Emprenta Iayme Cendrat: Barcelona, Spain, 1591. [Google Scholar]
- De Murua, M. Historia General del Peru; Historia 16; Biblioteca Virtual Miguel de Cervantes: Madrid, Spain, 1987. [Google Scholar]
- De la Calancha, A. Cronica Moralizada del Orden de San Agustin en el Peru; Pedro Lacavalleria en la calle de la Libreria: Barcellona, Spain, 1638. [Google Scholar]
- Medrano, M. Quipus: Mil Años de Historia Anudada en los Andes y su Futuro Digital; Planeta Perú: Lima, Peru, 2021. [Google Scholar]
- Hyland, S. How Khipus indicated labour contributions in an Andean village: An explanation of colour banding, seriation, and ethnocategories. J. Mater. Cult. 2016, 21, 490–509. [Google Scholar] [CrossRef] [Green Version]
- Hyland, S. Ply, Markedness, and Redundancy: New Evidence for How Andean Khipus Encoded Information. Am. Anthropol. 2014, 116, 1–6. [Google Scholar] [CrossRef] [Green Version]
- Urton, G. Signs of the Inka Khipu: Binary Coding in the Andean Knotted-String Records; University of Texas Press: Austin, TX, USA, 2003. [Google Scholar]
- Medrano, M.; Urton, G. Toward the Decipherment of a Set of Mid-Colonial Khipus from the Santa alley, Coastal Peru. Ethnohistory 2018, 65, 1–23. [Google Scholar] [CrossRef]
- De Ayala, F.G.P. El Primer Nueva Corónica i Buen Gobierno. Copenhagen. 1615. Available online: http://www.kb.dk/permalink/2006/poma/info/en/frontpage.htm (accessed on 12 November 2022).
- De la Vega, I.G. Los Comentarios Reales de Los Incas; Libreria Sanmarti: Lima, Peru, 1919; Volume II. [Google Scholar]
- Sarmiento de Gamboa, P. Historia de los Incas, 1572. Available online: http://www.ellibrototal.com/ltotal/ficha.jsp?idLibro=3592 (accessed on 2 October 2022).
- Domenici, D. The Flowery Matter of Chant. The Use of Organic Colors in pre-Hispanic Mesoamerican Codex Painting. In Flower Worlds: Religion, Aesthetics, and Ideology in Mesoamerica and the American Southwest; Mathiowetz, M.D., Turner, A.T., Eds.; The University of Arizona Press: Tucson, AZ, USA, 2021; p. 266. [Google Scholar]
- Domenici, D.; Miliani, C.; Buti, D.; Brunetti, B.; Sgamellotti, A. Coloring Materials, Technological Practices, and Painting Traditions. In Painting the Skin: Pigments on Bodies and Codices in Pre-Columbian Mesoamerica; University of Arizona Press: Tuscon, AZ, USA, 2018; pp. 129–143. [Google Scholar]
- Conklin, W.J. The information system of Middle Horizon quipus. Ann. N. Y. Acad. Sci. 1982, 385, 261–281. [Google Scholar] [CrossRef]
- Altieri, R.A. Sobre 11 Antiguos Kipu Peruanos; Universidad Nacional de Tucumán: Tucumán, Argentina, 1941; p. 2. [Google Scholar]
- Splitstoser, J. Wari Khipus—An Ancient Andean Information System. Boundary End Archaeology Research Center, Barnardsville, NC, USA. 2021. Available online: https://www.youtube.com/watch?v=0cwHNpU8Mjg&t=3501s (accessed on 20 February 2021).
- Splitstoser, J.; Khipus, W. Written in Knots: Undeciphered Accounts of Andean Life; Splitstoser, J.; Murro, J.A., Eds. Dumbarton Oaks Museum. 2019. Available online: Chrome-extension://efaidnbmnnnibpcajpcglclefindmkaj/https://www.doaks.org/visit/museum/exhibitions/past/written-in-knots/written-in-knots-catalogue (accessed on 9 January 2023).
- Nordenskiöld, E. Nordenskiöld, E. Nordenskiöld originalkatalog. In Etnografiska Museet; Världskulturmuseet, Ed.; Nationalmuseums of World Culture: Gothenburg, Sweden, 1932. [Google Scholar]
- Encycolorpedia. Available online: https://encycolorpedia.com/ (accessed on 7 December 2022).
- Roberson, D.; Davidoff, J.; Davies, I.R.L.; Shapiro, L.R. Color categories: Confirmation of the relativity hypothesis. Cogn. Psychol. 2005, 50, 378–411. [Google Scholar] [CrossRef] [Green Version]
- Dyer, J.; Verri, G.; Cupitt, J. Multispectral Imaging in Reflectance and Photo-Induced Luminscence Modes: A User Manual; The British Museum: London, UK, 2013. [Google Scholar]
- Cosentino, A. Infrared Technical Photography for art examination. E-Preserv. Sci. 2016, 13, 1–6. [Google Scholar]
- Bradley, L.; Ford, J.; Kriss, D.; Schussler, V.; Pozzi, F.; Basso, E.; Bruno, L. Evaluating Multiband Reflectance Image Subtraction for the Characterization of Indigo in Romano-Egyptian Funerary Portraits. In Los Angeles: Appear: Ancient Panel Painting, Examination, Analysis and Research; Brooklyn Museum and Metropolitan Museum of Art: New York, NY, USA, 2018. [Google Scholar]
- Dyer, J.; Tamburini, D.; O’Connell, E.R.; Harrison, A. A multispectral imaging approach integrated into the study of Late Antique textiles from Egypt. PLoS ONE 2018, 13, e0204699. [Google Scholar] [CrossRef] [Green Version]
- Baldia, C.M.; Jakes, K.A. Photographic methods to detect colourants in archaeological textiles. J. Archaeol. Sci. 2007, 34, 519–525. [Google Scholar] [CrossRef]
- Al-Gaoudi, H.A.; Iannaccone, R. Multiband imaging techniques incorporated into the study of dyed ancient Egyptian textile fragments. Int. J. Conserv. Sci. 2021, 12, 893–906. [Google Scholar]
- Technical Photography Filter Set. Available online: https://chsopensource.org/technical-photography-filters-set/ (accessed on 29 November 2022).
- Multispectral Imaging Filter Set. Available online: https://chsopensource.org/multispectral-imaging-system/ (accessed on 29 November 2022).
- Hacke, M. RAÄ-2021-3144 Instrument Report µXRF In Situ (Version 1) [Data Set], Dyes in History and Archaeology (DHA41), Visby; Swedish National Heritage Board: Stockholm, Sweden, 2022. [Google Scholar] [CrossRef]
- Koestler, R.J.; Sheryll, R.; Indictor, N. Identification of dyeing mordants and related substances on textile fibers: A preliminary study using energy dispersive X-ray spectrometry. Stud. Conserv. 1985, 30, 58–62. [Google Scholar] [CrossRef]
- Tamburini, D.; Cartwright, C.R.; Pullan, M.; Vickers, H. An investigation of the dye palette in Chinese silk embroidery from Dunhuang (Tang dynasty). Archaeol. Anthropol. Sci. 2019, 11, 1221–1239. [Google Scholar] [CrossRef]
- Rosario-Chirinos, N. Tintes en el Perú prehispánico, virreynal y republican—Dyes in Pre-Hispanic, Viceregal and Republican Peru. In Tejidos Milenarios del Perú—Ancient Peruvian Textiles; De Lavalle, J.A., Cardenas, R.D.L., Eds.; Integra AFP: Lima, Peru, 1999. [Google Scholar]
- Fester, G.A. Los colorantes del antiguo Perú. Archeion 1940, 22, 229–241. [Google Scholar] [CrossRef]
- Valette, M. Note sur la teinture de tissus précolombiens du Bas-Pérou. J. Société Américanistes 1913, 10, 43–45. [Google Scholar] [CrossRef]
- Plinius Secundus, G. Liber XXXV. 77–78 d.C. Available online: https://la.wikisource.org/wiki/Naturalis_Historia/Liber_XXXV (accessed on 5 November 2022).
- Dale, L.W. Mordanting of Wool With Salts of Aluminum; Iowa State University: Ames, IA, USA, 1942. [Google Scholar]
- Singer, C. The Earliest Chemical Industry: An Essay in the Historical Relations of Economics and Technology Illustrated from the Alum Trade; The Folio Society: London, UK, 1991. [Google Scholar]
- Verhecken, A. History and technology of alum production in Belgium. In The Diversity of Dyes in History and Archaeology; Atkinson Kirby, J., Ed.; Archetype Publications: London, UK, 2017; pp. 278–291. [Google Scholar]
- Balston, J. The early history of alum. In The Whatmans and Wove Paper: Its Invention and Development in the West. 1998. Available online: http://www.wovepaper.co.uk/alumessay1.html#EarlyHistory (accessed on 5 November 2022).
- Cobo y Peralta, B.; Tercero, L. Historia del Nuevo mundo por el Padre Bernabé Cobo de la Compañía de Jesús; Jiménez de la Espada, M.D., Ed.; Sociedad de Bibliófilos Andaluces: Seville, Spain, 1890; Volume 1, pp. 239–240. [Google Scholar]
- Roquero, A. Tintes y tintoreros de América: Catálogo de Materias Primas y Registro Etnográfico de México, Centro América, Andes Centrales y Selva Amazónica; Ministerio de Educación, Cultura y Deporte: Lima, Peru, 2006. [Google Scholar]
- Bender, M. Colors for textiles—Ancient and modern. J. Chem. Educ. 1947, 24, 2. [Google Scholar] [CrossRef]
- Wouters, J.; Rosario-Chirinos, N. Dye Analysis of Pre-Columbian Peruvian Textiles With High-Performance Liquid Chromatography and Diode-Array Detection. J. Am. Inst. Conserv. 1992, 31, 237–255. [Google Scholar] [CrossRef]
- De Mayolo, K.K.A. Peruvian natural dye plants. Econ. Bot. 1989, 43, 181–191. [Google Scholar] [CrossRef]
- Sabatini, F.; Bacigalupo, M.; Degano, I.; Javér, A.; Hacke, M. Revealing the organic dye and mordant composition of Paracas textiles by a combined analytical approach. Herit. Sci. 2020, 8, 122. [Google Scholar] [CrossRef]
- Javér, A.; Hacke, M.; Delgado, C.; Thuresson, K. Paracas textiles—Colour and condition. Investigation of the mordants and state of degradation of the Paracas textile collections in Peru and Sweden. In Proceedings of the ICOM Committee for Conservation 18th Triennial Meeting, Copenhagen, Denmark, 4–8 September 2017. [Google Scholar]
- Wallert, A.; Boytner, R. Dyes from the Tumilaca and Chiribaya Cultures, South Coast of Peru. J. Archaeol. Sci. 1996, 23, 853–861. [Google Scholar] [CrossRef]
- Thuresson, K. Mercury in Museum Herbarium Collections. 2019. Available online: https://www.raa.se/app/uploads/2020/06/HgHerbarium-A1-Poster.pptx.pdf (accessed on 26 January 2023).
- Cardon, D. Natural Dyes: Sources, Traditions, Technology & Science; Archetype: London, UK, 2007; p. 268. [Google Scholar]
- Lech, K.; Witkoś, K.; Wileńska, B.; Jarosz, M. Identification of unknown colorants in pre-Columbian textiles dyed with American cochineal (Dactylopius coccus Costa) using high-performance liquid chromatography and tandem mass spectrometry. Anal. Bioanal. Chem. 2015, 407, 855–867. [Google Scholar] [CrossRef] [Green Version]
- Dilillo, M.; Restivo, A.; Degano, I.; Ribechini, E.; Colombini, M.P. GC/MS investigations of the total lipid fraction of wool: A new approach for modelling the ageing processes induced by iron-gallic dyestuffs on historical and archaeological textiles. Microchem. J. 2015, 118, 131–140. [Google Scholar] [CrossRef]
- Ferreira, E.S.; Quye, A. Photo-oxidation products of quercetin and morin as markers for the characterisation of natural flavonoid yellow dyes in ancient textiles. Dye. Hist. Archaeol. 2002, 18, 63–72. [Google Scholar]
- Splitstoser, J.C. The parenthetical notation method for recording yarn structure 2012. In Proceedings of the Textile Society of America Symposium Proceedings, Washington, DC, USA, 19–22 September 2012. [Google Scholar]


| Pantone® Colour Code | Closely Related Descriptive Colour | Short Colour Term | Material | 1932.08.0002 | 1932.08.0001 |
|---|---|---|---|---|---|
| \* | Ivory | Ivory | Cotton | x | x |
| 468 | Durian white | Ecru | Cotton | x | x |
| 4685 | Manila | Cotton | |||
| 463 | Violin brown | Brown | Cotton | x | x |
| 7505 | Coyote brown | Cotton | |||
| 464 | Bronze | Light Brown | Cotton | x | |
| 465 | Camel | Yellow | Cotton | x | |
| 467 | Burlywood | Beige | Cotton | x | |
| 2311 | Tumbleweed | Cotton | |||
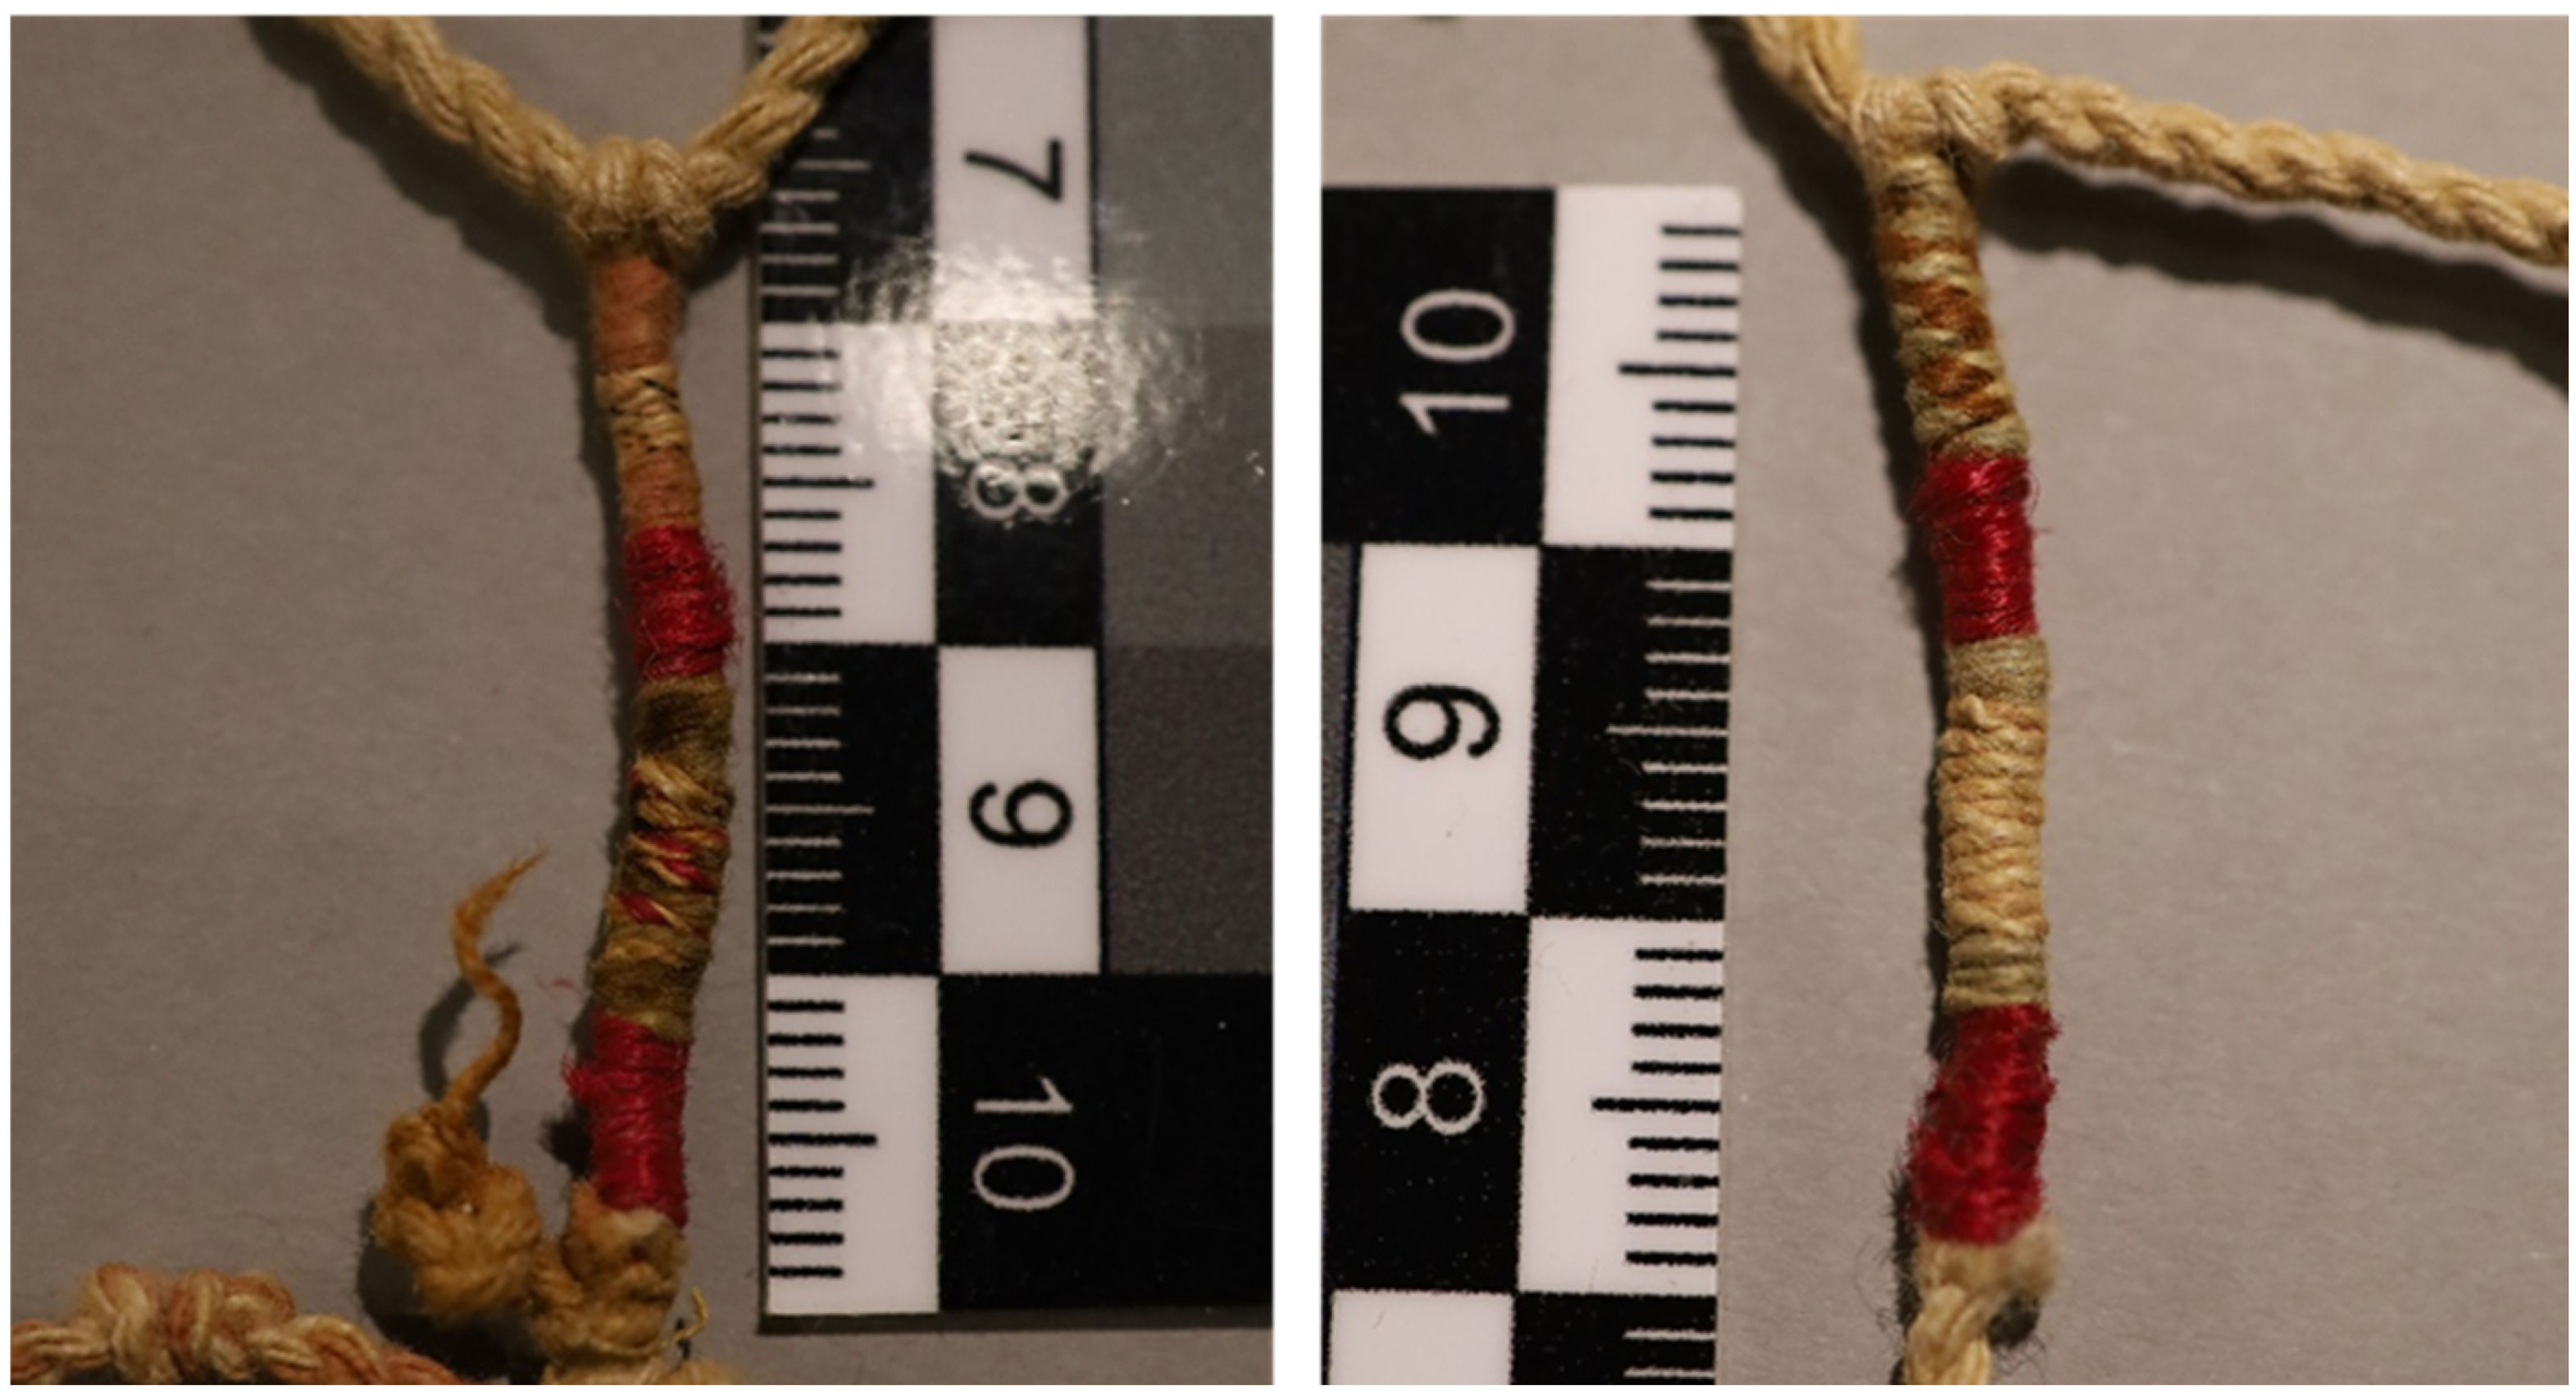
| 201 | Royal red | Red | Wool | x | x |
| 7613 | Old rose | Pink | Cotton | x | x |
| 7612 | Tuscany-Antique brass | Cotton | |||
| 442 | Ash grey | Blue | Cotton | x | x |
| 5497 | Morning blue | Cotton | |||
| 7538 | Dolphin grey | Cotton | |||
| 455 | Antique bronze | Green | Cotton | x | |
| \* | Black | Black | Cotton | x | x |
| Image | Light Source (Set of Two) | Filter in Front of Camera |
|---|---|---|
| VIS | Godox LED1000 II | UV-IR blocking bandpass, c. 400–700 nm |
| UVL | Engelbrecht UVA-366 black lights | UV-IR blocking bandpass, c. 400–700 nm |
| IRR | IR LED Synergy 21 M30205 | IR cut-on, c. 800 nm cut-on, 25% transmittance at 900 nm |
| MBR | Kaiser Studiolight 1000 with an Osram halogen Superphot 1000 W bulb | Bandpass, 630 ± 5 nm + 740 ± 5 nm |
| Colour | Sample | XRF Areas In Situ 1932.08.0002 | XRF Areas In Situ 1932.08.0001 | MBI Samples and In Situ | XRF Samples and In Situ | HPLC–HRMS Samples |
|---|---|---|---|---|---|---|
| blue | 1 | P1s8—Band 1, 3, 5 | P1—Band 3, 5, 6 P2s9—Band 1 | UVL-dark MBR-bright IRRFC-red | Ca, Cl, Fe, Cu | Indigo |
| pink | 2 | P1—Band 1, 2, 3 P1s8—Band 4 | P1—Band 1 P2s8—Band 2 P2s9—Band 3 | UVL-dark IRRFC-orange–yellow | Fe, Cl, K | Cochineal |
| ivory | 3 | P1—Band 2 P1s8—Band 4 | P1—Band 1, 3, 6 P2s8—Band 1 P2s9—Band 2 | UVL-light IRRFC-white | Blank | |
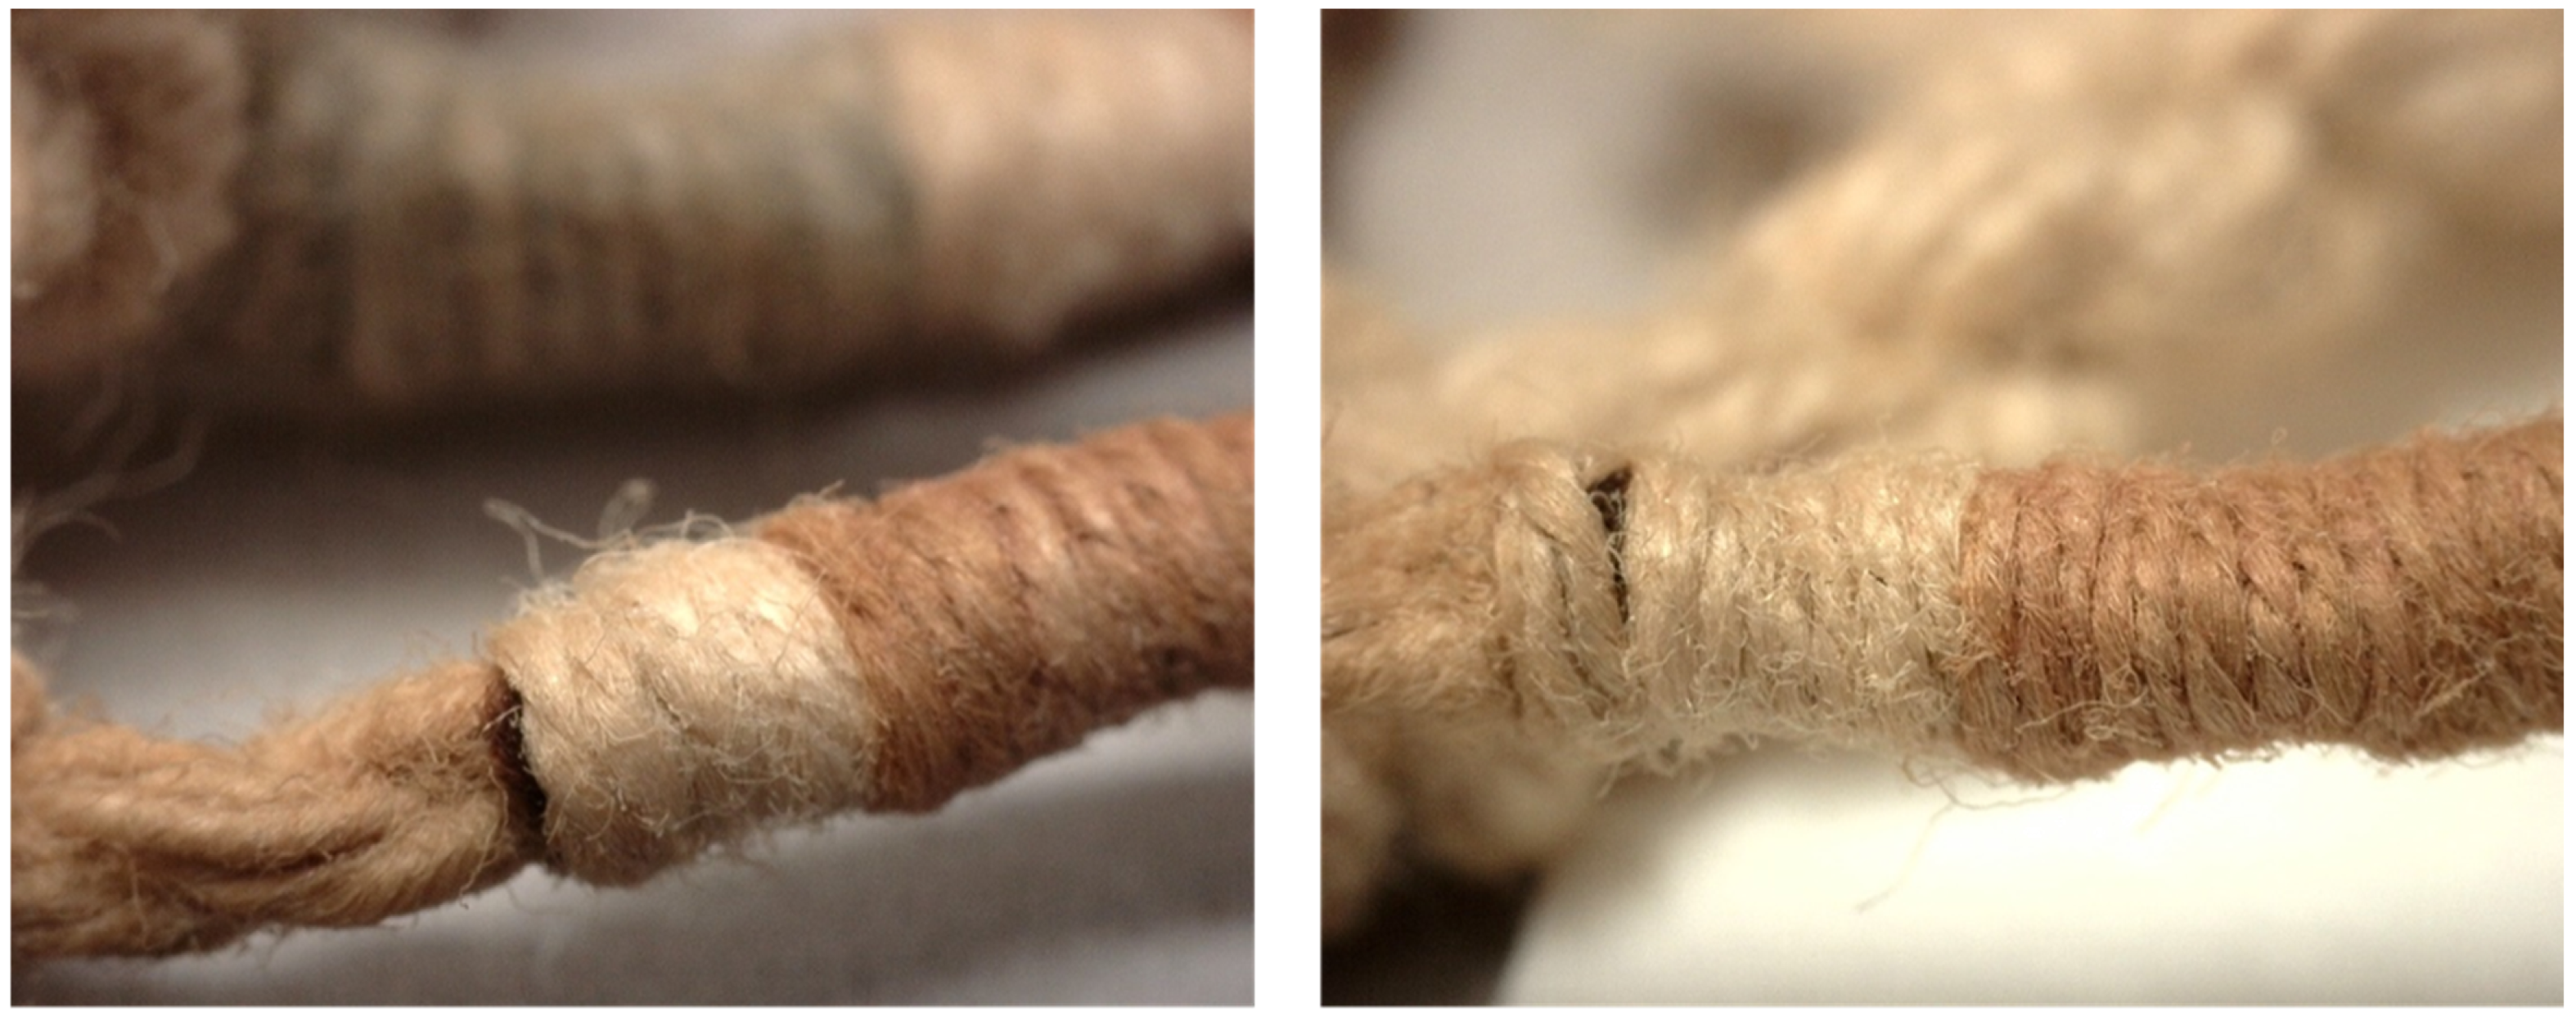
| brown | 4 | P1s8—Band 1 | UVL-very dark IRRFC-orange | K | Cochineal (very weak) | |
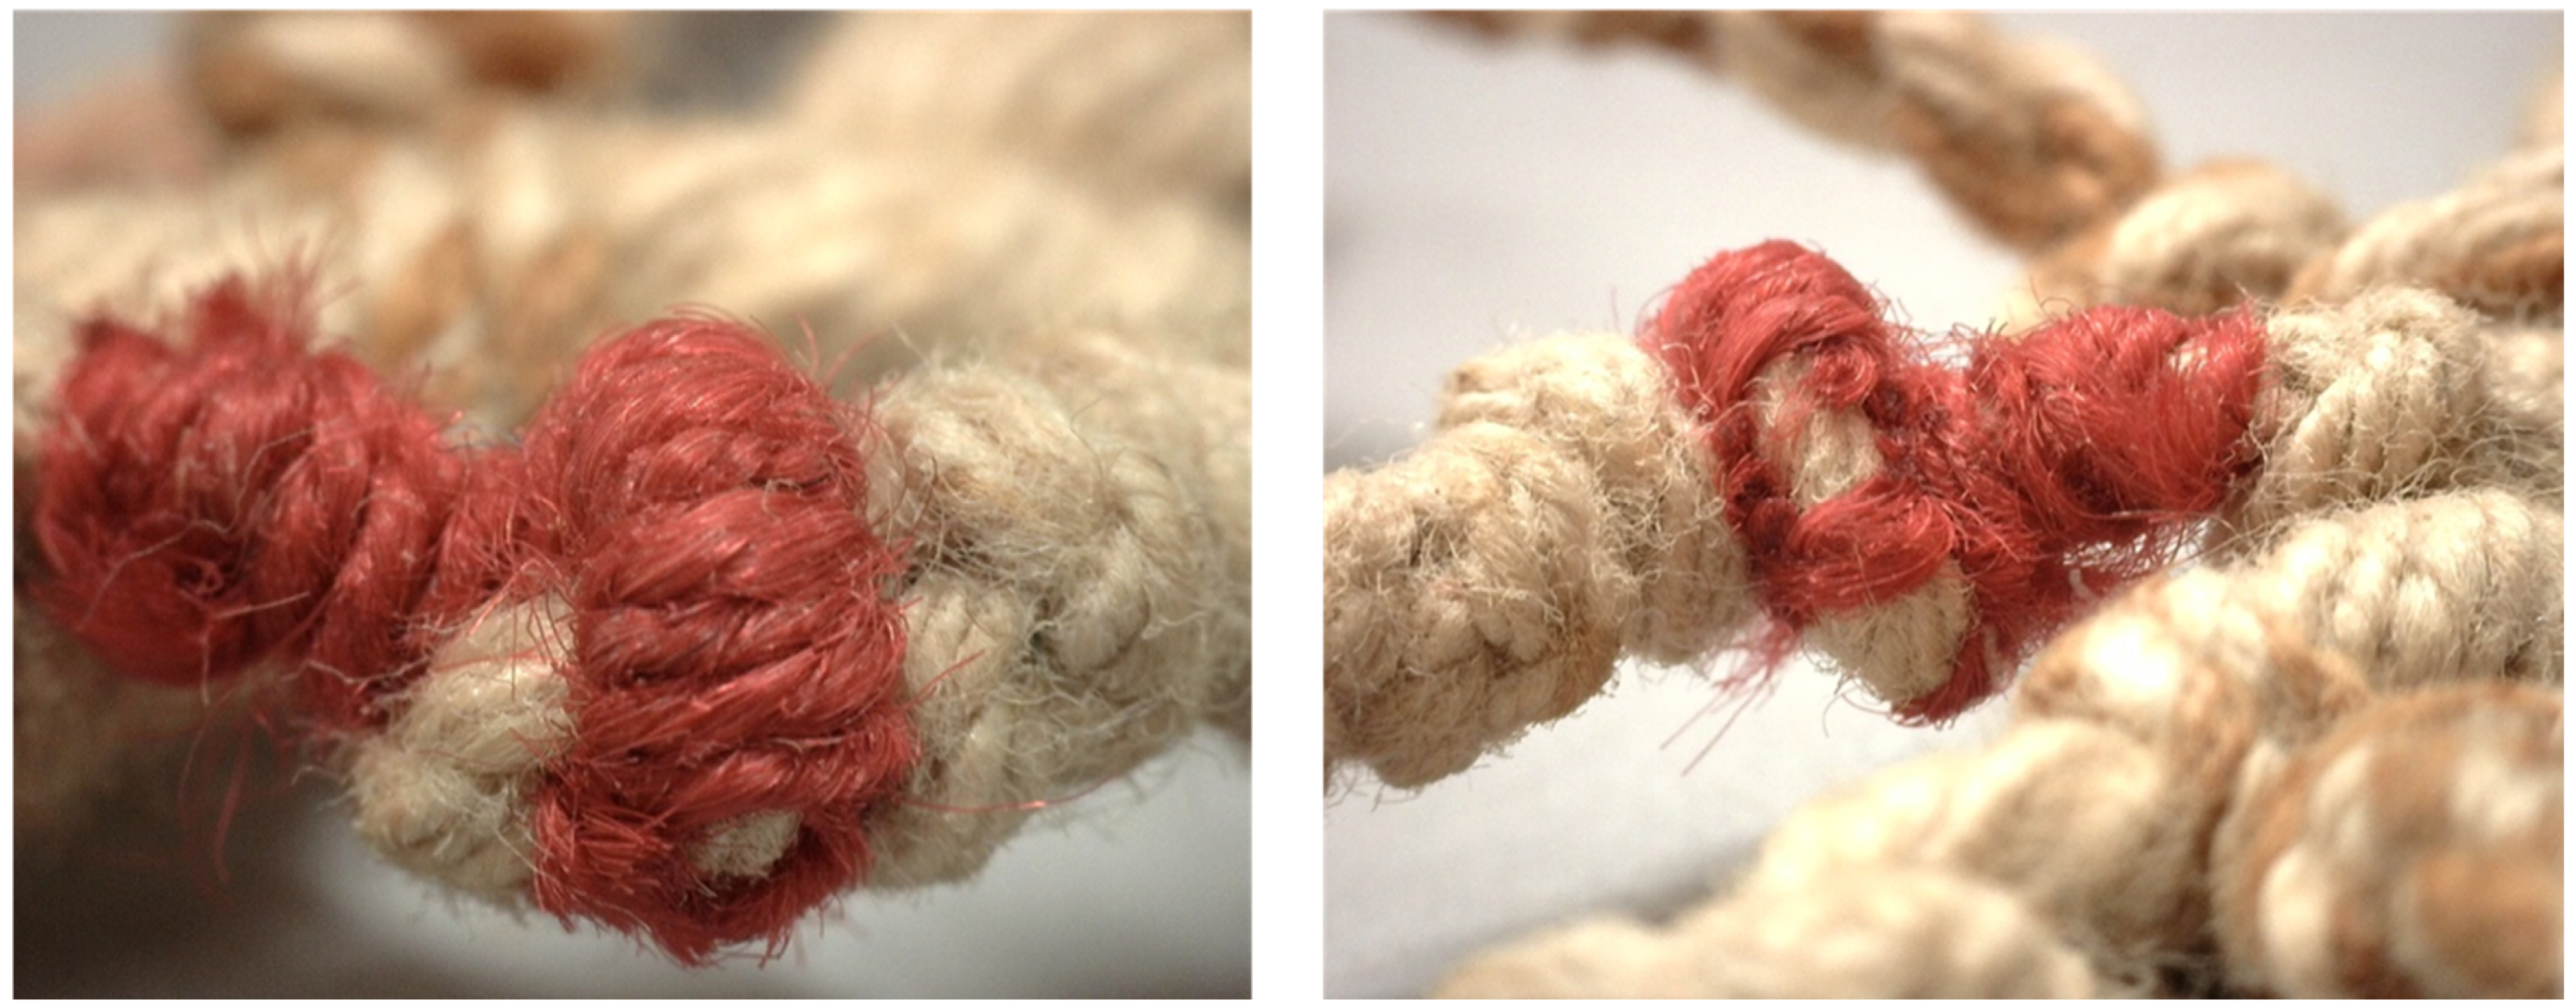
| red | 5 | P1s8—Band 2, 6 | P1—Band 4, 6 | UVL-very dark purple IRRFC-orange UVFC-green | Ca | Cochineal (most intense) plus unknown anthraquinone |
| ivory | 6 | P1—Band 2 P1s8—Band 4 | P1—Band 1, 3, 6 P2s8—Band 1 P2s9—Band 2 | UVL-light IRRFC-white | Blank | |
| ecru | 7 | Point analyses P1s2 | \ | UVL-dark IRRFC-yellow | Ca, Cl, Fe, K | Flavonoid dye based on rutin, luteolin, and luteolin-O-glucosides |
| black | P1 | P2s8 | Fe, Mn, K | |||
| pink | P2s8—Band 2 | S, Sn |
Disclaimer/Publisher’s Note: The statements, opinions and data contained in all publications are solely those of the individual author(s) and contributor(s) and not of MDPI and/or the editor(s). MDPI and/or the editor(s) disclaim responsibility for any injury to people or property resulting from any ideas, methods, instructions or products referred to in the content. |
© 2023 by the authors. Licensee MDPI, Basel, Switzerland. This article is an open access article distributed under the terms and conditions of the Creative Commons Attribution (CC BY) license (https://creativecommons.org/licenses/by/4.0/).
Share and Cite
Milillo, L.; Hacke, M.; Norrehed, S.; Degano, I.; Gherardi, F.; Gunnarsson, E. Heritage Science Contribution to the Understanding of Meaningful Khipu Colours. Heritage 2023, 6, 2355-2378. https://doi.org/10.3390/heritage6030124
Milillo L, Hacke M, Norrehed S, Degano I, Gherardi F, Gunnarsson E. Heritage Science Contribution to the Understanding of Meaningful Khipu Colours. Heritage. 2023; 6(3):2355-2378. https://doi.org/10.3390/heritage6030124
Chicago/Turabian StyleMilillo, Lucrezia, Marei Hacke, Sara Norrehed, Ilaria Degano, Francesca Gherardi, and Ellinor Gunnarsson. 2023. "Heritage Science Contribution to the Understanding of Meaningful Khipu Colours" Heritage 6, no. 3: 2355-2378. https://doi.org/10.3390/heritage6030124