

Geophysical Investigations within the Latus Dextrum of Porolissum Fort, Northwestern Romania—The Layout of a Roman Edifice
 , and
, and 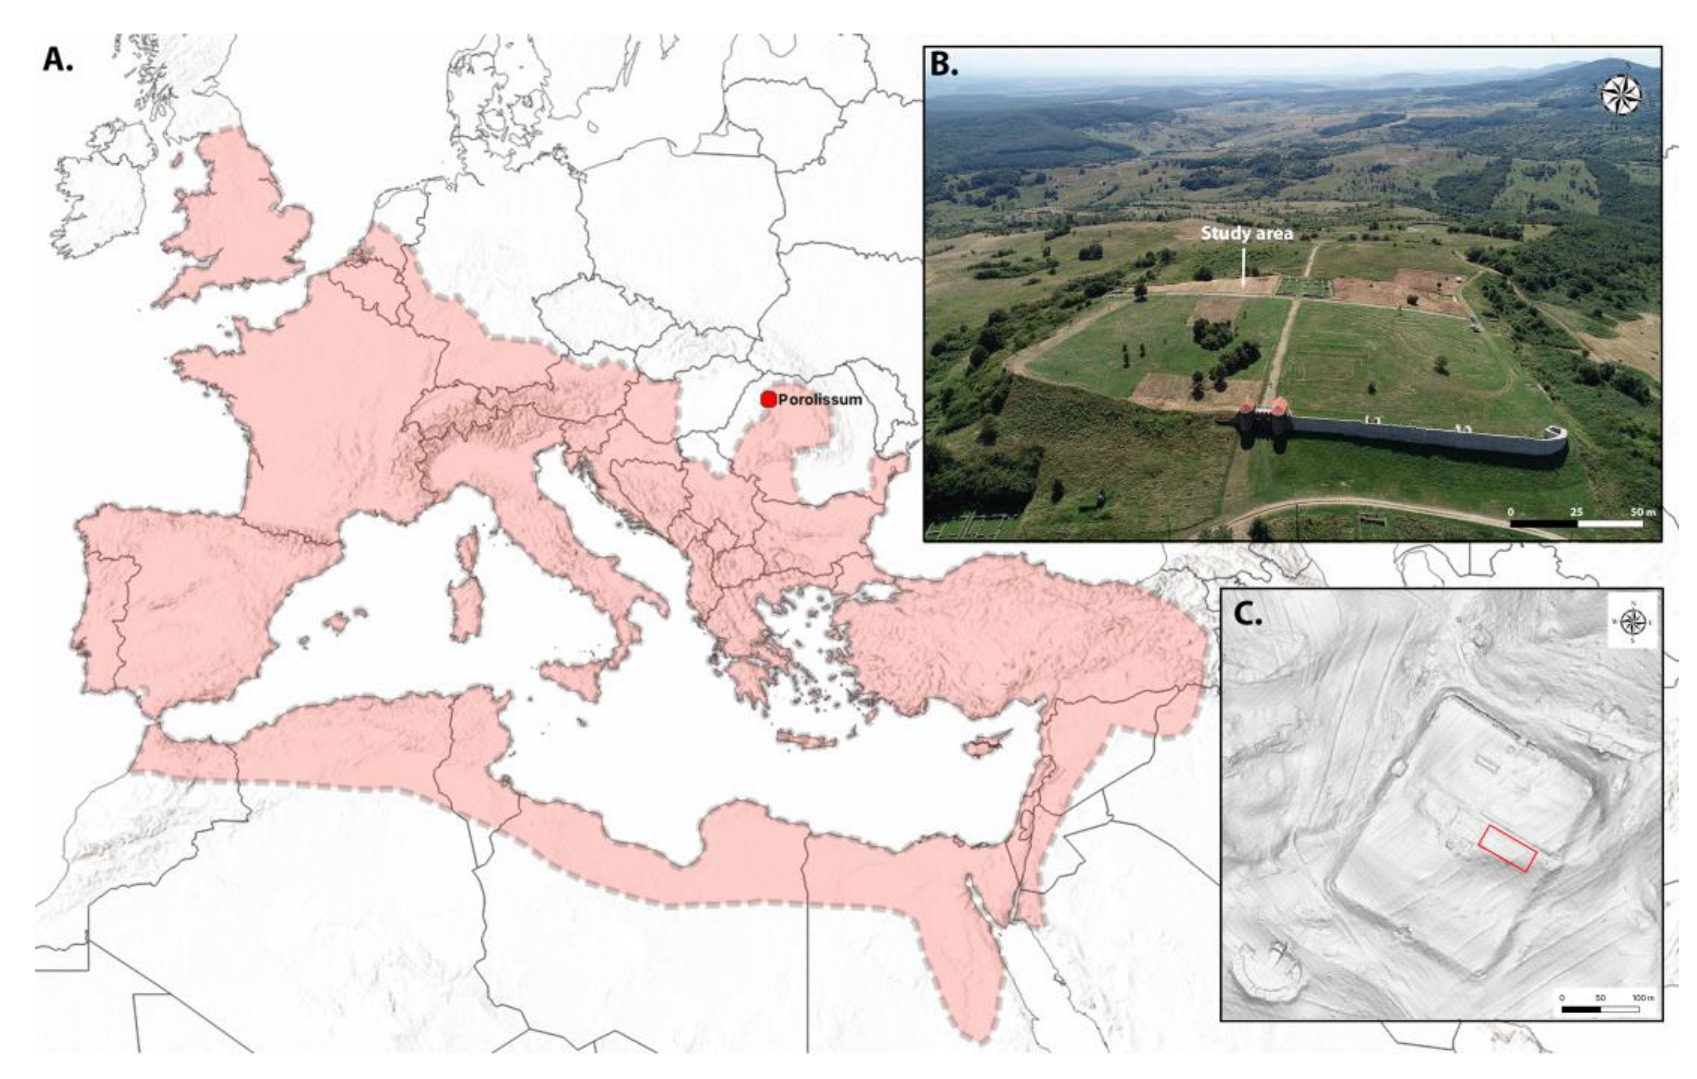
Abstract
:1. Introduction


2. Materials and Methods

3. Results


4. Discussions
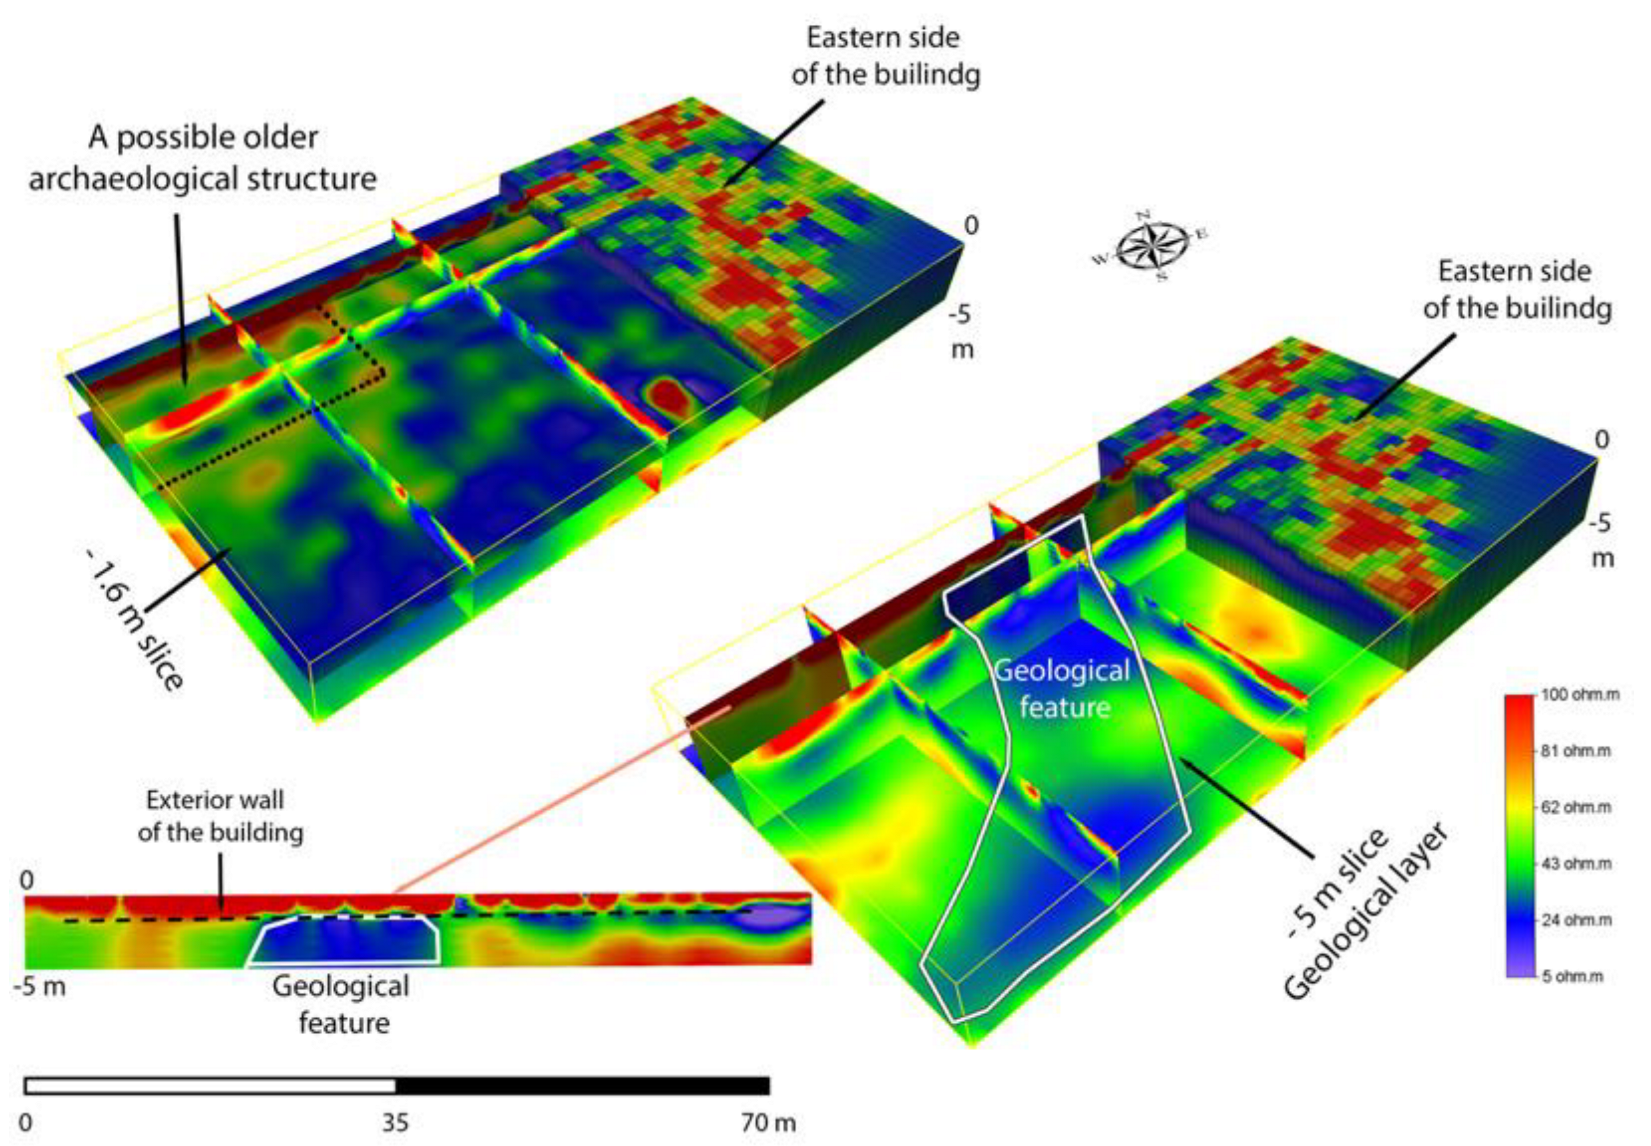
4.1. Results Interpretation


4.2. The Impact of the Geological Setting on the Results of Archaeological Prospection


4.3. An Attempt at Building Reconstruction Based on the Geophysical Results and Older Archaeological Excavations


5. Conclusions
Author Contributions
Funding
Institutional Review Board Statement
Informed Consent Statement
Data Availability Statement
Acknowledgments
Conflicts of Interest
References
- Teodor, E. The Invisible Giant: Limes Transalutanus. An Overview South of Argeş River; Editura Cetatea de Scaun: Târgoviște, Romania, 2015. [Google Scholar]
- Gudea, N. Porolissum, un Complex Daco-roman la Marginea de Nord a Imperiului Roman, Cercetări şi Descoperiri Arheologice pînă în anul 1977: Acta Musei Porolissensis; Muzeul National de Istorie a Transilvaniei: Cluj-Napoca, Romania, 1989. [Google Scholar]
- Gudea, N. Der Meseş-Limes. Die Vorgeschobene Kleinfestungslinie auf den Westlichen Abschnitt der Grenze der Provinz Dacia Porolissensis/Limesul de pe Munţii Meseş. Linia înaintată de Turnuri de pază de pe Sectorul de vest al Provinciei Dacia Porolissensis; Zalău, Editura Muzeului Județean de Istorie și Arheologie Zalău: Zalău, Romania, 1997. [Google Scholar]
- Gudea, N.; Papp, E. Das Römergrenzkastell von Moigrad- Pomet. Porolissum 1. In Ghid al Monumentelor Arheologice Din Dacia Porolissensis; Muzeul Județean de Istorie și Artă Zalău: Zalău, Romania, 1997. [Google Scholar]
- Tamba, D.G. Porolissum: Aşezarea civilă (vicus Militaris) a Castrului Mare; Editura Mega: Cluj-Napoca, Romania, 2008. [Google Scholar]
- Pop, H. Fortificațiile Dacice din Vestul și nord-Vestul României; Editura Mega: Cluj-Napoca, Romania, 2006. [Google Scholar]
- Gudea, N. The Defensive System of Roman Dacia. In Britannia; Society for the Promotion of Roman Studies: London, UK, 1979; Volume 10. [Google Scholar] [CrossRef]
- Gudea, N.; Gudea, A.I.; Salontai, S.; Lisovschi-Cheleșanu, C. Porolissum: Un Complex Daco-Roman la Marginea de Nord a Imperiului Roman. II, Vama Romană: Monografie Arheologică. Contribuţii la Cunoaşterea Sistemului Vamal din Provinciile Dacice; Muzeul Național de Istorie a Transilvaniei: Cluj-Napoca, Romania, 1996. [Google Scholar]
- Opreanu, C.H.; Lăzărescu, V.A. The evolution of the civilian settlement at Porolissum in the light of the new research. Ephemer. Napoc. 2016, 26, 107–120. [Google Scholar]
- Roman, A.; Ursu, T.M.; Fărcaş, S.; Opreanu, C.H.; Lăzărescu, V.A. Documenting ancient anthropogenic signatures by remotely sensing the current vegetation spectral and 3D patterns: A case study at Roman Porolissum archaeological site (Romania). Quat. Int. 2019, 523, 89–100. [Google Scholar] [CrossRef]
- Whittaker, C.R. Frontiers of the Roman Empire: A Social and Economic Study; Johns Hopkins University Press: Baltimore, MD, USA, 1994. [Google Scholar]
- Opreanu, C.H.; Lăzărescu, V.A.; Ardevan, R.; Găzdac, C.R.; Gui, m.; Ionescu, C.; Pop, H.; Pripon, E.; Simon, V. A Roman Frontier Marketplace at Porolissum in the Light of Numismatic Evidence, Contribution to the Knowledge of the Roman Limes Economy; Editura Mega: Cluj-Napoca, Romania, 2015. [Google Scholar]
- Russu, I.I. Inscriptiile Daciei Romane, Volumen 1, Introducere Istorica si Epigrafica, Diplomele Militare, Tablitele Cerate; Academiei Republicii Socialiste Romania: Bucureşti, Romania, 1975. [Google Scholar]
- Fiedler, M.; Höpken, K.; Pánczél, S.P.; Bajusz, I.; Döhner, G.; Lenkey, G.; Merzenich, C.; Pethe, M.; Vasáros, Z. Porolissum. Forschungen im Kastell auf dem Pomet von 2009 bis 2011; Müller, K., Schiller, B., Der Fachschaftsrat Des Winckelmann-Instituts Der Humboldt–Universität Zu Berlin , Eds.; Logos: Berlin, Germany, 2011; pp. 449–468. [Google Scholar]
- Opreanu, C.H.; Lăzărescu, V.A. The roman headquarters on the northern limes of dacia: Porolissum (jud. sălaj/ro) in the light of recent research. Archaol. Korresp. 2020, 50, 225–240. [Google Scholar]
- Opreanu, C.H.; Lăzărescu, V.A. New light on a Roman fort based on a Lidar survey in the forested landscape from Porolissum. Ephemer. Napoc. 2014, 24, 71–86. [Google Scholar]
- Ardevan, R. Viaţa Municipală în Dacia Romană; Mirton: Timişoara, Romania, 1998. [Google Scholar]
- Opreanu, C.H.; Lăzărescu, V.-A.; Ștefan, D. Noi cercetări la Porolissum. Analele Banatului 2013, 21, 83–106. [Google Scholar]
- Opreanu, C.H.; Lăzărescu, V.A. Landscape Archaeology on the Northern Frontier of the Roman Empire at Porolissum; An Interdisciplinary Research Project; Mega: Cluj-Napoca, Romania, 2016. [Google Scholar]
- Opreanu, C.; Lăzărescu, V. The basilica of the forum at Municipium Septimium Porolissense (Dacia). In Visy 75 Artificem Commendat Opus; Studes in Honorem Zsolt Visy; Farkas, G.I., Nemeny, R., Szabo, M., Eds.; CLIR Research Center: Pécs, Hungary, 2019; pp. 396–415. [Google Scholar]
- Scurtu, F. Radiografia geofizică a unei părţi a oraşului roman Porolissum. SCIVA 1997, 48, 361–372. [Google Scholar]
- Scurtu, F. The geophysical image of a part of the ancient Roman town Porolissum in Dacia. BAR Int. Ser 2002, 1043, 165–169. [Google Scholar]
- Petrovszki, J.; Lipovics, T.; Lenkey, L.; Pethe, M.; Ferencz, E.; Herein, M. Régészeti kutatás céljából végzett mágneses mérések Porolissumon. Magyar Geofizika 2008, 49, 88–95. [Google Scholar]
- Lipovics, T.; Lenkey, L.; Pethe, M.; Herein, M.; Ferencz, E.; Bajusz, I. Masuratori arheomagnetice la Porolissum. Acta Musei Porolissensis 2008, 30, 123–133. [Google Scholar]
- Pethe, M.; Lenkey, L. Magnetic Surveying in the Roman Age Fort of Porolissum. In Proceedings of the 6th Congress of the Balkan Geophysical Society, European Association of Geoscientists & Engineers, Budapest, Hungary, 3–6 October 2011; p. 262. [Google Scholar]
- Geometrics Inc. Magmap 2000 User Guide; 24891-01 Rev. H; Geometrics Inc.: San Jose, CA, USA, 2000. [Google Scholar]
- Tchernychev, M. MAGPICK-Magnetic Map & Profile Processing, User Guide. 2013. Available online: Http://Sourceforge.Net/Projects/Magpick (accessed on 20 December 2022).
- Terra Surveyor, User Manual, Program Verion 3.0.33 DW Consulting. Available online: https://dwconsulting.nl/Download/TerraSurveyor%20manual%203033.pdf (accessed on 20 December 2022).
- Surfer® from Golden Software, LLC or Surfer® (Golden Software, LLC), Golden Software, LLC, PO Box 281, Golden, CO 80402-0281 USA. Available online: www.goldensoftware.com (accessed on 20 December 2022).
- Loke, M.H. Rapid 2-D Resistivity and IP Inversion Using the Least-Squares Method, Geoelectrical Imaging 2D and 3D Geotomo Software; Geotomo Software: Penang, Malaysia, 2002.
- Loke, M.H. Res2Dinv and Res3dinv Software, Version 3.59, Geoelectrical Imaging 2D&3D; Geotomo Software: Penang, Malaysia, 2009. [Google Scholar]
- Voxler® from Golden Software, LLC or Voxler® (Golden Software, LLC), Golden Software, Golden, CO, USA. Available online: www.goldensoftware.com (accessed on 20 December 2022).
- Pisz, M.; Tomas, A.; Hegyi, A. Non-destructive research in the surroundings of the Roman Fort Tibiscum (today Romania). Archaeol. Prospect. 2020, 27, 219–238. [Google Scholar] [CrossRef] [Green Version]
- Fassbinder, J.W.E. Seeing beneath the farmland, steppe, and desert soil: Magnetic prospecting and soil magnetism. J. Archaeol. Sci. 2015, 56, 85–95. [Google Scholar] [CrossRef]
- Fassbinder, J.W.E.; Stanjek, H. Magnetic properties of biogenic soil greigite (Fe3S4). Geophys. Res. Lett. 1994, 21, 2349–2352. [Google Scholar] [CrossRef]
- Seghedi, I.; Ntaflos, T.; Pécskay, Z.; Panaiotu, C.; Mirea, V.; Downes, H. Miocene extension and magma generation in the Apuseni Mts. (western Romania): A review. Int. Geol. Rev. 2022, 64, 1885–1911. [Google Scholar] [CrossRef]
- Wollmann, V. Cercetări privind carierele de piatră din Dacia romană. Sargetia 1973, X, 105–122. [Google Scholar]
- Zăgreanu, R. Votive Statue Bases and Votive Altars from Porolissum. Acta Mus. Napocensis 2016, 53, 203–248. [Google Scholar]
- Marcu, F. The Internal Planning of Roman Forts of Dacia; Mega Publishing House: Cluj-Napoca, Romania, 2009. [Google Scholar]
- Opreanu, C.H. The Garrison of the Roman Fort at Porolissum (Dacia). The Analysis of the Tile-Stamps. Open Archaeol. 2018, 4, 365–372. [Google Scholar] [CrossRef]
- Groh, S. Im Spannungsfeld von Macht und Strategie: Die legio II Italica und Ihre Castra von Locica (Slowenien), Lauriacum/Enns und Albing (Österreich); Gesellschaft fuör Landeskunde und Denkmalpflege Oberoösterreich: Linz, Austria, 2018. [Google Scholar]
- Hegyi, A. Aplicarea Metodelor Specifice Geoștiințelor in Cercetări Arheologice din Sud-Vestul României. Ph.D. Thesis, Universitatea de Vest din Timișoara, Timișoara, Romania, 2018. [Google Scholar]
- Hegyi, A.; Sarris, A.; Curta, F.; Floca, C.; Fortiu, S.; Urdea, P.; Onaca, A.; Timofte, F.; Pisz, M.; Timut, S.; et al. Deserted medieval village reconstruction using applied geosciences. Remote Sens. 2020, 12, 1975. [Google Scholar] [CrossRef]
- Hegyi, A.; Urdea, P.; Floca, C.; Ardelean, A.; Onaca, A. Mapping the subsurface structures of a lost medieval village in South-Western Romania by combining conventional geophysical methods. Archaeol. Prospect. 2019, 26, 21–32. [Google Scholar] [CrossRef] [Green Version]
- Țentea, O.; Matei-Popescu, F.; Călina, V. Frontiera romană din Dacia Inferior. O trecere în revistă și o actualizare. 1. Cercet. Arheol. 2021, 28, 9–90. [Google Scholar] [CrossRef]
- Stavilă, A.; Hegyi, A.; Craiovan, B. Non-invasive archaeological research performed in the Middle Bronze Age settlement from AlioșValea Alioşu (Timiș County, Romania). Structures, chronology, and perspectives. Ziridava Stud. Arcaheologica 2020, 34, 168–188. [Google Scholar]
- Asăndulesei, A. GIS, Fotogrametrie și Geofizică în Arheologie. Investigații Non-Invazive în Așezări Cucuteni din România; Universității Alexandru Ioan Cuza: Iași, Romania, 2019. [Google Scholar]
- Gridan, S.; Urdea, P.; Hegyi, A. Castrul de la Ungra, jud. Brașov. Cercetări multidisciplinare. In ArheoVest V2. Interdisciplinaritate în Arheologieși Istorie; Forțiu, S., Ed.; JATE Press Kiadó: Szeged, Hungary, 2017; pp. 851–883. [Google Scholar]
- Zăgrean, R.; Gridan, S.; Hegyi, A. Castrul Roman de la Ungra (jud. Brașov); LIMES, Frontierele Imperiului Roman în România; Comisia Limes România: Bucharest, Romania, 2022; Volume 12, pp. 30–33. [Google Scholar]
Disclaimer/Publisher’s Note: The statements, opinions and data contained in all publications are solely those of the individual author(s) and contributor(s) and not of MDPI and/or the editor(s). MDPI and/or the editor(s) disclaim responsibility for any injury to people or property resulting from any ideas, methods, instructions or products referred to in the content. |
© 2023 by the authors. Licensee MDPI, Basel, Switzerland. This article is an open access article distributed under the terms and conditions of the Creative Commons Attribution (CC BY) license (https://creativecommons.org/licenses/by/4.0/).
Share and Cite
Hegyi, A.; Lăzărescu, V.; Pisz, M.; Lenkey, L.; Pethe, M.; Onaca, A.; Nica, M. Geophysical Investigations within the Latus Dextrum of Porolissum Fort, Northwestern Romania—The Layout of a Roman Edifice. Heritage 2023, 6, 829-848. https://doi.org/10.3390/heritage6020046
Hegyi A, Lăzărescu V, Pisz M, Lenkey L, Pethe M, Onaca A, Nica M. Geophysical Investigations within the Latus Dextrum of Porolissum Fort, Northwestern Romania—The Layout of a Roman Edifice. Heritage. 2023; 6(2):829-848. https://doi.org/10.3390/heritage6020046
Chicago/Turabian StyleHegyi, Alexandru, Vlad Lăzărescu, Michał Pisz, László Lenkey, Mihály Pethe, Alexandru Onaca, and Mădălina Nica. 2023. "Geophysical Investigations within the Latus Dextrum of Porolissum Fort, Northwestern Romania—The Layout of a Roman Edifice" Heritage 6, no. 2: 829-848. https://doi.org/10.3390/heritage6020046