
Chromatographic Characterization of Archaeological Molluskan Colorants via the Di-Mono Index and Ternary Diagram

Abstract
:1. Introduction
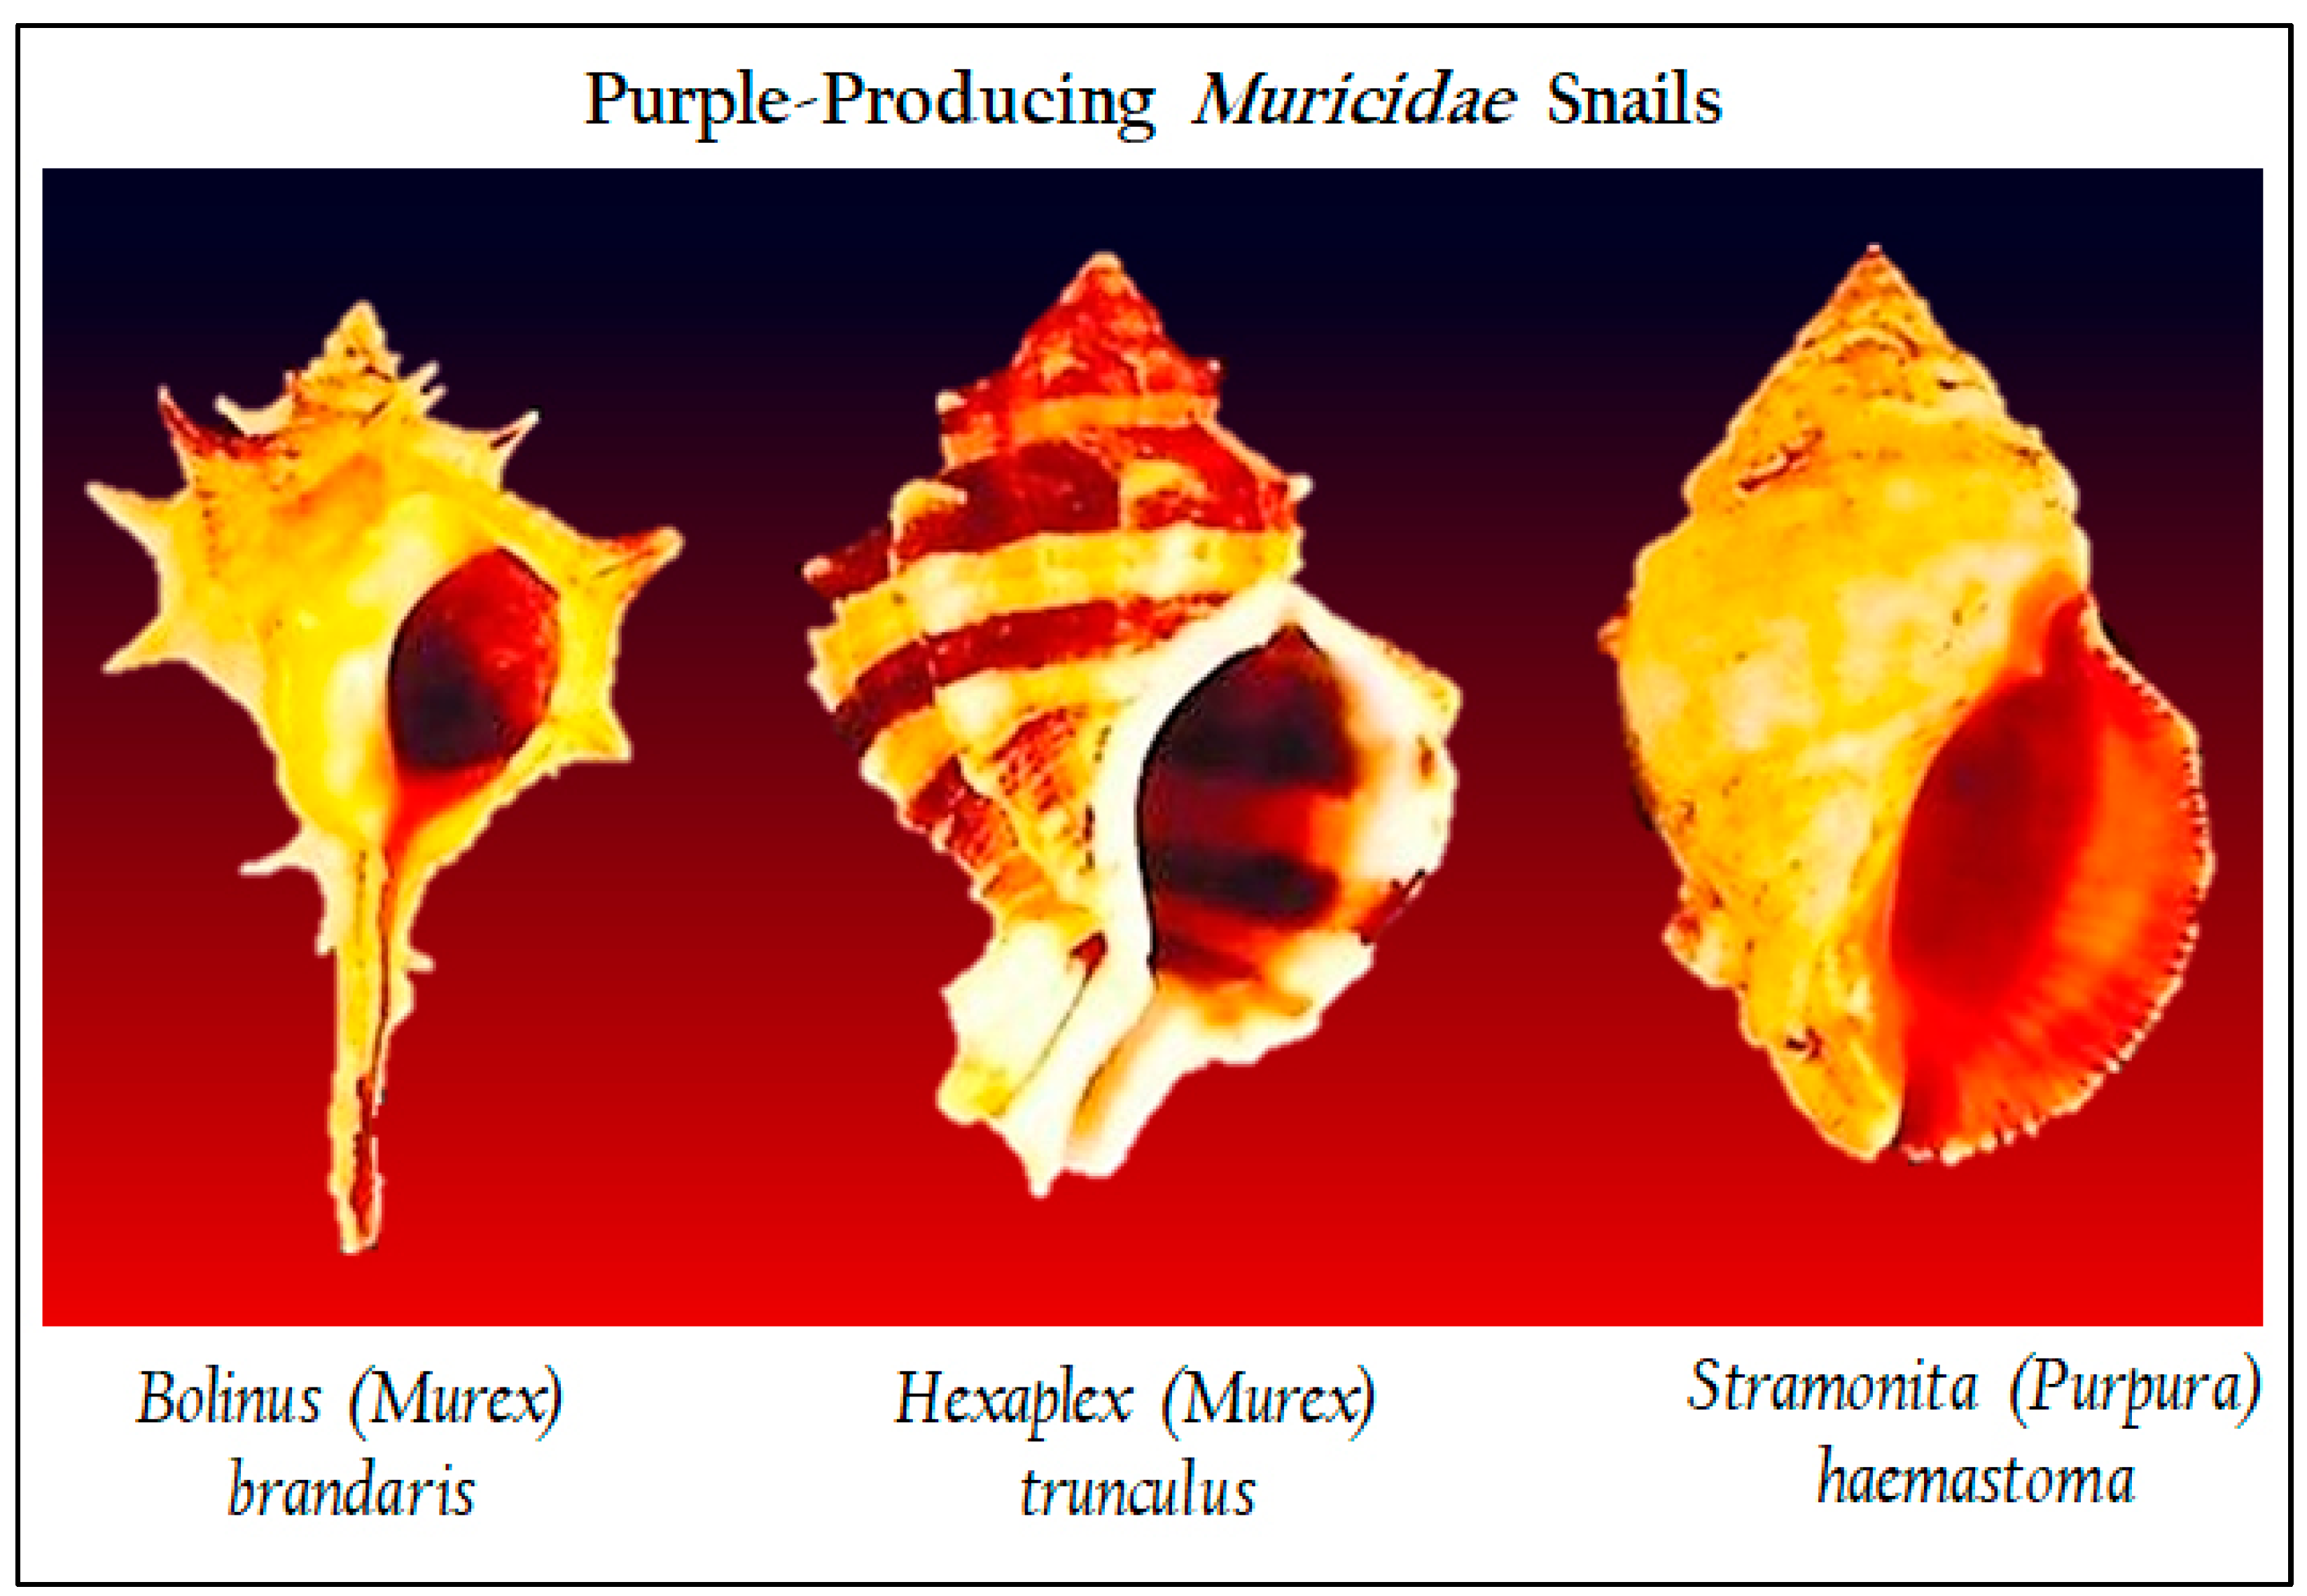
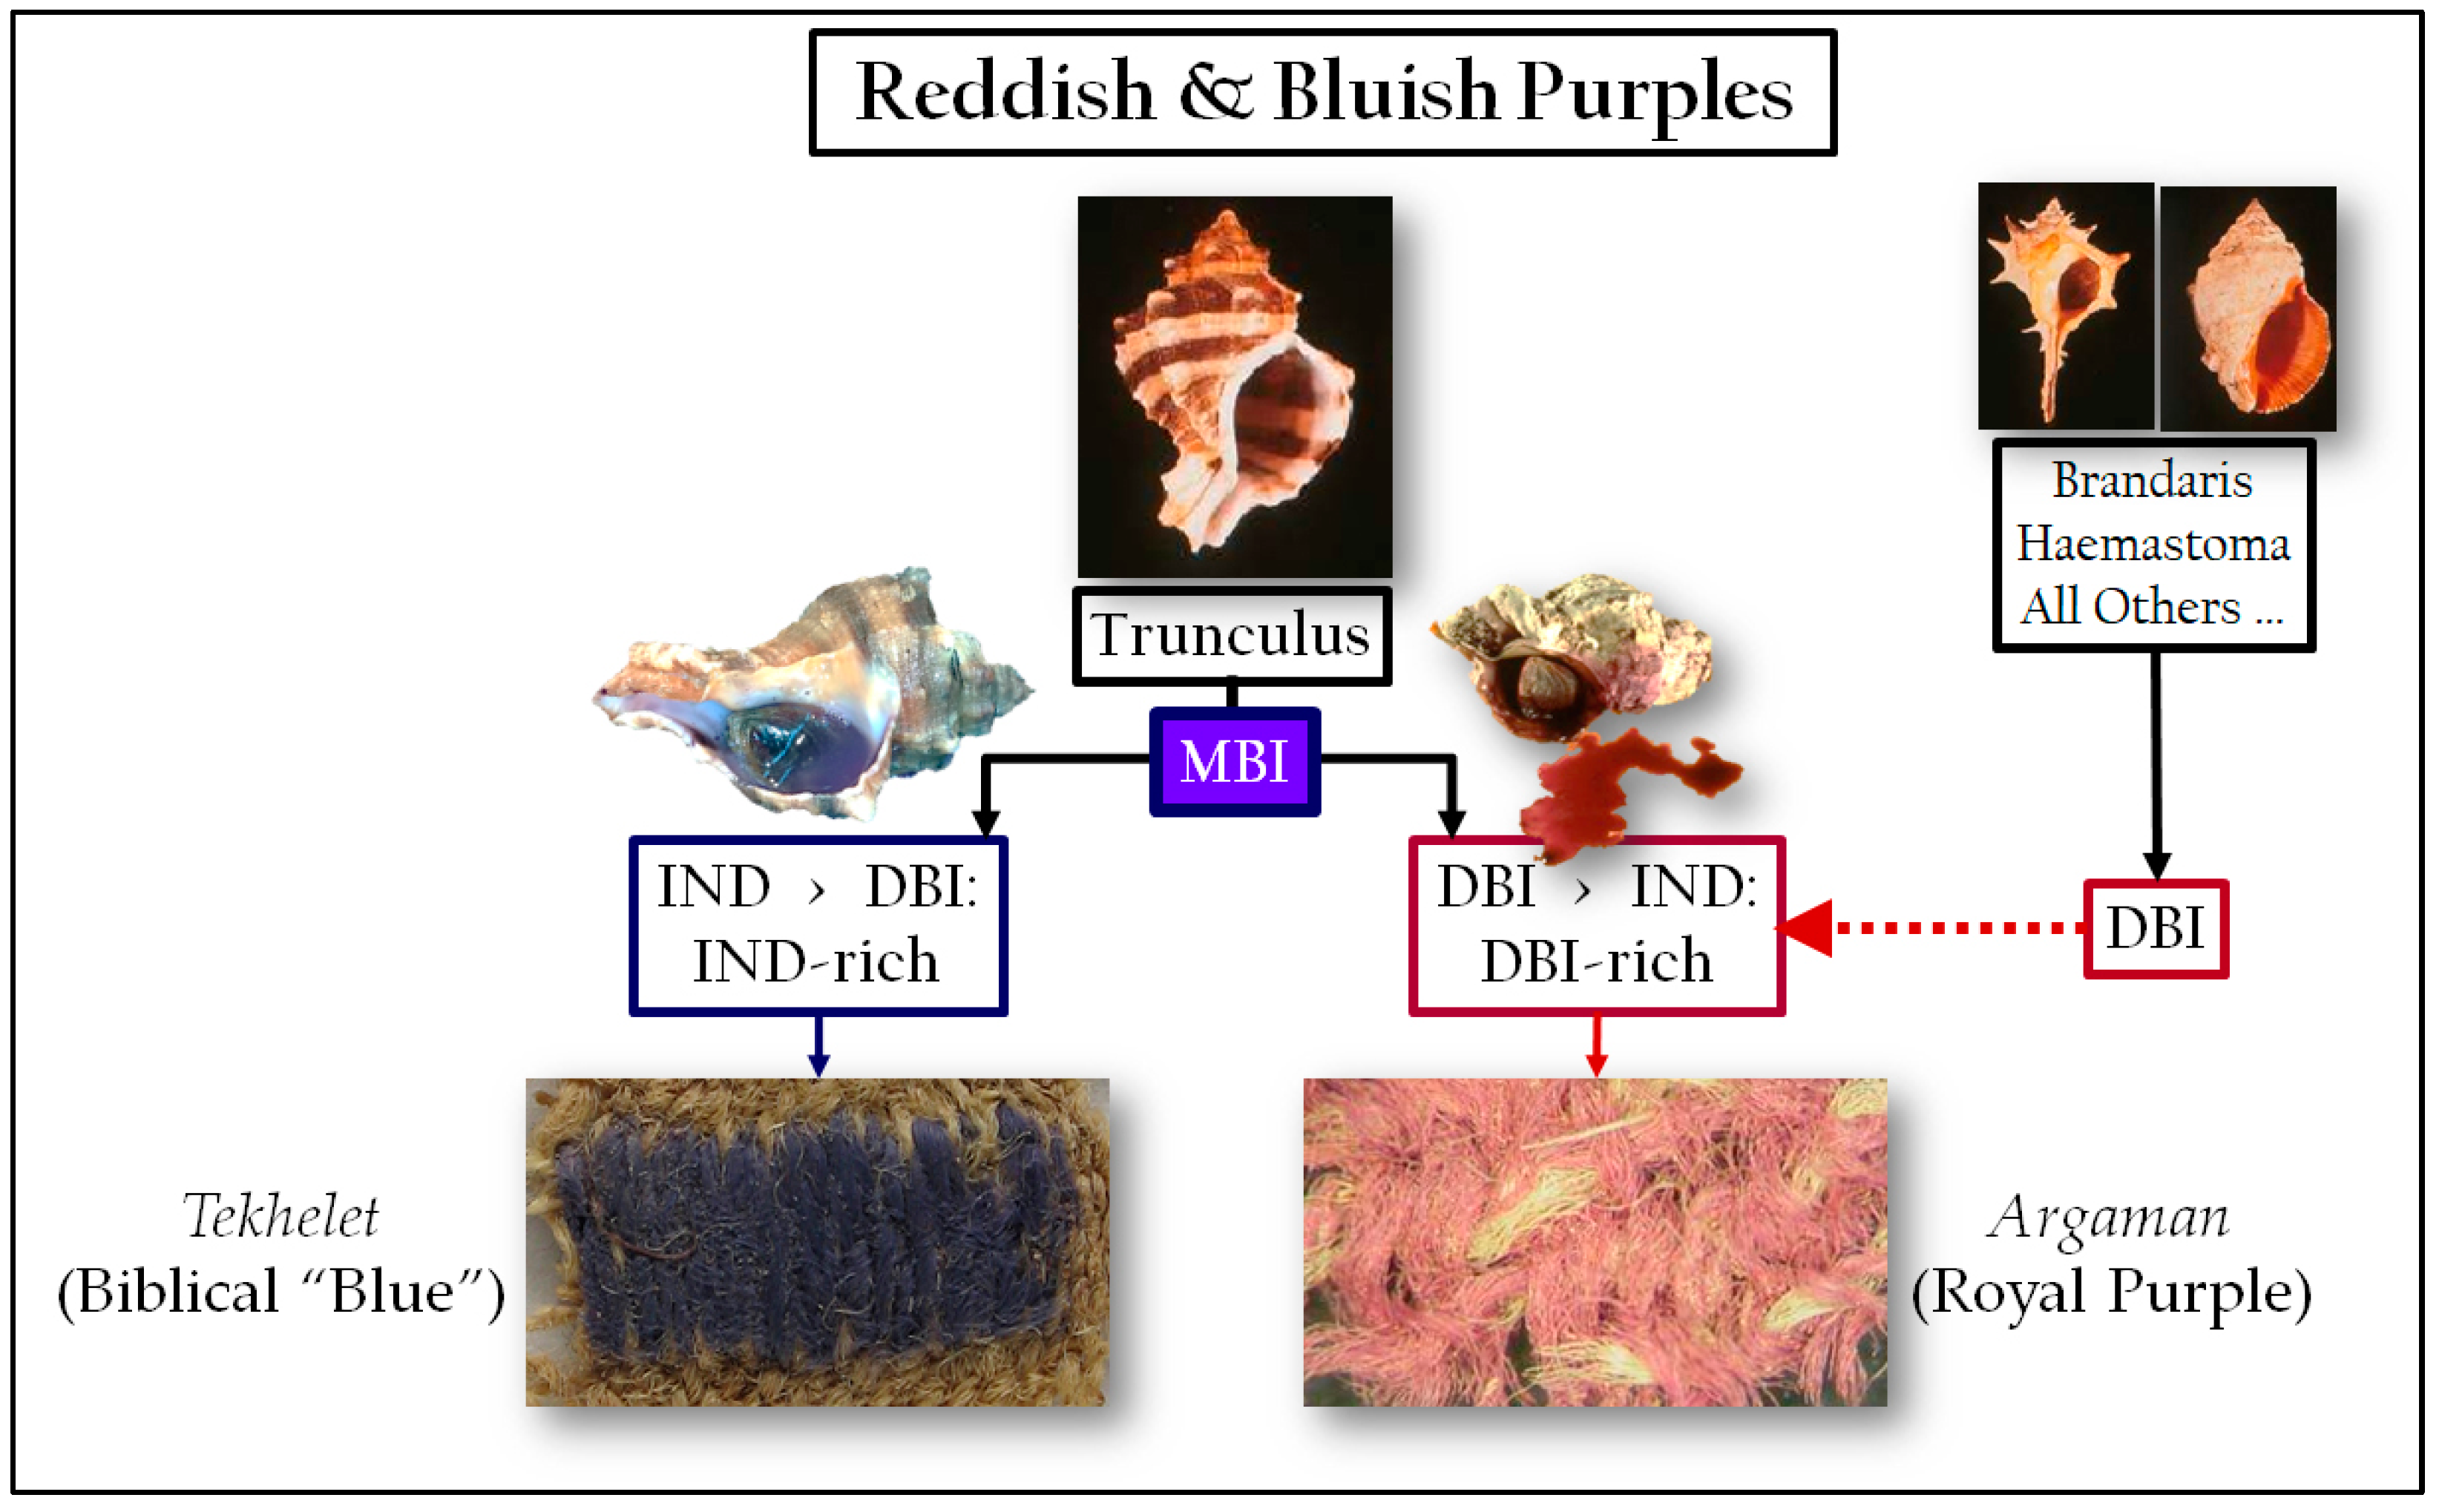
1.1. Introducing the Sea Snails
1.2. HPLC Über Alles
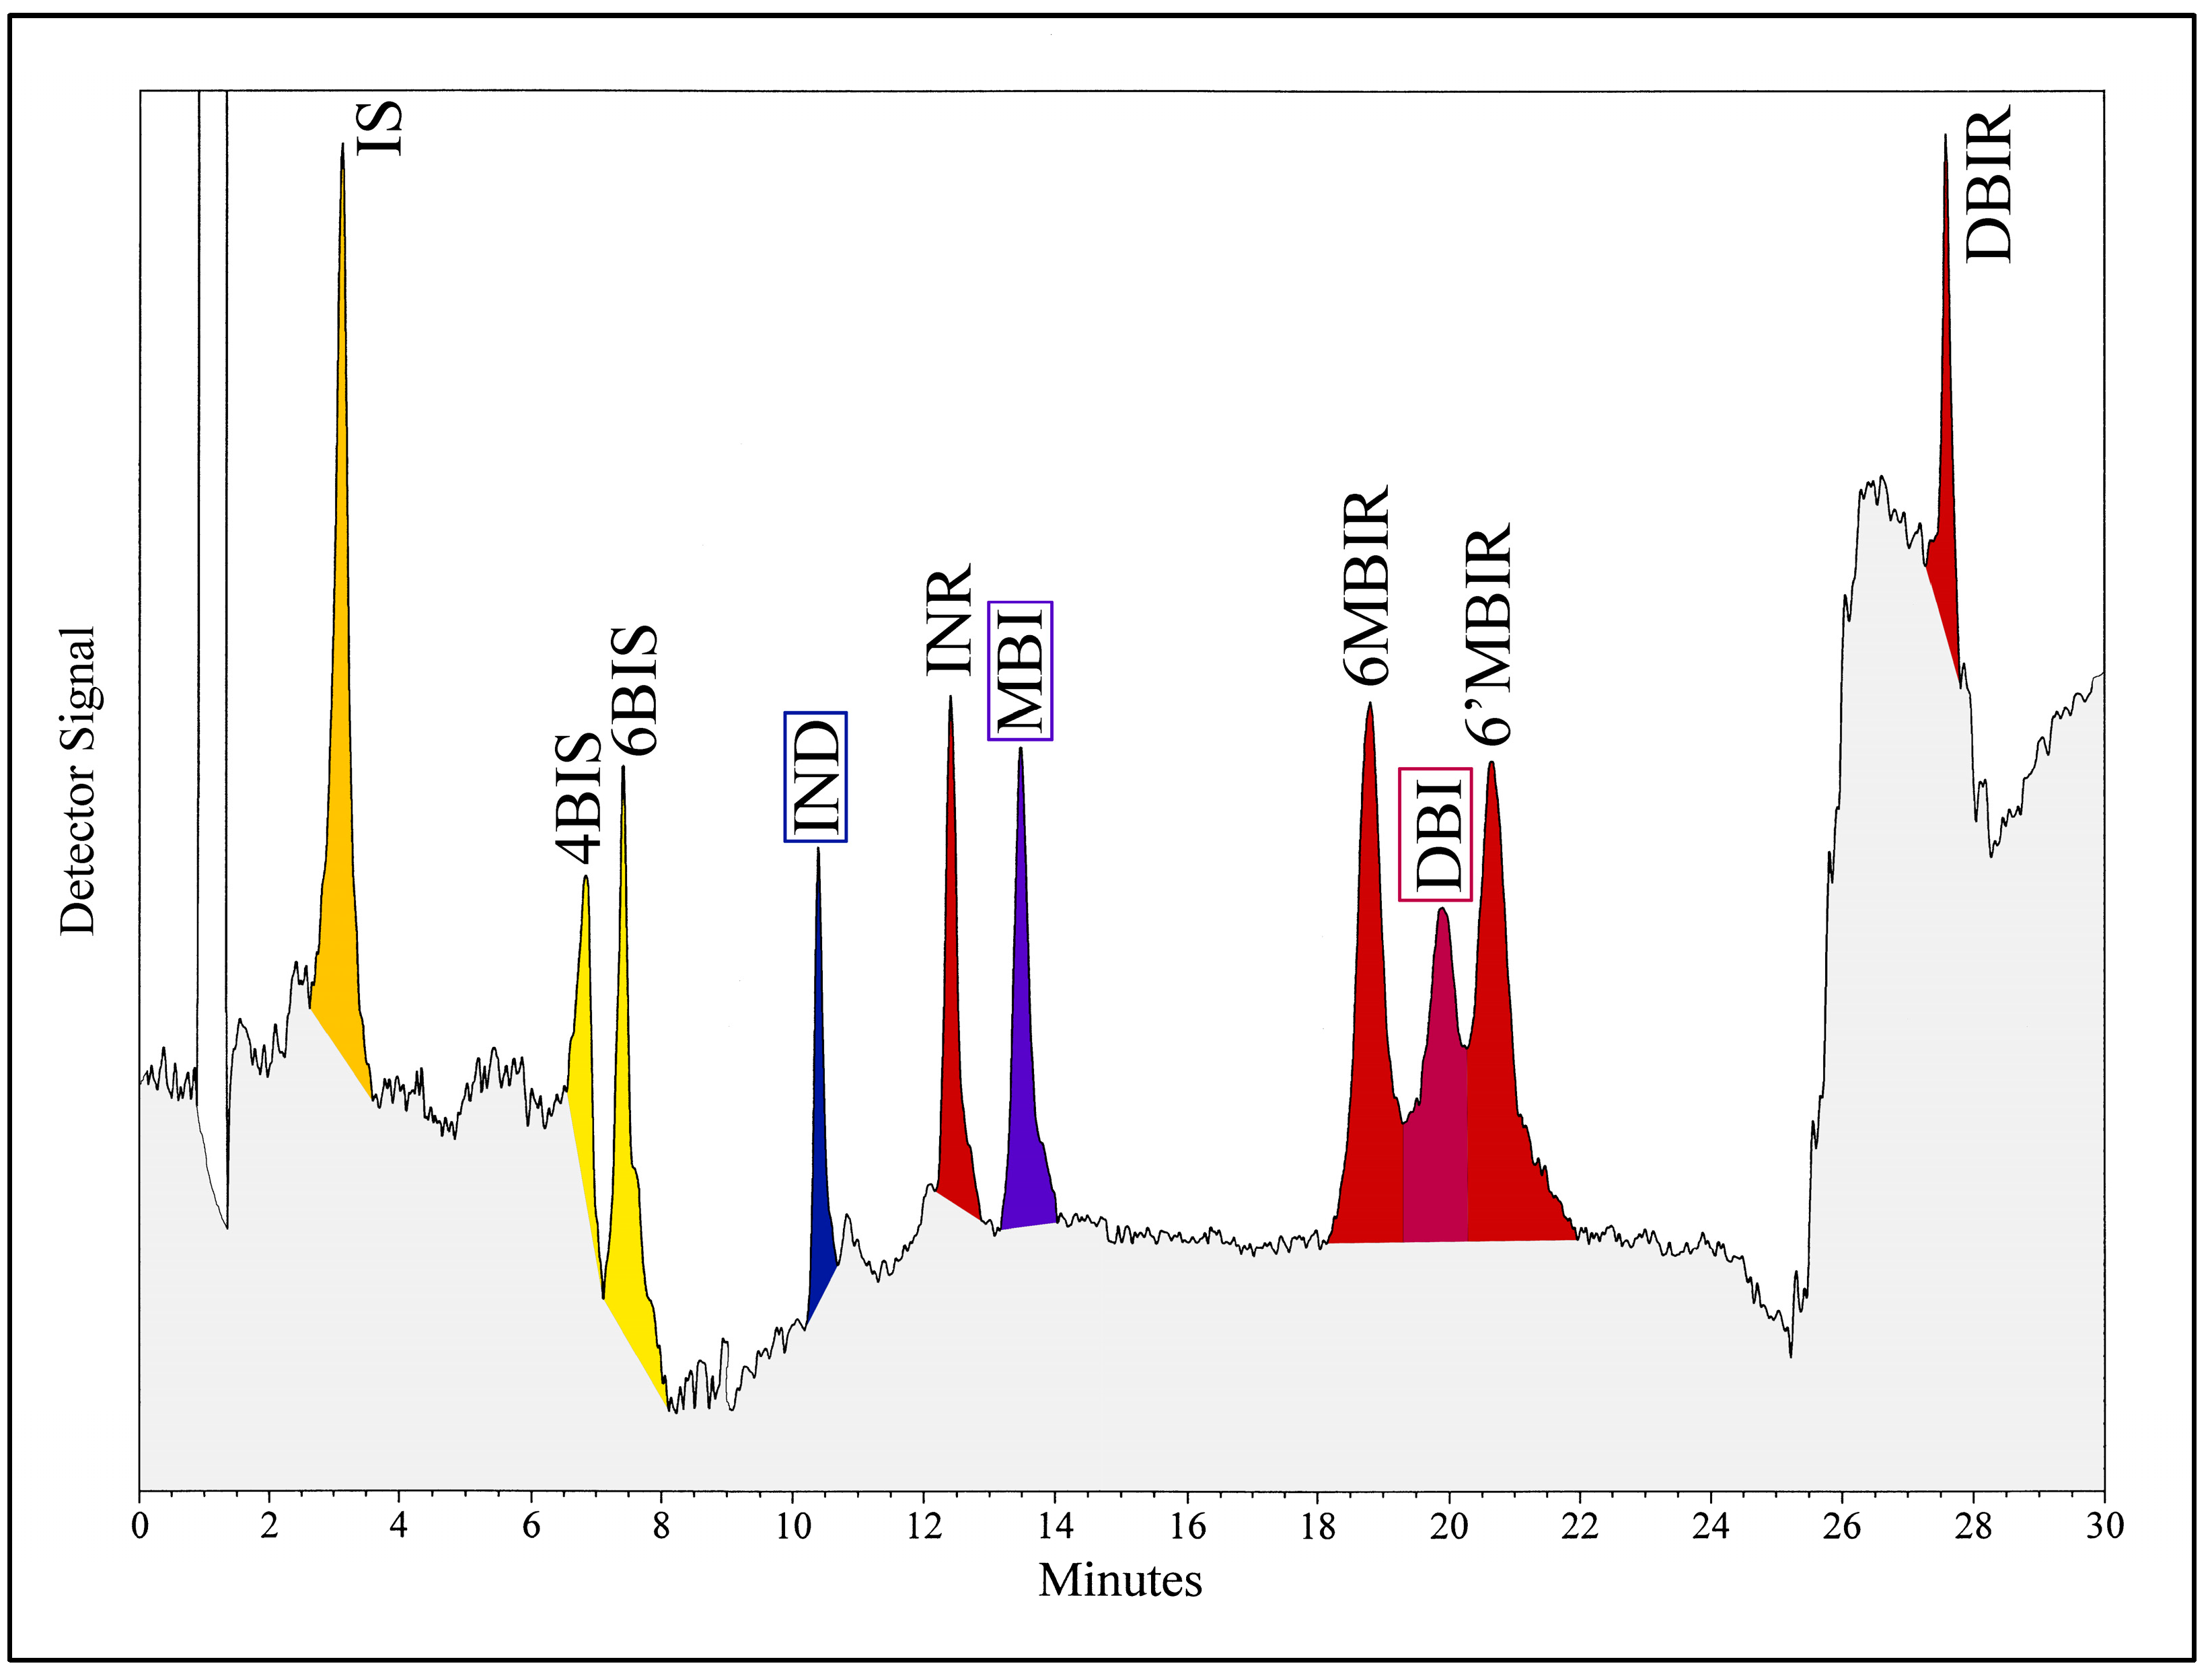
- Indigoids: blue indigo (IND), violet 6-monobromoindigo (MBI), reddish-purple 6,6′-dibromoindigo (DBI):
- Indirubinoids (all reddish-crimson): indirubin (INR), 6-monobromoindirubin (6MBIR), 6′-monobromoindirubin (6′MBIR), 6,6′-dibromoindirubin (DBIR);
- Isatinoids (yellowish): isatin (IS), 6-bromoisatin (6BIS).
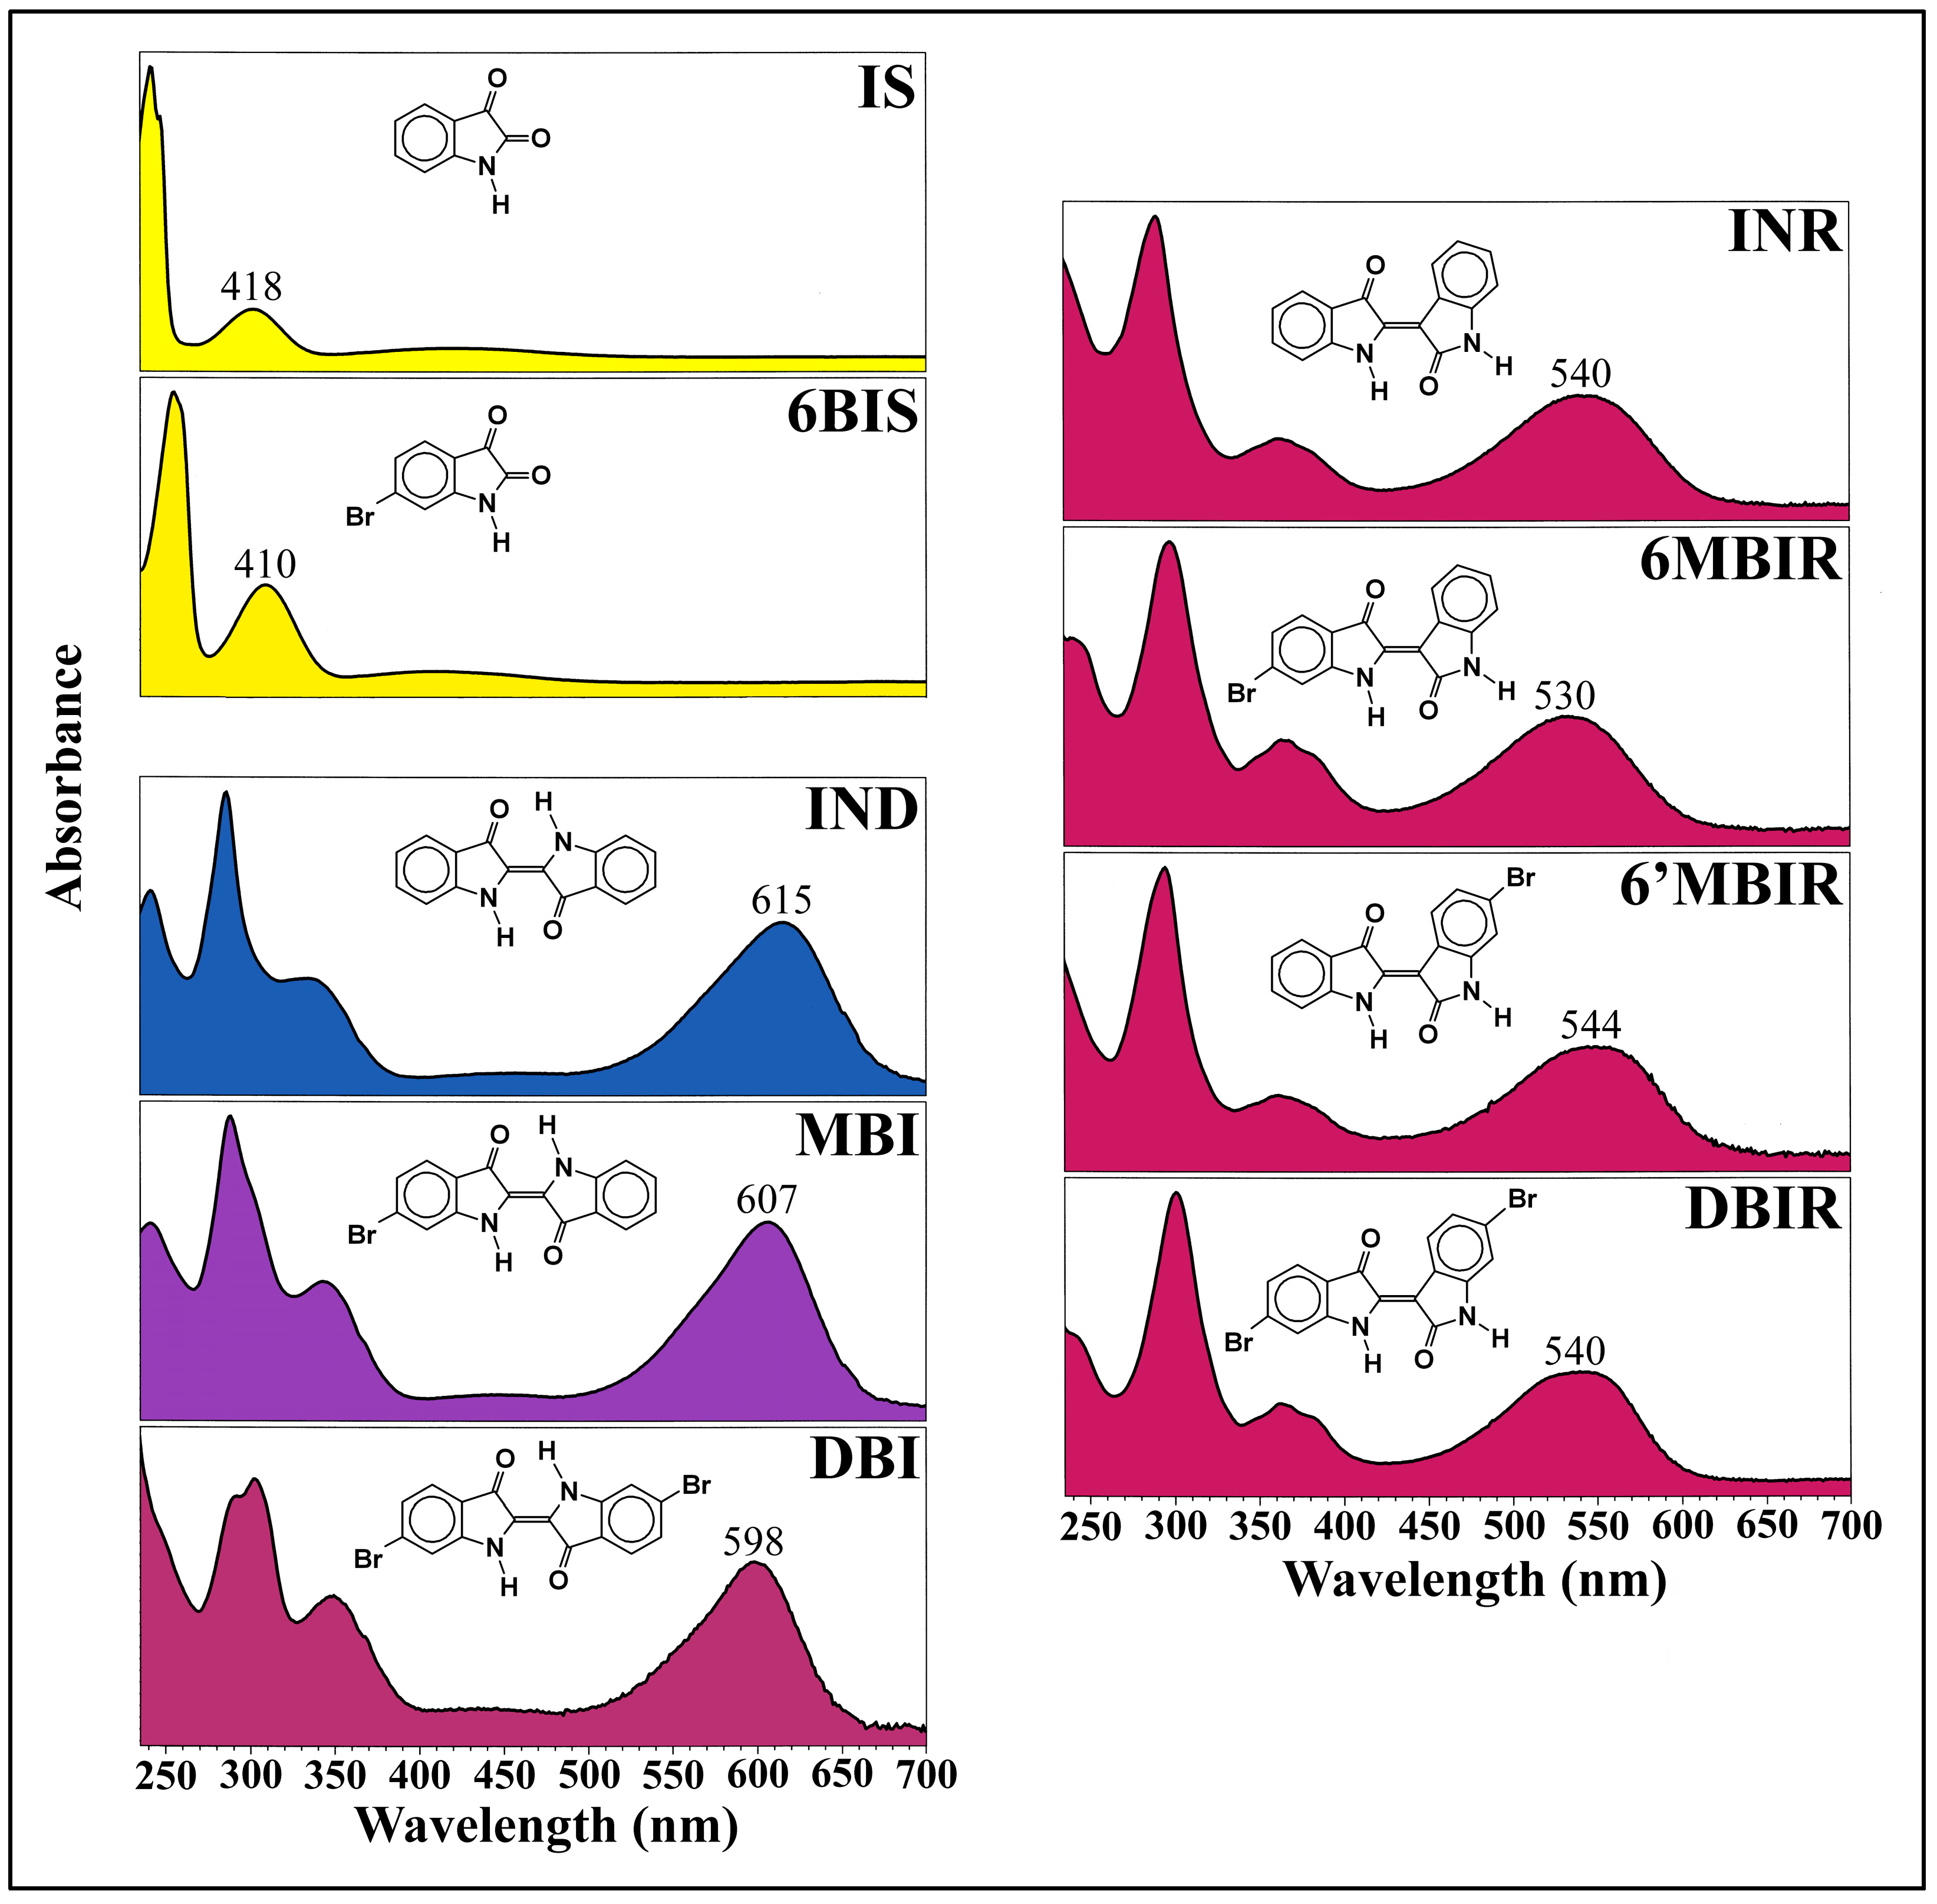
- The accompanying UV/Vis spectra of these molluscan colorants, as determined by the PDA (photo-diode array) detector of the HPLC, as well as their molecular structures, are shown in Figure 3. The spectra show that each homologous series of dyes has a common visible wavelength at maximum absorption, λmax, and for the isatinoids, the wavelength is around 415 nm, the indigoids’ is about 605 nm, and the indirubinoids’ is approximately 540 nm. It is important to note that the λmax values shown in the UV/Vis absorption spectra are specific for the solvent system in which the dye is solubilized. However, dyes dissolved in other solvents will nevertheless typically yield wavelengths that are close to these values.
1.3. Statistical Characterizations of Molluscan Purple
2. Materials and Methods
2.1. HPLC: Sample Preparation and Analysis
2.2. Materials Analyzed
3. Comparison Problems
3.1. Problems in Comparing Results from Different Researchers
3.1.1. Extraction in Minimal Light
3.1.2. Maximizing Extraction via the Optimal Solvent, Temperature, and Time
3.1.3. Immediate Filtration and Injection into the HPLC
3.1.4. HPLC Elution Methods
3.1.5. HPLC Detection Wavelength
4. Results and Discussion
4.1. Modern and Archaeological Purples

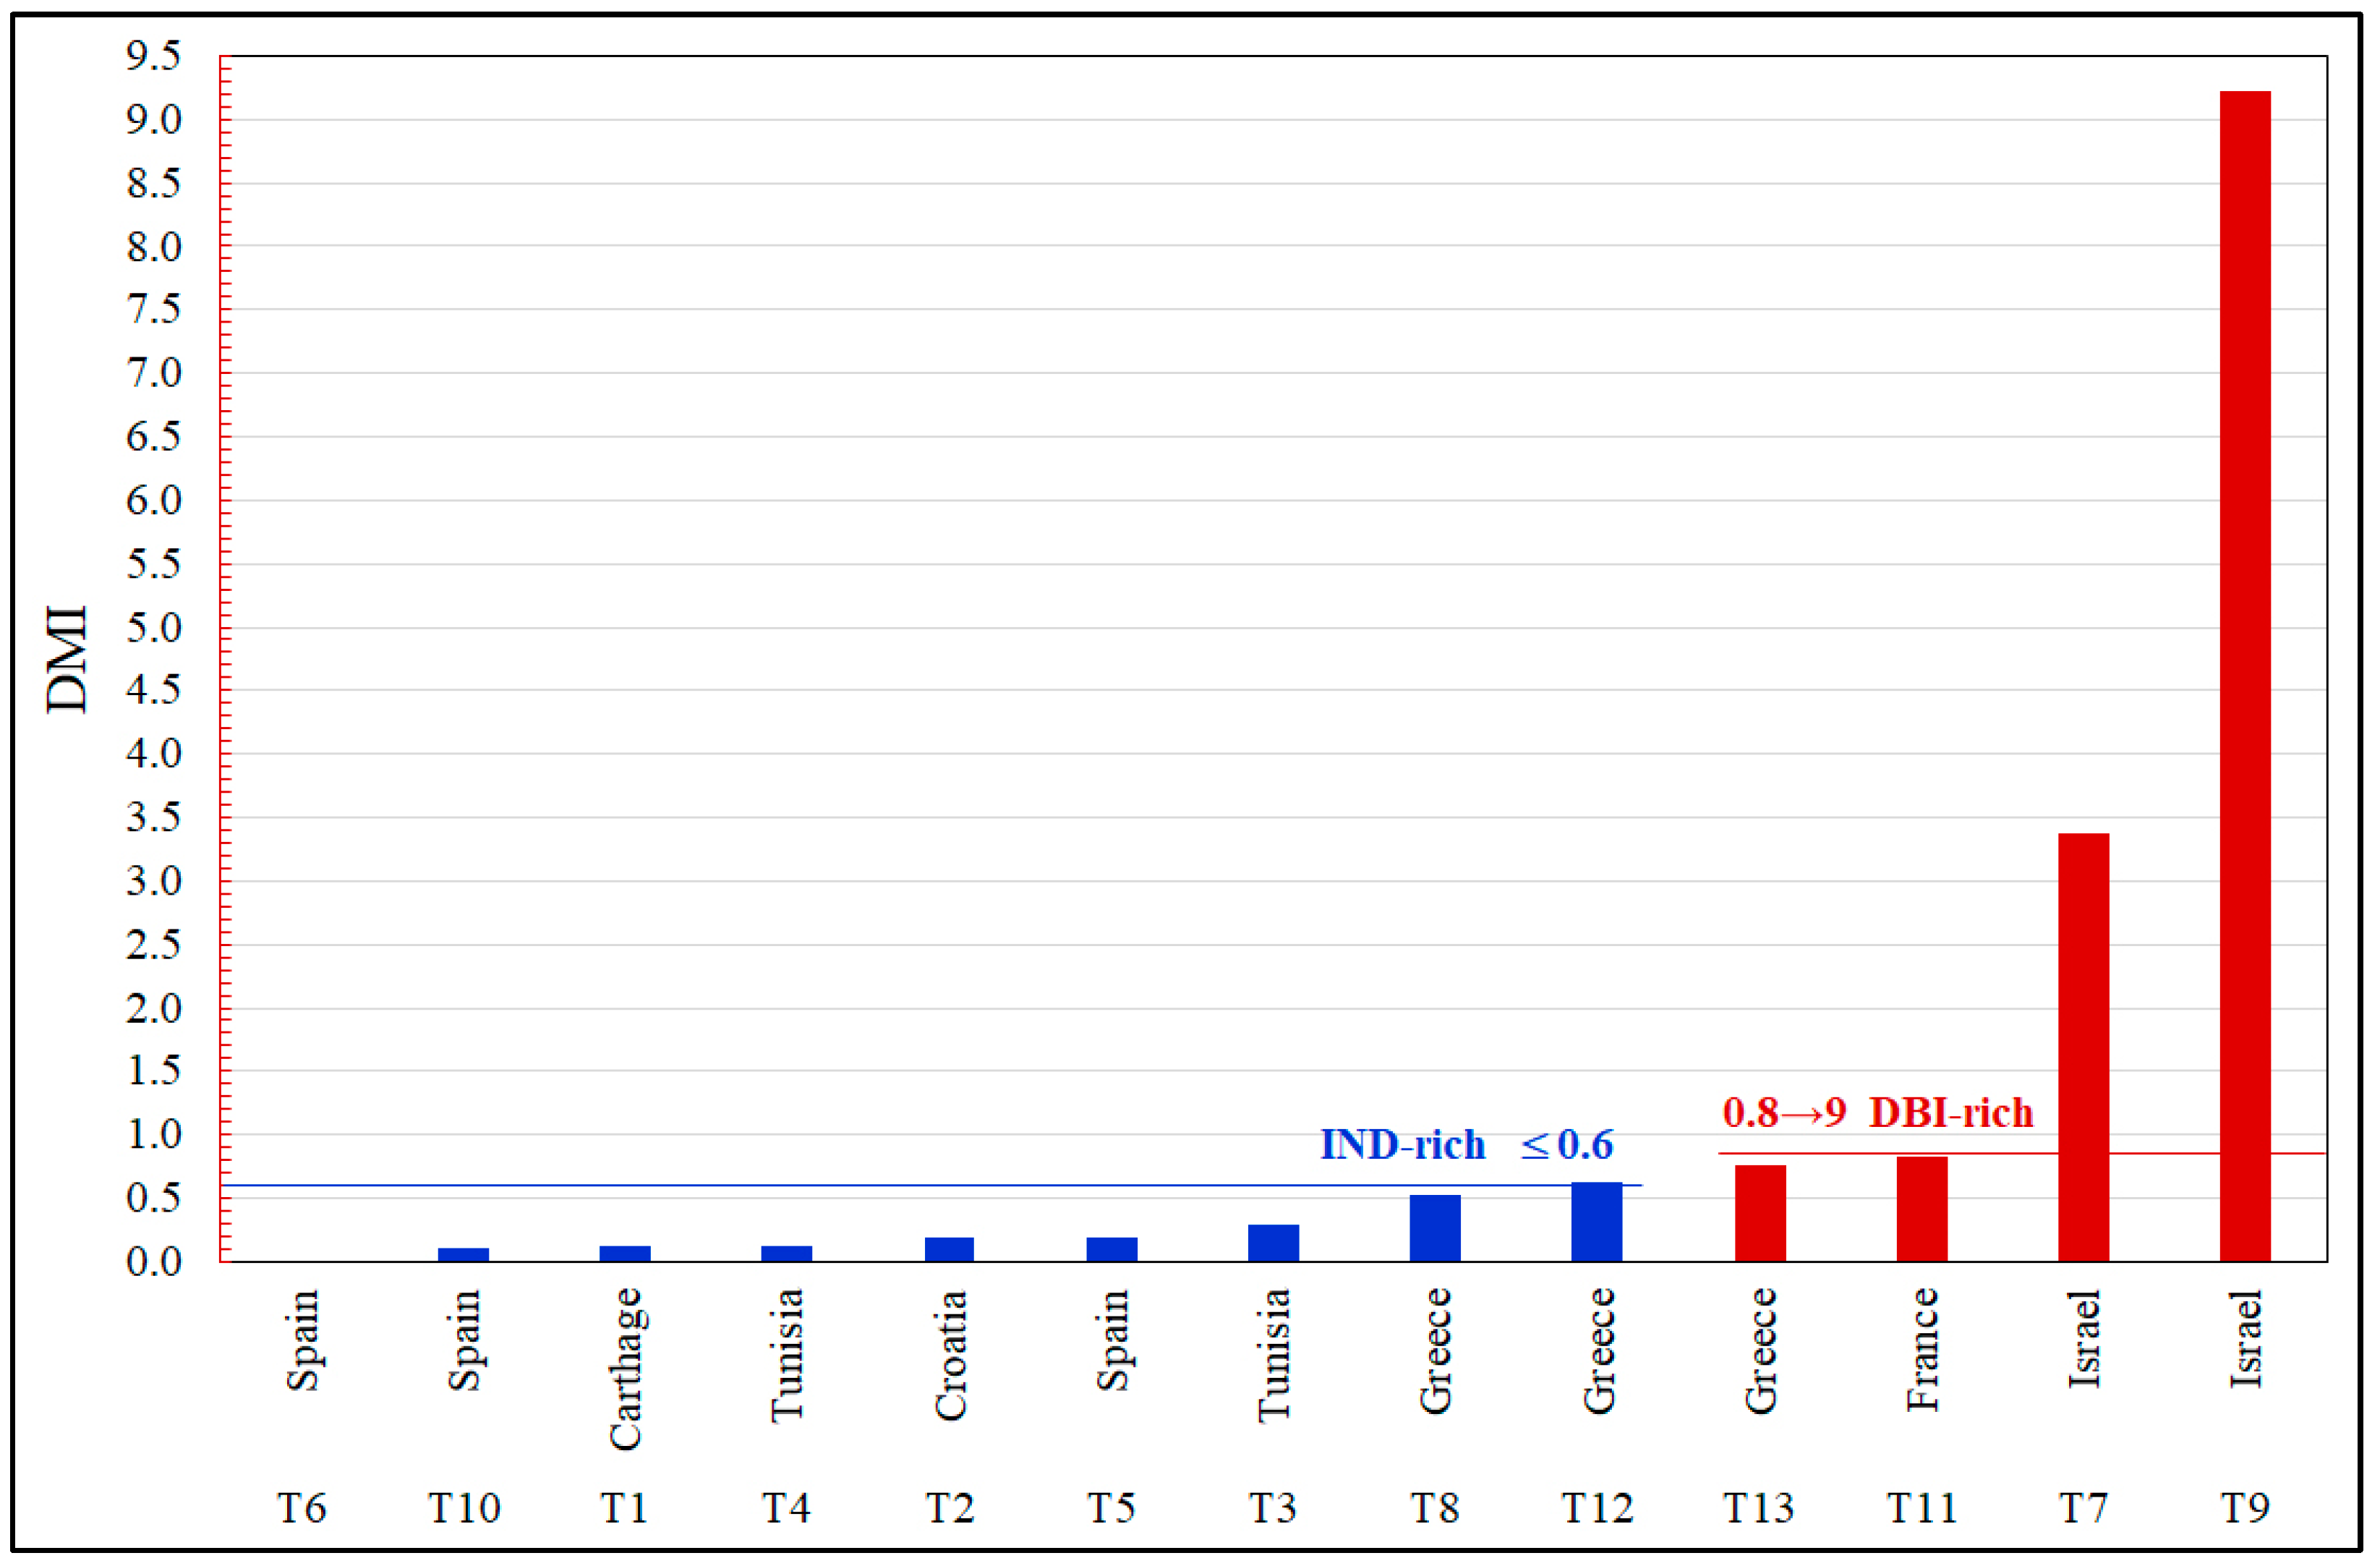
| Sample | Region | Description | Solvent Temp., Time * | Dye Components | DMI ** | Reference | ||||
|---|---|---|---|---|---|---|---|---|---|---|
| IND | INR | MBI | DBI | DBIR | ||||||
| T1 | Carthage, Tunisia | Shells crushed and exposed to air and sunlight | DMSO 80, 15 | 62.90 | 1.20 | 32.10 | 3.70 | 0.10 | 0.12 | [15] |
| T2 | Croatia | Snails removed from water, exuding pigment when expiring | DMSO 80, 15 | 49.80 | 4.40 | 37.60 | 7.10 | 1.10 | 0.19 | [15] |
| T3 | Tunisia | Tunisia “red”; gland excised in the dark | DMSO 80, 15 | 35.10 | 0.40 | 49.70 | 14.40 | 0.40 | 0.29 | [15] |
| T4 | Tunisia | Tunisia “blue”: T3 pigment in boiling water | DMSO 80, 15 | 54.00 | 1.50 | 39.40 | 4.90 | 0.20 | 0.12 | [15] |
| T5 | Tarragona, Spain | Stained, non-vatted, cotton | Pyridine 100, ? | 56.00 | 0.00 | 37.00 | 7.00 | 0.00 | 0.19 | [9,10] |
| T6 | Tarragona, Spain | Vat-dyed wool | Pyridine 100, ? | 53.00 | 14.00 | 33.00 | 0.00 | 0.00 | 0.00 | [9,10] |
| T7 | Akhziv, Israel | Pigment extracted from glands at the seashore | DMF 100, 5 | 4.05 | 0.00 | 17.79 | 60.00 | 18.16 | 3.37 | [17,22] |
| T8 | Saronikos, Greece | Glands exposed to 6 h sunlight, extracting 1 h with DMF, and dried | DMF 80, 15 | 35.20 | 8.10 | 30.50 | 15.80 | 10.40 | 0.52 | [15,20] |
| T9 | Akhziv, Israel | Same as T7 | DMSO 100, 5 | 0.35 | 0.00 | 7.41 | 68.39 | 23.85 | 9.23 | [17] |
| T10 | Spain | Pigment | DMSO 100, 5 | 40.72 | 3.34 | 41.33 | 4.25 | 10.36 | 0.10 | [17] |
| T11 | France | Pigment on talc substrate | DMSO room, 10 | 10.30 | 2.90 | 44.40 | 36.80 | 5.60 | 0.83 | [23] |
| T12 | Hermione, Greece | Pigment | DMF ?, ? | 27.80 | 7.50 | 37.40 | 23.20 | 4.10 | 0.62 | [15] |
| T13 | Thessaloniki, Greece | Excised glands exposed to direct sunlight for 3 h | DMSO 80, 30 | 7.3 | 2.2 | 30.4 | 22.9 | 37.2 | 0.75 | [21] |
| Sample | Region | Description | Solvent Temp., Time | Dye Components | DMI | Reference | ||||
|---|---|---|---|---|---|---|---|---|---|---|
| IND | INR | MBI | DBI | DBIR | ||||||
| Bolinus brandaris | ||||||||||
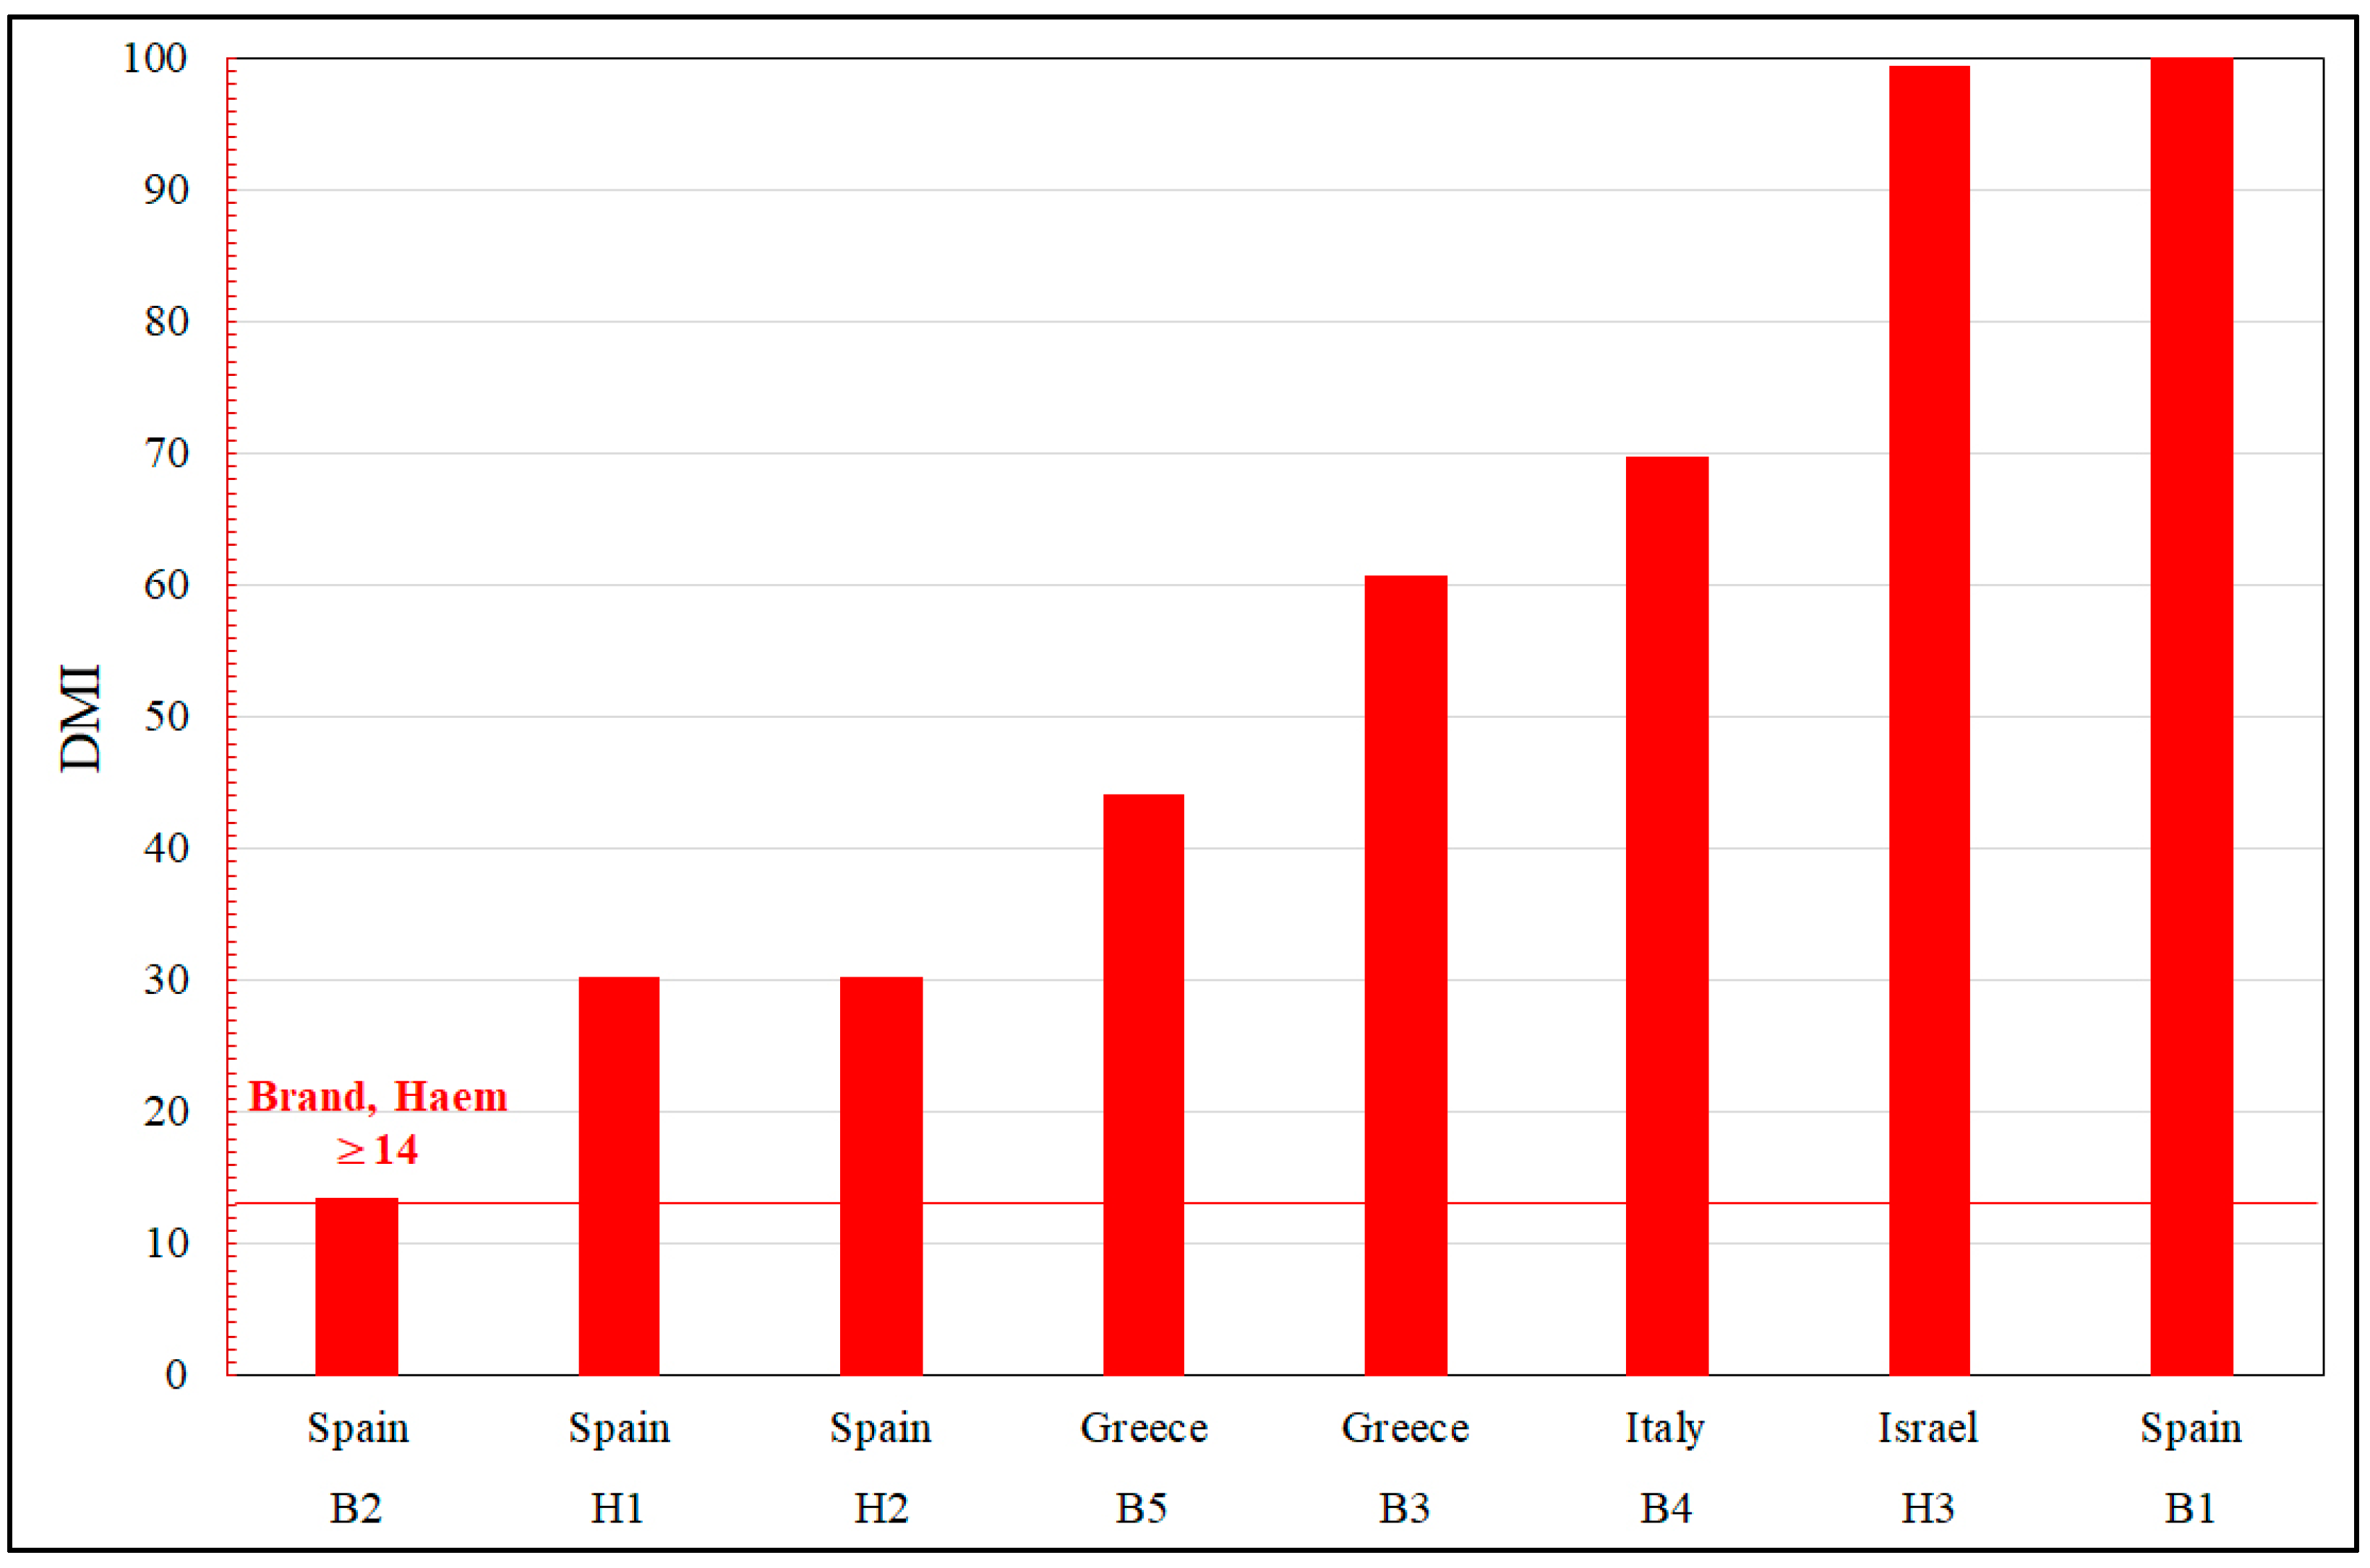
| B1 | Tarragona, Spain | Sample was stained cotton (not vat) | Pyridine 100, ? | 0.00 | 0.00 | 0.00 | 85.00 | 15.00 | ∞ | [9,10] |
| B2 | Tarragona, Spain | Sample was dyed wool (vat) | Pyridine 100, ? | 0.00 | 0.00 | 6.00 | 81.00 | 13.00 | 13.5 | [9,10] |
| B3 | Saronikos, Greece | Glands exposed to 6 h sunlight, extracting 1 h with DMF, and dried | DMF 80, 15 | 0.001 | 0.00 | 1.60 | 97.20 | 1.20 | 60.8 | [15,20] |
| B4 | Fiumicino, Italy | Pigment | DMSO 100, 5 | 0.00 | 0.00 | 1.36 | 94.88 | 3.76 | 69.8 | [17] |
| B5 | Thera, Greece | Glands exposed to direct sunlight for 3 h | DMSO 80, 30 | 2.00 | 0.50 | 1.80 | 79.30 | 16.40 | 44.1 | [21,24] |
| Stramonita haemastoma | ||||||||||
| H1 | Tarragona, Spain | Stained, not vatted, cotton | Pyridine 100, ? | 0.00 | 0.00 | 3.00 | 91.00 | 6.00 | 30.3 | [9,10] |
| H2 | Tarragona, Spain | Dyed, vatted, wool | Pyridine 100, ? | 0.00 | 0.00 | 3.00 | 91.00 | 6.00 | 30.3 | [9,10] |
| H3 | Palmahim, Israel | Pigment extracted at seashore | DMSO 100, 5 | 0.00 | 0.00 | 0.86 | 85.48 | 13.66 | 99.4 | [17] |
| Sample | Region | Description | Period | Dye Components | DMI | Reference | ||||
|---|---|---|---|---|---|---|---|---|---|---|
| IND | INR | MBI | DBI | DBIR | ||||||
| Ak1 * | Akrotiri | Lump of purple pigment | 17th c. BCE | 1.10 | 0.00 | 20.10 | 71.80 | 7.00 | 3.57 | [15] |
| Ak2 * | Akrotiri | Purple pigment from wall painting | 1.70 | 0.00 | 18.80 | 77.60 | 1.90 | 4.13 | [15] | |
| Ak3 * | Akrotiri | Purple pigment in New Pillar Pit | 3.20 | 0.00 | 27.10 | 65.90 | 3.80 | 2.43 | [15] | |
| Tr * | Trianda | Purple pigment | 2.50 | 0.00 | 24.40 | 66.20 | 6.90 | 2.71 | [15] | |
| Ra * | Raos | Purple pigment from wall painting | 1.60 | 0.00 | 15.50 | 77.30 | 5.60 | 4.99 | [15] | |
| E1 * | Greece | Epitaphios textile, Benaki Museum | Byzantine14th c. CE | 48.60 | 0.00 | 25.90 | 25.00 | 0.50 | 0.97 | [15] |
| E2 * | Greece | 48.00 | 0.40 | 25.40 | 25.60 | 0.60 | 1.01 | [15] | ||
| DsP * | Daskyleion, Turkey | Painted decoration on burial couch | 5th c. BCE | 21.3 | 0.1 | 31.4 | 8.8 | 38.4 | 0.28 | [21] |
| DsT * | Textile from the burial site | 14.0 | 0.1 | 42.0 | 12.8 | 31.1 | 0.30 | [21] | ||
| Ro * | Thessaloniki | Purple fabric from sarcophagus | 3rd c. CE | 2.50 | 0.00 | 32.70 | 58.30 | 6.50 | 1.78 | [16] |
| Da ** | Iran | Pigment from painted stone jar | 5th c. BCE | 0.19 | 0.00 | 14.84 | 82.61 | 2.36 | 5.57 | [17] |
| K1 *** | Egypt | Polychrome textile in Katoen Natie, Antwerp | 5th c. CE | 50.50 | 0.00 | 35.10 | 13.70 | 0.70 | 0.39 | [13] |
| K2 *** | Egypt | 28.98 | 0.00 | 42.48 | 26.88 | 1.66 | 0.63 | [13] | ||
| K3 *** | Egypt | 2.36 | 0.00 | 53.48 | 43.02 | 1.14 | 0.80 | [13] | ||
| J1 ** | Judean Desert, Israel | Various purple textiles from Ancient Israel | 1st c. BCE | 11.23 | 0.08 | 36.05 | 50.62 | 2.02 | 1.40 | Herein |
| J2 ** | 1st c. BCE—1st c. CE | 33.07 | 0.07 | 48.15 | 17.89 | 0.82 | 0.37 | Herein | ||
| J3 ** | 22.01 | 0.34 | 28.19 | 49.47 | 0.00 | 1.76 | Herein | |||
| J4 ** | 19.35 | 0.25 | 45.53 | 34.87 | 0.00 | 0.77 | Herein | |||
| J5 ** | 11.76 | 0.00 | 40.28 | 47.97 | 0.00 | 1.19 | Herein | |||
| J6 ** | 34.19 | 0.00 | 30.68 | 33.84 | 1.29 | 1.10 | Herein | |||
| J7 ** | 3.87 | 2.54 | 46.61 | 46.99 | 0.00 | 1.01 | Herein | |||
| J8 ** | 2nd c. CE | 89.00 | 0.00 | 10.00 | 1.00 | 0.00 | 0.10 | Herein | ||
| J9 ** | 90.40 | 0.00 | 9.10 | 0.50 | 0.00 | 0.05 | Herein | |||
| J10 ** | 56.16 | 0.00 | 35.56 | 8.28 | 0.00 | 0.23 | Herein | |||
| P0 ** | Siberia | Pazyryk polychromic saddle cloth | 4th c. BCE | 6.7 | 0.00 | 44.6 | 48.6 | 0.00 | 1.09 | Herein |
| P1 ** | Siberia | 26.1 | 0.00 | 56.4 | 17.5 | 0.00 | 0.31 | Herein | ||
| P2 ** | Siberia | 30.9 | 0.00 | 51.49 | 17.6 | 0.00 | 0.34 | Herein | ||
| P3 ** | Siberia | 15.9 | 0.00 | 44.9 | 39.2 | 0.00 | 0.87 | Herein | ||
| L ** | Leeds, UK | Purple-dyed cotton of C.S. Bedford | ≥1910 CE | 12.00 | 0.00 | 1.00 | 87.00 | 0.00 | 87.00 | [25] |
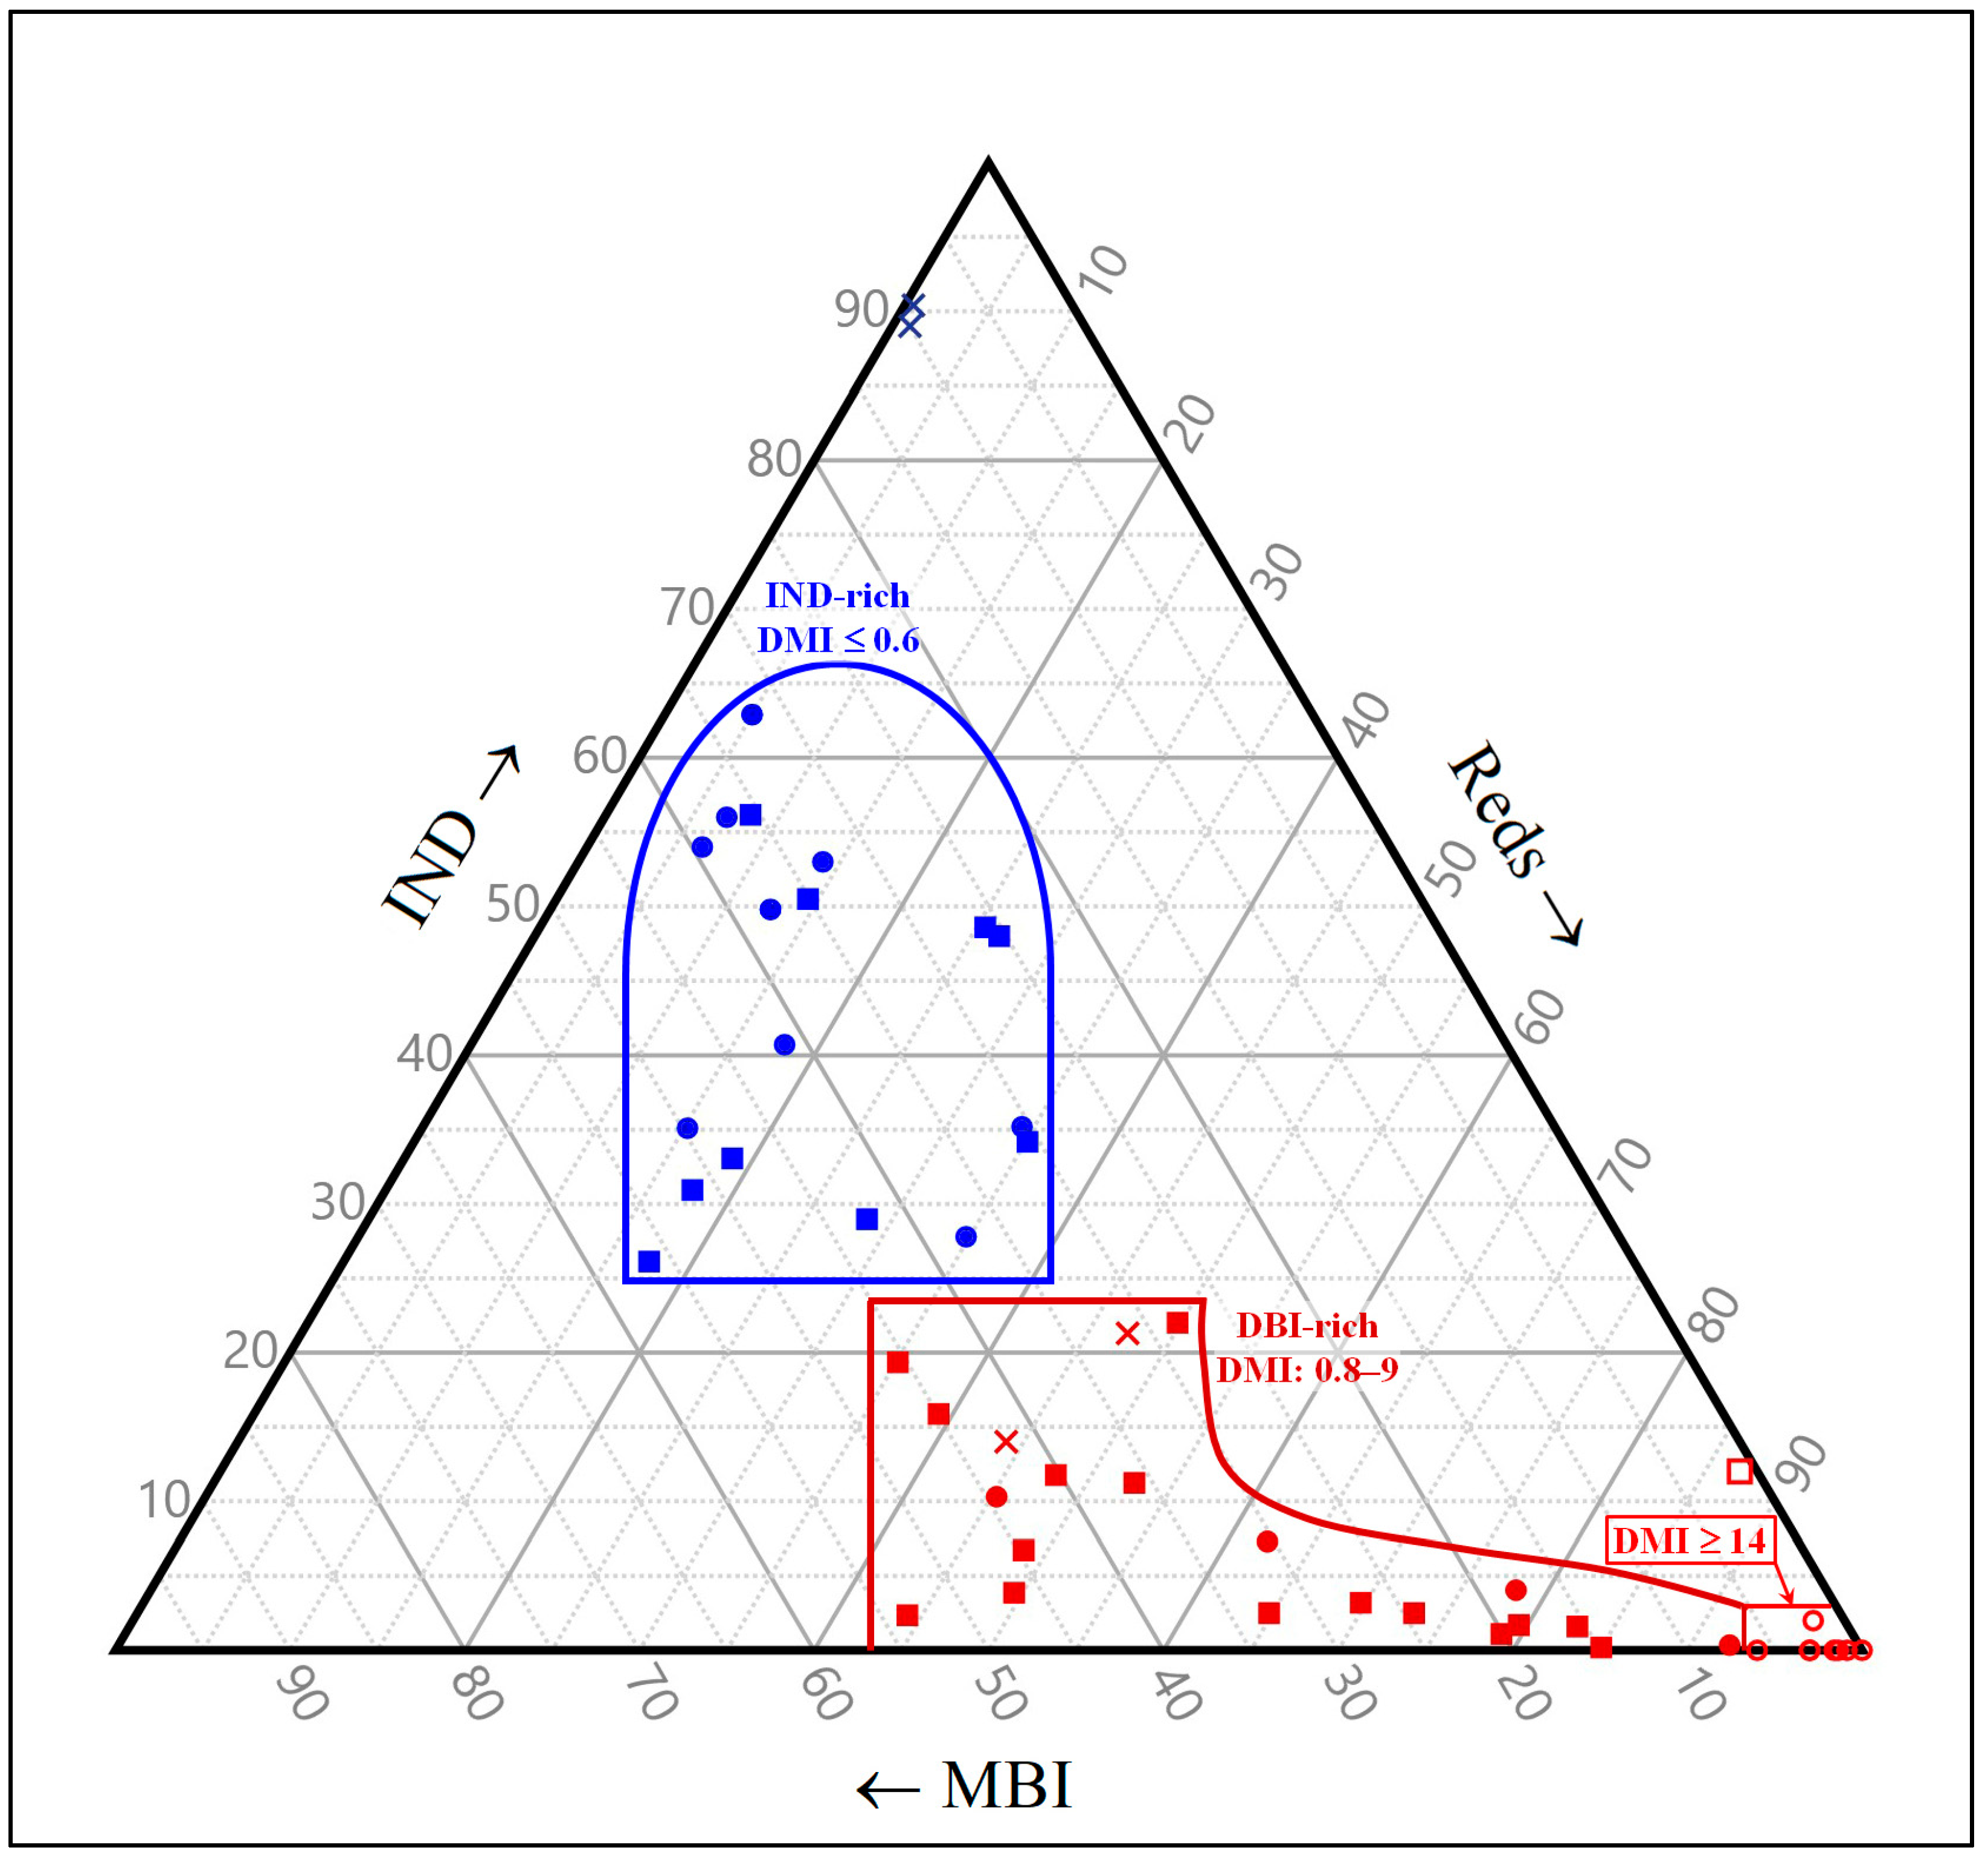
4.2. Di-Mono Index
4.3. Ternary Diagram
5. Conclusions
Funding
Acknowledgments
Conflicts of Interest
References
- Cardon, D. Natural Dyes: Sources, Tradition, Technology and Science; Archetype Publications: London, UK, 2007. [Google Scholar]
- Orna, M.V. March of the Pigments: Color History, Science and Impact; Royal Society of Chemistry: London, UK, 2022. [Google Scholar]
- Orna, M.V. The Chemical History of Color; Springer Briefs in Molecular Science, History of Chemistry, Springer Science & Business Media: Heidelberg, Germany; New York NY, USA, 2012; Chapter 4; pp. 47–78. [Google Scholar]
- Koren, Z.C. Archaeological shades of purple from flora and fauna from the ancient Near East. In Archaeological Chemistry: A Multidisciplinary Analysis of the Past; Orna, M.V., Rasmussen, S., Eds.; Cambridge Scholars Publishing: Newcastle upon Tyne, UK, 2020; Chapter 13; pp. 256–300. [Google Scholar]
- Cooksey, C.J. Tyrian Purple: 6,6’-dibromoindigo and related compounds. Molecules 2001, 6, 736–769. [Google Scholar] [CrossRef] [Green Version]
- Cooksey, C. Tyrian purple: The first four thousand years. Sci. Prog. 2013, 96, 171–186. [Google Scholar] [CrossRef]
- Karapanagiotis, I. A Review on the Archaeological Chemistry of Shellfish Purple, Special Issue “Natural Sciences in Archaeology and Cultural Heritage. Sustainability 2019, 11, 3595. [Google Scholar] [CrossRef] [Green Version]
- Koren, Z.C. New chemical insights into the ancient molluskan purple dyeing process. In Archaeological Chemistry VIII; ACS Symposium Series 1147; Armitage, R.A., Burton, J.H., Eds.; American Chemical Society: Washington, DC, USA, 2013; Chapter 3; pp. 43–67. [Google Scholar]
- Wouters, J.; Verhecken, A. High-performance liquid chromatography of blue and purple indigoid natural dyes. J. Soc. Dye. Colour. 1991, 107, 266–269. [Google Scholar] [CrossRef]
- Wouters, J. A new method for the analysis of blue and purple dyes in textiles. Dye. Hist. Archaeol. 1992, 10, 17–21. [Google Scholar]
- Koren, Z.C. HPLC-PDA analysis of brominated indirubinoid, indigoid, and isatinoid dyes. In Indirubin, the Red Shade of Indigo; Meijer, L., Guyard, N., Skaltsounis, L., Eisenbrand, G., Eds.; Life in Progress Editions: Roscoff, France, 2006; Chapter 5; pp. 45–53. [Google Scholar]
- Koh, A.; Apostolakou, V.; Pareja, M.N.; Crandall, A.M.; Betancourt, P.P. Organic residue studies. In Alatzomouri Pefka: A Middle Minoan IIB Workshop Making Organic Dyes; Apostolakou, V., Brogan, T.M., Betancourt, P.P., Eds.; INSTAP Academic Press: Philadelphia, PA, USA, 2020; Chapter 13; pp. 111–118. [Google Scholar]
- Koren, Z.C.; Verhecken-Lammens, C. Microscopic and chromatographic analyses of molluskan purple yarns in a late Roman Period textile. E-Preserv. Sci. 2013, 10, 27–34. [Google Scholar]
- Koren, Z.C. Editorial: Extracting thousands of years of colorful dye history through analytical science. Palest. Explor. Q. 2011, 143, 1–3. [Google Scholar] [CrossRef] [Green Version]
- Karapanagiotis, I.; Mantzouris, D.; Cooksey, C.; Mubarak, M.S.; Tsiamyrtzis, P. An improved HPLC method coupled to PCA for the identification of Tyrian Purple in archaeological and historical samples. Microchem. J. 2013, 110, 70–80. [Google Scholar] [CrossRef]
- Karapanagiotis, I.; Sotiropoulou, S.; Vasileiadou, S.; Karagiannidou, E.; Mantzouris, D.; Tsiamyrtzis, P. Shellfish purple and gold threads from a Late Antique tomb excavated in Thessaloniki. Arachne 2018, 5, 64–77. [Google Scholar]
- Koren, Z.C. Archaeo-chemical analysis of Royal Purple on a Darius I stone jar. Microchim. Acta 2008, 162, 381–392. [Google Scholar] [CrossRef]
- Degano, I.; Ribechini, E.; Modugno, F.; Colombini, M.P. Analytical methods for the characterization of organic dyes in artworks and in historical textiles. Appl. Spectrosc. Rev. 2009, 44, 363–410. [Google Scholar] [CrossRef]
- Koren, Z.C. Methods of dye analysis used at the Shenkar College Edelstein Center in Israel. Dye. Hist. Archaeol. 1993, 11, 25–33. [Google Scholar]
- Karapanagiotis, I.; de Villemereuil, V.; Magiatis, P.; Polychronopoulos, P.; Vougogiannopoulou, K.; Skaltsounis, A.-L. Identification of the coloring constituents of four natural indigoid dyes. J. Liq. Chromatogr. Relat. Technol. 2006, 29, 1491–1502. [Google Scholar] [CrossRef]
- Papliaka, Z.E.; Konstanta, A.; Karapanagiotis, I.; Karadag, R.; Akyol, A.A.; Mantzouris, D.; Tsiamyrtzis, P. FTIR imaging and HPLC reveal ancient painting and dyeing techniques of molluskan purple. Archaeol. Anthropol. Sci. 2017, 9, 197–208. [Google Scholar] [CrossRef]
- Koren, Z.C. High-performance liquid chromatographic analysis of an ancient Tyrian Purple dyeing vat from Israel. Isr. J. Chem. 1995, 35, 117–124. [Google Scholar] [CrossRef]
- Nowik, W.; Marcinowska, R.; Kusyk, K.; Cardon, D.; Trojanowicz, M. High performance liquid chromatography of slightly soluble brominated indigoids from Tyrian Purple. J. Chromatogr. A 2011, 1218, 1244–1252. [Google Scholar] [CrossRef] [PubMed]
- Mantzouris, D.; Karapanagiotis, I. Identification of indirubin and monobromoindirubins in Murex brandaris. Dye. Pigment. 2014, 104, 194–196. [Google Scholar] [CrossRef]
- Whitworth, I.; Koren, Z.C. Orchil and Tyrian Purple: Two centuries of Bedfords from Leeds. Ambix 2016, 63, 244–267. [Google Scholar] [CrossRef]
- Clark, R.J.H.; Cooksey, C.J. Monobromoindigos: A new general synthesis, the characterization of all four isomers and an investigation into the purple colour of 6,6’-dibromoindigo. New J. Chem. 1999, 23, 323–328. [Google Scholar] [CrossRef]
- Koren, Z.C. Monobromoindigo: The singular chromatic biomarker for the identification of the malacological provenance of archaeological purple pigments from Hexaplex trunculus species. In Ancient Textile Production from an Interdisciplinary Perspective: Humanities and Natural Sciences Interwoven for our Understanding of Textiles; Interdisciplinary Contributions to Archaeology; Ulanowska, A., Grömer, K., Vanden Berghe, I., Öhrman, M., Eds.; Springer: Cham, Switzerland, 2022; Chapter 3; pp. 39–52. [Google Scholar]
- Howarth, R.J. Sources for a history of the ternary diagram. Br. J. Hist. Sci. 1996, 29, 337–356. [Google Scholar] [CrossRef]
- Chirikure, S. Geochemistry of ancient metallurgy: Examples from Africa and elsewhere. In Treatise on Geochemistry, 2nd ed.; Turekian, K.K., Holland, H.D., Eds.; Elsevier: Amsterdam, The Netherlands, 2014; Chapter 14.13; pp. 169–189. [Google Scholar]
- Hsu, Y.-K.; Sabatini, B.J. A geochemical characterization of lead ores in China: An isotope database for provenancing archaeological materials. PLoS ONE 2019, 14, e0215973. [Google Scholar] [CrossRef]
- Morel, M.; Serneels, V. Interpreting the Chemical Variability of Iron Smelting Slag: A Case Study from Northeastern Madagascar. Minerals 2021, 11, 900. [Google Scholar] [CrossRef]
- Cardell, C.; Guerra, I.; Sánchez-Navas, A. SEM-EDX at the Service of Archaeology to Unravel Historical Technology. Microsc. Today 2009, 17, 28–33. [Google Scholar] [CrossRef]
- Chiarella, R.A.; Davey, R.J.; Peterson, M.L. Making co-crystals—The utility of ternary phase diagrams. Cryst. Growth Des. 2007, 7, 1223–1226. [Google Scholar] [CrossRef]
- Dhoot, A.S.; Naha, A.; Priya, J.; Xalxo, N. Phase diagrams for three component mixtures in pharmaceuticals and its applications. J. Young Pharm. 2018, 10, 132–137. [Google Scholar] [CrossRef] [Green Version]
- Gholizadeh, F.; Mirzaghaderi, G. Genome-wide analysis of the polyamine oxidase gene family in wheat (Triticum aestivum L.) reveals involvement in temperature stress response. PLoS ONE 2020, 15, e0236226. [Google Scholar] [CrossRef]
- Yang, L.; Danzberger, J.; Schöler, A.; Schröder, P.; Schloter, M.; Radl, V. Dominant groups of potentially active bacteria shared by barley seeds become less abundant in root associated microbiome. Front. Plant Sci. 2017, 8, 1005. [Google Scholar] [CrossRef] [PubMed] [Green Version]
- Discamps, E.; Costamagno, S. Improving mortality profile analysis in zooarchaeology: A revised zoning for ternary diagrams. J. Archaeol. Sci. 2015, 58, 62–76. [Google Scholar] [CrossRef] [Green Version]


Disclaimer/Publisher’s Note: The statements, opinions and data contained in all publications are solely those of the individual author(s) and contributor(s) and not of MDPI and/or the editor(s). MDPI and/or the editor(s) disclaim responsibility for any injury to people or property resulting from any ideas, methods, instructions or products referred to in the content. |
© 2023 by the author. Licensee MDPI, Basel, Switzerland. This article is an open access article distributed under the terms and conditions of the Creative Commons Attribution (CC BY) license (https://creativecommons.org/licenses/by/4.0/).
Share and Cite
Koren, Z.C. Chromatographic Characterization of Archaeological Molluskan Colorants via the Di-Mono Index and Ternary Diagram. Heritage 2023, 6, 2186-2201. https://doi.org/10.3390/heritage6020116
Koren ZC. Chromatographic Characterization of Archaeological Molluskan Colorants via the Di-Mono Index and Ternary Diagram. Heritage. 2023; 6(2):2186-2201. https://doi.org/10.3390/heritage6020116
Chicago/Turabian StyleKoren, Zvi C. 2023. "Chromatographic Characterization of Archaeological Molluskan Colorants via the Di-Mono Index and Ternary Diagram" Heritage 6, no. 2: 2186-2201. https://doi.org/10.3390/heritage6020116