Review

Condition Assessment of Heritage Buildings via Photogrammetry: A Scoping Review from the Perspective of Decision Makers

by
Mariella De Fino
*,
Rosella Alessia Galantucci
and
Fabio Fatiguso
Department of Civil, Environmental, Land, Construction and Chemistry (DICATECh), Polytechnic University of Bari, 70125 Bari, Italy
*
Author to whom correspondence should be addressed.
Heritage 2023, 6(11), 7031-7066; https://doi.org/10.3390/heritage6110367
Submission received: 29 September 2023 / Revised: 18 October 2023 / Accepted: 25 October 2023 / Published: 30 October 2023
(This article belongs to the Special Issue Photogrammetry, Remote Sensing and GIS for Built Heritage)

Abstract

:
In recent years, advanced digital technologies have driven an outstanding paradigm shift in the field of architectural heritage, particularly for building modelling, historical documentation and touristic promotion. Nonetheless, they show great potentialities in the field of assessment and control of the state of conservation of heritage buildings. In particular, close-range and aerial photogrammetry have increasingly relied on low-cost and user-friendly tools and procedures, with a high degree of automation that makes them accessible to specialists who are foremost involved in architectural diagnosis and conservation, rather than in remote sensing sciences. In this framework, this paper provides a scoping review of 117 publications, based on the PRISMA protocol, from Scopus and Web of Science databases, related to the employment of photogrammetric models and methods, with specific focus on the targets and purposes of the diagnostic process, including decay mapping, structural monitoring and modelling, non-destructive investigation and multi-source documentation. In detail, the results point out that current studies mainly support robust processing of large amounts of information from direct observation of surface alterations, systematic correlation between materials, construction characteristics, visible anomalies and experimental measurements, as well as multi-disciplinary collaborative workflows through remote inspection and harmonized data management. Further improvements were identified, including standardization of acquisition procedures, automatization of elaboration pipelines, integration of real-time data, validation of diagnosis decision-making support tools and scalability to networks of assets.

1. Introduction

In the last years, advanced digital technologies, such as 3D modelling, artificial intelligence, machine learning, cloud computing, virtual reality (VR) and augmented reality (AR), have driven an outstanding paradigm shift in the field of cultural heritage toward harmonized documentation and management, inclusive accessibility and fruition, as well as condition monitoring and preventive conservation [1,2,3,4].
Within this framework, close-range photogrammetry (CRP) and aerial photogrammetry by unmanned vehicles (UAVs) enable the acquisition of data about a real object in order to retrieve measurements and interpretations, by exploiting information obtained from images, such as sources for the reconstruction of the 3D volume of the object, both from a geometric and radiometric point of view [5,6]. These technologies have increasingly relied on efficient and accurate methods for data acquisition and elaboration, as well as on affordable and accessible hardware and software tools that enable low-cost and user-friendly pipelines by high degree of automation [7,8,9,10]. Consequently, in many research areas, including the safeguard and protection of heritage sites, they have supported not only the documentation through reality-based surveying and 3D representation of shapes, colours and textures [11,12,13,14,15], but also the understanding of values, characteristics and performances by specialists who are foremost involved in architectural diagnosis and conservation, rather than in remote sensing sciences [16,17,18,19].
Nevertheless, the transversal role of digital photorealistic replicas throughout the overall preservation process, from survey to diagnosis, from intervention to management, is consistent with the international institutional policies, promoting 3D digitization as a valuable tool for reproduction, research, education, exploration and creative reuse, as well as for improvement in adaptation and resilience of tangible assets at risk, by non-destructive analysis, visualization of damages and information for restoration [20,21].
Particularly, the condition assessment of heritage buildings, in terms of anomalies, defects and failures, has recently inspected the potential of photogrammetry-based models and methods, so that a literature review on the topic is considered a useful way to outline the main research trends and perspectives.
Some state-of-the art reviews have been released on related aspects in the last years. Yang at al. [22] provided a general overview of recent trends in heritage documentation, based on 3D modelling by computer graphics, photogrammetry and laser scanning, as well as on information management of semantic knowledge through a Geographic Information System (GIS) and ontology tools. Particularly, they focused on Historic/Heritage Building Information Modelling (HBIM), discussing how to extend HBIM capabilities by integrating with the aforementioned technologies. Mishra [23] performed a systematic review of various machine learning (ML) techniques applied to assess the health condition of heritage buildings through the effective utilization of test data gathered from the laboratory or field, including sets of images and coloured point clouds. Aicardi et al. [24] analysed several case studies and compared the digital photogrammetry technique with the computer vision method in the field of 3D metric reconstruction from images for cultural heritage documentation and analysis. Adamopoulos and Rinaudo [25,26] discussed the integration of close-range sensing data from different techniques, including photogrammetry, terrestrial laser scanning (TLS), infrared thermography (IRT), multispectral imaging, ground penetrating radar (GPR) and ultrasonic testing (UST) for inspection and monitoring. Sutherland et al. [27] released a scoping review on the application of IRT and 3D-data fusion (IRT-3DDF) for architectural heritage in RGB, TLS and parametric models, while Vileikis et al. [28] released a review of digital documentation tools potentially supporting a systematic assessment of the condition and changes of historic structures as future perspective. Rossi et al. [29] recently proposed a comprehensive review of both conventional and innovative techniques for monitoring cultural heritage structures, including the image- and computer-vision-based approach by photogrammetry and TLS, while Sanchez-Aparicio et al. [30] released a systematic review about the role of 3D point cloud data in relation to heritage buildings, structuring their dissertation mainly on the kind of sensors used for the data acquisition (both range-based and image-based) and the method employed for the data analysis.
Particularly, from the above-mentioned reviews, the following is generally recognized.
  • Exhaustive studies have highlighted advantages and drawbacks of image-based and range-based survey techniques in relation to specific heritage applications [31,32], so that several authors propose the integration of photogrammetry and TLS techniques in hybrid approaches, given the heterogeneity of assets, in terms of extent, from entire archaeological sites to single architectural elements [33,34,35];
  • A plurality of researchers have pointed out the spreading of image-based techniques for digital documentation purposes, as a starting point for more articulated processes of enrichment and analysis [36], with a view on the affordability of photogrammetry both at the urban and the building scales compared with different reverse engineering techniques [37,38].
  • A great share of applications, including ground and aerial photogrammetry, addresses historical documentation, cultural dissemination, touristic fruition and geometrical survey [39,40] have a specific focus on archaeological sites in order to support speedy and efficient documentation of excavation activities for large and/or low accessible areas [41,42,43,44].
Consequently, despite excluding some relevant articles discussed and acknowledged by related studies, the present review intends to propose a novel point of view on the state-of-the-art and gaps-in-knowledge, since:
  • It is focused on the employment of digital photogrammetry as a specific technique whose ease of use and affordability make it suitable for several phases and activities within the condition assessment and diagnosis of heritage buildings, rather than covering several reality-based (i.e., image-based and range-based) techniques for specific purposes (e.g., building modelling, multispectral detection, structural monitoring).
  • It offers the perspective of decision makers, including diagnosticians and conservationists, thus focusing on preservation purposes and targets more than tools and procedures, by highlighting investigated construction materials and techniques, architectural components, performances, pathologies and inherent and surrounding conditions.
As a result, the review is focused on studies where (i) metric and optical information are self-sufficient regardless of the combined use of more specialized TLS survey technologies, (ii) procedures are easy to replicate and/or adopted, (iii) results are useful to support observations and actions throughout the whole service life of the assets; and (iv) investigated characteristics and pathologies are relevant at the scale of the building system and building sub-systems.
Based on the above-mentioned premises, the manuscript is arranged as follows: Section 2 presents the review questions, phases and methods, including bibliometric and content analysis; Section 3 offers a detailed overview of the selected articles, according to the main topics and sub-topics; Section 4 discusses the main findings and limitations; and Section 5 highlights the main review outcome and future perspectives.

2. Materials and Methods

The review was conceived as a scoping review, since it aims at identifying the types of available evidence in a given field; examining how research is conducted on a certain topic; identifying key characteristics or factors related to a concept; and identifying and analysing knowledge gaps. These purposes are distinctive compared to systematic reviews and more oriented toward uncovering the international evidence, confirming the current practice/addressing any variation/identifying new practices, identifying and informing areas for future research and producing statements to guide decision making [45]. In detail, the scope of the review was preliminarily identified though the formulation of some research questions as a first step toward the literature search, selection, charting, summary and discussion [45], as follows.
  • What are the main findings in the state-of-the-art applications of photogrammetric models and methods for diagnostic purposes?
  • Which shortcomings of traditional approaches for condition assessment do they overcome?
  • What are the main limitations and perspectives in the field from the perspective of decision makers?
Thus, the review was carried out according to the well-established method provided by the Preferred Reporting Items for Systematic reviews and Meta-Analyses (PRISMA) statement [46], and it followed the flowchart summarized in Figure 1 and discussed in the following sub-paragraphs.

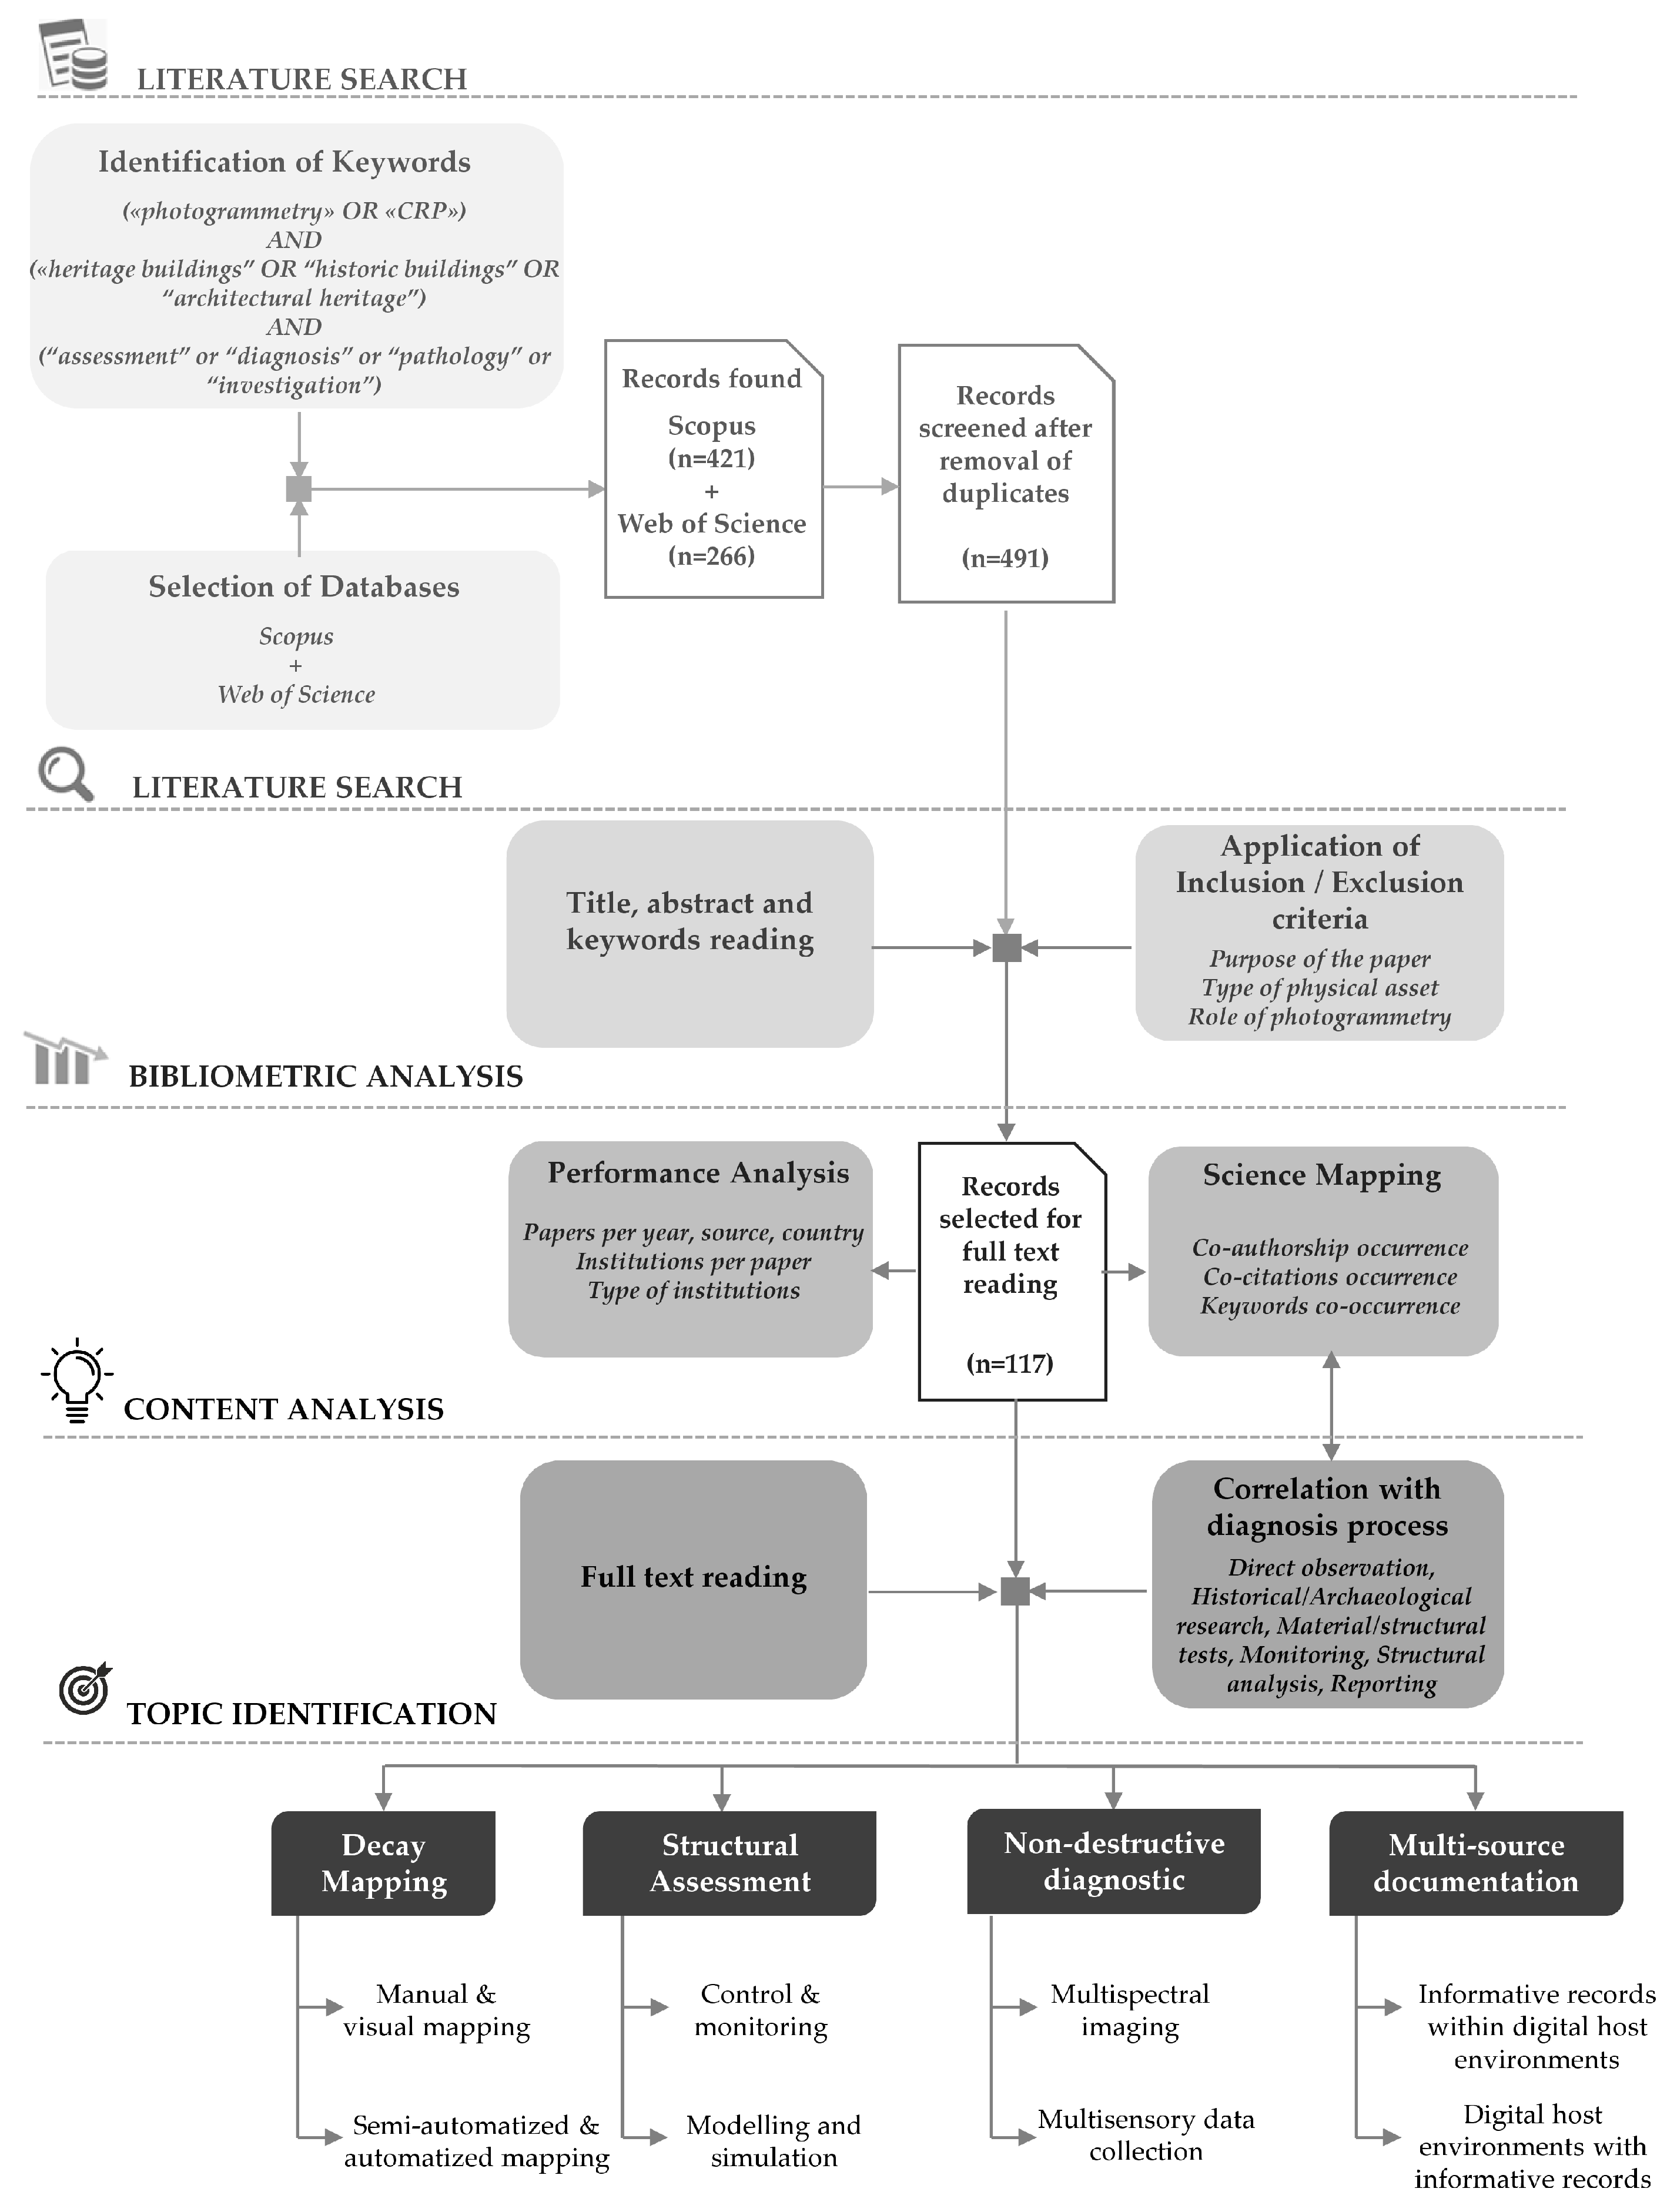
2.1. Literature Search and Selection

The first step of the review concerned the literature search through Scopus and Web of Science databases, last accessed in June 2023. In both databases, though Boolean operators, the combination of three types of keywords was used, respectively, related to: (i) technique (“photogrammetry” OR “CRP”); AND (ii) target (“heritage buildings” OR “historic buildings”); AND (iii) purpose (“assessment” OR “diagnosis” OR “pathology” OR “investigation”). The search was referred to the period 2013–2023, which was considered suitable for such a rapidly and continuously updated technology, and it included articles, review papers, conference papers and book chapters in English. No further restrictions were applied on research fields or sources, assuming the topic to be inherently multi-disciplinary and, thus, allowing as many studies as possible to be included in the first step. This search resulted in 449 papers after merging and removing duplicate records in the two databases.
Thus, the second step of the review concerned the literature selection by analysing the abstracts and the keywords. At this level, a set of inclusion and exclusion criteria was applied, related to the purpose of the paper, the type of physical asset and the role of photogrammetry in the framework, case study and/or application (Table 1), as follows.
  • The purpose of the paper. Several papers were excluded because photogrammetric models were used as a preliminary base toward informative parametric modelling through SCAN-to-BIM processes or future implementation of thematic analyses; they resulted from customized equipment development and remote sensing procedures to overcome hardware and software limitations for specific application fields or they addressed the documentation of structures and sites for touristic purposes and dissemination to the general public. On the contrary, all the studies about condition analysis, diagnostic data collection and correlation, assessment and monitoring of decay and pathologies, as well as simulation modelling were included.
  • The type of physical asset. Some papers were excluded because they referred to modern buildings with negligible historical-architectural relevance to paintings and artworks with specific focus on artistic preservation issues regardless their integration within a structural system and to urban settlements and infrastructures whose scale of observation was not comparable to the building scale. On the contrary, beyond historic architectures and archaeological sites and structures, frescoes were also included because the assessment inherently included the condition of the underlying masonry support. Likewise, sculptures were included as they are similar in characteristics and dimensions to decorative architectural elements, and bridges because they are comparable in construction techniques and size to large and difficult to access buildings.
  • The role of photogrammetry, by exclusion of those studies where photogrammetry was not directly exploited for the condition assessment, but rather as a secondary-complementary tool, within a wider diagnosis campaign and/or for integrating TLS data as main source of analysis.
At the end of the selection, a number of 117 papers were further processed through bibliometric and content analysis by full text reading.

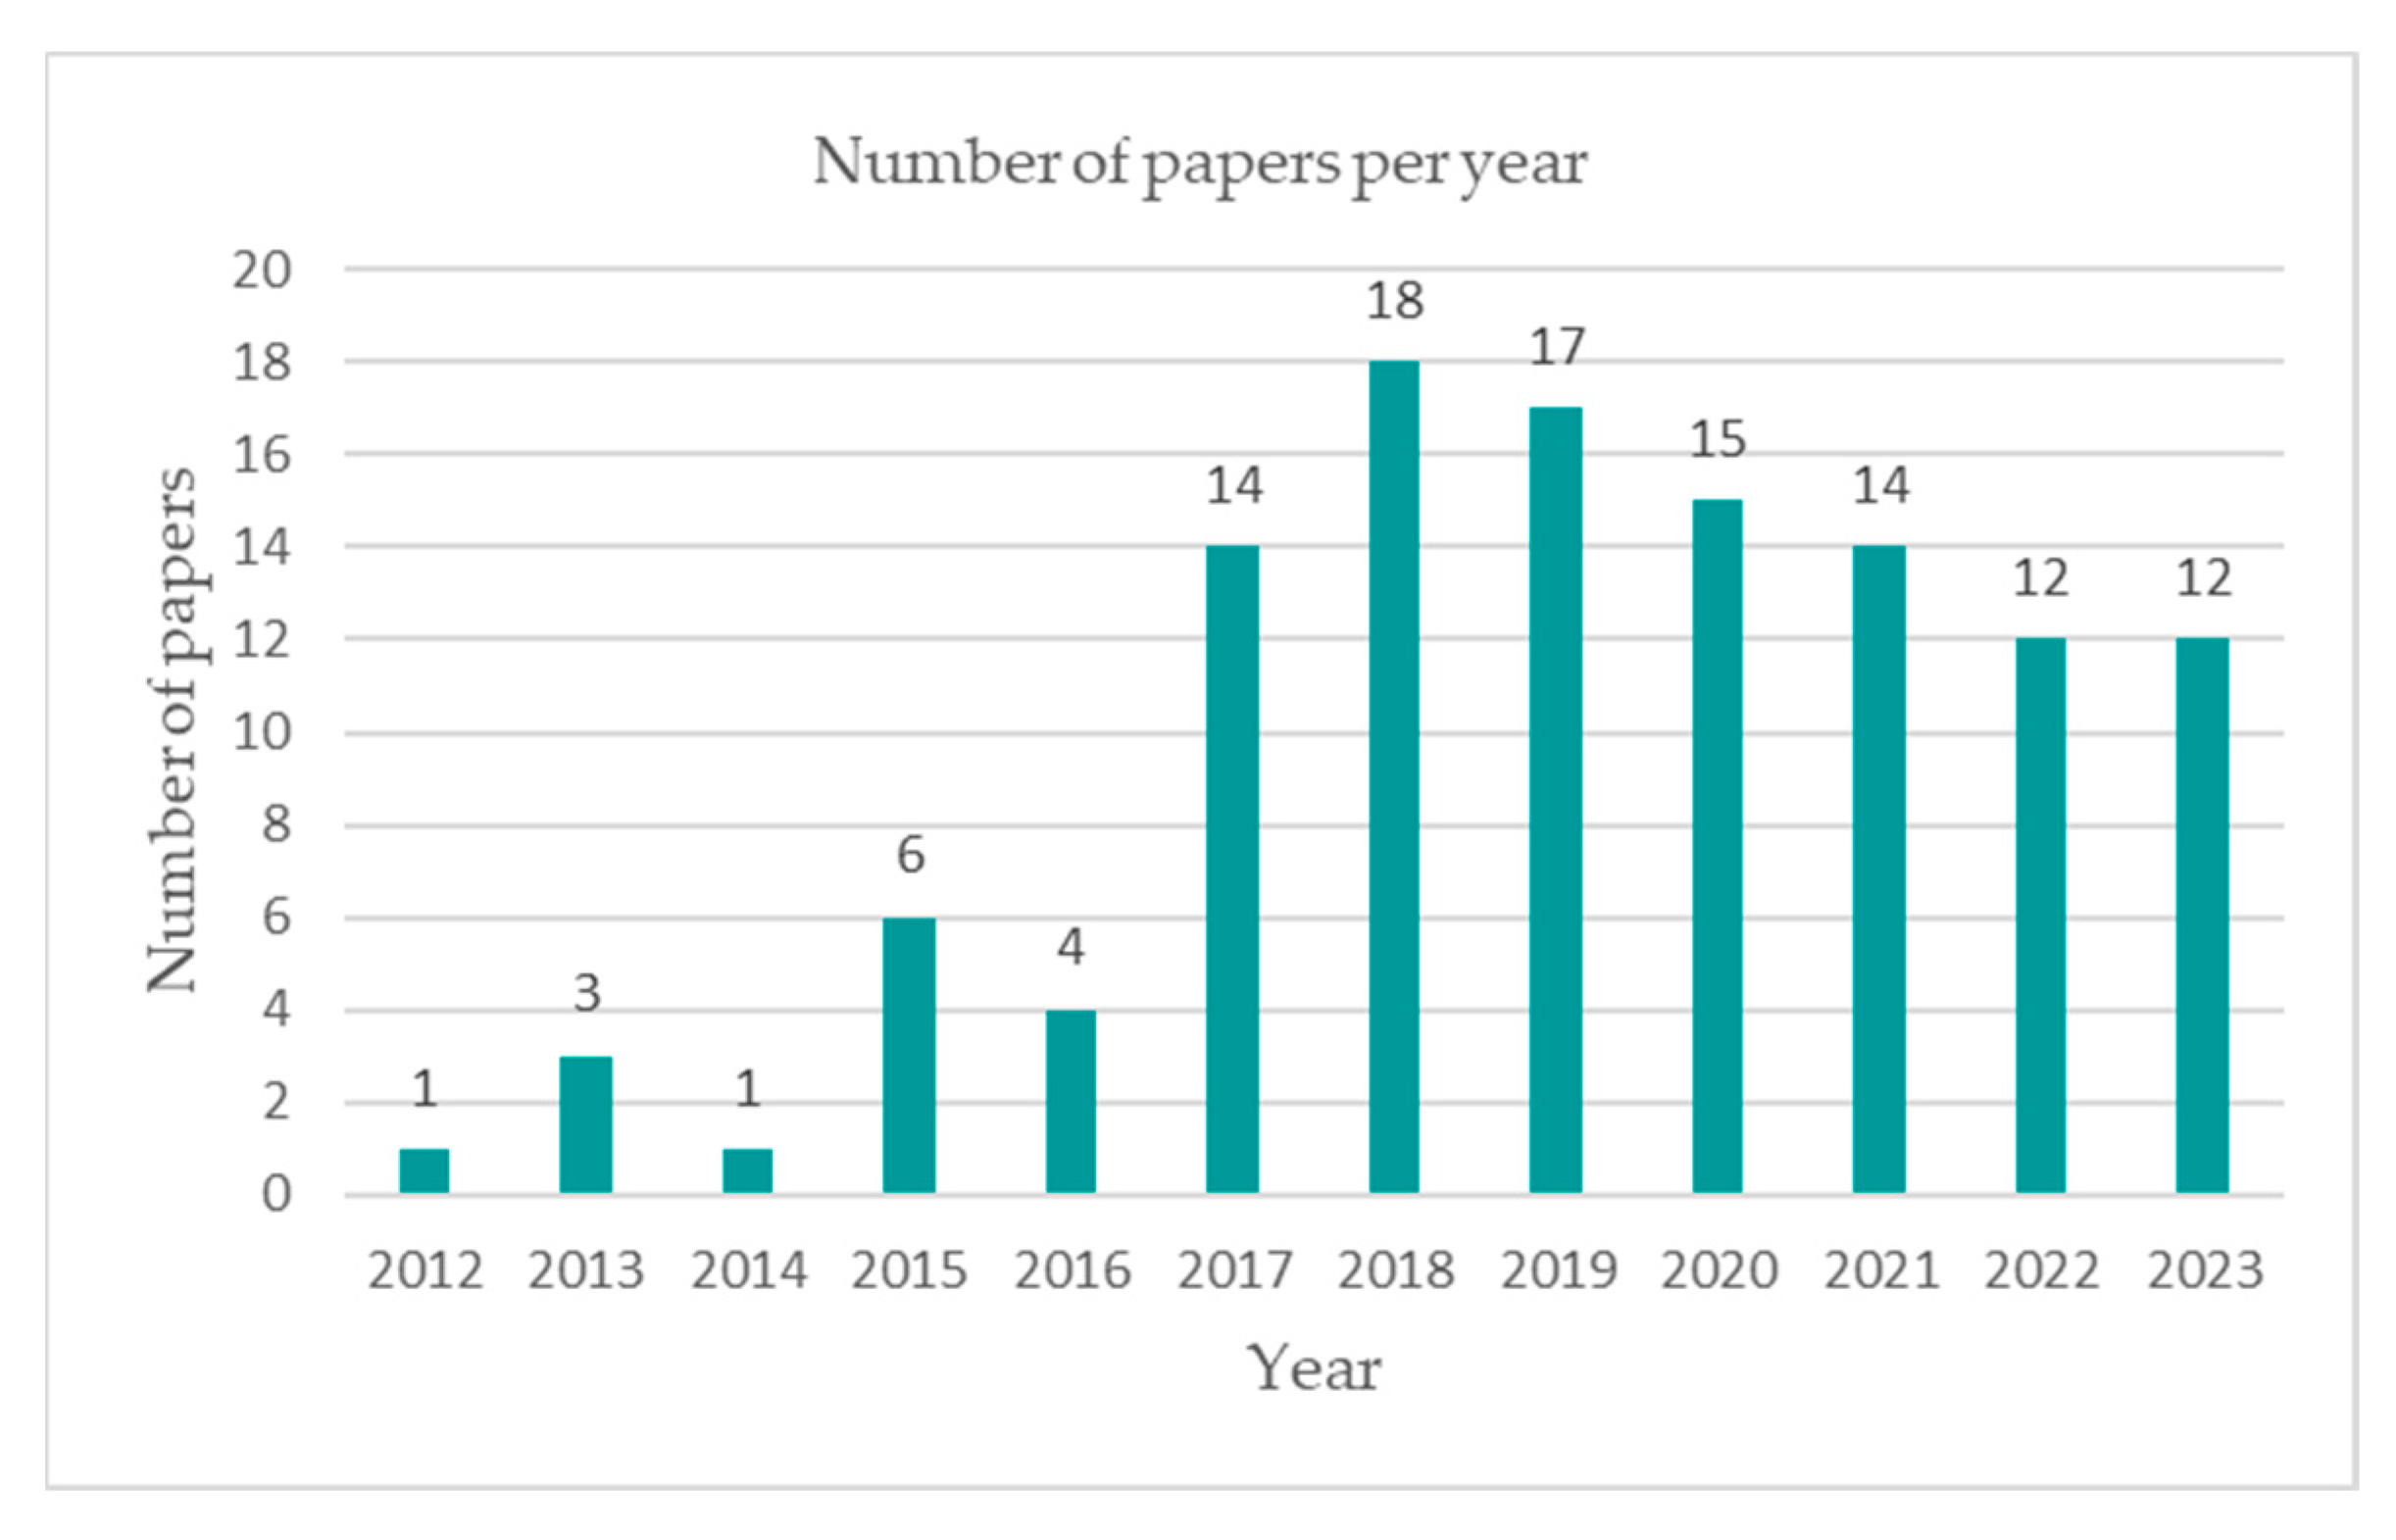
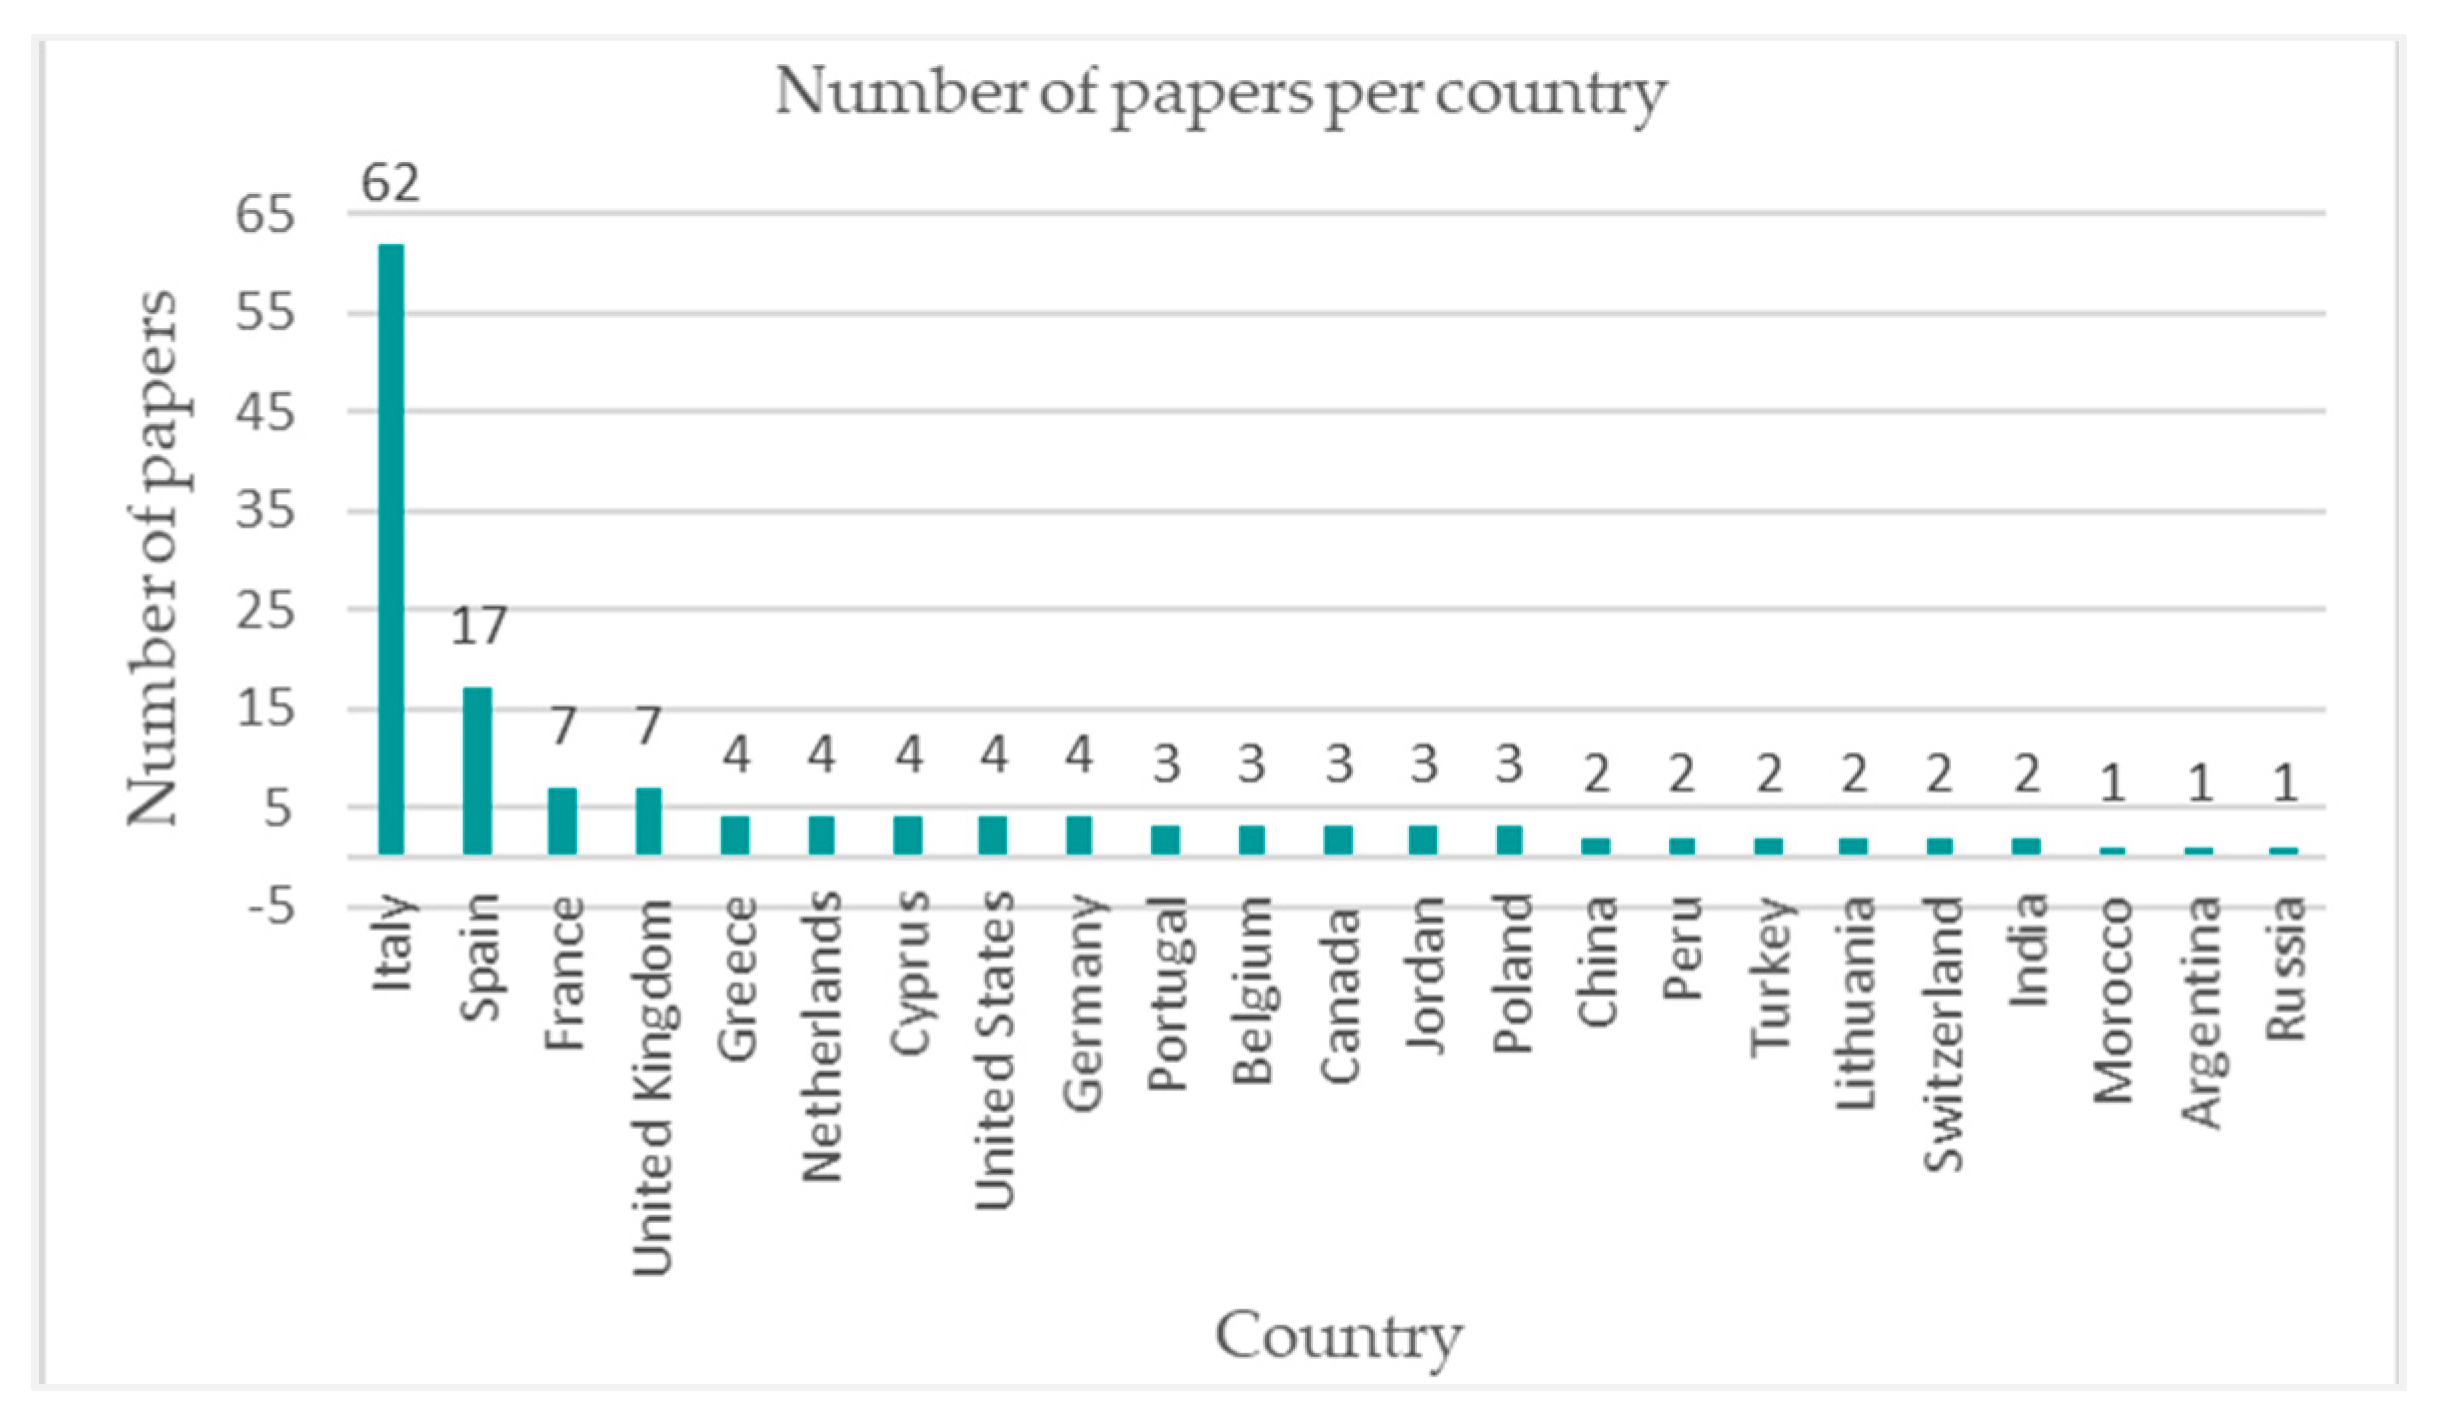
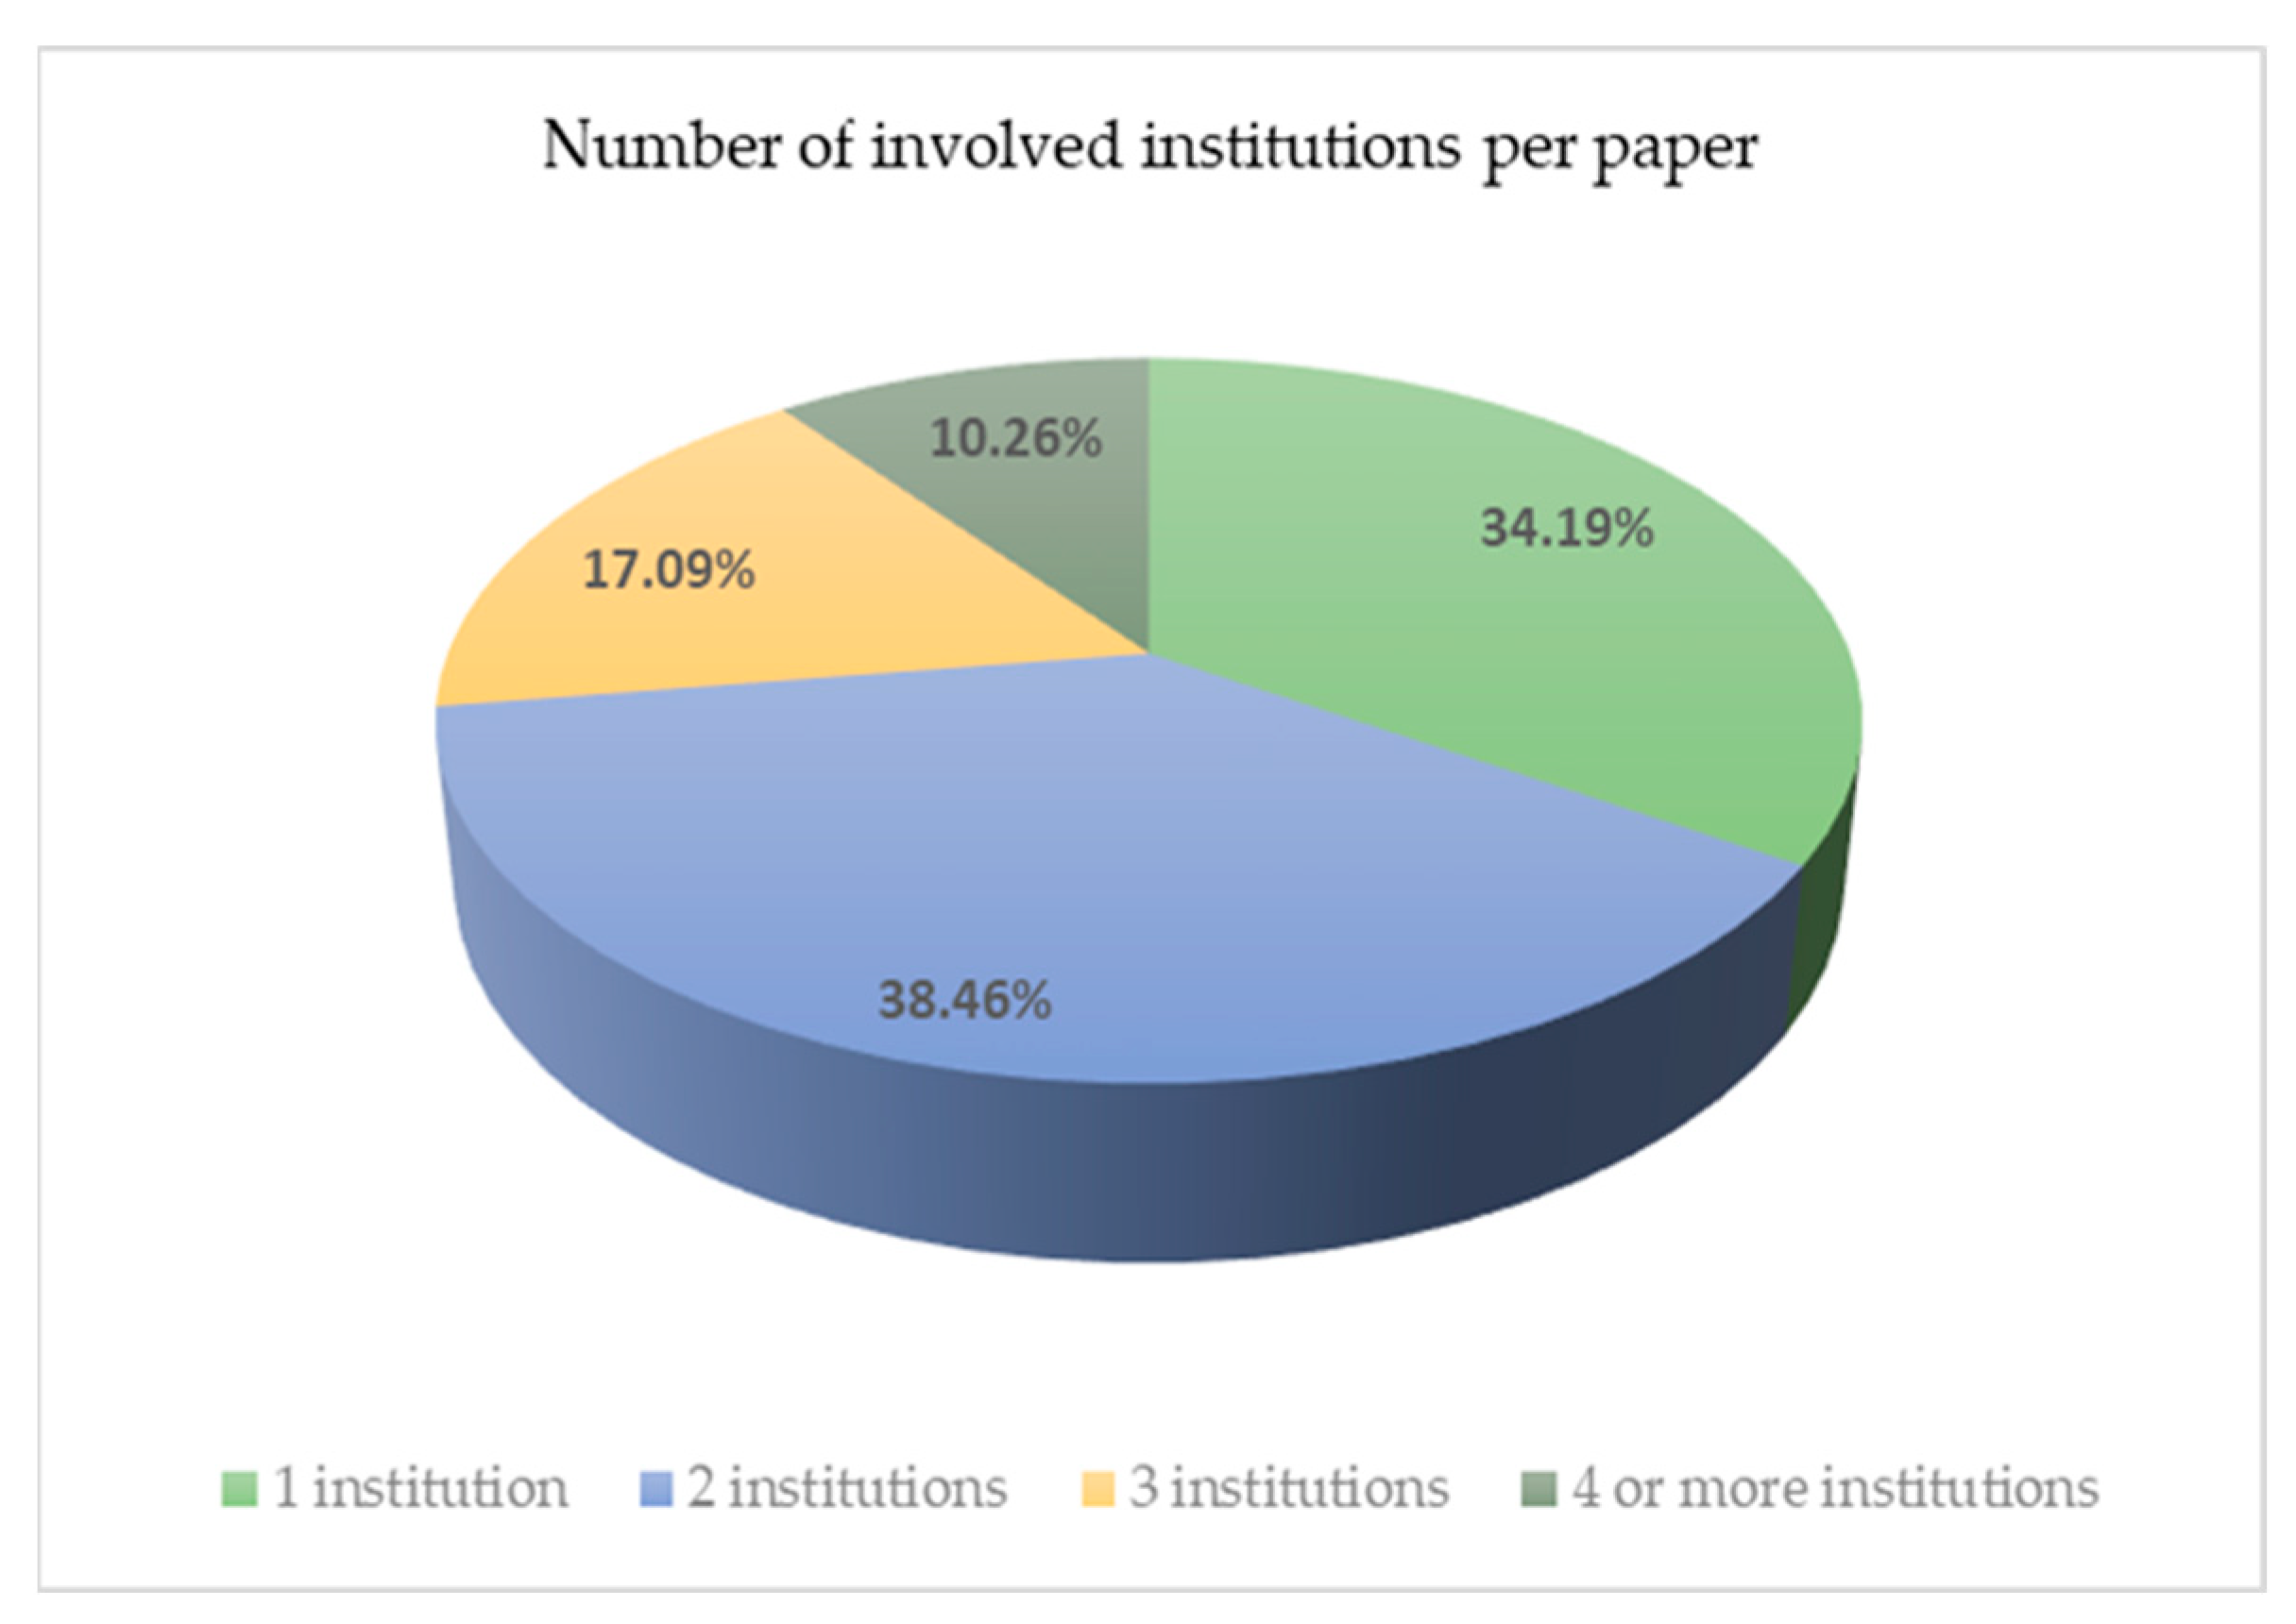
2.2. Bibliometric Analysis

According to [47], the techniques for bibliometric analysis manifest across two categories: (1) performance analysis and (2) science mapping. The former examines the contributions of research constituents (e.g., authors, institutions, countries, journals) to a given field and, thus, provides insights on the distribution of productivity and impacts. The latter focuses on the intellectual interactions and structural connections among research constituents (e.g., citation analysis, co- citation analysis, bibliographic coupling, co-word analysis, and co- authorship analysis) and helps to identify the links between collected publications and groups, as well as to recognize potential clusters representing the inter-connectivity of subject areas, technologies and applications.
With reference to the performance analysis, the papers have been related to publication year (Figure 2), source (Figure 3) and country (Figure 4), as well as to the number of institutions involved for each paper (Figure 5) and the type of institutions that all the authors belong to (Figure 6).
In general, a peak of publications was found in the period 2018–2019, slightly decreasing in the most recent years, although the numbers in 2023 are partial (Figure 2). However, taking into account the reduced feasibility of onsite activities during the COVID-19 pandemic, a quite stable production rate from 2017 can be observed compared to the previous five-year period, probably due to the achieved maturity and accessibility of tools and procedures.
Furthermore, the great majority of papers were published in ISPRS Archives and ISPRS Annals, as predictable, considering the direct correspondence between the topic and the mission of the International Society for Photogrammetry and Remote Sensing. Among further sources with at least five papers, including Automation in Construction and Remote Sensing, only the Journal of Cultural Heritage is specifically targeted to heritage buildings. Other sources on architectural, restoration and conservation studies, such as the International Journal of Architectural Heritage and Virtual Archaeology Review, count for a limited number of papers (Figure 3). This confirms that the topic is primarily developed from the perspective of remote sensing specialists, as also proved by the great number of papers that included the searched keywords but did not fit the inclusion criteria for the scoping review after title and abstract reading.
Concerning the countries, Italy plays a primary role in the scientific production, followed by Spain and France, and Europe is certainly the leading geographic area in the field, reasonably due to the great incidence of historical-architectural buildings and sites (Figure 4).
Furthermore, the included papers quite consistently show at least two different institutions involved in the study, confirming the multidisciplinary quality of the topic (Figure 5). They were mostly written by authors from different departments of the same university or research centre covering several areas of architecture, engineering and construction; computer science, data science and information technology; and, remote sensing, cartography and earth science. It should be noted that the research is mainly academic, with a low involvement of government bodies, associations and enterprises, proving that the technology transfer is still at the initial stage (Figure 6).
With reference to the science mapping, the analysis was supported by VOSviewer v1.6.18. Firstly, the co-authorship of the most cited authors was investigated (Figure 7), where the authors (with at least one published document and more than five citations) are the nodes, the circles size corresponds to the number of citations of the papers, and the circle colour is related to the average year of publication. The scattered groups of authors in the map, without mutual links, show a predominance of co-authorship within the same university/centre/group and a weak cooperation among researchers from different affiliation/country. Particularly, the main research groups belong to Bauhaus-University of Weimar, Germany (Hallermann), the University of Edinburgh, United Kingdom (Bosché), Polytechnic of Bari, Italy (Fatiguso et al.), National Technical University of Athens, Greece (Ioannidis et al.), the National Agency for New Technologies, Energy and Sustainable Economic Development, Rome, Italy (De Canio), Universidad de Salamanca, Spain (Gonzales-Aguilera et al.), Polytechnic of Turin, Italy (Spanò et al.), and Ministry of Culture and Sports of Thessaloniki, Greece (Adamopoulos et al.). However, the co-citations map highlights that the authors systematically refer to their peers involved in the research area (Figure 8).
Finally, the analysis of keywords was carried out in order to identify relevant and recurring themes within the collected literature. To this end, 120 keywords were considered with at least three occurrences, resulting in five clusters (Figure 9).
Particularly, beyond the general high occurrence of terms related to the acquisition and elaboration technology—e.g., photogrammetry, surveys, three dimensional modelling, unmanned aerial vehicles, structure from motion, reverse engineering, terrestrial laser scanning, remote sensing and equivalent—and the application field—e.g., cultural heritage, historic preservation, archaeology, architectural heritage and equivalent—some thematic keywords related to the diagnosis and conservation process could be recognized (Table 2).

2.3. Content Analysis

The methodology for reporting the review results was defined after the detailed analysis of the selected papers. Specifically, since the review purpose is to offer an overview of photogrammetry methods and models for condition assessment of heritage buildings from the perspective of decision makers (purposes and targets) rather than remote sensing specialists (tools and procedures), the publications were organized and labelled keeping in mind the well-established phases of the diagnosis process, including direct observation, historical and archaeological research, material and structural tests, monitoring, structural analysis and reporting [48]. Thus, based on the bibliometric analysis of keywords [49], as reported in Section 2.1, and the reading of abstracts, the identification and denomination of four topics was achieved. It is worth mentioning that the four topics essentially correspond to four out the five clusters derived from the analysis of keywords, whereas cluster 4 was considered negligible. Furthermore, following the reading of the full texts, a further specification of the sub-topics was addressed, supporting the presentation and discussion of the studies in Section 3 and Section 4 (Table 3).

3. Results

3.1. Decay Mapping

Photogrammetry has proven to be particularly suitable in decay mapping because it provides non-invasive remote survey support for the collection of a huge quantity of unorganized data, from which it is possible to extract meaningful information about geometry, colour and texture.
As far as decay mapping is concerned, 37 papers have been considered and two main research directions have been identified: (i) visual condition assessment and manual decay mapping, for which a selection of 16 papers were analysed; (ii) semi-automatized/automatized procedures for decay detection and mapping, addressed in 21 papers.

3.1.1. Manual and Visual Mapping

The first line of investigation, as just mentioned, concerns visual condition assessment and decay mapping. In this regard, numerous works exploit photogrammetric 3D data for the retrieval of high-resolution 2D orthoimages, which are used as a basis for visual inspection and manual mapping of surface decay. This kind of approach has been used chiefly on building façades, because of their mainly planar shape, which can be easily analysed in a 2D environment.
For example, orthoimages of masonry façades of a monumental complex or a farmer house have been retrieved through close-range or aerial photogrammetry in order to map several pathologies like cracks, vegetation, discoloration, black deposit, peeling, missing parts and biological colonization [50,51]. In 2014, Morgenthal and Hallermann generated detailed images from UAV photogrammetry for the condition assessment and detection of critical cracks at a masonry corner roof joint (bottom) of a church bell tower, through the application of image processing algorithms [52]. Differently, Percy et al. (2015) extracted orthoimages from photogrammetric 3D data of a historical residence to manually map and re-project damages of decorated surfaces [53]. High-resolution photogrammetric ortho-mosaics have been adopted to manually extract deformation lines for the evaluation of surface and geometric variations occurring in valuable architectural elements, corresponding to deformation, permanent loss and surface cracks on a decorated masonry wall [54]. In other cases, decay mapping also has been performed on multi-spectral textures or UV maps to detect the presence of non-visible alterations (i.e., filled cracks) for a comprehensive knowledge of the condition of a restored cultural heritage item [55]. Accordingly, Azzola et al. (2019) underlined the opportunities provided by the high amount of laser and photogrammetric data, for the recognition of anomalies, categorized into two main areas: congenital/constructive defects or aging pathologies, visible through crack patterns, chromatic alterations, physical and chemical damages to plaster [56].
As a matter of fact, these procedures are not suitable to determine and quantify the extension of damage in non-planar or articulated surfaces, like columns, vaults and domes. In this respect, photogrammetric point clouds or texturized polygonal meshes provide a digital support for remote examination, within a three-dimensional environment, without losing spatial information. However, most researchers only used 3D data for a direct annotation and/or manual segmentation of different morphologies of alterations affecting the heritage.
Lo Brutto et al. (2017) used 3D models for the close observation of decorative details of Monreale’s main portal (Italy), allowing them to develop further evaluations and comparisons for planning future interventions [57]. Pepe et. al. (2021) used photogrammetric data to retrieve an enriched 3D model of a masonry bridge and inform where to insert the results of visual inspection/observation about the state of conservation (degradation analysis), in the form of textual annotation linked to the specific architectural element [58]. Some authors obtained thematic maps from 3D models of the artefact, oriented to classify stones, recognize carvings, previous restorations, detachment, corrosion and discoloration on a masonry church façade [59]. Likewise, thematic outputs served for the definition of damage levels related to cracks, material loss and vegetation, through the quantification of percentages of each alteration on the masonry wall of a temple [60]. Furthermore, in view of a quantitative evaluation of decay, geo-heritage has been manually mapped and analysed by extracting features from photogrammetric 3D data [61].
However, a peculiar focus involves cracks, which require an in-depth study at a micro-scale (higher level of detail), owing to their appearance and size (small and thin) with respect to the support surface. To tackle crack detection, a multi-source investigation has been proposed, involving crack patterns identification, vector drawings and taxonomy on photogrammetric data, integrated with other non-destructive methods, in order to verify the structural health of the column of the portal of the Orvieto cathedral (Italy) [62].
Further developments are presented by the project CRATI (Conoscenza e Restauro Attraverso Tecnologie avanzate Integrate), a multidisciplinary system based on photogrammetric 3D data, to create thematic decay maps, with quantitative evaluations and damage indices, related to type, extension and severity of detected alterations [63].
Conversely, some authors enclose manual decay mapping on photogrammetric 3D data within specific digital diagnosis platforms, enabling multi-temporal interactive mapping and analysis on digital data [64]. Analogously, a targeted tool has been proposed (EasyCUBE PRO) to perform a manual point cloud segmentation for the isolation of multiple categories of alterations, as described by the Italian code UNI 11182, within a segmented 3D model enriched with informative contents [65].
However, most of the illustrated approaches entail a manual and qualitative decay mapping on 2D data and, hence, do not fully leverage the advantage of the three-dimensionality of decay phenomena in architectural structures with a complex three-dimensional morphology and volumetry.

3.1.2. Semi-Automatized and Automatized Mapping

Notwithstanding, efforts have been made towards a partial or complete automatization of the remote observation and analysis, in support of technicians, thanks to the semi or fully automatic extraction of features/segments from raw reality-based photogrammetric 2D or 3D data. To this end, image processing algorithms and artificial intelligence have been implemented on point clouds or polygonal meshes of cultural heritages to quantitatively assess their state of conservation and the presence of decay. For example, some authors applied algorithms like edge detection and thresholding on UAV-based orthomosaics of a pagoda, within an archaeological site, to semi-automatically quantify damage regions at a macroscopic level [66]. The same kind of algorithms have been applied by Galantucci et al. (2019) on the point cloud of an ashlar masonry wall of a noble palace in order to identify erosion or material loss connected to humidity problems or marine aerosol consistently affecting the façade [67].
Going towards a higher level of detail, some authors propose automatic crack detection through the application of edge detection algorithms (like Canny edge) and binarization to orthoimages of the Amra Palace, a UNESCO world heritage site in Jordan [68], or of the portal of the heritage site of Petra (Jordan) [69]. As far as crack detection is concerned, similar image processing workflows have been implemented on point clouds of both a masonry wall and a masonry tower [70,71].
The application of image processing workflows to photogrammetric point clouds also allows for the extraction of relevant geometric-related features, enabling an automatic or semi-automatic recognition and classification/indexing of the different decay morphologies like features induced by material loss or crack patterns [70,72]. In some papers, surface curvature computation, edge detection (Frangi filter) and colour enhancing have been applied to photogrammetric 3D data to detect ageing carvings on plasters or to map weathering effects like scaling on small monuments [73,74]. Furthermore, Danese et al. (2018) exploited a photogrammetry-based Digital Relief Model (DRM), applying contour and slope analysis, together with colour information and multiple data from non-destructive tests, to deduce and quantify decay typologies like decolouration, material loss or detachment [75]. Differently, Valero et al. evaluated segmented defective regions, according to geometry-related parameters (ratio outliers/inliers, roughness, mean distance, distribution of normal vectors, area, elongation, rectangleness, circularity, number/area of unconnected defective areas), texture-related parameters (contrast, energy, correlation, homogeneity) and colour-related parameters (dispersion of hue, dispersion of value, range of hue, range of value) to recognize and classify defects like erosion, delamination, mechanical damage, and non-defective areas, at single masonry ashlar level [76,77].
Another interesting topic concerns the introduction and development of machine/deep learning techniques for the automatization of 2D/3D segmentation procedures, directed to the isolation of defects, the automatic recognition of different constructive types or the presence of previous restoration works on ancient walls. In this regard, some works exploit orthoimages or textures for the benefit of simplification in data processing, with respect to 3D data. For example, García-Talegón et al. (2015) applied non-supervised classification methods to photogrammetry-based orthoimages for the purpose of assessing different intensity levels of humidity/lichens on the masonry wall of a UNESCO heritage site. Moreover, Del Pozo et al. (2016) adopted a supervised approach, Fuzzy k-means clustering, to distinguish unaltered granite and mortar from altered granite moisture on multispectral orthoimages of a church façade [78]. Malinverni et al. (2018) concentrated on the detection of visible colour changes and degradation on bass reliefs through the help of supervised classification and segmentation of orthorectified images [79]. Differently, Grilli et al. (2018) involved the third dimension by means of UV maps or textures. The supervised classification was performed on a 2D output, as in the previous cases, but then re-projected on the 3D mesh model, providing segmented regions with different surface materials or wall textures on the Roman Cavea in the Circus Maximus in Rome [80]. Furthermore, in 2019, they realized a systematic review of 3D segmentation and classification methods explored in cultural heritage, among which a predominant role was covered by the automatic recognition of architectural elements (columns, vaults, doors, walls,…) [81]. Similarly, Adamopoulos et al. (2021) projected a 2D unsupervised decay classification of stone monuments on 3D mesh models using near-infrared texture, with the possibility to differentiate healthier material from biodegradation, black crusts or stone patina [82]. Gong et al. (2021) applied deep learning (edge-enhanced CNN—Mask R-CNN) on 2D images, with the first goal of object recognition in the main architectural elements of the Great Wall in China. Secondarily, material losses have been computed on the texturized 3D mesh model by reciprocally comparing analogous repetitive elements and exploiting surface symmetries [83]. In addition, Idjaton et al. (2023) exploited the image dataset acquired in the photogrammetric survey to perform a deep learning-based automatic recognition of limestone spalling, which was then re-projected as annotation on photogrammetric orthoimages [84].
Nevertheless, few researchers have adopted supervised or unsupervised procedures directly on 3D data, and especially point clouds, with the specific aim of automatic classification and quantification of damages. As previously mentioned, Valero et al. (2019) defined a workflow for the automatic extraction of both colour- and geometry-related features for the quantification of potentially defective areas with chromatic alterations, missing parts or material loss [77]. Moisture-related alterations or chromatic variations in masonry vaults or plastered interior walls have been highlighted through the application of automatic segmentation methods, like unsupervised clustering on heritage photogrammetric point clouds, by essentially exploiting colour features [85,86]. Indeed, apart from few examples, both geometry- and colour-based point cloud segmentation remains related to geometric object recognition.

3.2. Structural Assessment

One of the most critical phases along the conservation process is related to the structural assessment in the evaluation of the overall/residual performance of the heritage. This theme has been thoroughly investigated and articulated in two main issues: (i) control and monitoring and (ii) modelling and simulation. These two aspects have been analysed in 20 and 17 papers, respectively.

3.2.1. Control and Monitoring

As far as control and monitoring are concerned, several authors highlight the importance of exploiting digital documentation/survey techniques, like photogrammetry, to evaluate and control an artefact by visually inspecting and remotely measuring decay features directly on digital outputs in order to overcome the limits of time consuming and labour-intensive current practices. An interesting opportunity concerns the analysis of deviations among multiple sets of data. This issue has led to displacement analysis, dealing with two main aspects: on the one hand, a morphological/spatial comparison, performed at different scales, from macro-elements (naves, façades, etc.) to constructive elements (walls, columns, pillars,…) up to the level of single architectural components (capitals, archivolts,…); on the other hand, a temporal matching, intended to study the evolution of pathologies over time and their monitoring, through the comparison of time series of data.
With reference to the first theme, by way of example, the 3D data of planar surfaces, like the vertical walls of the façades of the Florence Baptistery (Italy), have been compared with vertical planes, thus obtaining displacement maps and highlighting a out-of-plumb structures by a few centimetres towards the outside, which is not visible to the eye [87]. However, in this case, the use of photogrammetry has been limited to restricted parts of the heritage due to time limitations, and the majority of the survey was realized by TLS with an embedded camera. For the same purpose, Federman et al. (2018) performed a multi-temporal deformation analysis based on the deviation of point clouds in the vertical masonry walls of the Prince of Wale Fort, Canada, from best-fit planes representative of an unaltered condition. The 3D data exploited for this research was entirely collected by UAV surveys [88].
Another investigated aspect concerns the verification of the verticality of slender elements like masonry towers or chimneys by taking direct measurements of vertical displacements on 3D data, by comparing different height transversal sections, or with the help of best-fitting algorithms. By way of example, García-León et al. (2017) used reality-capture 3D data of a masonry chimney in an old mining heritage in Mountain Range of Cartagena-La Unión (Spain) [89]. The workflow entailed the combination of LIDAR and photogrammetry to obtain an accurate photorealistic representation of the chimney, in which both visual assessment of crack patterns and direct measurements of the cross-section-centres’ displacement at different heights supported technicians in understanding the risk of collapse of the structure [89]. In the same direction, the work of Markiewicz et al. (2017) focused on the verticality control of a monumental masonry tower within a medieval fortification (Kraków Bishops’ Castle in Iłża, Poland). Horizontal transversal sections extracted from the point cloud and retrieved from TLS, APH (Aerial Photogrammetry), and CRP were compared with theoretical best-fit ellipses in order to quantify deviations from an ideal shape [90]. Best-fitting geometries have also been exploited by Sammartano et al. (2017) who analysed volumetric deviations between the photogrammetric point cloud of a late medieval dovecote tower and ideal cylindrical or trunk-cone volumes for the identification of deformation areas [91]. Analogously, Casula et al. (2023) used best-fitting cylinders to isolate and compute geometrical anomalies in three Pietra Forte limestone columns in Saints Lorenzo and Pancrazio church in Cagliari, Italy. In a macroscopic analysis they appeared affected by shallow alteration, such as oxidation. The deviation maps allowed for easy localization of the affected areas, where ultrasonic tests had to be performed [92].
In relation to the temporal comparison of time series of data, a plurality of solutions has been proposed, among which the most widespread entails an evaluation of the temporal evolution of the heritage through a pixel-to-pixel comparison/juxtaposition of photogrammetric 2D data (orthoimages, digital elevation models depth maps). For example, a change detection analysis has been applied to a time series of photogrammetric orthoimages and DEMs of archaeological bass-reliefs in order to detect colour changes representative of the colour decay progression overtime through the help of both supervised and unsupervised clustering methods [93].
Photogrammetric 3D data have also been used as a basis for the alignment and referencing of archives images, with the purpose of documenting the evolution of the artefact (changes, damages,…). Bevilacqua et al. (2017) have oriented archive images of decorated surfaces of the Arco del Gualandi or the Chapel of Santagata, within Pisa Cathedral, with respect to their corresponding photogrammetric texturized models, in order support the planning of restoration activities, with the comprehension of differences between the actual state of conservation and previous conditions in time [94].
On the other hand, a direct comparison and deviation analysis of 3D data (point clouds, texturized polygonal meshes) helped understand damages and their temporal changes easily and properly, within a three-dimensional environment, which is especially convenient for the study of typical complex structures in historical buildings, like vaults, domes, columns, towers or decorative apparatuses. Alternatively, a deviation analysis among temporarily-spaced UAV-based 3D data allowed for information to be obtained about the development of structural damages to a historical masonry bridge overtime in order to monitor its health and assist technicians in decision making. Three-dimensional change detection among data acquired in a monthly range highlighted phenomena like stone loosening and the presence of cracks on the constructive elements [95]. In some other cases, the comparison between photogrammetric models has been used to evaluate the efficacy of restoration intervention, like cleaning treatment on pictorial fragments belonging to Roman wall paintings in Castulo (Jaèn, Spain) [96]. Further applications have led to surface regression patterns, even with the integration of meteorological data, in view of predictive monitoring for the understanding and localization of future weathering decay on heritage buildings, like the Romanesque quadriportico of San Matteo’s Cathedral in Salerno (Italy) [97], the masonry walls of the buttress of San Jeronimo Monastery (Granada, Spain) [98] or the basement of the Puerta Elvira (Granada, Spain) [99].
In the end, one of the most important matters within decay mapping and condition assessment is related to the post-disaster monitoring of heritages. Here, some preliminary considerations need to be made: the assessment of damages and risks deriving from the occurrence of a calamitous event (earthquake, fire, etc.) is affected by urgency and danger for human operators who need to quickly comprehend the state of places and restore a safe condition for people and structures. Hence, the possibility to perform remote, contact-less surveys and analyses, through the employment of UAV systems also, represents an effective opportunity to tackle these issues.
Given the well-known performances of TLS systems, their use for the three-dimensional survey of post-disaster heritages is consolidated in the literature. Nevertheless, photogrammetry has been progressively introduced, as an integration, or an alternative, to accomplish the task of post-disaster assessment [100,101]. Actually, accuracy evaluations of reality-based 3D data have been realized, with respect to LIDAR acquisitions, demonstrating that they are adequate for general evaluations of post-disaster needs, providing a good compromise between accuracy and velocity [102]. In several cases, post-disaster UAV photogrammetric surveys have represented almost the only way to safely and quickly evaluate the state of places, meanwhile providing quantitative insights about the damage entity, even for large areas or an entire small historical centre [103,104]. Likewise, the UAV point cloud of the Sulamani temple (Myanmar) has been classified to isolate and quantify, at a macroscopic level, damaged parts of the architecture with respect to non-altered ones in order to understand the earthquake effects [105]. In a further case, post-disaster assessment has been accomplished through a deviation analysis among multi-temporal 3D data, in which damages were quantified as differences, both in terms of areas and volumes, among different models. This workflow has been applied to the Church of Sant’Agostino in Amatrice, Italy, after a huge seismic event in 2016, and it allowed for quantification of the extension of collapsed or missing parts and the related crack patterns, both of the church and the bell tower [106].

3.2.2. Modelling and Simulation

With reference to structural analysis, FEM (Finite Element Method) or DEM (Discrete Element Method) models are mainly developed on the basis of laser scanner data because of the simplicity of acquisition of accurate three-dimensional data. In this context, the role of photogrammetry is often secondary with respect to laser scanning, which is considered as the primary source of geometric data, for the construction of the as-is model.
Nonetheless, some works have valorised photogrammetric point clouds or meshes for the same scope. Indeed, several modelling workflows entail integrated 3D surveys, which merge different scanning outcomes (photogrammetric, laser scanning), to realize FEM models for structural analysis. By way of example, evaluation of the structural stability of the Olympic theatre in Vicenza (Italy) was performed on a FEM model, whose geometry derives from photogrammetric data, for regular and mainly planar surfaces, and from laser scanning data, for architectural details with higher surface curvature [107]. Moreover, the geometrical and structural characterization of Pisa’s cathedral dome has been retrieved from merged polygonal meshes, derived from both range-based and image-based surveys [108]. Furthermore, Aguilar et al. (2018) used a hybrid point cloud of the church of the San Juan Bautista de Huaro (Perù), derived from the joint data from laser scanner and aerial/terrestrial photogrammetry, to implement an FE model functional to a non-linear static analysis, calibrated with dynamic properties derived from OMA (Operational Modal Analysis). The main aim was to assess the seismic capacity of the church and the most probable collapse mechanisms in response to a seismic event [109]. For the same purpose, Chácara et al. (2023) used non-linear numerical analysis in the FE model of the 16th-century Jesuit church of Cusco, Perù. In this case, in addition to the OMA, a series of non-destructive tests (e.g., passive IRT, Echo-impact testing) were performed to estimate the masonry material properties [110].
On the other hand, further approaches emphasize the advantage of exploiting uniquely photogrammetric data, with low-cost equipment, to extract both geometric and texture properties for the reconstruction of an FE model. However, only few works fall in this category, like the structural analysis of the masonry castle Torre Gaeta (Reggio Calabria) [111] or the stone masonry church of Santa Ana (Sevilla), where the authors enriched the structural model with data from environmental vibration techniques and OMA [112].
Some strategies entail the use of photogrammetry for structural health monitoring, not only to derive geometry and texture of the heritage, but also to deduce mechanical properties from the remote condition assessment and crack mapping performed on the photogrammetric survey [113,114]. In these cases, on the one hand, three-dimensional photogrammetric data have been used (i) to retrieve decay maps, representative of the state of conservation of the heritage, and to achieve a taxonomy of crack patterns, according to EMS98 (European Macroseismic Scale), of medieval masonry bridges, like the “Ponte delle Torri” of Spoleto, Italy [115], or (ii) to evaluate potential displacements/deformations (i.e., declivity of a tower, verticality of walls) like for the Spoleto masonry bell tower built in the late 14th century [116], or (iii) simply as high-detailed 3D data for the retrieval of a numerical model [117]. On the other hand, FEM/DEM enabled the assessment of the seismic capacity.
Notwithstanding, in several cases, photogrammetric surveys allow for the integration, interpretation and analysis of qualitative and quantitative information about the state of conservation. For example, Santagati et al. (2019) propose a workflow where 2D decay maps deriving from photogrammetric images are transformed into measurable parametric surfaces, within the HBIM environment [118]. HBIM also provides a framework and a tool supporting rapid seismic vulnerability assessment, always starting from a Structure-from-Motion survey, from which constructive characteristics, materials and conservation conditions have been determined [119,120,121]. A further development is represented by the work of Pavlovskis et al. (2019), wherein a photogrammetric-based HBIM 3D model, in combination with multiple-criteria decision-making techniques, has been exploited to finalize diagnosis into a selection of the best interventions to perform on the heritage in order to guarantee its preservation [122]. Another interesting aspect is related to the introduction of the time parameter within the HBIM environment. For example, Bruno et al. (2019), starting from a photogrammetric reconstruction, built a HBIM model where decay progression over time is not only assessed, but also simulated, in order to manage maintenance and restoration interventions [123].

3.3. Non-Destructive Diagnostic Investigation

In the field of non-destructive diagnostic investigation, including onsite techniques that are suitable, along with laboratory tests, to assess inherent characteristics and alterations of heritage buildings and, thus, to support the identification of factors and mechanisms causing decay and pathologies, 29 papers were selected. Among them, two main research lines might be identified, as reported in the following sub-sections: (i) multispectral imaging, based on the integration of 3D photorealistic models with data from different bands of the electromagnetic spectrum, namely thermal infrared (TIR), near infrared (NIR), ultraviolet (UV) and some specific wavelengths of the visible (VIS) light; (ii) multisensory data collection, based on the correlation between ground penetrating radar (GPR) and ultrasonic pulse velocity (UPV) with photogrammetry-based coloured point clouds and texturized polygonal meshes. In a few cases, both research lines merge.

3.3.1. Multispectral Imaging

One of the most documented multi-spectral approaches for photogrammetry-based 3D modelling is related to the combined acquisition of VIS and TIR images. This is certainly due to the great maturity of thermography as a non-destructive method for the investigation of construction materials and techniques, surface alterations, energy performances and humidity patterns in heritage buildings [124,125,126,127,128]. Nonetheless, this is consistent with the need to overcome some shortcomings of 2D thermograms, since they do not provide any metric information, they might be affected by environmental factors, especially when not acquired (quite) perpendicular to the surfaces, and, above all, they can guarantee fair resolution only at a very close camera-target distance, thus requiring manual analysis of large datasets and hindering the general wide overview of complex and/or big-sized objects.
In detail, Patrucco et al. [129] presented and compared two workflows, using Structure for Motion (SfM) algorithms, to process TIR images co-registered with VIS pictures by UAV surveys of architectural assets: the simpler one following the standard photogrammetric approach for multi-view VIS and TIR images separately; the more time-consuming one based on the orientation of the TIR dataset using the previously estimated absolute external orientation parameters of the visible cameras as an initial approximate solution for TIR images. The purpose was to balance the ease of the processing procedures with the reliability of the elaborated models, whose accuracy and completeness might be challenged by several features of both the target and the equipment, e.g., morphological complexity of the surveyed building, modularity of the technical elements, low radiometric contrast of the detected scenes, high acquisition distance, and low spatial resolution of the thermograms. Particularly, the first approach was found effective on a small rural chapel made of traditional masonry, showing extremely heterogeneous stone textures and partial cover with rough plaster. Conversely, it resulted in less confident models, compared to the corresponding ones from the second data-fusion approach, when applied to the reinforced concrete façade of a school, due to regular geometry, repetitive pattern and homogenous materials, and a reinforced concrete historic parabolic arch with complex spatial configuration, very similar surface colours/textures and great incidence of background data, such as sky, vegetation and surrounding elements. Furthermore, the second approach was found to be highly recommended by the same research group [130] whenever the available thermograms are not acquired for 3D reconstruction purposes, eventually with low overlapping, or whenever the targets are large settlements with several buildings, e.g., villages. For these cases, the use of Control Points (CPs), detectable in both datasets, as well as the employment of SfM photogrammetric software tools with new algorithms and specific templates for thermal images were also highlighted as facilitating strategies.
Differently, in the work by Paziewska and Rzonca [131], the detection of areas showing energy losses on a stone church located in the southern part of Poland was pursued by building a 3D point model based on thermograms by using thermal measurement marks and the dense matching method. Thus, the model obtained from colour photos was integrated with the point cloud created on the basis of the thermal images by migrating the thermal point attributes from the cloud to the vertices of the RGB model. In this way, the thermal vision of the point cloud was integrated with the three-dimensional RGB model of the church building.
A further documented workflow toward integration of VIS and TIR images is related to the reconstruction of the photorealistic 3D model and the following application of thermal textures, which is based on the preliminary orientation of the thermograms from the corresponding RGB pictures. This approach was found to be successful whenever the investigation target has prominent 2D development, such as facades of buildings or planimetric aerial views of structures and sites. For instance, it was applied by Scaioni et al. [132] in order to achieve a reliable metric evaluation of the size of several decay patterns, mainly the detachment of cladding tiles and exposure of metallic rebars, on the facades of an Italian church with reinforced concrete structure. To this end, from the dense point cloud automatically obtained from standard SfM-based photogrammetric processing, a 3D Triangulated Irregular Network (TIN) model was generated to be used for successive thermal texturing by orientation of the TIR images on the basis of the same dataset captured for texturing the geometric model. Similarly, Adamopoulos et al. [133] successfully detected plaster integration from previous restoration treatments, underlying structures and moisture patterns of the façade of a stone masonry building, whose photogrammetry 3D model was textured by thermal data, proving the great benefits of acquiring VIS and TIR images from the same device and with the same resolution by using a thermocamera equipped with both optoelectronic and thermal sensors. In this case, the additional survey by a high resolution photocamera was recommended to elaborate a more accurate point cloud. Furthermore, such an hybrid approach was applied by the same authors [60] on several ancient masonry walls to better identify the main weathering patterns, merging TIR, NIR and VIS images with thematic maps within a comprehensive Free and Open Source Software for Geographical Information System (FOSS GIS).
The selection of proper software tools, the employment of CPCs and the adaptation of acquisition equipment and elaboration procedures to the size and complexity of the targets are also discussed in the case of near-infrared (NIR) imagery for 3D modelling in the fields of archaeology and artworks, for well-established purposes of condition observation and decay assessment. In particular, Adamopoulos and Rinaudo [134] proposed an investigation on the use of relatively low-cost modified sensors, both mounted on UAVs and on tripods. They assessed four datasets, coming from heritage assets of different dimensions, including the stone walls on the inner courtyard of a monumental building, in order to compare the metric validity and radiometric quality of the NIR dense 3D point clouds and textured meshes resulting from two specific software solutions. The NIR models were meant for a variety of purposes, including the classification of the canopy to create an approximate of the digital terrain model for the archaeological site and the surface and subsurface characteristics of the historical materials for other case studies.
In some other cases, the multi-spectral approach has been extended to more than two bands of the electromagnetic spectrum, based on multi-spectral cameras, including sensors that use multi-lens systems with different filter combinations to acquire images simultaneously for several spectral ranges. It is worth mentioning that, in the case of multi-spectral cameras, the aforementioned data fusion process is made more straightforward by the simultaneous acquisition of different datasets with the same device and better image resolution compared with TIR cameras. In this field, Themistocleous et al. [135] discussed the case of a small church in Cyprus where several technologies, including multispectral imaging, were applied in order to integrate, through SfM photogrammetry and point-cloud generation, different 3D models in the visible, blue and near infrared bands. The method was found to be useful for the detection of decay patterns on the stone walls of the building, particularly due to high moisture contents. To this end, the researchers had preliminarily run some spectroscopy measurements for the identification of the spectral signatures of the most recurring moisture-related alterations, i.e., mosses, lichens and vegetation, that were found distinctively detectable in the blue (low reflectance) and near infrared (high reflectance) compared with the surroundings. Similarly, Percy et al. [53] developed 3D models from VIS, infrared (IR) and ultraviolet (UV) acquisitions to achieve a comprehensive assessment of the state of conservation of the decorated surfaces of a Caid residence in Morocco, while Erenoglu et al. [136] relied on the joint analysis of 3D models from digital, thermal and multi-spectral camera systems on UAVs to detect several anomalies in an ancient theatre in Turkey, including cracks on steps and stone, corrosions by water and wind, as well as parts repaired with concrete material during previous restoration works.

3.3.2. Multisensory Data Collection

In the field of multisensory data collection, some works [69,137,138,139] document the employment of photogrammetric survey as part of wider diagnostic campaigns, including both onsite and laboratory testing, where 3D models are evaluated together with direct observations in order to select the most representative areas for DTs and NDTs.
However, in other cases, the photogrammetric survey is mainly useful for the joint restitution and interpretation of experimental measurements.
For instance, several studies are focused on the assessment of heritage building materials and components by combined digital photogrammetry and GPR, which is acknowledged as valuable tool for the detection of morphology and extent of underground structures, inner stratigraphy of walls and floors and presence of cracks and humidity areas [140,141]. The two techniques are very well suited to enable the comprehensive assessment of decay patterns and degradation phenomena since the detailed visual documentation of the architectural surfaces might be related to the condition of the underlying construction component. For instance, Cozzolino et al. [142] presented the case of an abbey in South-East Italy, where the photorealistic survey of the internal and external walls supported the identification of extension and the location of substantial moisture traces often associated with considerable separations of plasterwork, swelling, mould appearance and blasting of paintings, while the radar scanning confirmed the corresponding presence of inner humidity, typically resulting in low reflection/high absorption of the electromagnetic signal. Moreover, the false-colour radargrams could be overlapped and visualized on the 2D textured vertical sections of the building, enabling a more intuitive and effective spatial correlation among the results. This correlation is also a result of the work by Chiabrando et al. [143], where GPR was used to detect the presence of underground structures around a masonry tower in North-West Italy through superimposition of radar profiles and horizontal orthoimages. Similarly, within a comprehensive investigation of a basilica in North-East Italy [144], the integrated visualization and analysis of GPR and Digital Elevation Models (DEMs) relating to the mosaics led to hypothesizing about the presence of buried structures belonging to the oldest construction phases under the investigated floors.
The potentialities of integrating the radargrams within the 3D model of a building are also documented. In the work by Abate et al. [145], the photogrammetric reconstruction of a “Painted Church” in Cyprus was used to develop an interactive environment, where 2D radargrams of the underground structures were rendered into the 3D space as flat 3D objects textured with the GPR image which could be interrogated and displayed interactively. Differently, Adamopoulos et al. [146], within a comprehensive investigation of an Italian castle where multispectral survey was also applied, tested the data fusion of the point clouds with GPR reflection amplitude values. In detail, the values were displayed as horizontal circular sections of a column, leading to the assumption that the bottom part had undergone mortar replacement from a previous intervention, and as isosurfaces of high echo for a portion of the monumental façade, supporting the diagnosis of high moisture content from water that had permeated the damaged structure’s surface layers. Moreover, the 3D elaboration of 2D radargrams was explored by Barrile et al. [147], who presented a study on a church in Italy, where a unique 3D BIM model was elaborated by merging the UAV-based reconstruction of the visible exteriors with the 3D GPR-based reconstruction of the hidden crypt that is no longer accessible. To this end, a VR/AR environment was specifically developed to make the results available to the general public. In the field of UAV survey, although with a different approach, Van Dongen at al. [148] outlined the potentialities of integrating aerial photogrammetry with aerial-GPR by showing the preliminary results from some laboratory tests on the printed replica of a monumental sanctuary in Peru covered by sand, whose buried structures were already known by onsite excavations.
A further NDT that is applied and interpreted with reference to image-based 2D sections and 3D models is sonic/ultrasonic testing, which might support assessment of the inner compactness of a building element by measuring the travel velocity of mechanical waves in the transversal section and, thus, benefit from correlation of the photorealistic restitution of the boundary surfaces [149]. For instance, Santini at al. [150] studied Roman masonry walls in opus incertum with sonic tests to correlate the propagation of the velocity through the horizontal section of the elements and the exterior masonry texture. To this end, 2D texturized elevations and plan views of the walls were integrated with tomography slices, supporting the identification of areas where higher velocities corresponded to lighter smooth hewn stone masonry that had reasonably undergone previous restoration works. Ortega et al. [151] exploited the same principle through 3D models in laboratory applications, where the validation of an automated sonic tomography system was achieved through correlation of the results with the geometrical digital replicas of stone masonry elements. For this purpose, an SfM model of the constructed wall was carried out, following the photogrammetric survey of all stones used in building the laboratory prototype.
Furthermore, three works from an Italian research group presented the cases of a Carrara marble [152] and some Pietra Forte limestone monolithic columns [92,153] in religious buildings located in Sardinia, Italy, where the high-resolution 3D modelling of the studied artefacts was useful before and after computing the velocity pattern of the ultrasonic signal through the investigated materials, as it provided information on the visible anomalies, supported the selection of suitable locations of the source and receiver point, and was used for better interpretation of the 3D ultrasonic tomography, giving images of the distribution of the longitudinal velocities in the investigated volumes. The approach was also applied by the same research group [154] to a pillar made of Pietra Forte and Pietra Cantone ashlars and mortar joints to investigate the inner construction typology and state of conservation.
In some other cases, 3D models were mainly used for the identification of the measurement points. Senos et al. [155] worked on an abbey in Portugal, where the ultrasonic transmission tomography survey, supported by high-resolution photogrammetry scanning for accurate positioning of sources and geophones, was carried out to investigate the dimensions and thicknesses of different columns as well as the structure and nature of materials inside them. Similarly, Akoglu et al. [156] made direct use of the 3D models for calibrated distance measurements for the ultrasonic measurements in situ.
Finally, the employment of CRP models to determine the position of the sensor system, which then allows for georeferenced of the results of measurements, was also proposed by Muradov et al. [157]. They applied a novel multispectral system to identify in-wall moisture content based on microwave spectroscopy and provided its precise location on a decorated measured wall of a museum in Poland as a part of a detailed architectural documentation for safeguarding and preserving cultural heritage buildings.

3.4. Multi-Source Documentation

Multi-source documentation is a key aspect in the condition assessment of heritage buildings, since it refers to the integration of all the relevant documentary, analytical and experimental records that lead to the reliable anamnesis, diagnosis and control of the state of conservation and residual performances [158,159]. In this field, close range and aerial photogrammetry models and methods are mainly exploited within digital platforms, collecting several data and enabling interaction modes with different levels of customization. In detail, among 17 selected papers, two main research lines might be identified, as reported in the following sub-sections: (i) platforms where coloured point clouds, texturized polygonal meshes and/or resulting ortho-images are external or internal records within a host digital environment; (ii) platforms where coloured point clouds and texturized polygonal meshes act as host digital environments for a variety of informative resources and products and where the users are provided with analysis functionalities, including measurement, segmentation, annotation and management.

3.4.1. Informative Records within Digital Host Environments

Among the most common host environments for multi-source documentation which include photogrammetry-based products are Virtual Tours (VTs) of spherical images and GIS platforms.
As far as VTs are concerned, several applications are reported, where image-based 3D models are linked through referenced switches/hotspots to external viewers. This is the case in the study by Trizio et al. [160], who implemented a web informative system with some thematic VTs of 360 panoramas, including “archaeological” and “damage” tours, of an abbey in Italy, by using the proprietary software 3DVista Virtual Tour Pro. The VTs were proposed as connecting hubs for collaborative design, providing annotation tools for mapping the spherical images, storing several records and connecting to 3D CRP models in Sketchfab online viewer through pop-up windows. A similar pipeline and software tools were proposed by De Fino et al. [67,161] for editing thematic VTs for “performance assessment” and “risk management” of a noble palace and a medieval castle in Southern Italy. The VTs herein display timeline schemes, surface decay patterns, diagnostic reports and aerial views of low-accessibility areas, as well as direct web links to coloured point clouds for documentation of architectural details and constructional components. Differently, Bruno et al. [162] developed the ad-hoc cloud-based VERBUM platform, adding some customized components to a standard Unity Game Engine project, where a Virtual Technical Tour (VTT) acts as a rapid, up-to-date, high fidelity-to-reality tool. The platform, which was demonstrated on a fortified masonry farmhouse and a reinforced concrete church in South Italy, includes the annotation of the spherical images, linkage to external files (e.g., texts, images, documents, audio and video contents) and visualization of 3D models, including both HBIM models and coloured point clouds, published as webGL objects in the web-based viewer Potree.
As far as the GIS platforms are concerned, in some cases, the host environment enables simple functionalities of visualization and download of 3D models as in the VTs, based on commercial applications. This is the case in the study by Costantino et al. [163], who developed a WebGIS platform, based on a QGIS project, for the management of rural areas and as a supporting tool in the planning and development processes, through a territory representation. In detail, the topographic database integrates different types of information layer and several links to external resources that can be visualized and downloaded, including informative cards and 3D metrics of rural architectures. Nevertheless, some other studies were found, exploiting higher levels of customization and interoperability between models and tools. For instance, Sedano-Espejo et al. [164] used the open source QGIS platform, further implemented with additional features, in order to collect relevant records on some archaeological ruins in Spain. The records refer to “construction materials and systems”, “historical information”, “damages” and “previous tests” and are all stored with their own field attributes in different shapefiles within the system. Moreover, the interoperability between GIS and CRP models is herein achieved by introducing several extracted orthoimages into the QGIS project and following exportation to the Android application QField. The application allows for onsite graphic mapping of the orthoimages based on the above-mentioned field attributes for materials and damages as well as the automatic management of texturized surfaces as vector datasets of the QGIS desktop software, where metric measurements and statistical analyses, along with interrogation of referenced links to historic information and previous tests, can be accomplished. A further demonstration of interoperability was tested by Tsilimantou et al. [165] who developed a workflow for multidisciplinary data integration within an information system combining GIS and HBIM approaches toward documentation and rehabilitation of a historic district in Greece. In detail, the ArcMap 10.5.1software was used as a GIS platform, where multidisciplinary data from documentary research and onsite NDTs were stored in a relational geo-database, including 3D point clouds from aerial CRP, image-based products, architectural and historical archives and drawings, documented construction phases and past intervention works. Moreover, the platform was used to display thematic maps of materials and decay patterns, as previously elaborated by CAD tools, on orthoimages as blueprints and then process them to be queried by GIS tools for correlation of different decay factors and assessment of the structural integrity of the building.

3.4.2. Digital Host Environments with Informative Records

The same approach described in Section 3.4.1 was found in the literature, where the host environments collecting different data, sources and products are the image-based models themselves. In this regard, once more, some studies are focused on the employment of available software tools. Coughenour et al. [166] exploited the potential of the commercial Potree and Unity3D engines as a 3D viewer of coloured point clouds and texturized polygonal meshes from CRP in order to enable online visualization by tablet, desktop and mobile phone, direct metric measurements and consultation of relevant informative contents—e.g., CAD geometric models and drawings, pictures, texts, schemes of timeline evolution—by referencing links to external resources. Similarly, Carraro et al. [167] applied different web tools for exploring, understanding and interacting with an archaeological site in Sardinia, Italy, by focusing on 3D modelling, semantic enrichment and the contextualization of digital records. To this end, the open-source multi-resolution web Potree renderer is used to navigate the coloured point cloud, which is labelled using a system of bounding boxes with several informative contents. The solution is meant for different users—researchers, administrators and general public—through different levels of interaction.
In other cases, more customized solutions are developed. For instance, Pedeli [168] presented a 3D information platform, based on CRP and TLS models, where different users can operate independently by measurement of highly accurate metric data and by graphic annotation of several data as textured areas on extracted orthoimages. The annotation is related to specific thematic categories, such as “functional components”, “materials”, “general condition” and “weathering effects”. Moreover, it is associated with pre-defined fields—e.g., texture colour, area, description, images, linked documents—along with lists of standardized terms in order to enable coordinated integration within the platform database. In the work by Mandelli at al. [169], a web informative platform, based on the novel designed system BIM3DSG, was used to georeference the results from laboratory tests of a 3D model of a statue trough spherical and areal hotspots. Furthermore, Boutsi et al. [170] developed an open-source web-based cultural heritage archive describing the application of rock settlements and masonry monuments, where multi-resolution 3D models constitute the core of the visualization, which is enriched by incorporation of image collections and textual information through interlinks that the user has direct access to while browsing the models. The multi-resolution approach ensures fast data transfer, rendering and loading, thus compensating for size and complexity, with additional features for annotating points of interest, extracting the original coordinates of any selected point, measuring distance between two selected points and a cross-section toolset for real-time orthogonal sections through the 3D scene or specific models. Staring from this experience, the same research group [171,172] later presented their creation of an open-source web-based platform as a centralized data hub, moving beyond advanced photogrammetric techniques for 3D capture and multi-dimensional documentation, by integrating metric data with cultural and historical resources in order to form a critical knowledge base for multiple purposes and user types. In detail, the METEORA platform is able to store and display 3D models, from aerial and ground CRPs among others, with different levels of detail and different referenced descriptive texts and images depending on the final users, which include geotechnical engineers, archaeologists/architects, historians/philologists/theologians, and teachers. Moreover, it enables the creation of annotations in the form of clickable geometries on the surface of 3D models to be used for the following: as a spatial reference for related multimedia, with the possibility to group the hotspots into spatial or thematic ontologies; the editing of text documents as well as titles, captions or descriptions of image and video files, linked with related hotspots, keywords and scientific specialty; and the potential integration of a WebXR module for 3D asset inspection into VR/AR sessions, which is currently under investigation. Finally, another example of an open source end-to-end solution for multi-source documentation based on image-based 3D models is the platform AIOLI [173,174], which is based on a web service and allows for multi-user collaborative documentation of 3D reality-based digitization of heritage artefacts. The web application allows users to upload a photogrammetric dataset, which is then fully automatically processed to build a dense 3D point cloud that, in turn, is used as a common geometric framework for spreading and correlating 2D annotations within an entire image set. This 2D–3D–2D projection process is replicated hundreds of times during a work session, as background task, so that the users can build 2D–3D annotations which are organized in hierarchical structures and multiple thematic layers. This digital environment also allows for enrichment of the 2D–3D annotation with custom description sheets and multimedia attachments. Furthermore, the platform was tested for semi-automatic classification via machine learning and deep learning [175].

4. Discussion

The below discussion of the results was developed according to the research questions as reported in Section 2.

4.1. What Are the Main Findings in the State-of-the-Art Applications of Photogrammetry Models and Methods for Diagnostic Purposes?

This scoping review started from an initial fundamental question, concerning how photogrammetry models and methods have been introduced and exploited within the diagnostic process, and what the roles and goals they fulfil. During the past decade, photogrammetric reality-capture 3D data have progressively become involved in the process, not only as a geometric representation of the heritage, but also as a visual support to accomplish remote observation of an artefact in order to assess its general state of conservation.
In the field of decay mapping (Section 3.1), these objectives are closely related to the first phase of the diagnostic process, the preliminary knowledge, and, particularly, to the direct observation/on-site survey, they are oriented both to understanding the spatial/morphological connections and the constructive characteristics and also to recognizing the presence of anomalies. The on-site collection of photogrammetric data increases/improves direct observation because it allows for augmentation of the survey with a remote observation of a huge quantity of data, thus supporting of decision makers. The acquired digital 3D data reproduce the actual state of places, hence serving as a mean for addressing multiple tasks: (i) a tool for an accurate visual inspection of the architecture [57,58]; (ii) a framework to add textual annotations or to manually locate visible damages/anomalies, both in a 2D or 3D environment [50,53,54,55]; and (iii) a raw database, from which colour- or geometry-related parameters can be extracted, for partial or full automatic detection and mapping of alterations [52,60]. The first two possibilities were thoroughly explored mainly during the first years of the analysed decade, as illustrated in Section 3.1.1, while the third possibility, extensively described in Section 3.1.2, is a more recent line of research, concerning the introduction of a certain degree of automation even in the first phases of the diagnostic process, through the implementation of image processing algorithms or artificial intelligence directly on 3D data. Hence, with respect to these three areas, the analysed research works are intended for the recognition and the quantification of visible surface decay forms: the majority of them look at macroscopic alterations like features induced by material losses, moisture patterns or variations expressed through the chromatic appearance of the surface, while a limited number aim at detecting small defects like cracks or micro-cracks.
This research subject is closely related to the second investigated topic, concerning structural assessment (Section 3.2), which is categorised into two aspects: control and monitoring (Section 3.2.1); modelling and simulation (Section 3.2.2), corresponding to many phases of the diagnostic process (monitoring and structural analysis). With respect to monitoring, photogrammetry provides a considerable contribution because of the possibility to collect temporally spaced 3D data that is representative of the state of places in different time periods. Indeed, the deviation among corresponding series of data leads to the detection of changes occurring in the investigated structure, thus allowing us to understand the evolution of pathological phenomena throughout the building’s life [93,94,95]. Thus, structural analysis starts with assessment of the presence of mechanical-related forms of decay, such as deformations or crack patterns, which could be symptoms of constructive defects, structural deficiency and static instabilities. In this perspective, the morphological comparison between reality-based data, on the one hand, and hypothetic, ideal and unaltered shapes and volumes, on the other hand, consents to highlight deformations, out-of-plumbs, cracks and losses, as opposed to the original conditions of the structure [87,88,90,91]. Likewise, photogrammetric data have also been exploited as a source to realize theoretical FEM models for the simulation of structural behaviour, even in post-disaster scenarios [108,109,110].
Furthermore, concerning non-destructive diagnostic investigation (Section 3.3) via photogrammetric methods and models, which is the third review topic, it should be noted that this is strictly related to material and structural tests that might support the reliable assessment of building characteristics and pathologies, after preliminary knowledge is obtained based on direct observation and historical/archaeological research. In particular, this topic aims at relating the visual condition of building surfaces and components with their surveyed physical, mechanical, constructional and performance characteristics. In the case of multispectral imaging, as presented in Section 3.3.1, a direct comparison is enabled between CRP surface colorimetric/metric data and TIR, NIR and/or UV surface data, which might be useful to assess the position and quantitative extent of non-visible anomalies, such as material inhomogeneity [129,130,134], energy losses [131], cracks and mechanical damage [132,136], moist areas [133,135] and weathering patterns [53,60]. Differently, in the case of multisensory data collection, as reported in Section 3.3.2, an indirect comparison is enabled between CRP surface colorimetric/metric data and measurements of constructional discontinuities and pathologies across the components; this comparison is detected as variations in radar reflection from underground structures [143,144,145,147,148]; moist areas [142,146]; or variations in ultrasonic velocities in walls [148,150,151], columns [92,152,153] and pillars [154]. In a few applications, the employment of CRP models to accurately set up onsite tests and equipment is also documented [155,156,157].
Finally, as far as multi-source documentation (Section 3.4) through digital platforms is concerned, it was found to be generally focused on the collection of data related to both direct observation and historical/archaeological research, as well as on the overall reporting of analysis and investigation activities. Direct observation is remotely enabled by 3D photogrammetric models themselves, along with further image-based products, such as photographs, videos by UAVs and 360° panoramas. Furthermore, historical and archaeological research has resulted in a repository of records which are directly linked in the platforms as documents, pictures and drawings. In most studies, particularly those reported in Section 3.4.1, where the 3D models are displayed as informative contents of a further host environment [67,160,161,162,164,165,169], material and structural tests are also included. Differently, in the great majority of studies discussed in Section 3.4.2, where the 3D models are the main host environments, great attention is paid to some functions that might enhance the interaction with coloured point clouds, texturized polygonal meshes and resulting orthoimages beyond the basic functions of visualization, measurement and labelling through web-based commercial viewers. These functions include 2D [168] or 3D [171,172,173,174,175] annotation of thematic features, such as construction materials and alteration patterns, identification of ontologies for textured geometries and linked records [171,172,173,174,175], different levels of interaction depending of the final users [167,171,172], different levels of resolution of the displayed models [170,171,172], visualization in immersive XR (extended Reality) [171,172] and application of machine learning routines [175].

4.2. Which Shortcomings of Traditional Approaches for Condition Assessment Do They Overcome?

Decay mapping through photogrammetric data handles a series of criticalities affecting traditional approaches to on-site survey/direct observation (visual on-site check; dimensional survey with metric tools like flexometers, laser distance meters, total station, aerial/terrestrial LIDAR; traditional photographic documentation). First of all, data collection is remarkably improved, due to the possibility to acquire huge amounts of raw data, enclosing both geometric and chromatic information, in reduced extents of time, and with common-use equipment, like standard cameras and smartphones. This consideration leads to the double advantage of simplifying data acquisition procedures and decreasing the time needed to survey inside or near the artefact, which is a notable benefit, especially in case of restricted accessibility (poor hygienic-sanitary conditions, unsafe post-emergency status, etc.). Secondly, the availability of accurate/high-resolution digital data allows for the use of easy direct observation/decay mapping tasks, thus moving towards an implementation of remote/contactless activities, which can be effectively performed on desk by processing the acquired photogrammetric data. As a matter of fact, the illustrated values also involve monitoring and structural analysis because the fulcrum of diagnostic actions can be transferred to the elaboration and interpretation of data through the help of artificial intelligence approaches and digital hardware/software tools. Indeed, image processing and machine/deep learning have led to considerable advancements, in view of the optimization of the whole process, because of the opportunity to perform accurate non-invasive analyses to quantify of damage level and damage progression in the investigated heritage overtime. In this respect, particularly regarding research works which entail the exploitation of 3D outputs, this offers a significant gain against the majority of traditional approaches in the detection and quantification of loss/deformation volumes or three dimensional alterations lying on morphologically articulated architectural elements (towers, columns, vaults, bass-reliefs,...). In addition,, as a result of automation, they can minimize the dependence on expertise from the decision maker.
Furthermore, the introduction of photogrammetry within the phases of direct observation, structural analysis and monitoring, results in the scalability of the approaches, which have been easily targeted to the assessment and monitoring of macroscopic visible damages, like humidity patterns, material losses, chromatic alterations (in the order of magnitude of few centimetres) (inserire citazioni); or, conversely, to the detection of microscopic anomalies, like crack patterns (inserire citazioni). Indeed, flexibility and scalability are paramount conditions which address the peculiarity of the diagnostic process in relation to the complexity of architectural heritages.
In addition, the integration of photogrammetric models within onsite non-destructive investigation shows the great advantage of displaying experimental data in a single three-dimensional, photorealistic and scaled environment, where the detected characteristics and anomalies are represented in terms of location and size; correspondence with visible construction materials and techniques; and mutual spatial, morphological and functional relationships. This approach is quite different from the conventional assessment of experimental data in combination with 2D drawings and images because it provides a comprehensive overview of results at the building scale. Consequently, it supports the identification of the origin and magnitude of the observed phenomena, based on the position in the whole system; the occurrence and distribution in similar sub-systems; and the orientation and exposure to the surrounding environmental conditions. Nonetheless, it provides an effective and intuitive way of communicating results to non-experts of diagnostic tests, particularly for techniques such as GPR and UPV, where the measured parameters, such as echo of electromagnetic pulses and travel velocity of mechanical waves, respectively, are indirect indicators of the characteristics under investigation.
Finally, the digital platforms for multi-source documentation aim at addressing some well-recognized limits of common practice in heritage building diagnosis and control. First and foremost, they allow for the harmonized integration of records related to different archives, authors, periods and formats, overcoming the high risk of information mismatch and fragmentation, particularly in preliminary knowledge from direct observation and documentary research. Moreover, they aim to boost data sharing and collaborative work among all specialists, and typically those involved in decision making on architectural artefacts, by providing a single structure for storing, displaying and discussing multidisciplinary records. Finally, they make digital replicas of the assets available and fully reproduced in terms of colours and textures as well as morphology and geometry. Thus, remote periodic inspection is particularly useful whenever buildings are endangered with restricted accessibility, have poor hygienic conditions and/or are far from the place where all or some of the involved stakeholders are located, by minimizing the “on-site” permanence of operators and maximizing the reliability of the acquired information for “on-desk” elaboration.

4.3. Which Are the Main Limitations and Perspectives in the Field from the Perspective of Decision Makers?

In the end, we are able draw some insights about the main limitations and perspectives of photogrammetry methods and models within the condition assessment of heritage buildings.
Within the fields of decay mapping, the implementation of automation in damage detection, analysis and monitoring have been explored so far, but this is still limited due to the great heterogeneity in architectural heritage, and often to the little availability/sharing of photogrammetric data belonging to analogous cases, which could be useful to perform comparative analyses or to train machine/deep learning systems. In this respect, it is worth restating that the majority of illustrated approaches entail a manual and qualitative decay mapping on 2D data, thus, not allowing for full comprehension of the three-dimensionality of decay phenomena in architectural structures with a complex morphology and volumetry. Particularly, most of the segmentation/clustering methods are applied to images, acting mainly on colour-related properties, while experimentations on point clouds are intended to identify the geometry of architectural elements, whereas only a few cases are focused on the recognition and quantification of pathologies(inserire citazioni). Beyond automatization, a further development in the field should overcome the substantial fragmentation and partialization in the methodologies, as well as the dispersion of the advancements, toward overall systematization though sectorial guidelines and standards. This is even more valid in light of the recurrent necessity to merge and combine data from multiple digital sources in order to tailor the approaches to several factors: (i) diagnostic phase, (ii) principal objective of the analysis, (iii) variable environmental conditions, (iv) geometric/morphological restrictions, (v) limited accessibility.
Another consideration deals with the predominant use of laser scanning as a primary source of geometric data and as the main basis for structural analysis or post-disaster assessment, with FEM or DEM or theoretical modelling, which suggests the need of further applications based on speditive survey, particularly by UAVs.
In the field of onsite non-destructive investigation, several issues are highlighted by the authors of the reviewed papers. They are mainly related to acquisition and elaboration tools for multispectral imagery toward successful data fusion, including the critical quality of TIR images in terms of resolution and contrast, which make homologous point extraction quite challenging; requiring co-registration and optimized arrangement of control points for VIS and TIR image; increased cost; reduced mobility; and the calibration needs of multi-sensory equipment. Nonetheless, in the field of multispectral imaginary, it is also worth underlying the need for general guidelines and best practices from the perspective of decision makers, regarding processing procedures which are related to peculiarities in the architectural asset and the characteristic/anomaly under investigation, in order to overcome the “case-by-case” approach currently found in the literature. Moreover, in the field of multi-sensory data from CRP, GPR and UPV techniques, an interesting development perspective could concern the definition of synthetic indicators extracted from multi-sensory models through segmentation and annotation, which could be used for systematic correlation analysis between surface alterations and inner anomalies.
Furthermore, the analysed studies on multi-source documentation through digital platforms might greatly benefit from the integration of real-time monitoring data on relevant structural and environmental parameters, as is sometimes foreseen by the authors themselves as a future perspective. As a matter of fact, a comprehensive diagnosis should include observation of the evolution overtime of displacements, inclinations, accelerations, air temperature and relative humidity, among the others, as complementary indicators of the origin and severity of cracks, deformations, dampness and surface decay visible patterns alongside remote visualization, consultation of relevant documents and annotation of thematic features on construction materials and alterations,. The integration of monitoring data is a key aspect of the Digital Twin (DT) concept, which is mainly associated with the HBIM approach, in view of continuous health monitoring throughout the service life of an asset. However, with specific focus on condition assessment and diagnosis as preparatory steps toward the conservation and maintenance plan of heritage buildings, it could suitably fit a digital environment where the target is realistically replicated, differently from parametric models, where several simplifications and schematization occur.
Moreover, the development of specific ontologies is highly desirable from the perspective of decision makers because it would be useful not only for data documentation but also for data interpretation in view of diagnosing occurring pathologies. In detail, the most advanced applications enable the semantic annotation and enrichment of 2D and 3D photogrammetry-based models, both in GIS-based and ad hoc platforms, through some pre-set descriptors related to materials, construction techniques, architectural elements and surface alterations. Indeed, a further useful improvement might involve the guided identification of correlations among the above-mentioned descriptors, supporting pre-diagnosis where visible evidence is associated with possible pathologies and causes and tests and analyses eventually lead to a final diagnosis. The above-mentioned approach applies to both ad hoc 3D model-based platforms and GIS-based platforms where the annotation function and a relational database are applicable.
Finally, the integration of monitoring data and ontologies for a final diagnosis would be even more attractive if combined with the further interesting development perspective of multi-source documentation through digital platforms, namely the management of a network of assets within the same informative environment. In fact, in the case of architectures sharing recurring similarities in construction techniques, environmental surroundings, maintenance conditions and/or protective regulations—e.g., historical centres, heritage buildings under the same managing authority—the availability of harmonized methods, tools of assessment and control that might optimize data collection and analysis, investigation procedures, priority identification and action planning would be highly desirable.

5. Conclusions

The proposed scoping review is intended to offer an overview of photogrammetry methods and models for the condition assessment of heritage buildings from the perspective of decision makers, mainly focusing on purposes and targets.
The preliminary literature search and selection though relevant keywords highlighted that a vast number of research studies deal with digital and aerial photogrammetry applied to architectural heritage and distinctively address representation, documentation, dissemination and digital fruition purposes (374 out of 491). Nevertheless, based on the bibliometric analysis of the selected dataset, it was found that debate on the topic is lively, with a quite stable trend of productivity in the last five years (15 papers per year on average), particularly in Italy (43%) and Europe (86%), with numerous research groups involved holding good transversal connections in terms of citations and multidisciplinary approach, thus highlighting the different scientific sectors cooperating on single frameworks, case studies and/or applications.
The content analysis in relation to the key phases of the diagnosis process—decay mapping, structural assessment, onsite non-destructive investigation and multi-source documentation—enabled the identification of some relevant achievements and advantages of photogrammetry-based procedures against well-known drawbacks of the current practice.
Furthermore, it is worth mentioning that, on the one hand, the robust and systematic processing of large amounts of information, the direct correlation between material and construction characteristics, and, on the other, visible anomalies and experimental measurements, as well as the creation of multi-user collaborative environments with effective remote inspection and harmonized data management, were empowered.
Nevertheless, further improvements were identified, including standardization of acquisition procedures, automatization of elaboration pipelines, development of best practices/guidelines for targeted assets and purposes, integration of real-time data, validation of diagnosis decision-making support tools and scalability to networks of consistent cases, which might pave the way for future research developments.
To this end, all specialists should contribute, through ad hoc web-based open repositories, by raw data sharing of digital products, through databases and routines that might be useful for training, in replication and adaptation to different contexts/goals, as well as by presentation of exemplary pilot cases where novel technologies are applied in public procurement interventions with cooperating academics, enterprises and authorities.
Finally, it should be noted that the found research on this topic was mainly academic, with a low involvement of government bodies, associations and enterprises. In this regard, future efforts should be made toward proficient technology transfer in favour of the final private and public stakeholders, with specific attention to training professional figures specialized in innovation management, as a bridge between scientific knowledge and business implementation.

Author Contributions

Conceptualization, F.F. and M.D.F.; methodology, M.D.F.; resources, M.D.F. and R.A.G.; data curation, M.D.F. and R.A.G.; formal analysis: M.D.F. and R.A.G.; writing—original draft preparation, M.D.F. and R.A.G.; writing—review and editing, M.D.F.; visualization, F.F.; supervision. All authors have read and agreed to the published version of the manuscript.

Funding

This research received no external funding.

Institutional Review Board Statement

Not applicable.

Informed Consent Statement

Not applicable.

Data Availability Statement

Publicly available datasets were analysed in this study.

Conflicts of Interest

The authors declare no conflict of interest.

References

  1. Hemsley, J.; Cappellini, V.; Stanke, G. Digital Applications for Cultural and Heritage Institutions; Taylor and Francis Inc.: Abingdon, UK, 2017; ISBN 9781315257808. [Google Scholar]
  2. Ippolito, A.; Cigola, M. Handbook of Research on Emerging Technologies for Digital Preservation and Information Modeling; IGI Global: Hershey, PA, USA, 2016; ISBN 9781522506812. [Google Scholar]
  3. Borowiecki, K.J.; Forbes, N.; Fresa, A. Cultural Heritage in a Changing World; Springer: Berlin/Heidelberg, Germany, 2016; ISBN 9783319295442. [Google Scholar]
  4. Kargas, A.; Loumos, G. Cultural Industry’s Strategic Development: Reaching International Audience by Using Virtual Reality and Augmented Reality Technologies. Heritage 2023, 6, 4640–4652. [Google Scholar] [CrossRef]
  5. Luhmann, T.; Robson, S.; Kyle, S.; Harley, I. Close Range Photogrammetry Principles, Techniques and Applications; Whittles Publishing: Dunbeath, UK, 2006; Volume 30, ISBN 9781849950572. [Google Scholar]
  6. Bedford, J. Photogrammetric Applications for Cultural Heritage. Guidance for Good Practice; Historic England: London, UK, 2017; pp. 1–128. [Google Scholar] [CrossRef]
  7. Elkhrachy, I. 3D Structure from 2D Dimensional Images Using Structure from Motion Algorithms. Sustainbility 2022, 14, 5399. [Google Scholar] [CrossRef]
  8. Kingsland, K. Comparative analysis of digital photogrammetry software for cultural heritage. Digit. Appl. Archaeol. Cult. Herit. 2020, 18, e00157. [Google Scholar] [CrossRef]
  9. Pepe, M.; Alfio, V.S.; Costantino, D. UAV Platforms and the SfM-MVS Approach in the 3D Surveys and Modelling: A Review in the Cultural Heritage Field. Appl. Sci. 2022, 12, 12886. [Google Scholar]
  10. Leon, I.; Pérez, J.J.; Senderos, M. Advanced Techniques for Fast and Accurate Heritage Digitisation in Multiple Case Studies. Sustainability 2020, 12, 6068. [Google Scholar] [CrossRef]
  11. Stylianidis, E.; Evangelidis, K.; Vital, R.; Dafiotis, P.; Sylaiou, S. 3D Documentation and Visualization of Cultural Heritage Buildings through the Application of Geospatial Technologies. Heritage 2022, 5, 2818–2832. [Google Scholar] [CrossRef]
  12. Danesh, M.M.; Rajabi, A. Importance of Digital Techniques of Documentation for the Conservation of Cultural Heritage. In Advances in Science, Technology and Innovation; Springer International Publishing: Cham, Switzerland, 2022; pp. 415–425. [Google Scholar]
  13. Yilmaz, H.M.; Yakar, M.; Gulec, S.A.; Dulgerler, O.N. Importance of digital close-range photogrammetry in documentation of cultural heritage. J. Cult. Herit. 2007, 8, 428–433. [Google Scholar] [CrossRef]
  14. Yastikli, N. Documentation of cultural heritage using digital photogrammetry and laser scanning. J. Cult. Herit. 2007, 8, 423–427. [Google Scholar] [CrossRef]
  15. Herman, G.V.; Caciora, T.; Ilies, D.C.; Ilies, A.; Deac, A.; Sturza, A.; Sonko, S.M.; Suba, N.S.; Nistor, S. 3D Modeling of the Cultural Heritage: Between Opportunity and Necessity. J. Appl. Eng. Sci. 2020, 10, 27–30. [Google Scholar] [CrossRef]
  16. Vital, R.; Sylaiou, S. Digital survey: How it can change the way we perceive and understand heritage sites. Digit. Appl. Archaeol. Cult. Herit. 2022, 24, e00212. [Google Scholar] [CrossRef]
  17. Laing, R. Built heritage modelling and visualisation: The potential to engage with issues of heritage value and wider participation. Dev. Built Environ. 2020, 4, 100017. [Google Scholar] [CrossRef]
  18. Grama, V.; Ilies, G.; Safarov, B.; Ilies, A.; Caciora, T.; Hodor, N.; Ilies, D.C.; Kieti, D.; Berdenov, Z.; Josan, I.; et al. Digital Technologies Role in the Preservation of Jewish Cultural Heritage: Case Study Heyman House, Oradea, Romania. Buildings 2022, 12, 1617. [Google Scholar] [CrossRef]
  19. Bozdoğan, Ö.; Yaman, A.; Yılmaz, H.M. An analysis on the corrosion of a cultural heritage. Int. J. Eng. Geosci. 2022, 7, 112–127. [Google Scholar] [CrossRef]
  20. Breton, T. EU Commission: On a Common European Data Space for Cultural Heritage; Official Journal of the European Union: Brussels, Belgium, 2021. [Google Scholar]
  21. Expert Group on Digital Cultural Heritage and Europeana. Basic Principles and Tips for 3D Digitisation of Tangible Cultural Heritage for Cultural Heritage Professionals and Institutions and Other Custodians of Cultural Heritage; Commission Européenne: Luxembourg, 2021; pp. 1–30.
  22. Yang, X.; Grussenmeyer, P.; Koehl, M.; Macher, H.; Murtiyoso, A.; Landes, T. Review of built heritage modelling: Integration of HBIM and other information techniques. J. Cult. Herit. 2020, 46, 350–360. [Google Scholar] [CrossRef]
  23. Mishra, M. Machine learning techniques for structural health monitoring of heritage buildings: A state-of-the-art review and case studies. J. Cult. Herit. 2021, 47, 227–245. [Google Scholar] [CrossRef]
  24. Aicardi, I.; Chiabrando, F.; Maria Lingua, A.; Noardo, F. Recent trends in cultural heritage 3D survey: The photogrammetric computer vision approach. J. Cult. Herit. 2018, 32, 257–266. [Google Scholar] [CrossRef]
  25. Adamopoulos, E.; Rinaudo, F. 3D interpretation and fusion of multidisciplinary data for heritage science: A review. Int. Arch. Photogramm. Remote Sens. Spat. Inf. Sci.-ISPRS Arch. 2019, 42, 17–24. [Google Scholar] [CrossRef]
  26. Adamopoulos, E.; Rinaudo, F. Close-range sensing and data fusion for built heritage inspection and monitoring—A review. Remote Sens. 2021, 13, 3936. [Google Scholar] [CrossRef]
  27. Sutherland, N.; Marsh, S.; Priestnall, G.; Bryan, P.; Mills, J. InfraRed Thermography and 3D-Data Fusion for Architectural Heritage: A Scoping Review. Remote Sens. 2023, 15, 2422. [Google Scholar] [CrossRef]
  28. Vileikis, O.; Khabibullaeyev, F. Application of digital heritage documentation for condition assessments and monitoring change in Uzbekistan. ISPRS Ann. Photogramm. Remote Sens. Spat. Inf. Sci. 2021, 8, 179–186. [Google Scholar] [CrossRef]
  29. Rossi, M.; Bournas, D. Structural Health Monitoring and Management of Cultural Heritage Structures: A State-of-the-Art Review. Appl. Sci. 2023, 13, 6450. [Google Scholar] [CrossRef]
  30. Sánchez-Aparicio, L.J.; Blanco-García, F.L.D.; Mencías-Carrizosa, D.; Villanueva-Llauradó, P.; Aira-Zunzunegui, J.R.; Sanz-Arauz, D.; Pierdicca, R.; Pinilla-Melo, J.; Garcia-Gago, J. Detection of damage in heritage constructions based on 3D point clouds. A systematic review. J. Build. Eng. 2023, 77, 107440. [Google Scholar] [CrossRef]
  31. Di Angelo, L.; Di Stefano, P.; Fratocchi, L.; Marzola, A. An AHP-based method for choosing the best 3D scanner for cultural heritage applications. J. Cult. Herit. 2018, 34, 109–115. [Google Scholar] [CrossRef]
  32. Moyano, J.; Nieto-Julián, J.E.; Bienvenido-Huertas, D.; Marín-García, D. Validation of close-range photogrammetry for architectural and archaeological heritage: Analysis of point density and 3d mesh geometry. Remote Sens. 2020, 12, 3571. [Google Scholar] [CrossRef]
  33. El-Din Fawzy, H. 3D laser scanning and close-range photogrammetry for buildings documentation: A hybrid technique towards a better accuracy. Alexandria Eng. J. 2019, 58, 1191–1204. [Google Scholar] [CrossRef]
  34. Koutsoudis, A.; Vidmar, B.; Ioannakis, G.; Arnaoutoglou, F.; Pavlidis, G.; Chamzas, C. Multi-image 3D reconstruction data evaluation. J. Cult. Herit. 2014, 15, 73–79. [Google Scholar] [CrossRef]
  35. Alshawabkeh, Y.; Baik, A. Integration of photogrammetry and laser scanning for enhancing scan-to-HBIM modeling of Al Ula heritage site. Herit. Sci. 2023, 11, 147. [Google Scholar] [CrossRef]
  36. Sestras, P.; Roșca, S.; Ștefan, B.; Naș, S.; Buru, S.M.; Kovacs, L.; Spalević, V.; Sestras, A.F. Feasibility assessments using unmanned aerial vehicle technology in heritage buildings: Rehabilitation-restoration, spatial analysis and tourism potential analysis. Sensors 2020, 20, 2054. [Google Scholar] [CrossRef]
  37. Attenni, M.; Bartolomei, C.; Inglese, C.; Ippolito, A.; Morganti, C.; Predari, G. Low cost survey and heritage value. SCIRES-IT Sci. Res. Inf. Technol. 2018, 7, 115–132. [Google Scholar] [CrossRef]
  38. Chiarini, S.; Cremonesi, S.; Fregonese, L.; Fassi, F.; Taffurelli, L. A multi-range approach for Cultural Heritage survey: A case study in Mantua Unesco site. Int. Arch. Photogramm. Remote Sens. Spat. Inf. Sci.-ISPRS Arch. 2014, 40, 157–164. [Google Scholar] [CrossRef]
  39. Remondino, F. Heritage recording and 3D modeling with photogrammetry and 3D scanning. Remote Sens. 2011, 3, 1104–1138. [Google Scholar] [CrossRef]
  40. Valzano, V.; Negro, F.; Foschi, R. The Gallery of the Castromediano’s Castle. Three-dimensional reconstruction and virtual representation. SCIRES-IT Sci. Res. Inf. Technol. 2018, 7, 13–26. [Google Scholar] [CrossRef]
  41. Brandolini, F.; Cremaschi, M.; Zerboni, A.; Esposti, M.D.; Mariani, G.S.; Lischi, S. SfM-photogrammetry for fast recording of archaeological features in remote areas. Archeol. Calc. 2021, 31, 33–45. [Google Scholar] [CrossRef]
  42. Stanga, C.; Valente, R.; Previtali, M. An integrated approach based on traditional archaeological surveys, digital recording techniques & historical documentation for the assessment of threats related to the climate-sensitive territorial context. Int. Arch. Photogramm. Remote Sens. Spat. Inf. Sci.-ISPRS Arch. 2017, 42, 195–201. [Google Scholar] [CrossRef]
  43. Pierdicca, R. Mapping Chimu’s settlements for conservation purposes using UAV and close range photogrammetry. The virtual reconstruction of Palacio Tschudi, Chan Chan, Peru. Digit. Appl. Archaeol. Cult. Herit. 2018, 8, 27–34. [Google Scholar] [CrossRef]
  44. Torres-González, M.; Revuelta, E.C.; Calero-Castillo, A.I. Photogrammetric State of Degradation Assessment of Decorative Claddings: The Plasterwork of the Maidens’ Courtyard (the Royal Alcazar of Seville). Virtual Archaeol. Rev. 2023, 14, 110–123. [Google Scholar] [CrossRef]
  45. Munn, Z.; Peters, M.D.J.; Stern, C.; Tufanaru, C.; McArthur, A.; Aromataris, E. Systematic review or scoping review? Guidance for authors when choosing between a systematic or scoping review approach. BMC Med. Res. Methodol. 2018, 18, 143. [Google Scholar] [CrossRef]
  46. Page, M.J.; McKenzie, J.E.; Bossuyt, P.M.; Boutron, I.; Hoffmann, T.C.; Mulrow, C.D.; Shamseer, L.; Tetzlaff, J.M.; Akl, E.A.; Brennan, S.E.; et al. The PRISMA 2020 statement: An updated guideline for reporting systematic reviews. Syst. Rev. 2021, 10, 89. [Google Scholar] [CrossRef]
  47. Donthu, N.; Kumar, S.; Mukherjee, D.; Pandey, N.; Marc, W. How to conduct a bibliometric analysis: An overview and guidelines. J. Bus. Res. 2021, 133, 285–296. [Google Scholar] [CrossRef]
  48. ICOMOS. Principles for the analysis, conservation and Structural Restoration of Architectural Heritage. In Proceedings of the ICOMOS 14th General Assembly in Victoria Falls, Victoria Falls, Zimbabwe, 27–31 October 2003. [Google Scholar]
  49. Jiang, F.; Ma, L.; Broyd, T.; Chen, K. Digital twin and its implementations in the civil engineering sector. Autom. Constr. 2021, 130, 103838. [Google Scholar] [CrossRef]
  50. Lo Brutto, M.; Ebolese, D.; Dardanelli, G. 3D modelling of a historical building using close-range photogrammetry and remotely piloted aircraft system (RPAS). Int. Arch. Photogramm. Remote Sens. Spat. Inf. Sci.-ISPRS Arch. 2018, 42, 599–606. [Google Scholar] [CrossRef]
  51. Lerena, M.S.G.; López, L. Photogrammetry (SfM-MVS) survey of rural historical heritage in the Pampean region. The “Primera Estancia”, Magdalena, Buenos Aires, Argentina. Arqueologia 2021, 27, 169–181. [Google Scholar] [CrossRef]
  52. Morgenthal, G.; Hallermann, N. Quality Assessment of Unmanned Aerial Vehicle (UAV) Based Visual Inspection of Structures. Adv. Struct. Eng. 2014, 17, 289–302. [Google Scholar] [CrossRef]
  53. Percy, K.; Ouimet, C.; Ward, S.; Santana Quintero, M.; Cancino, C.; Wong, L.; Marcus, B.; Whittaker, S.; Boussalh, M. Documentation for emergency condition mapping of Decorated historic surfaces at the Caid Residence, the Kasbah of Taourirt (Ouarzazate, Morocco). ISPRS Ann. Photogramm. Remote Sens. Spat. Inf. Sci. 2015, 2, 229–234. [Google Scholar] [CrossRef]
  54. Sužiedelytė-Visockienė, J.; Bagdžiūnaitė, R.; Malys, N.; Maliene, V. Close-range photogrammetry enables documentation of environment-induced deformation of architectural heritage. Environ. Eng. Manag. J. 2015, 14, 1371–1381. [Google Scholar] [CrossRef]
  55. Nocerino, E.; Rieke-Zapp, D.H.; Trinkl, E.; Rosenbauer, R.; Farella, E.M.; Morabito, D.; Remondino, F. Mapping VIS and UVL imagery on 3D geometry for non-invasive, non-contact analysis of a vase. Int. Arch. Photogramm. Remote Sens. Spat. Inf. Sci.-ISPRS Arch. 2018, 42, 773–780. [Google Scholar] [CrossRef]
  56. Azzola, P.; Cardaci, A.; Versaci, A. Integrated 3D survey and diagnostic analysis for the building engineering: The former kindergarten san filippo neri in dalmine. ISPRS Ann. Photogramm. Remote Sens. Spat. Inf. Sci. 2019, 42, 51–56. [Google Scholar] [CrossRef]
  57. Lo Brutto, M.; Dardanelli, G.; Ebolese, D.; Milazzo, G.; Pipitone, C.; Sciortino, R. The main portal of the cathedral of monreale: First geometric analysis and interpretive assessment of architectural features. Int. Arch. Photogramm. Remote Sens. Spat. Inf. Sci. 2017, 42, 381–387. [Google Scholar] [CrossRef]
  58. Pepe, M.; Costantino, D. Uav photogrammetry and 3d modelling of complex architecture for maintenance purposes: The case study of the masonry bridge on the sele river, italy. Period. Polytech. Civ. Eng. 2021, 65, 191–203. [Google Scholar] [CrossRef]
  59. Nespeca, R.; De Luca, L. Analysis, thematic maps and data mining from point cloud to ontology for software development. Int. Arch. Photogramm. Remote Sens. Spat. Inf. Sci.-ISPRS Arch. 2016, 41, 347–354. [Google Scholar] [CrossRef]
  60. Adamopoulos, E.; Rinaudo, F. Combining Multiband Imaging, Photogrammetric Techniques, and FOSS GIS for Affordable Degradation Mapping of Stone Monuments.pdf. Buildings 2021, 11, 304. [Google Scholar] [CrossRef]
  61. Fernández-Lozano, J.; Gutiérrez-Alonso, G. The Alejico Carboniferous Forest: A 3D-Terrestrial and UAV-Assisted Photogrammetric Model for Geologic Heritage Preservation. Geoheritage 2017, 9, 163–173. [Google Scholar] [CrossRef]
  62. De Canio, G.; Mongelli, M.; Tatì, A.; Giocoli, A.; Roselli, I.; Rinaldis, D.; Hailemikael, S.; Borfecchia, F. Structural monitoring of the columns at the Cathedral of Orvieto. In Proceedings of the SHMII 2015—7th International Conference on Structural Health Monitoring of Intelligent Infrastructure; International Society for Structural Health Monitoring of Intelligent Infrastructure, Torino, Italy, 1–3 July 2015. [Google Scholar]
  63. Randazzo, L.; Collina, M.; Ricca, M.; Barbieri, L.; Bruno, F.; Arcudi, A.; La Russa, M.F. Damage indices and photogrammetry for decay assessment of stone-built cultural heritage: The case study of the san domenico church main entrance portal (South Calabria, Italy). Sustainbility 2020, 12, 5198. [Google Scholar] [CrossRef]
  64. Roussel, R.; Bagnéris, M.; De Luca, L.; Bomblet, P. A digital diagnosis for the « autumn » statue (marseille, france): Photogrammetry, digital cartography and construction of a thesaurus. Int. Arch. Photogramm. Remote Sens. Spat. Inf. Sci.-ISPRS Arch. 2019, 42, 1039–1046. [Google Scholar] [CrossRef]
  65. Pratali Maffei, S.; Canevese, E.; De Gottardo, T. The real in the virtual. The 3D model in the cultural heritage sector: The tip of the iceberg. ISPRS Ann. Photogramm. Remote Sens. Spat. Inf. Sci. 2019, 42, 615–621. [Google Scholar] [CrossRef]
  66. Baranwal, E.; Raghvendra, S.; Tiwari, P.S.; Pande, H. Health Monitoring and Assessment of the Cultural Monument through Unmanned Aerial Vehicle (UAV) Image Processing; Springer: Singapore, 2021; ISBN 9789811580246. [Google Scholar]
  67. Fino, M.D.; Galantucci, R.A.; Fatiguso, F. Remote diagnosis and control of heritage architecture by photorealistic digital environments and models. Scires-It 2019, 9, 1–16. [Google Scholar] [CrossRef]
  68. Alshawabkeh, Y.; El-Khalili, M. Detection and quantification of material displacements at historical structures using photogrammetry and laser scanning techniques. Mediterr. Archaeol. Archaeom. 2013, 13, 57–67. [Google Scholar]
  69. Bala’awi, F.; Alshawabkeh, Y.; Alawneh, F.; Al Masri, E. Damage assessment and digital 2D-3D documentation of Petra treasury. Mediterr. Archaeol. Archaeom. 2012, 12, 21–41. [Google Scholar]
  70. Guerra, M.G.; Galantucci, R.A. Standard quantification and measurement of damages through features characterization of surface imperfections on 3D models: An application on architectural heritages. Procedia CIRP 2020, 88, 515–520. [Google Scholar] [CrossRef]
  71. Galantucci, R.A.; Fatiguso, F. Advanced damage detection techniques in historical buildings using digital photogrammetry and 3D surface anlysis. J. Cult. Herit. 2019, 36, 51–62. [Google Scholar] [CrossRef]
  72. Galantucci, R.A.; Fatiguso, F.; Galantucci, L.M. A proposal for a new standard quantification of damages of cultural heritages, based on 3D scanning. SCIRES-IT-Sci. Res. Inf. Technol. 2018, 8, 121–138. [Google Scholar] [CrossRef]
  73. Lawonn, K.; Trostmann, E.; Preim, B.; Hildebrandt, K. Visualization and Extraction of Carvings for Heritage Conservation. IEEE Trans. Vis. Comput. Graph. 2017, 23, 801–810. [Google Scholar] [CrossRef] [PubMed]
  74. Carrero-Pazos, M.; Vilas-Estévez, B.; Vázquez-Martínez, A. Digital imaging techniques for recording and analysing prehistoric rock art panels in Galicia (NW Iberia). Digit. Appl. Archaeol. Cult. Herit. 2018, 8, 35–45. [Google Scholar] [CrossRef]
  75. Danese, M.; Sileo, M.; Masini, N. Geophysical Methods and Spatial Information for the Analysis of Decaying Frescoes. Surv. Geophys. 2018, 39, 1149–1166. [Google Scholar] [CrossRef]
  76. Valero, E.; Bosché, F.; Forster, A. Automatic segmentation of 3D point clouds of rubble masonry walls, and its application to building surveying, repair and maintenance. Autom. Constr. 2018, 96, 29–39. [Google Scholar] [CrossRef]
  77. Valero, E.; Forster, A.; Bosché, F.; Hyslop, E.; Wilson, L.; Turmel, A. Automated defect detection and classification in ashlar masonry walls using machine learning. Autom. Constr. 2019, 106, 102846. [Google Scholar] [CrossRef]
  78. Del Pozo, S.; Herrero-Pascual, J.; Felipe-García, B.; Hernández-López, D.; Rodríguez-Gonzálvez, P.; González-Aguilera, D. Multispectral radiometric analysis of façades to detect pathologies from active and passive remote sensing. Remote Sens. 2016, 8, 80. [Google Scholar] [CrossRef]
  79. Malinverni, E.S.; Pierdicca, R.; Sturari, M.; Colosi, F.; Orazi, R. Documentation & detection of colour changes of bas relieves using close range photogrammetry. ISPRS Arch. 2017, 42, 203–210. [Google Scholar] [CrossRef]
  80. Grilli, E.; Dininno, D.; Petrucci, G.; Remondinoa, F. From 2D to 3D supervised segmentation and classification for cultural heritage applications. Int. Arch. Photogramm. Remote Sens. Spat. Inf. Sci.-ISPRS Arch. 2018, 42, 399–406. [Google Scholar] [CrossRef]
  81. Grilli, E.; Remondino, F. Classification of 3D Digital Heritage. Remote Sens. 2019, 11, 847. [Google Scholar] [CrossRef]
  82. Adamopoulos, E.; Rinaudo, F. Documenting the State of Preservation of Historical Stone Sculptures in Three Dimensions with Digital Tools; Springer International Publishing: Berlin/Heidelberg, Germany, 2021; Volume 12663, ISBN 9783030687953. [Google Scholar]
  83. Gong, Y.; Zhang, F.; Jia, X.; Huang, X.; Li, D.; Mao, Z. Deep neural networks for quantitative damage evaluation of building losses using aerial oblique images: Case study on the great wall (china). Remote Sens. 2021, 13, 1321. [Google Scholar] [CrossRef]
  84. Idjaton, K.; Janvier, R.; Balawi, M.; Desquesnes, X.; Brunetaud, X.; Treuillet, S. Detection of limestone spalling in 3D survey images using deep learning. Autom. Constr. 2023, 152, 104919. [Google Scholar] [CrossRef]
  85. Galantucci, R.A.; Musicco, A.; Bruno, S.; Fatiguso, F. Automatic detection of dampness phenomena on architectural elements by point cloud segmentation. Rehabend 2020, 1141–1148. Available online: https://www.researchgate.net/publication/344559473_AUTOMATIC_DETECTION_OF_DAMPNESS_PHENOMENA_ON_ARCHITECTURAL_ELEMENTS_BY_POINT_CLOUD_SEGMENTATION (accessed on 23 October 2023).
  86. Musicco, A.; Galantucci, R.A.; Bruno, S.; Verdoscia, C.; Fatiguso, F. Automatic Point Cloud Segmentation for the Detection of Alterations on Historical Buildings Through an Unsupervised and Clustering-Based Machine Learning Approach. ISPRS Ann. Photogramm. Remote Sens. Spat. Inf. Sci. 2021, 2, 129–136. [Google Scholar] [CrossRef]
  87. Tucci, G.; Bonora, V.; Fiorini, L.; Conti, A. The florence baptistery: 3-D Survey as a knowledge tool for historical and structural investigations. Int. Arch. Photogramm. Remote Sens. Spat. Inf. Sci.-ISPRS Arch. 2016, 41, 977–984. [Google Scholar] [CrossRef]
  88. Federman, A.; Shrestha, S.; Quintero, M.S.; Mezzino, D.; Gregg, J.; Kretz, S.; Ouimet, C. Unmanned Aerial Vehicles (UAV) Photogrammetry in the Conservation of Historic Places: Carleton Immersive Media Studio Case Studies. Drones 2018, 2, 18. [Google Scholar] [CrossRef]
  89. García-León, J.; García Martín, A.; Torres Picazo, M.; Fernández, J. 3D recording and modelling of mining heritage: The monserrat mine, sierra minera of cartagena-la unión, Southeast of Spain. Int. Arch. Photogramm. Remote Sens. Spat. Inf. Sci.-ISPRS Arch. 2017, 42, 325–330. [Google Scholar] [CrossRef]
  90. Markiewicz, J.; Zawieska, D.; Podlasiak, P. Comparing multi-source photogrammetric data during the examination of verticality in a Monumental tower. Int. Arch. Photogramm. Remote Sens. Spat. Inf. Sci.-ISPRS Arch. 2017, 42, 475–480. [Google Scholar] [CrossRef]
  91. Sammartano, G.; Spanò, A. High scale 3d modelling and orthophoto of curved masonries for a multipurpose representation, analysis and assessment. Int. Arch. Photogramm. Remote Sens. Spat. Inf. Sci.-ISPRS Arch. 2017, 42, 245–252. [Google Scholar] [CrossRef]
  92. Casula, G.; Fais, S.; Cuccuru, F.; Bianchi, M.G.; Ligas, P. Diagnostic Process of an Ancient Colonnade Using 3D High-Resolution Models with Non-Invasive Multi Techniques. Sensors 2023, 23, 3098. [Google Scholar] [CrossRef]
  93. Malinverni, E.S.; Pierdicca, R.; Di Stefano, F.; Sturari, M.; Mameli, M.; Frontoni, E.; Orazi, R.; Colosi, F. How to Extract Useful Information about the Decay of Bass Relieves in Archaeological Area. ISPRS Ann. Photogramm. Remote Sens. Spat. Inf. Sci. 2019, 42, 785–792. [Google Scholar] [CrossRef]
  94. Bevilacqua, M.G.; Caroti, G.; Martínez-Espejo Zaragoza, I.; Piemonte, A. Orientation of archive images on 3D digital models of painted vaults: An interesting tool for restorers. Appl. Geomat. 2018, 10, 385–398. [Google Scholar] [CrossRef]
  95. Kong, X.; Hucks, R.G. Preserving our heritage: A photogrammetry-based digital twin framework for monitoring deteriorations of historic structures. Autom. Constr. 2023, 152, 104928. [Google Scholar] [CrossRef]
  96. López-Martínez, T.; García-Bueno, A.; Medina-Flórez, V.J. New methodology for the assessment of cleaning treatments. Applications of photogrammetry for restoration. J. Cult. Herit. 2018, 30, 117–123. [Google Scholar] [CrossRef]
  97. Falcone, M.; Origlia, A.; Campi, M.; Di Martino, S. From Architectural Survey To Continuous Monitoring: Graph-Based Data Management for Cultural Heritage Conservation With Digital Twins. Int. Arch. Photogramm. Remote Sens. Spat. Inf. Sci. 2021, 43, 47–53. [Google Scholar] [CrossRef]
  98. Jalón, M.L.; Chiachío, J.; Gil-Martín, L.M.; Hernández-Montes, E. Probabilistic identification of surface recession patterns in heritage buildings based on digital photogrammetry. J. Build. Eng. 2021, 34, 101922. [Google Scholar] [CrossRef]
  99. Menéndez, E.; Gil Martín, L.M.; Salem, Y.; Jalón, L.; Hernández-Montes, E.; Alonso, M.C. Bayesian assessment of surface recession patternsin brick buildings with critical factors identification. Bol. Soc. Esp. Ceram. Vidr. 2022, 61, 357–373. [Google Scholar] [CrossRef]
  100. Previtali, M.; Stanga, C.; Molnar, T.; Van Meerbeek, L.; Barazzetti, L. An integrated approach for threat assessment and damage identification on built heritage in climate-sensitive territories: The Albenga case study (San Clemente church). Appl. Geomat. 2018, 10, 485–499. [Google Scholar] [CrossRef]
  101. Haddad, N.A.; Akasheh, T.S.; Lerma, J.L.; Khresat, B.R. Towards a Risk Management and Conservation Plan for the Djin Blocks at the World Heritage Site of Petra, Jordan: The Case of Djin Block No. 9. Conserv. Manag. Archaeol. Sites 2015, 17, 175–191. [Google Scholar] [CrossRef]
  102. Gagliolo, S.; Fagandini, R.; Passoni, D.; Federici, B.; Ferrando, I.; Pagliari, D.; Pinto, L.; Sguerso, D. Parameter optimization for creating reliable photogrammetric models in emergency scenarios. Appl. Geomat. 2018, 10, 501–514. [Google Scholar] [CrossRef]
  103. Calantropio, A.; Chiabrando, F.; Sammartano, G.; Spanò, A.; Losè, L.T. UAV strategies validation and remote sensing data for damage assessment in post-disaster scenarios. Int. Arch. Photogramm. Remote Sens. Spat. Inf. Sci.-ISPRS Arch. 2018, 42, 121–128. [Google Scholar] [CrossRef]
  104. Croce, V.; Caroti, G.; Piemonte, A. Assessment of earthquake-induced damage level on buildings: Analysis of two different survey methods for a case study. Int. Arch. Photogramm. Remote Sens. Spat. Inf. Sci.-ISPRS Arch. 2019, 42, 351–358. [Google Scholar] [CrossRef]
  105. Baranwal, E.; Seth, P.; Pande, H.; Raghavendra, S.; Kushwaha, S.K.P. Application of Unmanned Aerial Vehicle (UAV) for Damage Assessment of a Cultural Heritage Monument; Springer International Publishing: Berlin/Heidelberg, Germany, 2020; Volume 51, ISBN 9783030373931. [Google Scholar]
  106. Chiabrando, F.; Di Lolli, A.; Patrucco, G.; Spanò, A.; Sammartano, G.; Losè, L.T. Multitemporal 3D modelling for cultural heritage emergency during seismic events: Damage assesment of S. Agostino church in Amatrice (RI). Int. Arch. Photogramm. Remote Sens. Spat. Inf. Sci.-ISPRS Arch. 2017, 42, 69–76. [Google Scholar] [CrossRef]
  107. Guarnieri, A.; Milan, N.; Vettore, A. Monitoring of complex structure for structural control using terrestrial laser scanning (Tls) and photogrammetry. Int. J. Archit. Herit. 2013, 7, 54–67. [Google Scholar] [CrossRef]
  108. Aita, D.; Barsotti, R.; Bennati, S.; Caroti, G.; Piemonte, A. 3-Dimensional geometric survey and structural modelling of the dome of Pisa cathedral. Int. Arch. Photogramm. Remote Sens. Spat. Inf. Sci. 2017, 42, 39–46. [Google Scholar] [CrossRef]
  109. Aguilar, R.; Noel, M.F.; Ramos, L.F. Integration of reverse engineering and non-linear numerical analysis for the seismic assessment of historical adobe buildings. Autom. Constr. 2019, 98, 1–15. [Google Scholar] [CrossRef]
  110. Chácara, C.; Reátegui, R.; Oré, Á.; Suarez, P.; Aguilar, R. Integration of NDT, 3D parametric modelling, and nonlinear numerical analysis for the seismic assessment of a vaulted stone-masonry historical building. J. Build. Eng. 2023, 70, 106347. [Google Scholar] [CrossRef]
  111. Barrile, V.; Bilotta, G.; D’Amore, E.; Meduri, G.M.; Trovato, S. Structural modeling of a historic castle using close range photogrammetry. Int. J. Math. Comput. Simul. 2016, 10, 370–380. [Google Scholar]
  112. Valseca, J.A.; Rodriguez-Leon, M.T.; Garcia, P.P.; Vicente, E.V.; Cardiel, V.C. Dynamic identification for structural analysis of santa ana church in Seville. In Science and Digital Technology for Cultural Heritage-Interdisciplinary Approach to Diagnosis, Vulnerability, Risk Assessment and Graphic Information Models: Proceedings of the 4th International Congress Science and Technology for the Conservation of Cultural Heritage (TechnoHeritage 2019), Sevilla, Spain, 26–30 March 2019; CRC Press: Boca Raton, FL, USA, 2019; pp. 109–115. [Google Scholar] [CrossRef]
  113. Blyth, A.; Napolitano, R.; Glisic, B. Documentation, structural health monitoring and numerical modelling for damage assessment of the Morris Island Lighthouse. Philos. Trans. R. Soc. A Math. Phys. Eng. Sci. 2019, 377, 20190002. [Google Scholar] [CrossRef]
  114. Bassier, M.; Hardy, G.; Bejarano-Urrego, L.; Drougkas, A.; Verstrynge, E.; Balen, K.V.; Vergauwen, M. Semi-automated creation of accurate FE meshes of heritage masonry walls from point cloud data. In Proceedings of the International Conference on Structural Analysis of Historical Constructions (SAHC), Cusco, Peru, 11–13 September 2018; Volume 18, pp. 1–8. [Google Scholar]
  115. Roselli, I.; Malena, M.; Mongelli, M.; Cavalagli, N.; Gioffrè, M.; De Canio, G.; de Felice, G. Health assessment and ambient vibration testing of the “Ponte delle Torri” of Spoleto during the 2016–2017 Central Italy seismic sequence. J. Civ. Struct. Health Monit. 2018, 8, 199–216. [Google Scholar] [CrossRef]
  116. Micelli, F.; Cascardi, A.; Aiello, M.A. Seismic capacity estimation of a masonry bell-tower with verticality imperfection detected by a drone-assisted survey. Infrastructures 2020, 5, 72. [Google Scholar] [CrossRef]
  117. Chen, S.; Wang, S.; Li, C.; Hu, Q.; Yang, H. A seismic capacity evaluation approach for architectural heritage using finite element analysis of three-dimensional model: A case study of the limestone hall in the ming dynasty. Remote Sens. 2018, 10, 963. [Google Scholar] [CrossRef]
  118. Santagati, C.; Laurini, C.R.; Sanfilippo, G.; Bakirtzis, N.; Papacharalambous, D.; Hermon, S. Hbim for the surveying, analysis and restoration of the saint john the theologian cathedral in Nicosia (Cyprus). ISPRS Ann. Photogramm. Remote Sens. Spat. Inf. Sci. 2019, 42, 1039–1046. [Google Scholar] [CrossRef]
  119. Mondello, A.; Garozzo, R.; Salemi, A.; Santagati, C. HBIM for the SEISMIC vulnerability assessment of traditional bell towers. Int. Arch. Photogramm. Remote Sens. Spat. Inf. Sci.-ISPRS Arch. 2019, 42, 791–798. [Google Scholar] [CrossRef]
  120. Palestini, C.; Basso, A.; Graziani, L. Integrated photogrammetric survey and bim modelling for the protection of school heritage, applications on a case study. Int. Arch. Photogramm. Remote Sens. Spat. Inf. Sci.-ISPRS Arch. 2018, 42, 821–828. [Google Scholar] [CrossRef]
  121. Sarıcaoğlu, T.; Saygı, G. Data-Driven Conservation Actions of Heritage Places Curated With Hbim. Virtual Archaeol. Rev. 2022, 13, 17–32. [Google Scholar] [CrossRef]
  122. Pavlovskis, M.; Migilinskas, D.; Antucheviciene, J.; Kutut, V. Ranking of heritage building conversion alternatives by applying BIM and MCDM: A case of Sapieha Palace in Vilnius. Symmetry 2019, 11, 973. [Google Scholar] [CrossRef]
  123. Bruno, S.; Musicco, A.; Fatiguso, F.; Dell’Osso, G.R. The Role of 4D Historic Building Information Modelling and Management in the Analysis of Constructive Evolution and Decay Condition within the Refurbishment Process. Int. J. Archit. Herit. 2021, 15, 1250–1266. [Google Scholar] [CrossRef]
  124. Tejedor, B.; Lucchi, E.; Bienvenido-Huertas, D.; Nardi, I. Non-destructive techniques (NDT) for the diagnosis of heritage buildings: Traditional procedures and futures perspectives. Energy Build. 2022, 263, 112029. [Google Scholar] [CrossRef]
  125. Gopinath, V.K.; Ramadoss, R. Review on structural health monitoring for restoration of heritage buildings. Mater. Today Proc. 2021, 43, 1534–1538. [Google Scholar] [CrossRef]
  126. Barbosa, M.T.G.; Rosse, V.J.; Laurindo, N.G. Thermography evaluation strategy proposal due moisture damage on building facades. J. Build. Eng. 2021, 43, 102555. [Google Scholar] [CrossRef]
  127. Pappalardo, G.; Mineo, S.; Caliò, D.; Bognandi, A. Evaluation of Natural Stone Weathering in Heritage Building by Infrared Thermography. Heritage 2022, 5, 2594–2614. [Google Scholar] [CrossRef]
  128. Cascardi, A.; Longo, F.; Perrone, D.; Lassandro, P.; Aiello, M.A. Thermography Investigation and Seismic Vulnerability Assessment of a Historical Vaulted Masonry Building. Heritage 2022, 5, 2041–2061. [Google Scholar] [CrossRef]
  129. Patrucco, G.; Giulio Tonolo, F.; Sammartano, G.; Spanò, A. Sfm-Based 3D Reconstruction of Heritage Assets Using Uav Thermal Images. Int. Arch. Photogramm. Remote Sens. Spat. Inf. Sci.-ISPRS Arch. 2022, 43, 399–406. [Google Scholar] [CrossRef]
  130. Patrucco, G.; Cortese, G.; Giulio Tonolo, F.; Spanò, A. Thermal and optical data fusion supporting built heritage analyses. Int. Arch. Photogramm. Remote Sens. Spat. Inf. Sci.-ISPRS Arch. 2020, 43, 619–626. [Google Scholar] [CrossRef]
  131. Paziewska, J.; Rzonca, A. Integration of Thermal and RGB Data Obtained by Means of a Drone for Interdisciplinary Inventory. Energies 2022, 15, 4971. [Google Scholar] [CrossRef]
  132. Scaioni, M.; Rosina, E.; L’erario, A.; Dìaz-Vilariño, L. Integration of infrared thermography & photogrammetric surveying of built landscape. Int. Arch. Photogramm. Remote Sens. Spat. Inf. Sci.-ISPRS Arch. 2017, 42, 153–160. [Google Scholar] [CrossRef]
  133. Adamopoulos, E.; Volinia, M.; Girotto, M.; Rinaudo, F. Three-dimensional thermal mapping from IRT images for rapid architectural heritage NDT. Buildings 2020, 10, 187. [Google Scholar] [CrossRef]
  134. Adamopoulos, E.; Rinaudo, F. Enhancing image-based multiscale heritage recording with near-infrared data. ISPRS Int. J. Geo-Information 2020, 9, 269. [Google Scholar] [CrossRef]
  135. Themistocleous, K.; Evagorou, E.; Mettas, C.; Prodromou, M.; Hadjimitsis, D.G. The documentation of cultural heritage sites in Cyprus using integrated techniques: The case study of the Church of Agios Athanasios and Kyrillos. Proc. SPIE 2020, 11524, 115240a. [Google Scholar] [CrossRef]
  136. Erenoglu, R.C.; Akcay, O.; Erenoglu, O. An UAS-assisted multi-sensor approach for 3D modeling and reconstruction of cultural heritage site. J. Cult. Herit. 2017, 26, 79–90. [Google Scholar] [CrossRef]
  137. Tosunlar, M.B.; Beycan, A.D.O.; Korkanç, M. Non-destructive test investigations on the deterioration of roman mausoleum in Karadağ central anatolia, Turkey. Mediterr. Archaeol. Archaeom. 2020, 20, 199–219. [Google Scholar] [CrossRef]
  138. Buda, G.; Galizia, M.; Presti, A.L.; Privitera, F.; Randazzo, G.; Santagati, C.; Santagati, M. Interdisciplinary investigations aimed at the preservation of a funerary Roman monument named “Torre Rossa” in Fiumefreddo di Sicilia. In Proceedings of the SAHC 2012: Structural Analysis of Historical Constructions, Wrocław, Poland, 15–17 October 2012; pp. 2314–2322. [Google Scholar]
  139. Diz-Mellado, E.; Mascort-Albea, E.J.; Romero-Hernández, R.; Galán-Marín, C.; Rivera-Gómez, C.; Ruiz-Jaramillo, J.; Jaramillo-Morilla, A. Non-destructive testing and Finite Element Method integrated procedure for heritage diagnosis: The Seville Cathedral case study. J. Build. Eng. 2021, 37, 102134. [Google Scholar] [CrossRef]
  140. Matias, M.; Almeida, F.; Moura, R.; Barraca, N. High resolution NDT in the characterization of the inner structure and materials of heritage buildings walls and columns. Constr. Build. Mater. 2021, 267, 121726. [Google Scholar] [CrossRef]
  141. Martínez-Garrido, M.I.; Fort, R.; Gómez-Heras, M.; Valles-Iriso, J.; Varas-Muriel, M.J. A comprehensive study for moisture control in cultural heritage using non-destructive techniques. J. Appl. Geophys. 2018, 155, 36–52. [Google Scholar] [CrossRef]
  142. Cozzolino, M.; Di Meo, A.; Gentile, V. The contribution of indirect topographic surveys (photogrammetry and laser scanner) and GPR investigations in the study of the vulnerability of the Abbey of Santa Maria a Mare, Tremiti Islands (Italy). Ann. Geophys. 2019, 62, SE343. [Google Scholar] [CrossRef]
  143. Chiabrando, F.; Naretto, M.; Sammartano, G.; Sambuelli, L.; Spanò, A.; Losè, L.T. The 4dilan project (4th dimension in landscape and artifacts analyses). Int. Arch. Photogramm. Remote Sens. Spat. Inf. Sci.-ISPRS Arch. 2017, 42, 227–234. [Google Scholar] [CrossRef]
  144. Angelini, A.; Cozzolino, M.; Gabrielli, R.; Gentile, V.; Mauriello, P. Three-Dimensional Modeling and Non-Invasive Diagnosis of a Huge and Complex Heritage Building: The Patriarchal Basilica of Santa Maria Assunta in Aquileia (Udine, Italy). Remote Sens. 2023, 15, 2386. [Google Scholar] [CrossRef]
  145. Abate, D.; Faka, M.; Toumbas, K.; Bakirtzis, N.; Mitchell, W.; Colls, K.; Sturdy-Colls, C. Multi-Modal Digital Documentation and Visualization of the Unesco Painted Churches in Troodos (Cyprus). Int. Arch. Photogramm. Remote Sens. Spat. Inf. Sci.-ISPRS Arch. 2022, 46, 1–8. [Google Scholar] [CrossRef]
  146. Adamopoulos, E.; Colombero, C.; Comina, C.; Rinaudo, F.; Volinia, M.; Girotto, M.; Ardissono, L. Integrating multiband photogrammetry, scanning, and GPR for built heritage surveys: The façades of Castello del Valentino. ISPRS Ann. Photogramm. Remote Sens. Spat. Inf. Sci. 2021, 8, 1–8. [Google Scholar] [CrossRef]
  147. Barrile, V.; Bernardo, E.; Fotia, A.; Bilotta, G. Integration of Laser Scanner, Ground-Penetrating Radar, 3D Models and Mixed Reality for Artistic, Archaeological and Cultural Heritage Dissemination. Heritage 2022, 5, 1529–1550. [Google Scholar] [CrossRef]
  148. Van Dongen, A.; Eeckhout, P.; Lo Buglio, D. Crossed experimentations of low-altitude surveys for the detection of buried structures. Int. Arch. Photogramm. Remote Sens. Spat. Inf. Sci. 2022, 46, 505–512. [Google Scholar] [CrossRef]
  149. Benavente, D.; Martinez-Martinez, J.; Galiana-Merino, J.J.; Pla, C.; de Jongh, M.; Garcia-Martinez, N. Estimation of uniaxial compressive strength and intrinsic permeability from ultrasounds in sedimentary stones used as heritage building materials. J. Cult. Herit. 2022, 55, 346–355. [Google Scholar] [CrossRef]
  150. Santini, S.; Cogotti, M.; Baggio, C.; Sabbatini, V.; Sebastiani, C. Field testing for structural behavior of a stratified monumental complex over time: Palazzo Colonna-Barberini and Templum Fortunae Praeneste. Case Stud. Constr. Mater. 2023, 18, e02152. [Google Scholar] [CrossRef]
  151. Ortega, J.; Meersman, M.F.L.; Aparicio, S.; Liébana, J.C.; Martín, R.; Anaya, J.J.; González, M. An automated sonic tomography system for the inspection of historical masonry walls. Open Res. Eur. 2023, 3, 60. [Google Scholar] [CrossRef]
  152. Casula, G.; Fais, S.; Cuccuru, F.; Bianchi, M.G.; Ligas, P.; Sitzia, A. Decay detection in an ancient column with combined close-range photogrammetry (Crp) and ultrasonic tomography. Minerals 2021, 11, 1114. [Google Scholar] [CrossRef]
  153. Casula, G.; Cuccuru, F.; Bianchi, M.G.; Fais, S.; Ligas, P. High resolution 3-D modelling of cylinder shape bodies applied to ancient columns of a church. Adv. Geosci. 2020, 54, 119–127. [Google Scholar] [CrossRef]
  154. Bianchi, M.G.; Casula, G.; Cuccuru, F.; Fais, S.; Ligas, P.; Ferrara, C. Three-dimensional imaging from laser scanner, photogrammetric and acoustic non-destructive techniques in the characterization of stone building materials. Adv. Geosci. 2018, 45, 57–62. [Google Scholar] [CrossRef]
  155. Senos, M.J.; Almeida, F.; Moura, R.; Barraca, N. High-Resolution geophysics in the investigation of the inner structure of walls and columns of batalha abbey. In Proceedings of the 23rd European Meeting of Environmental and Engineering Geophysics, Malmo, Sweden, 3–7 September 2017. [Google Scholar]
  156. Akoglu, K.G.; Kotoula, E.; Simon, S. Combined use of ultrasonic pulse velocity (UPV) testing and digital technologies: A model for long-term condition monitoring memorials in historic Grove Street Cemetery, New Haven. J. Cult. Herit. 2020, 41, 84–95. [Google Scholar] [CrossRef]
  157. Muradov, M.; Kot, P.; Markiewicz, J.; Łapiński, S.; Tobiasz, A.; Onisk, K.; Shaw, A.; Hashim, K.; Zawieska, D.; Mohi-Ud-Din, G. Non-destructive system for in-wall moisture assessment of cultural heritage buildings. Meas. J. Int. Meas. Confed. 2022, 203. [Google Scholar] [CrossRef]
  158. Masciotta, M.G.; Roque, J.C.A.; Ramos, L.F.; Lourenço, P.B. A multidisciplinary approach to assess the health state of heritage structures: The case study of the Church of Monastery of Jerónimos in Lisbon. Constr. Build. Mater. 2016, 116, 169–187. [Google Scholar] [CrossRef]
  159. Delegou, E.T.; Mourgi, G.; Tsilimantou, E.; Ioannidis, C.; Moropoulou, A. A multidisciplinary approach for historic buildings diagnosis: The case study of the kaisariani monastery. Heritage 2019, 2, 1211–1232. [Google Scholar] [CrossRef]
  160. Trizio, I.; Savini, F.; Ruggieri, A.; Fabbrocino, G. Digital Environment for Remote Visual Inspection and Condition Assessment of Architectural Heritage BT—Civil Structural Health Monitoring; Rainieri, C., Fabbrocino, G., Caterino, N., Ceroni, F., Notarangelo, M.A., Eds.; Springer International Publishing: Cham, Switzerland, 2021; pp. 869–888. [Google Scholar]
  161. De Fino, M.; Bruno, S.; Fatiguso, F. Dissemination, assessment and management of historic buildings by thematic virtual tours and 3D models. Virtual Archaeol. Rev. 2022, 13, 88–102. [Google Scholar] [CrossRef]
  162. Bruno, S.; Scioti, A.; Pierucci, A.; Rubino, R.; Di Noia, T.; Fatiguso, F. Verbum—Virtual enhanced reality for building modelling (virtual technical tour in digital twins for building conservation). J. Inf. Technol. Constr. 2022, 27, 20–47. [Google Scholar] [CrossRef]
  163. Costantino, D.; Angelini, M.G.; Alfio, V.S.; Claveri, M.; Settembrini, F. Implementation of a system WebGIS open-source for the protection and sustainable management of rural heritage. Appl. Geomat. 2020, 12, 41–54. [Google Scholar] [CrossRef]
  164. Sedano-Espejo, E.; MacKinlay, P.; Sanz-Arauz, D.; Sánchez-Aparicio, M.; Sánchez-Aparicio, L.J. Use of geographical information system approaches for the diagnosis of san isidoro ruins (Madrid, Spain). Int. Arch. Photogramm. Remote Sens. Spat. Inf. Sci. 2021, XLVI-M-1–2021, 677–684. [Google Scholar] [CrossRef]
  165. Tsilimantou, E.; Delegou, E.T.; Nikitakos, I.A.; Ioannidis, C.; Moropoulou, A. GIS and BIM as Integrated Digital Environments for Modeling and Monitoring of Historic Buildings. Appl. Sci. 2020, 10, 1078. [Google Scholar] [CrossRef]
  166. Coughenour, C.M.; Vincent, M.L.; de Kramer, M.; Senecal, S.; Fritsch, D.; Flores Gutirrez, M.; Lopez-Menchero Bendicho, V.M.; Ioannides, M. Embedding Knowledge in 3D Data Frameworks in Cultural Heritage. ISPRS Ann. Photogramm. Remote Sens. Spat. Inf. Sci. 2015, 2, 47–52. [Google Scholar] [CrossRef]
  167. Carraro, F.; Marinello, A.; Morabito, D.; Bonetto, J. New Perspectives on the Sanctuary of Aesculapius in Nora (Sardinia): From Photogrammetry to Visualizing and Querying Tools. Open Archaeol. 2019, 5, 263–273. [Google Scholar] [CrossRef]
  168. Pedelì, C. An interdisciplinary conservation module for condition survey on cultural heritages with a 3D information system. Int. Arch. Photogramm. Remote Sens. Spat. Inf. Sci. 2013, 40, 483–487. [Google Scholar] [CrossRef]
  169. Mandelli, A.; Achille, C.; Tommasi, C.; Fassi, F. Integration of 3D models and diagnostic analyses through a conservation-oriented information system. Int. Arch. Photogramm. Remote Sens. Spat. Inf. Sci. 2017, 42, 497–504. [Google Scholar] [CrossRef]
  170. Boutsi, A.-M.; Ioannidis, C.; Soile, S. An Integrated Approach to 3D Web Visualization of Cultural Heritage Heterogeneous Datasets. Remote Sens. 2019, 11, 2508. [Google Scholar] [CrossRef]
  171. Ioannidis, C.; Verykokou, S.; Soile, S.; Boutsi, A.-M. A multi-purpose cultural heritage data platform for 4D visualization and interactive information services. Int. Arch. Photogramm. Remote Sens. Spat. Inf. Sci. 2020, 43, 583–590. [Google Scholar] [CrossRef]
  172. Boutsi, A.-M.; Tallis, I.; Pastos, I.; Verykokou, S.; Ioannidis, C. 5DMETEORA framework: Management and web publishing of cultural heritage data. ISPRS Ann. Photogramm. Remote Sens. Spat. Inf. Sci. 2023, X-M-1–2023, 33–40. [Google Scholar] [CrossRef]
  173. Abergel, V.; Manuel, A.; Pamart, A.; Cao, I.; De Luca, L. Aïoli: A reality-based 3D annotation cloud platform for the collaborative documentation of cultural heritage artefacts. Digit. Appl. Archaeol. Cult. Herit. 2023, 30, e00285. [Google Scholar] [CrossRef]
  174. Roussel, R.; De Luca, L. An approach to build a complete digital report of the notre dame cathedral after the fire, using the aioli platform. Int. Arch. Photogramm. Remote Sens. Spat. Inf. Sci. 2023, 48, 1359–1365. [Google Scholar] [CrossRef]
  175. Croce, V.; Manuel, A.; Caroti, G.; Piemonte, A.; De Luca, L.; Véron, P. Semi-automatic classification of digital heritage on the Aïoli open source 2D/3D annotation platform via machine learning and deep learning. J. Cult. Herit. 2023, 62, 187–197. [Google Scholar] [CrossRef]
Figure 1. Flowchart of the review phases.
Heritage 06 00367 g001
Figure 2. Number of papers per year.
Heritage 06 00367 g002
Figure 3. Number of papers per source with more than one occurrence.
Heritage 06 00367 g003
Figure 4. Number of papers per country.
Heritage 06 00367 g004
Figure 5. Number of involved institutions per paper.
Heritage 06 00367 g005
Figure 6. Type of involved institutions.
Heritage 06 00367 g006
Figure 7. Co-authorship in relation to authors, with a minimum number of documents of an author of 1, a minimum number of citations of 5 and a selection of 233 items over 403. Overlay of authors with number of citations, in relation to the average publication year.
Heritage 06 00367 g007
Figure 8. Co-citations in relation to authors’ citations, with a minimum number of citations per author of 10 and a selection of 10 items.
Heritage 06 00367 g008
Figure 9. VOSviewer map showing co-occurrence of keywords (both author and indexed keywords), with a minimum number of co-occurrences of 3 and a selection of 120 words.
Heritage 06 00367 g009
Table 1. Inclusion and exclusion criteria.
Inclusion CriteriaExclusion Criteria
Purpose of the paperCondition analysis
Data collection and correlation
Assessment/monitoring of
decay/pathologies
Simulation modelling
Geometric survey
Validation of novel hardware/software tools
Parametric modelling
Touristic dissemination
Type of physical assetHistoric buildings
Archaeological structures and sites
Frescoes and Sculptures
Bridges
Modern buildings
Urban settlement
Infrastructures
Paintings
Role of photogrammetryKey role
for condition assessment
Secondary role
For condition assessment
Table 2. VOSviewer clusters and thematic keywords.
Cluster (Colour)Thematic KeywordsGeneral Keywords
1 (Red)damage detection; earthquakes;
risk assessment; walls; finite element method; seismology; structural analysis; structural health monitoring; classification; damage assessments; diagnostic analysis; image segmentation; machine learning; religious buildings; seismic assessment; artificial intelligence; classification (of information); deep learning; learning systems; modal analysis; towers
surveys; unmanned aerial vehicles (uav); antennas; close range photogrammetry; architectural heritage; uav photogrammetry; architecture; historical buildings
2 (Green)non-destructive examination; geological surveys;
ground penetrating radar systems; ground penetrating radar; monitoring; geophysical prospecting; geophysics; tomography; 3D model; construction material; data fusion; decay; decision making; gpr; hbim; non-destructive testing; non-destructive methods; non-destructive testing; state of conservation; thermography (imaging); weathering
photogrammetry; italy; heritage buildings; heritage conservation; three-dimensional modelling; built heritage; 3d model
3 (Blue)deterioration; image reconstruction; restoration; architectural design; information management; data visualization; digital documentation; virtual reality; visualization; 3d visualization; data acquisition; data handling; digital twin; maintenance; maps; open-source software; open systems; scientific community; semanticscultural heritage; cultural heritages; historic preservation; three-dimensional computer graphics; remote sensing; point clouds
4 (Yellow)masonry materials; data integrationstructure from motion; 3d modelling; surveying instruments; 3d reconstruction; surveying; terrestrial laser scanners; uav; buildings; close-range photogrammetry; multi-view stereo; 3d point cloud; digital cultural heritage; heritage masonry; software; stereo image processing;
terrestrial laser scanner
5 (Purple)mapping; surface analysis; documentation
archaeology; decay mapping; optical radar
condition assessment; condition assessments
laser applications; laser scanning; terrestrial laser scanning; conservation; digital photogrammetry; scanning; 3d modelling; archaeology; history
Table 3. Research clusters.
TopicSub-TopicNumber of Papers 1Keywords ClusterDiagnosis
Phases
Decay
mapping
Manual and visual mapping; 165Direct observation
Semi-automatized and automatized mapping21
Structural
assessment
Monitoring and control; 201Monitoring; Structural Analysis
Modelling and simulation17
Non-destructive investigationMulti-spectral imaging;102Material and Structural Tests
Multi-sensory data collection19
Multi-source
documentation
Informative records within digital host environments;83Historical and archaeological research, material and structural tests, reporting
Digital host environments with informative records9
1 The same paper might be counted more than once if referred to more topics.
Disclaimer/Publisher’s Note: The statements, opinions and data contained in all publications are solely those of the individual author(s) and contributor(s) and not of MDPI and/or the editor(s). MDPI and/or the editor(s) disclaim responsibility for any injury to people or property resulting from any ideas, methods, instructions or products referred to in the content.

