Article

Dye Identification in Mounting Textiles of Traditional Korean Paintings from the Late Joseon Dynasty

1
Department of Scientific Research, The British Museum, Great Russell Street, London WC1B 3DG, UK
2
Department of Collection Care, Pictorial Art Conservation, The British Museum, Great Russell Street, London WC1B 3DG, UK
3
Department of Asia, The British Museum, Great Russell Street, London WC1B 3DG, UK
*
Author to whom correspondence should be addressed.
Heritage 2023, 6(1), 44-66; https://doi.org/10.3390/heritage6010003
Submission received: 8 November 2022 / Revised: 6 December 2022 / Accepted: 18 December 2022 / Published: 21 December 2022
(This article belongs to the Special Issue Dyes in History and Archaeology 41)

Abstract

:
In the framework of the ‘Amorepacific Project for the conservation of Korean pictorial art’ (2018–2023) at the British Museum, three traditional Korean paintings have been investigated with the aim of supporting their conservation and obtaining information about the dyes used in the mounting textiles and other mounting elements. The paintings include a rare example of late 18th-century traditional Korean portraiture (accession number 1996,0329,0.1); a late 19th-century two-panel screen silk painting of Pyeongsaeng-do-Scenes of life (accession number 2016,3028.1); and a late 19th-century twelve-panel screen silk painting representing the Five Confucian virtues (accession number 1957,1214,0.1). The mounting textiles were investigated non-invasively by using digital microscopy and fibre optic reflectance spectroscopy (FORS), and the results guided a minimally invasive sampling campaign. Fourteen samples were analysed by using high-pressure liquid chromatography coupled with diode array and tandem mass spectrometry detectors (HPLC-DAD-MS/MS), leading to the identification of the natural dyes indigo, sappanwood (Biancaea sappan, formerly Caesalpinia sappan), amur cork tree (Phellodendron amurense) and safflower (Carthamus tinctorius) in the mounting elements of the 18th-century portrait. These results confirmed some of the non-invasive observations and were in agreement with the production date of the painting. Both natural and synthetic dyes were identified in the mounting textiles of the panel screens. Among the synthetic dyes, fuchsin (C.I. 42510), methyl violet 3B (C.I. 42536), methyl blue (C.I. 42780) and benzopurpurin 4B (C.I. 23500) were identified. These are early synthetic dyes first synthesised between the 1860s and the 1880s, suggesting that the silk textiles are likely to have been dyed in the last part of the 19th century.

1. Introduction

Dye analysis is a powerful tool in textile research, as the identification of dyes not only informs on the manufacturing of a textile but can also point towards geographical provenance as well as refine the dating of textiles. This is particularly relevant for synthetic dyes, which were invented after 1856, as the date of their first synthesis is usually recorded [1]. Additionally, available information about the light sensitivity of dyes can be used to reconstruct the original appearance of textiles that have undertaken substantial fading or discolouration and to choose appropriate displaying strategies [2,3,4].
East Asian paintings are traditionally made on silk or paper and are mounted in different formats, such as hanging scrolls and folding screens [5,6,7]. Mounting encompasses a series of operations involving the application of several elements and materials to the back and sides of a painting, with the final outcome of framing it, strengthening it and protecting it, thus allowing for easier transportation, storage and display. The mounting elements also serve an aesthetic embellishing function and can even constitute additional spaces to carry symbolic meanings [8]. Among the mounting elements, borders are connected to the perimeter of the painting and are constituted of textile or paper, playing an important aesthetic and practical role, for example, in the case of scroll paintings that are rolled for ease of storage and transportation. Despite their important functions, textile borders and other mounting elements are often not considered an integral part of the artwork due to the fact that, in traditional practice, they are subject to replacement following their natural degradation [9]. As a result, they are often disregarded as an important research topic in art history. However, their study is fundamental for conservation, as the relative light sensitivities of the different dyes used to colour the textiles are a major factor in determining suitability for, and length of, any display. Furthermore, valuable information can be obtained about the traditional use of certain materials, the overall artistic intention, and sometimes the spiritual/religious significance behind the paintings [9]. Ultimately, researching the textile borders can help understand whether the textiles are original and contemporaneous with the painting.
Building on previous research on traditional Asian dyes [4,9,10,11], an investigation took place at the British Museum to study the mounting elements of three traditional Korean paintings. This research was undertaken in the framework of the ‘Amorepacific Project for the conservation of Korean pictorial art’ (2018–2023), sponsored by the Amorepacific Corporation to study and conserve historic and contemporary Korean pictorial art at the British Museum. The focus was on dye analysis with the main aim of informing the conservation process and obtain as much information as possible on the original dyes present on the mounting elements.
Recent developments in dye analysis have shown the potential of non-invasive methods to identify dyes, with reflectance and luminescence spectroscopic approaches being particularly promising [4,9,12,13,14,15,16,17,18,19,20]. Consequently, fibre optic reflectance spectroscopy (FORS) was used in this investigation to gather as much information as possible non-invasively. However, limitations in terms of identifying yellow dyes as well as mixtures of dyes are known drawbacks of this technique [4,21]. The conservation process of these paintings provided us with the opportunity to take small samples and apply high-pressure liquid chromatography coupled with diode array and tandem mass spectrometry detectors (HPLC-DAD-MS/MS). This is considered the state-of-the-art technique for identifying natural and synthetic dyes at a molecular level [22,23,24,25,26,27,28,29]. The technique requires minimal sampling (1–2 mm of a single thread) and provides insight into the molecular composition of dyes and dye mixtures, which is fundamental information for achieving straightforward identifications [11,30,31,32].

2. Materials and Methods

Accession number 1996,0329,0.1(P1)-Portrait scroll of Chae Je-gong
A rare example of late 18th-century traditional Korean portraiture, representing Chae Je-gong (1720–1799), Prime Minister of Korea under King Jeongjo (reign 1776–1800) of the Joseon dynasty (1392–1910), and made in 1789 by court artist Yi Myeong-gi (1756–before 1813) (Figure 1). Seen in a three-quarter view, the crossed-legged sitter sits on a cushion made of tiger skin, wearing a pink robe and a rhinoceros horn belt and a traditional Korean hat [33]. Chae Je-gong is known for having most of his portraits survived to this day. Nine portraits of him are known today. This British Museum portrait shows great similarity to the portrait in the Suwon Hwaseong Museum in Korea [34], which was painted in 1791.
The textile mounting is in silk. The recto shows a very light aqua colour, and the verso is a darker shade of blue. Several decorative elements are included, such as red knotted tassels (yuso), a roller knob, a hanging rod and a metal washer [35]. Following a non-invasive investigation whose results are presented in [9], three samples were taken from the light blue recto textile, the red/orange tassel and the red edge of the hanging rod. Figure S1 (Supplementary Material) shows the mounting elements under investigation.
Accession number 2016,3028.1(P2)-Two-panel screen painting of Pyeongsaeng-do (‘Scenes of life’).
A late 19th-century two-panel screen silk painting of Pyeongsaeng-do-Scenes of life (Figure 2). This genre of painting depicts an idealised biography of a scholar or official, usually starting from a scene of the first birthday and concluding with a scene of the 60th wedding anniversary and passing the civil examination. The right panel represents the 60th wedding anniversary, and the left panel commemorates the 60th anniversary of passing the civil service examination [36]. These two paintings constitute the last two panels of what would have originally been a ten-panel screen, as in the process of dismantling it, the numbers 9 and 10 were written in Chinese characters on each panel.
The main mounting elements are composed of two horizontal blue silk textiles joined alongside the top and bottom of the painting. Brownish decorative bands that are bordered on either side by narrow pink and off-white strips surround the four edges of each panel. A purple damask silk textile covered the outside of the panels. These morphological characteristics constitute the typical mounting technique of Joseon screens. Four samples were taken from the blue, purple, pink and brown textile elements, which are shown in more detail in Figure S2 (Supplementary Material).
Accession number 1957,1214,0.1(P3)-Twelve-panel screen painting of Five Confucian virtues.
Seen below is a late 19th-century twelve-panel screen silk painting representing scenes of stories visualising the five Confucian virtues, which are about relationships between the king and his servants, father and sons, husbands and wives, the elders and the young and between friends (Figure 3) [37]. This painting is a rare example in terms of its size and highly decorative presentation.
The mounting elements are composed of the morphological features of the typical Joseon screen observed in P2. As well as this, the outer surface of each panel was covered with dark blue cotton fabric. In addition, as a more decorative element, pink and off-white narrow strips were inserted between the painting and the top and bottom blue silk mount.
Four samples were taken from the blue cotton, blue silk, pink and brown textile elements, shown in more detail in Figure S3 (Supplementary Material).

Reference Materials

Reference dye samples were analysed to confirm the identification of natural and synthetic dyes. For the natural dyes, the details of the reference samples are reported in [4,11]. For the synthetic dyes, methyl violet (C.I. 42535), methyl blue (C.I. 42780) and fuchsin (C.I. 42510) were available as both powders and dyed wool samples from the CHARISMA project (2009–2014) funded by the European Union FP 7 Research Infrastructures programme (CHARISMA Grant Agreement no. 228330). Additional samples of historic dyed fibres were available from copies of two historic books: “A Manual of Dyeing: For the Use of Practical Dyers, Manufacturers, Students, and All Interested in the Art of Dyeing (Specimen of dyed fabrics)” by Knecht, E., C. Rawson, and R. Loewenthal published in London in 1893 [38] and “The Coal Tar Colours of Farbwerke Vorm. Meister Lucius & Brüning, Hoechst on the Maine, Germany–A General Part” by Farbwerke Vorm. Meister Lucius & Brüning in 1896. In particular, benzopurpurin 4B (C.I. 23500) was available from the former one, whereas methyl violet 3B (C.I. 42536) was present in both books. The HPLC analysis of all samples present in these books will be the topic of upcoming publications.
Digital microscopy
High-magnification images were obtained using a Hirox Video 3D Digital Microscope HRX-01 mounted on a bi-dimensional frame and equipped with a TH-5 Motion Controller and a Hirox HR-2016E lens (magnification 20× g–160× g).
Optical microscopy
High-magnification images were taken for all samples under visible and ultraviolet (UV) light using a Leica DM 4000M UV microscope equipped with a halogen lamp.
Fibre optic reflectance spectroscopy
Fibre optic reflectance spectra were recorded for all the coloured areas of interest with an Avantes (Apeldoorn, The Netherlands) AvaSpec-ULS2048XL-USB2 spectrophotometer equipped with an AvaLight-HAL-S-IND tungsten halogen light source. The detector and light source were connected with a fibre optic bundle to an FCR-7UV200-2-1.5 × 100 probe. In this configuration, light was sent and retrieved by the bundle set at approximately 45° from the surface normal, thus excluding specular reflectance. The spectral range of the detector was 200–1160 nm; nevertheless, due to poor blank correction on both the extremes of the range, only the range between 400 and 900 nm was considered, as per the features of the monochromator (slit width 50 μm, grating of the UA type with 300 lines/mm) and of the detector (2048 pixels), the best spectra resolution was 2.4 nm calculated as the full width at half maximum (FWHM). The spectra were referenced against the WS-2 reference tile provided by Avantes. The diameter of the investigated area on the sample was approximately 1 mm, obtained by setting the distance between the probe and the sample at 1 mm. The instrumental parameters were as follows: 50 ms integration time and 20 scans for a total acquisition time of 1 s for each spectrum. The whole system was managed by the software AvaSoft 8 for Windows™.
High-pressure liquid chromatography coupled to diode array detector and electrospray ionisation followed by quadrupole and time of flight detection(HPLC-DAD-ESI-Q-ToF)
The dye extraction was performed using a method published in [10], which briefly consists of a double mild extraction procedure, using DMSO first, and secondly a mixture of methanol/acetone/water/0.5 M oxalic acid 30:30:40:1 (v/v/v/v). The size of the samples ranged from 2 to 5 mm of single threads of variable thickness, depending on the difficulty of accessing the already damaged areas.
Analyses were carried out using a 1260 Infinity HPLC (Agilent Technologies), coupled to an 1100 DAD detector (Hewlett-Packard) and to a Quadrupole-Time of Flight tandem mass spectrometer 6530 Infinity Q-ToF detector (Agilent Technologies) by a Jet Stream ESI interface (Agilent Technologies). Separation was achieved using a Zorbax Extend-C18 column (2.1 mm × 50 mm, 1.8 μm particle size) with a 0.4 mL/min flow rate and 40°C column temperature, and a gradient of water with 0.1% formic acid (eluent A) and acetonitrile with 0.1% formic acid (eluent B). The elution gradient was programmed as follows: initial conditions 95% A, followed by a linear gradient to 100% B in 10 min and held for 2 min. The re-equilibration time for each analysis was 10 min. A 10 μL injection volume was adopted for the MS experiments and 20 μL for the MS/MS experiments.
The DAD detector (cell volume 50 µL) scanned in the range 200–700 nm with 2 nm resolution. The ESI operating conditions were: drying gas (N2, purity > 98%) temperature 350 °C and 10 L/min flow; capillary voltage 4.0 kV; nebulizer gas pressure 40 psig; sheath gas (N2, purity > 98%) temperature 375 °C and flow 11 L/min. High-resolution MS and MS/MS spectra were acquired in both negative and positive modes in the range of 100–1700 m/z. The fragmentor was kept at 100 V, nozzle voltage 1000 V, skimmer 65 V and octapole RF 750 V. For the MS/MS experiments, different voltages (from 10 to 40 V) in the collision cell were tested for Collision Induced Dissociation (CID), in order to maximize the information obtained from the fragmentation of the single molecules. The collision gas was N2 (purity 99.999%). The data were collected by targeted MS/MS acquisition with an MS scan rate of 1.0 spectra/sec and an MS/MS scan rate of 1.0 spectra/sec. Auto-calibration was performed daily using Agilent tuning mix HP0321 (Agilent Technologies) prepared in 90% water 10% acetonitrile.
MassHunter Workstation Software was used to carry out diode array detector and mass spectrometer control, data acquisition and data analysis. In particular, extract ion chromatograms were obtained using the software EIC function and selecting the mass range corresponding to the calculated mass ± 0.01 m/z. Chemical formula and molecular structures were assigned based on mass differences below 2 ppm.

3. Results

The results of this investigation are discussed for each painting and summarised in Table 1.

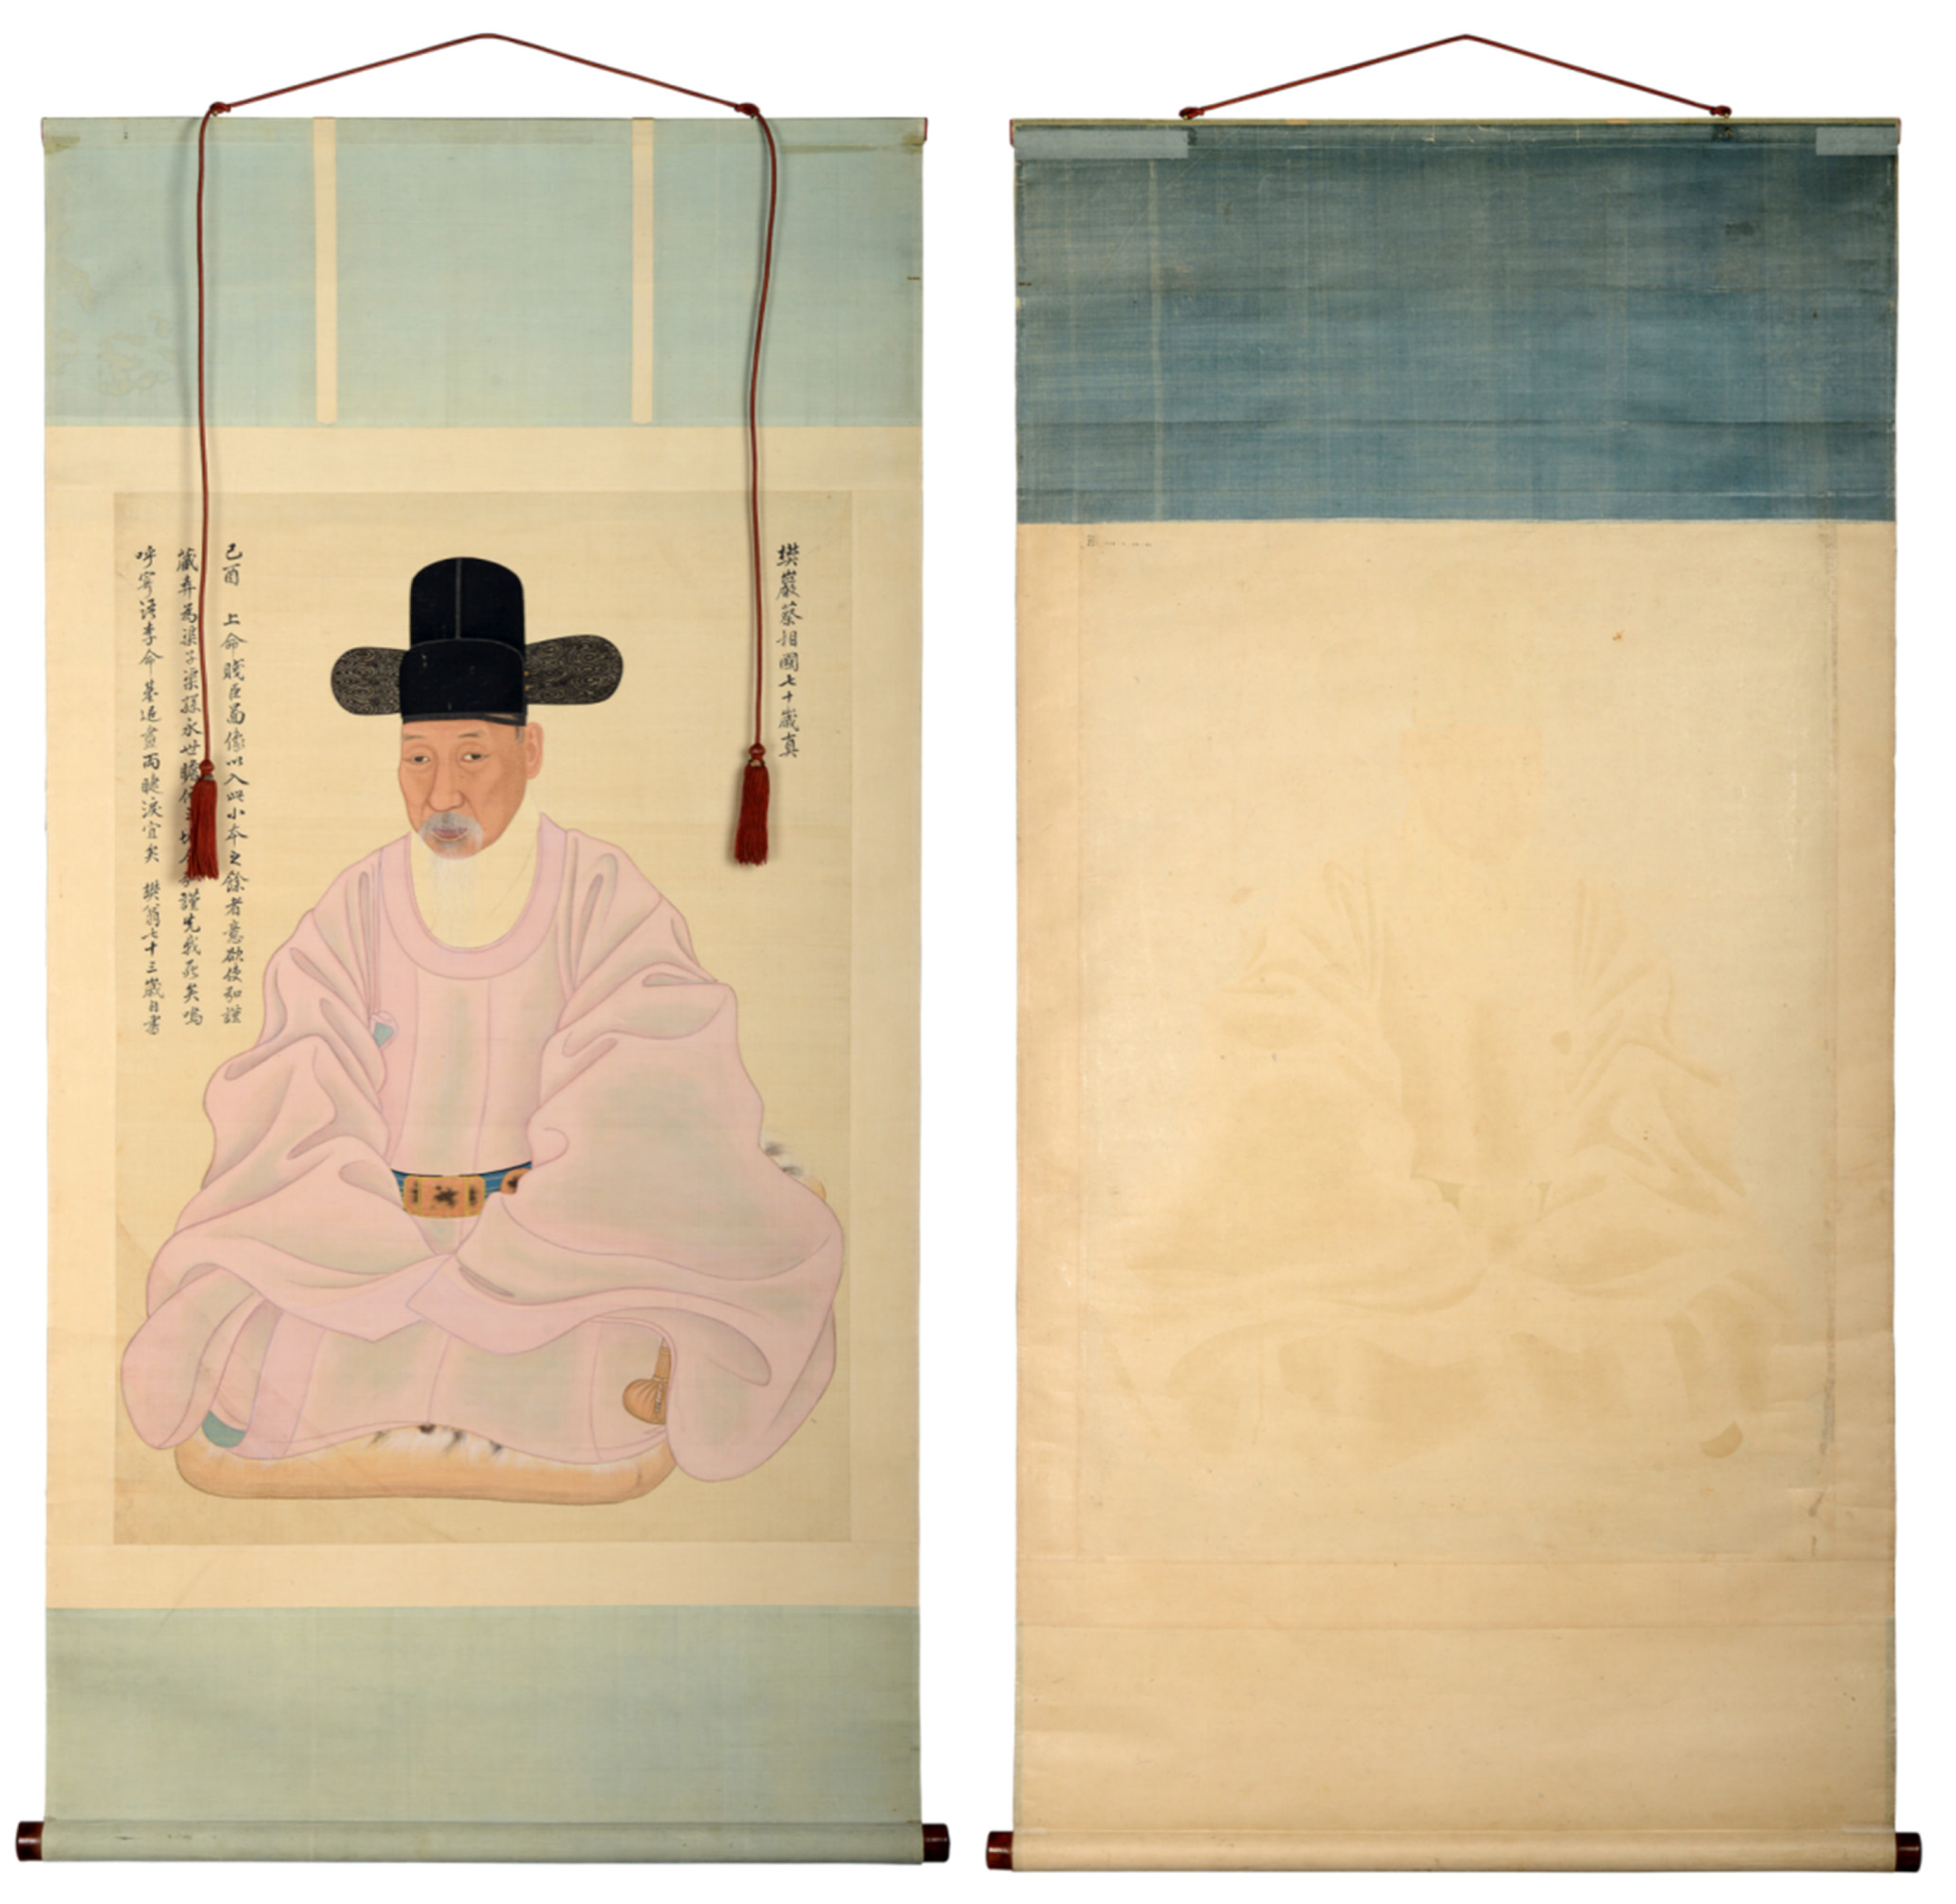
3.1. P1-Portrait Scroll of Chae Je-Gong

The three samples taken from the textile border and mounting elements of P1 corresponded to the light blue border, the dark red/orange tassel and the bright red textile at the edge of the hanging rod (Figure S1—Supplementary Material). The observations under the microscope using UV light revealed that the red sample from the hanging rod exhibited a bright orange luminescence. A weaker luminescence was also exhibited by the orange sample from the tassel (Figure 4). As discussed in [4], several traditional Asian dyes have the property of emitting luminesce under UV light, including safflower, turmeric and amur cork tree. Interesting observations about safflower-dyed fibres investigated by UV light microscopy are also reported in [39,40].
The HPLC analysis of the light blue sample revealed the presence of indigo, as indigotin was detected despite the extremely small amount of sample taken and the very light colour exhibited (Figure 5a). Traces of indirubin and isatin were also present, confirming the natural origin of the indigo [41], although the exact botanical source could not be ascertained. The non-invasive results obtained on the light and dark blue colours of the textile borders were very similar and already suggested the presence of indigo [9]. Hence, the dark blue colour on the back of the textile border is confirmed to be indigo as well.
The sample from the hanging rod contained carthamin (Figure 5b), which enabled the straightforward identification of safflower red. Carthamin is known to degrade easily [42,43,44]. However, the degradation products often detected in historic safflower samples [27,42] were present in very small relative amounts, and no trace of safflower yellow components was detected, which suggests the very good preservation of the dye and justifies the bright red colour observed on this textile. Additionally, in this case, the results confirmed the observation already obtained non-invasively [9] and are in agreement with the UV-induced luminescence observed.
The sample from the tassel contained sappanwood, identified by the presence of urolithin C (Figure 5c), a sappanwood marker component often used for diagnostic purposes [45,46]. The presence of urolithin C and other sappanwood degradation products highlights that the sappanwood is not in a good state of preservation and has partially discoloured. In addition, berberine, palmatine, jatrorrhizine, hydroxyberberine and other minor components were detected (Figure 5d), highlighting the presence of the yellow dye extracted from the amur cork tree [10,11,19]. This dye has strong UV-induced luminescence properties [4], and its identification adds to the observations obtained by FORS. Although the presence of a yellow dye was suspected together with a tentative identification of sappanwood, FORS could not give conclusive information on this dye mixture [9].
The identification of these traditional natural dyes is in agreement with the date of the painting (end of the 18th century). The combination of sappanwood and amur cork tree in the tassel is interesting, as Chinese dyeing recipes from the Ming and Qing dynasties report the use of sappanwood with several other yellow dyes, such as smoketree, pagoda bud and turmeric rather than amur cork tree to obtain orange shades [47]. Similarly, this particular combination is not reported in Korean dyeing recipes from the Joseon period [48].

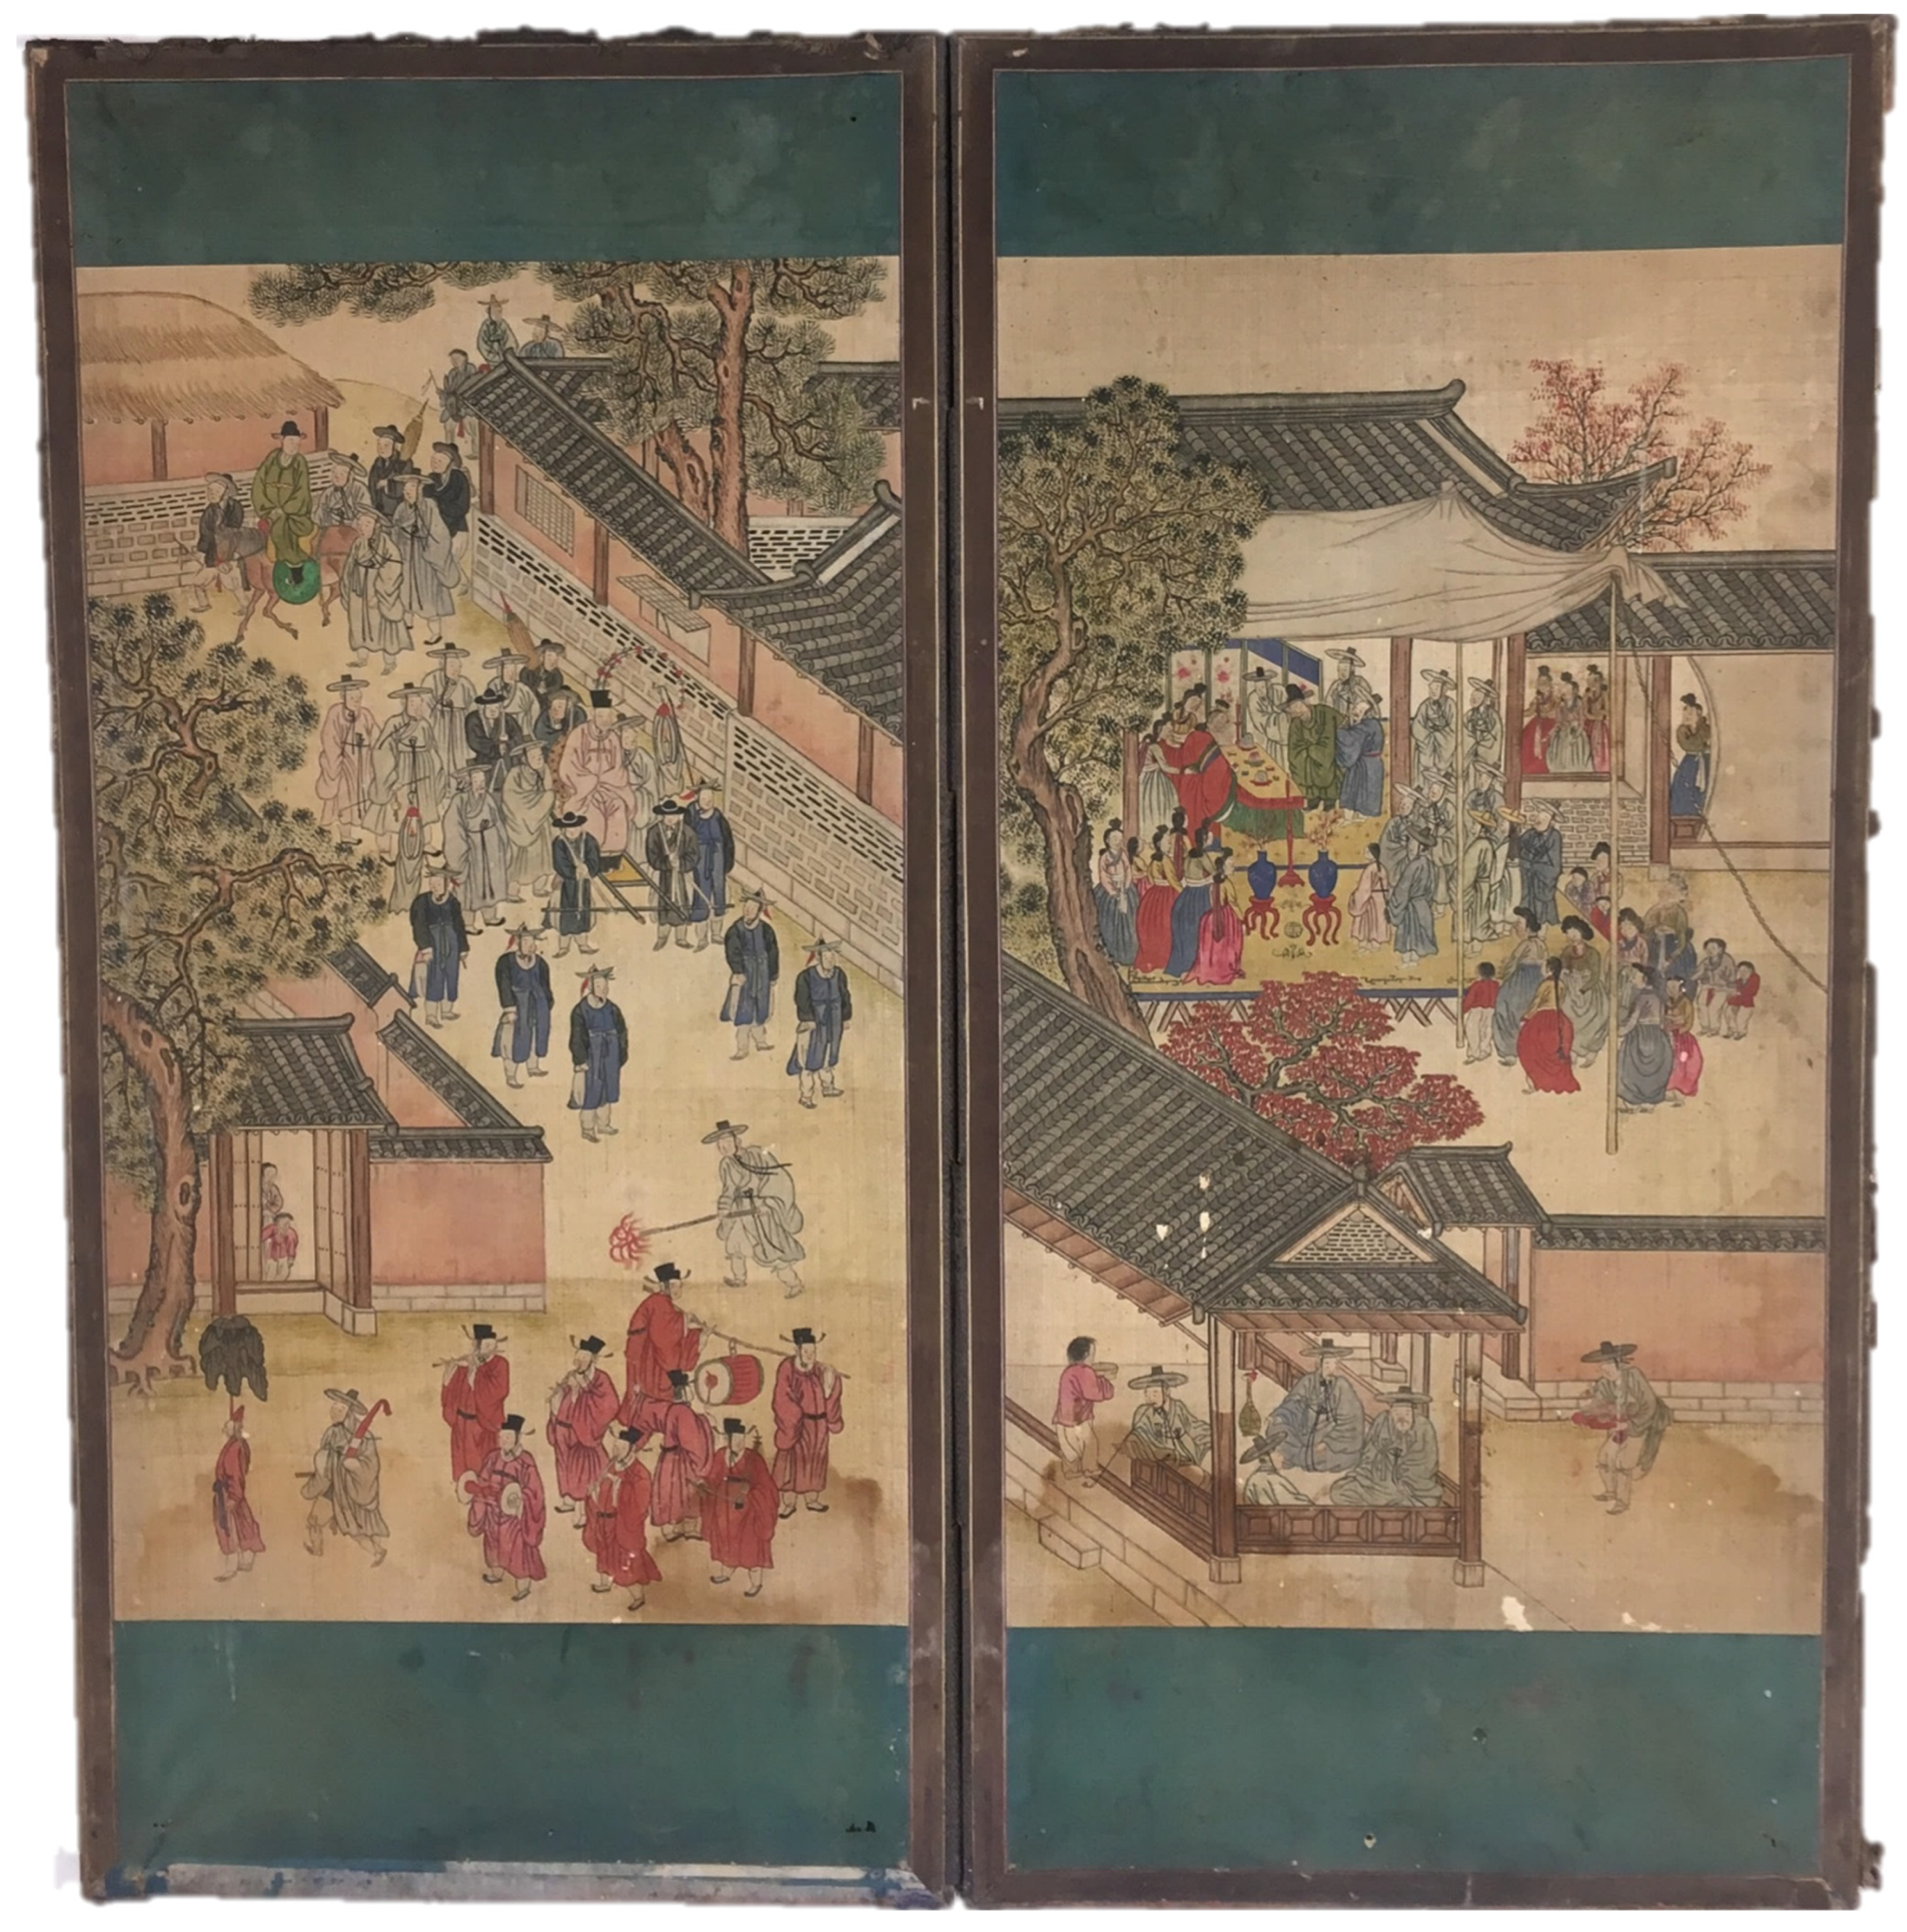
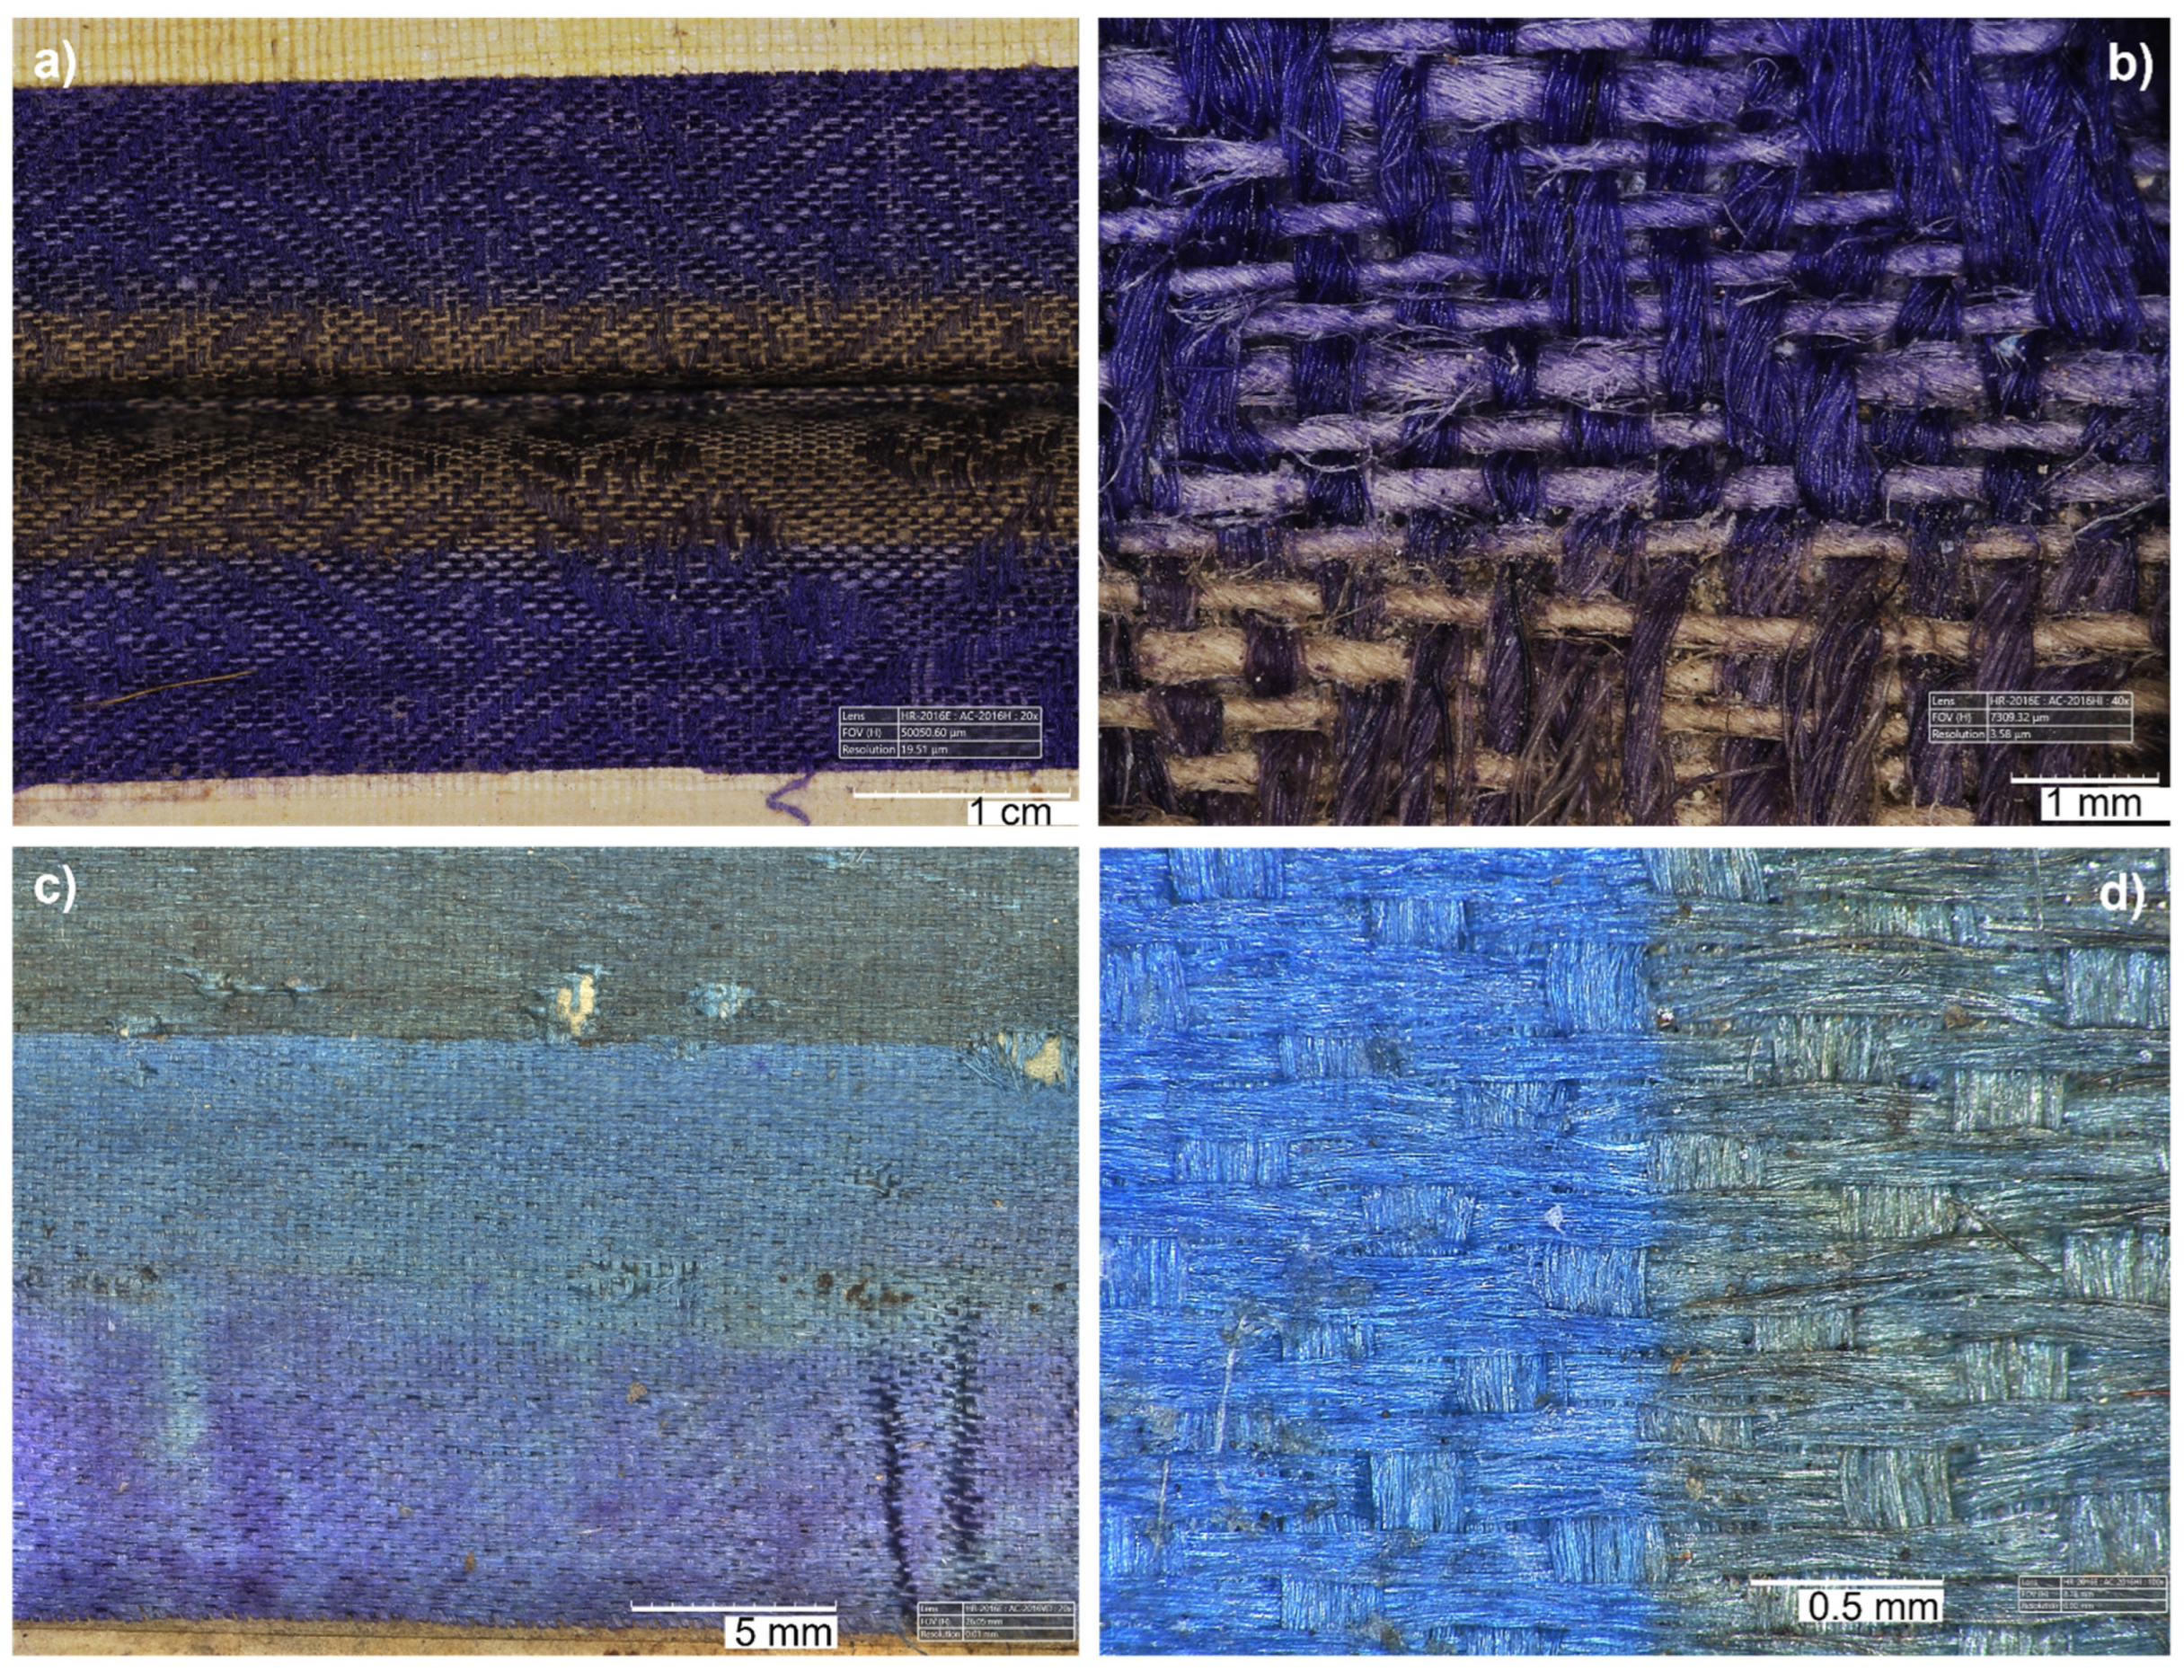
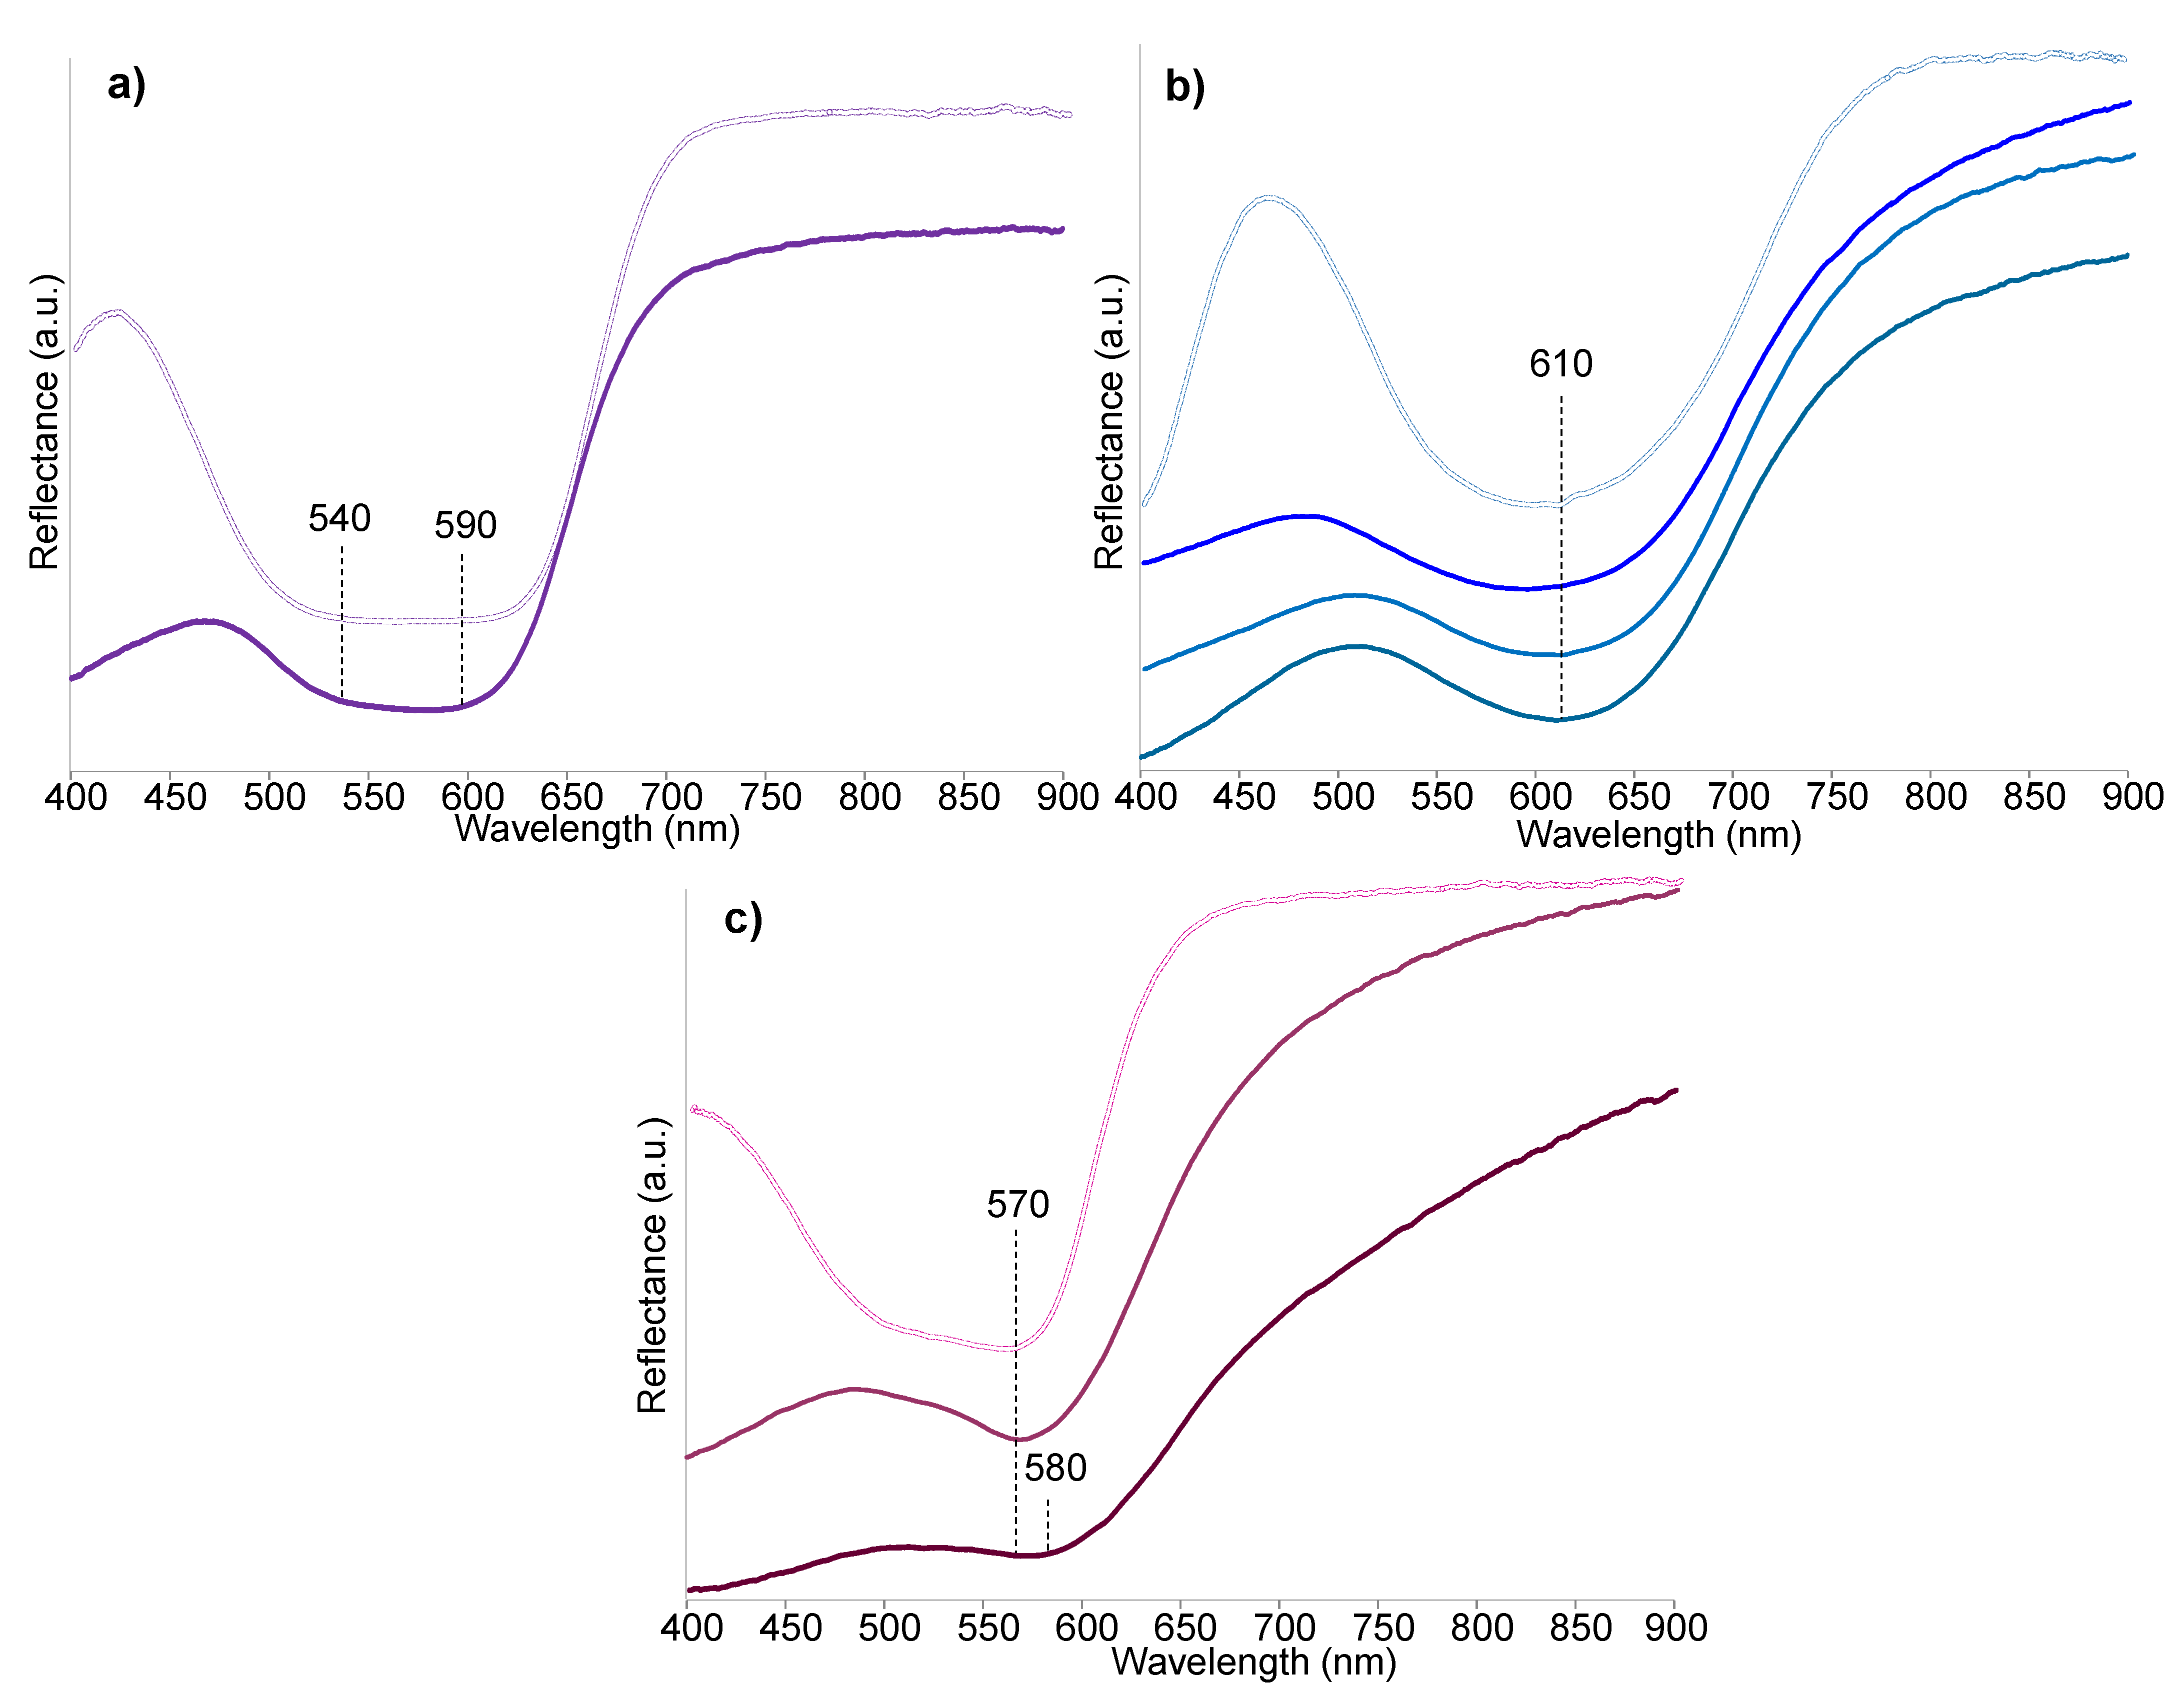
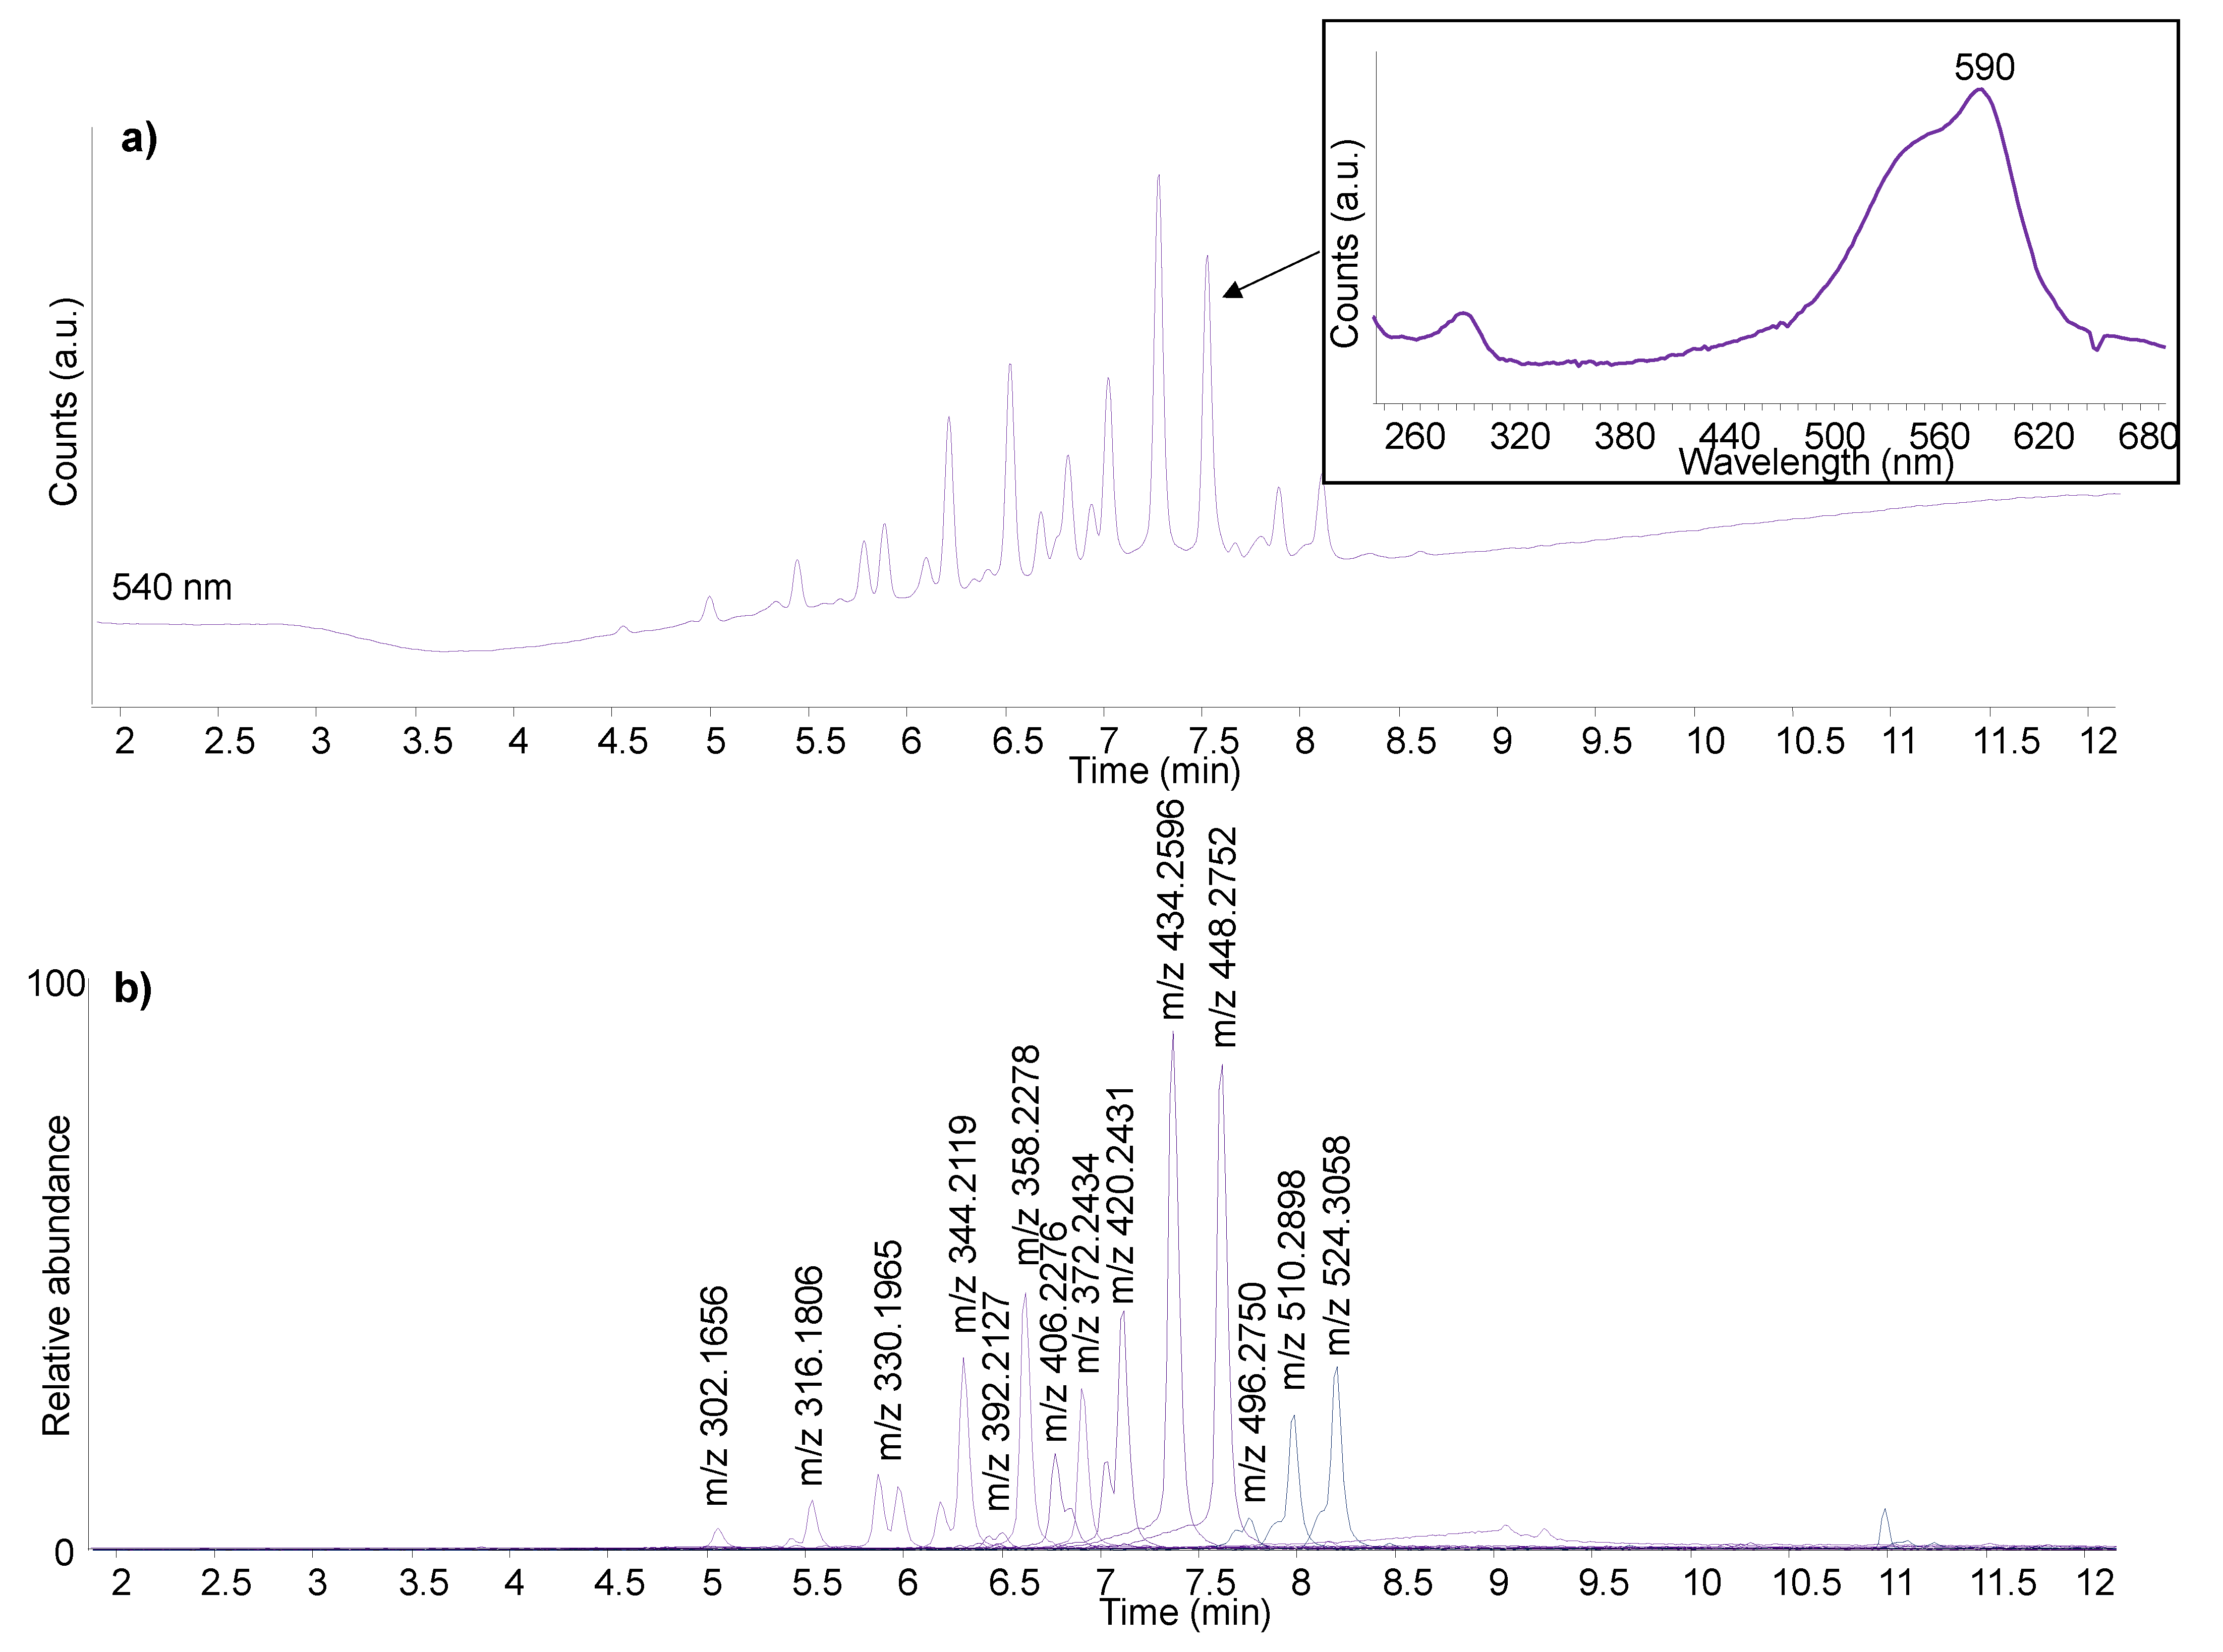
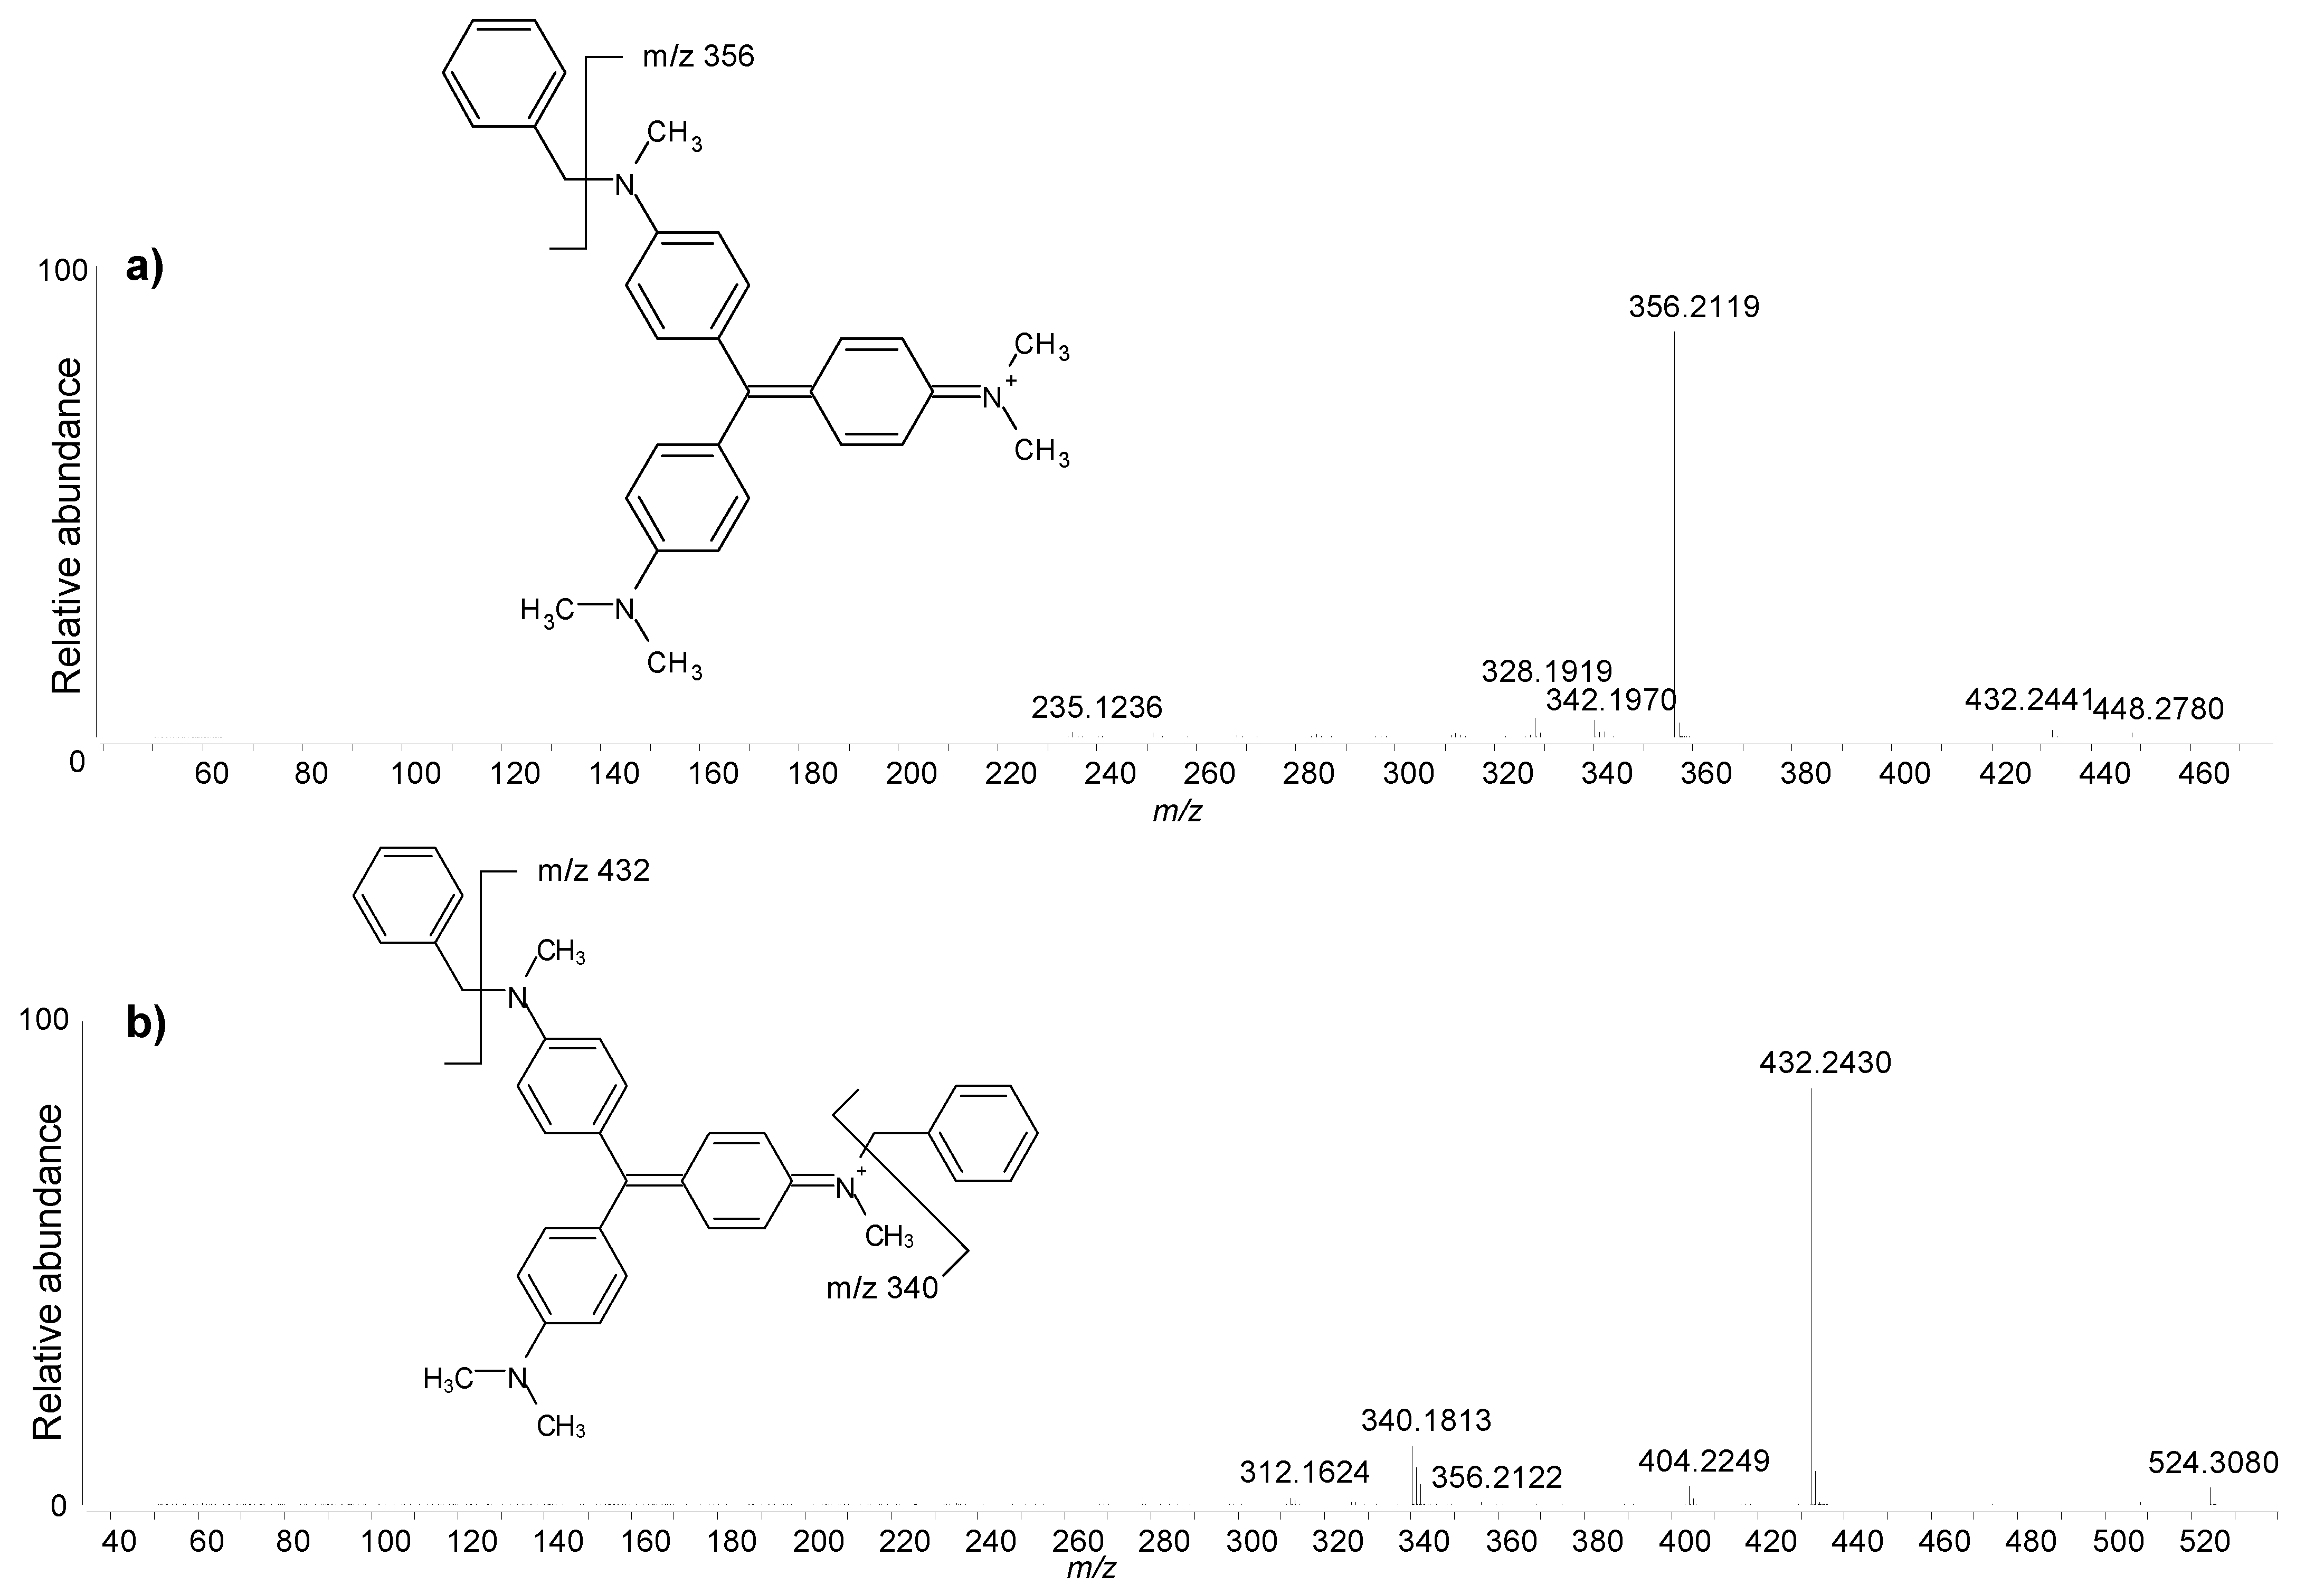
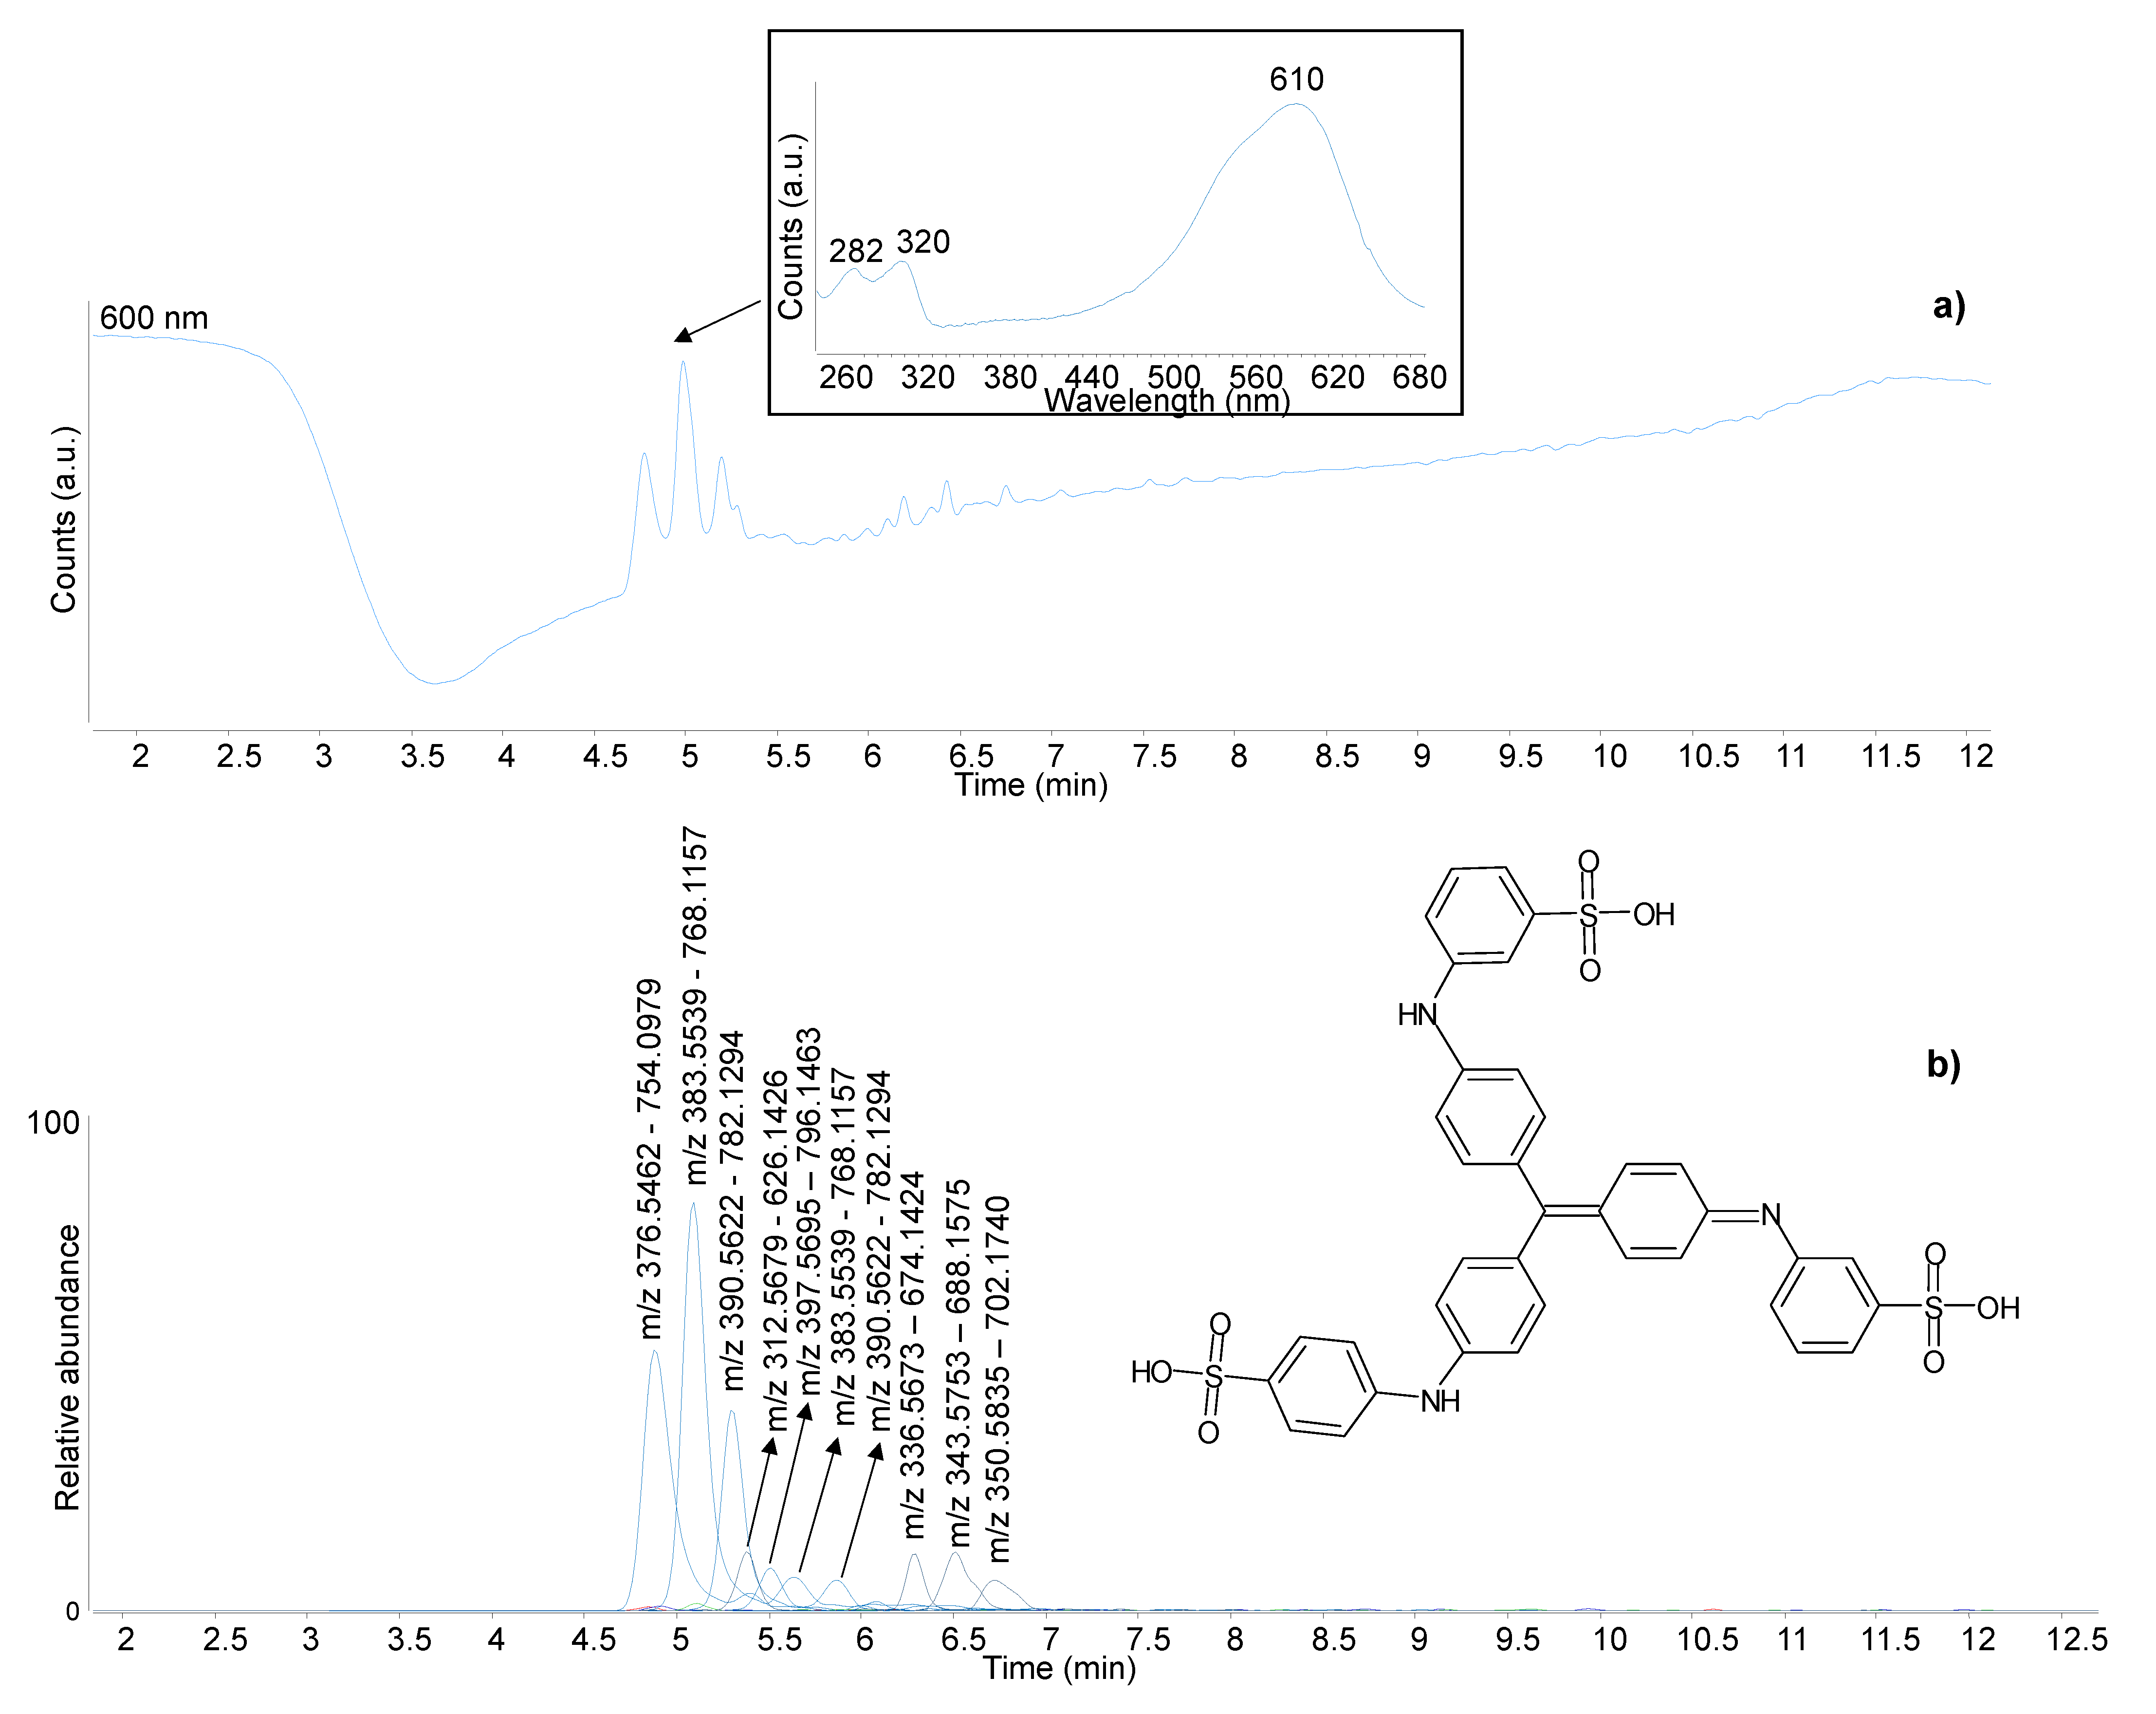
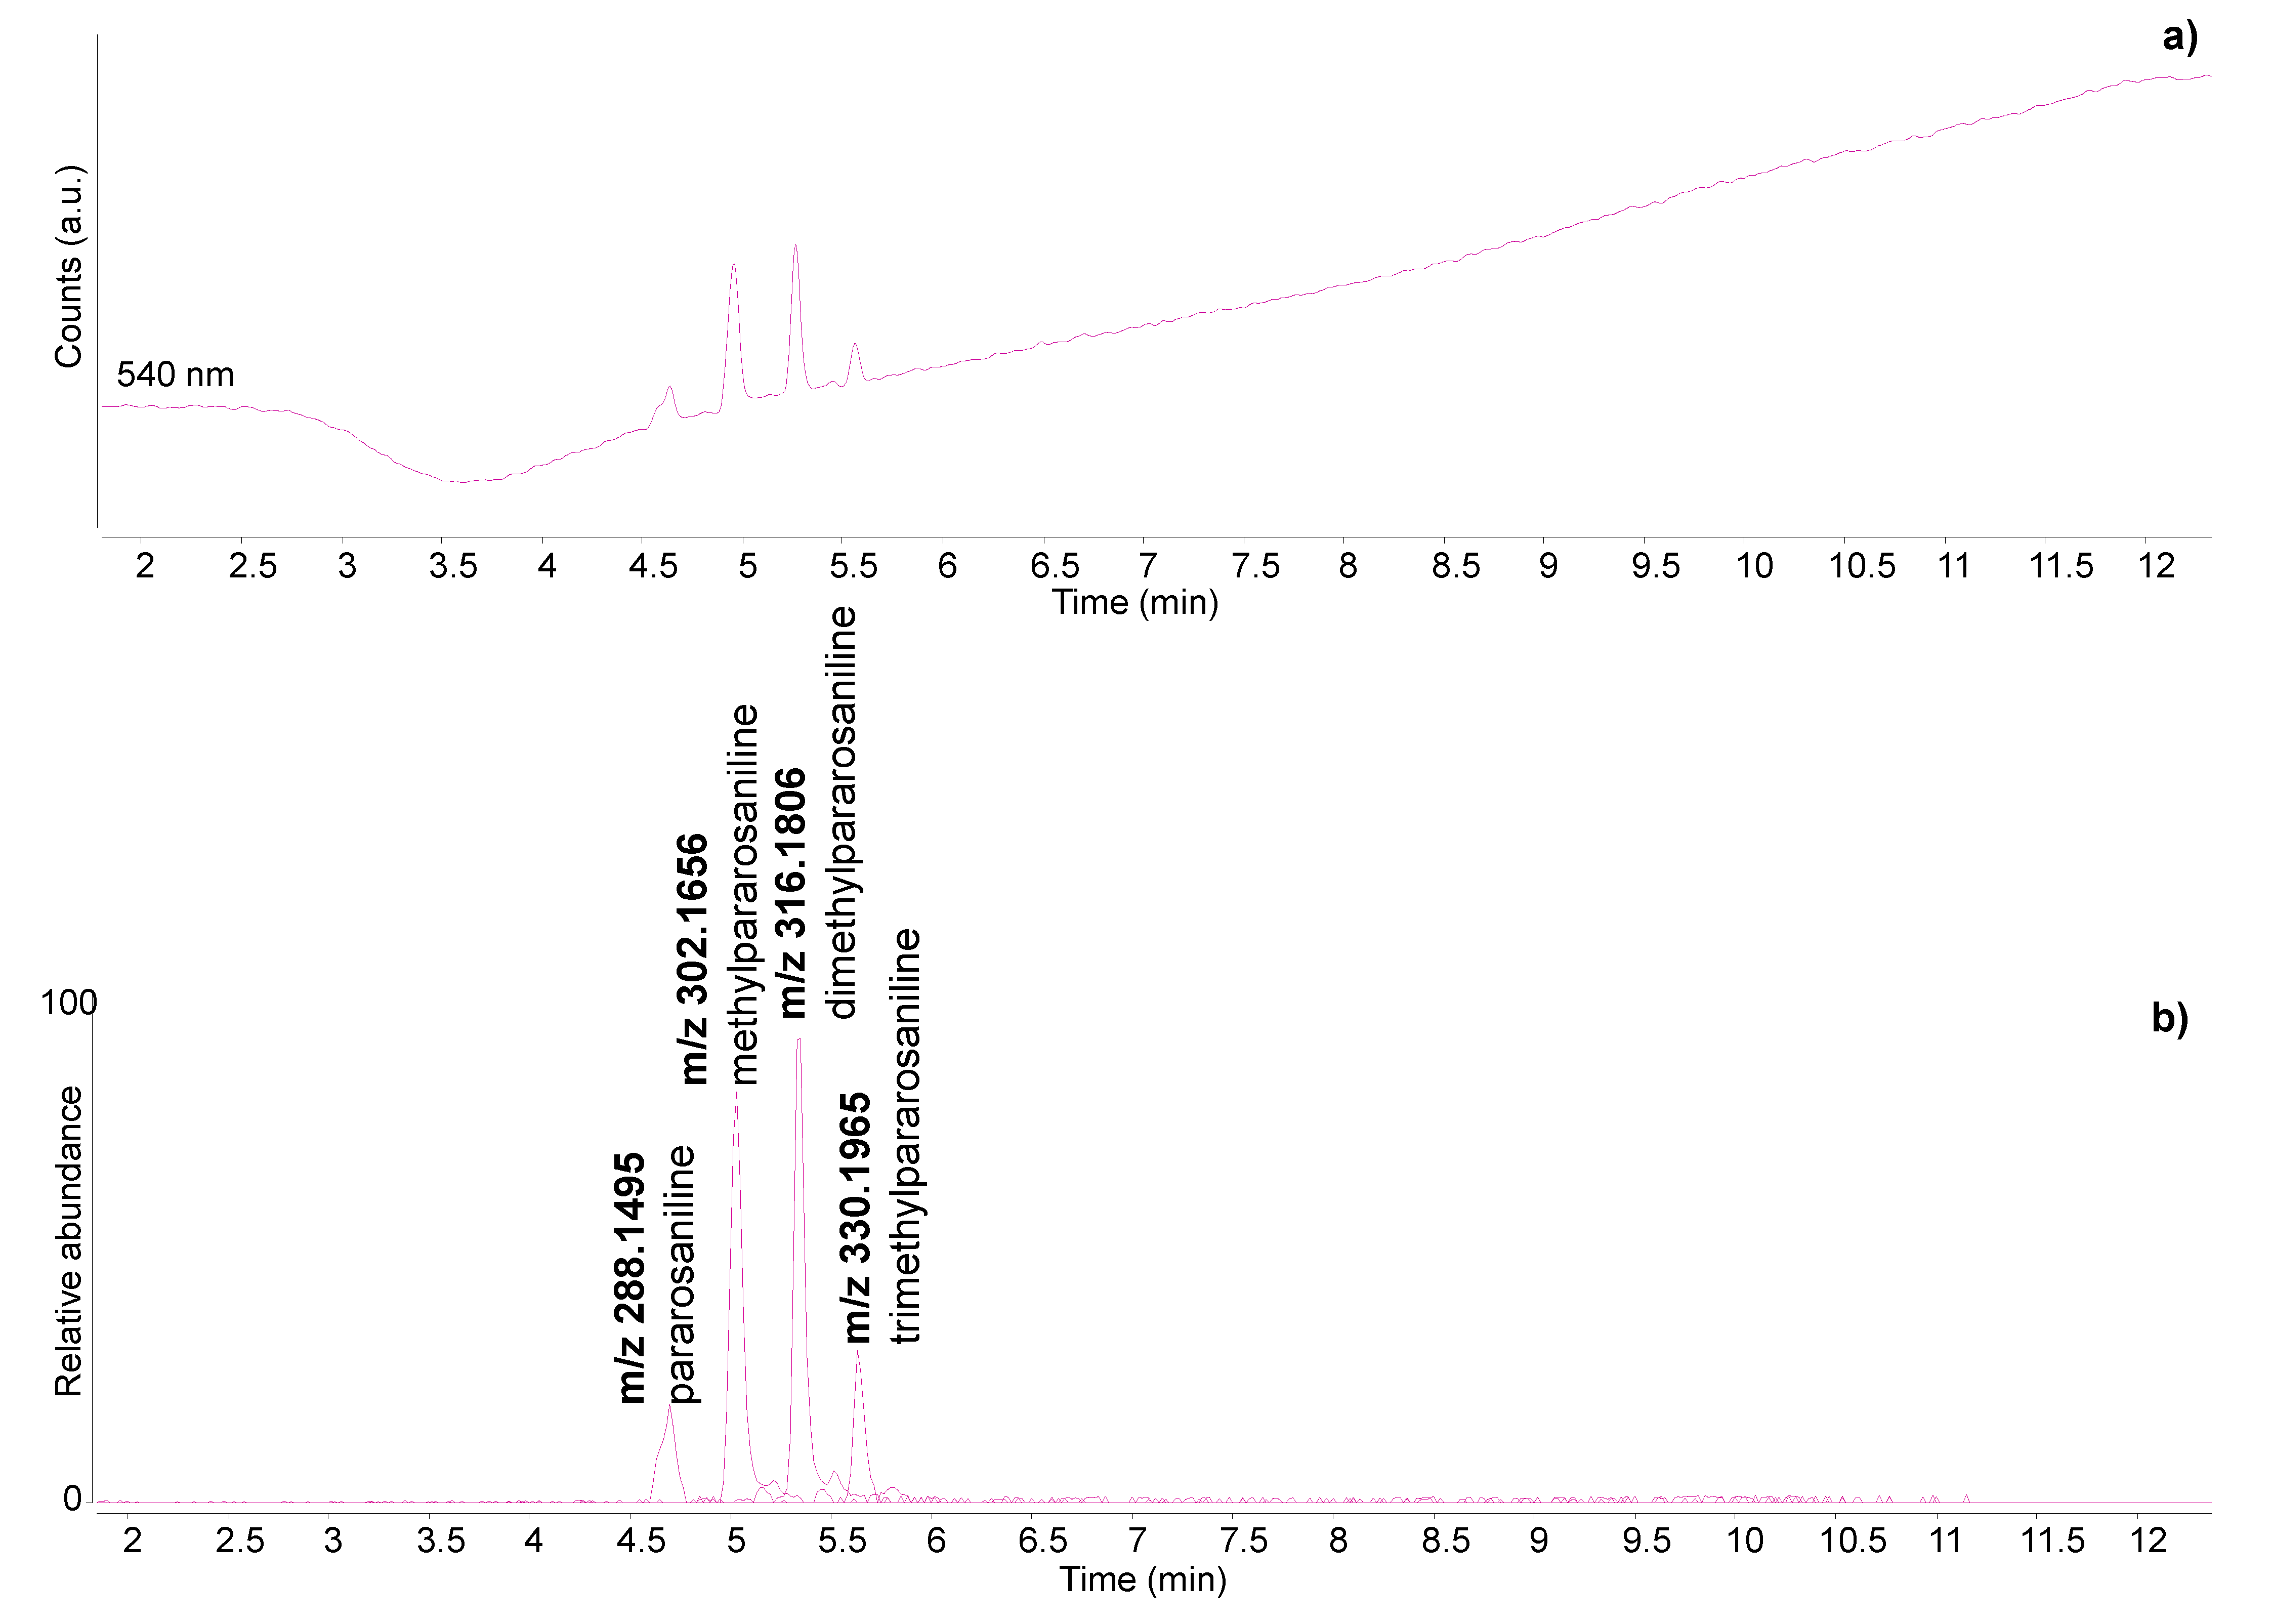
3.2. P2-Two-Panel Screen Painting of Pyeongsaeng-do (‘Scenes of Life’)

Before and during the conservation treatment, digital microscopy was used to obtain a better idea of the areas of interest. In particular, the removal of the brown and pink mounting elements sitting on top of the purple damask revealed the extent of discolouration and dirtiness of the exposed area compared to the protected one, which still retained an extremely vibrant purple colour (Figure 6a,b). Similar observations were obtained from the blue textile border (Figure 6c,d). Furthermore, when the purple textile sitting on top of the blue one was removed, a colour transfer was evident (Figure 6c).
FORS spectra were acquired from the four textile borders corresponding to the purple, blue, pink and brown areas (Figure 7). The reflectance spectrum of the purple area showed a relatively broad absorption band between ca. 540 and 590 nm (Figure 7a), suggesting the presence of a synthetic purple dye [13,49]. The spectrum showed similarities with the results obtained from a reference sample of methyl violet (C.I. 42535), although the match was not perfect due to the absorption band of the reference sample being broader. Moreover, a high number of synthetic purple dyes with similar molecular structures and reflectance spectra [49] are available; hence the FORS results were not considered conclusive. In the case of the blue textile, the three different blue areas visible in Figure 6c were targeted and produced similar spectra with a relatively broad absorption band with a maximum between 605 and 615 nm (Figure 7b). A relatively good match was obtained with a reference sample of methyl blue (C.I. 42780), but also, in this case, the identification was not considered conclusive. The thin pink stripe produced a reflectance spectrum with an absorption maximum at ca. 570 nm (Figure 7c) and a characteristic shape that showed similarities with a reference sample of fuchsin (C.I. 42510). However, some differences were observed as well, which did not allow for a certain identification solely based on the FORS results. The darker colour of the brown textile resulted in a less intense reflectance spectrum. However, a maximum absorption at ca. 580 nm was obtained, suggesting the possible presence of fuchsin also in this textile, although a further investigation was needed, as the absorption maximum appeared significantly shifted.
Four samples were therefore taken from the different textiles. The optical microscopy images are shown in Figure S4 (Supplementary Material).
The HPLC analysis of the purple sample produced a complex chromatographic profile, as shown in Figure 8. The molecules ranging from m/z 302.1656 to m/z 372.2434 were identified as the homologue series of N-methylated pararosanilines containing from one to six N-methyl groups. These are the main components of methyl violet (C.I. 42535) according to the literature [50] and are in agreement with the in-house analysis of the reference samples. However, two additional homologue series were detected. The former one included molecules with molecular ions [M]+ = m/z 406.2278 (two isomers), 420.2434 (two isomers), 434.2591 and 448.2747. The latter one included molecules with [M]+ = m/z 496.2724, 510.2904 and 524.3060. Tandem mass spectra (MS/MS) were acquired for these molecules in order to elucidate their molecular structures. The MS/MS spectra for the molecules with [M]+ = m/z 448.2747 and 524.3060 are reported in Figure 9. The main fragmentation patterns revealed the neutral loss of C7H8 (92.0626 u) fragments corresponding to benzyl groups. The molecular structures were therefore assigned to N-benzyl and N-N-dibenzyl derivatives of N-methylated pararosanilines with different degrees of methylation. These compounds are reported as synthesis products associated with the production of methyl violet formulations [51,52]. In particular, methyl violet 6B is described as N-pentamethyl,N-benzylpararosaniline chloride produced by the action of benzyl chloride on ordinary methyl violet [51]. Furthermore, methyl violet 3B, 4B and 5B are described as mixtures of ordinary methyl violet and methyl violet 6B [51]. The reference samples of methyl violet 3B were available, and the results obtained from these samples indeed showed all the compounds detected in the purple sample from P2 (Figure S5a—Supplementary Material). These benzylated methyl violet formulations are given C.I. number 42536 and started to be produced after 1866 [52].
The HPLC analysis of the blue sample also produced a relatively complex chromatographic profile (Figure 10). In the negative ionisation mode, all molecules produced a strong doubly charged [M-2H]2− ion accompanied by a weaker single charged [M-H] ion. The most abundant three molecules also produced weak ions in the positive ionisation mode. These three molecules are reported as the main components of methyl blue (C.I. 42780) [50] and correspond to the trisulphonated derivative of triphenylpararosaniline ([M-2H]2− = m/z 376.5460 and [M-H] = m/z 754.0993), as well as its methylated ([M-2H]2− = m/z 383.2253 and [M-H] = m/z 768.1150), dimethylated ([M-2H]2− = m/z 390.5617 and [M-H] = m/z 782.1306) and trimethylated ([M-2H]2− = m/z 397.5695 and [M-H] = m/z 796.1463) homologues. The isomers of the methylated compounds were also detected with lower abundance. The corresponding disulphonated derivatives (see Figure 10 and Table 1 for m/z values) eluted at slightly higher retention times. The compound with [M-2H]2− = m/z 312.5679 and [M-H] = m/z 626.1426 was identified as the disulphonated derivative of diphenylpararosaniline. The identifications were supported by the tandem mass spectra (Table 1), and the molecular composition matched with reference samples of methyl blue (also referred to as soluble blue or Nicholson’s blue) (Figure S5b—Supplementary Material). This class of dyes was synthesised in 1862 [52].
Methyl violet compounds were also detected in the blue sample as part of the colour transfer from the purple damask textile.
The HPLC analysis of the pink sample showed the presence of four molecules, which corresponded to the main components of fuchsin (C.I. 42510), i.e., pararosaniline and its methylated, dimethylated and trimethylated derivatives (Figure 11) [25,50]. This dye is also referred to as magenta, and in the early synthetic process, the molecules were obtained by heating an oxidant with a coal tar distillate (or aniline oil) containing a mixture of aniline and toluidine at various ratios so that the resulting molecules were expected to be a mixture of pararosaniline and its methylated derivatives [51,53]. In 1889, the so-called new magenta started to be produced by condensing 4,4’-methylene-di-o-toluidine and o-toluidine with the aim of producing pure trimethylpararosaniline [51,53]. It is, therefore, evident that the fuchsine used in the pink sample is produced with the early process, which was adopted as early as 1858 [52]. The result was supported by the analysis of reference samples of magenta and new magenta, with magenta samples showing a distribution of the four molecular components similar to the pink sample, whereas new magenta samples showed a very different distribution with trimethylpararosaniline as the main component (Figure S5c,d—Supplementary Material).
The HPLC analysis of the brownish sample also revealed the presence of fuchsin synthesised with the early process method. Urolithin C was also detected, highlighting that this textile was dyed with a mixture of fuchsin and sappanwood (Figure S6—Supplementary Material). The discolouration of sappanwood to brownish shades is documented [11]; hence it is reasonable to suggest that this textile would have originally looked more reddish/pinkish than it appears today.

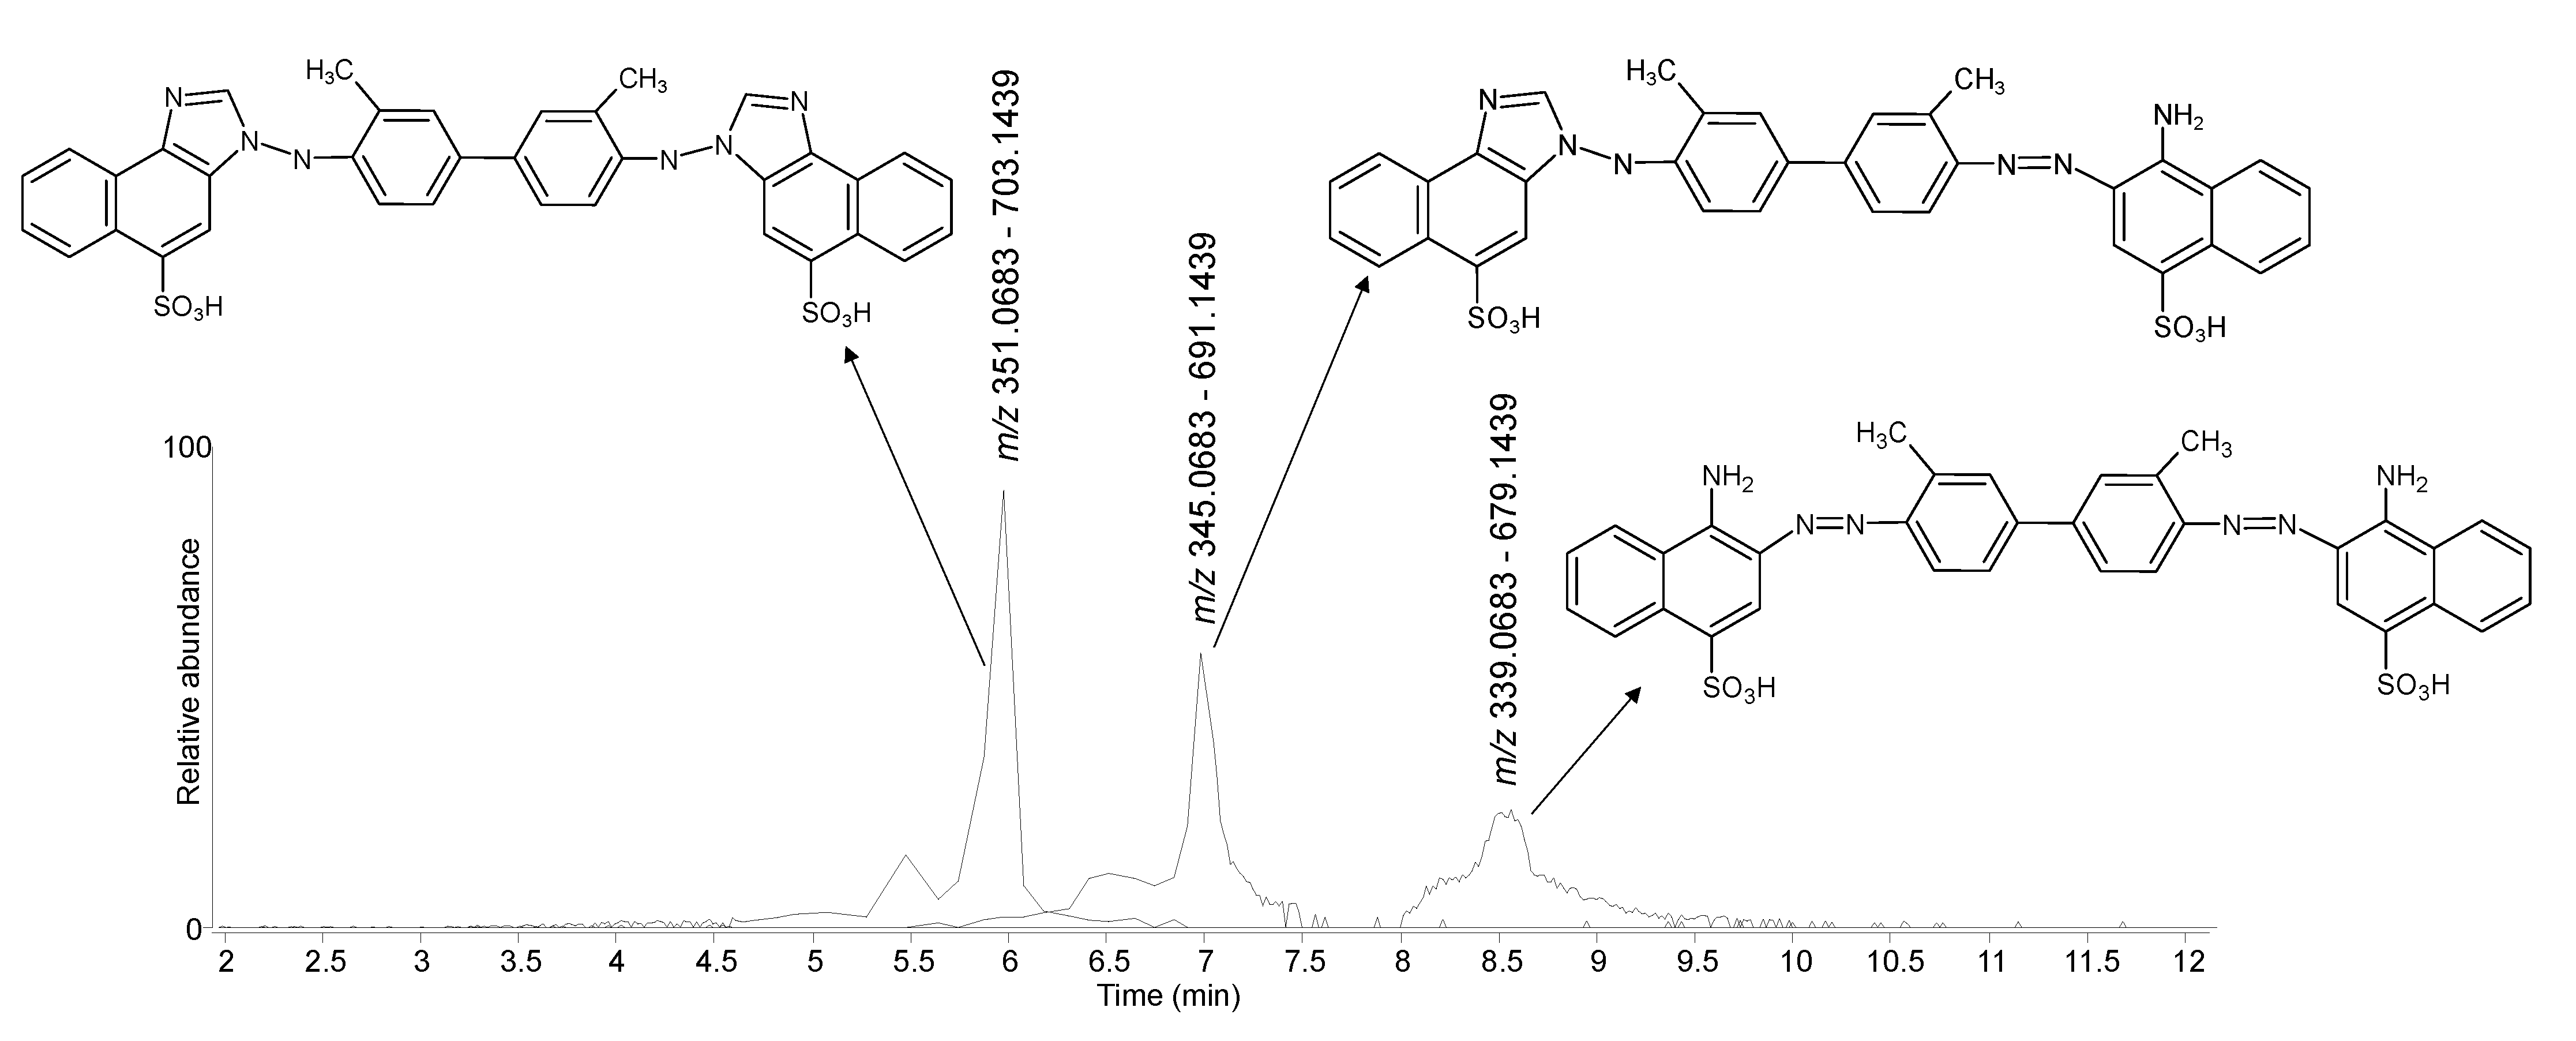
3.3. P3-Twelve-Panel Screen Painting of Scenes of Five Confucian Virtues

The FORS spectra were collected from the four areas of interest (blue cotton, blue silk, brown silk and pink silk). The blue cotton showed the characteristic inflection point of indigo at ca. 720 nm [54,55] (Figure 12a). The reflectance spectra from preserved and discoloured areas of the blue silk damask showed broad absorption bands centred at ca. 610 nm (Figure 12b), similar to what was observed for the blue textile of P2 (Figure 7b), thus suggesting the possible presence of methyl blue. The reflectance spectrum of the brown area was almost featureless, except for a small absorption band at around 580 nm (Figure 12c), which was difficult to interpret. The spectrum of the pink colouration only showed an inflection point at ca. 585 nm (Figure 12d), not specific enough to hypothesise the source of the colour.
As a consequence, four samples were taken from the four areas, and the microscopy images are shown in Figure S7 (Supplementary Material). The observations under the microscope revealed that the blue cotton textile was dyed as a fabric, as visible by the alternate colour pattern on the thread, indicating that the colour did not penetrate homogeneously due to the warp/weft structure. By contrast, a homogeneous dark blue colour was visible on the sample taken from the blue silk damask. The brown sample revealed a pinkish tone to it and a significant brittleness of the silk fibres. The pink sample appeared to be composed of fine silk fibres attached to a paper support, as all of the narrow strips were lined with thin paper. The pink colour appeared to emit a weak luminescence under UV light
The HPLC analysis confirmed the presence of indigo in the blue cotton sample. Indigotin and indirubin were identified (Figure S8—Supplementary Material).
Methyl blue was again identified in the blue silk damask, showing a very similar molecular distribution to the blue sample in P2 (Figure S9—Supplementary Material).
The sample taken from the brown silk damask was found to be dyed with a mixture of hydrolysable tannins–identified by the detection of ellagic acid and fuchsin synthesised via the early process (Figure S10—Supplementary Material). This dye combination is reported to obtain dark shades of magenta colour [52] and justifies the pink/purplish hue observed in the microscopy image as well as the brittleness of the fibres, as tannins are reported to enhance fibre degradation [39,40,56,57]. It is reasonable to have expected the red/pink hue to be originally more vibrant on this textile.
The HPLC analysis of the sample taken from the pink textile revealed the presence of three molecules, which were detected in the negative ionisation mode and produced doubly charged [M-2H]2− ions accompanied by weaker single charged [M-H] ions (Figure 13). One of these molecules showed [M-2H]2− = m/z 339.0683 and [M-H] = m/z 679.1439, which correspond to the chemical formula C34H28N6O6S2. The other two molecules showed [M-2H]2− = m/z 345.0683 and [M-H] = m/z 691.1439, and [M-2H]2− = m/z 351.0683 and [M-H] = m/z 703.1439, corresponding to C35H28N6O6S2 and C36H28N6O6S2, respectively. The result produced a match with a reference sample of benzopurpurin 4B (C.I. 23500) available from the book “A Manual of Dyeing: For the Use of Practical Dyers, Manufacturers, Students, and All Interested in the Art of Dyeing (Specimen of dyed fabrics)” [38] (Figure S5e—Supplementary Material). The smaller molecule is the one corresponding to the actual formula of benzopurpurin 4B, whereas the other two molecules appear to have one and two additional carbon atoms, respectively. These compounds have been recently elucidated by Chen et al. [23] as deriving from a reaction with formaldehyde followed by cyclization on one or both sides of the molecule. Our MS/MS data are in perfect agreement with the ones reported in the literature [23]. Benzopurpurin 4B is a disazo dye that was first synthesised in 1884 [52].

4. Conclusions

The scientific investigation conducted on the textile borders and other mounting elements of three traditional Korean paintings revealed the different dyes used. FORS proved to be useful in identifying some of the natural dyes, such as indigo, safflower red and sappanwood but confirmed its limitations in identifying yellow dyes. It was also useful to indicate the possible presence of synthetic dyes and to point towards the dye class, although a univocal identification was often not possible.
HPLC-DAD-MS/MS was therefore needed to provide a molecular identification of these dyes. Natural dyes were exclusively found on P1 (1996,0329,0.1). The use of indigo for various shades of blue, safflower for red, and a mixture of sappanwood and amur cork tree for orange were in agreement with traditional Korean dyeing practices in the 18th century.
Both natural and synthetic dyes were found in P2 (2016,3028.1) and P3 (1957,1214,0.1). Methyl violet 3B (C.I. 42536), methyl blue (C.I. 42780), fuchsin (C.I. 42510) and benzopurpurin 4B (C.I. 23500) are all early synthetic dyes, with benzopurpurin 4B being the latest one synthesised in 1884. Although it is difficult to establish exactly how long after their invention these dyes reached Korea and started being used, it is reasonable to assume that these textiles were dyed before the end of the 19th century. Of particular interest were the mixtures of natural and synthetic dyes, such as fuchsin and sappanwood/tannins. These mixtures are mentioned in early commercial formulations and dyeing recipes but could also suggest that the dyeing occurred at a time when synthetic dyes had just started to be introduced, hence dyers were still experimenting with these newly available products.
The light sensitivity of most of these dyes is known to be problematic, as was evident during the conservation process. This information contributed to the decision to retain or replacing the mounting elements of these paintings, which are now conserved and temporarily exhibited at the British Museum.

Supplementary Materials

The following supporting information can be downloaded at: https://www.mdpi.com/article/10.3390/heritage6010003/s1, Figure S1: Coloured areas of the mounting elements of hanging scroll 1996,0329,0.1 (P1) investigated. © The Trustees of The British Museum; Figure S2: Coloured areas of the textile borders of two-panel screen painting 2016,3028.1 (P2) investigated. © The Trustees of The British Museum; Figure S3: Coloured areas of the textile borders of twelve-panel screen painting 1957,1214,0.1 (P3) investigated. © The Trustees of The British Museum; Figure S4: Microscopic images of the samples taken from P2 under visible (a–c) and UV (a’–c’) light. Image for the purple sample is not available; Figure S5: Positive ionisation (a) and negative ionisation (b) extracted ion chromatograms obtained by HPLC-DAD-MS/MS analysis of the brown sample from P2; Figure S6: Microscopic images of the samples taken from P3 under visible (a–d) and UV (a’–d’) light. (a,a’) blue cotton; (b,b’) blue silk; (c,c’) brown textile; (d,d’) pink textile; Figure S7: DAD chromatogram obtained by HPLC-DAD-MS/MS analysis of the blue cotton sample from P3. The UV-Vis absorption spectrum of indigotin is reported in the insert; Figure S8: Negative ionisation extracted ion chromatograms obtained by HPLC-DAD-MS/MS analysis of the blue silk sample from P3; Figure S9: DAD chromatograms obtained by HPLC-DAD-MS/MS analysis of the brown sample from P3. Figure S10. DAD chromatograms obtained by HPLC-DAD-MS/MS analysis of the brown sample from P3.

Author Contributions

Conceptualization, D.T. and M.K.-M.; Data curation, D.T., M.K.-M. and S.-a.K.; Formal analysis, D.T.; Investigation, D.T.; Methodology, D.T.; Project administration, M.K.-M.; Resources, D.T., M.K.-M. and S.-a.K.; Software, D.T.; Validation, D.T.; Visualization, D.T.; Writing—Original draft, D.T.; Writing—Review and editing, M.K.-M. and S.-a.K. All authors have read and agreed to the published version of the manuscript.

Funding

This research was partially funded by the Amorepacific Corporation. The APC was funded by the Marcus Wallenberg Foundation for International Scientific Cooperation and by the Swedish National Heritage Board.

Institutional Review Board Statement

Not applicable.

Informed Consent Statement

Not applicable.

Data Availability Statement

The raw data presented in this study are available on request from the corresponding author.

Acknowledgments

The authors would like to thank the Amorepacific Corporation for the financial support over five years (2018–2023) to undertake the ‘Amorepacific Project for the conservation of Korean pictorial art’. The authors would like to thank Matthias Sotiras (Conservator of Eastern Pictorial Art at the British Museum) for his help with the acquisition of digital microscopy images, Joanna Kosek (Head of Pictorial Art Conservation-Eastern at the British Museum) and Louisa Burden (Head of Conservation) for supervising the project activities.

Conflicts of Interest

The authors declare no conflict of interest.

References

  1. Welham, R.D. The Early History of the Synthetic Dye Industry. J. Soc. Dye. Colour. 1963, 79, 146–152. [Google Scholar] [CrossRef]
  2. Hagan, E.; Castro-Soto, I.; Breault, M.; Poulin, J. The lightfastness of early synthetic organic dyes. Herit. Sci. 2022, 10, 50. [Google Scholar] [CrossRef]
  3. Degani, L.; Gulmini, M.; Piccablotto, G.; Iacomussi, P.; Gastaldi, D.; Dal Bello, F.; Chiantore, O. Stability of natural dyes under light emitting diode lamps. J. Cult. Herit. 2017, 26, 12–21. [Google Scholar] [CrossRef]
  4. Tamburini, D.; Dyer, J. Fibre optic reflectance spectroscopy and multispectral imaging for the non-invasive investigation of Asian colourants in Chinese textiles from Dunhuang (7th–10th century AD). Dye. Pigment. 2019, 162, 494–511. [Google Scholar] [CrossRef]
  5. Van Gulik, R. Chinese Pictorial Art as Viewed by the Connoisseur: Notes on the Means and Methods of Traditonal Chinese Connisseurship of Pictorial Art, Based upon a Study of the Art of Mounting Scrolls in China and Japan; Instituto Italiano per il Medio ed Estremo Oriente: Rome, Italy, 1958. [Google Scholar]
  6. Kim-Marandet, M. The Mounting of Korean Painting During the Joseon Dynasty (1392); Sorbonne University: Paris, France, 2018. [Google Scholar]
  7. Zhang, H. Masterpieces of Chinese Painting, 700-1900; Museum, V.A., Ed.; V&A Publishing: London, UK, 2013; pp. 11–25. [Google Scholar]
  8. Shaftel, A. Conservation Treatment of Tibetan Thangkas. J. Am. Inst. Conserv. 1991, 30, 3–11. [Google Scholar] [CrossRef]
  9. Tamburini, D.; Dyer, J.; Heady, T.; Derham, A.; Kim-Marandet, M.; Pullan, M.; Luk, Y.-P.; Ramos, I. Bordering on Asian Paintings: Dye Analysis of Textile Borders and Mount Elements to Complement Research on Asian Pictorial Art. Heritage 2021, 4, 240. [Google Scholar] [CrossRef]
  10. Tamburini, D.; Cartwright, C.R.; Pullan, M.; Vickers, H. An investigation of the dye palette in Chinese silk embroidery from Dunhuang (Tang dynasty). Archaeol. Anthropol. Sci. 2019, 11, 1221–1239. [Google Scholar] [CrossRef]
  11. Tamburini, D. Investigating Asian colourants in Chinese textiles from Dunhuang (7th-10th century AD) by high performance liquid chromatography tandem mass spectrometry—Towards the creation of a mass spectra database. Dye. Pigment. 2019, 163, 454–474. [Google Scholar] [CrossRef]
  12. Chavanne, C.; Troalen, L.G.; Fronty, I.B.; Buléon, P.; Walter, P. Noninvasive Characterization and Quantification of Anthraquinones in Dyed Woolen Threads by Visible Diffuse Reflectance Spectroscopy. Anal. Chem. 2022, 94, 7674–7682. [Google Scholar] [CrossRef]
  13. Caggiani, M.C.; Forleo, T.; Pojana, G.; Lagioia, G.; Mangone, A.; Giannossa, L.C. Characterization of silk-cotton and wool-cotton blends pattern books by fibre optic reflectance spectroscopy. The booming market of first synthetic textile dyes in early 20th century. Microchem. J. 2022, 175, 107178. [Google Scholar] [CrossRef]
  14. Ding, L.; Gong, T.; Wang, B.; Yang, Q.; Liu, W.; Pemo, R.; Metok, T. Non-invasive study of natural dyes in textiles of the Qing Dynasty using fiber optic reflectance spectroscopy. J. Cult. Herit. 2021, 47, 69–78. [Google Scholar] [CrossRef]
  15. Tamburini, D.; Breitung, E.; Mori, C.; Kotajima, T.; Clarke, M.L.; McCarthy, B. Exploring the transition from natural to synthetic dyes in the production of 19th-century Central Asian ikat textiles. Herit. Sci. 2020, 8, 114. [Google Scholar] [CrossRef]
  16. Fonseca, B.; Schmidt Patterson, C.; Ganio, M.; MacLennan, D.; Trentelman, K. Seeing red: Towards an improved protocol for the identification of madder- and cochineal-based pigments by fiber optics reflectance spectroscopy (FORS). Herit. Sci. 2019, 7, 92. [Google Scholar] [CrossRef]
  17. Aceto, M.; Agostino, A.; Fenoglio, G.; Idone, A.; Gulmini, M.; Picollo, M.; Ricciardi, P.; Delaney, J.K. Characterisation of colourants on illuminated manuscripts by portable fibre optic UV-visible-NIR reflectance spectrophotometry. Anal. Methods 2014, 6, 1488–1500. [Google Scholar] [CrossRef]
  18. Nakamura, R.; Tanaka, Y.; Ogata, A.; Masakazu, N. Scientific evidence by fluorescence spectrometry for safflower red on ancient Japanese textiles stored in the Shosoin Treasure House repository. Stud. Conserv. 2014, 59, 367–376. [Google Scholar] [CrossRef]
  19. Sasaki, Y.; Sasaki, K. Analysis of protoberberines in historical textiles: Determining the provenance of East Asian textiles by analysis of phellodendron. e-Preserv. Sci. 2013, 10, 83–89. [Google Scholar]
  20. Nakamura, R.; Tanaka, Y.; Ogata, A.; Naruse, M. Dye Analysis of Shosoin Textiles Using Excitation−Emission Matrix Fluorescence and Ultraviolet−Visible Reflectance Spectroscopic Techniques. Anal. Chem. 2009, 81, 5691–5698. [Google Scholar] [CrossRef]
  21. de Ferri, L.; Tripodi, R.; Martignon, A.; Ferrari, E.S.; Lagrutta-Diaz, A.C.; Vallotto, D.; Pojana, G. Non-invasive study of natural dyes on historical textiles from the collection of Michelangelo Guggenheim. Spectrochim. Acta Part A Mol. Biomol. Spectrosc. 2018, 204, 548–567. [Google Scholar] [CrossRef] [Green Version]
  22. Guo, Y.; Shi, L.; Zhou, X.; Xia, W.; Zhang, L.; Xu, Z.; Luo, X.; Zhang, W. A precise self-built MS/MS database for identifying red dyes and dyeing techniques with UPLC-QTOF-ESI-MS/MS. J. Mass Spectrom. 2022, 57, e4823. [Google Scholar] [CrossRef]
  23. Chen, V.; Minto, R.; Manicke, N.; Smith, G. Structural elucidation of two Congo red derivatives on dyed historical objects indicative of formaldehyde exposure and the potential for chemical fading. Dye. Pigment. 2022, 201, 110173. [Google Scholar] [CrossRef]
  24. Wozniak, M.M.; Witkowski, B.; Ganeczko, M.; Gierczak, T.; Biesaga, M. Textile dyeing in Medieval Sudan evidenced by HPLC-MS analyses: Material traces of a disappeared activity. J. Archaeol. Sci. Rep. 2021, 38, 103098. [Google Scholar] [CrossRef]
  25. Tamburini, D.; Shimada, C.M.; McCarthy, B. The molecular characterization of early synthetic dyes in E. Knecht et al’s textile sample book “A Manual of Dyeing” (1893) by high performance liquid chromatography—Diode array detector—Mass spectrometry (HPLC-DAD-MS). Dye. Pigment. 2021, 190, 109286. [Google Scholar] [CrossRef]
  26. Liu, J.; Li, W.; Kang, X.; Zhao, F.; He, M.; She, Y.; Zhou, Y. Profiling by HPLC-DAD-MSD reveals a 2500-year history of the use of natural dyes in Northwest China. Dye. Pigment. 2021, 187, 109143. [Google Scholar] [CrossRef]
  27. Lech, K.; Nawała, J.; Popiel, S. Mass Spectrometry for Investigation of Natural Dyes in Historical Textiles: Unveiling the Mystery behind Safflower-Dyed Fibers. J. Am. Soc. Mass Spectrom. 2021, 32, 2552–2566. [Google Scholar] [CrossRef]
  28. Sabatini, F.; La Nasa, J.; Guerrini, C.; Modugno, F.; Bonadio, S.; Ursino, F.; Tosini, I.; Colombini, M.P.; Degano, I. On the Set of Fellini’s Movies: Investigating and Preserving Multi-Material Stage Costumes Exploiting Spectroscopic and Mass Spectrometric Techniques. Appl. Sci. 2021, 11, 2954. [Google Scholar] [CrossRef]
  29. Armitage, R.A.; Fraser, D.; Degano, I.; Colombini, M.P. The analysis of the Saltzman Collection of Peruvian dyes by high performance liquid chromatography and ambient ionisation mass spectrometry. Herit. Sci. 2019, 7, 81. [Google Scholar] [CrossRef]
  30. Mouri, C.; Mozaffarian, V.; Zhang, X.; Laursen, R. Characterization of flavonols in plants used for textile dyeing and the significance of flavonol conjugates. Dye. Pigment. 2014, 100, 135–141. [Google Scholar] [CrossRef]
  31. Liu, J.; Mouri, C.; Laursen, R.; Zhao, F.; Zhou, Y.; Li, W. Characterization of dyes in ancient textiles from Yingpan, Xinjiang. J. Archaeol. Sci. 2013, 40, 4444–4449. [Google Scholar] [CrossRef]
  32. Mouri, C.; Laursen, R. Identification of anthraquinone markers for distinguishing Rubia species in madder-dyed textiles by HPLC. Microchim. Acta 2012, 179, 105–113. [Google Scholar] [CrossRef]
  33. Available online: https://www.britishmuseum.org/collection/object/A_1996-0329-0-1 (accessed on 1 November 2022).
  34. Available online: https://m.cha.go.kr/public/commentary/culSelectDetail.do;jsessionid=SXMh8K0B2XxFo1lVGjU5r0vc7ibL0TmAutVPAApT1zD2vxpfJljNe5cOieNANtBa.cha-was01_servlet_engine2?ccbaKdcd=12&ccbaAsno=14770100&ccbaCtcd=31&ccbaCpno=&menuId=03 (accessed on 1 November 2022).
  35. Kim, M. Broken history: Redefining eighteenth-century Korean portrait painting mounts. Stud. Conserv. 2014, 59, S58–S61. [Google Scholar] [CrossRef]
  36. Available online: https://www.britishmuseum.org/collection/object/A_2016-3028-1 (accessed on 1 November 2022).
  37. Available online: https://www.britishmuseum.org/collection/object/A_1957-1214-0-1 (accessed on 1 November 2022).
  38. Knecht, E.; Rawson, C.; Loewenthal, R. A Manual of Dyeing: For the Use of Practical Dyers, Manufacturers, Students, and All Interested in the Art of Dyeing (Specimen of Dyed Fabrics); Charles Griffin and Company: London, UK, 1893. [Google Scholar]
  39. Tamburini, D.; Dyer, J.; Vandenbeusch, M.; Borla, M.; Angelici, D.; Aceto, M.; Oliva, C.; Facchetti, F.; Aicardi, S.; Davit, P.; et al. A multi-scalar investigation of the colouring materials used in textile wrappings of Egyptian votive animal mummies. Herit. Sci. 2021, 9, 106. [Google Scholar] [CrossRef]
  40. Tamburini, D.; Dyer, J.; Davit, P.; Aceto, M.; Turina, V.; Borla, M.; Vandenbeusch, M.; Gulmini, M. Compositional and Micro-Morphological Characterisation of Red Colourants in Archaeological Textiles from Pharaonic Egypt. Molecules 2019, 24, 3761. [Google Scholar] [CrossRef] [PubMed] [Green Version]
  41. Witkoś, K.; Lech, K.; Jarosz, M. Identification of degradation products of indigoids by tandem mass spectrometry. J. Mass Spectrom. 2015, 50, 1245–1251. [Google Scholar] [CrossRef] [PubMed]
  42. Laursen, R.; Mouri, C. Decomposition and analysis of carthamin in safflower-dyed textiles. e-Preserv. Sci. 2013, 10, 35–37. [Google Scholar]
  43. Costantini, R.; Vanden Berghe, I.; Izzo, F.C. New insights into the fading problems of safflower red dyed textiles through a HPLC-PDA and colorimetric study. J. Cult. Herit. 2019, 38, 37–45. [Google Scholar] [CrossRef]
  44. Wouters, J.; Grzywacz, C.M.; Claro, A. Markers for Identification of Faded Safflower (Carthamus tinctorius L.) Colorants by HPLC-PDA-MS—Ancient Fibres, Pigments, Paints and Cosmetics Derived from Antique Recipes. Stud. Conserv. 2010, 55, 186–203. [Google Scholar] [CrossRef]
  45. Doherty, B.; Degano, I.; Romani, A.; Higgitt, C.; Peggie, D.; Colombini, M.P.; Miliani, C. Identifying Brazilwood’s Marker Component, Urolithin C, in Historical Textiles by Surface-Enhanced Raman Spectroscopy. Heritage 2021, 4, 78. [Google Scholar] [CrossRef]
  46. Peggie, D.A.; Kirby, J.; Poulin, J.; Genuit, W.; Romanuka, J.; Wills, D.F.; De Simone, A.; Hulme, A.N. Historical mystery solved: A multi-analytical approach to the identification of a key marker for the historical use of brazilwood (Caesalpinia spp.) in paintings and textiles. Anal. Methods 2018, 10, 617–623. [Google Scholar] [CrossRef] [Green Version]
  47. Han, J.; Quye, A. Dyes and Dyeing in the Ming and Qing Dynasties in China: Preliminary Evidence Based on Primary Sources of Documented Recipes. Text. Hist. 2018, 49, 44–70. [Google Scholar] [CrossRef]
  48. Kim, S.-Y. Kinds and Types of Dyes Used in the Joseon Dynasty. J. Korean Soc. Cloth. Text. 2014, 38, 201–215. [Google Scholar] [CrossRef] [Green Version]
  49. Montagner, C.; Bacci, M.; Bracci, S.; Freeman, R.; Picollo, M. Library of UV–Vis–NIR reflectance spectra of modern organic dyes from historic pattern-card coloured papers. Spectrochim. Acta Part A Mol. Biomol. Spectrosc. 2011, 79, 1669–1680. [Google Scholar] [CrossRef] [PubMed]
  50. Degano, I.; Sabatini, F.; Braccini, C.; Colombini, M.P. Triarylmethine dyes: Characterization of isomers using integrated mass spectrometry. Dye. Pigment. 2019, 160, 587–596. [Google Scholar] [CrossRef]
  51. Knecht, E.; Rawson, C.; Loewenthal, R. A Manual of Dyeing: For the Use of Practical Dyers, Manufacturers, Students, and All Interested in the Art of Dyeing (Volume II); Charles Griffin and Company: London, UK, 1893; Volume II. [Google Scholar]
  52. Colour Index, 3rd ed.; Society of Dyers and Colourists: Bradford, UK, 1971; Volume 1–5.
  53. Chen, V.J.; Smith, G.D.; Whitaker, M.R.; von Rabenau, B. Identification of Red Dyes in Selected Textiles from Chin and Karen Ethnic Groups of Myanmar by LC-DAD-ESI-MS. In Dyes in History and Archaeology 33/34; Kirby, J., Ed.; Archetype Publications: London, UK, 2021; pp. 92–101. [Google Scholar]
  54. Vermeulen, M.; Tamburini, D.; Müller, E.M.K.; Centeno, S.A.; Basso, E.; Leona, M. Integrating liquid chromatography mass spectrometry into an analytical protocol for the identification of organic colorants in Japanese woodblock prints. Sci. Rep. 2020, 10, 20921. [Google Scholar] [CrossRef] [PubMed]
  55. Vermeulen, M.; Burgio, L.; Vandeperre, N.; Driscoll, E.; Viljoen, M.; Woo, J.; Leona, M. Beyond the connoisseurship approach: Creating a chronology in Hokusai prints using non-invasive techniques and multivariate data analysis. Herit. Sci. 2020, 8, 62. [Google Scholar] [CrossRef]
  56. Palladino, N.; Hacke, M.; Poggi, G.; Nechyporchuk, O.; Kolman, K.; Xu, Q.; Persson, M.; Giorgi, R.; Holmberg, K.; Baglioni, P.; et al. Nanomaterials for Combined Stabilisation and Deacidification of Cellulosic Materials—The Case of Iron-Tannate Dyed Cotton. Nanomaterials 2020, 10, 900. [Google Scholar] [CrossRef]
  57. Wilson, H.; Carr, C.; Hacke, M. Production and validation of model iron-tannate dyed textiles for use as historic textile substitutes in stabilisation treatment studies. Chem. Cent. J. 2012, 6, 44. [Google Scholar] [CrossRef]
Figure 1. Image of the recto and verso of hanging scroll 1996,0329,0.1 (P1), showing the portrait of Chae Je-gong (1720–1799 CE). Dimensions are 142.0 × 75.5 cm with mount and 96.5 × 59.5 cm without. Date is 1789 CE. © The Trustees of The British Museum.
Heritage 06 00003 g001
Figure 2. Image of the two-panel screen silk painting of Pyeongsaeng-do-Scenes of life 2016,3028.1 (P2). Dimensions per panel are 85.1 × 40.9 cm with mount and 62.2 × 36.7 cm without. Production date is late 19th century. © The Trustees of The British Museum.
Heritage 06 00003 g002
Figure 3. Image of the twelve-panel screen silk painting representing scenes of stories visualising the Five Confucian virtues 1957,1214,0.1 (P3). Dimensions per panel are 127.9 × 31.5 cm without mount and overall, 171 × 434.7 cm with mount. Production date is late 19th century. © The Trustees of The British Museum.
Heritage 06 00003 g003
Figure 4. Microscopic images of the samples taken from P1 under visible (ac) and UV (a’–c’) light. (a,a’) light blue sample from textile border; (b,b’) red/orange sample from tassel; (c,c’) bright red sample from hanging rod.
Heritage 06 00003 g004
Figure 5. DAD chromatograms obtained by HPLC-DAD-MS/MS analysis of (a) light blue sample; (b) bright red sample from the hanging rod; (c,d) dark red/orange sample from tassel of P1.
Heritage 06 00003 g005
Figure 6. Images of the purple (a,b) and blue (c,d) textile borders of P2 obtained by digital microscopy, highlighting the discolouration of the exposed areas and the vibrant colours of the protected areas.
Heritage 06 00003 g006
Figure 7. Reflectance spectra obtained by FORS analysis of P2 corresponding to (a) purple textile (full line) and reference sample of methyl violet (hollow line); (b) blue textile (full lines for the three areas visible in Figure 6c) and a reference sample of methyl blue (hollow line); (c) brown textile (full line, bottom), pink textile (full line, middle) and a reference sample of fuchsin (hollow line).
Heritage 06 00003 g007
Figure 8. DAD (a) and positive ionisation extracted ion (b) chromatograms obtained by HPLC-DAD-MS/MS analysis of the purple sample from P2. The insert reports the UV-Vis spectrum of one of the molecular components. The experimental masses of the molecular ions [M]+ are also reported.
Heritage 06 00003 g008
Figure 9. Tandem mass spectra (positive ionisation mode) of (a) N-benzyl-N,N,N,N,N-pentamethyl-pararosaniline (precursor ion m/z 448.2747; collision energy 50 keV) and (b) N,N-dibenzyl-N,N,N,N-tetramethyl-pararosaniline (precursor ion m/z 524.3060; collision energy 50 keV).
Heritage 06 00003 g009
Figure 10. DAD (a) and negative ionisation extracted ion (b) chromatograms obtained by HPLC-DAD-MS/MS analysis of the blue sample from P2. The insert reports the UV-Vis spectrum of one of the molecular components. The experimental masses of the pseudomolecular ions are reported as pairs of doubly charged [M-2H]2− and single charged [M-H] ions. The molecular structure of methyl blue ([M-2H]2− = m/z 376.5460 and [M-H] = m/z 754.0993) is included.
Heritage 06 00003 g010
Figure 11. DAD (a) and positive ionisation extracted ion (b) chromatograms obtained by HPLC-DAD-MS/MS analysis of the pink sample from P2. The experimental masses of the molecular ions [M]+ are reported.
Heritage 06 00003 g011
Figure 12. Reflectance spectra obtained by FORS analysis of P3 corresponding to (a) blue cotton; (b) blue silk; (c) brown silk textile; (d) pink silk textile.
Heritage 06 00003 g012
Figure 13. Negative ionisation extracted ion chromatograms obtained by HPLC-DAD-MS/MS analysis of the pink sample from P3. The molecular structure of benzopurpurin 4B and the two degradation products is included.
Heritage 06 00003 g013
Table 1. Summary of the results obtained by HPLC-DAD-MS/MS analysis.
MoleculesFormula[M]+/[M+H]+[M-2H]2−[M-H]Fragment Ions (+)Fragment Ions (-)Dye Sources
1996,0329,0.1-Portrait scroll of Chae Je-gong (P1)
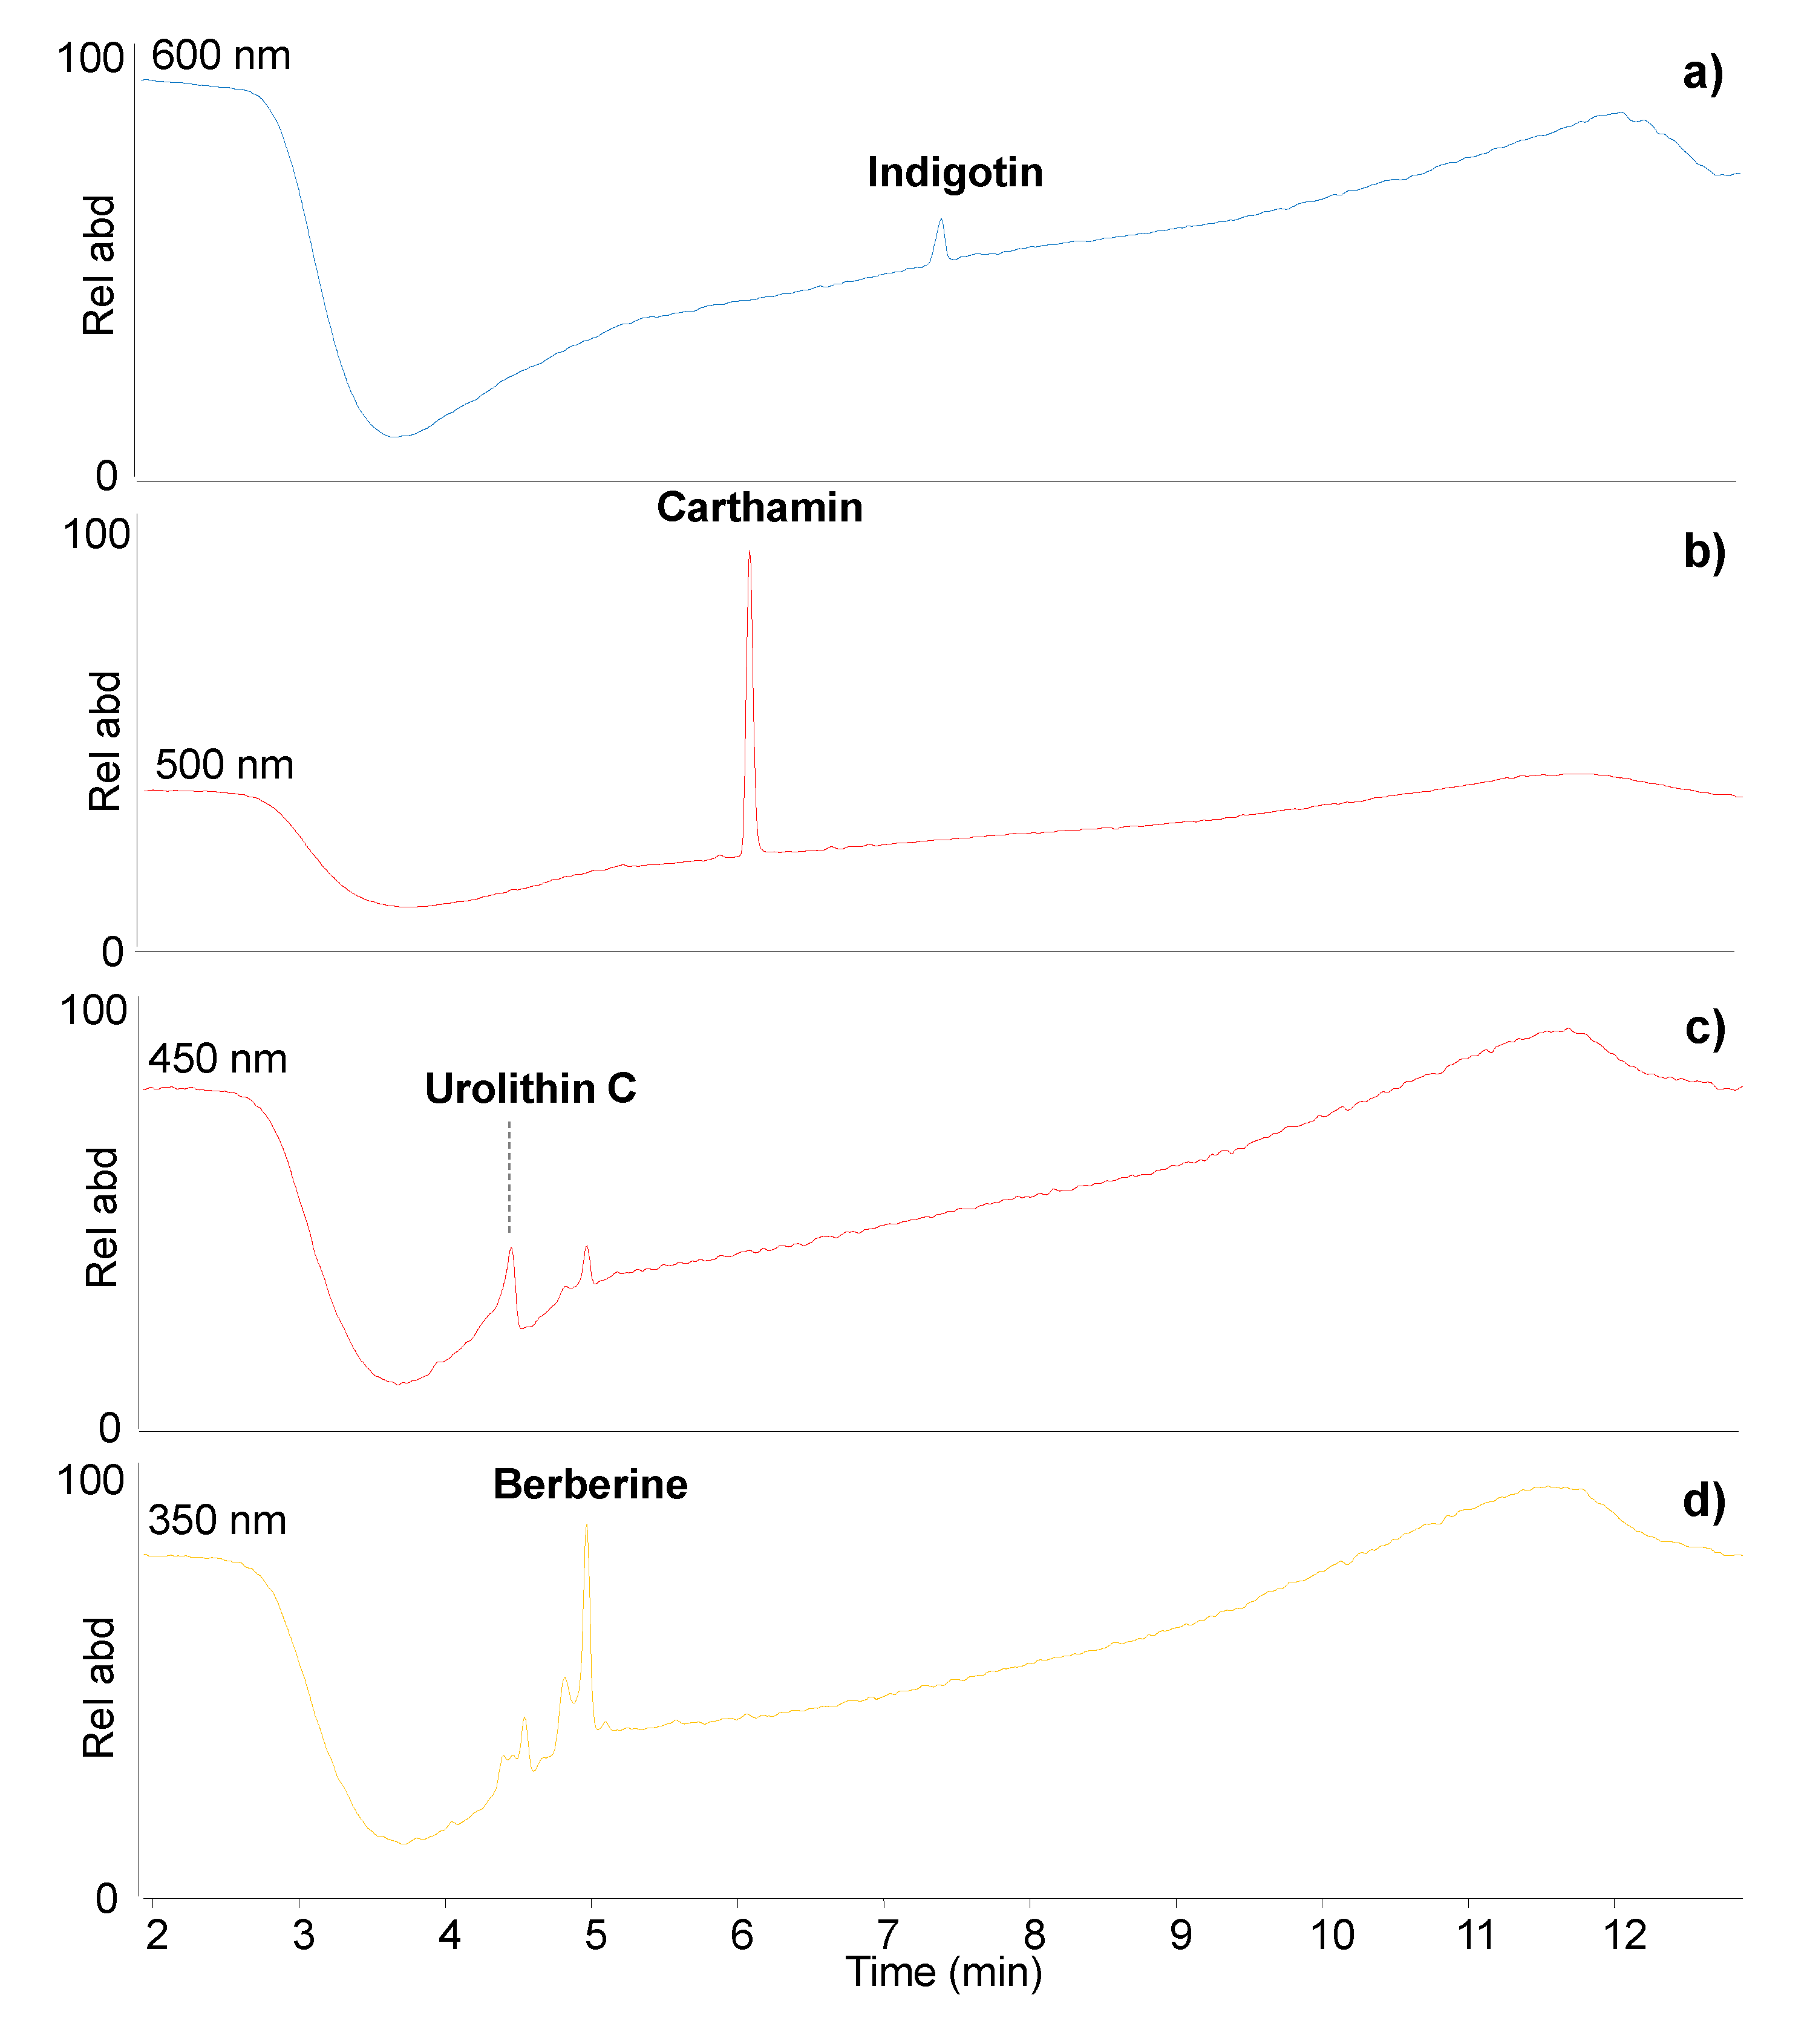
Light blueIsatinC8H5NO2148.0393 146.0248130, 120, 102, 92, 77, 65118Indigo–unknown botanical origin
IndigotinC16H10N2O2263.0815 261.067235, 219, 206, 190, 132
IndirubinC16H10N2O2263.0815 261.067235, 219, 206, 190, 132
Dark red/orange from tasselBrasilein C16H12O5285.0757 283.0612239, 175, 147, 123265, 240, 196, 173Sappanwod (Biancaea sappan)
Urolithin CC13H8O5245.0444 243.0299 226, 215, 198, 187, 171, 143
HydroxyberberineC20H17NO5+352.1185 336, 320, 308, 290 Amur cork tree (Phellodendron amurense)
HydroxypalmatineC21H21NO5+368.1492 352, 338, 324, 310
JatrorrhizineC20H19NO4+338.1387 323, 322, 308, 306, 294, 280, 279
BerberineC20H17NO4+336.123 321, 320, 306, 304, 292, 278
PalmatineC21H21NO4+352.1543 336, 322, 308, 294
Bright red from hanging rodCarthaminC43H42O22911.224 909.2095 891, 847, 659, 501, 449, 407, 287Safflower (Carthamus tinctorius)
Carthamin degradation product IC21H22O11451.1235 449.1089 299, 286, 261, 207, 153, 141, 119
Carthamin degradation product IIC22H22O12479.1184 477.1038 459, 339, 327, 314, 309, 287, 269, 179, 119
2016,3028.1-Two-panel screen painting of Pyeongsaeng-do (‘Scenes of life’) (P2)
PurpleN-methyl-pararosaniline (rosaniline)C20H20N3+302.1656 286, 209, 195, 135, 119, 102, 62 Methyl violet 3B–C.I. 42536-1866
N,N-dimethyl-pararosanilineC21H22N3+316.1808 300, 286, 223, 209, 106
N,N,N-trimethyl-pararosanilineC22H24N3+330.1965 314, 300, 223, 208, 120
N,N,N,N-tetramethyl-pararosanilineC23H26N3+344.2121 328, 313, 301 237, 223
N,N,N,N,N-pentamethyl-pararosanilineC24H28N3+358.2278 342, 326, 289, 237, 214, 133, 119
N,N,N,N,N,N-hexamethyl-pararosanilineC25H30N3+372.2434 356, 328, 251
N-benzyl-N-methyl-pararosanilineC27H26N3+392.2121
N-benzyl-N,N-dimethyl-pararosanilineC28H28N3+406.2278
N-benzyl-N,N,N-trimethyl-pararosanilineC29H30N3+420.2434 404, 328, 313, 300, 258, 223
N-benzyl-N,N,N,N-tetramethyl-pararosanilineC30H32N3+434.2591 418, 342, 314, 272
N-benzyl-N,N,N,N,N- pentamethyl-pararosanilineC31H34N3+448.2747 432, 356, 342, 328
N,N-dibenzyl-N,N-dimethyl-pararosanilineC35H34N3+496.2724 404, 376, 312, 284
N,N-dibenzyl-N,N,N-trimethyl-pararosanilineC36H36N3+510.2904 418, 390, 326
N,N-dibenzyl-N,N,N,N-tetramethyl-pararosanilineC37H38N3+524.3060 432, 404, 340, 312
BlueDisulphonated N,N-diphenyl-N-methyl-pararosanilineC32H27N3O6S2614.1414305.5598612.1269 532, 452, 367, 231, 80Methyl blue-C.I. 42780-1862
Disulphonated N,N-diiphenyl-N,N-dimethyl-pararosanilineC33H29N3O6S2628.1571312.5676626.1425 546, 466, 375, 177, 80
Disulphonated N,N,N-triphenyl-pararosanilineC37H29N3O6S2676.1571 674.1425596, 583, 516, 503, 427, 412, 347, 332, 254, 239, 215594, 530, 514, 156, 80
Disulphonated N,N,N-triphenyl-N-methyl-pararosanilineC38H31N3O6S2690.1727 688.1582610, 530, 426, 346, 254, 217608, 544, 530, 453, 171, 156, 107, 80
Disulphonated N,N,N-triphenyl-N,N-dimethyl-pararosanilineC39H33N3O6S2704.1875 702.1738624, 597, 544, 517, 440, 360, 268622, 542, 476, 171, 156, 80
Trisulphonated N,N,N-triphenyl-pararosanilineC37H29N3O9S3756.1139376.5460754.0993676, 596, 507, 412, 345, 254674, 594, 514
Trisulphonated N,N,N-triphenyl-N-methyl-pararosanilineC38H31N3O9S3
770.1295383.2253768.1150
690, 610, 583, 521, 426, 262
688, 608, 528
Trisulphonated N,N,N-triphenyl-N,N-dimethyl-pararosanilineC39H33N3O9S3784.1452390.5617782.1306704, 597, 535, 377, 320702, 622
Trisulphonated N,N,N-triphenyl-N,N,N-trimethyl-pararosanilineC40H35N3O9S3798.1608397.5695796.1463
PinkPararosaniline C19H18N3+288.1495 271, 195, 168,137 Fuchsin-C.I. 42510-1856
Methyl-pararosanilineC20H20N3+302.1656 286, 209, 195, 135, 119, 102, 62
Dimethyl-pararosanilineC21H22N3+316.1808 300, 286, 223, 209, 106
Trimethyl-pararosaniline C22H24N3+330.1965 314, 300, 223, 208, 120
BrownBrasilein, Urolithin CSee “Dark red/orange from tassel” sample from P1Sappanwod (Biancaea sappan)
Pararosaniline
Methyl-pararosaniline
Dimethyl-pararosaniline
Trimethylpararosaniline
See “Pink” sample from P2Fuchsin-C.I. 42510-1856
1957,1214,0.1-Twelve-panel screen painting of scenes of Five Confucian virtues (P3)
Blue cottonIsatin, Indigotin, IndirubinSee “Light blue” sample from P1Indigo–unknown botanical origin
Blue silkSee “blue” sample from P2Methyl blue
BrownEllagic acidC14H6O8303.0135 300.999284, 245, 228, 200, 173, 145, 117285, 275, 257, 229, 201Tannins–unknown botanical origin
Pararosaniline
Methyl-pararosaniline
Dimethyl-pararosaniline
Trimethylpararosaniline
See “Pink” sample from P2Fuchsin-C.I. 42510-1856
PinkBenzopurpurin 4BC34H28N6O6S2681.1585339.0683679.1439445.1322, 353.1609, 222.0241, 196.1157663, 599, 571, 445, 427, 234Benzopurpurin 4B–C.I. 23500-1884
Benzopurpurin 4B + 1C C35H28N6O6S2693.1585345.0683691.1439
Benzopurpurin 4B + 2CC36H28N6O6S2705.1585351.0683703.1439 455, 391, 375, 247, 182, 167, 107
Disclaimer/Publisher’s Note: The statements, opinions and data contained in all publications are solely those of the individual author(s) and contributor(s) and not of MDPI and/or the editor(s). MDPI and/or the editor(s) disclaim responsibility for any injury to people or property resulting from any ideas, methods, instructions or products referred to in the content.

