Article

Moisture as a Driver of Long-Term Threats to Timber Heritage—Part II: Risks Imposed on Structures at Local Sites

by
Peter Brimblecombe
1 and
Jenny Richards
2,3,*
1
Department of Marine Environment and Engineering, National Sun Yat-Sen University, Kaohsiung 80424, Taiwan
2
St. John’s College, Oxford University, Oxford OX1 3JP, UK
3
School of Geography and the Environment, Oxford University, Oxford OX1 3QY, UK
*
Author to whom correspondence should be addressed.
Heritage 2022, 5(4), 2966-2986; https://doi.org/10.3390/heritage5040154
Submission received: 22 August 2022 / Revised: 30 September 2022 / Accepted: 1 October 2022 / Published: 5 October 2022
(This article belongs to the Special Issue Effective Models in Heritage Science)

Abstract

:
Timber heritage sites are vulnerable to damage from moisture. Simple meteorological descriptions of climate need to be tuned to capture drivers that threaten heritage, including dimensional change, insect attack and mould growth. Global climate models often provide projections through to the end of the 21st century but need to be translated to a local level to reveal processes of deterioration at specific sites. Translation to a local level can be challenging and requires the use of local information from a range of sources. This translation is explored over a range of sites facing different climate pressures, including fungal and insect risk at Harmondsworth Great Barn, England; changes in humidity range, salt risk and algal growth in rural timber buildings in the Midwestern states, USA; wind-driven rain impacts on board houses in Freetown, Sierra Leone; and rainfall and humidity range on timber buildings among the tropical rainforests of the Amazon, Congo Basin and Southeast Asia. Evidence-based narratives provide a tool to incorporate a multiplicity of local information to enrich projections and the interpretation of the model output. These could build trust and aid decision-making based on future projections, which are inherently uncertain.

1. Introduction

Managing water relations is fundamental to the long-term protection of heritage [1]. Water affects heritage materials not only in terms of precipitation and humidity but also in its expression as flooding [2], water table changes and soil moisture content. Constructional timber, while widely used, has long been recognised as vulnerable to damage from fire and wear, and is sensitive to the ambient environment and climate, especially water-related aspects. For heritage sites constructed of timber, changes in moisture can drive fungal growth [3], affect biological processes in terms of insect attack [4] and exert mechanical stress on porous materials through wetting and drying and salt crystallisation [5,6].
Classical meteorological descriptions of climate often fail to capture the drivers that threaten heritage [7,8]. Climate parameters need to be tuned to the context of heritage threat, enabling these pressures to be expressed as particular heritage climatologies [1], which are taken to be particular climate forms that express a potential threat to heritage [9]. Richards and Brimblecombe [7] mapped six key moisture-related heritage climate parameters for timber heritage: Range in annual relative humidity (ΔRH), relative humidity (RH) seasonality, time of wetness (ToW), number of wind-driven rain (WDR) days, salt transitions and the Scheffer index, a function of timber decay.
Heritage climate is particularly important in the 21st century [3], especially as climate change is likely to impose shifts in weather patterns that threaten heritage [10]. The IPCC’s Sixth Assessment Report suggests that by the end of the current century, temperatures are very likely to be 1.0–1.8 °C and 3.3–5.7 °C higher than last century, under low and high greenhouse gas emission scenarios, respectively [11]. Projections of future precipitation are more uncertain than temperature, as precipitation is highly variable on small spatial scales. Nevertheless, projections suggest an intensification of wet and dry periods of weather [11]. These changes are likely to alter potential moisture-based threats to timber heritage [7], e.g., prolonged desiccation of wood could reduce biological attacks by fungi or insects, which require a high water content.
An assessment of heritage deterioration often needs to incorporate dose or damage functions [12] and may be achieved by assessing occurrences and accumulation of environmental parameters. However, there is a need for a local, and even microscale [13], understanding of climate to improve the relevance of environmental observations to heritage management [14]. At the local scale, people responsible for heritage protection have worried about climate change impacts and have seen changes in precipitation and atmospheric moisture as a particular problem [15]. It is important to be able to transfer global-scale heritage climate assessments to a local level. Therefore, this paper aims to investigate the transferring of global pressures to site-specific risk. Our study focuses on meteorologically derived parameters (temperature, precipitation, relative humidity and wind speed) and does not specifically consider soil moisture change [8], surface flooding [16] and more extreme events, e.g., violent storms and landslides [17,18].

Approach

Previous research has commonly assessed global pressures using modelling [7,10]. However, as models are a simplification of reality, they require processes to be abstracted from their wider context. Therefore, when they are applied to unique heritage sites and objects, this simplification and abstraction can cause models to be viewed with varying levels of scepticism [14]. As summarised by Currie and Sterelny [19] (p. 14), “Where models often achieve isolation and precision at the cost of simplification and abstraction, narratives can track complex changes in a trajectory over time at the cost of simplicity and precision”. Such narrative approaches can therefore be seen as bridging a communication gap between research, modelling and action [20]. The role of language in effective communication of climate change is critical to dialogues between researchers, policy makers and the general public, especially for issues of uncertainty [21,22].
We combine modelling and narrative, following Mike Hulme’s thoughts found in Why We Disagree about Climate Change [23], where he advocates using case studies that are almost stories of a future, when describing the impact of climate change. Scientists, often positivist, can be resistant to stories [19,24,25], but this does not mean that imagined and imaginary geographies of heritage and climate change are detached from reality [26]. Furthermore, narratives can help identify diverse forms of data [19], enabling quantitative and qualitative data from multiple sources (e.g., observational records, cultural references such as books and films, policy documents and heritage reports) to be linked to model outputs.

2. Methods

2.1. Heritage Sites

In this study, we focus on heritage sites located in regions highlighted by Richards and Brimblecombe [7] as having notable changes in climate pressures over the coming century. The sites span a range of climates, heritage typologies and conservation challenges. Additionally, the amount and type of available data for each site vary, with some having rich historical records while others are more limited.
We focus on the following sites: (i) Harmondsworth Barn, a medieval barn in England (Figure 1d,e); (ii) rural timber buildings in Iowa, the USA, such as Dibble House (Figure 1a–c); (iii) timber board-houses in Freetown, Sierra Leone, built after the abolition of slavery (Figure 1f,g); and (iv) timber heritage located in rainforests across the Amazon (Figure 1i), Congo Basin (Figure 1h) and Southeast Asia, including Dayak houses and prisoner of war huts in Sarawak, Malaysia (Figure 1j,k). It is not possible to represent the enormous global range of timber heritage, given the small number of sites that can be discussed in a paper. Therefore, we selected sites that could speak more broadly, either in the type or the magnitude of the threat, the amount of data available or political and management contexts. It is worth noting that the sites selected were constructed to fulfil a range of purposes with some built to last many decades (e.g., Harmondsworth Barn), while others were intended to have much shorter intended lifespans (e.g., prisoner of war huts), influencing the construction materials and techniques used.

2.2. Datasets and Data Processing

2.2.1. Modelled Heritage Climate Pressures

Moisture-related drivers of timber deterioration were modelled in Richards and Brimblecombe [7] using HadGEM3-GC31-MM over the time period 1850–2099. Future projections used a high-emission scenario (SSP585) to illustrate the extent of change under a worst-case scenario. Here, we also use the modelled heritage climate parameters:
  • Relative humidity range: Annual range in mean monthly relative humidity (%), where the annual range (ΔRHa) is RHmaxRHmin, and RHmax is the RH of the month with the highest mean RH in a given year and RHmin is the minimum mean monthly RH in the same year.
  • Relative humidity seasonality: Month with the highest and lowest mean RH.
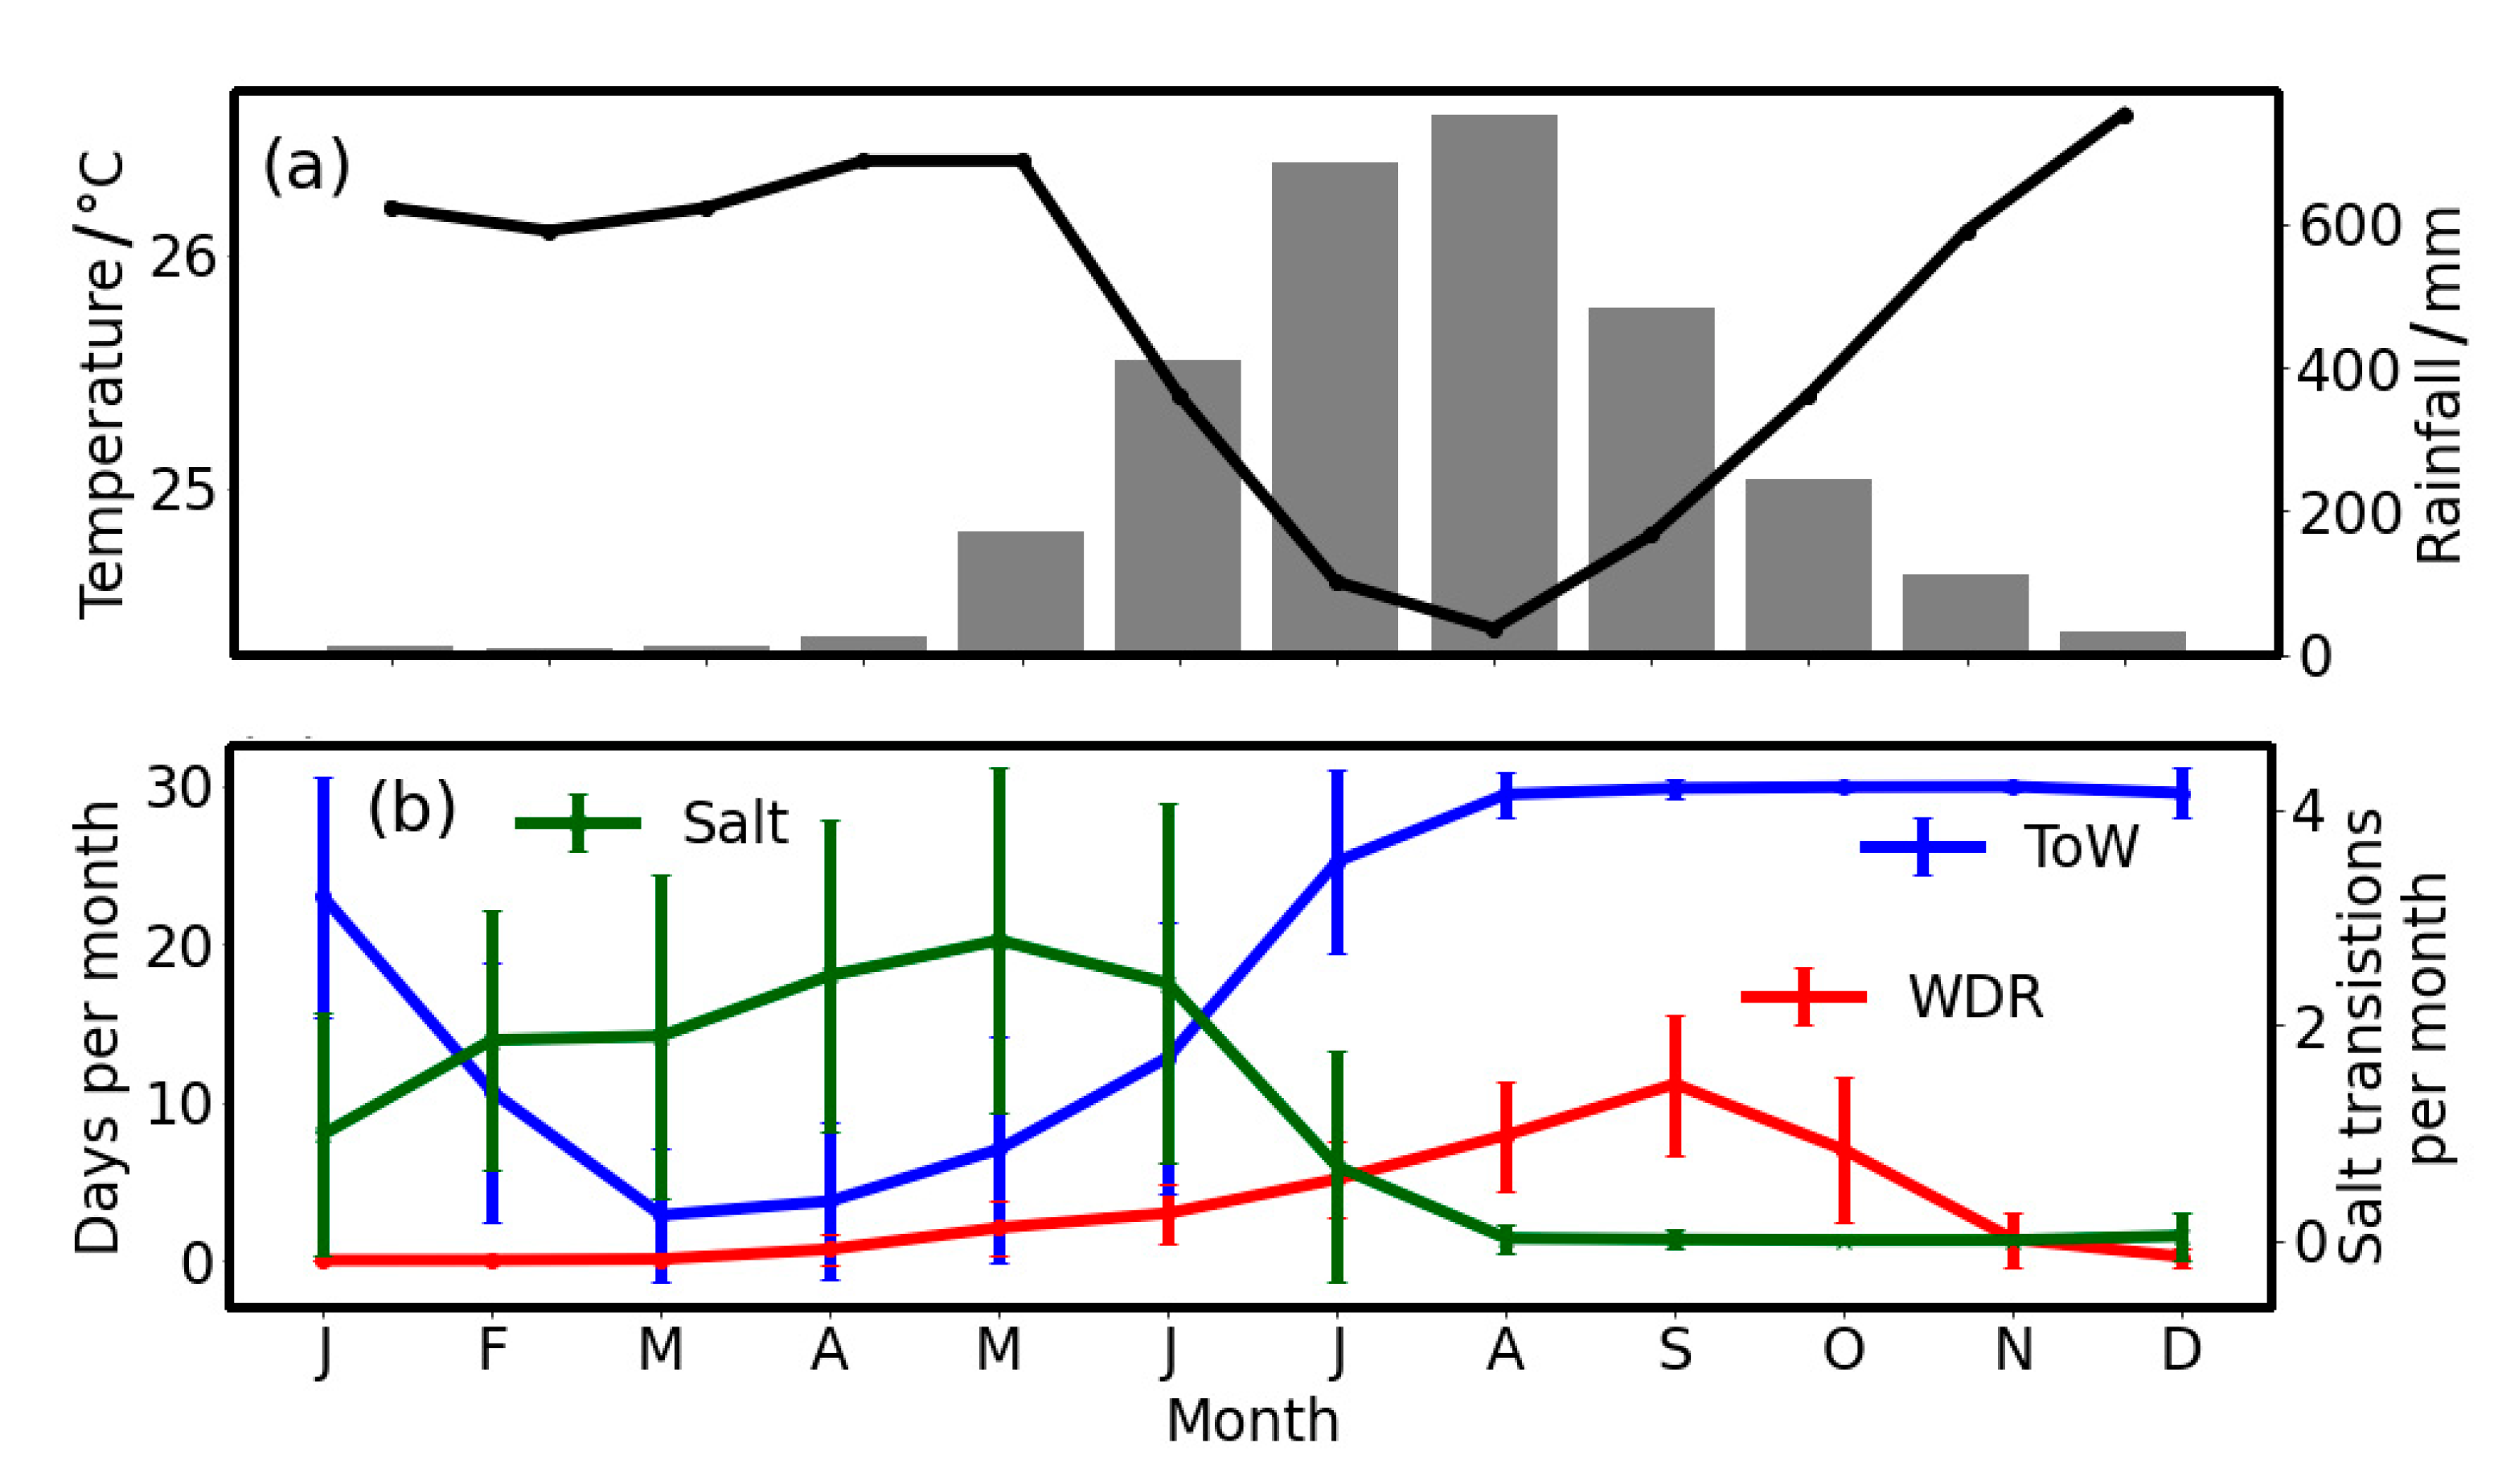
  • Time of wetness: Number of days per year RH >  80% and temperature > 0 ℃.
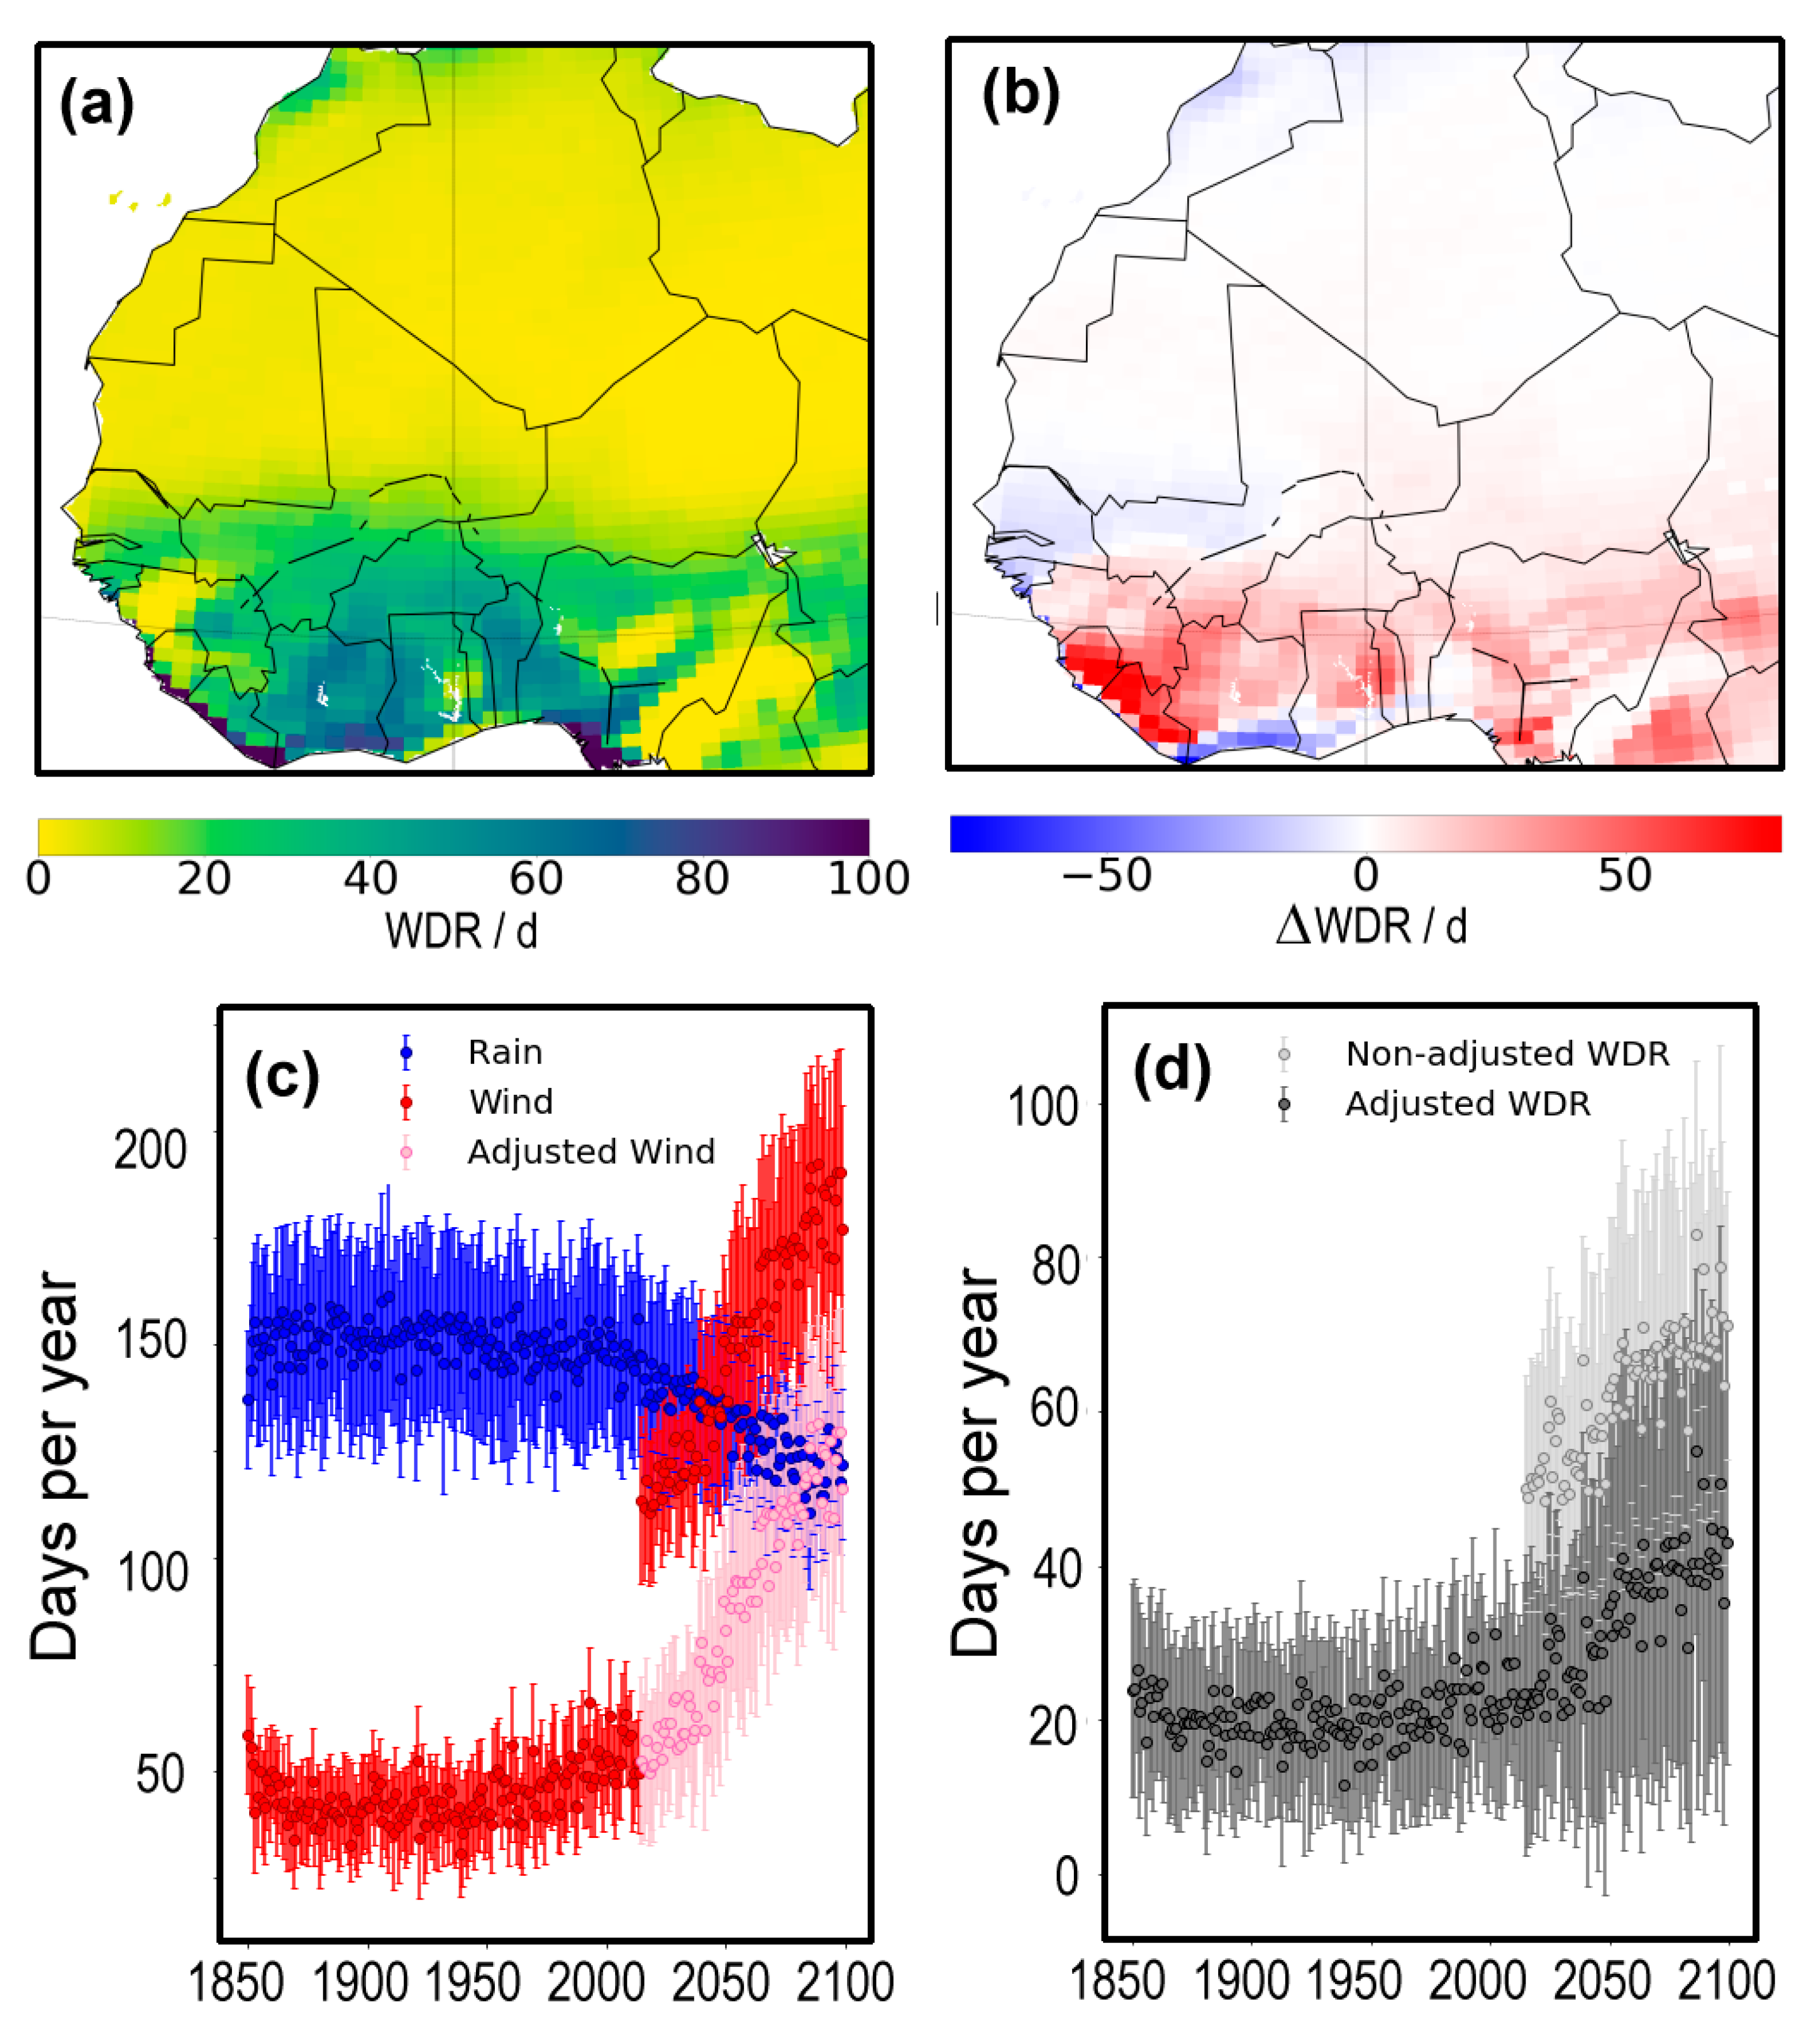
  • Wind-driven rain: Number of days per year when rain is > 4 mm, mean wind speed is >2 m s−1 and temperature > 0 ℃.
  • Salt transitions: Number of cycles per year where the mean daily RH crossed below 75.5%, to account for sodium chloride crystallisation.
  • Scheffer index: Risk of fungal attack expressed as Sch = Σ(Tm − 2)(D − 3)/16.7, which represents the sum over twelve months for the monthly mean temperature (Tm) and the number of days (D) in the month with ≥0.3 mm of rain [27,28].
Additionally, we used climate projections made as part of national studies (e.g., EPA report Seasonality and Climate Change [29]) where projections were tuned to local needs (e.g., the US reports Impacts, Risks, and Adaptation in the United States: Fourth National Climate Assessment [30]), and in the UK, reports on the impact of climate change, such as that from the National Trust [31] and academic research, as cited at the appropriate points in the text.

2.2.2. Observational Data

We used observations as these directly represent weather and climate at a specific location, although they may be made some distance from the site of interest. Extensive observations from national weather agencies or well-established meteorological institutions capture many meteorological parameters at a high resolution. Records can be lengthy, e.g., monthly rainfall is available from Kew in England from 1697 [32], while more regionally, the Central England Temperature Record begins with monthly data at 1659 and daily from 1772 [33]. The Harmondsworth Barn site in the UK (51.4897 N, −0.4799 E) is located close to the Heathrow weather station (51.4787 N, −0.44904 E). Weather records used from this station included hourly rainfall, daily temperature and wind speed, dating back to 1950. These are freely available from the UK Meteorological Office’s MIDAS database [34,35,36] and were used to calculate the Scheffer index for Harmondsworth Barn over the period 1950–2020.
The discussion of humidity change in the American Midwest relied on some published climatological studies of recent and projected changes [30,37,38]. The section on the board-houses in Freetown, Sierra Leone, accessed present-day climate data from the Sierra Leone Meteorological Agency [39]. We used the current average annual rainfall data, as the daily and hourly precipitation was unavailable.
Homogenised data were sometimes used, in our study, because of the limited availability of observations at individual sites; while global, it may be at a lower spatial and temporal resolution. We used climate normals available at a global scale, and these cover the 30-year periods 1901–1930, 1931–1960, and 1961–1990. They are accessible online for more recent periods [40], with the next World Meteorological Organisation mandated normals for 1991–2020 under preparation, to be released 1 August 2023. This study also used the high-resolution gridded datasets maintained by the Climate Research Centre (CRU) at the University of East Anglia [41], which are typically at a monthly resolution. They can also be accessed via the WorldBank portal [42].
Meteorological observations can be affected by gaps, discontinuities or absent parameters. This means users have to be flexible in adopting such data and willing to accept judicious extrapolation, adjustment or proxy data. As an example, there was a discontinuity in the modelled wind speeds for Sierra Leone between the historic and future scenario model runs. To adjust for this, the difference in the decadal average on either side of the discontinuity (1995–2014; 2015–2024) was calculated and applied to the modelled wind speed data from the time period 2015–2099.

2.2.3. Heritage Documentation

Documentation about sites, materials and degradation processes was available from academic publications, policy documents, institutional reports and condition assessments. Especially useful were the Preservation Briefs (1978–present) [43,44,45,46] and the Preservation Tech Notes (1984–present) from the National Park Service, Washington, DC, and the consultation report Review of the Monuments and Relics Act and Recommendations for New Heritage Legislation for Sierra Leone [47]. Site guides were also useful, e.g., that of English Heritage [48] or Dibble House [49] and heritage sites in Freetown [50]. Where documentation is less readily available, broader comparisons can be made to the care and maintenance of timber heritage at other sites. We also searched for outputs from relevant fieldwork but found that such data were difficult to find for the sites we focused on.

2.2.4. Site Scale Material Damage

Climate pressures can be converted to estimates of damage through the use of the Scheffer index or other damage functions [12]. Insects and fungi represent a major threat to the deterioration of timber, so it is necessary to consider the environmental conditions conducive to their growth. As an example, our study of Harmondsworth Barn used observed temperature and relative humidity from Heathrow [36] to model the percentage of time when the optimum conditions occurred (1950–2020) for a selection of beetles and rot that commonly cause damage to timber in the UK. We modelled the optimum climate conditions for the powderpost beetle genera (Lyctus spp.), house longhorn beetle (Hylotrupes bajulus), deathwatch beetle (Xestobium rufovillosum), dry rot (Serpula lacrymans), cellar rot (Coniophora puteana) and oak rot (Donkioporia expansa). Powderpost beetles are a genus rather than specific species. Both powderpost and longhorn beetles predominantly attack sapwood because of their inability to digest lignin and cellulose. Furthermore, they pose little threat to wood over six to eight decades old as they are unable to digest degraded starch and sugars in the wood. However, we include this genus in this analysis due to their widespread occurrence [51], and they pose a risk to repairs to historic structures or new timber buildings. The optimal climate conditions were based on those outlined in [51] and are detailed in Supplementary Table S2.

2.3. Statistics

Non-parametric methods have frequently been used in this study. Trends in the observational data were determined using the Theil–Sen estimator to construct the line of best fit. The estimator uses the median slope and is a more robust method with noisy data due to its insensitivity to outliers. The Kendall τ statistic was used to test the significance of trends over time (analogous to the familiar regression statistic r2).

2.4. Compiling Site Information

We assembled information from multiple sources to assess the deterioration of timber heritage sites. This process aimed to (i) provide a cultural context in which the heritage is located, so we could draw upon the history of the area, artistic works or local customs; (ii) bring the understanding of the effect of climate change on timber heritage to a broader audience, which could include relevant stakeholders such as the general public, local communities, conservators and heritage practitioners; (iii) suggest pathways for improved management, acknowledging that decision making has to balance financial, material and human resources, yet recognise local sensitivities.

3. Results

The results present analyses of local conditions from specific sites. These give a sense of the range of issues likely to confront timber heritage as a result of climate change threats outlined in an earlier publication [7].

3.1. Medieval Barns and Biological Risk

Richards and Brimblecombe [7] showed that timber heritage in western Europe is exposed to a range of moisture pressures. In particular, the Sheffer index is likely to increase over the coming century (Figure 2a,b). There are many iconic forms of European timber heritage including stave churches in Scandinavia and Russia, Germanic Fachwerk buildings and medieval barns, which could be affected by these changes. Old historic barns are significant as they provide insight into European medieval life and have also inspired the design of other buildings, including churches and libraries [48]. They are also interesting from a heritage climate perspective as many historic barns are uninhabited, without heating systems or insulation, meaning that their interior climates are similar to those outdoors though sheltered from direct rain.
In England, the Harmondsworth Barn (Figure 1c) is argued to rank “alongside the Houses of Parliament and Westminster Abbey for its exceptional architectural and historic interest”; it has been likened to a cathedral [48]. The barn is one of the largest (60 m long) ever built in Britain, made predominantly from oak with aisles running down the length of the structure. It was built in the early 1400s by Winchester College and provides a rich understanding of medieval farming practices and the production of wealth, and has been witness to natural changes in climate, e.g., the Little Ice Age. It was Grade I Listed in 1950 for its architectural and historic interest coupled with its rarity [52]. However, in the late 20th century, it was neglected, resulting in damage that included holes in the roof and root damage to the stone plinth [53], prior to English Heritage taking over its management and conservation. These repair materials will be sensitive to the impact of future climates.
The historic neglect and changing ownership of Harmondsworth Barn mean it does not have such detailed conservation records, compared to some English buildings that have useful maintenance and expenditure records spanning many hundred years [54]. The academic research at the site has also been limited, and where undertaken, has tended to focus on digital documentation [55]. However, the close proximity of Harmondsworth Barn to the Heathrow weather station enables us to examine heritage climate pressures calculated using both observations and modelled data (Figure 2c).

3.1.1. Scheffer Index

The Kendall τ test for observations and modelled output for Harmondsworth Barn suggest that the Scheffer index is likely to increase significantly in the future (Figure 2c; observed data (1950–2020) n = 70, τ = 0.42, p2 < 0.0001; model (1850–2099) n = 250, τ = 0.29, p2 < 0.0001; model (1950–2020) n = 70, τ = 0.17, p2 = 0.038). This suggests fungal attack at the barn is likely to become more common through the 21st century.
The Scheffer index calculated using the observations and model output has similar ranges (Figure 2c). However, the index values calculated using the observed data were (i) generally lower, and (ii) the calculated rate of change over the last seven decades was 3.5 times greater than the model output (Figure 2c). It was possible this might be caused by a geographical misalignment, but when looking at the change in the Scheffer index for Scotland, this did not provide a full explanation for the rapid change in the observed data (Figure S1).
Despite global models not fully capturing local conditions, they can project the past and future, beyond observational records. For Harmondsworth Barn, the modelled output provides an important context beyond the period with observations, e.g., if we used the observed data to linearly project the Scheffer index to 2100, it would rise to 108. However, the modelled output suggests this is unlikely, with the Scheffer index levelling between 65 and 85. Combining observations and models provides conservation managers with the opportunity to see the local changes within a wider temporal and spatial context.

3.1.2. Optimum Climate Conditions for Individual Organisms

Figure 3 shows the percentage of days per year with optimal conditions at Harmondsworth Barn for insects and rot (1950–2020). For the three types of rot, the outdoor climate is rarely (<10 d a−1) in the range required for the growth and reproduction of the species. This suggests that unheated structures are less likely to be subject to fungal attack than those warmed for human comfort. However, there has been a significant increase in the occurrence of optimum conditions for dry rot (Kendall τ = 0.29, p2 < 0.001) with the Theil–Sen slopes suggesting an increase in optimal conditionals by an extra day every two decades.
A significant increase in optimal conditions was also seen for powderpost beetles (0.07% per annum, Kendall τ = 0.39, p2 < 0.0001) with an extra optimal day added every four years. This increase will have little impact on timber older than six to eight decades but suggests an increase in the vulnerability of repaired timber or new timber structures to insect attacks in southern England over the coming century. There is no significant change for the house longhorn beetle, deathwatch beetle, cellar rot or oak rot (Kendall τ, p2 ≳ 0.05).
We also found marked changes in the seasonality of optimal conditions (Figure 4). In July and August, the percentage of time spent in optimal conditions for dry rot increased between 1950 and 2019 (Figure 4a). Smaller increases were also noted in spring and autumn, which could extend the period in which this fungus would thrive at Harmondsworth Barn (Figure 4a). In addition, these seasonal changes were also seen in species where no significant change had occurred over an annual period. For example, the amount of time in the optimal conditions for the deathwatch beetle decreased in the summer but increased in winter and autumn (Figure 4b). This could mean that routine monitoring for the presence of deathwatch beetles in the Barn may need to be undertaken more frequently in autumn and winter.

3.2. Rural Timber Buildings and Humidity Threats

Richards and Brimblecombe [7] suggest that the annual RH range in many regions will increase through the 21st century, including the Great Plains of the North American Midwest (Figure 1). The Midwest has a humid continental climate with hot or warm summers and without a dry season. Angel et al. [30] describe annual temperatures in the warmer months as increasing more than in any other region of the US. In Iowa, temperatures have been increasing throughout the 20th century, but these are most notable at night with asymmetric warming that has been attributed to rising humidity [56]. The Midwest is projected to have an increased annual range in RH (Figure 5), which could be driven in part by intense heat waves that are often accompanied by high humidity [56]. In the central USA, Feng et al. [38] argued for a future with higher specific humidity (0.04 g kg−1 a−1) and thus more storms. There may have been little change in annual RH (1947–2010), but there has been a noticeable decrease in March–May, and an increase in June–August [37]. The vapour pressure deficit is likely to increase, so plants and soils will become drier [30]. Change may be spread unevenly across the state, but in general, in the 20th century, there has been a notable anomaly in the summer humidity. This is a result of a moistening that has been characteristic of the Midwest [37], although our calculations [7] suggest the warmer months are likely to become less humid (lower RH) through the current century.
In Wisconsin, Iowa and Minnesota, there are numerous rural wooden heritage buildings associated with a 19th century expansion of agriculture, as cheap land encouraged European immigrants to settle. The farming activity is represented by the region’s homes, rural workshops, old railway stations (Hatton railroad depot near West Millgrove, Ohio [57]) and mills [58]. Notable Prairie School architects, such as Frank Lloyd Wright and William Gray Purcell, constructed imaginative wooden buildings, e.g., the Town Hall (1915) at Jump River, Wisconsin [59]. Dibble House (designed by carpenters Busey and Herald), Eldon, Iowa, is an iconic gothic style house that features in Grant Wood’s painting American Gothic (Figure 1b,c). The house is a testament to the gothic revival brought to the state by German immigrants. Wood’s 1930 painting is doubtless one of the best-known images of interwar rural America; admired as much as lampooned. Dibble House is owned by the State Historical Society of Iowa. It currently operates as a museum managed by the Molalla Area Historical Society (American Gothic House Center [49]). It was refurbished in 1976 [60], but despite lengthy preservation efforts (1960–1990), there are few formal academic studies of the environmental threats to the house. There are also important wooden buildings at Herbert Hoover National Historic Site, West Branch, Iowa, including the Birthplace Cottage and a blacksmith shop [61].

3.2.1. Multiple Threats

The future climate is likely to expose timber heritage in the Midwest to multiple threats. The increasing humidity range predicted is likely to cause a greater dimensional change in wood, which may be a serious mechanism for damage in wood sheltered from the rain. In historic buildings without active mechanical ventilation, changing climate conditions will propagate indoors. The temperature of the interiors may be slightly higher due to solar gain [62], thereby RH is lowered further. Indoor wood, particularly painted wood, is sensitive to humidity change [63], so there could be increased cracking of coatings. Such changes are likely to occur in different seasons, as the month of maximum humidity (Figure S2) will move from the boreal spring (1984–2013) to earlier in the year (2070–2099), potentially requiring a change to the timing of maintenance regimes.
There is also likely to be a modest increase in the Scheffer index, and thus mould risk [7] driven by rising temperatures. The algal growth on paint work and roofing (e.g., shingles) has become an increasing concern in the USA [64]. The discolouration of painted surfaces or roofs by alga [65], while in some senses an aesthetic issue, can develop into broader maintenance problems [64]. The stains are often caused by the cyanobacterium, with Gloeocapsa sp a recognised problem for heritage [66]. Furthermore, the termite threat from species such as Coptotermes formosanus and Reticulitermes flavipes will expand northward through the Midwest over the coming decades [67].
Salt transitions should decrease from 50 (1850–1879) to 30 per year (2070–2099) [7]. Thus, threats to salt-laden timber may decline even though road salt continues to be used and persists in shallow aquifers [68]. However warmer winters [29] should mean that timber buildings near roads will be exposed to less road salt.

3.2.2. Maintenance Strategies

Smaller, rural buildings can find it hard to attract large flows of visitors or resources, so conservation is often an act of love provided by the local community. Often little academic literature is available to describe the conservation of these buildings. Focused and informed maintenance is stressed in National Parks Service guidance, in particular regarding protection against moisture [45]. The Service has published a range of briefs and technical notes dealing with special issues such as doors [69], porches [44] shingle roofs [46] and exterior paint on historic woodwork [43]. Additionally, moisture is a critical factor in the biological growth of paintwork and thrives under damp conditions or in the absence of sunlight [45]. Managing possible future damage at heritage sites in the Midwest will likely involve diligent maintenance, which could adopt Parks Service guidelines, in the absence of specific local practices. In many cases, such maintenance will require a continuation of current approaches but implemented more frequently or in different seasons to reduce the threat from a changing climate.
Increasing concern over algal growth and termites has led to considerable commercialisation of roof cleaning [70] and the protection of timber from insect attack [71]. In a world of changing climates, the algal darkening of roofs increases solar gain [72] at a time when decreases would be desirable. However, the aged look may be valued as a patina, encouraged by coating newly replaced parts of a roof with yoghurt [73].

3.3. Board Houses and Wind-Driven Rain Risk

West Africa has been noted as an area vulnerable to climate change exacerbated by rapid population growth and with high densities in urban areas, and variable community resilience [74,75]. The seasonal climate is dominated by the West African monsoon and the Harmattan winds from the Sahara. Recent studies have suggested that WDR (Figure 6a,b), extreme rainfall and consecutive dry days are likely to increase in future, but uncertainties in whether annual precipitation will increase or decrease remain [7,76,77]. The frequent occurrence of WDR along the Sierra Leonean coast suggests that it poses a threat to timber heritage (Figure 6a), and that by the end of the 21st century, this threat will have expanded inland (Figure 6b).
Within West Africa, Sierra Leone has been noted as being particularly vulnerable to climate change [75,78], affecting its timber heritage. In Sierra Leone, wood has commonly been used to create objects such as statues, ceremonial masks and instruments, as well as the construction of homes and monuments. On the Sierra Leone Heritage website (a digital resource aimed at virtually bringing together collections from Sierra Leone’s rich cultural heritage), almost a quarter (24%) of the listed items are made from wood [79]. However, the colonial history of the country means that many of these objects are housed in European museums [80]. The timber board houses in Freetown (Figure 1g) remain in Sierra Leone, seen by residents as providing an important link to the city’s history and the effects of slavery and colonialism. The houses’ style reflects late 18th and 19th century American eastern seaboard cabins. These were built with the arrival of former American slaves to Sierra Leone after the abolition of slavery [81]. They are now seen as an important form of vernacular architecture that provides a distinctive character to the city [47].

3.3.1. Climate and Climate Pressures

There are eight automatic weather stations located across Sierra Leone. Data from these stations show that average annual rainfall across the country is zonal, with coastal regions receiving >3500 mm a−1 (Figure S3). These meteorological records have been used by researchers such as Taylor et al. [82] to assess precipitation dating back to the 1960s. Richards and Brimblecombe [7] found that the projected changes of climate pressure to heritage in this region were driven by increasing threats from WDR (Figure 6a,b) and a change in RH seasonality. Freetown could experience a 50% increase in the projected number of wind-driven days between 2015 and 2099 (Figure 6d).
The occurrence of pressures on timber heritage in Freetown was found to be seasonal. Wind-driven rain and ToW occurred most frequently in August and September, coinciding with the peak months of the rainy season (Figure 7). In contrast, salt transitions peak between February and June, during the dry season, associated with higher temperatures. With future increases in temperature and warmer weather in the rainy season, wood might dry more quickly between rain events, increasing the number of wetting–drying cycles, and thus driving mechanical damage. However, drier conditions could also reduce biological growth, altering the present balance between the drivers of deterioration. Such an outcome may mean that future conservation will need an increasing focus on addressing mechanical rather than biological damage.

3.3.2. Conservation Challenges

In addition to pressures caused by a shifting heritage climate, the board houses in Freetown face threats from the growing popularity of stone and concrete as building materials. Thus, the 20th century has seen a decline in the condition and number of board houses [47]. Furthermore, Sierra Leone faces many other challenges, which include widespread impoverishment, high levels of youth unemployment and poor infrastructure, along with disease outbreaks including Ebola, cholera and COVID-19 [84]. In this context, the conservation of vernacular-built heritage can easily be overlooked. However, as argued in a consultation report for the Sierra Leonean Ministry of Tourism and Cultural Affairs, cultural heritage is an integral part of the broader cultural life of a nation and can provide a vehicle for economic development, for building social cohesion and stability, for achieving environmental sustainability, and for fostering resilience in communities… that needs to be carefully managed and safeguarded through national legislation that is adequately supported and effectively implemented by the State [47] (p3).
These board houses critically require effective conservation, through the implementation of monitoring systems, maintenance and planning regulations [47]. The management of these sites could provide an opportunity to foster international relations between Sierra Leone and other countries facing similar heritage climate pressures and conservation challenges. Networks could be developed virtually, with online meetings and workshops becoming increasingly common since the COVID-19 pandemic.

3.4. Built Heritage of the Wet Tropics and Time of Wetness

It is easy to overlook built heritage in tropical areas as they are so widely recognised as being rich in natural heritage and biodiversity. The rainforests that characterise so much of the tropics reflect very warm and wet climates. These conditions place much pressure on the preservation of timber, as continuous high humidity takes its toll on organic materials. Major areas of tropical rain forests include the great river basins of the Amazon and the Congo along with the forests of Southeast Asia. The seasonal cycle of precipitation from these regions is shown in Figure 8. Total annual rainfall varies between regions, and often presents a distinct seasonal cycle. There are only slight trends (1901–2021) in the annual rainfall amount, which increases by 1 mm a−1 (p2 = 0.0025) in Amazonas, an insignificant 0.07 mm a−1 (p2~0.5) in the Congo and 1.6 mm a−1 (p2 = 0.08) in Sarawak, Malaysia. In earlier work [7], we gave a picture of a less humid tropical climate, with wider ranges of humidity, and reduced times of wetness (Figure 9), such that surfaces remain wet for shorter times [85].

3.4.1. Amazonia

Manaus (Brazil) and Iquitos (Peru) are Amazonian cities, notable for art, architecture and culture and were a backdrop for Werner Herzog’s film Fitzcarraldo (1982), where a misguided visionary is determined to attract funds for a new opera house in the Amazon. Additionally, other smaller municipalities have interesting heritage. In the upper Amazon, Tefé, has historic sites such as the Barreira das Missões. The town was the headquarters of the scientific commission (1781–91) that settled the Spanish–Portuguese boundaries and was a centre for subsequent exploration [86].
Tefé has a pronounced seasonal cycle in rainfall (Figure 10a), with more than 300 mm mth−1 March–May, through to as little as 100 mm mth−1 by August. This pattern follows the general climate of Amazonas State quite closely (Figure 8a). Esquivel-Muelbert et al. [87] have summarised the changing climate across the Amazonian region and suggest that, in recent decades, the dry season has been more intense. There have been repeated drought events and precipitation has declined in the south and south-east. However, precipitation has increased during the wet season, with episodes of extreme rainfall. As a result, ecological changes are observed in forests that have become increasingly dominated by large trees. The seasonal cycle of humidity in Amazonas from HadGEM3-GC31-MM shows that, in the future, RH is likely to decline, but there will be a more distinct seasonal cycle with April–June remaining humid (Figure 10b).
Less humid conditions, while seemingly advantageous for the protection of timber heritage from biological damage, would likely mean that wooden objects equilibrated to high humidity would lose water and contract. This could lead to cracks or the disruption of surface coatings [63,88]. In addition, shifts in seasonality can affect the times popular for visits and therefore might require adjustments to site management [89]. The future changes to climate could also mean the loss of some termites in Brazil, with less humid conditions potentially reducing the diversity of termites in tropical forests [90], e.g., a contraction of the range of Coptotermes formosanus, though there may be an expansion of other species such as Mastotermes darwiniensis [67].

3.4.2. Congo

In the Congo, Kisangani (formerly Stanleyville), the capital of Tshopo province, is a populous and important city. The city is relatively large (1.3 M), but the built heritage is often in poor condition and not part of the standard tourist itinerary [91]. The older colonial buildings are described on a website provided by Jean-Luc Ernst [92]. Iconic for some may be the dilapidated Villa Regina, where Katherine Hepburn and Humphrey Bogart stayed while John Huston’s The African Queen was filmed.
Figure 10c shows that the Congo may become generally less humid over the current century [7], doubtless taking its toll on insects and flora. In terms of precipitation, there has been no significant change over the last century (Figure 8e), and future projected change is highly uncertain, with changes ranging from −50% to +150% for the December–February dry season [93,94]. This uncertainty makes planning future management for timber heritage challenging, emphasising the urgent need for improved climate models for precipitation over Africa.

3.4.3. Sarawak

Sarawak is notable for its Dayak architecture (mainly longhouses with dwelling and communal areas) and many traditional shop houses (which have timber elements). Entirely of wood are the remaining buildings of the Batu Lintang POW camp (e.g., Punjabi Barracks) [95], as featured in Agnes Newton Keith’s autobiography Three Came Home.
In Borneo, annual rainfall is likely to increase [96], although, as with many regions in the tropics, there is much uncertainty. The seasonal RH in Sarawak seems set to marginally decline (Figure 10d) yet will remain high (~80%). Therefore, surfaces should continue to be damp for long periods under future climates, so here, a biological threat seems likely to persist. Increases in monthly rainfall have been observed in the Limbang River basin (1970–2015) [97], along with increases in short-term intensity [96]. These changes are projected to continue into the future [96], so surface flooding may form an important aspect of management plans.

4. Discussion

Our study shows how global-scale heritage climate pressures can be combined with information from a range of sources to describe the potential deterioration of timber heritage at a local scale. Assessing heritage from several locations allowed us to show that this process is challenging due to (i) limited data and availability; (ii) difficulties in converting environmental pressure to damage; and (iii) translation predictions of future risk to conservation management.

4.1. Data

On a global scale, the use of climate models to calculate heritage climate pressures provides worldwide coverage of the potential threat [7]. This enables researchers to undertake a global analysis, even if there has been little previous research, or limited available data at specific locations. This approach helps address geographical biases in heritage research, addressing issues raised by Simpson et al. [98]. The examples chosen in our study indicate that readily available local data make the translation of heritage pressures from global to local easier. For sites with detailed meteorological records, such as Harmondsworth Barn, it was possible to directly estimate climate pressures and assess potential drivers of deterioration (Figure 2c and Figure 3).
For timber heritage in regions where local data were harder to access, such as the board houses in Freetown and prisoner of war camp in Sarawak, translation from global to local scales required the judicious use of available information. Combining modelled data with information from grey literature, policy documents and archive sources, enabled us to develop a better local understanding of future site threats. However, available data may need careful adjustment, as seen with the board houses in Freetown. Here, the modelled output showed a sharp discontinuity in days of wind-driven rain between 2014 and 2015 (Figure 6c). Improved meteorological monitoring would help resolve such uncertainties, gaps and singularities to better assess risks to timber heritage at specific sites.

4.2. Damage

Quantifying the pressures affecting timber heritage sites provides an indication of the extent of potential damage. However, converting these pressures to damage requires an understanding of scale and process. In our examples, we see that multiple processes can operate individually or synergistically at a site, so focusing on a single damage pathway may not capture the complexity of the threat.
In heritage science, damage functions have commonly been used to convert environmental pressures to damage [12]. However, they are typically developed for historic materials rather than sites. Therefore, damage functions can seem to lack relevance at the site-scale as they include only a limited set of processes, which may not reflect the complexity of conditions at a site. Site-scale environmental pressures can be represented at high temporal and spatial resolution by computational fluid dynamics [99,100]. Such models are computationally expensive to run at the multi-decadal timescales used in this paper, but heritage-specific representations may be possible, especially with increasing computing power.

4.3. Action

The examples in this study also highlight the challenges of translating potential damage into conservation or management action. Future projections are associated with uncertainty, due to the quality of data, understanding of the process and additional unknowns. This can render findings unconvincing if the error is not explicitly addressed. Uncertainties frustrate the decision-making process, as different conservation actions could depend on the balance of such uncertainties. Furthermore, these can lead to distrust of models, potentially stalling action, when heritage managers need to take risky decisions about historic properties.
Protecting heritage against future climate shows parallels with the difficult translation of climate change research to climate change action [101]. This challenge creates a role for narrative in expressing heritage damage in terms of conservation actions and can be important in reducing hesitancy associated with uncertainty. The construction of evidence-based narratives enables researchers to envision a range of possible outcomes to present to stakeholders, such as politicians, funders and the general public. This could represent a powerful mechanism for improving public understanding of timber heritage, in a context relevant to visitors, managers and owners. This approach may also be a useful tool in targeting fieldwork efforts. Comparisons of early field observations with model outputs could act as a preliminary assessment of the need for further work. However, much field data are collected but are not readily accessible due to limited or dispersed publication venues for this form of information. The lack of a dedicated, well-indexed repository limits access to such information.

4.4. Effective Modelling

For models to be effective they need to be usable by those who need them [14]. This means for site-scale conservation, models need to be user-friendly and the output useful to those engaged with site management (e.g., site managers, non-professional heritage practitioners and volunteers). This requires models to be built with the end user requirements prioritised from the start, as otherwise, models of heritage pressures or damage can be impenetrable or highly complex to run. For example, in the case of Iowa, the management of numerous small buildings by local communities could benefit from the development of user-friendly models, with graphical interfaces that reveal local-scale damage, readily interpretable by those caring for the buildings.
Furthermore, when models are isolated from observations and local experience, their effectiveness can be reduced. When enriched with contextual information, the output becomes more specific to the site. As the availability of contextual data to enrich the model is highly variable between sites, flexibility is needed by researchers and conservators in determining what data are acceptable, requiring us to be judicious and potentially creative in utilising available information.

5. Conclusions

Global climate models are a powerful tool in providing a picture of climate across the next century, with outputs that can be tuned to represent a multiplicity of threats to heritage. Heritage is at a fine scale, so it is important to develop approaches to apply global output at the site level. It is challenging, but not impossible, to transfer the focus to local settings. The case studies show that model projections should not be taken in isolation but rather interfaced with a wide variety of local observations and other contextual information to incorporate multiple threats to heritage. At sites with limited information, researchers and practitioners should address the transfer of global to local scale through flexible and imaginative use of disparate quantitative and qualitative sources. This could include, for example, fieldwork observations, oral histories, site descriptions, photographs, films and guidebooks. Weaving together fragmentary understandings into a narrative could effectively communicate threat and uncertainty. Evidence-based narratives provide a mechanism to build trust in modelled outputs, broadening engagement with ideas about the interactions between climate change and heritage. We intend for the current study to promote discussion between heritage researchers, practitioners and managers. Particularly, similar threats facing local heritage in geographically disparate regions could encourage international collaboration between heritage practitioners and policy makers. Effective modelling remains a worthy challenge, yet it is important to remember, no prediction can ever be complete.

Supplementary Materials

The following supporting information can be downloaded at: https://www.mdpi.com/article/10.3390/heritage5040154/s1, Table S1: Copyright information for Figure 1; Figure S1. Scheffer index for Harmondsworth and Scotland; Table S2: Optimum climate conditions for organisms, based on English Heritage (2012) Practical Building Conservation. Timber; Figure S2: Modal month with the maximum monthly RH in the American Midwest for the periods (a) 1850–1879, (b) 1984–2013, (c) 2025–2054 and (d) 2070–2099; Figure S3: Isobar map of average annual rainfall (mm) in Sierra Leone sourced from the Sierra Leone Meteorological Agency.

Author Contributions

Conceptualization, P.B.; data curation, J.R.; formal analysis, P.B. and J.R.; investigation, P.B. and J.R.; methodology, P.B. and J.R.; software, J.R.; visualization, P.B. and J.R.; writing—original draft, P.B. and J.R.; writing—review and editing, P.B. and J.R. All authors have read and agreed to the published version of the manuscript.

Funding

This research received no external funding.

Data Availability Statement

Data are available from the links noted in the text.

Conflicts of Interest

The authors declare no conflict of interest.

References

  1. Sabbioni, C.; Brimblecombe, P.; Cassar, M. The Atlas Ofclimate Change Impact on European Cultural Heritage. In Scientific Analysis and Management Strategies; Anthem Press: London, UK, 2010. [Google Scholar]
  2. Howard, A.J.; Hancox, E.; Hanson, J.; Jackson, R. Protecting the Historic Environment from Inland Flooding in the UK: Some Thoughts on Current Approaches to Asset Management in the Light of Planning Policy, Changing Catchment Hydrology and Climate Change. Hist. Environ. Policy Pract. 2017, 8, 125–142. [Google Scholar] [CrossRef]
  3. Sesana, E.; Gagnon, A.S.; Ciantelli, C.; Cassar, J.; Hughes, J.J. Climate Change Impacts on Cultural Heritage: A Literature Review. WIREs Clim. Chang. 2021, 12, e710. [Google Scholar] [CrossRef]
  4. Brimblecombe, P.; Lankester, P. Long-Term Changes in Climate and Insect Damage in Historic Houses. Stud. Conserv. 2013, 58, 13–22. [Google Scholar] [CrossRef]
  5. Grossi, C.M.; Brimblecombe, P.; Menéndez, B.; Benavente, D.; Harris, I.; Déqué, M. Climatology of Salt Transitions and Implications for Stone Weathering. Sci. Total Environ. 2011, 409, 2577–2585. [Google Scholar] [CrossRef]
  6. Oguchi, C.T.; Yu, S. A Review of Theoretical Salt Weathering Studies for Stone Heritage. Prog. Earth Planet Sci. 2021, 8, 1–23. [Google Scholar] [CrossRef]
  7. Richards, J.; Brimblecombe, P. Moisture as a Driver of Long-Term Threats to Timber Heritage. Part I: Changing Heritage Climatology. Heritage 2022, 5, 1929–1946. [Google Scholar] [CrossRef]
  8. Brimblecombe, P. Refining Climate Change Threats to Heritage. J. Inst. Conserv. 2014, 37, 85–93. [Google Scholar] [CrossRef]
  9. Brimblecombe, P. Heritage Climatology. In Climate Change and Cultural Heritage; Lefevre, R.-A., Sabbioni, C., Eds.; Edipuglia: Bari, Italy, 2010; pp. 57–64. [Google Scholar]
  10. Orr, S.A.; Richards, J.; Fatorić, S. Climate Change and Cultural Heritage: A Systematic Literature Review (2016–2020). Hist. Environ. Policy Pract. 2021, 12, 434–477. [Google Scholar] [CrossRef]
  11. IPCC. Summary for Policymakers. In Climate Change 2021: The Physical Science Basis. Contribution of Working Group I to the Sixth Assessment Report of the Intergovernmental Panel on Climate Change; Masson-Delmotte, V., Zhai, P., Pirani, A., Connors, S.L., Péan, C., Berger, S., Caud, N., Chen, Y., Goldfarb, L., Gomis, M.I., et al., Eds.; Cambridge University Press: Cambridge, UK; New York, NY, USA, 2021; pp. 3–32. [Google Scholar]
  12. Strlič, M.; Thickett, D.; Taylor, J.; Cassar, M. Damage Functions in Heritage Science. Stud. Conserv. 2013, 58, 80–87. [Google Scholar] [CrossRef]
  13. Choidis, P.; Kraniotis, D.; Lehtonen, I.; Hellum, B. A Modelling Approach for the Assessment of Climate Change Impact on the Fungal Colonization of Historic Timber Structures. Forests 2021, 12, 819. [Google Scholar] [CrossRef]
  14. Richards, J.; Brimblecombe, P. The Transfer of Heritage Modelling from Research to Practice. Herit. Sci. 2022, 10, 1–10. [Google Scholar] [CrossRef]
  15. Cassar, M. Climate Change and the Historic Environment; Centre for Sustainable Heritage, University College London: London, UK, 2005; Available online: https://discovery.ucl.ac.uk/id/eprint/2082/1/2082.pdf (accessed on 21 August 2022).
  16. Brimblecombe, P.; Grossi, C.M.; Harris, I. The Effect of Long-Term Trends in Dampness on Historic Buildings. Weather 2006, 61, 278–281. [Google Scholar] [CrossRef]
  17. Brimblecombe, P.; Hayashi, M.; Futagami, Y. Mapping Climate Change, Natural Hazards and Tokyo’s Built Heritage. Atmosphere 2020, 11, 680. [Google Scholar] [CrossRef]
  18. Sardella, A.; Palazzi, E.; von Hardenberg, J.; del Grande, C.; de Nuntiis, P.D.; Sabbioni, C.; Bonazza, A. Risk Mapping for the Sustainable Protection of Cultural Heritage in Extreme Changing Environments. Atmosphere 2020, 11, 700. [Google Scholar] [CrossRef]
  19. Currie, A.; Sterelny, K. In Defence of Story-Telling. Stud. Hist. Philos. Sci. Part A 2017, 62, 14–21. [Google Scholar] [CrossRef] [PubMed]
  20. Corless, V. The Role of Narrative in Science. Available online: https://www.advancedsciencenews.com/the-role-of-narrative-in-science/ (accessed on 10 August 2022).
  21. Nerlich, B.; Koteyko, N.; Brown, B. Theory and Language of Climate Change Communication. WIREs Clim. Chang. 2010, 1, 97–110. [Google Scholar] [CrossRef]
  22. Pearce, W.; Brown, B.; Nerlich, B.; Koteyko, N. Communicating Climate Change: Conduits, Content, and Consensus. WIREs Clim. Chang. 2015, 6, 613–626. [Google Scholar] [CrossRef]
  23. Hulme, M. Why We Disagree about Climate Change: Understanding Controversy, Inaction and Opportunity; Cambridge University Press: Cambridge, UK, 2009. [Google Scholar]
  24. Matless, D. Climate Change Stories and the Anthroposcenic. Nat. Clim. Chang. 2016, 6, 118–119. [Google Scholar] [CrossRef] [Green Version]
  25. Wise, M.N. On the Narrative Form of Simulations. Stud. Hist. Philos. Sci. Part A 2017, 62, 74–85. [Google Scholar] [CrossRef] [PubMed]
  26. Brimblecombe, P. Climate Myths. In Climate Change and Cultural Heritage; Lefevre, R.-A., Sabbioni, C., Eds.; Edipuglia: Bari, Italy, 2010; pp. 207–209. [Google Scholar]
  27. Scheffer, T.C. A Climate Index for Estimating Potential for Decay in Wood Structures above Ground. For. Prod. J. 1971, 21, 25–31. [Google Scholar]
  28. Lisø, K.R.; Hygen, H.O.; Kvande, T.; Thue, J.V. Decay Potential in Wood Structures Using Climate Data. Build. Res. Inf. 2007, 34, 546–551. [Google Scholar] [CrossRef]
  29. Environmental Protection Agency. Seasonality and Climate Change: A Review of Observed Evidence in the United States; 2021. Available online: https://www.epa.gov/system/files/documents/2021-12/30339_epa_report_climate_change_and_seasonality_v12_release_508.pdf (accessed on 10 August 2022).
  30. Angel, J.; Swanston, C.; Boustead, B.M.; Conlon, K.C.; Hall, K.R.; Jorns, J.L.; Kunkel, K.E.; Lemos, M.C.; Lofgren, B.; Ontl, T.A.; et al. Midwest. In Impacts, Risks, and Adaptation in the United States: Fourth National Climate Assessment, Volume II (Report); Reidmiller, D.R., Avery, C.W., Easterling, D.R., Kunkel, K.E., Lewis, K.L.M., Maycock, T.K., Stewart, B.C., Eds.; U.S. Global Change Research Program: Washington, DC, USA, 2018; pp. 872–940. [Google Scholar]
  31. Tourism National Trust. National Trust How Climate Change Will Affect the Future of UK. Available online: https://www.nationaltrust.org.uk/features/how-climate-change-will-affect-the-future-of-uk-tourism (accessed on 17 August 2022).
  32. Todd, B. Reconstructing Long-Term Records of UK Drought and Analysis of Variability: 1697–2013. Ph.D. Thesis, University of Liverpool, Liverpool, UK, 2014. [Google Scholar]
  33. Parker, D.E.; Legg, T.P.; Folland, C.K. A New Daily Central England Temperature Series, 1772–1991. Int. J. Climatol. 1992, 12, 317–342. [Google Scholar] [CrossRef]
  34. Met Office. MIDAS Open: UK Daily Weather Observation Data, V202107; NERC EDS Centre for Environmental Data Analysis: Didcot, UK, 2021. [Google Scholar] [CrossRef]
  35. Met Office. MIDAS Open: UK Hourly Rainfall Data, V202107; NERC EDS Centre for Environmental Data Analysis: Didcot, UK, 2021. [Google Scholar] [CrossRef]
  36. Met Office. MIDAS Open: UK Daily Temperature Data, V202107; NERC EDS Centre for Environmental Data Analysis: Didcot, UK, 2021. [Google Scholar] [CrossRef]
  37. Brown, P.J.; Degaetano, A.T. Trends in U.S. Surface Humidity, 1930–2010. J. Appl. Meteorol. Climatol. 2013, 52, 147–163. [Google Scholar] [CrossRef]
  38. Feng, Z.; Leung, L.R.; Hagos, S.; Houze, R.A.; Burleyson, C.D.; Balaguru, K. More Frequent Intense and Long-Lived Storms Dominate the Springtime Trend in Central US Rainfall. Nat. Commun. 2016, 7, 1–8. [Google Scholar] [CrossRef] [Green Version]
  39. Sierra Leone Meteorological Agency. Sierra Leone Meteorological Agency. Available online: https://slmet.gov.sl/ (accessed on 17 August 2022).
  40. World Meteorological Organization. WMO Climate Normals. Available online: https://www.ncei.noaa.gov/products/wmo-climate-normals (accessed on 17 August 2022).
  41. Climatic Research Unit (University of East Anglia). High-Resolution Gridded Datasets. Available online: https://crudata.uea.ac.uk/cru/data/hrg/ (accessed on 17 August 2022).
  42. World Bank Group. Climate Change Knowledge Portal. Available online: https://climateknowledgeportal.worldbank.org/ (accessed on 17 August 2022).
  43. Weeks, K.D.; Look, D.W. Exterior Paint Problems on Historic Woodwork. Preserv. Briefs 1982, 10, 1–12. [Google Scholar]
  44. Sullivan, A.; Leeke, J. Preserving Historic Wood Porches. Preserv. Briefs 2006, 45, 1–20. [Google Scholar]
  45. Park, S.C. Holding the Line: Controlling Unwanted Moisture in Historic Buildings. Preserv. Briefs 1996, 39, 1–16. [Google Scholar]
  46. Park, S.C. The Repair and Replacement of Historic Wooden Shingle Roofs. Preserv. Briefs 1989, 19, 1–12. [Google Scholar]
  47. Basu, P.; Sam, M.A. Review of the Monuments and Relics Act and Recommendations for New Heritage Legislation for Sierra Leone, Consultation Report; The Ministry of Tourism and Cultural Affairs and Monuments and Relics Commission, Government of Sierra Leone: Freetown, Sierra Leone, 2016. [Google Scholar]
  48. English Heritage. Harmondsworth Barn. Available online: https://www.english-heritage.org.uk/visit/places/harmondsworth-barn/ (accessed on 17 August 2022).
  49. American Gothic. House Center American Gothic House Center. Available online: https://americangothichouse.org/ (accessed on 17 August 2022).
  50. Sierra Leone National Tourist Board. Historical and Heritage Sites. Available online: https://ntb.gov.sl/historical-and-heritage-sites/# (accessed on 17 August 2022).
  51. English Heritage. Practical Building Conservation. Timber; Routledge: Abingdon, UK, 2012. [Google Scholar]
  52. Historic England. The Great Barn, Harmondsworth. Available online: https://historicengland.org.uk/listing/the-list/list-entry/1194332?section=official-list-entry (accessed on 17 August 2022).
  53. Society for the Protection of Ancient Buildings. Harmondsworth Barn. Who Will Save the ‘Cathedral of Middlesex’? Available online: https://web.archive.org/web/20120214143758/http://www.spab.org.uk/cornerstone-magazine/news/harmondsworth-barn/ (accessed on 17 August 2022).
  54. Brimblecombe, P. Air Pollution and Architecture: Past, Present and Future. J. Archit. Conserv. 2000, 6, 30–46. [Google Scholar] [CrossRef]
  55. Andrews, D.P.; Bedford, J.; Bryan, P.G. A Comparison of Laser Scanning and Structure from Motion as Applied to the Great Barn at Harmondsworth, UK. Int. Arch. Photogramm. Remote Sens. Spat. Inf. Sci. 2013, XL-5/W2, 31–36. [Google Scholar] [CrossRef] [Green Version]
  56. Frankson, R.; Kunkel, K.E.; Champion, S.M.; Runkle, J. Iowa State Climate Summary 2022; NOAA Technical Report NESDIS 150-IA; NOAA/NESDIS: Silver Spring, MD, USA, 2022. [Google Scholar]
  57. Feehan, J. Train Depot Move on Track. Available online: https://www.toledoblade.com/frontpage/2005/06/23/Train-depot-move-on-track.html (accessed on 10 August 2022).
  58. Pope, M.K.; Sievert, A.K.; Sievert, S.L. From Pioneer to Tourist: Public Archaeology at Spring Mill State Park. Int. J. Hist. Archaeol. 2011, 15, 206–221. [Google Scholar] [CrossRef]
  59. The Prairie School Traveler. The Prairie School Traveler. Available online: https://www.prairieschooltraveler.com/html/wi/jumpriver/jumpriver.html (accessed on 10 August 2022).
  60. Caba, S. “Gothic” House Being Refurbished. The Cedar Rapids Gazette, 20 June 1976. [Google Scholar]
  61. Wurtz, R.L. Constructing Identities in the West Branch Landscape: Herbert Hoover’s Life and Legacy as a Common Man, 1935–1992. Master’s Thesis, University of Northern Iowa, Cedar Falls, IA, USA, 2017. [Google Scholar]
  62. Lankester, P.; Brimblecombe, P. The Impact of Future Climate on Historic Interiors. Sci. Total Environ. 2012, 417–418, 248–254. [Google Scholar] [CrossRef] [PubMed]
  63. Bratasz, Ł.; Harris, I.; Lasyk, Ł.; Łukomski, M.; Kozłowski, R. Future Climate-Induced Pressures on Painted Wood. J. Cult. Herit. 2012, 13, 365–370. [Google Scholar] [CrossRef]
  64. Jacobs, J.L.; Thakur, R. How Advances in Algae-Resistant Roofing Address the Growing Roof Algae Problem. In Proceeding of the Fourth International Symposium on Roofing technology, National Roofing Contractors Association, Gaithersburg, MD, USA, 17–19 September 1997; pp. 99–103. [Google Scholar]
  65. Berdahl, P.; Akbari, H.; Levinson, R.; Miller, W.A. Weathering of Roofing Materials—An Overview. Constr. Build. Mater. 2008, 22, 423–433. [Google Scholar] [CrossRef] [Green Version]
  66. Ortega-Morales, O.; Montero-Muñoz, J.L.; Baptista Neto, J.A.; Beech, I.B.; Sunner, J.; Gaylarde, C. Deterioration and Microbial Colonization of Cultural Heritage Stone Buildings in Polluted and Unpolluted Tropical and Subtropical Climates: A Meta-Analysis. Int. Biodeterior. Biodegrad. 2019, 143, 104734. [Google Scholar] [CrossRef]
  67. Buczkowski, G.; Bertelsmeier, C. Invasive Termites in a Changing Climate: A Global Perspective. Ecol. Evol. 2017, 7, 974–985. [Google Scholar] [CrossRef]
  68. Ludwikowski, J.J.; Peterson, E.W. Transport and Fate of Chloride from Road Salt within a Mixed Urban and Agricultural Watershed in Illinois (USA): Assessing the Influence of Chloride Application Rates. Hydrogeol. J. 2018, 26, 1123–1135. [Google Scholar] [CrossRef]
  69. Halda, B.J. Doors Number 1, 1989. Available online: https://www.nps.gov/tps/how-to-preserve/tech-notes/Tech-Notes-Doors01.pdf (accessed on 21 August 2022).
  70. Powerwash. Roof Cleaning Market Profitability. Available online: https://powerwash.com/spray-tips/roof-cleaning-market-profitability/ (accessed on 10 August 2022).
  71. Anderson Pest Solutions. Where Do Termites Live? Midwestern Termites. Available online: https://andersonpestsolutions.com/termites/identification/where-do-termites-live/ (accessed on 19 August 2022).
  72. Levinson, R.; Berdahl, P.; Asefaw Berhe, A.; Akbari, H. Effects of Soiling and Cleaning on the Reflectance and Solar Heat Gain of a Light-Colored Roofing Membrane. Atmos. Environ. 2005, 39, 7807–7824. [Google Scholar] [CrossRef]
  73. Thomas, C. Matching New Tiles to Old. Available online: http://www.roofconsult.co.uk/articles/tiling/tips6.htm (accessed on 10 August 2022).
  74. Busby, J.W.; Smith, T.G.; White, K.L.; Strange, S.M. Climate Change and Insecurity: Mapping Vulnerability in Africa. Int. Secur. 2013, 37, 132–172. [Google Scholar] [CrossRef]
  75. Busby, J.W.; Cook, K.H.; Vizy, E.K.; Smith, T.G.; Bekalo, M. Identifying Hot Spots of Security Vulnerability Associated with Climate Change in Africa. Clim. Chang. 2014, 124, 717–731. [Google Scholar] [CrossRef]
  76. Akinsanola, A.A.; Zhou, W. Projections of West African Summer Monsoon Rainfall Extremes from Two CORDEX Models. Clim. Dyn. 2019, 52, 2017–2028. [Google Scholar] [CrossRef]
  77. Dosio, A.; Turner, A.G.; Tamoffo, A.T.; Sylla, M.B.; Lennard, C.; Jones, R.G.; Terray, L.; Nikulin, G.; Hewitson, B. A Tale of Two Futures: Contrasting Scenarios of Future Precipitation for West Africa from an Ensemble of Regional Climate Models. Environ. Res. Lett. 2020, 15, 064007. [Google Scholar] [CrossRef]
  78. Macarthy, J.M. Integrating Climate Change Considerations in Planning for Urban Development in Sierra Leone: The Case of Freetown. Ph.D. Thesis, Newcastle University, Newcastle upon Tyne, UK, 2012. [Google Scholar]
  79. Sierra Leone Heritage. Sierra Leone Heritage. Available online: https://www.sierraleoneheritage.org/ (accessed on 17 August 2022).
  80. Basu, P. OBJECT DIASPORAS, RESOURCING COMMUNITIES: Sierra Leonean Collections in the Global Museumscape. Mus. Anthropol. 2011, 34, 28–42. [Google Scholar] [CrossRef]
  81. Akam, S. Freetown’s Wood Homes a Link to Sierra Leone’s Past Reuters. Available online: https://www.reuters.com/article/us-sierraleone-architecture-idUSBRE8420IO20120503 (accessed on 2 August 2022).
  82. Taylor, E.T.; Kamara, I.S.; Bockarie, A. Rainfall Pattern in Freetown, Sierra Leone: From a Retrospective Viewpoint. In Proceedings of the International Conference ADAPT to CLIMATE, Nicosia, Cyprus, 27–28 March 2014; pp. 1–8. [Google Scholar]
  83. Climate-Data. Climate Data for Cities Worldwide. Available online: https://en.climate-data.org/ (accessed on 17 August 2022).
  84. World Bank Group. Sierra Leone Overview. Available online: https://www.worldbank.org/en/country/sierraleone/overview (accessed on 17 August 2022).
  85. Corvo, F.; Pérez, T.; Martin, Y.; Reyes, J.; Dzib, L.R.; González-Sánchez, J.; Castañeda, A. Time of Wetness in Tropical Climate: Considerations on the Estimation of TOW According to ISO 9223 Standard. Corros. Sci. 2008, 50, 206–219. [Google Scholar] [CrossRef]
  86. Bates, H.W. The Naturalist on the River Amazons, a Record of Adventures, Habits of Animals, Sketches of Brazilian and Indian Life and Aspects of Nature under the Equator during Eleven Years of Travel; John Murray: London, UK, 1863. [Google Scholar]
  87. Esquivel-Muelbert, A.; Baker, T.R.; Dexter, K.G.; Lewis, S.L.; Brienen, R.J.W.; Feldpausch, T.R.; Lloyd, J.; Monteagudo-Mendoza, A.; Arroyo, L.; Álvarez-Dávila, E.; et al. Compositional Response of Amazon Forests to Climate Change. Glob. Chang. Biol. 2019, 25, 39–56. [Google Scholar] [CrossRef] [Green Version]
  88. Lee, D.S.-H.; KIM, N.-S.; Scharff, M.; Nielsen, A.V.; Mecklenburg, M.; Fuster-López, L.; Bratasz, L.; Andersen, C.K. Numerical Modelling of Mechanical Degradation of Canvas Paintings under Desiccation. Herit. Sci. 2022, 10, 1–13. [Google Scholar] [CrossRef]
  89. Brimblecombe, P. Visitor Responses and Climate Change. In Cultural Heritage from Pollution to Climate Change; Lefevre, R., Sabbioni, C., Eds.; Edipuglia: Bari, Italy, 2016; pp. 73–80. [Google Scholar]
  90. Woon, J.S.; Boyle, M.J.W.; Ewers, R.M.; Chung, A.; Eggleton, P. Termite Environmental Tolerances Are More Linked to Desiccation than Temperature in Modified Tropical Forests. Insectes Soc. 2019, 66, 57–64. [Google Scholar] [CrossRef] [Green Version]
  91. Omasombo, J. Kisangani: A City at Its Lowest Ebb. In Urban Africa. Changing Contours of Surviving in the City; Abdoumaliq, S., Abdelghani, A., Eds.; CODESRIA Books: Dakar, Senegal; Zed Books: London, UK; University of South Africa Press: Pretoria, South Africa, 2005; pp. 96–119. [Google Scholar]
  92. Ernst, J.-L. Stanleyville, Kisangani. Available online: http://www.stanleyville.be/index.html (accessed on 18 August 2022).
  93. Creese, A.; Washington, R.; Jones, R. Climate Change in the Congo Basin: Processes Related to Wetting in the December–February Dry Season. Clim. Dyn. 2019, 53, 3583–3602. [Google Scholar] [CrossRef] [Green Version]
  94. Saeed, F.; Haensler, A.; Weber, T.; Hagemann, S.; Jacob, D. Representation of Extreme Precipitation Events Leading to Opposite Climate Change Signals over the Congo Basin. Atmosphere 2013, 4, 254–271. [Google Scholar] [CrossRef] [Green Version]
  95. Ooi, K.G. Japanese Empire in the Tropics: Selected Documents and Reports of the Japanese Period in Sarawak, Northwest Borneo, 1941–1945; Ohio University Center for International Studies: Athens, OH, USA, 1998. [Google Scholar]
  96. Sa’adi, Z.; Shahid, S.; Chung, E.S.; Ismail, B.T. Projection of Spatial and Temporal Changes of Rainfall in Sarawak of Borneo Island Using Statistical Downscaling of CMIP5 Models. Atmos. Res. 2017, 197, 446–460. [Google Scholar] [CrossRef]
  97. Krishnan, M.V.N.; Prasanna, M.V.; Vijith, H. Statistical Analysis of Trends in Monthly Precipitation at the Limbang River Basin, Sarawak (NW Borneo), Malaysia. Meteorol. Atmos. Phys. 2019, 131, 883–896. [Google Scholar] [CrossRef]
  98. Simpson, N.P.; Clarke, J.; Orr, S.A.; Cundill, G.; Orlove, B.; Fatorić, S.; Sabour, S.; Khalaf, N.; Rockman, M.; Pinho, P.; et al. Decolonizing Climate Change–Heritage Research. Nat. Clim. Chang. 2022 2022, 1–4. [Google Scholar] [CrossRef]
  99. Balocco, C.; Petrone, G.; Maggi, O.; Pasquariello, G.; Albertini, R.; Pasquarella, C. Indoor Microclimatic Study for Cultural Heritage Protection and Preventive Conservation in the Palatina Library. J. Cult. Herit. 2016, 22, 956–967. [Google Scholar] [CrossRef]
  100. Pineda, P.; Iranzo, A. Analysis of Sand-Loaded Air Flow Erosion in Heritage Sites by Computational Fluid Dynamics: Method and Damage Prediction. J. Cult. Herit. 2017, 25, 75–86. [Google Scholar] [CrossRef]
  101. Masson, T.; Fritsche, I. We Need Climate Change Mitigation and Climate Change Mitigation Needs the ‘We’: A State-of-the-Art Review of Social Identity Effects Motivating Climate Change Action. Curr. Opin. Behav. Sci. 2021, 42, 89–96. [Google Scholar] [CrossRef]
Figure 1. Map of key areas and photographs of sites discussed in this work. (a) Map of Midwestern USA; (b) painting American Gothic by Grant Wood, 1930; (c) Dibble House in Eldon, Iowa; (d) Harmondsworth Great Barn in Hillingdon Borough, London; (e) map showing barn location; (f) map of Sierra Leone; (g) old board house in Freetown; (h) map of the Congo; (i) map of the Upper Amazon; (j) map of Borneo; (k) Punjabi Barracks at Batu Lintang Camp, Kuching. Notes: Copyright details are in Supplementary Information Table S1.
Heritage 05 00154 g001
Figure 2. (a) Scheffer index for Western Europe, 1850–1879 and (b) the change in Scheffer index for this region between 2070–2099 and 1850–1879. (c) Annual Scheffer index for Harmondsworth calculated using (i) observed daily data from Heathrow 1950–2020 (blue) and (ii) modelled daily output from HadGEM3-GC31-MM 1850–2099 (grey). The modelled output is the mean of values from the nine grid cells centred on Heathrow, with error bars a standard deviation from the mean. Theil–Sen trends are fitted for the observed data (1950–2020) as a blue line with slope 0.45 a−1 (τ = 0.42); the modelled output (1950–2020) as a grey line with slope 0.13 a−1 (τ = 0.17); and the modelled output (1850–2099) as a grey dotted line with slope 0.06 a−1 (τ = 0.29).
Heritage 05 00154 g002
Figure 3. The percentage of time per year spent in optimal conditions between 1950 and 2020 for (a) the powderpost beetle; (b) house longhorn beetle, (c) deathwatch beetle, (d) dry rot, (e) cellar rot and (f) oak rot, with lines showing Theil–Sen slopes.
Heritage 05 00154 g003
Figure 4. The mean percentage of time per month spent in optimal conditions for (a) dry rot, (b) deathwatch beetle, per decade. Error bars show one standard deviation from the mean.
Heritage 05 00154 g004
Figure 5. Mean annual RH range (ΔRHa) for the periods (a) 1850–1879 and (b) 2070–2099 and (c) the difference between 2070–2099 and 1850–1879, from the HadGEM3 model data in the CMIP6 ensemble (HadGEM3-GC31-MM).
Heritage 05 00154 g005
Figure 6. (a) Days of wind-driven rain per year for West Africa, 1850–1879 and (b) the change in days of wind-driven rain for this region between 2070–2099 and 1850–1879. (c) Number of days per year for Freetown where rain is >4 mm (blue) and mean wind speed is >2 m s−1 (red). The adjusted wind speed (2015–2099) is shown in pink. (d) Annual number of wind-driven rain days for Freetown calculated using the non-adjusted (light grey) and adjusted (dark grey) inputs. The output is the mean of values from the nine grid cells around Freetown, with error bars showing one standard deviation from the mean.
Heritage 05 00154 g006
Figure 7. Freetown’s (a) average monthly temperature and rainfall (1991–2021—raw data from [83]) and (b) days of wind-driven rain, red; time of wetness in days, blue; and salt transitions, green (1984–2013).
Heritage 05 00154 g007
Figure 8. Seasonal cycles of precipitation averaged across 30 years (1992–2021) for (a) Amazonas State, Brazil, (b) Maniema Province, Democratic Republic of Congo and (c) Sarawak, a Malaysian state on the island of Borneo. Annual rainfall (1901–2021) shown for (d) Amazonas, (e) Maniema and (f) Sarawak. Datasets: [41,42].
Heritage 05 00154 g008
Figure 9. The time of wetness in days (a) 1850–1879 and (b) 2070–2099.
Heritage 05 00154 g009
Figure 10. (a) Average monthly relative humidity (RH%) in Tefé, Amazonas 1961–1990. The 30-year mean monthly relative humidity (RH%) for the time periods 1850–1879 (grey), 1984–2013 (blue), 2025–2054 (yellow) and 2070–2099 (red) for (b) Amazonas, (c) the Congo Basin (d) and Sarawak. Error bars show one standard deviation from the mean.
Heritage 05 00154 g010
Publisher’s Note: MDPI stays neutral with regard to jurisdictional claims in published maps and institutional affiliations.

