Article

Rapid and Accurate Production of 3D Point Cloud via Latest-Generation Sensors in the Field of Cultural Heritage: A Comparison between SLAM and Spherical Videogrammetry

by
Massimiliano Pepe
1,*,
Vincenzo Saverio Alfio
1,
Domenica Costantino
1 and
Sorin Herban
2
1
Dipartimento di Ingegneria Civile, Ambientale, del Territorio, Edile e di Chimica, Polytechnic University of Bari, Via E. Orabona 4, 70125 Bari, Italy
2
Department of Ground Communications, Foundations and Cadastre, Faculty of Civil Engineering, Politehnica University of Timisoara, Traian Lalescu 2°, 300223 Timisoara, Romania
*
Author to whom correspondence should be addressed.
Heritage 2022, 5(3), 1910-1928; https://doi.org/10.3390/heritage5030099
Submission received: 27 June 2022 / Revised: 26 July 2022 / Accepted: 27 July 2022 / Published: 29 July 2022
(This article belongs to the Special Issue 3D Modeling for Cultural Heritage and Applications)

Abstract

:
The manuscript intends to describe different methodologies for the acquisition, data processing, and identification of strategies aimed at improving the quality of 3D point cloud production using latest-generation sensors in the field of cultural heritage surveying. The point clouds taken into consideration were acquired by passive and active sensors on the Buziaș site, an important historical and architectural structure in Romania. In particular, a spherical camera (Ricoh Theta Z1) was used in order to obtain a video; subsequently, starting from the video, more datasets were extracted and processed in a photogrammetric software based on Structure from Motion and Multi View Stereo algorithms. In addition, a Simultaneous Localization And Mapping (SLAM) sensor (ZEB Revo RT) was used in order to generate a point cloud. The different point clouds produced were compared with the data obtained through a Terrestrial Laser Scanner (TLS) survey. Statistical analyses were carried out to check and validate the results obtained from the comparison between the different techniques and data acquisition methods. The statistical analysis showed that the model obtained with the GeoSLAM was metrically more accurate and detailed than the point cloud generated by the videogrammetric processing highlighted in this study. The paper also analyzes the performance of the three different sensors used, including parameters such as acquisition (timing and ease of use), processing (timing and ease of use), results (accuracy, resolution, and chromatic quality), and costs (instrumental and operator).

1. Introduction

To conserve and preserve cultural heritage, the use of techniques and sensors for the 3D reconstruction of structures and sites of historical, artistic, and cultural interest in different parts of the world is a compelling research topic. For the digitization and documentation of cultural heritage, it is necessary to identify suitable techniques and strategies capable of building 3D models in the shortest possible time, documenting the state of conservation from a geometric and qualitative point of view.
The 3D models can be performed using image-based 3D modelling (IBM) or range-based modelling (RBM) [1].
IBM methods use measurements of 2D images (generated by a passive sensor) in order to obtain 3D models. In recent years, a very successful approach in the construction of 3D models has been the one based on the Structure from Motion (SfM) and Multi-View Stereo (MVS) algorithms [2,3,4,5]. In order to speed up the image acquisition phase, the use of video is a challenging problem and has been an important research topic in the areas of photogrammetry and computer vision in recent years [6,7]. This stems from the enormous potential of this technique to acquire and cover large areas in a short time and the enormous progress made in the field of photogrammetry–computer vision in 3D reconstruction of objects using images. In addition, the development of high-performance low-cost sensors has enabled use in various fields of application. The process of building 3D models for photogrammetric purposes using a sequence of images from video is known as videogrammetry [8]. Over the years, sensors and their formats have undergone rapid improvement. In 2005, Digital Cinema Initiatives (DCI) published the Digital Cinema System Specification, which establishes the standardized 2K and 4K container formats, with resolutions of 2048 × 1080 pixels and 4096 × 2160 pixels, respectively. The resolution of the video content inside follows the SMPTE 428-1 standard, which establishes the following resolutions for 4K distribution: (i) 4096 × 2160 pixels, full frame, 256:135 or ≈1.90:1 aspect ratio; (ii) 3996 × 2160 pixel, flat crop, 1.85:1 aspect ratio; and (iii) 4096 × 1716 pixels, CinemaScope crop, ≈2.39:1 aspect ratio. The 6K and 8K video resolution cameras are starting to be found in the market at a professional camera level, and consumer-grade 6K and 8K cameras are expected to become popular in the near future [9]. Brilakis et al. [10] wrote about 3D as-built documentation; the proposed framework includes the following five steps: (i) stereo camera set calibration, (ii) feature set detection and matching, (iii) structure and motion recovery, (iv) stereo mapping, and (v) intelligent data smoothing. Singh et al. [11] explored the potential of the standard Sony DSC HX7V digital video camera and using Agisoft Photoscan software for 3D virtual city modelling. Alsadik et al. [12] developed a method to find the minimal significant number of video images in terms of object coverage and blur effect; this reduction in video images is convenient to decrease processing time and to create a reliable textured 3D model compared with models produced by still imaging. Murtiyoso et al. [13] showed how with the right workflow, by integrating low-cost imaging sensors with modern sensors found on smartphones, it is possible through a videogrammetric approach to scan and reconstruct three-dimensional models useful for cultural heritage documentation. Through a comparison with digital single lens reflex (DSLR) cameras, this latter study showed how a good compromise between geometric quality and overall cost can be achieved in the context of 3D documentation and reconstruction of CH. In order to document three different areas of the archaeological site “House of the Mithraeum” in the city of Mérida (Spain), Ortiz-Coder et al. [14] developed a prototype consisting of two cameras (a high-resolution camera and a video graphics array (VGA) camera); this prototype is connected to a tablet capable of implementing a guidance system to control the trajectory and allow highly flexible and long-lasting movements. The results of this latter experimentation showed similar accuracies and a shorter acquisition time than terrestrial laser scanning in the 3D reconstruction of the point cloud.
The development of immersive video, i.e., a video involving capturing a live-action scene that presents a 360° field of view, made it possible to cover large areas in a short amount of time. Kwiatek and Tokarczyk [15] discussed two applications of immersive video in photogrammetry. Firstly, the creation of a low-cost mobile mapping system based on Ladybug®3 and a Global Positioning System (GPS) device was discussed. The second approach was a generation of 3D video-based reconstructions of heritage sites based on immersive video (structure from immersive video); a mobile camera mounted on a tripod dolly was used to record the interior setting, and immersive video, separated into thousands of still panoramas, was converted from video into 3D objects using Agisoft Photoscan Professional. Sun and Zhang [16] used BLK360 and photogrammetry to create 3D models in order to assess the accuracy of videogrammetry applied to small settings of architectural heritage; the results show that the relative accuracy (median absolute errors/object dimensions) of spherical camera videogrammetry ranged from 1/500 to 1/2000, catering to the surveying and mapping of architectural heritage with medium accuracy and resolution.
Another technique used for the construction of the 3D point cloud is the one based on the direct measurement of three-dimensional geometric information of the object using active sensors [17,18]. An example of range-based technique is the Terrestrial Laser Scanner (TLS), which provides multiple advantages: (i) high accuracy; (ii) a large number of points forming an almost continuous surface; (iii) a high level of automation of the measurements; (iv) the possibility of recording the reflectance intensity of the laser beam, which could be used to investigate the properties of the analyzed object; and (v) the possibility of measuring unstructured areas [19]. However, TLS is rather expensive and obtains data statically [20]. In recent years, in order to increase the acquisition speed and find a system cheaper than TLS, a new range-based technique called Simultaneous Localization and Mapping (SLAM) has been developed [21]. Using SLAM algorithms, a device can simultaneously localize (locate itself on the map) and map (create a virtual location map). SLAM devices are fast for data collection because they are mostly handheld or backpacked, and the data collection only requires walking around the setting [22]. In general, there are two types of technological components used to implement SLAM: front- and back-end processes. Front-end processes include sensors, whereas back-end processes include mapping, localization, data fusion, and actuation, as shown in Figure 1 [23].
Two different methods of SLAM based on the front-end processing component are visual SLAM and SLAM LiDAR (Light Detection and Ranging). Visual SLAM (or vSLAM) uses images acquired from cameras and other image sensors. Visual SLAM can use simple cameras (wide-angle, fisheye, and spherical cameras), compound eye cameras (stereo and multi cameras), and RGB-D cameras (depth and ToF cameras). SLAM LiDAR, instead, is based on LiDAR measurement, which is a method that mainly uses a distance sensor. A LiDAR-based SLAM system uses a laser sensor to generate a 3D map of the setting. LiDAR measures the distance to an object by illuminating the object using an active laser “pulse” [24]. As regards accuracy, Maboudi et al. [25] showed that the standard deviation of the distances between the point cloud generated by a SLAM sensor (Zeb-Revo, which is a handheld 3D mapping scanner from GeoSLAM with a scan rate higher than 40,000 points per second and 30 m range indoors) and the one generated by Leica P20 TLS (reference of the comparison) was about 11 mm. Similarly, Oniga et al. [26] found a standard deviation of 1.6 cm from the comparison of the point clouds, one generated by TLS and another by GeoSLAM ZEB Revo RT; in addition, through the comparison between the cross-sections extracted from the point clouds, the authors found that 80% of the sigma values were less than or equal to 1 cm. In the field of CH, Hess et al. [27]—exploiting SLAM technology capable of using the sequence of data acquired during movement to estimate relative position in real time and, in particular, using the ZEB Horizon GeoSLAM sensor—analyzed geometrically and quantitatively the architectural typologies of Cistercian gardens in the context of a designated cultural landscape, located in Franconia (Bavaria, Germany). The experiments conducted in this research showed that this methodology has great potential not only in 3D reconstruction but also to provide valuable technical and scientific support in the monitoring, digital conservation, and sharing of cultural heritage. Zhang et al. [28], for the documentation of a cultural heritage site (Turkish palace at the Seraya site—Nazareth, Israel), investigated methods to reduce noisy responses in order to improve data quality and highlight the underlying structure. Indeed, by using bilateral filtering based on point cloud normals and introducing new concepts of normal-based preservation, the authors showed the possibility of producing a more visually pleasing entity description and performing subsequent processing, including feature extraction and semantic segmentation.

1.1. Aim of Paper

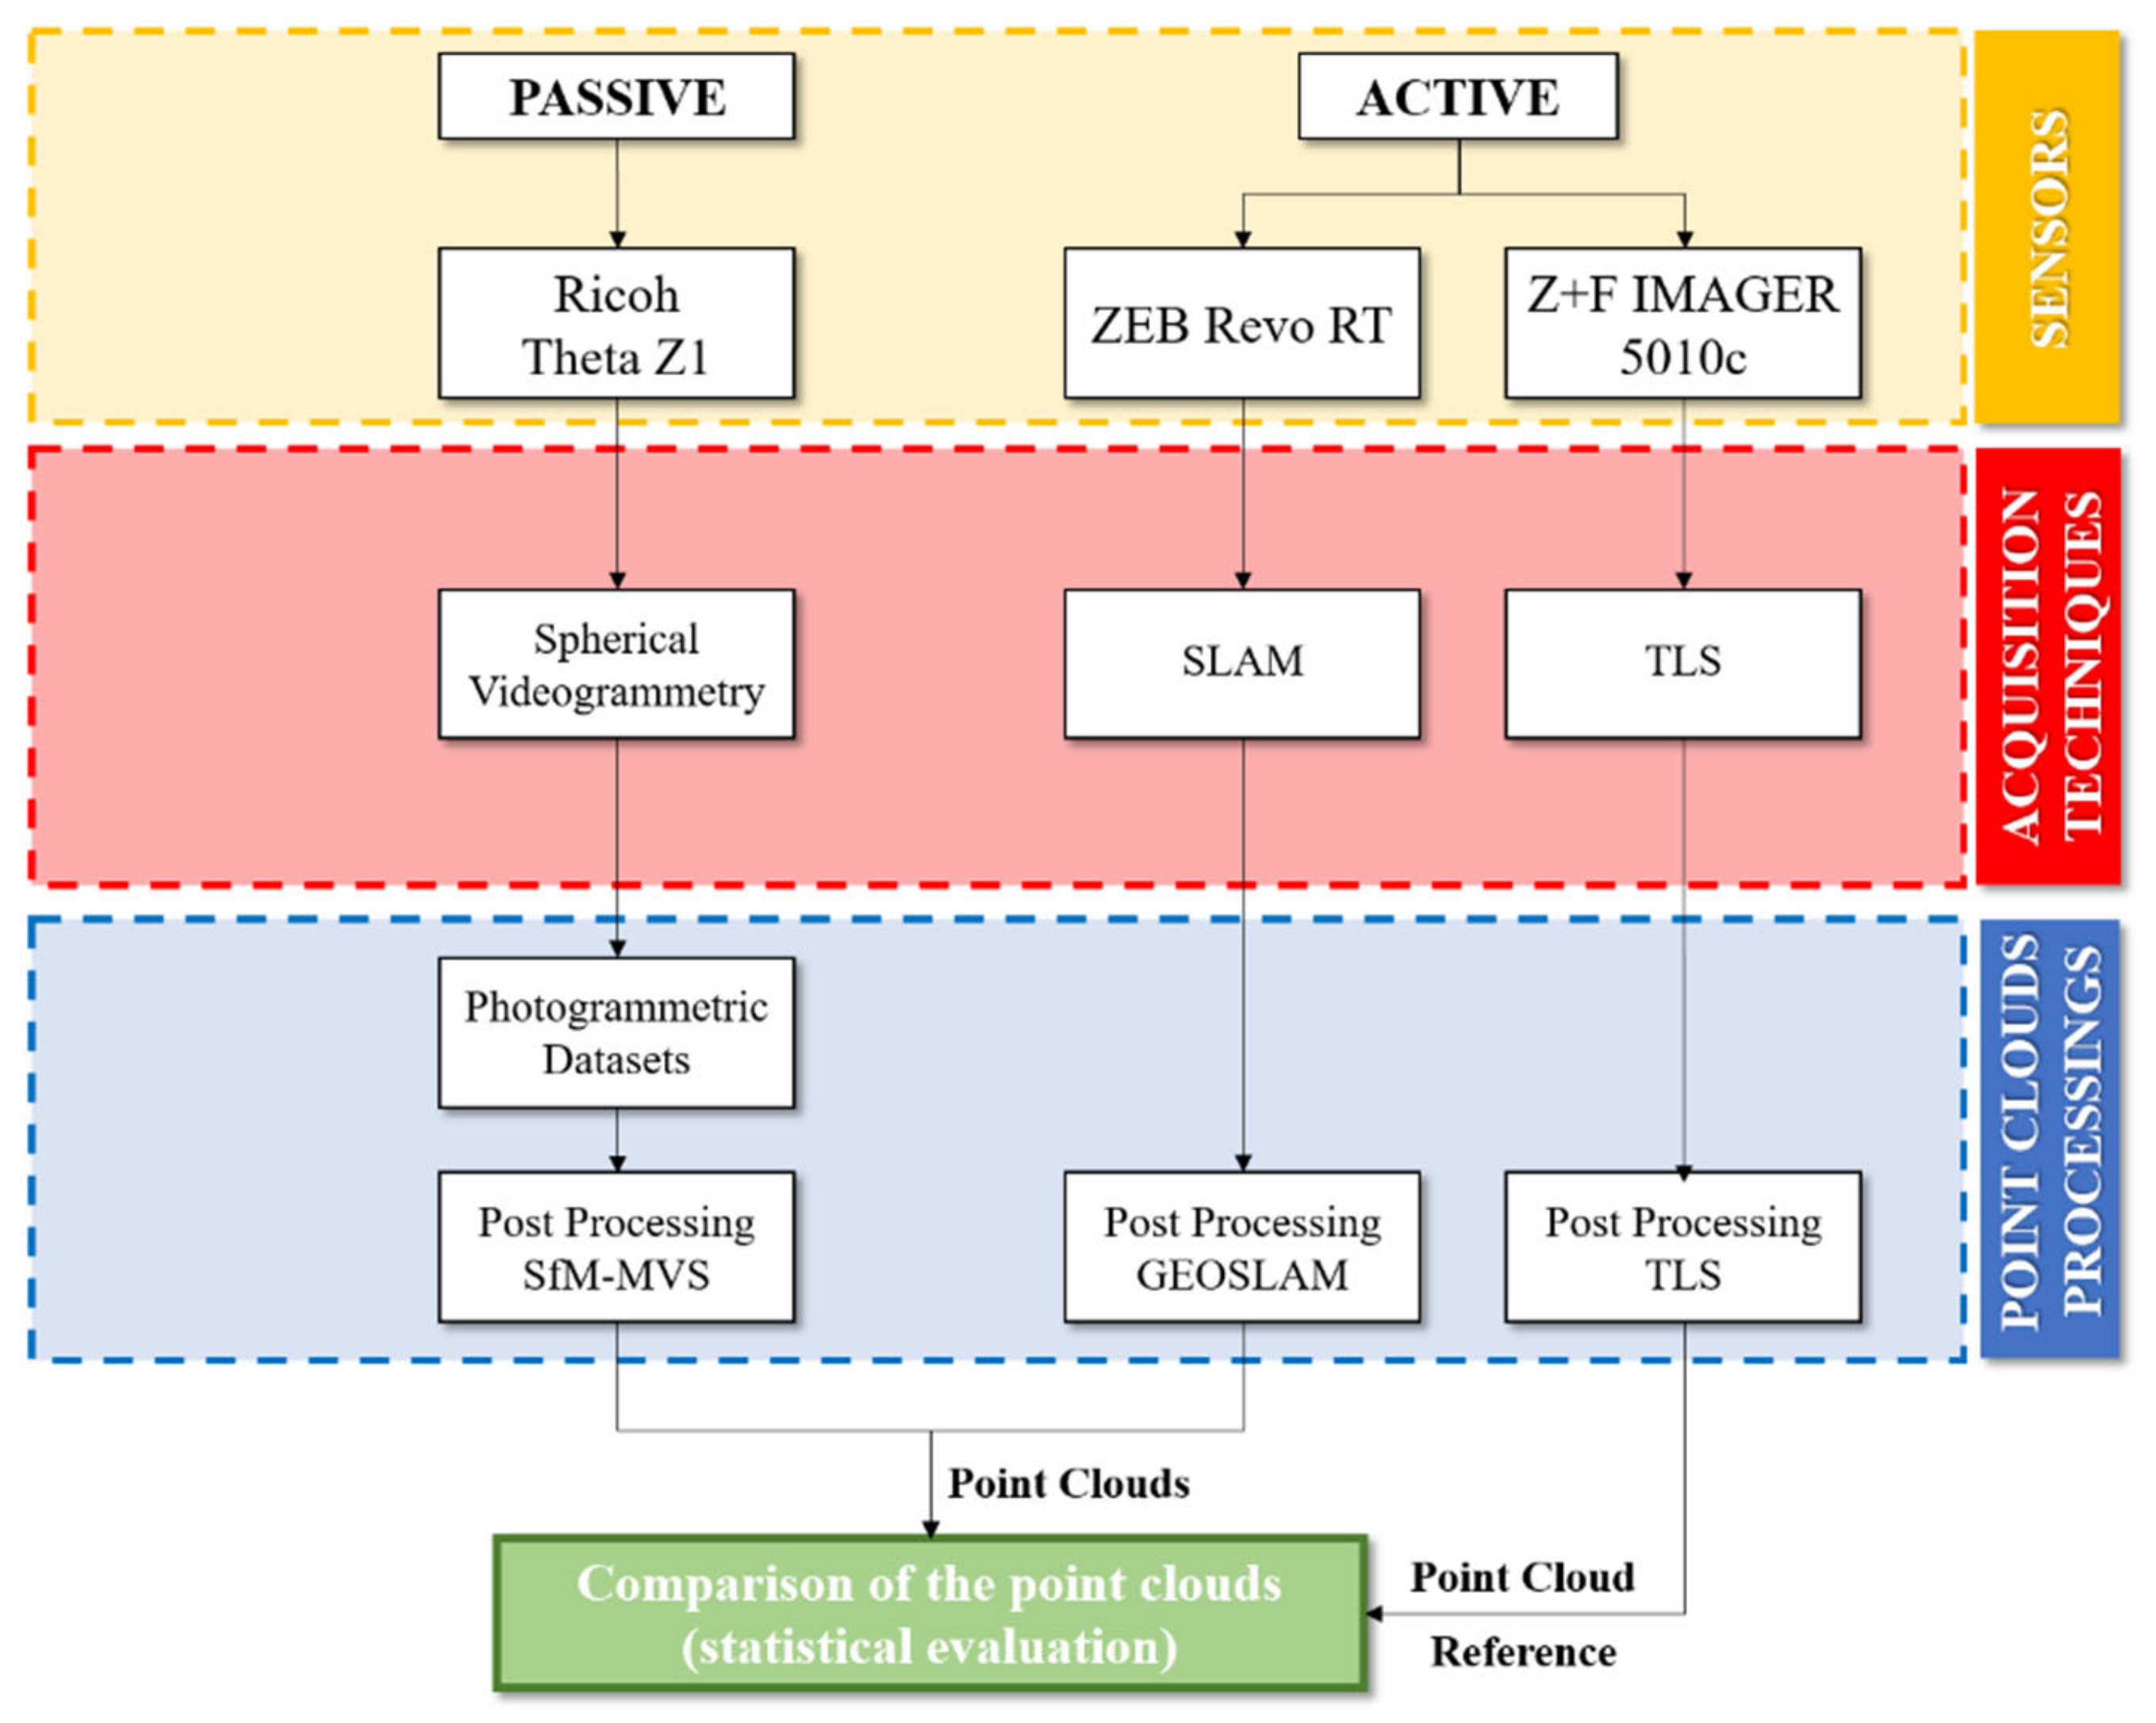
The field of investigation concerns the use of latest-generation sensors in the field of CH capable of generating a 3D point cloud.
Regarding the use of images obtained from passive sensors, a photogrammetric approach, based on the SfM and MVS algorithms, was investigated by processing and comparing a series of datasets obtained from a 360° spherical camera.
Concerning the active sensors, a mobile SLAM sensor was tested in order to produce a point cloud in the shortest possible time and at the same time, that was metrically accurate. Considering the reliability and metric accuracy in three-dimensional reconstruction, a phase-shift TLS was used; the point cloud generated by the TLS represents the reference in the process of comparing point clouds generated by active and passive sensors.
The use of appropriate statistical indices makes it possible to investigate the metric quality of the point cloud acquired by several sensors. Therefore, the purpose of the paper is to identify the performance (quality, accuracy, acquisition, and processing times) of the latest sensors in 3D reconstruction processes of elements belonging to cultural heritage.

1.2. Organization of the Article

This paper is organized as follows.
The first part describes the active and passive sensors used in the experiment and the methodological approach adopted for the generation of the point cloud using the different acquisition technologies, with particular regard to the technique and principles of photogrammetric data acquisition (Section 2.1 and Section 2.2). The statistical indicators used to compare the different point clouds are described in Section 2.3.
In the third paragraph, after the description of a 3D test field conducted in the Geomatics laboratory of the Polytechnic of Bari (Section 3.1), the case study, represented by a structure of important architectural and historical interest in the field of CH (Section 3.2), is illustrated. This structure was surveyed using active sensors such as TLS and GeoSLAM (Section 3.3 and Section 3.4) and passive sensors such as spherical cameras (Section 3.5).
The experimental results and validation of the multi-sensor approach are described in Section 4.
The discussion and conclusions (Section 5 and Section 6) are summarized at the end of the article.

2. Materials and Methods

2.1. Experimental Setup

Various sensors, both active and passive, can be used to obtain the 3D point cloud. In order to assess the metric quality of point clouds that were obtained with several sensors, a comparison with a TLS survey is essential due to the high reliability and accuracy of its sensor. Therefore, the pipeline summarizing the different processes to be developed to facilitate comparisons between point clouds generated by the different sensors is shown in Figure 2. In particular, the main steps are sensor selection, acquisition techniques, point cloud processing, and statistical evaluation for the comparison of the point clouds.

2.2. Sensors Used in the Experimentation

2.2.1. SLAM and TLS Active Sensors

Active sensors acquire the spatial coordinates of numerous points on a structure by emitting laser pulses that allow the distance from the device to the target to be measured. Traditional ground-based LiDAR systems can produce millions of data points with millimeter accuracy. Nowadays, modern navigation and positioning systems allow the use of mobile platforms, called mobile laser scanning (MLS), which have the advantage, compared to TLS, of being able to acquire large complex areas more quickly and efficiently. In general, the point cloud obtained from these scanning systems are processed in customized software packages in order to manage and analyze large amounts of data. In fact, the data obtained from the TLS were processed within the software provided by the instrument manufacturer, which offers a high degree of flexibility and a fast data transfer to another specialized software (for the objective of Buziaș Colonnade more than 50 scan positions were necessary).
SLAM instrumented scanning enables geospatial measurements to be taken quickly, easily, and with centimeter accuracy thanks to a rotating LiDAR (Light Detection and Ranging) sensor for a wider field of view. It is a small, portable 3D scanner using LiDAR technology that is easy to use and captures high-quality data at high speed. The main features of the equipment, when scanning both simple and complex environments, are the acquisition of up to 43,000 points per second, a maximum range of 30 m, and a relative precision variable from 1 to 3 cm (depending on the setting). The sensor system consists of a 2D laser scanner and an IMU mounted on one or more springs. The laser device consists of a 2D time-off light laser sensor with a field of view of 270 degrees, 30 m indoors and 15 m outdoors, and a scanning frequency of 40 Hz. The dimensions of the UTM-30LX are 60 × 60 × 85 mm, and its mass is 210 g, making it ideal for low-weight requirements. The IMU is a MicroStrain 3DM-GX2, an industrial-grade IMU containing triaxial MEMS gyroscopes and accelerometers with an output rate of 100 Hz [29]. Comprehensive and extensive descriptions of the state of the art of SLAM algorithms can be found in recent works [30,31].
The TLS used for the experimentation was the Z + F IMAGER® 5010C, manufactured by Zoller and Fröhlich GmbH, Wangen, Baden-Wurttemberg, Germany. The 5010C is a phased system using a class 1 infrared laser. Compared to other TLSs, the 5010C has an exceptionally high and fast data acquisition rate of 1.06 million points per second while maintaining a ranging error of less than 1 mm, within 20 m of the surface [32].
The post-processing of the data that is acquired from active sensors is generally managed within the software developed by the sensor manufacturers. Exporting the point cloud in an interchange format, such as LAS (LASer), allows point clouds to be compared.

2.2.2. Ricoh Theta Z1 Passive Sensor and Processing of the Equirectangular Images in Photogrammetric Environment

The 360° video, or immersive video, is a currently emerging frame-capture or video technology that allows an exploratory experience within spherical reproductions. The production of 360° video involves the use of special multidirectional filming technologies, capable of capturing images simultaneously in spherical mode, and is most commonly used in gaming, tourism and real estate promotion, engineering applications (construction sites, inspections, etc.), events, and virtual reproductions. Since 2013, the year of production of the first 360° cameras, the models have undergone a huge process of technological innovation based on the use of increasingly high-performance sensors that have led to an increasingly high quality of images and videos, as shown in Figure 3.
The Ricoh Theta Z1 was used for the acquisition of the videogrammetric dataset. This camera is able to acquire images with a resolution of 23 MP (6720 × 3360 pixel) with a high-performance and precise image-stitching algorithm. As concerns video capturing, the resolution is 4K (frame size of 3840 × 1920 pixels and 29.97 fps).
The data acquisition technique with passive sensors plays an important role in the 3D reconstruction of the scene under investigation because it is necessary to implement a robust image network with high overlap. Taking into account the structure under examination, which is characterized by long corridors, it is possible to hypothesize several acquisition schemes. For the acquisition of the video-derived dataset using the Ricoh Theta spherical camera, a double acquisition path was designed: the first following the central axis of the corridor (Figure 4a) and the second following a sinusoidal pattern (Figure 4b).
The point clouds, obtained from the survey with passive sensors, were processed using photogrammetric software based on SfM and MVS algorithms.
The SfM-MVS approach allows the reconstruction of 3D structures starting from a set of images acquired from different observation points by means of the following two steps: a correspondence search and the reconstruction stage [33,34]. In the case of spherical photogrammetry, instead, the collinearity equations [35] can be given as:
ϑ = atg r 1 X X 0 + r 4 Y Y 0 + r 7 Z Z 0 r 2 X X 0 + r 5 Y Y 0 + r 8 Z Z 0
φ = acos r 3 X X 0 + r 6 Y Y 0 + r 9 Z Z 0 d
where ϑ is the longitude and φ is the latitude of a generic point P X ,   Y , Z in a Cartesian terrestrial reference system (whose axes are X 0 ,   Y 0 ,   Z 0 ), d is the distance of the sphere center O from point P, and r 1 , , 9 are the terms of the rotation matrix.
Multi-view-stereo algorithms, e.g., clustering views for MVS-CMVS and patch-based MVS-PMVS, allow the point cloud density previously generated during the SfM process to be increased [36].
The images acquired with passive sensor were processed by Agisoft Metashape software Version 1.5.1, which is a photogrammetric software able to reconstruct a three-dimensional model from a photographic dataset. In fact, in this environment it is possible to manage numerous images, controlling different processing parameters and efficiently processing a dense and geometrically accurate point cloud. Moreover, with Agisoft Metashape it is possible to create a series of masks to remove from the scene details and shapes that are not necessary in the reconstruction phase of the 3D model; the use of such masks is also a good strategy to obtain a cleaner and more accurate point cloud, with a low presence of outliers (related to interfering objects in the scene to be reconstructed) as well as the possibility of increasing the accuracy and decreasing the total time in the phase of alignment and processing.

2.3. Statistical Evaluation of the Point Clouds

The point clouds generated by different sensors can be compared and analyzed, in statistical terms, by calculating the mean value μ and the variance σ 2 of the distance ( d ) between the point clouds, where n is the number of observations.
The mean value and the variance can be obtained by following equations, respectively:
μ = i = 1 n d i n
σ 2 = i = 1 n d i μ 2 n 1
In addition, it is possible to calculate, from the variance, the statistical value of the standard deviation σ , i.e., the index expressing the differences in the values of each observation from the mean of the variable.
σ = i = 1 n d i μ 2 n 1
This means that if the sample follows a Gaussian distribution, it is possible to verify that the Q–Q (quantile–quantile) has a normal distribution. A Q–Q (quantile–quantile) plot is a graphical method for comparing two probability distributions by plotting their quantiles against each other [37]. This Q–Q plot compares a sample of data on the vertical axis with a statistical population on the horizontal axis; if the points follow a strongly non-linear pattern, it suggests that the data are not distributed as a Gaussian function. A Q–Q diagram is used to compare the shapes of the distributions, providing a graphical view of how properties such as position, scale, and skewness are similar or different in the two distributions.
Further information on the distribution can be derived from other parameters, such as skewness and kurtosis. Skewness is a measure of the lack of symmetry and can be defined as:
Skew = i = 1 n x i μ n 1 σ 3
Maximum similarity occurs when the skewness is zero or close to zero (normal distribution).
Kurtosis can be formally defined as the standardized fourth sample moment of the mean [38]:
K u r t = i = 1 n x i μ 4 n 1 σ 4
Conventionally, a normal kurtosis value is 3. If the sample is not normally distributed, either because of the presence of outliers or because a different population assumption is applied, a robust model based on non-parametric estimation should be employed.
In this case, the median ( m ) i.e., as the value in the middle of the distribution, and the median absolute deviation ( M A D ), are used as robust measures instead of the mean and the standard deviation, respectively [39]. The M A D is defined as the median ( m ) of the absolute deviations from the median of the data ( m x ):
M A D = 1 n i = 1 n x i m X

3. Point Cloud Generation by Several Sensors and Techniques

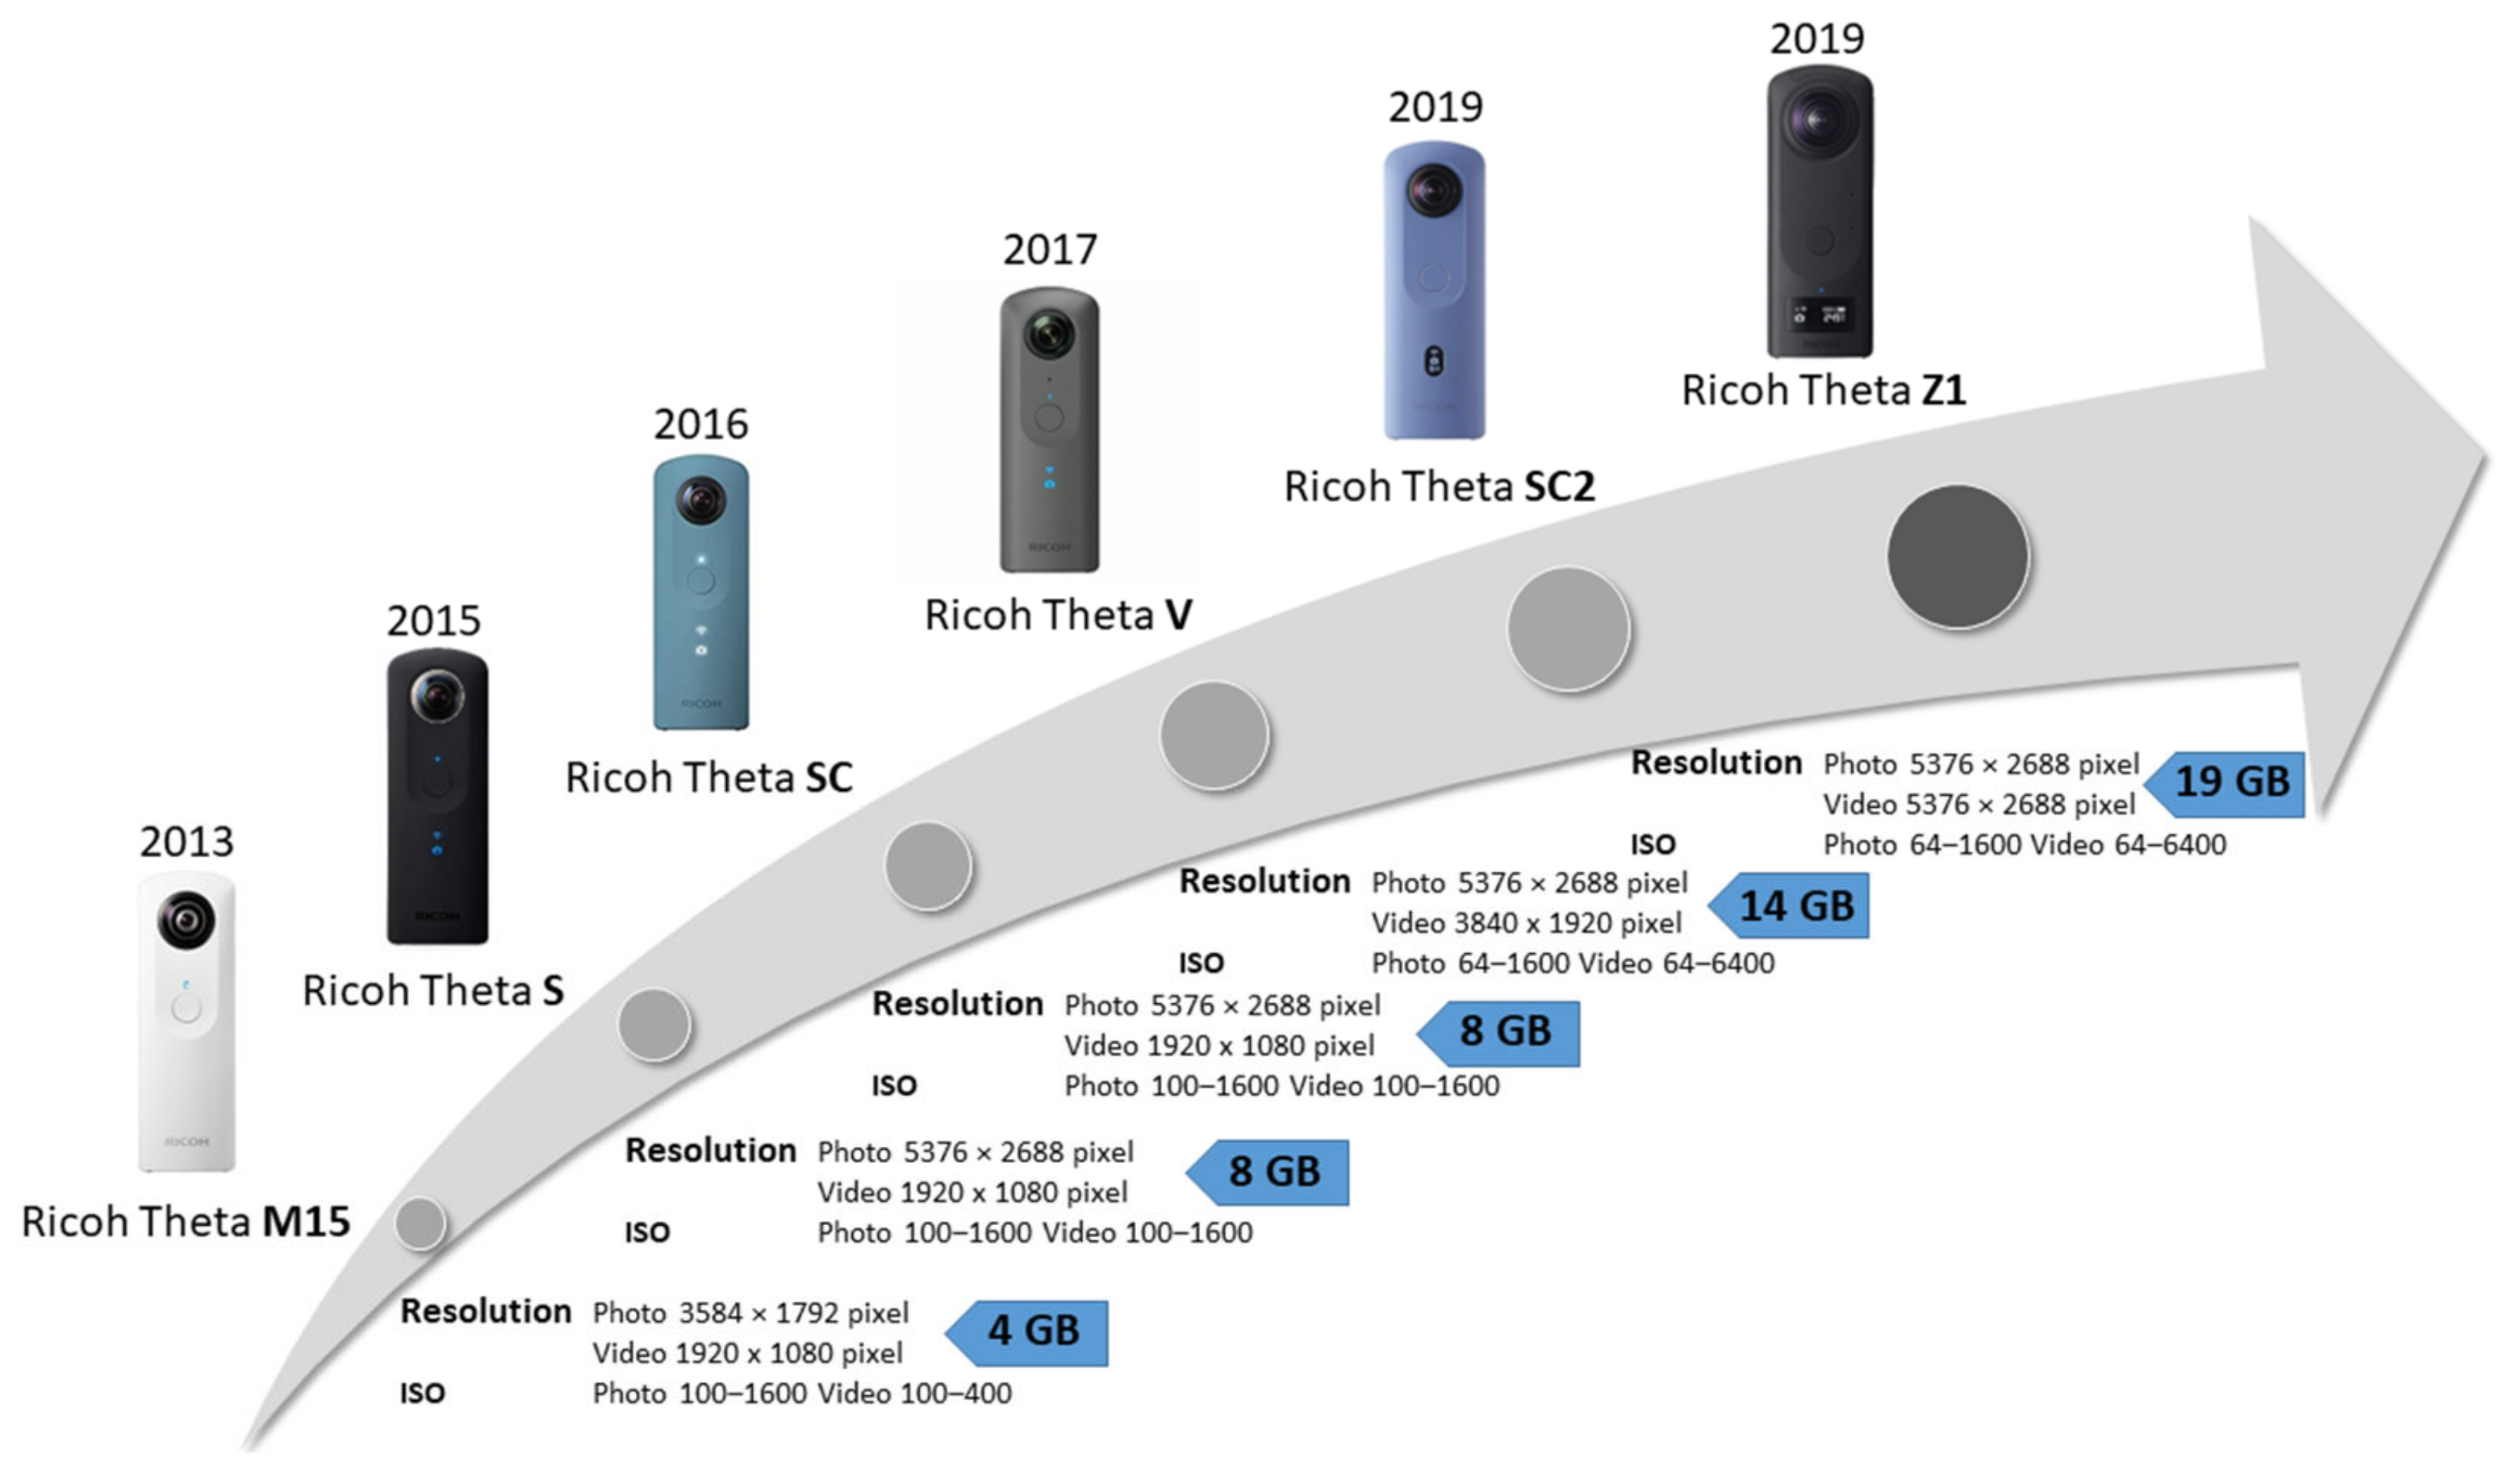
For the construction of 3D point clouds of a site of historical and architectural interest, three different sensors were used in this experiment: Ricoh-Theta Z1, GeoSLAM Zeb RevoRT, and Terrestrial Laser Scanner mod. Z + F IMAGER® 5010C. Therefore, specific datasets were generated for each sensor used; however, in the specific case of the spherical camera, preliminary laboratory tests were carried out. The purpose of this experimentation was to assess the quality of the point cloud obtained from the 4K images.

3.1. Point Cloud Quality Assessment from 7K to 4K Images

This test, conducted within the Geomatics Laboratory of the Polytechnic of Bari, allowed the difference between the point cloud generated by the raw images and the frames extracted from the video to be evaluated.
The raw images were acquired with a tripod in different positions and on two height levels in order to achieve a rigid geometric acquisition configuration. Subsequently, a video reproducing the trajectory deduced from the positions acquired in photo mode was produced. The dataset made up of equirectangular raw images and that made up of the frames generated by the video were processed in the Agisoft Metashape environment in order to generate a dense point cloud. This software allows the dataset to be processed according to the size of the images. For example, with the “High” accuracy setting the software works with photos of the original size, the “Medium” setting causes image downscaling by a factor of 4 (2 times for each side), and at “Low” accuracy the source files are downscaled by a factor of 16.
In this case study, the “High” setting was used for alignment process and “Low” to generate the dense point cloud. The two point clouds were compared with each other in Cloud Compare software version 2.11; the comparison showed that the two point clouds were comparable with each other, i.e., they presented a maximum difference of 0.01 m (Figure 5).
Furthermore, the two point clouds of the entire structure, generated from 4K and 7K images, were compared with one obtained from a TLS survey that was performed with HDS3000 that has a position accuracy of 6 mm.
The latter comparison showed the quality of the point cloud obtained by extracting frames from the video and the level of accuracy achievable using equirectangular images (Figure 6 and Figure 7).
Comparing the point cloud generated by the TLS (reference) and the point cloud generated by the equirectangular images with 4K and 7K resolution, it was possible to note an average distance of 0.04 m and a maximum distance of 0.029 m and 0.026 m, respectively.

3.2. Experimentation on Cultural Heritage Site: Buziaș Colonnade

The “Buziaș Colonnade” is a site of significant historical interest, located in a park of about 20 hectares in the homonymous town of Buziaș (Figure 8) and about 30 km from the city of Timișoara (capital of the Timiș district—Romania).
The colonnade was commissioned by Emperor Franz Joseph of Austria around 1875 and was intended as a place for his wife Empress Elisabeth, better known as Sisi, to stroll during her stay for terminal treatment.
The Buziaș Colonnade is built in the Byzantine architectural style with wood carvings that give the impression of huge lace and has a total length of 533 m, making it the only one of its kind in Europe.

3.3. Terrestrial Laser Scanner

The TLS Z + F IMAGER® 5010C used for the experiment has a range of about 187 m and is capable of acquiring point data with a vertical FOV of 320° and a horizontal FOV of 360°. For the TLS survey, four different quality levels can be set with the instrumentation used, depending on the resolution and measurement. The resolution for the TLS was set to “High” (6 mm at 10 m), with quality balanced and normal. To scan the entire architectural structure, 54 scans were carried out. Post-processing was performed using the in-house Z + F LaserControl software; the scans were aligned manually using flat targets as reference points that had been accurately positioned within the investigated site. The alignment phase of the scans resulted in a final RMSE for a total of approximately 280 million points acquired. The following images show several details of the point cloud obtained from the TLS survey processing (Figure 9).

3.4. GeoSLAM

The survey of the structure under consideration was carried out using GeoSLAM ZEB Revo RT. After being stationed for about 15 s in a barycentric position with respect to the area to be surveyed, the operator began to walk around in order to acquire the LiDAR data. In particular, in order to reconstruct the entire structure, several closed paths were designed. Starting from the left front, the outer side was first acquired, followed by the inner side of the structure; the left side was then acquired similarly. 
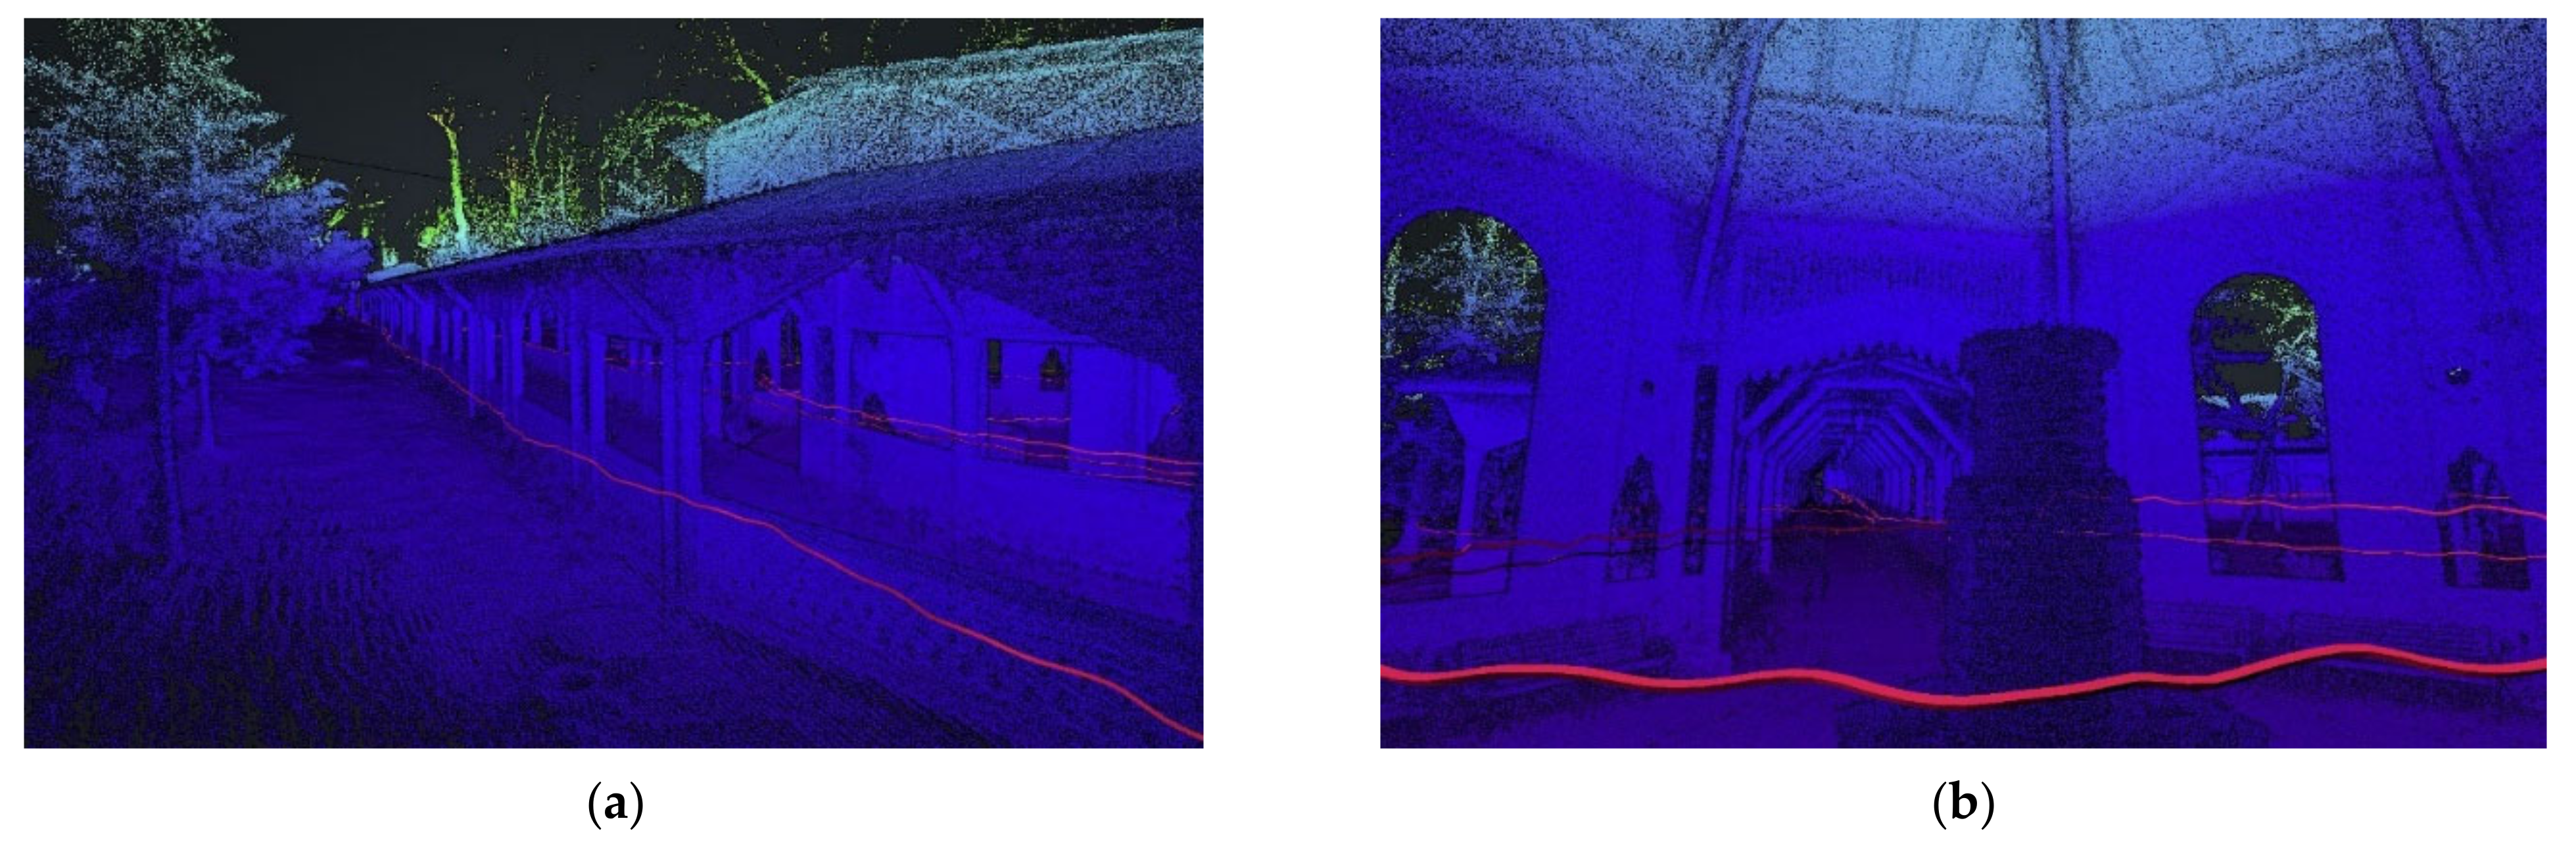
Figure 10 shows some details of the acquired point cloud as well as, in red, the paths followed for the data acquisition. Subsequently, the 3D data acquired from the laser scan were processed using the desktop software GeoSLAM Hub 6.1.0, whose different steps are rather automated. The format of the output point cloud was set to “LAS” and the density of the point cloud was set to 100% with shaded colors.

3.5. Spherical Videogrammetry

3.5.1. Point Cloud of the CH Site Using the Ricoh Theta Camera along the Axis Line of the Colonnade

A spherical video was acquired along the center line of the structure; the time of acquisition was 15 min and 46 s for a total video of 5.2 GB.
In Agisoft Metashape, it is possible to transform the video into a sequence of frames that will then be used as source images for the 3D reconstruction.
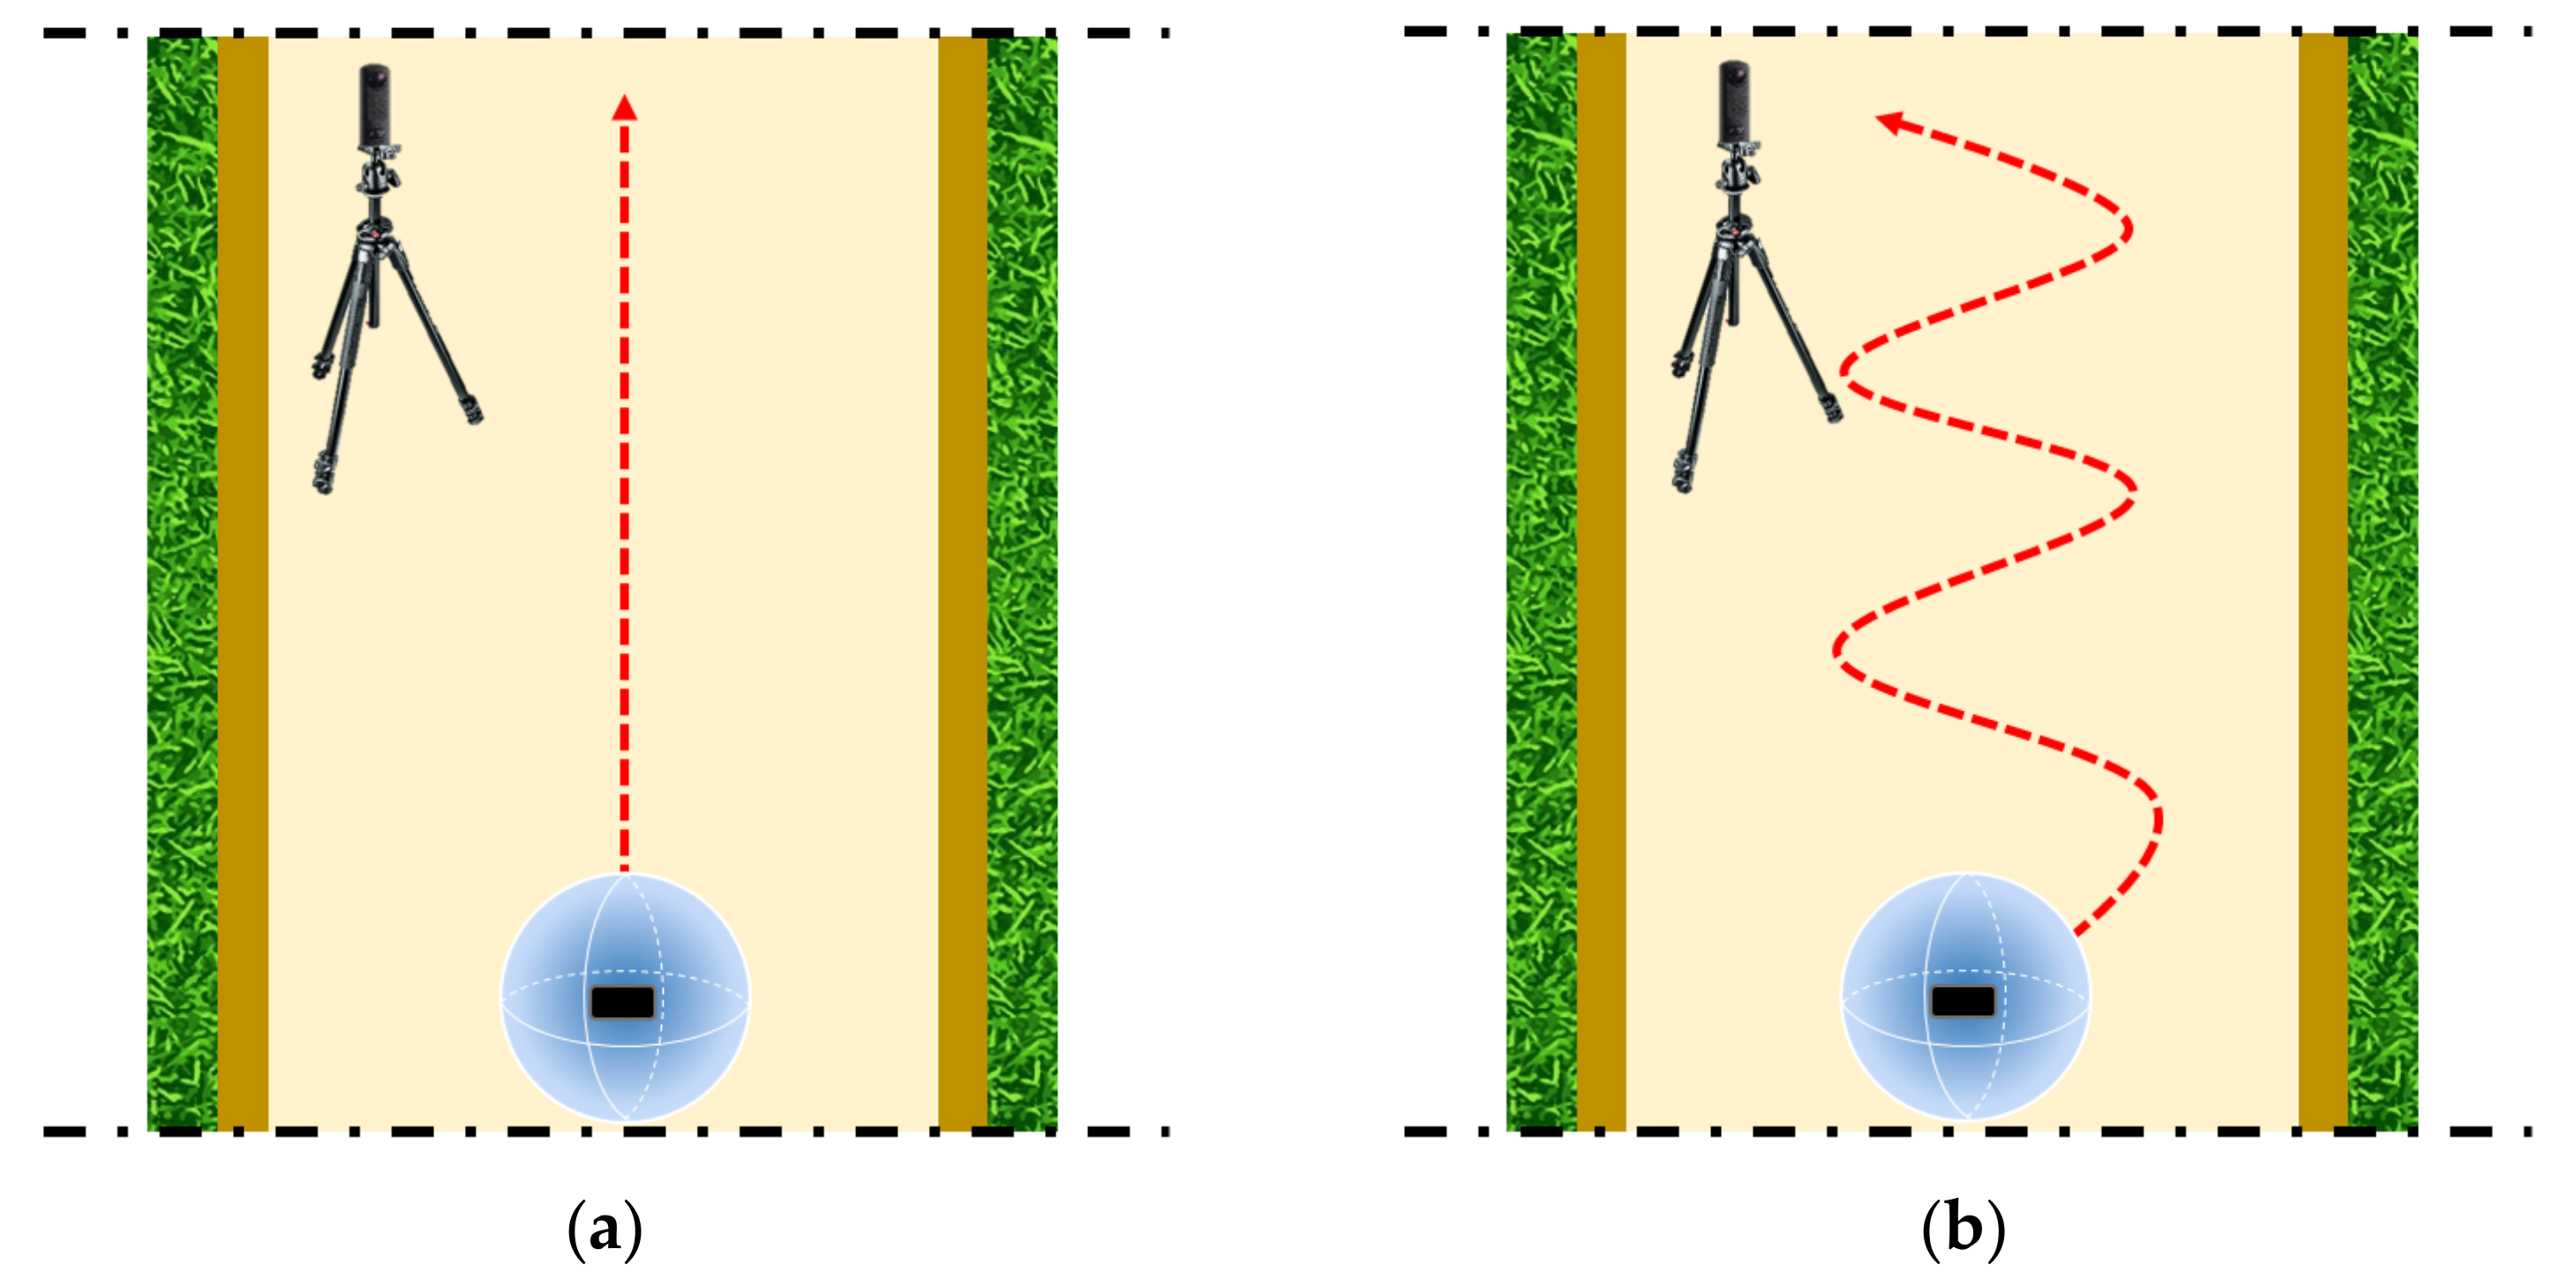
Moreover, it is possible to choose the automatic frame pitch that can be useful to skip similar sequential frames. In particular, it is possible to choose the automatic step of the frame (small, medium, large): the “small” value corresponds to a displacement of about 3% of the image width, the “medium” value corresponds to a displacement of 7%, and the “large” value corresponds to a displacement of 14% of the image width. In this case, a displacement value of 3% was used. From the video acquired along the axis line of the colonnade, 25,216 frames were extracted; considering the quantity of the frames and the high overlap of the images, a dataset of 2295 frames was created, selecting from the initial 25,216 frames one frame every 10 frames (3 frames per second). The extracted frames were aligned using the Agisoft Metashape software on the “High” setting. The processing of this dataset did not provide good results, as only 928 images were correctly aligned; this was due to the weakness of the geometric configuration of spherical images.

3.5.2. Point Cloud of the CH Site Using the Ricoh Theta Camera Following a Sinusoidal Pattern

Due to the poor results obtained, a new acquisition following a sinusoidal pattern was carried out, according to the sketch reported in Figure 5b. The acquisition of the entire structure lasted 25 min and 37 s, for a total video of about 10 GB.
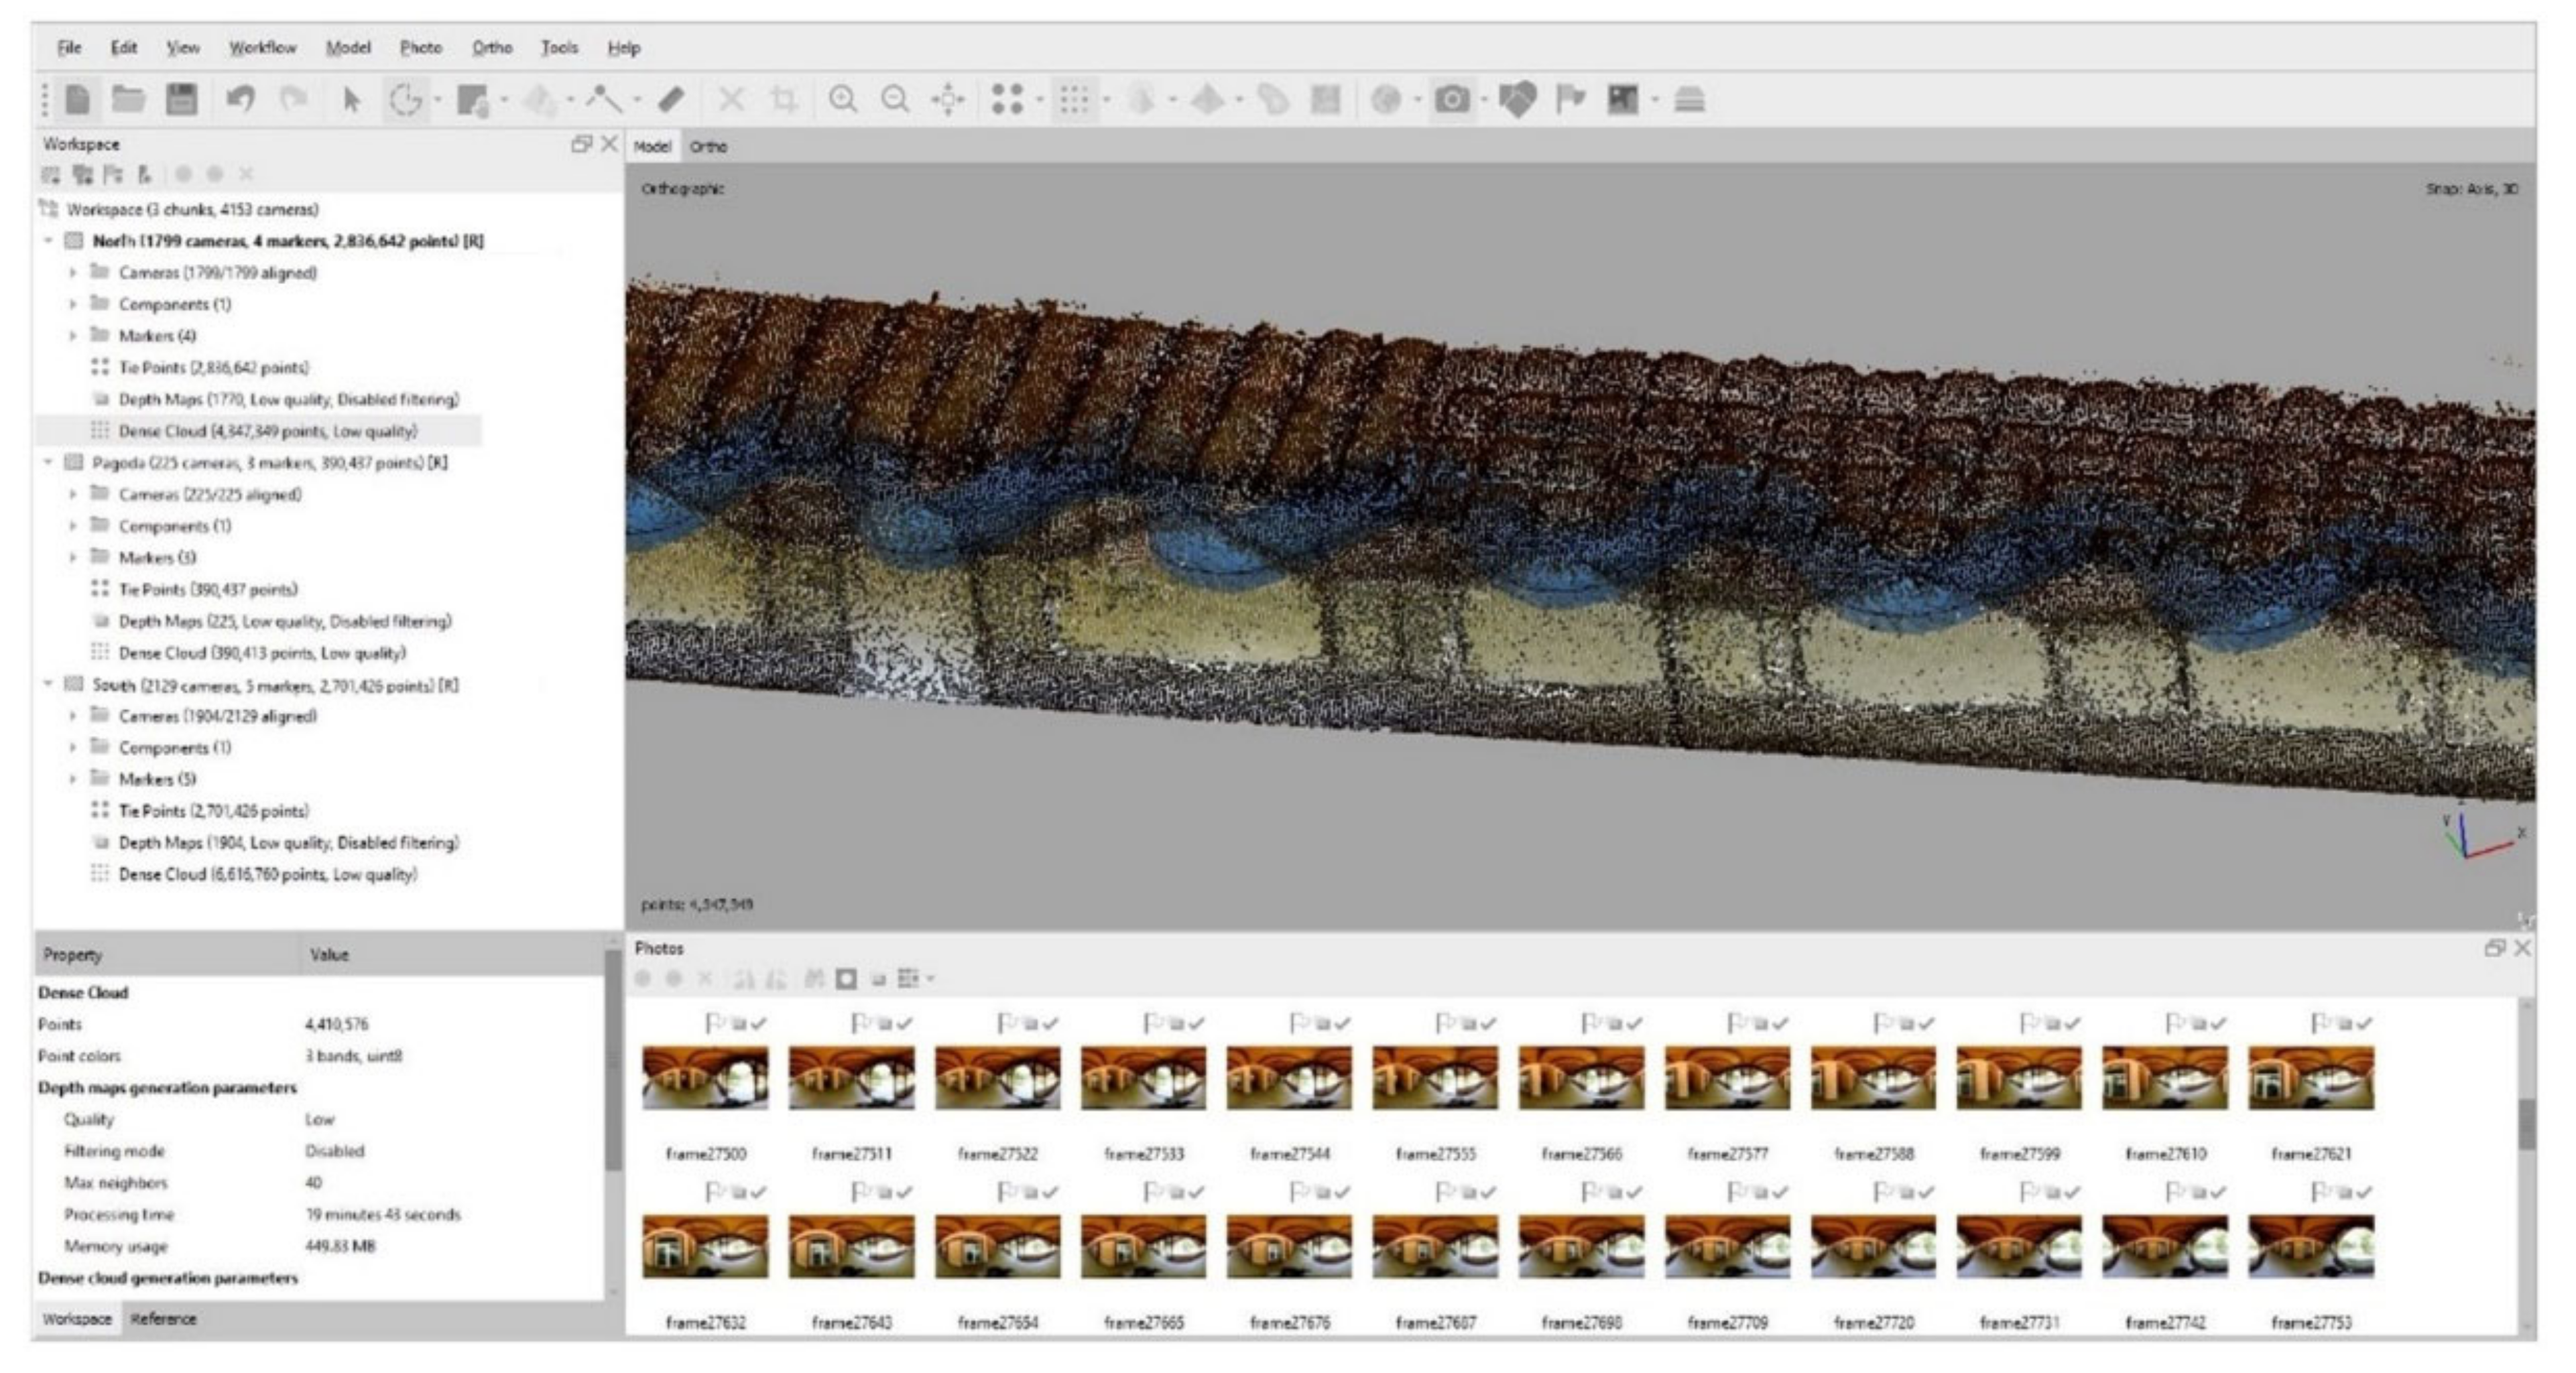
As described in the previous section, from the video a new dataset of 4153 images was built. In order to simplify the alignment process, the dataset was split into three datasets (see Figure 11).
All the datasets were processed with the “High” setting in the alignment process, whereas when building 3D point cloud, the “Low” setting was used. The results of photogrammetric processing are summarized in Table 1.
Lastly, the 3D point cloud was georeferenced using GCPs derived by the TLS survey. The average total error achieved in the three different datasets and evaluated in GCPs was about 0.02 m. Subsequently, the three datasets were merged; in this way a point cloud of about 12 million points was generated.

4. Results

4.1. Metric Validation of the Point Cloud Obtained Using Several Sensors

The point clouds were compared in Cloud Compare software using the algorithm implemented in the C2C tool, which is based on the Hausdorff distance. The algorithm implements the calculation of the Hausdorff distance used to measure the similarity of two geometric objects because it is defined as the MAX-MIN distance between two sets of points; it can determine the degree of similarity between two sets of points without defining the correlation between the points [40].
The Hausdorff distance H from set A to set B is a maximum function defined by the equation below [41,42]:
H A , B = m a x a A m i n b B d a , b
where a and b are points of sets A and B , respectively, and d a , b is any metric distance between these points. Using the point cloud generated by the TLS survey as a reference, it was possible to compare the different point clouds and build a histogram of the distances in 256 classes. From this histogram, the following statistical parameters were calculated in Microsoft Excel: (i) mean, (ii) standard deviation, (iii) variance, (iv) skewness, (v) kurtosis, and (vi) MAD. These statistical values are reported in the Table 2 below.

4.2. Quality of the Point Cloud in the Reconstruction of Architectural Details

To analyze the quality of the point cloud, several profiles were extracted. In fact, through the extraction of profiles in characteristic parts of the structure, it is possible to reconstruct the geometry of the point cloud generated by each sensor examined. This is particularly important for defining the details of complex geometries present on the site in order to be able to perform a qualitative and quantitative assessment of the shape of the architectural element considered. The metric analysis carried out on the point cloud makes it possible to assess the deviation of the point cloud obtained from GeoSLAM and spherical videogrammetry from the TLS reference point cloud. For this reason, a profile was extracted from part of the structure characterized by complex geometric elements, as shown in Figure 12.

5. Discussion

The three sensors used were able to reconstruct a three-dimensional point cloud. From a statistical point of view, it turned out that the point cloud generated by videogrammetry, compared to the TLS reference cloud, showed an average difference of about 0.20 m and a variance of about 0.16 m. When comparing GeoSLAM with the TLS reference cloud, the mean difference and variance were of the order of a few centimeters. Further statistic parameters were analyzed in the descriptive comparison of the processed three-dimensional models. In particular, the kurtosis, i.e., the parameter relating to the deviation from distribution normality, was approximately 1.80 in both cases, demonstrating a smoothing of the distribution curve (outliers less extreme than the normal distribution). On the other hand, as regards the evaluation of the skewness parameter, the value close to zero obtained indicates a zero skewness that tends towards a left skewness for both sensors analyzed. The calculated MAD values made it possible to identify the presence of outliers; in particular, in the case of the TLS-GeoSLAM comparison, a value of approximately 0.05 m was obtained. Regarding the dataset obtained from spherical videogrammetry, the value from the MAD was approximately 0.15 m. This means that GeoSLAM, in contrast to the survey carried out with a videogrammetric approach using a spherical sensor, was closer to the TLS point cloud. The values obtained from the statistical analysis conducted were graphically confirmed by the extraction of a profile from a significant part of the structure. The profile confirmed, on the one hand, the noisiness of the dense point cloud obtained by spherical videogrammetry and, additionally, the high quality of the point cloud obtained with the GeoSLAM sensor. However, it is necessary to take into account the complexity of operations related to both the surveying and data-processing activities; therefore, to analyze the performance and peculiarities of each sensor, it is necessary to take into account a series of additional quantitative and qualitative parameters. The evaluation of the performance of these sensors used in this case study showed that each sensor has different characteristics regarding use, processing, and quality of the final results. It is not possible to express an unambiguous evaluation on these aspects; to this end, various aspects characterizing each sensor were taken into consideration, as shown below (Table 3).
For each parameter in Table 3, a value from 1 to 10 was assigned. Some parameters are objective, i.e., they take into account directly measurable and quantifiable aspects; others, on the contrary, require a subjective evaluation. For this reason, parameters that are not directly measurable were obtained through a questionnaire submitted to the Geomatics research team of experts in the field of surveying and 3D modelling.
The indicators taken into consideration describe the quantitative and qualitative aspects of the point cloud in terms of survey operations, processing, accuracy, detail, relative costs of instrumentation, and the necessary specialization of operators. In particular, for the “Acquisition” indicator, two parameters were taken into consideration: the acquisition time required for surveying activities and the ease with which it was carried out. Similarly, for the “Processing” indicator, the processing times and ease of use in managing the specialized software necessary for the production and final processing of the dense cloud were analyzed. For both indicators listed so far, for the quantification of the grade with reference to time, it was necessary to normalize the “time” figure by assigning a lower ranking in correspondence with high execution and processing times (and vice versa). Regarding the “Results” parameter, the different point clouds produced with the different sensors were analyzed and the final accuracy achieved; the geometric resolution and finally the chromatic quality of the three-dimensional model obtained were introduced as comparison and evaluation parameters. The last indicator analyzed was “Costs,” relating both to device purchase and maintenance, as well as costs relating to the specialized operators in charge of the survey operations. In the latter case, low values were considered in assigning the grade in correspondence with high costs.
The grades were translated to a ranking from 1 to 5 stars for each of the indicators analyzed, in order to be able to give a simpler and quicker reading of the potential of the sensors; one star is considered the lowest level of classification, whereas a high level of classification is associated with 5 stars. The results of this ranking are shown in Table 4, where the star rating will be rounded up or down.
Table 4 also shows that although TLS provides a high-quality point cloud, the costs and skills involved are important in terms of both data acquisition and processing. The GeoSLAM sensor showed a high versatility in data acquisition but required high professionalism and medium–high costs in the three-dimensional reconstruction of the data. As far as the spherical camera is concerned, despite the low instrumental and professional costs and despite ease of use and reduced time in the acquisition processes, it showed a less-than-perfect level of accuracy and density of the point cloud.

6. Conclusions

The paper reports the comparison of point clouds generated by three different sensors: active sensors such as TLS and GeoSLAM and passive sensors such as the spherical camera.
The point cloud generated by the TLS survey represents the reference model for comparison with other models obtained from other sensors thanks to its ability to describe the architectural elements of the structure with high density and accuracy.
Regarding the Ricoh Theta Z1 spherical camera, the potential of spherical videogrammetry was analyzed, which allowed numerous equirectangular images to be generated in 4K. From the images, it was possible to create a point cloud in the SfM and MVS environment. A key role in the construction of the point cloud was the acquisition technique of the video and consequently of the extracted images; by using a sinusoidal pattern, it was possible to obtain a 3D point cloud of the structure under investigation. However, in some parts of the structure, the point cloud was rather noisy. In fact, as shown in the profile in Figure 12, the point cloud generated by the spherical camera was very noisy and unable to accurately describe the architectural elements of the structure. The comparison between the model generated by the spherical camera and the one obtained by TLS showed an average deviation of about 20 cm, due to the noisiness of the point cloud and to the several outliers present.
The point cloud generated by the GeoSLAM sensor provided a detailed and accurate three-dimensional reconstruction of the site. In fact, from the C2C comparison with the TLS point cloud, an average distance of a few centimeters was obtained. In contrast to the model reconstructed from the equirectangular images, the point cloud obtained from the GeoSLAM sensor was more detailed and accurate in the reconstruction of the most detailed architectural elements. Compared to the model generated by the TLS, however, the density of the point cloud was lower and showed low noise on the different elements of the structure. Although GeoSLAM presented difficulties in acquiring the data and handling rather long structures, it made it possible to obtain a detailed point cloud suitable for reconstructing a 3D structure.
The application of the spherical videogrammetry technique, on the other hand, made it possible to rapidly acquire even structures with complex geometry; however, the quality of the processed point cloud was barely suitable for the 3D reconstruction of individual architectural elements. Therefore, research must be directed towards the development of algorithms that can improve the quality of the point cloud and, at the same time, reduce the noise characteristic of spherical sensors. In addition, the development of sensors capable of generating higher resolution frames, such as in 7K, can improve the 3D reconstruction process by providing better-quality architectural detail.

Author Contributions

Conceptualization, M.P., V.S.A., D.C. and S.H.; methodology, V.S.A., D.C., M.P. and S.H.; software, S.H., V.S.A., D.C. and M.P.; validation, V.S.A., D.C., M.P. and S.H.; formal analysis, V.S.A., D.C., M.P. and S.H.; investigation, V.S.A., D.C., M.P. and S.H.; resources, V.S.A., D.C., M.P. and S.H.; data curation, V.S.A., D.C., M.P. and S.H.; writing—review and editing, V.S.A., D.C., M.P. and S.H. All authors have read and agreed to the published version of the manuscript.

Funding

This research received no external funding.

Institutional Review Board Statement

Not applicable.

Informed Consent Statement

Not applicable.

Data Availability Statement

Not applicable.

Acknowledgments

We wish to thank the reviewers for their suggestions.

Conflicts of Interest

The authors declare no conflict of interest.

References

  1. Luhmann, T.; Robson, S.; Kyle, S.; Boehm, J. Close-Range Photogrammetry and 3D Imaging; De Gruyter: Berlin, Germany, 2019. [Google Scholar]
  2. Bertilsson, U. Examples of Application of Modern Digital Techniques and Methods: Structure for Motion (SfM) and Multi-View Stereo (MvS) for Three-Dimensional Documentation of Rock Carvings in Tanum Creating New Opportunities for Interpretation and Dating. In Proceedings of the XXVI Valcamonica Symposium, Valcamonica, Italy, 9–12 September 2015; pp. 1–6. [Google Scholar]
  3. Pepe, M.; Costantino, D.; Alfio, V.S.; Restuccia, A.G.; Papalino, N.M. Scan to BIM for the Digital Management and Representation in 3D GIS Environment of Cultural Heritage Site. J. Cult. Herit. 2021, 50, 115–125. [Google Scholar] [CrossRef]
  4. Alfio, V.S.; Costantino, D.; Pepe, M.; Restuccia Garofalo, A. A Geomatics Approach in Scan to FEM Process Applied to Cultural Heritage Structure: The Case Study of the “Colossus of Barletta”. Remote Sens. 2022, 14, 664. [Google Scholar] [CrossRef]
  5. Benítez, A.J.; Souto, X.P.; Armenteros, M.; Stepanian, E.M.; Cantos, R.; García-Villaraco, M.; Solano, J.; Manzanares, Á.G. Multi-Camera Workflow Applied to a Cultural Heritage Building: Alhambra’s Torre de la Cautiva from the Inside. Heritage 2021, 5, 21–41. [Google Scholar] [CrossRef]
  6. Pollefeys, M.; Koch, R.; Vergauwen, M.; Van Gool, L. Automated Reconstruction of 3D Scenes from Sequences of Images. ISPRS J. Photogramm. Remote Sens. 2000, 55, 251–267. [Google Scholar] [CrossRef]
  7. Firdaus, M.I.; Rau, J.-Y. Accuracy Analysis of Three-Dimensional Model Reconstructed by Spherical Video Images. In Proceedings of the International Symposium on Remote Sensing (ISRS 2018), Pyeongchang, Korea, 9–11 May 2018. [Google Scholar]
  8. Gruen, A. Fundamentals of Videogrammetry—A Review. Hum. Mov. Sci. 1997, 16, 155–187. [Google Scholar] [CrossRef]
  9. Alsadik, B.; Khalaf, Y.H. Potential Use of Drone Ultra-High-Definition Videos for Detailed 3D City Modeling. ISPRS Int. J. Geo-Inf. 2022, 11, 34. [Google Scholar] [CrossRef]
  10. Brilakis, I.; Fathi, H.; Rashidi, A. Progressive 3D Reconstruction of Infrastructure with Videogrammetry. Autom. Constr. 2011, 20, 884–895. [Google Scholar] [CrossRef]
  11. Singh, S.P.; Jain, K.; Mandla, V.R. 3D Scene Reconstruction from Video Camera for Virtual 3d City Modeling. Am. J. Eng. Res. 2014, 3, 140–148. [Google Scholar]
  12. Alsadik, B.; Gerke, M.; Vosselman, G. Efficient Use of Video for 3D Modelling of Cultural Heritage Objects. Int. Arch. Photogramm. Remote Sens. Spat. Inf. Sci. 2015, 2, 1. [Google Scholar] [CrossRef] [Green Version]
  13. Murtiyoso, A.; Grussenmeyer, P. Experiments using smartphone-based videogrammetry for low-cost cultural heritage documentation. In Proceedings of the 28th CIPA symposium (ISPRS), Beijing, China, 28 August–1 September; 2021. [Google Scholar]
  14. Ortiz-Coder, P.; Cabecera, R. Accurate 3d reconstruction using a videogrammetric device for heritage scenarios. Int. Arch. Photogramm. Remote Sens. Spat. Inf. Sci. 2021, 46, 499–506. [Google Scholar] [CrossRef]
  15. Kwiatek, K.; Tokarczyk, R. Photogrammetric Applications of Immersive Video Cameras. Int. Arch. Photogramm. Remote Sens. Spat. Inf. Sci. 2014, 2, 211. [Google Scholar] [CrossRef] [Green Version]
  16. Sun, Z.; Zhang, Y. Accuracy Evaluation of Videogrammetry Using a Low-Cost Spherical Camera for Narrow Architectural Heritage: An Observational Study with Variable Baselines and Blur Filters. Sensors 2019, 19, 496. [Google Scholar] [CrossRef] [PubMed] [Green Version]
  17. Shan, J.; Toth, C.K. Topographic Laser Ranging and Scanning: Principles and Processing; CRC Press: Boca Raton, FL, USA, 2018. [Google Scholar]
  18. Saricaoğlu, T.; Kaya, N.K. A Combined Use of Image and Range-Based Data Acquisition for the Three-Dimensional Information Mapping Archaeological Heritage. Mersin Photogramm. J. 2021, 3, 1–9. [Google Scholar]
  19. Bocheńska, A.; Markiewicz, J.; Lapiński, S. The Combination of the Image and Range-Based 3d Acquisition in Archaeological and Architectural Research in the Royal Castle in Warsaw. Int. Arch. Photogramm. Remote Sens. Spat. Inf. Sci. 2019, 42, 177–184. [Google Scholar] [CrossRef] [Green Version]
  20. Nowak, R.; Orlowicz, R.; Rutkowski, R. Use of TLS (LiDAR) for Building Diagnostics with the Example of a Historic Building in Karlino. Buildings 2020, 10, 24. [Google Scholar] [CrossRef] [Green Version]
  21. Chong, T.J.; Tang, X.J.; Leng, C.H.; Yogeswaran, M.; Ng, O.E.; Chong, Y.Z. Sensor Technologies and Simultaneous Localization and Mapping (SLAM). Procedia Comput. Sci. 2015, 76, 174–179. [Google Scholar] [CrossRef] [Green Version]
  22. Keitaanniemi, A.; Virtanen, J.P.; Rönnholm, P.; Kukko, A.; Rantanen, T.; Vaaja, M.T. The combined use of SLAM laser scanning and TLS for the 3D indoor mapping. Buildings 2021, 11, 386. [Google Scholar] [CrossRef]
  23. Khan, M.S.A.; Hussain, D.; Naveed, K.; Khan, U.S.; Mundial, I.Q.; Aqeel, A.B. Investigation of Widely Used SLAM Sensors Using Analytical Hierarchy Process. J. Sens. 2022, 2022, 5428097. [Google Scholar] [CrossRef]
  24. GeoSLAM. Available online: https://geoSLAM.com/what-is-SLAM/ (accessed on 7 April 2022).
  25. Maboudi, M.; Bánhid, D.; Gerke, M. Investigation of geometric performance of an indoor Mobile Mapping System. Int. Arch. Photogramm. Remote Sens. Spat. Inf. Sci. 2018, 42, 637–642. [Google Scholar] [CrossRef] [Green Version]
  26. Oniga, V.E.; Breaban, A.I.; Alexe, E.I.; Văsii, C. Indoor Mapping of a Complex Cultural Heritage Scene Using Tls and Hmls Laser Scanning. Int. Arch. Photogramm. Remote Sens. Spat. Inf. Sci. 2021, 43, 605–612. [Google Scholar] [CrossRef]
  27. Hess, M.; Ferreyra, C. Recording and Comparing Historic Garden Architecture. Value of Slam-Based Recording for Research on Cultural Landscapes in Connection with Heritage Conservation. Int. Arch. Photogramm. Remote Sens. Spat. Inf. Sci. 2021, 46, 301–308. [Google Scholar] [CrossRef]
  28. Zhang, T.; Abu-Hani, J.; Filin, S. Shape preserving noise attenuation model for 3D modeling of heritage sites by portable laser scans. Int. Arch. Photogramm. Remote Sens. Spat. Inf. Sci. 2022, 5/W1, 551–556. [Google Scholar] [CrossRef]
  29. Sirmacek, B.; Shen, Y.; Lindenbergh, R.; Zlatanova, S.; Diakite, A. Comparison of Zeb1 and Leica C10 indoor laser scanning point clouds. ISPRS Ann. Photogramm. Remote Sens. Spat. Inf. Sci. 2016, 3, 143–149. [Google Scholar] [CrossRef] [Green Version]
  30. Barros, A.M.; Michel, M.; Moline, Y.; Corre, G.; Carrel, F. A comprehensive survey of visual slam algorithms. Robotics 2022, 11, 24. [Google Scholar] [CrossRef]
  31. Kolhatkar, C.; Wagle, K. Review of SLAM algorithms for indoor mobile robot with LIDAR and RGB-D camera technology. Innov. Electr. Electron. Eng. 2021, 661, 397–409. [Google Scholar]
  32. Herban, S.; Costantino, D.; Alfio, V.S.; Pepe, M. Use of Low-Cost Spherical Cameras for the Digitisation of Cultural Heritage Structures into 3D Point Clouds. J. Imaging 2022, 8, 13. [Google Scholar] [CrossRef]
  33. Snavely, K.N. Scene Reconstruction and Visualization from Internet Photo Collections. Ph.D. Thesis, University of Washington, Seattle, DC, USA, 2008. [Google Scholar]
  34. Costantino, D.; Settembrini, F.; Pepe, M.; Alfio, V.S. Develop of New Tools for 4D Monitoring: Case Study of Cliff in Apulia Region (Italy). Remote Sens. 2021, 13, 1857. [Google Scholar] [CrossRef]
  35. Fangi, G. Some Metric Documentation of Cultural Heritage in Poland by Spherical Photogrammetry. In New Advanced GNSS and 3D Spatial Techniques; Springer: Berlin/Heidelberg, Germany, 2018; pp. 189–203. [Google Scholar]
  36. Furukawa, Y.; Ponce, J. Accurate, dense, and robust multiview stereopsis. IEEE Trans. Pattern Anal. Mach. Intell. 2009, 32, 1362–1376. [Google Scholar] [CrossRef]
  37. Maharatna, K.; Kanjilal, M.R.; Konar, S.C.; Nandi, S.; Das, K. Computational Advancement in Communication Circuits and Systems; Springer: Berlin/Heidelberg, Germany, 2020. [Google Scholar]
  38. DeCarlo, L.T. On the meaning and use of kurtosis. Psychol. Methods 1997, 2, 292–307. [Google Scholar] [CrossRef]
  39. Toschi, I.; Rodríguez-Gonzálvez, P.; Remondino, F.; Minto, S.; Orlandini, S.; Fuller, A. Accuracy evaluation of a mobile mapping system with advanced statistical methods. Int. Arch. Photogramm. Remote Sens. Spat. Inf. Sci. 2015, 40, 245. [Google Scholar] [CrossRef] [Green Version]
  40. Ryu, J.; Kamata, S.I. An efficient computational algorithm for Hausdorff distance based on points-ruling-out and systematic random sampling. Pattern Recognit. 2021, 114, 107857. [Google Scholar] [CrossRef]
  41. Jafari, B.M. Deflection measurement through 3D point cloud analysis. Doctoral dissertation. Master’s Thesis, George Mason University, Fairfax, VA, USA, 2017. [Google Scholar]
  42. Fuad, N.A.; Yusoff, A.R.; Ismail, Z.; Majid, Z. Comparing the performance of point cloud registration methods for landslide monitoring using mobile laser scanning data. Int. Arch. Photogramm. Remote Sens. Spat. Inf. Sci. 2018, 42, 11–21. [Google Scholar] [CrossRef] [Green Version]
Figure 1. SLAM processing flow (https://ch.mathworks.com/discovery/slam.html?s_tid=srchtitle_slam_1 (accessed on 28 April 2022).
Heritage 05 00099 g001
Figure 2. Pipeline of the methodological approach.
Heritage 05 00099 g002
Figure 3. Technological evolution of Ricoh Theta spherical cameras over the years.
Heritage 05 00099 g003
Figure 4. Acquisition scheme with spherical camera: along the axis line of the colonnade (a); sinusoidal pattern (b).
Heritage 05 00099 g004
Figure 5. Comparison of point clouds obtained from 7K images (reference) and frames extracted from 4K video: evaluation of 3D model (a) and histogram (b).
Heritage 05 00099 g005
Figure 6. Comparison of point clouds from 4K images and TLS survey (reference): evaluation of 3D model (a) and histogram (b).
Heritage 05 00099 g006
Figure 7. Comparison of point clouds from 7K images and TLS survey (reference): evaluation of 3D model (a) and histogram (b).
Heritage 05 00099 g007
Figure 8. Geo-localization of the Buziaș Colonnade.
Heritage 05 00099 g008
Figure 9. Views of the point cloud generated by the TLS survey: total view (a) and some details of the structure (bd).
Heritage 05 00099 g009
Figure 10. Views of the point cloud (elevation scale) generated by the GeoSLAM survey (a,b), and the route performed with the sensor is shown in red.
Heritage 05 00099 g010
Figure 11. Project visualization in Agisoft Metashape software.
Heritage 05 00099 g011
Figure 12. Comparison of the several point clouds along a specific profile.
Heritage 05 00099 g012
Table 1. Features of several datasets.
DatasetCamerasAligned CamerasTie PointsDense Cloud
North17991799/17992,836,6424,347,349
Pagoda225225/225390,437390,413
South21291904/21292,701,4266,616,760
Table 2. Statistical parameters obtained by comparing point clouds.
PC ComparedMean (m)Standard Deviation (m)Variance (m)SkewnessKurtosisMAD (m)
TLS vs. Ricoh Theta Z10.1510.1320.017−0.000211.80450.150
TLS vs. GeoSLAM0.0550.0490.002−0.000181.80030.055
Table 3. Parameters analyzed for performance evaluation.
Parameters
AcquisitionProcessingResultsCosts
TimeTimeAccuracyInstrumental
Ease of useEase of useGeometric resolutionOperator
--Chromatic quality-
Table 4. Ratings according to the parameters taken into account (1–1.5 stars: Bad; 1.5–2.5 stars: Poor; 2.5–3.5 stars: Average; 4 stars: Great; 4.5–5 stars: Excellent).
ParametersSensor
TLSSLAMSpherical Camera
Acquisition
Time Heritage 05 00099 i001 Heritage 05 00099 i002 Heritage 05 00099 i003
Ease of use Heritage 05 00099 i004 Heritage 05 00099 i005 Heritage 05 00099 i003
Processing
Time Heritage 05 00099 i006 Heritage 05 00099 i002 Heritage 05 00099 i004
Ease of use Heritage 05 00099 i002 Heritage 05 00099 i002 Heritage 05 00099 i004
Results
Accuracy Heritage 05 00099 i003 Heritage 05 00099 i004 Heritage 05 00099 i001
Geometric resolution Heritage 05 00099 i003 Heritage 05 00099 i004 Heritage 05 00099 i001
Chromatic quality Heritage 05 00099 i005 Heritage 05 00099 i005 Heritage 05 00099 i005
Costs
Instrumental Heritage 05 00099 i001 Heritage 05 00099 i002 Heritage 05 00099 i003
Operator Heritage 05 00099 i005 Heritage 05 00099 i004 Heritage 05 00099 i003
Publisher’s Note: MDPI stays neutral with regard to jurisdictional claims in published maps and institutional affiliations.

