Article

What Advantages Do Adaptive Industrial Heritage Reuse Processes Provide? An Econometric Model for Estimating the Impact on the Surrounding Residential Housing Market

by
Federico Dell’Anna
Interuniversity Department of Regional and Urban Studies and Planning, Politecnico di Torino, Viale Mattioli 39, 10125 Turin, Italy
Heritage 2022, 5(3), 1572-1592; https://doi.org/10.3390/heritage5030082
Submission received: 6 June 2022 / Revised: 1 July 2022 / Accepted: 2 July 2022 / Published: 6 July 2022

Abstract

:
When industrial relics, such as obsolete buildings, sites, and infrastructures, enter into a process of adaptive reuse, they become transformation engines capable of shaping the urban fabric. They provide tangible and intangible links to our past and have the potential to play a significant role in today’s cities’ futures. One unresolved issue is the quantification of the externalities of these transformation processes. If undertaken correctly, adaptive reuse can contribute to the development of social and cultural capital, environmental sustainability, urban regeneration, and, most importantly, economic benefits to the surrounding community. In this sense, understanding the value of heritage is particularly important in light of the new European urban environmental policy movement based on the circular economy, which aims to change the way Member States consume and produce materials and energy. After a review of the externalities generated by the adaptive reuse of disused industrial heritage, the paper will concentrate on the estimation of economic benefits given by a transformation process that affected Turin’s Aurora district (Northern Italy) during the last years. The hedonic pricing method (HPM) was used to investigate the effects of the construction of new headquarters and the redevelopment of an old power plant converted into a museum and conference center. This study used econometric models to identify a significant increase in market prices within 800 m of the site and calculated a EUR 16,650,445 capitalized benefit from the transformation on the surrounding residential building stock. The study thus contributed to the awareness that reused heritage not only improves the lives of residents, but it also has a positive impact on the real estate market, in terms of transactions, as well as market values.

1. Introduction

Decommissioning of large-scale industrial construction became visible in the 1970s, first in the most traditionally industrialized countries such as England, France, Germany, and the United States [1]. This phenomenon coincided with the decline of certain traditional manufacturing sectors and the gradual transition from an industrial society based on the Fordist model to a post-industrial society marked by significant outsourcing [2].
Industrial heritage locations and spaces connect the modern world to the work of the past. These structures bear witness to the material transformation economy, processes, and procedures. They can tell the story of an industry or location purpose, progress, and decline over time. The abandoned relics of industrial heritage are not only the sites of past industrial processes, but also evidence of something that has given the landscapes and areas of industrial cities a distinct identity for many years. They are an important part of our cultural and real estate heritage [3,4].
In terms of architecture, this building stock is highly adaptable because it was designed to house large technological plants and industrial machinery. These buildings have large interior spaces that can be used for a variety of purposes, such as museums, libraries, performance spaces, and other activities that require a lot of space [5,6]. Moreover, these buildings were originally designed to maximize work efficiency by providing a lot of natural light, which promotes the work of the people inside. Maximizing the potential benefits of natural ventilation and shading is also a prerogative of these passive buildings via natural air conditioning systems and shading and these architectural qualities can be adapted to the needs of new uses during the conversion of these structures [7,8].
Aside from the architectural aspect, the spatial aspect should not be overlooked. Disused buildings are frequently incorporated into the urban fabric as a result of urban expansion, becoming potential engines of transformation, particularly in difficult areas [9,10]. Their proximity to infrastructure and city centers is another consideration for their potential redevelopment. Moreover, because of the numerous benefits that an industrial building can provide, an awareness of its positive characteristics allows for a better understanding and improvement of the key role it plays in urban regeneration processes, such as: a reduction in land consumption and a reduction in the resources required for new constructions, as opposed to the rapid and disorderly processes of metropolization; an ecological regeneration of the urbanized territory through the re-use of areas previously freed from industrial buildings; the social re-appropriation of urban spaces and the preservation of the collective memory of the industrial past and, thus, of the city’s history; the ability to introduce new and different technologies [11].
In recent decades, the phenomenon of abandoned industrial buildings has taken on significant dimensions in Italy and around the world, with social, urban, and inevitably economic ramifications. Meanwhile, the cultural debate has drawn increased attention to the issue and raised awareness of the strategic role that decommissioned industrial areas can play in meeting society’s new needs [12,13]. In light of the growing need for a sustainable urban environment, it is worthwhile to investigate the issue of adaptive reuse of abandoned industrial buildings, which can play a strategic role in the urban transformation process. When looking at examples from major industrialized countries, it is clear that these structures are universally valued for their distinctiveness. Industrial heritage can be repurposed into architectural complexes capable of revitalizing entire urban areas as well as effective socio-cultural and economic growth vehicles. Adaptive reuse revitalizes a site by attempting to analyze the various options that exist between demolition and new use, adding to the existing structures one or more elements that can meet the new needs, and, if possible, describing and illustrating the building’s history [14,15,16]. This allows for the preservation of spaces and sites that would otherwise be demolished for future generations.
A review of the literature, organized using a SWOT (strengths, weaknesses, opportunities, and threats) analysis, first identified all of the benefits and drawbacks that an adaptive reuse project in this context would face. One of the obvious benefits is that it not only improves the lives of residents, but also has a significant impact on the real estate market in terms of transactions and market values. In light of this, the purpose of this research is to look at the direct link between an urban regeneration project and the revival of the area in which it is located utilizing housing market data. Indeed, real estate performance serves as a litmus test for the positive effects of these interventions on the city and social fabric [17]. The study specifically uses the hedonic pricing model (HPM) [18] to evaluate the effects of an adaptive reuse intervention at a former power plant, and the area around it, in Turin’s Aurora neighborhood (Northern Italy). Given that studies conducted by the ‘Federazione Italiana Agenti Immobiliari Professionali’ (Fiaip) [19] have identified an increase in the market prices of properties around the area under investigation, this study aims to investigate the causality present between the regeneration project and the offer prices of flats in multi-family buildings from 2016, the year of the city block transformation, to 2021 through an econometric approach. A geo-referenced sample of residential property offer price data was analyzed with econometric models to estimate the total value generated in terms of economic benefit on the flats located in the area surrounding the redevelopment. Considering the results obtained, the market prices were significantly higher within 50 m of the site, confirming Fiaip’s results, and a capitalized benefit of EUR 16,650,445 was measured within 800 m.
The paper is organized into six sections. After the Introduction, Section 2 offers an overview of the externalities generated by adaptive reuse processes in industrial heritage and a review of studies where HPM has been applied to assess the impact of such interventions. Section 3 describes the case study, the datasets and the variables included in the estimating. The application of the ordinary least squares (OLS), maximum likelihood (ML) method with exponential coefficients is shown in Section 4. The main conclusions are discussed and summarized in Section 5 and Section 6.

2. Research Background

2.1. Urban Regeneration Externalities

Urban regeneration, particularly in tough circumstances of historical pre-existence, can be seen as a multifunctional transformation that also tries to propose sustainable adjustments and improve local quality of life, with potential implications for the inhabitants’ overall well-being [20]. Understanding a project entails analyzing its linkages with the setting and all existing or potential correlations that could be formed, because complex and dynamic systems and varied processes (e.g., physical, social, environmental, and economic) have significance in urban regeneration. Engwall emphasizes the significance of all the linkages that a new initiative might establish with the past, its current organization, and the future [21]. The consequences could be both favorable and bad and being able to anticipate them could prevent the development of criticalities and issues.
A disused pre-existing building should be reintegrated into the complex urban, social, and economic system through community involvement in an urban regeneration project [22]. In order to reach social agreement, the direct and indirect impacts must be studied in order to understand their influence, strength, and duration [23,24]. This section provides an overview, though not exhaustive, of the positive and negative externalities generated by a project of industrial heritage rehabilitation and adaptive reuse. The first part of the study involved the application of a STEEP (social, technological, economic, environmental, and political) analysis, in conjunction with a SWOT (strengths, weaknesses, opportunities, and threats) analysis, to systematize the various impacts generated by an adaptive reuse project. After the collection of the potential benefits and costs generated by transformation processes from the literature, these were first classified according to the potential for the project’s success following the SWOT methodology. The features that can be important for the project’s success are the strengths (S) and opportunities (O). In contrast, the weaknesses (W) and threats (T) are the characteristics that pose a barrier to the project’s completion. A SWOT analysis also allows elements to be classified according to their spatial location. Strengths and weaknesses are internal parts of the problem to be studied, while opportunities and threats are external aspects. In this analysis, the spatial boundary was defined as the boundary of a hypothetical area to be transformed. This working technique was combined with the STEEP analysis, in which the SWOT analysis findings were categorized into five categories: social (SO), technological (TE), economic (EC), environmental (EN), and political (PO) factors [25,26]. This combined assessment is a decision-making methodology used to better visualize the drivers of urban and territorial transformation scenarios. In this regard, the STEEP analysis enables the development of strategic plans that maximize an area’s strengths and opportunities while minimizing or resolving its weaknesses, integrating the financial aspects with purely socioeconomic and environmental criteria to obtain a global vision of the project and taking into account the entire range of the impacts generated.
The adaptive reuse of industrial areas can have a significant positive impact on the economic situation of the surrounding area and by following the STEEP analysis procedure, it is possible to identify a series of benefits within the area that can maximize the attraction of private investors or convince public decision-makers to transform the site (Figure 1). Certainly, the recovery of a disused building heritage will have positive impacts in terms of the social identity of the industrial past that characterized the area or the city [27]. The redevelopment of such heritage brings back into the hands of the community a cultural asset with its distinctive architectural and structural characteristics [28]. From a technological point of view, the large spaces and characteristics of industrial buildings allow the introduction of different functions inside, favoring a functional mix [29]. The intervention will inevitably generate an economic benefit in terms of increasing the real estate value in the asset, but not only, for this benefit will probably also extend to the surrounding areas due to a spillover effect [30,31]. The creation of new jobs, whether through public or private intervention, is guaranteed [32]. Increasingly, architecture is moving towards sustainability and these types of interventions are increasingly focused on achieving stringent environmental objectives by promoting sustainable management models, for example by following specific protocols [33,34]. Industrial buildings are usually located, by their nature, in polluted places and their rehabilitation inevitably leads to an improvement in the environmental quality of the site and its surroundings [35]. Moreover, the reuse of existing buildings contributes positively to reducing land consumption, especially in cities where it is scarce. Generation processes are often also accompanied by initiatives for social inclusion and the surrounding community [36]; however, one must also face difficulties when approaching projects of this kind. The property or site may be subject to architectural or landscape constraints that may influence the project’s decision-making choices [37]. Often the spaces to transform are large, and the costs of implementation are high, especially when reclamation operations are required.
Impacts rarely stay within the confines of the object being transformed. On the contrary, one of the promoters’ prerogatives is to open such projects up to the city as much as possible and to integrate them into the urban, environmental, and socioeconomic context [38,39]. One of the primary goals is to improve the appearance of the city or neighborhoods by establishing new attractive hubs and abandoning the concept of a monocentric city [5]. Major projects attract people and investment by improving the financial viability of the area’s plan/development [22]. Such buildings or brownfield sites, which are frequently strategically located, can become connectors in the existing fabric or activate a series of regeneration policies, triggering chain processes; however, the risk of this not happening exists, implying that it remains an isolated intervention within the urban context. Moreover, when projects are of a certain scale, or there are many actors involved, getting all stakeholders, direct or indirect, on board is not always easy [40,41]. Another issue that needs to be addressed is also the possible competition that can be generated and that can jeopardize the achievement of the planned results. Last, but not least, is the issue related to the gentrification phenomenon that these interventions may generate [42,43]. Often, the increase in real estate values brought about by these processes can lead to depopulation or a decrease in the population living in the area [44].

2.2. Estimation of the Impact of Adaptive Reuse Projects on the Housing Market

The primary references have been techniques that estimate individuals’ willingness to pay (WTP) for these benefits using simulated markets and stated preference (SP) methods, or by analyzing surrogate markets using revealed preference (RP) approaches [45,46]. RP methods are based on observing consumer choices in existing markets related to the public good [47]. Among the RP-based methods, HPM observes real estate markets to assess the effects of externalities [48,49,50]. In general, real estate has several characteristics. Some are structural and define the property, while others are related to the neighborhood and its surroundings. A change in the characteristics of the property or the surrounding ecosystem, according to the HPM method, will be reflected in the value of the property.
Studies based on HPM have been conducted to determine whether or not urban infrastructure, amenities, cultural and historical heritage, and other factors influence the surrounding real estate market. Several authors have demonstrated that residents value the functional, cultural, or aesthetic significance of these services, infrastructures, and heritages, increasing the demand for living space and property values in these markets; many studies have been conducted to investigate the impact of urban green infrastructure [51,52,53,54], modes of transportation [55,56,57], and historic cultural heritage proximity [58,59], but the impact of reused cultural heritage has received little attention (Table 1). Indeed, while adaptive reuse appears to be a proactive strategy for preserving the historical and cultural value embedded in heritage sites, little is known about its external impact [44]. Iftekhar et al. [60] used the HPM and the discrete choice experiment technique to understand the benefits of improving the Main Outfall Sewer reserve in Melbourne, Australia, and assess residents’ preferences for different large-scale, water-sensitive urban improvement options for a disused historic site. They discovered that the various options had significant non-market benefits, both in terms of the potential reflection of increases in house values and in terms of people’s WTP to improve the amenity and environmental quality. Liu and Liu [44] examined the external effect of religious heritage reuse on surrounding house prices using a hedonic model on 42 religious heritage reuse projects in the Netherlands. The authors discovered that religious heritage reuse had a significant positive externality on the local house prices.
Kee and Chau [39] examined the external effects of heritage conservation on the adjacent neighborhood to provide empirical evidence on how heritage conservation fits into Hong Kong’s overall sustainable development. The authors demonstrated how the residential property prices increased as a result of adaptive heritage reuse through two case studies of adaptive heritage reuse, each with its own analysis of the hedonic prices of adjacent properties. According to the findings, an established heritage classification mechanism, combined with a socially inclusive approach to conservation with community stakeholders, not only preserves the authenticity of cultural heritage, but also provides significant social and economic benefits to neighboring communities. Jayantha and Kwan Yung [30] used an HPM to look into whether there was a link between the revitalization of historic buildings and the increase in value of nearby commercial properties on the ground floor in Hong Kong, China. The findings revealed that revitalized historical projects increased the value of the neighboring commercial properties significantly. The findings also revealed that revitalized historic sites had a greater impact on retail property prices than the newly developed residential projects nearby. In Italy, Boscacci et al. [31] estimated the collective benefits for Milan from the Navigli rehabilitation project, an 8 km-long urban regeneration project. They calculated the net increase in public utility generated by the project, as measured by local WTP, as revealed by the market value of residential and commercial properties that already benefitted from an urban quality condition similar to the future one via the HPM. The authors also used a regional input–output table [61] to calculate the multiplier effects of public infrastructure investments on local income. The empirical findings supported the collective net benefit of urban transformation.
As the review shows, among the methodologies most often used to assess market effects, the HPM seems to be able to measure the impacts of the adaptive reuse processes of existing heritage, both natural and cultural. Most of the studies developed confirm the positive effect of these regeneration interventions and in terms of the variables considered within the regression models, the value of the effects of regeneration and adaptive reuse projects are considered in terms of proximity or distance terms.
Based on these considerations, this paper seeks to determine whether the Turin real estate market has been influenced by the proximity of an adaptive reuse project of genuine industrial heritage, which has yet to be investigated in this regard. In particular, estimates based on the HPM should determine the residents’ WTP to live in private flats near the site in question.

3. Materials and Methods

3.1. Materials

The goal of this research is to determine whether urban regeneration processes, even if small-scale and punctual, are capable of generating not only intrinsic value, but also a spillover effect in the surrounding areas. For this purpose, a case study in Turin was chosen, and the HPM was used to determine whether and how much externalities were generated by the adaptive reuse intervention of an existing industrial building. Data on real estate properties, as well as the associated structural, neighborhood, and environmental attributes, were gathered from online property listings. Data on the property supply from 2016 to 2021 were obtained from immobiliare.it, the agency that collects the most property listings in Italy. Because the regeneration process ended in December of that year, 2016 was chosen as the starting year. The investigation period chosen was during the COVID-19 pandemic; however, the estate agency’s work was permitted to continue by the Italian Government, with all necessary precautions taken to avoid COVID-19 infection. Visits to the available flats were possible both in person and virtually, in an effort to minimize inconvenience and to favor a transparent sales phase.
The information contained offer prices for apartments in Turin’s Aurora neighborhood. Apartments in multifamily buildings were chosen because they are the most common type of building in the area. Furthermore, the cadastral map obtained from the municipality of Turin allowed to delineate the boundaries of the subject city block and make spatial references to the properties in the sample. The distance in meters between each apartment was calculated to capture the effect of proximity on property value. Through the Geographic Information System (GIS), data on the extent and location of the buildings in terms of Euclidean distance to the redevelopment project were obtained.

3.2. Methodology

3.2.1. Study Area

The Aurora district is part of Circoscrizione 7 and is located in the northern part of the municipality of Turin (Piedmont Region, Italy) (Figure 2). The old district division of the city identified three areas on its territory: districts 7 (Aurora–Valdocco–Rossini), 8 (Vanchiglia–Vanchiglietta), and 21 (Madonna del Pilone–Sassi-Borgata Rosa). The district 7 is bounded to the south by Corso Regina Margherita, to the north by Corso Vigevano and Corso Novara (which separate it from the Barriera di Milano neighborhood, Circoscrizione 6), to the west by Corso Principe Oddone, and to the east by the Dora Riparia River. Borgata Aurora is compressed between two important Turin polarities: to the north, the Barriera di Milano neighborhood, which has a strong identity linked to the workers’ movement and characterized by a high rate of immigration; to the south, with the liveliness of the Porta Palazzo market, which is accompanied by the social vocation of Borgo Dora-Valdocco. The north-south axis of Corso Giulio Cesare runs right through Aurora, connecting the two polarities [62].
There are numerous abandoned industrial areas in the Circoscrizione 7, reflecting the significant changes that have occurred in the area’s productive fabric. Some have undergone major building and urban transformations, either partial or total, while others have remained untouched. The district section including Aurora–Valdocco–Rossini has seen the most transformations in recent years. One such intervention is the Nuvola, the Luigi Lavazza S.p.A. headquarters built on the site of the former power plant and inaugurated in 2017, which is the subject of this paper’s study.
The intervention area has historically hosted the activities of various electricity companies, including Società Elettrica Alta Italia, Società Idroelettrica Piemonte (SIP), and finally Ente Nazionale per l‘Energia Elettrica (Enel). The existing buildings with historical-architectural interest that were part of the industrial complex were recovered and enhanced by becoming an integral part of the design of the new headquarters by architect Cino Zucchi, in accordance with the Turin municipality. The former headquarters on Via Bologna, built at the turn of the nineteenth and twentieth centuries, is an important example of the eclectic taste that characterizes many early industrialization buildings. The buildings have been revitalized by enhancing the identity of the industrial architecture and now house public-interest functions as well. The Nuvola reintroduces to the city a long-dark and abandoned area, imbuing it with new meaning as a public space. A large pedestrian plaza connects the block to the urban context, making it possible to cross via a new pedestrian link. In agreement with the City of Turin, there are also plans for a series of interventions aimed at enhancing public spaces in the area surrounding the Nuvola, which will include, for example, the widening of sidewalks, the replacement of finishing materials and street lighting, and the redevelopment of the large space in front with the introduction of green and pedestrian areas. Finally, public parking spaces are being constructed in the two basement levels beneath the square to compensate for the loss of on-street parking spaces caused by the decision to increase the pedestrian use of the area [63]. Excavation work in 2014 unearthed the remains of an ancient Early Christian Basilica dating from the second half of the fourth to fifth centuries AD, resulting in the creation of an archaeological area of approximately 1600 square meters visible from the outside thanks to large windows.
Without a doubt, the redevelopment of the now-disused industrial building has resulted in a process of neighborhood regeneration. The benefits realized are numerous, including economic, environmental, and social benefits. The goal of this study is to estimate the value added to the area by estimating the effects on the neighborhood’s real estate market and analyzing a sample of offer prices of apartments located near the block redevelopment, the adaptive reuse of the disused industrial heritage, and the new business center.

3.2.2. Hedonic Pricing Method (HPM)

According to the HPM, real estate, as economic goods, can be considered as a set of attributes, capable of bringing benefits to the consumer, all of which are part of the hedonic price function (1):
P = f x 1 , x 2 , , x n
where P is the market price and x 1 , x 2 , and x n . are the property’s structural, local, and environmental attributes. The regression technique is used to assess the relationship between the sales price and the property attributes. This method explains the variation of a dependent variable ( y ) as a function of the independent variables x 1 , x 2 , , x n . If the model is linear, the function’s form is as simple as Equation (2) below:
y = b 0 + b 1 x 1 + b 2 x 2 + + b n x n +   e j
where b 0 is the constant term and b 1 is the variable x 1 coefficient, and e j the error term. The ordinary least squares (OLS) method can be used to estimate unknown b-parameters. The calculation returns the minimum value of the sum of the squares of the deviations between the observed and estimated values of y to the equation.
The linear model is frequently criticized for its functional form. The HMP theory does not specify which functional form should be used to define the relationship between the dependent and independent variables. The arrangement of points within a scatter plot relating the dependent and independent variables can be used to determine the model type; however, because several mathematical functions can describe the same set of data, this choice is not always clear. In some cases, the knowledge and assumptions about the nature of the phenomenon being studied may guide the selection of the best model.
In terms of the problem of functional form selection, the OLS method involves the use of transformed data, often on a logarithmic scale, to linearize the regression function in order to investigate non-linear relationships between the variables in question. The maximum likelihood (ML) method, on the other hand, allows for the use of full-scale data. The following Equation (3) represents the typical approach:
P j = b 0 x j 1 b 1 x j 2 b 2 x j n b n e j
where P j denotes the market value, b 1 the estimation coefficients of the various variables, x j i the quantity of variables involved, and e j the error term
The ML method, with exponential coefficients, which is commonly used to estimate the Cobb–Douglas production function, yields the implied marginal prices by calculating the incremental ratio shown below (4):
δ P j δ x j i = P j x i b i
where P j is the market value estimated using the best-fit model parameters, x j i is the quantity of the feature under consideration, and b i the estimated coefficient.

3.3. Database Configuration

To develop the analysis based on the hedonic regression model, 875 real estate listings in the subject area published between January 2016 and December 2021 were gathered. In fact, the majority of the work was completed in 2016, so it is assumed that buyers were already aware of the intervention and the area’s potential. The observations were collected within a well-defined perimeter to limit the spatial autocorrelation effects and derive the most accurate estimate possible. Information was gathered specifically from apartments located within 800 m of the block under consideration, as well as within the main axes that circumscribe the Rossini sub-area of the Aurora neighborhood (Corso Regio Parco to the south, the Dora Riparia River to the west, Corso Giulio Cesare to the north, and Corso Novara to the east). Reducing the sample to this sub-area attempted to control for other spatially distributed variables that the regression model could not account for. Following the collection of all valid observations, additional tests were performed to identify potential outliers responsible for estimation bias. After removing the duplicates, missing data, and outliers, the final datasets contained 826 listings with price information and apartment details (Figure 3). Initially, eighteen explanatory variables were selected, plus the dependent variable, i.e., the total list price. The dependent variable was therefore the offer price defined by the real estate agency operator. Because the offering prices were typically 7–10% higher [64], referring to the sales price as the dependent variable would have been more accurate; however, in Italy, researchers, analysts, and real estate operators are confronted with the issue of real estate market transparency, which is a prerequisite, albeit entirely theoretical, for the ideal condition of equilibrium and, more importantly, an important condition for limiting the stochastic components inherent in the market itself. Because of the lack of transparency, analyses cannot use statistically significant samples of actual sales prices and quantitative and qualitative characteristics, which are considered explanatory variables. Furthermore, access to historical data on the sales price actually paid is made difficult due to privacy issues. As a result, analyses are forced to use offer prices, with all the limitations that come with them when they are not aimed at the supply component [64,65].
The most important variables were related to an apartment’s structural characteristics. The first variable considered was the commercial area of the property. ‘Dwelling level’ indicates the floor number where the flat was located within a condo. In this case, 0 indicates that the flat was located on the ground or mezzanine floor, 1 on the first floor, and so on. The presence of a lift within a building in which the flat was located constitutes the third variable. Another variable considered was the year of construction of the apartment building. Some available information has been transformed into ordinal variables; often from textual to numeric variables. The maintenance status become an ordinal variable ranging from 0 to 3, where 0 indicates a flat in need of renovation, 1 in good condition, 2 renovated, and 3 new or under construction. The market segment indicates the architectural quality of the property in which an apartment was located, and it is composed of an ordinal variable with 4 levels: 0 for economy class, 1 for medium class, 2 for high class, and 3 for very high class. The variable ‘Car park’ denotes the number of garages attached to a dwelling. A set of dichotomous variables representing the different years considered (2016 to 2021) was created to consider the temporal autocorrelation. To measure the impact of the energy label, the ordinal scale proposed by the European Commission was used. In detail, the Energy Performance Certificate (EPC) scale of 12 levels was reduced to 7 by including the levels above A in a single level, where 1 indicates the worst class G and 7 the best class A [47,64,65]. The local variables were calculated by the Geographic Information System (GIS) using the spatial coordinates. The proximity to major urban parks in the city was considered, with the walking distance in minutes calculated from the nearest green area; as parks are public urban infrastructures that can be visited on a daily basis with a large gravitational effect, it would be more correct to take into account the travel time required to reach them [66]. Following Iftekhar et al. [60], a dummy variable indicating if the apartment was located near a main street was considered. In detail, the proximity to the busiest streets were considered: Corso Giulio Cesare and Corso Novara. Given that some authors have demonstrated the significance of the benefits provided by blue infrastructure, the proximity to Dora Riparia River was analyzed using a dichotomic variable [67,68]. Since the objective of the study is to measure consumer appreciation of living in a redeveloped area from the transformation of the block, it was decided to consider the Euclidean distance to each flat, rather than walking distance. Furthermore, the results can be compared to previous studies on the case study that measured the impact by taking distance buffers into account [19].
Unfortunately, it was not possible to add socio-economic data in the regression model. In Italy, the latest socio-economic data at a statistical area level date back to 2011 [69]. Using these data would have led to a bias in the estimation as they are not up-to-date. The indices updated to 2021 are measured at neighbourhood level, resulting in a uniform result for the entire area, as the analysis focused on a small portion of the city.
Table 2 shows the independent variables taken into consideration in the models, as well as the dependent one. The sample’s average bid price was around EUR 122,500, with a square meter value of EUR 1470. Most of the flats were located between the second and third floors. The majority of the properties had elevators (0.68 average value). The typical year of construction was 1955. The most common market segment (1.30), as well as the state of maintenance (1.39), were both above the medium level. Few houses had an attached garage (0.16 average value). The average EPC value was 2.52, indicating a high concentration of buildings with poor energy efficiency. The average commute time to an urban park was approximately 16 min. The average distance to the block was 340 m, with a minimum of 13 m and a maximum of 740 m.

4. Results

4.1. OLS-Based Estimates

First, the standard OLS-based hedonic regression approach was used to study the relationship between the property characteristics and the offer price. The first model (Model 1) is a linear type (lin-lin) where both the dependent variable (price) and the explanatory variables are fitted in their full scale (Table 3). The statistical-estimation indices indicated a good model performance: R2 of 75%. The variable ‘Dwelling level’ was not significant in any of the models developed, therefore, it was always omitted. The model does not show any collinearity phenomena: the values of the Variance inflation factor (VIF) were, in fact, between a maximum of 2.137 for the variable 2018 and a minimum of 1.039 for the Dora Riparia River view variable. Almost all variables were significant at 5% (Sign. < 0.05). The multiple regression model (Model 1) provides, through the coefficients of the different independent variables, the statistical estimation of the implied marginal prices of the following property characteristics:
  • For the surface area variable, the marginal price, with a positive sign, was EUR 1710.07 per m2 of commercial area. This means that the marginal increase of one unit of floor space resulted in an increase of approximately EUR 1710 in the value of the property.
  • For the lift variable, the marginal price, with a positive sign, was EUR 6454 due to the presence of a lift inside the building in which the property was located, but it was not significant. This was also confirmed by the relatively low marginal price.
  • The year of construction obtained a positive marginal price of EUR 473. This means that newer properties were valued on the market.
  • For the variable ‘Property type’, the jump in each level of the time scale obtained a marginal price of EUR 7744.
  • For the variable ‘Maintenance status’ the marginal price, with a positive sign, was EUR 19,734 for each point on the ordinal scale (0 to 3).
  • The presence of a garage amounted in marginal price terms to EUR 8007.
  • For the energy class variable (CLEN), the marginal price was EUR 5211 for each point on the ordinal scale (1 to 7). The sign was the same as expected, and the coefficient was statistically significant (Sign. > 0.05).
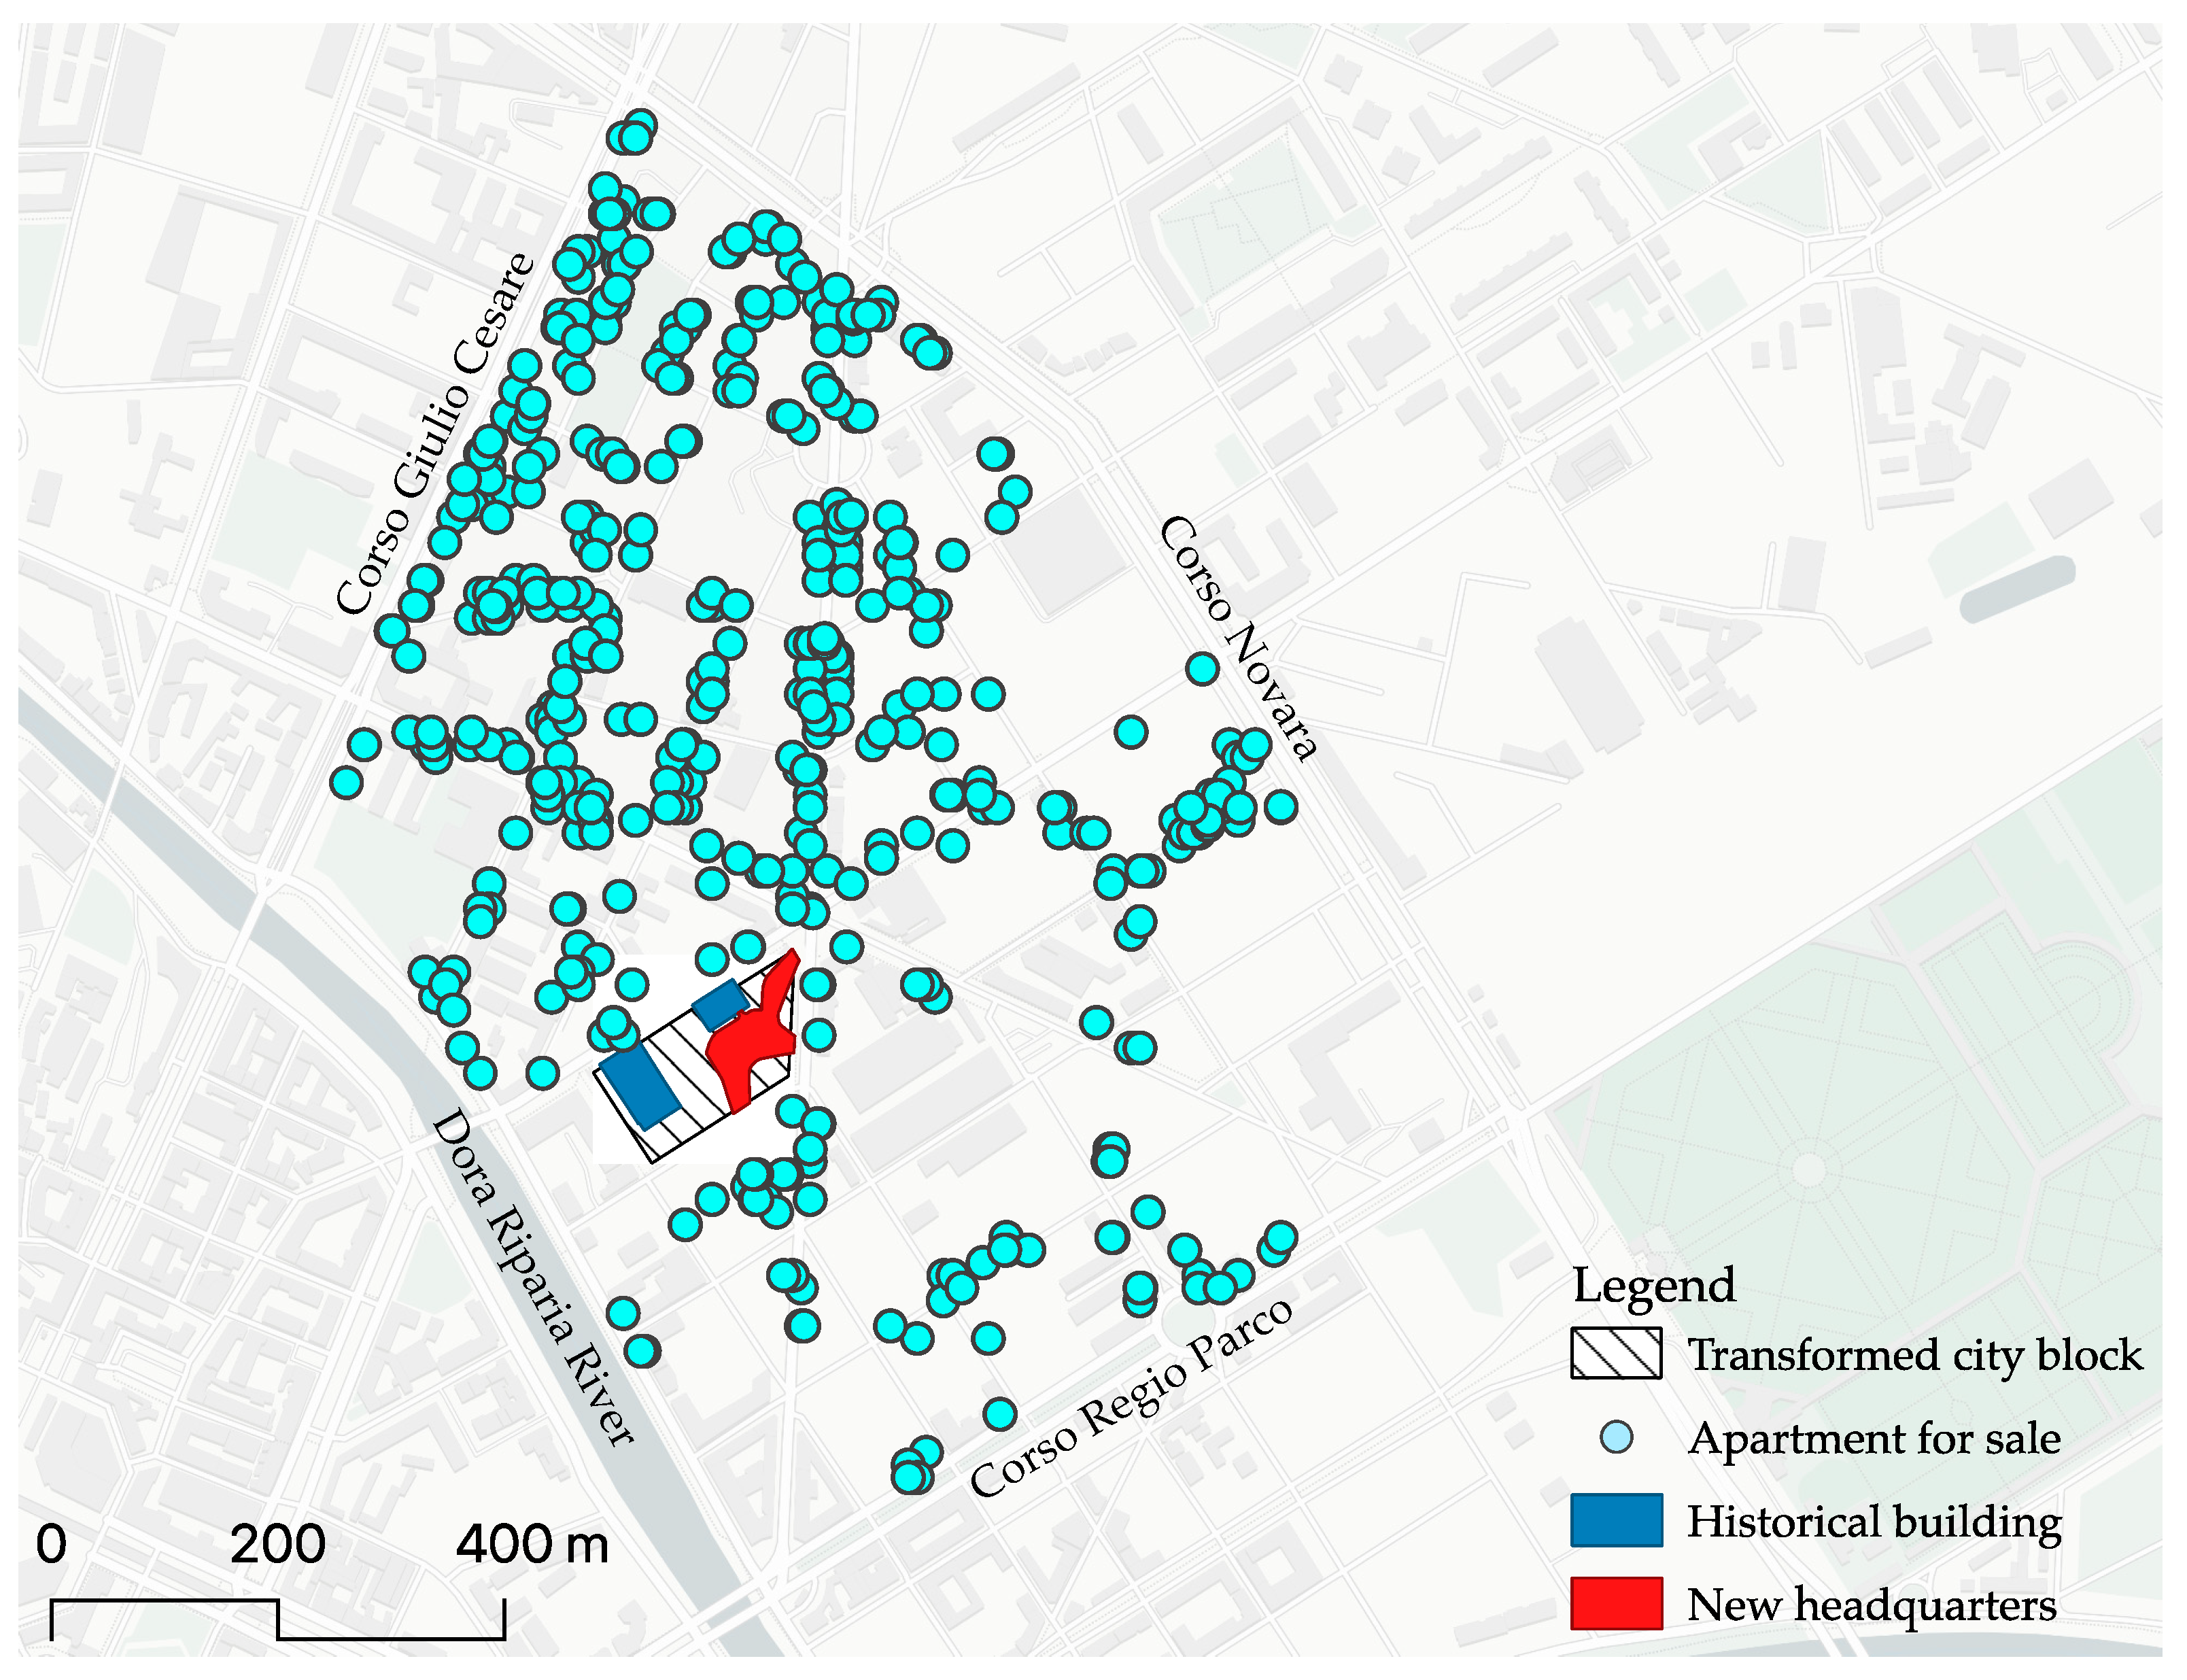
  • The set of dichotomous variables of the years in which the advertisements were published indicate a decrease in asking prices in recent years compared to 2016 (variable omitted), in line with the general situation in the city of Turin. Focusing on the Aurora district, it is possible to say that the prices were falling in general, though further clarification is required. In fact, the area under consideration can be divided into two very different zones, and the pricing does not differ only by the characteristics of the property. This adaptive reuse project actually spans two neighborhoods, Regio Parco and Aurora, which had very different market values. On the one hand, Regio Parco benefits from a new university campus, while Aurora suffers from the nearby Barriera di Milano’s high level of insecurity; therefore, while the south-eastern part of the area had maintained constant prices, the north-western area had seen the most significant percentage fluctuations. The high degree of insecurity of the nearby Barriera di Milano, as well as the high percentage of empty houses, contributed to price decreases in this sub-zone of the studied area. To this it must be added that the area’s offer is very popular and frequently in need of redevelopment; however, incorporating a dichotomous variable that takes into account this subdivision into sub-areas is difficult because the effects are not easily circumscribed into defined boundaries [70]. To test whether the average prices per square meter were affected by this price variation over time, a Pearson’s linear correlation coefficient [71] between the average price and distance to the transformed city block was calculated. The Pearson’s correlation index confirmed that a significant negative linear relationship existed between the price and distance increase for all the years considered; therefore, it can be assumed that a gravitational effect exists, and that it has increased over the years, as shown by the increasing correlation index over time (Table 4).
  • The distance to parks in terms of walking distance seems to have negatively influenced prices; for each additional minute of walking to the park, the price of properties decreased by EUR 3204.46.
  • The proximity to a busy road negatively affected the asking prices by EUR 12,766.
  • The view of the Dora Riparia River affected positively the asking prices by EUR 23,300.
  • The Euclidean distance to the transformed block similarly seems to influence the property prices, with a greater appreciation for flats located in its proximity; for every meter of distance there was an EUR 80 decrease in the value of the offer price.
Thus, from this first model it is possible to conclude that proximity to the block transformed by the regeneration process is a crucial variable for those who choose to live in the area 1. The results are in line with what is stated by ‘Federazione Italiana Agenti Immobiliari Professionali’, which operates in the area. Its survey has found that within a radius of 200 m from the Nuvola, property values have risen by as much as 25% [19]. The increase is much larger in the redeveloped buildings opposite the new headquarters. This percentage gradually decreases as one moves further away from the block. In fact, 500 m from the site the increase over the last two years averaged 15%.

4.2. Multiplicative Exponential Model

In order to better investigate the modelling of the variable relating to the distance to the transformed block, other possible approaches using an inherently non-linear function have been hypothesized. Such functions in fact work best with distance variables, as the relationship with price is hardly linear. A widely used functional form in this field is the multiplicative exponential model, as it is better suited to investigate the real estate phenomenon and the interactions between the variables considered. In Model 2, the model was set following the same variable input system as the model developed previously. The Model 2 produced a determination index of 82.6% (Table 5).
In a multiplicative exponential model, the estimated coefficients were not directly interpretable as marginal prices since they were expressed as exponents of the variable. To estimate the monetary values, it was necessary to use the Cobb–Douglas production function, and to calculate the partial derivatives (Equation (4), Section 3.2.2). All coefficients of the explanatory variables turned out to be significant and equal to the expected and undivided sign in Model 1. Looking at the coefficients obtained from Model 2, the variable of the year of construction was the one that most influenced the market value (coefficient 6.473). Then followed the surface area with a coefficient of 1.090. In this case, too, the variable of the distance from the renovated neighborhood had a negative sign, with a value equal to −0.094.

5. Discussion

Most HPM-based research follows Rosen’s two-step process [18]. After estimating the hedonic equation, it must be differentiated in order to determine the implicit pricing of product characteristics, and after that, the demand for each attribute must be estimated as a function of price [76,77]. After estimating the coefficients, marginal prices can be calculated for each meter away from the block under consideration. Using the estimated hedonic property price equation, the implicit marginal price of the housing characteristics was calculated from the results of Model 2 according to Equation (4). The Cobb-Douglas production function made it possible to calculate the implicit price assigned by the real estate market at each distance level from the transformed plot (Figure 4). According to Table 6’s descriptive study, the average property price reduced by EUR 63.50 every increasing distance meter. Model 1’s regression results are confirmed by this estimate. Figure 4 depicts the distribution of the marginal price as a function of the distance between each observation within an 800 m radius. The graph demonstrates how the benefits decreased with distance and how the influence of externalities was most prominent within 200 m, with a large effect within 50 m.
Then, once the implicit marginal prices were derived as a function of distance, they were used to estimate the marginal WTP demand function revealed by the sales prices [78]. The graph in Figure 5 depicts the marginal bid function for a household within an 800 m radius of the area under study. When one intends to derive a demand function from cross-sectional data, the lack of homogeneity means that each model is unable to provide a perfectly valid estimate; however, having restricted the analysis to a portion of the city of Turin should have limited the bias, assuming, for example, a socio-economic homogeneity of the population and an equal supply of services in the area. This could have led to an underestimation of the real willingness to pay of individuals [79]. Given that the aim was to investigate the benefit to live in a requalified neighborhood, it was assumed that the WTP was comparable to that of a public good, and that the area under the demand curve approximated the welfare gains of households. The estimated annual flow of benefits provided by the regeneration process was calculated by considering the average WTP per household, multiplied by the average number of apartments in an 800 m radius. In detail, the 800 m buffer was divided into six sections to consider the distribution of the WTP in space. To take into account the effects at different distances and the distribution of households in the surrounding area, we calculated the number of residential flats for each buffer. For the calculation of the flats, reference was made to the data provided by the ‘Base Dati Territoriale di Riferimento degli Enti’ (BDTRE) of the Piedmont Region for the year 2021. Starting from the floor area of each building and multiplied by the number of floors and then divided by the average size of the flats in our sample (82 m2), the number of flats for each buffer was obtained.
Table 7 displays the household’s estimated marginal WTP for the distance. According to the findings, the capitalized advantage offered by the redevelopment within 800 m was EUR 16,650,445.22. The greatest effect naturally occurred in the surrounding area, as is obvious for the buildings opposite and in the first 50 m. The influence lowered as it moved further away, and ultimately fell significantly beyond 600 m.
The results highlight the high potential provided by brownfield redevelopments as the engines for neighborhood regeneration. The benefits, of course, are not limited exclusively to those of individuals related to increased property values. In particular, brownfields are located in strategic areas of the urban fabric, and this is where investors can stake their investments. The interaction of adaptively reused facilities with the urban context has the capacity to transform into the engine of development for neighboring areas. These interventions are capable of triggering a series of redevelopment interventions capable of generating not only economic but also cultural capital [80]. The case study project analyzed focused not only on the redevelopment of the historic building itself, but an in-depth study was performed on the relationship with the city; however, the HPM provides only a partial and aggregate assessment of the benefits provided by these interventions. The HPM allows limited impacts to be captured for those living near the site of interest, who can enjoy the public services provided. The redeveloped disused historic assets have not only an infrastructural role, but also a strong aesthetic and cultural value, as they improve the aesthetic quality of neighborhoods, bringing benefits to the entire community. This implies a raising awareness in public decision-making for policies that provide well-managed public spaces while ensuring the preservation of disused building stock. In addition, the results can support private developers’ choices in locating investments, favoring areas close to those areas with a high regeneration potential.

6. Conclusions

Currently, abandoned industrial buildings make up a significant portion of the housing stock in Italy and around the world, particularly in developed countries. Accelerating the transition of these decommissioned buildings to the circular economy is the current challenge for institutions and cities, since the transition process can be aided at the local and urban levels. Best practices and circular experiments can be initiated within the city system, defined as the interconnection of inhabited areas, commercial and industrial areas, and green and agricultural areas, in order to reclaim the community’s identity and past. Regenerating the city’s unused or underutilized spaces and buildings necessitates rethinking their destinations and new productive, recreational, and social functions. It is always important to calculate the public benefit derived from an intervention, whether of a building or a space, as well as the potential of the new functions to be settled, when making decisions. Measurable indicators should allow for an understanding of how much the intervention returns in terms of the costs and benefits and to obtain a complete picture of the net benefit generated, all the impacts, direct and indirect, measurable and non-measurable, should be considered when calculating the utility of an intervention for a given area. Comprehensive evaluations can also be used to determine the public value of an investment, such as the provision of free public space, subsidized taxation, or financing. The current study adds to the scientific literature in this field by estimating the economic benefit of a Turin urban redevelopment intervention. In detail, the HPM method was used to estimate the spillover effect in terms of increased property value generated in the surrounding area, starting with a sample of residential property sales ads. The capitalized benefit gained by the block redevelopment within 800 m, according to the findings, was EUR 16,650,445. The greatest effect occurs naturally in the surrounding area, as evidenced by the buildings opposite and the first 50 m. The influence decreased as it moved further away, eventually dropping significantly beyond 600 m. The findings indicated that, in addition to improving the lives of its residents, the redevelopment of the area under investigation had a positive impact on the real estate market, both in terms of the number of purchases and sales and the market values. The construction of the Nuvola, the new Lavazza business center in Turin, and all ancillary interventions are examples of how a building redevelopment project can kickstart a redevelopment process of the entire surrounding area.
These findings provide empirical evidence in support of the efficacy of adaptive reuse projects at abandoned industrial heritage sites, making this study a valuable resource for a better understanding of the scope of social welfare. Understanding the importance of heritage is especially important in light of the new European urban environmental policy movement based on the circular economy, which aims to change the way Europeans consume and produce materials and energy. In this regard, policymakers may find it useful to compare the costs involved and the incentive policies in reuse projects in order to determine the net welfare effect of adaptive reuse in a decision support framework.
This study investigated the causation between the regeneration project and the offer prices, based on the previous findings which identified an increase in the real estate market prices in the area under consideration. However, creating difference-in-difference models in the future, by comparing the transaction trends before and after the regeneration intervention, should bolster the case that the redevelopment has resulted in the capitalization of nearby property prices. A limitation of this study is that it only considers the value of regeneration processes to consumers in the private housing market, who represent only a portion of Turin’s housing stock. An assessment of the commercial and tertiary construction market could evaluate impacts in other economic terms.

Funding

This research received no external funding.

Institutional Review Board Statement

Not applicable.

Informed Consent Statement

Not applicable.

Data Availability Statement

Not applicable.

Conflicts of Interest

The author declares no conflict of interest.

Note

1
Different models were explored to analyze the spatial dependence of the dependent variable (spatial lagged model, SLM) and of the error term (spatial error model, SEM) [72,73,74,75]. The SEM model performed the best in terms of significance of the Lagrange multiplier, with an R2 equal to 0.79; however, the main result concerning the effect of the development area is the same.

References

  1. Berger, S.; High, S. (De-)Industrial Heritage. Labor 2019, 16, 1–27. [Google Scholar] [CrossRef]
  2. Berta, M.; Bottero, M.; Bravi, M.; Dell’Anna, F.; Rapari, A. The Regeneration of a Shopping Center Starts from Consumers’ Preferences: A Best-Worst Scaling Application. In Lecture Notes in Computer Science (Including Subseries Lecture Notes in Artificial Intelligence and Lecture Notes in Bioinformatics); Springer: Berlin/Heidelberg, Germany, 2021; Volume 12955, pp. 533–543. [Google Scholar] [CrossRef]
  3. Arbab, P.; Alborzi, G. Toward developing a sustainable regeneration framework for urban industrial heritage. J. Cult. Herit. Manag. Sustain. Dev. 2021, 12, 263–274. [Google Scholar] [CrossRef]
  4. Pickerill, T. Investment Leverage for Adaptive Reuse of Cultural Heritage. Sustainability 2021, 13, 5052. [Google Scholar] [CrossRef]
  5. Tu, H.M. Sustainable heritage management: Exploring dimensions of pull and push factors. Sustainability 2020, 12, 8219. [Google Scholar] [CrossRef]
  6. Eom, J.S.; Yoon, S.H.; An, D.W. The sustainability of regenerative cafes utilizing idle industrial facilities in south korea. Sustainability 2021, 13, 4784. [Google Scholar] [CrossRef]
  7. Owojori, O.M.; Okoro, C.S.; Chileshe, N. Current Status and Emerging Trends on the Adaptive Reuse of Buildings: A Bibliometric Analysis. Sustainability 2021, 13, 11646. [Google Scholar] [CrossRef]
  8. Hamida, M.B.; Jylhä, T.; Remøy, H.; Gruis, V. Circular building adaptability and its determinants—A literature review. Int. J. Build. Pathol. Adapt. 2022, in press. [CrossRef]
  9. Guo, P.; Li, Q.; Guo, H.; Li, H. Quantifying the core driving force for the sustainable redevelopment of industrial heritage: Implications for urban renewal. Environ. Sci. Pollut. Res. 2021, 28, 48097–48111. [Google Scholar] [CrossRef]
  10. Radziszewska-Zielina, E.; Adamkiewicz, D.; Szewczyk, B.; Kania, O. Decision-Making Support for Housing Projects in Post-Industrial Areas. Sustainability 2022, 14, 3573. [Google Scholar] [CrossRef]
  11. Bosone, M.; De Toro, P.; Girard, L.F.; Gravagnuolo, A.; Iodice, S. Indicators for Ex-Post Evaluation of Cultural Heritage Adaptive Reuse Impacts in the Perspective of the Circular Economy. Sustainability 2021, 13, 4759. [Google Scholar] [CrossRef]
  12. Dell’Ovo, M.; Dell’Anna, F.; Simonelli, R.; Sdino, L. Enhancing the Cultural Heritage through Adaptive Reuse. A Multicriteria Approach to Evaluate the Castello Visconteo in Cusago (Italy). Sustainability 2021, 13, 4440. [Google Scholar] [CrossRef]
  13. Adelaja, S.; Shaw, J.; Beyea, W.; McKeown, J.C. Renewable energy potential on brownfield sites: A case study of Michigan. Energy Policy 2010, 38, 7021–7030. [Google Scholar] [CrossRef]
  14. Rossitti, M.; Oppio, A.; Torrieri, F. The Financial Sustainability of Cultural Heritage Reuse Projects: An Integrated Approach for the Historical Rural Landscape. Sustainability 2021, 13, 13130. [Google Scholar] [CrossRef]
  15. Centis, L.; Micelli, E. Regenerating Places outside the Metropolis. A Reading of Three Global Art-Related Processes and Development Trajectories. Sustainability 2021, 13, 12359. [Google Scholar] [CrossRef]
  16. Trisciuoglio, M.; Barosio, M.; Ricchiardi, A.; Tulumen, Z.; Crapolicchio, M.; Gugliotta, R. Transitional Morphologies and Urban Forms: Generation and Regeneration Processes—An Agenda. Sustainability 2021, 13, 6233. [Google Scholar] [CrossRef]
  17. Iodice, S.; De Toro, P.; Bosone, M. Circular Economy and adaptive reuse of historical buildings: An analysis of the dynamics between real estate and accommodation facilities in the city of Naples (Italy). Aestimum 2020, 2020, 103–124. [Google Scholar] [CrossRef]
  18. Rosen, S. Hedonic Prices and Implicit Markets: Product Differentiation in Pure Competition. J. Politi Econ. 1974, 82, 34–55. [Google Scholar] [CrossRef]
  19. Federazione Italiana Agenti Immobiliari Professionali—Fiaip. A Torino Prezzi Immobili +25% in 2 Anni in Zona Nuvola Lavazza—Fiaip. Available online: https://www.fiaip.it/news/news-territoriali/piemonte/torino/a-torino-prezzi-immobili-25-in-2-anni-in-zona-nuvola-lavazza/ (accessed on 6 June 2022).
  20. Cerreta, M.; Elefante, A.; La Rocca, L. A Creative Living Lab for the Adaptive Reuse of the Morticelli Church: The SSMOLL Project. Sustainability 2020, 12, 10561. [Google Scholar] [CrossRef]
  21. Engwall, M. No project is an island: Linking projects to history and context. Res. Policy 2003, 32, 789–808. [Google Scholar] [CrossRef]
  22. Bottero, M.; Bragaglia, F.; Caruso, N.; Datola, G.; Dell’Anna, F. Experimenting community impact evaluation (CIE) for assessing urban regeneration programmes: The case study of the area 22@ Barcelona. Cities 2020, 99, 102464. [Google Scholar] [CrossRef]
  23. Capolongo, S.; Sdino, L.; Dell’Ovo, M.; Moioli, R.; Della Torre, S. How to Assess Urban Regeneration Proposals by Considering Conflicting Values. Sustainability 2019, 11, 3877. [Google Scholar] [CrossRef] [Green Version]
  24. Dell’Anna, F.; Dell’Ovo, M. A stakeholder-based approach managing conflictual values in urban design processes. The case of an open prison in Barcelona. Land Use Policy 2022, 114, 105934. [Google Scholar] [CrossRef]
  25. Everard, M.; Reed, M.S.; Kenter, J.O. The ripple effect: Institutionalising pro-environmental values to shift societal norms and behaviours. Ecosyst. Serv. 2016, 21, 230–240. [Google Scholar] [CrossRef]
  26. Bottero, M.; Assumma, V.; Caprioli, C.; Dell’Ovo, M. Decision making in urban development: The application of a hybrid evaluation method for a critical area in the city of Turin (Italy). Sustain. Cities Soc. 2021, 72, 103028. [Google Scholar] [CrossRef]
  27. Dell’Ovo, M.; Bassani, S.; Stefanina, G.; Oppio, A. Memories at risk. How to support decisions about abandoned industrial heritage regeneration. Valori Valutazioni 2020, 2020, 107–115. [Google Scholar]
  28. Della Spina, L. Adaptive Sustainable Reuse for Cultural Heritage: A Multiple Criteria Decision Aiding Approach Supporting Urban Development Processes. Sustainability 2020, 12, 1363. [Google Scholar] [CrossRef] [Green Version]
  29. Bottero, M.; Ferretti, V.; Mondini, G. How to Support Strategic Decisions in Territorial Transformation Processes. Int. J. Agric. Environ. Inf. Syst. 2015, 6, 40–55. [Google Scholar] [CrossRef] [Green Version]
  30. Jayantha, W.M.; Yung, E.H.K. Effect of Revitalisation of Historic Buildings on Retail Shop Values in Urban Renewal: An Empirical Analysis. Sustainability 2018, 10, 1418. [Google Scholar] [CrossRef] [Green Version]
  31. Boscacci, F.; Camagni, R.; Caragliu, A.; Maltese, I.; Mariotti, I. Collective benefits of an urban transformation: Restoring the Navigli in Milan. Cities 2017, 71, 11–18. [Google Scholar] [CrossRef]
  32. Shehata, A.M. Current Trends in Urban Heritage Conservation: Medieval Historic Arab City Centers. Sustainability 2022, 14, 607. [Google Scholar] [CrossRef]
  33. Torrieri, F.; Fumo, M.; Sarnataro, M.; Ausiello, G. An Integrated Decision Support System for the Sustainable Reuse of the Former Monastery of “Ritiro del Carmine” in Campania Region. Sustainability 2019, 11, 5244. [Google Scholar] [CrossRef] [Green Version]
  34. Conejos, S.; Langston, C.; Smith, J. Designing for better building adaptability: A comparison of adaptSTAR and ARP models. Habitat Int. 2014, 41, 85–91. [Google Scholar] [CrossRef]
  35. Becchio, C.; Bottero, M.C.; Corgnati, S.P.; Dell’Anna, F. Evaluating Health Benefits of Urban Energy Retrofitting: An Application for the City of Turin. In Smart and Sustainable Planning for Cities and Regions; Bisello, A., Vettorato, D., Laconte, P., Costa, S., Eds.; Springer: Cham, Switzerland, 2018; pp. 281–304. ISBN 9783319757735. [Google Scholar] [CrossRef]
  36. Castles, A. Community Initiated Adaptive Reuse for Culture and the Arts: ‘The Tanks Arts Centre’ Cairns, Australia. eTrop. Electron. J. Stud. Trop. 2020, 19, 119–142. [Google Scholar] [CrossRef]
  37. Napoli, G.; Bottero, M.; Ciulla, G.; Dell’Anna, F.; Figueira, J.R.; Greco, S. Supporting public decision process in buildings energy retrofitting operations: The application of a Multiple Criteria Decision Aiding model to a case study in Southern Italy. Sustain. Cities Soc. 2020, 60, 102214. [Google Scholar] [CrossRef]
  38. Oppio, A.; Bottero, M. Conflicting values in designing adaptive reuse for cultural heritage. A case study of social multicriteria evaluation. In Lecture Notes in Computer Science (Including Subseries Lecture Notes in Artificial Intelligence and Lecture Notes in Bioinformatics); Springer Verlag: Berlin/Heidelberg, Germany, 2017; Volume 10406, pp. 607–623. [Google Scholar]
  39. Kee, T.; Chau, K.W. Adaptive reuse of heritage architecture and its external effects on sustainable built environment—Hedonic pricing model and case studies in Hong Kong. Sustain. Dev. 2020, 28, 1597–1608. [Google Scholar] [CrossRef]
  40. Bottero, M.; D’Alpaos, C.; Marello, A. An Application of the A’WOT Analysis for the Management of Cultural Heritage Assets: The Case of the Historical Farmhouses in the Aglié Castle (Turin). Sustainability 2020, 12, 1071. [Google Scholar] [CrossRef] [Green Version]
  41. Oevermann, H.; Degenkolb, J.; Dießler, A.; Karge, S.; Peltz, U. Participation in the reuse of industrial heritage sites: The case of Oberschöneweide, Berlin. Int. J. Herit. Stud. 2016, 22, 43–58. [Google Scholar] [CrossRef]
  42. Cizler, J. Urban regeneration effects on industrial heritage and local community—Case study: Leeds, UK. Sociol. Prost. 2012, 50, 223–236. [Google Scholar] [CrossRef] [Green Version]
  43. Citron, R.S. Urban regeneration of industrial sites: Between heritage preservation and gentrification. Trans. Built Environ. 2021, 203, PI263–PI273. [Google Scholar] [CrossRef]
  44. Liu, C.; Liu, X. Adaptive Reuse of Religious Heritage and Its Impact on House Prices. J. Real Estate Financ. Econ. 2020, 64, 71–92. [Google Scholar] [CrossRef]
  45. Barrio, M.; Loureiro, M.L. A meta-analysis of contingent valuation forest studies. Ecol. Econ. 2010, 69, 1023–1030. [Google Scholar] [CrossRef]
  46. Wright, W.C.; Eppink, F.V. Drivers of heritage value: A meta-analysis of monetary valuation studies of cultural heritage. Ecol. Econ. 2016, 130, 277–284. [Google Scholar] [CrossRef]
  47. Bronnmann, J.; Liebelt, V.; Marder, F.; Meya, J.; Quaas, M.F. The Value of Naturalness of Urban Green Spaces: Evidence from a Discrete Choice Experiment; Working Papers 128/20; University of Southern Denmark, Department of Sociology, Environmental and Business Economics: Odense, Denmark, 2020. [Google Scholar]
  48. Cao, Y.; Swallow, B.; Qiu, F. Identifying the effects of a land-use policy on willingness to pay for open space using an endogenous switching regression model. Land Use Policy 2021, 102, 105183. [Google Scholar] [CrossRef]
  49. Jensen, C.U.; Panduro, T.E.; Lundhede, T.H.; von Graevenitz, K.; Thorsen, B.J. Who demands peri-urban nature? A second stage hedonic house price estimation of household’s preference for peri-urban nature. Landsc. Urban Plan. 2021, 207, 104016. [Google Scholar] [CrossRef]
  50. Barreca, A.; Curto, R.; Malavasi, G.; Rolando, D. Energy Retrofitting for the Modern Heritage Enhancement in Weak Real Estate Markets: The Olivetti Housing Stock in Ivrea. Sustainability 2022, 14, 3507. [Google Scholar] [CrossRef]
  51. Bottero, M.; Caprioli, C.; Foth, M.; Mitchell, P.; Rittenbruch, M.; Santangelo, M. Urban parks, value uplift and green gentrification: An application of the spatial hedonic model in the city of Brisbane. Urban For. Urban Green. 2022, 74, 127618. [Google Scholar] [CrossRef]
  52. Dell’Anna, F.; Bottero, M.; Bravi, M. Geographically Weighted Regression Models to Investigate Urban Infrastructures Impacts. In Lecture Notes in Computer Science (Including Subseries Lecture Notes in Artificial Intelligence and Lecture Notes in Bioinformatics); Springer Science and Business Media Deutschland GmbH: Berlin/Heidelberg, Germany, 2021; Volume 12955, pp. 599–613. [Google Scholar]
  53. Chen, S.; Wang, Y.; Ni, Z.; Zhang, X.; Xia, B. Benefits of the ecosystem services provided by urban green infrastructures: Differences between perception and measurements. Urban For. Urban Green. 2020, 54, 126774. [Google Scholar] [CrossRef]
  54. Dell’Anna, F.; Bravi, M.; Bottero, M. Urban Green infrastructures: How much did they affect property prices in Singapore? Urban For. Urban Green. 2022, 68, 127475. [Google Scholar] [CrossRef]
  55. Rahman, M.; Hossain, T.; Chowdhury, R.H.; Uddin, M.S. Effects of Transportation Accessibility on Residential Housing Rent: Evidence from Metropolitan City of Khulna, Bangladesh. J. Urban Plan. Dev. 2021, 147, 04021009. [Google Scholar] [CrossRef]
  56. Berawi, M.A.; Miraj, P.; Saroji, G.; Sari, M. Impact of rail transit station proximity to commercial property prices: Utilizing big data in urban real estate. J. Big Data 2020, 7, 71. [Google Scholar] [CrossRef]
  57. Zhang, D.; Jiao, J. How Does Urban Rail Transit Influence Residential Property Values? Evidence from An Emerging Chinese Megacity. Sustainability 2019, 11, 534. [Google Scholar] [CrossRef] [Green Version]
  58. Franco, S.F.; Macdonald, J.L. The effects of cultural heritage on residential property values: Evidence from Lisbon, Portugal. Reg. Sci. Urban Econ. 2018, 70, 35–56. [Google Scholar] [CrossRef] [Green Version]
  59. Chin, T.C.; Yan, B.T.; Wai, F.W.; Kong, S.L.; Koh, Y.X. Revealing the investment value of penang heritage properties. Plan. Malays. J. 2021, 19, 146–156. [Google Scholar] [CrossRef]
  60. Iftekhar, S.; Polyakov, M.; Rogers, A. Valuing the improvement of a decommissioned heritage site to a multifunctional water sensitive greenspace. J. Environ. Manag. 2022, 313, 114908. [Google Scholar] [CrossRef]
  61. Leontief, W. Input-Output Economics; Oxford University Press: Oxford, UK, 1986; ISBN 0195035275. [Google Scholar]
  62. Cabodi, C.; Caruso, N.; Mela, S.; Pede, E.; Rossignolo, C.; Saccomanni, S. Sguardi su AURORA: Tra Centro e Periferia; Politecnico di Torino: Turin, Italy, 2020; ISBN 978-88-85745-48-3. [Google Scholar]
  63. Lavazza, S.P.A. Programma Integrato ai Sensi L.R. n.18 del 1996; Progetto del Nuovo Centro Direzionale Lavazza: Turin, Italy, 2010. [Google Scholar]
  64. Curto, R.; Fregonara, E.; Semeraro, P. Prezzi di Offerta vs. Prezzi di Mercato: Un’analisi empirica. Territorio 2012, 12, 53–72. [Google Scholar]
  65. Michelangeli, A. l metodo dei prezzi edonici per la costruzione di indici dei prezzi per il mercato immobiliare. In Principi Metodologici per la Costruzione di Indici dei Prezzi nel Mercato; Del Giudice, V., D’Amato, M., Eds.; Maggioli Editore: Dogana, San Marino, 2008; pp. 102–113. [Google Scholar]
  66. Łaszkiewicz, E.; Heyman, A.; Chen, X.; Cimburova, Z.; Nowell, M.; Barton, D.N. Valuing access to urban greenspace using non-linear distance decay in hedonic property pricing. Ecosyst. Serv. 2021, 53, 101394. [Google Scholar] [CrossRef]
  67. Chaudhry, P.; Sharma, M.; Bhargava, R. Benefit-cost analysis of lake conservation with emphasis on aesthetics in developing countries. Int. J. Hydrol. Sci. Technol. 2013, 3, 111–127. [Google Scholar] [CrossRef]
  68. Gibbons, S.; Mourato, S.; Resende, G.M. The Amenity Value of English Nature: A Hedonic Price Approach. Environ. Resour. Econ. 2014, 57, 175–196. [Google Scholar] [CrossRef] [Green Version]
  69. ISTAT (Istituto Nazionale di Statistica) Population Housing Census 2011. Available online: https://www.istat.it/it/censimenti-permanenti/censimenti-precedenti/popolazione-e-abitazioni/popolazione-2011 (accessed on 10 April 2021).
  70. Osland, L. An Application of Spatial Econometrics in Relation to Hedonic House Price Modeling. J. Real Estate Res. 2010, 32, 289–320. [Google Scholar] [CrossRef]
  71. Pearson, K. Note on regression and inheritance in the case of two parents. Proc. R. Soc. Lond. 1895, 58, 240–242. [Google Scholar] [CrossRef]
  72. Anselin, L. A test for spatial autocorrelation in seemingly unrelated regressions. Econ. Lett. 1988, 28, 335–341. [Google Scholar] [CrossRef]
  73. Anselin, L.; Syabri, I.; Kho, Y. GeoDa: An Introduction to Spatial Data Analysis. Geogr. Anal. 2006, 38, 5–22. [Google Scholar] [CrossRef]
  74. LeSage, J.; Pace, R.K. Introduction to Spatial Econometrics; Chapman and Hall/CRC: Boca Raton, FL, USA, 2009; ISBN 9780429138089. [Google Scholar]
  75. Dell’Anna, F. Spatial Econometric Analysis of Multi-family Housing Prices in Turin: The Heterogeneity of Preferences for Energy Efficiency. In ICCSA 2022 Workshops, LNCS 13380; Gervasi, O., Ed.; Springer: Cham, Switzerland, 2022; pp. 1–17, in press. [Google Scholar] [CrossRef]
  76. Yinger, J. Hedonic Markets and Explicit Demands: Bid-Function Envelopes for Public Services, Neighborhood Amenities, and Commuting Costs; Center for Policy Research: Madrid, Spain, 2012; Volume 52. [Google Scholar]
  77. Tempesta, T. Benefits and costs of urban parks: A review. Aestimum 2015, 67, 127–143. [Google Scholar] [CrossRef]
  78. Nelson, J.P. Residential choice, hedonic prices, and the demand for urban air quality. J. Urban Econ. 1978, 5, 357–369. [Google Scholar] [CrossRef]
  79. Freeman, A.M. Hedonic Prices, Property Values and Measuring Environmental Benefits: A Survey of the Issues. Scand. J. Econ. 1979, 81, 154. [Google Scholar] [CrossRef] [Green Version]
  80. Andrioti, N.; Kanetaki, E.; Drinia, H.; Kanetaki, Z.; Stefanis, A. Identifying the Industrial Cultural Heritage of Athens, Greece, through Digital Applications. Heritage 2021, 4, 3113–3125. [Google Scholar] [CrossRef]
Figure 1. STEEP analysis of an industrial heritage adaptive reuse project.
Heritage 05 00082 g001
Figure 2. Location maps. The Piedmont Region is highlighted in red in (a), Turin is depicted in (b), and the transformed city block location is shown in (c) in relation to the municipal territory.
Heritage 05 00082 g002
Figure 3. Dataset sample mapping.
Heritage 05 00082 g003
Figure 4. Implicit marginal prices for the distance from transformed city block.
Heritage 05 00082 g004
Figure 5. Marginal willingness to pay (WTP) for the distance from transformed city block.
Heritage 05 00082 g005
Table 1. Review of econometric studies based on hedonic pricing method about urban amenities and infrastructure.
AuthorsPublication YearCity, StateGoalSubject of InvestigationAmenities and Location CharacteristicsResults
Liu and Liu [44]2022The NetherlandsInvestigating the external effect of reusing religious heritage on surrounding house prices.Religious heritageDisplacement to heritage (in m);The authors discover a significant positive externality of religious heritage reusing on local house prices. The external effects vary depending on the size of the project and its monumental status. Larger religious heritage reuse projects, as well as those designated as national monuments, have a greater impact on surrounding house prices.
Iftekhar et al. [60]2022Melbourne, AustraliaEvaluation of the improvement of a disused historical site into a water-sensitive multifunctional green space.Disused historical siteIf within 50 m of the main road; if within 50 m of reserves; if within 50 m of new project.The hedonic analysis has revealed that there has been an uplift in the prices of the properties adjacent to the Brooklyn Park project (within 50 m). The increment is about 5.4%.
Kee and Chau [39]2020Hong Kong, ChinaProviding empirical evidence on how heritage conservation fits into the overall sustainable development in Hong Kong by examining the external effects of architectural heritage conservation on their adjacent neighborhood.Architectural heritage conservationSea view; displacement to the nearest MRT station (in m); displacement to heritage (in m);The hedonic pricing model regression results confirmed that graded heritage architecture in Hong Kong can have a positive external effect on neighboring property prices.
Jayantha and Kwan Yung [30]2018Wanchai, ChinaInvestigating the existence of any relationship between revitalization of historic building developments and the value enhancement of nearby retail properties located at the ground floor in the old area of Wanchai in Hong Kong.Historic buildingDistance to the heritage site from the retail shop; distance to the heritage site from the newly built housing scheme.The findings indicate that the revitalization of historical sites benefits not only the surrounding property owners but also local governments in the area by increasing the value of neighborhood properties.
Boscacci et al. [31]2017Milan, ItalyAssessment of the collective benefits for Milan due to the project to restore the Navigli.Urban transformationDriving distance in minutes from Piazza Duomo; availability of green spaces in the close proximity; average height of neighborhood buildings/road width; % of quality buildings in the area; subway stop in close proximity; artificial amenities in close proximity; location in a pedestrian area; apartment is located within 500 m from the existing open Navigli; apartment faces the existing open Navigli; apartment faces the Navigli currently flowing underground.Empirical results confirm the collective net advantage of the urban transformation.
Table 2. Variables descriptive analysis.
VariableScaleMinMaxAverageStandard Deviation
Asking price (EUR) aCardinal16,000700,000122,545.6187,802.05
Asking price (EUR/m2) aCardinal351.304354.801467.18671.05
Surface area (m2)Cardinal3027981.0432.04
Dwelling levelOrdinal0102.661.72
Lift bNominal010.680.47
Construction yearCardinal182020221955.6331.41
Property type cOrdinal031.300.94
Maintenance status dOrdinal031.390.89
Car parkCardinal030.160.55
EPC eOrdinal072.521.92
2016 bNominal010.150.36
2017 bNominal010.020.15
2018 bNominal010.270.44
2019 bNominal010.160.36
2020 bNominal010.180.38
2021 bNominal010.220.42
Nearest urban park walking distance (minutes)Cardinal10.8419.7016.401.83
50 m from main roadsNominal010.110.32
Dora Riparia Rivers viewNominal010.010.11
Euclidian distance from transformed city block (meters)Cardinal13.50740.40340.84182.48
a dependent variable; b 1 if Yes, 0 if No; c Market segment (0 = Low; 1 = Medium; 2 = High; 3 = Very high); d Maintenance status (0 = To be restored; 1 = Good; 2 = Restored; 3 = New/Under construction); e Energy Performance Certificate, EPC (A = 7; B = 6; C = 5; D = 4; E = 3; F = 2; G = 1).
Table 3. OLS-based model results.
Model 1Unstandardized CoefficientstSign.95.0% Confidence IntervalCollinearity Statistics
βStandard ErrorLower LimitUpper LimitToleranceVIF
Intercept−900,306.815121,683.456−7.3990.000−1,139,158.909−661,454.722
Surface area1710.06850.07134.1530.0001611.7841808.3520.9051.105
Lift6454.9193813.1611.6930.091−1029.92413,939.7610.7331.363
Construction year473.55064.1957.3770.000347.542599.5590.5731.746
Property type7744.4141931.0924.0100.0003953.88011,534.9490.7061.416
Maintenance status19,734.1732117.5989.3190.00015,577.54723,890.7990.6591.517
Car park8007.0002924.3392.7380.0062266.82313,747.1770.9161.092
EPC5211.526950.2105.4850.0003346.3627076.6900.7031.423
2017−24,793.20610,618.531−2.3350.020−45,636.289−3950.1230.8741.144
2018−22,316.9345024.343−4.4420.000−32,179.203−12,454.6660.4682.137
2019−17,424.1545657.275−3.0800.002−28,528.803−6319.5060.5521.811
2020−18,258.7605508.690−3.3150.001−29,071.752−7445.7690.5251.906
2021−19,674.6505206.456−3.7790.000−29,894.386−9454.9140.4962.015
Nearest urban park walking distance −3204.465876.716−3.6550.000−4925.368−1483.5610.9071.103
50 m from main roads−12,766.7585555.449−2.2980.022−23,671.532−1861.9840.7551.324
Dora Riparia Rivers view23,300.80613,573.0081.7170.086−3341.61149,943.2230.9621.039
Euclidian distance from transformed city block−80.8799.932−8.1430.000−100.374−61.3840.7091.410
R2 = 0.755; Adjusted R2 = 0.750; Estimate standard error = 43,865.94; VIF = Variance inflation factor; 2016, omitted variable.
Table 4. Pearson’s correlation analysis between average price and distance from the transformed city block.
Year201620172018201920202021
Euclidian distance from trans-formed city block (meters)−0.284−0.315−0.367−0.449−0.399−0.424
Significance0.0010.0000.0000.0000.0000.000
Table 5. Results of the multiplicative exponential model.
Model 2Coefficient95.0% Confidence Interval
βStandard ErrorLower LimitUpper Limit
Intercept2.385 × 10−180.000−2.223 × 10172.700 × 1017
Surface area1.0900.0241.0431.137
Lift0.0760.0360.0060.145
Construction year6.4730.6995.1007.846
Property type0.1900.0290.1330.247
Maintenance status0.3640.0320.3010.427
Car park0.0960.0210.0550.138
EPC0.0910.0150.0610.121
2017−0.2680.113−0.490−0.046
2018−0.2040.038−0.279−0.130
2019−0.2830.045−0.371−0.195
2020−0.2730.044−0.358−0.187
2021−0.2240.043−0.308−0.139
Nearest urban park walking distance −0.5470.089−0.721−0.372
50 m from main roads−0.2670.052−0.368−0.165
Dora Riparia River view0.4530.1060.2440.662
Euclidian distance from transformed city block−0.0940.015−0.123−0.065
R2 = 0.826; 2016, omitted variable.
Table 6. Marginal price for distance from transformed city block.
Marginal Price (EUR/m)Distance from City Block (m)
MeanMin1QMedian3QMaxIQRSDMean
63.505.4417.3728.1666.14886.4848.7793.39340.84
Table 7. Economic externalities generated by reuse project.
Buffer (m)Residential Surface (m2)Apartments (No)WTP/Household (EUR)WTP (EUR)
13–5078199517,120.301,626,428.50
50–10016,2001987885.271,561,283.46
100–20034,4004207316.543,072,946.80
200–40093,13811366788.827,712,099.52
400–60048,9035963741.892,230,166.44
600–80014,3511752557.26447,520.50
Total 16,650,445.22
Publisher’s Note: MDPI stays neutral with regard to jurisdictional claims in published maps and institutional affiliations.

