

Big Data and Predictive Analytics for Business Intelligence: A Bibliographic Study (2000–2021)


Abstract
:1. Introduction
2. Methodology
2.1. Data Source
2.2. Analysis Tools
3. Results and Discussions
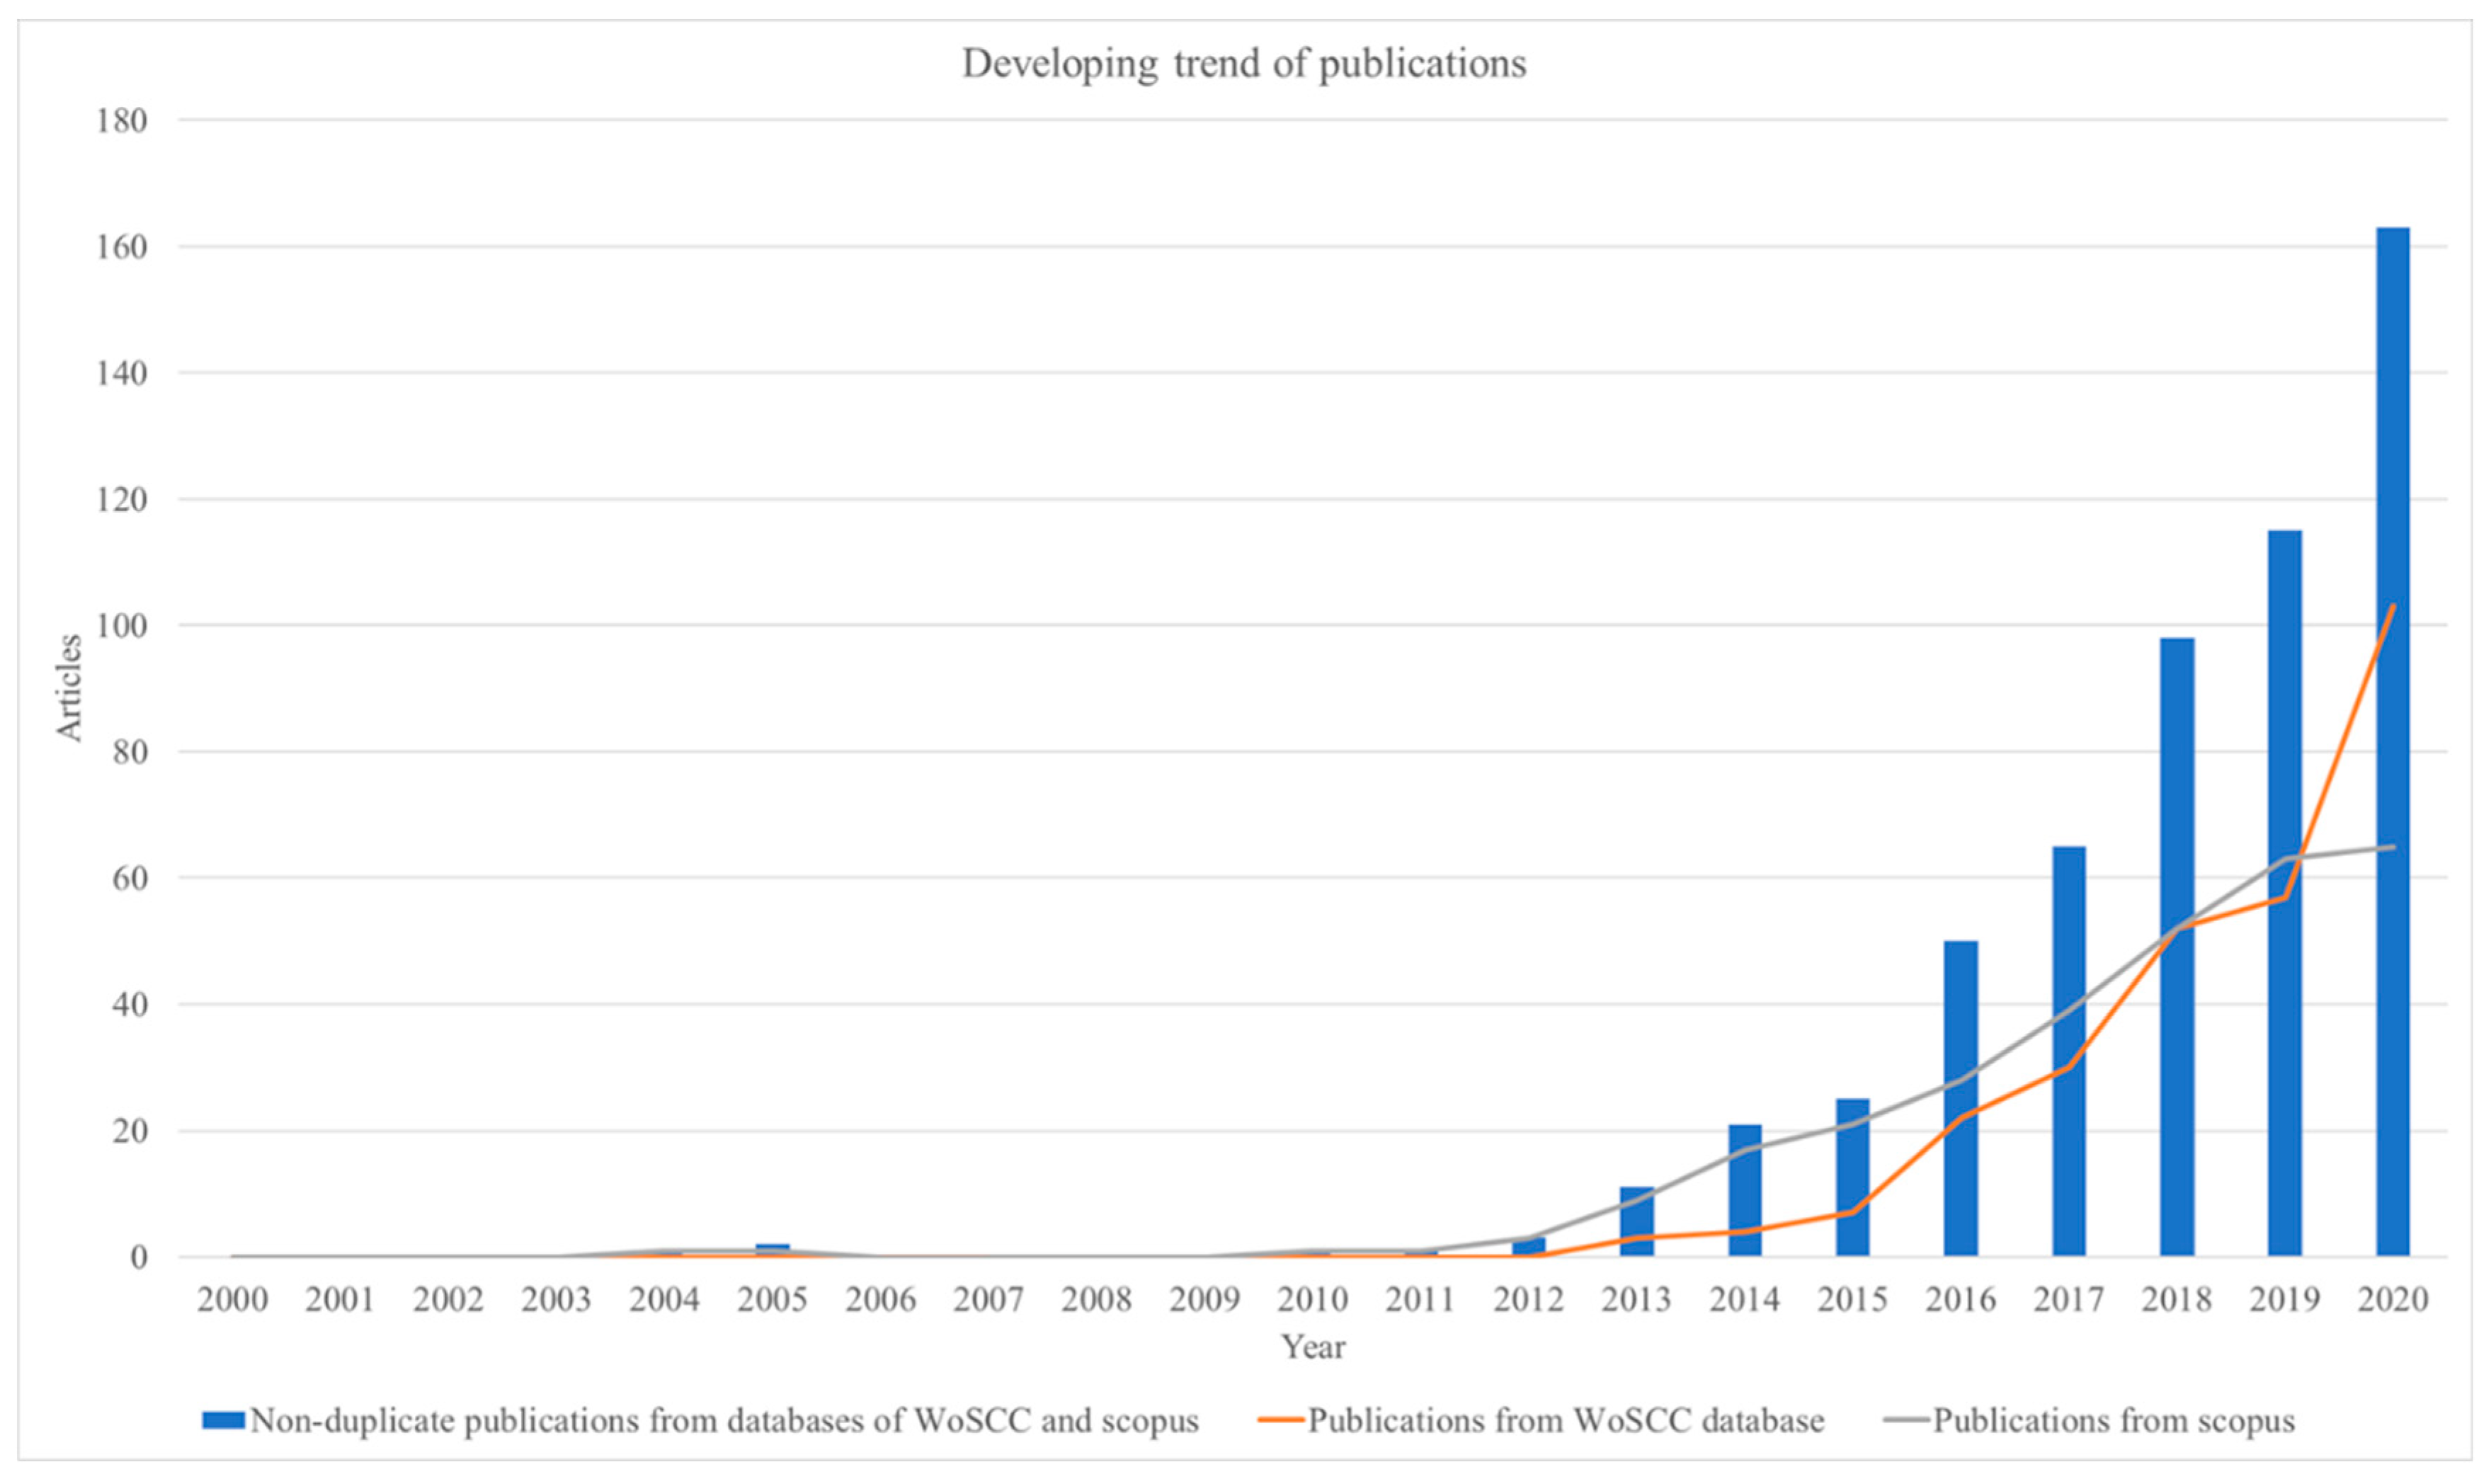
3.1. Trends in the Literature
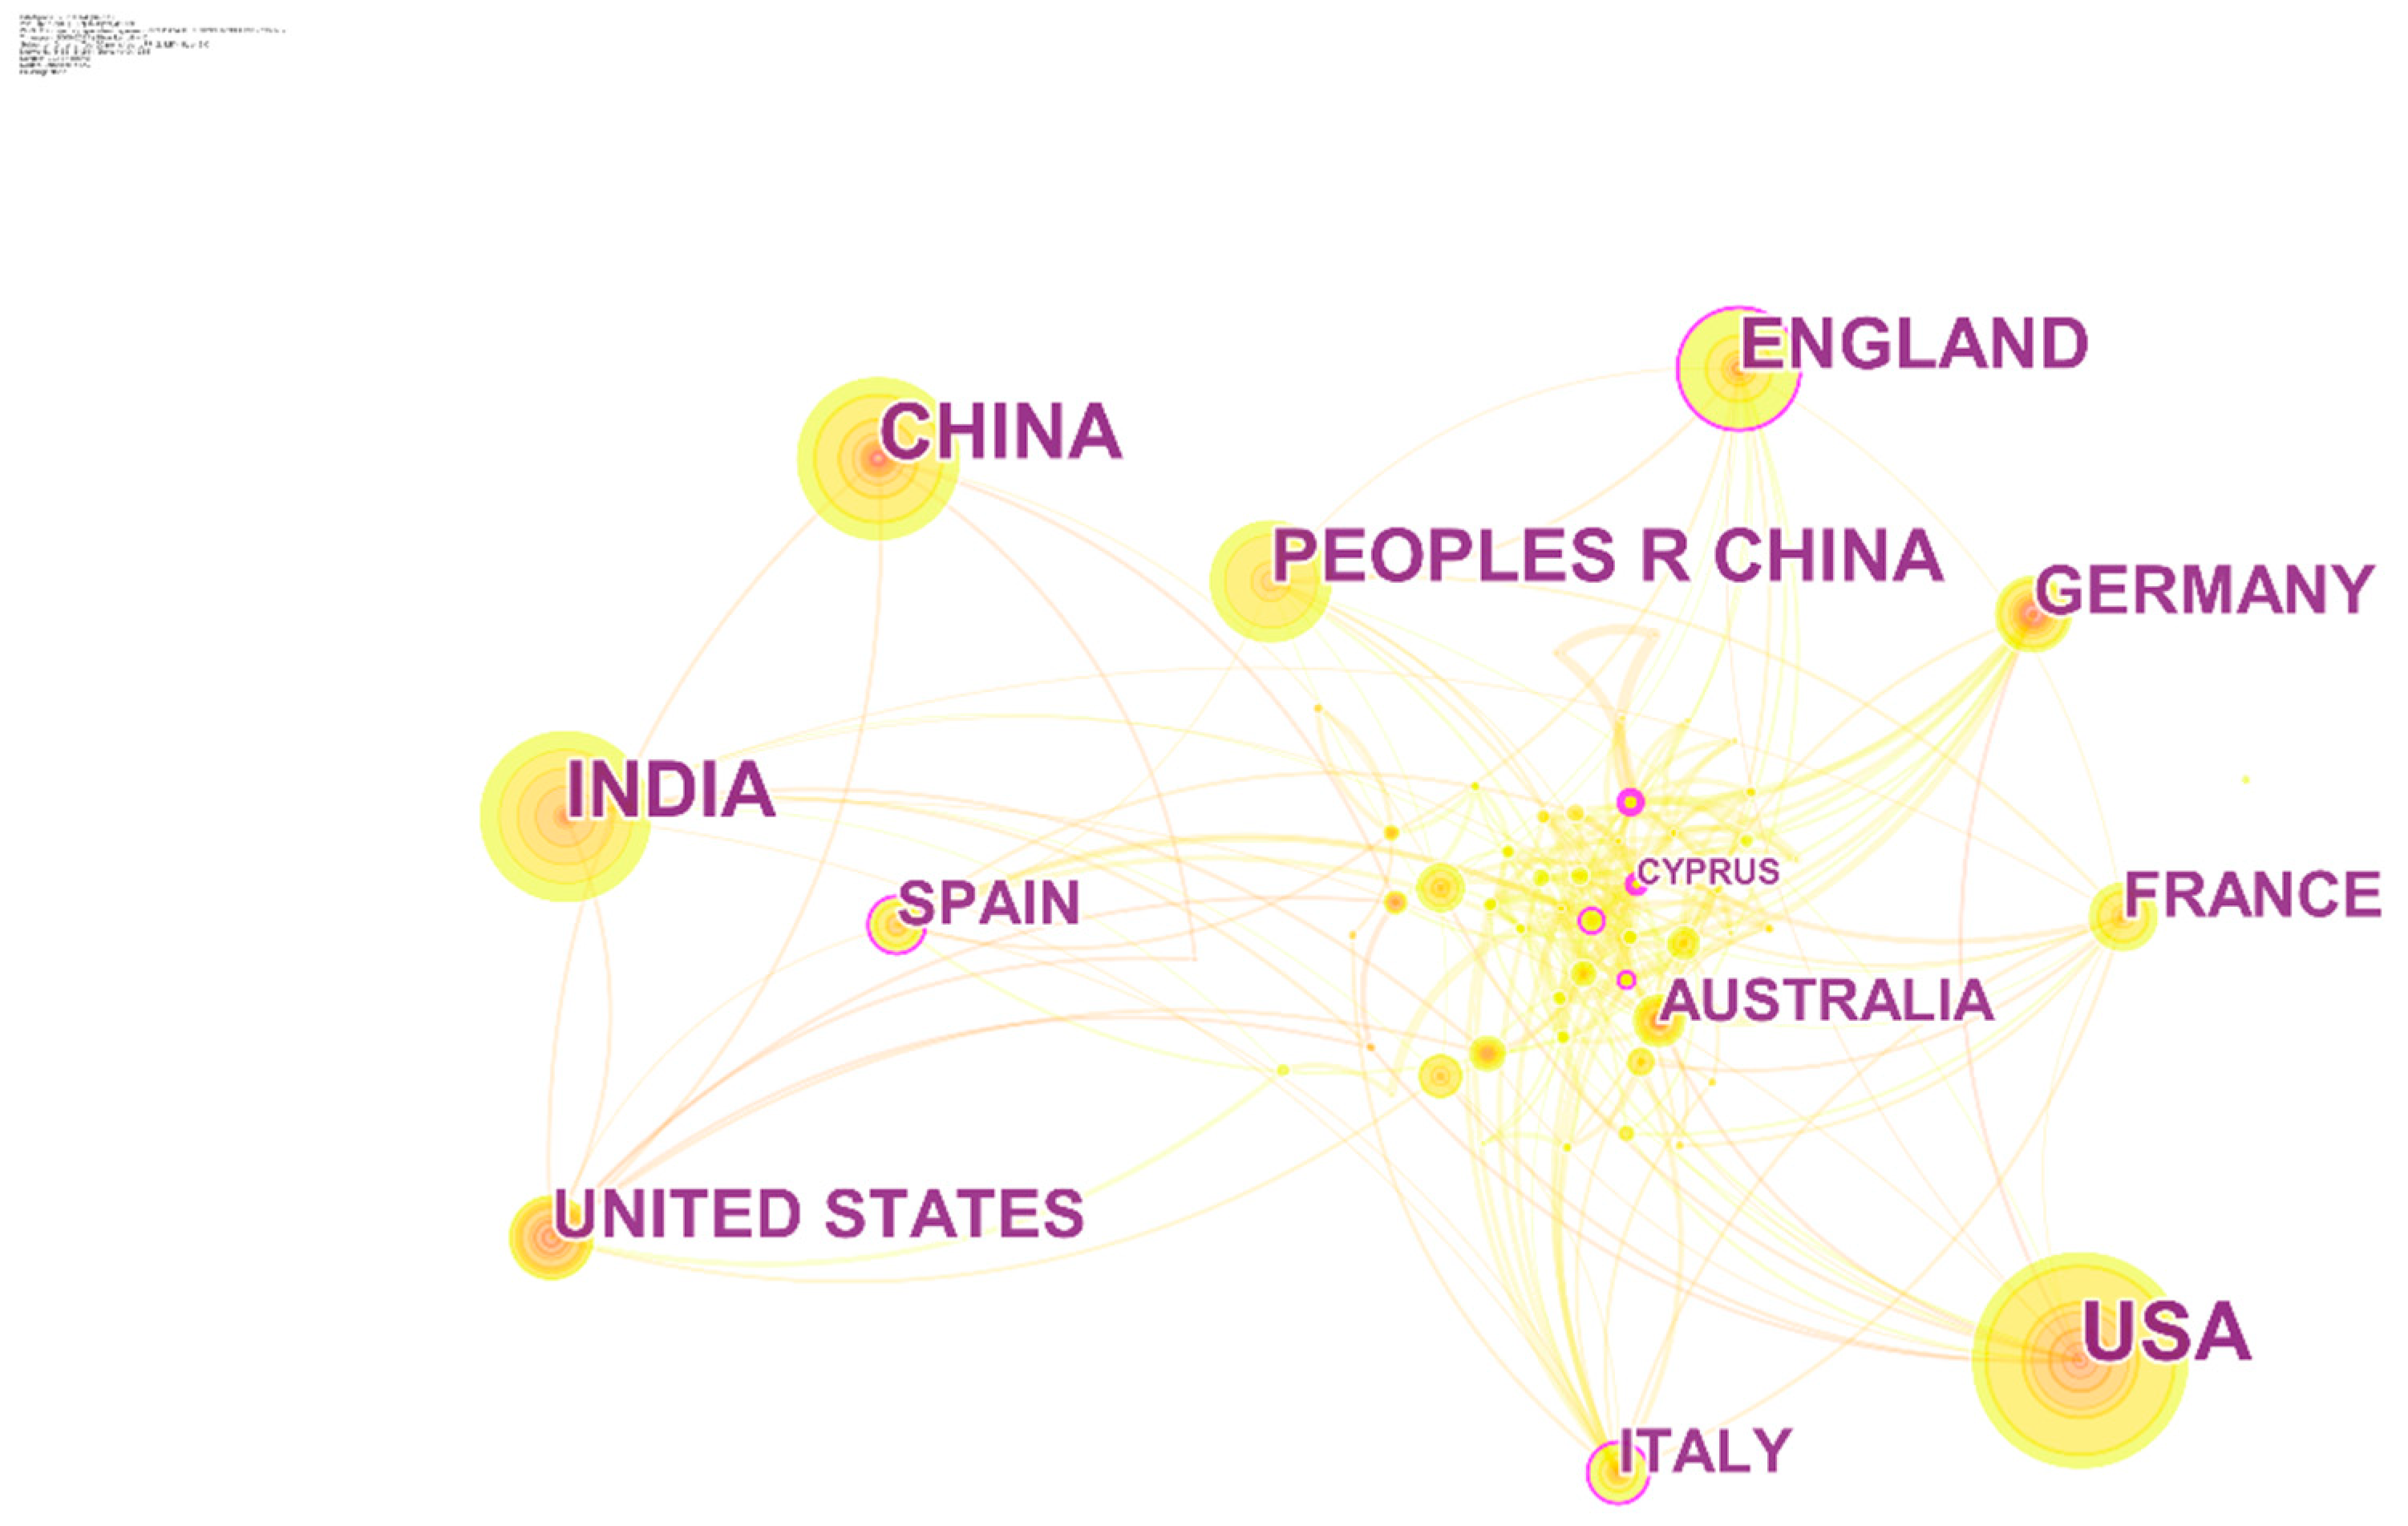
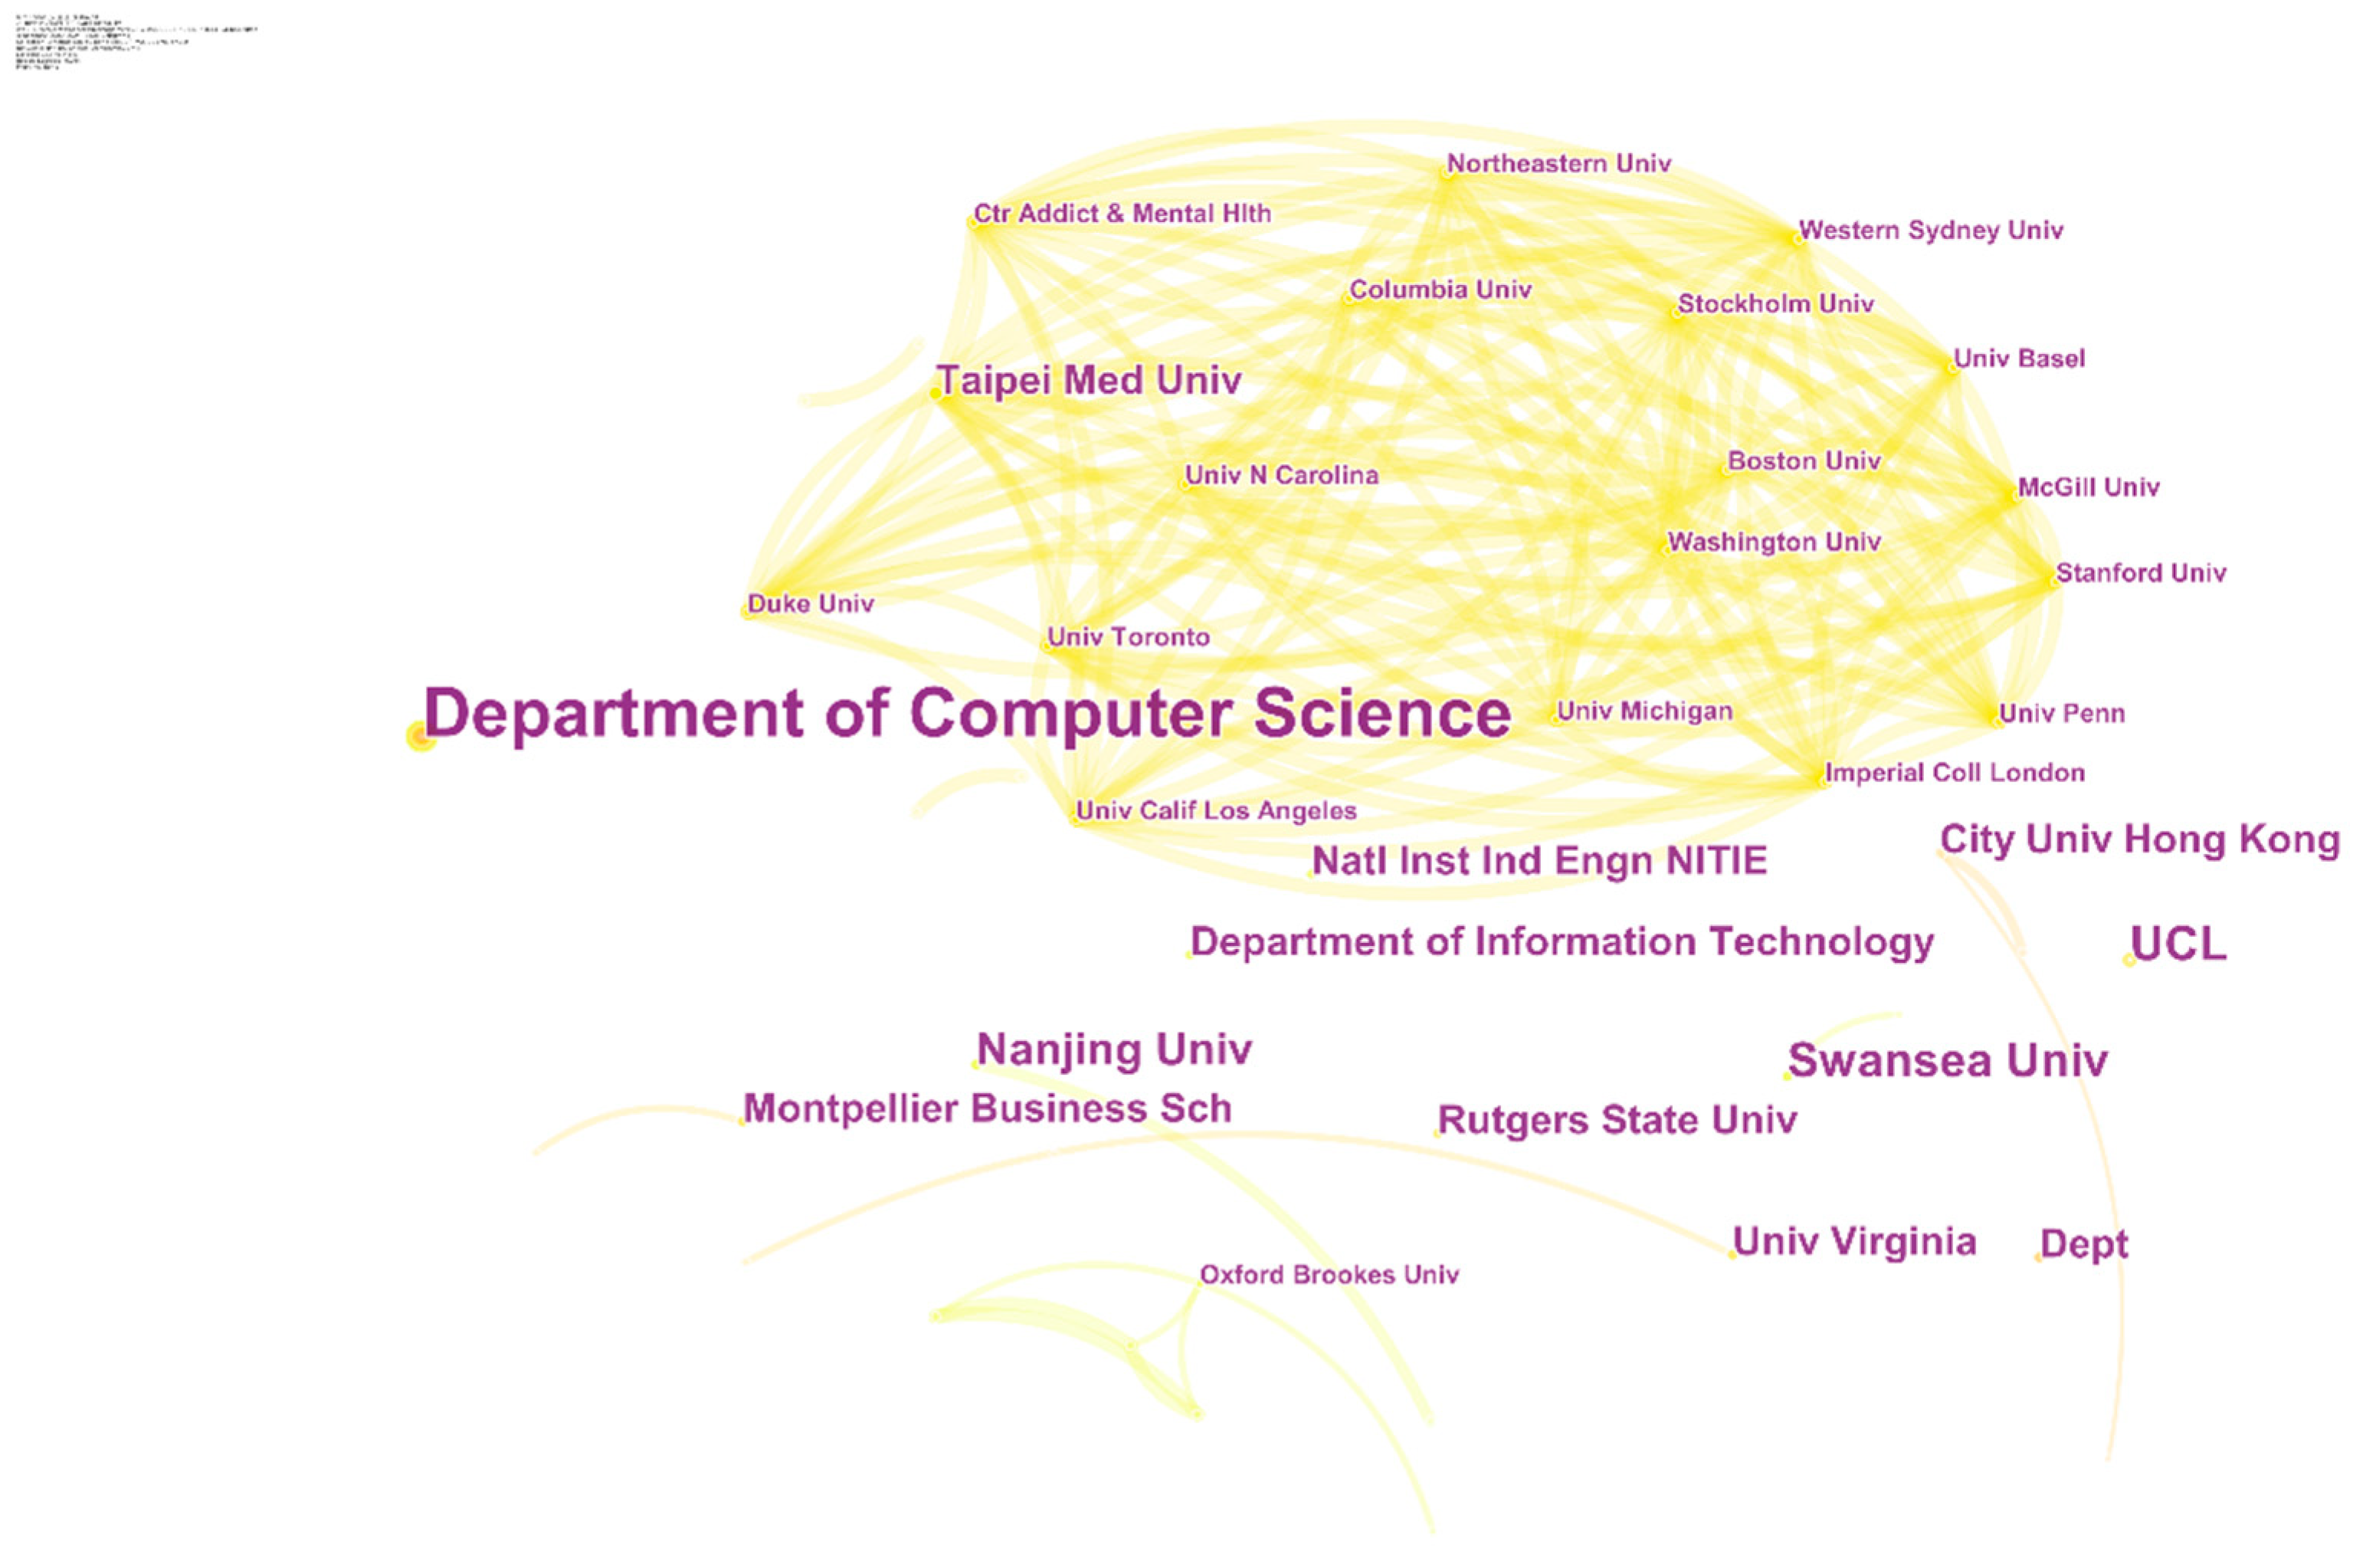
3.2. Analysis of Countries and Institutions
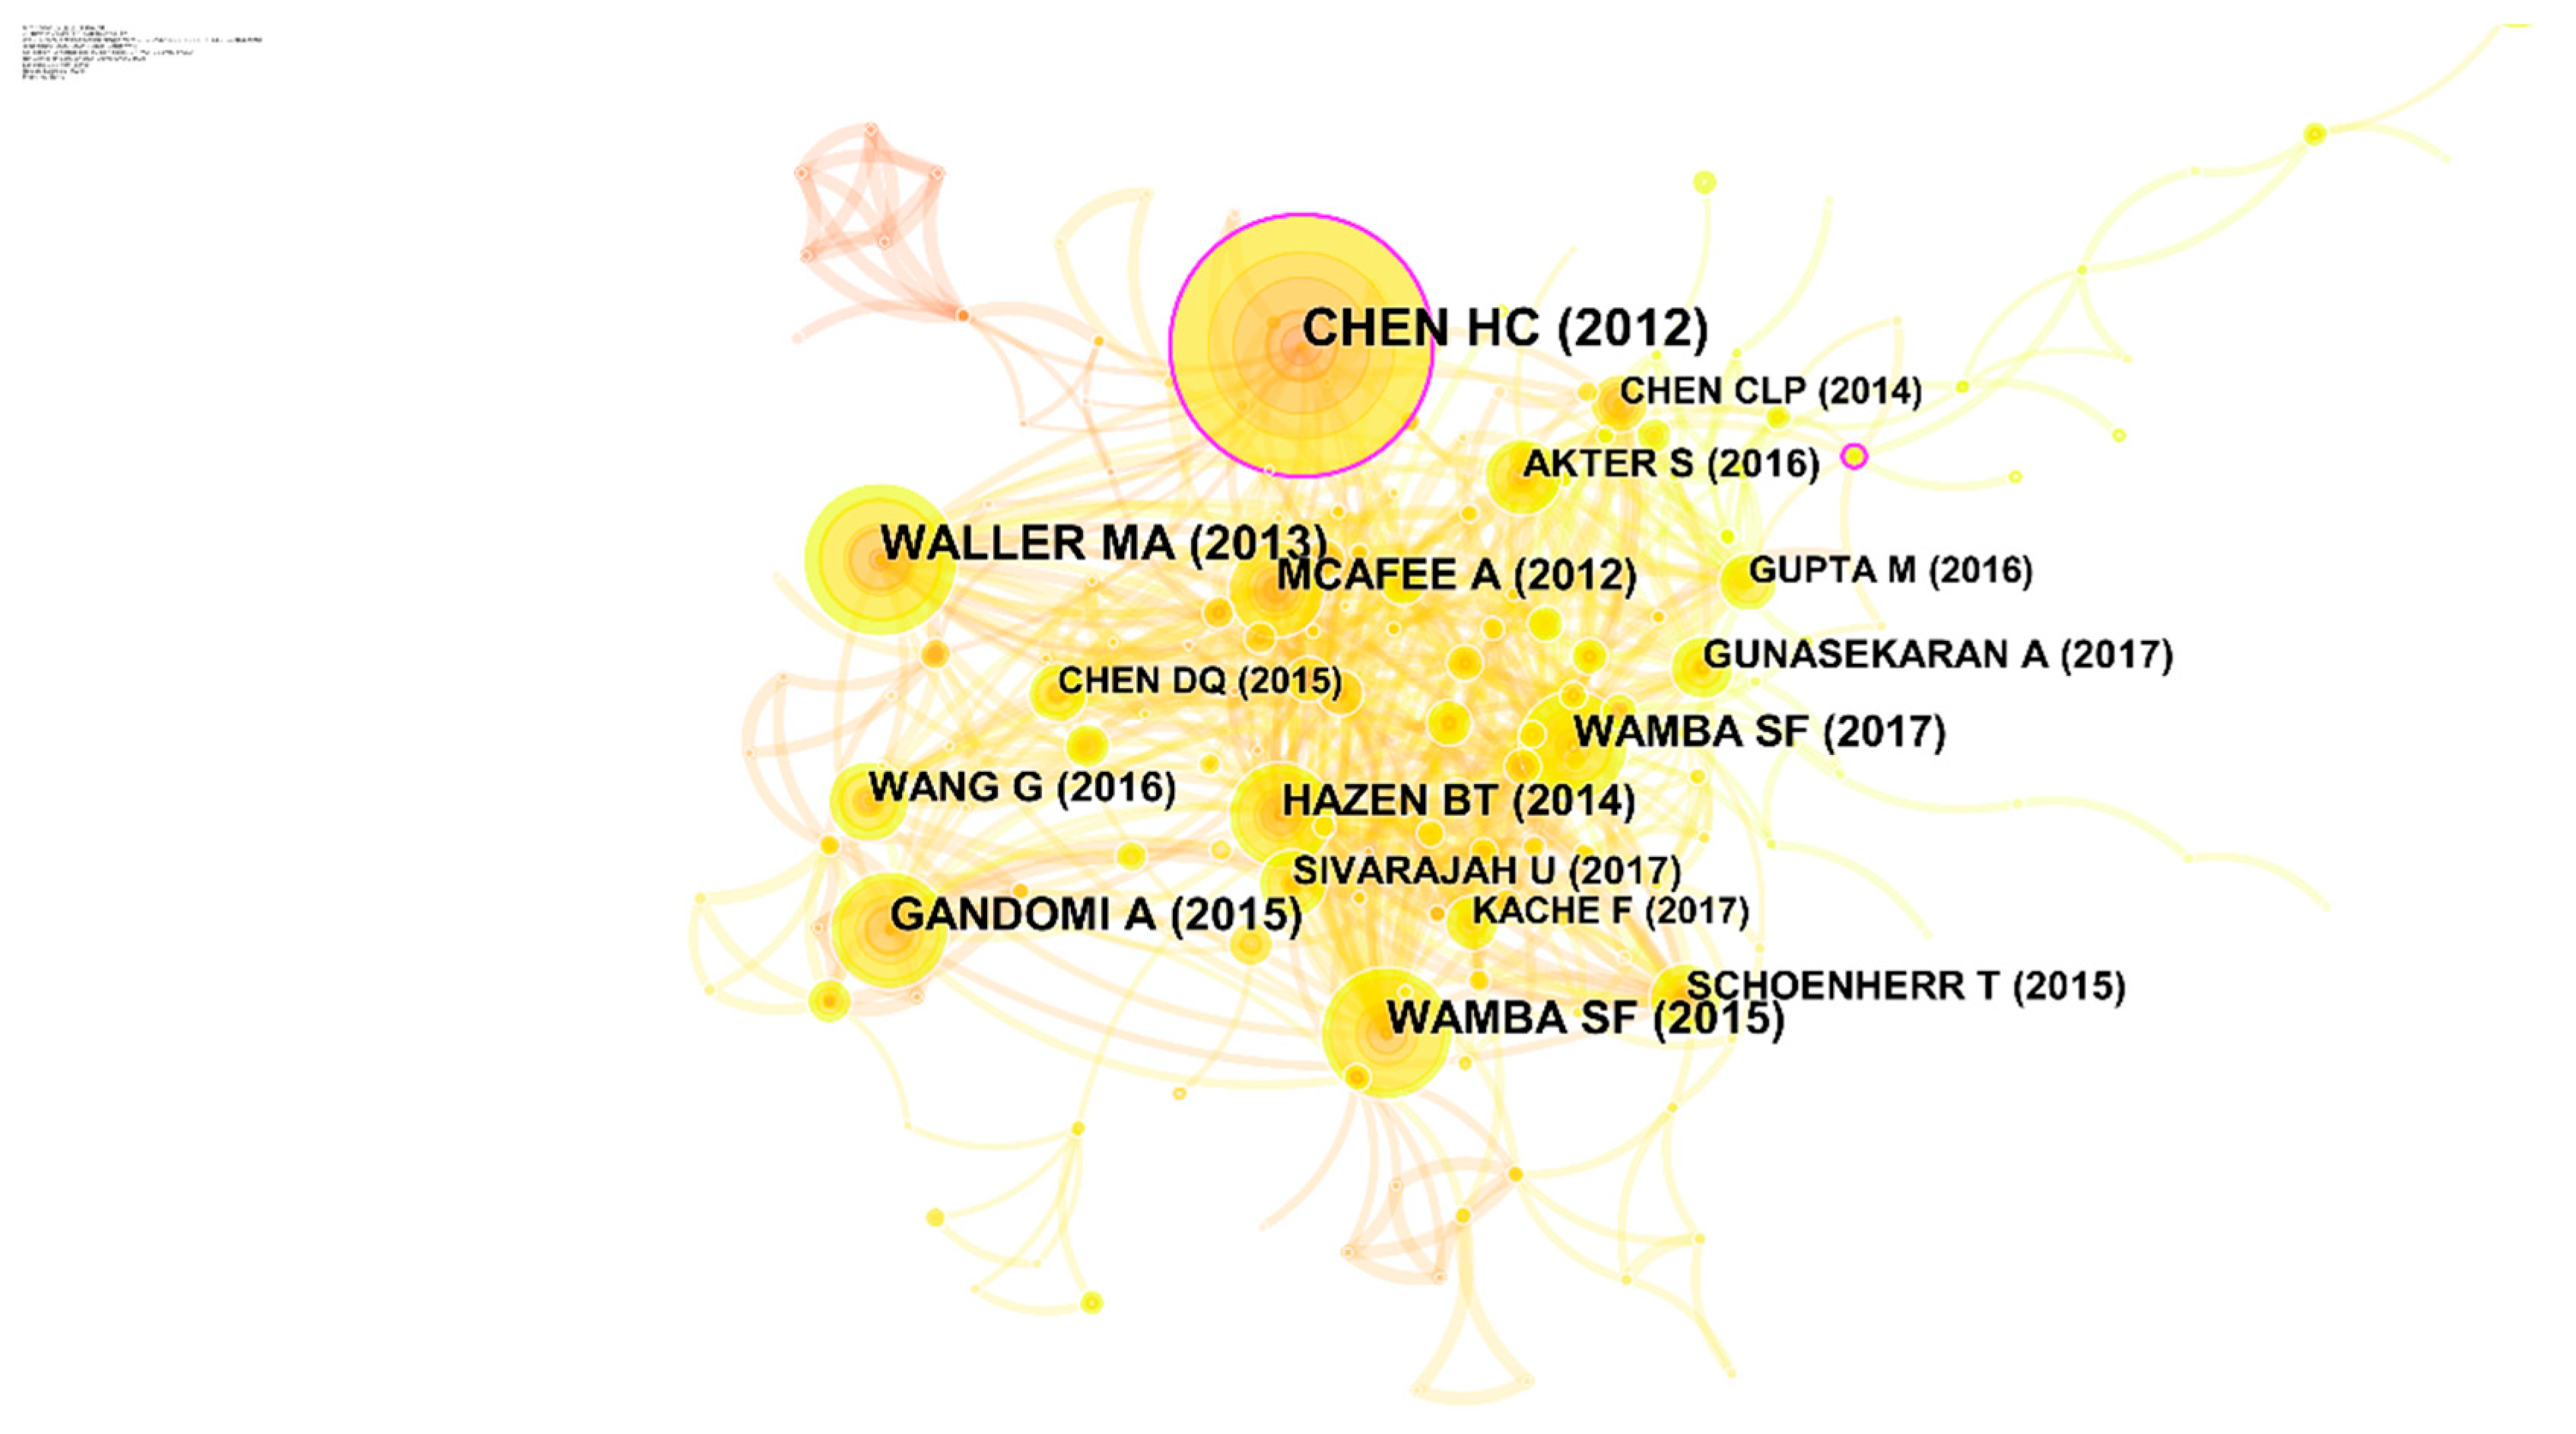
3.3. Analysis of Cited Journals, Cited Authors, and Cited References
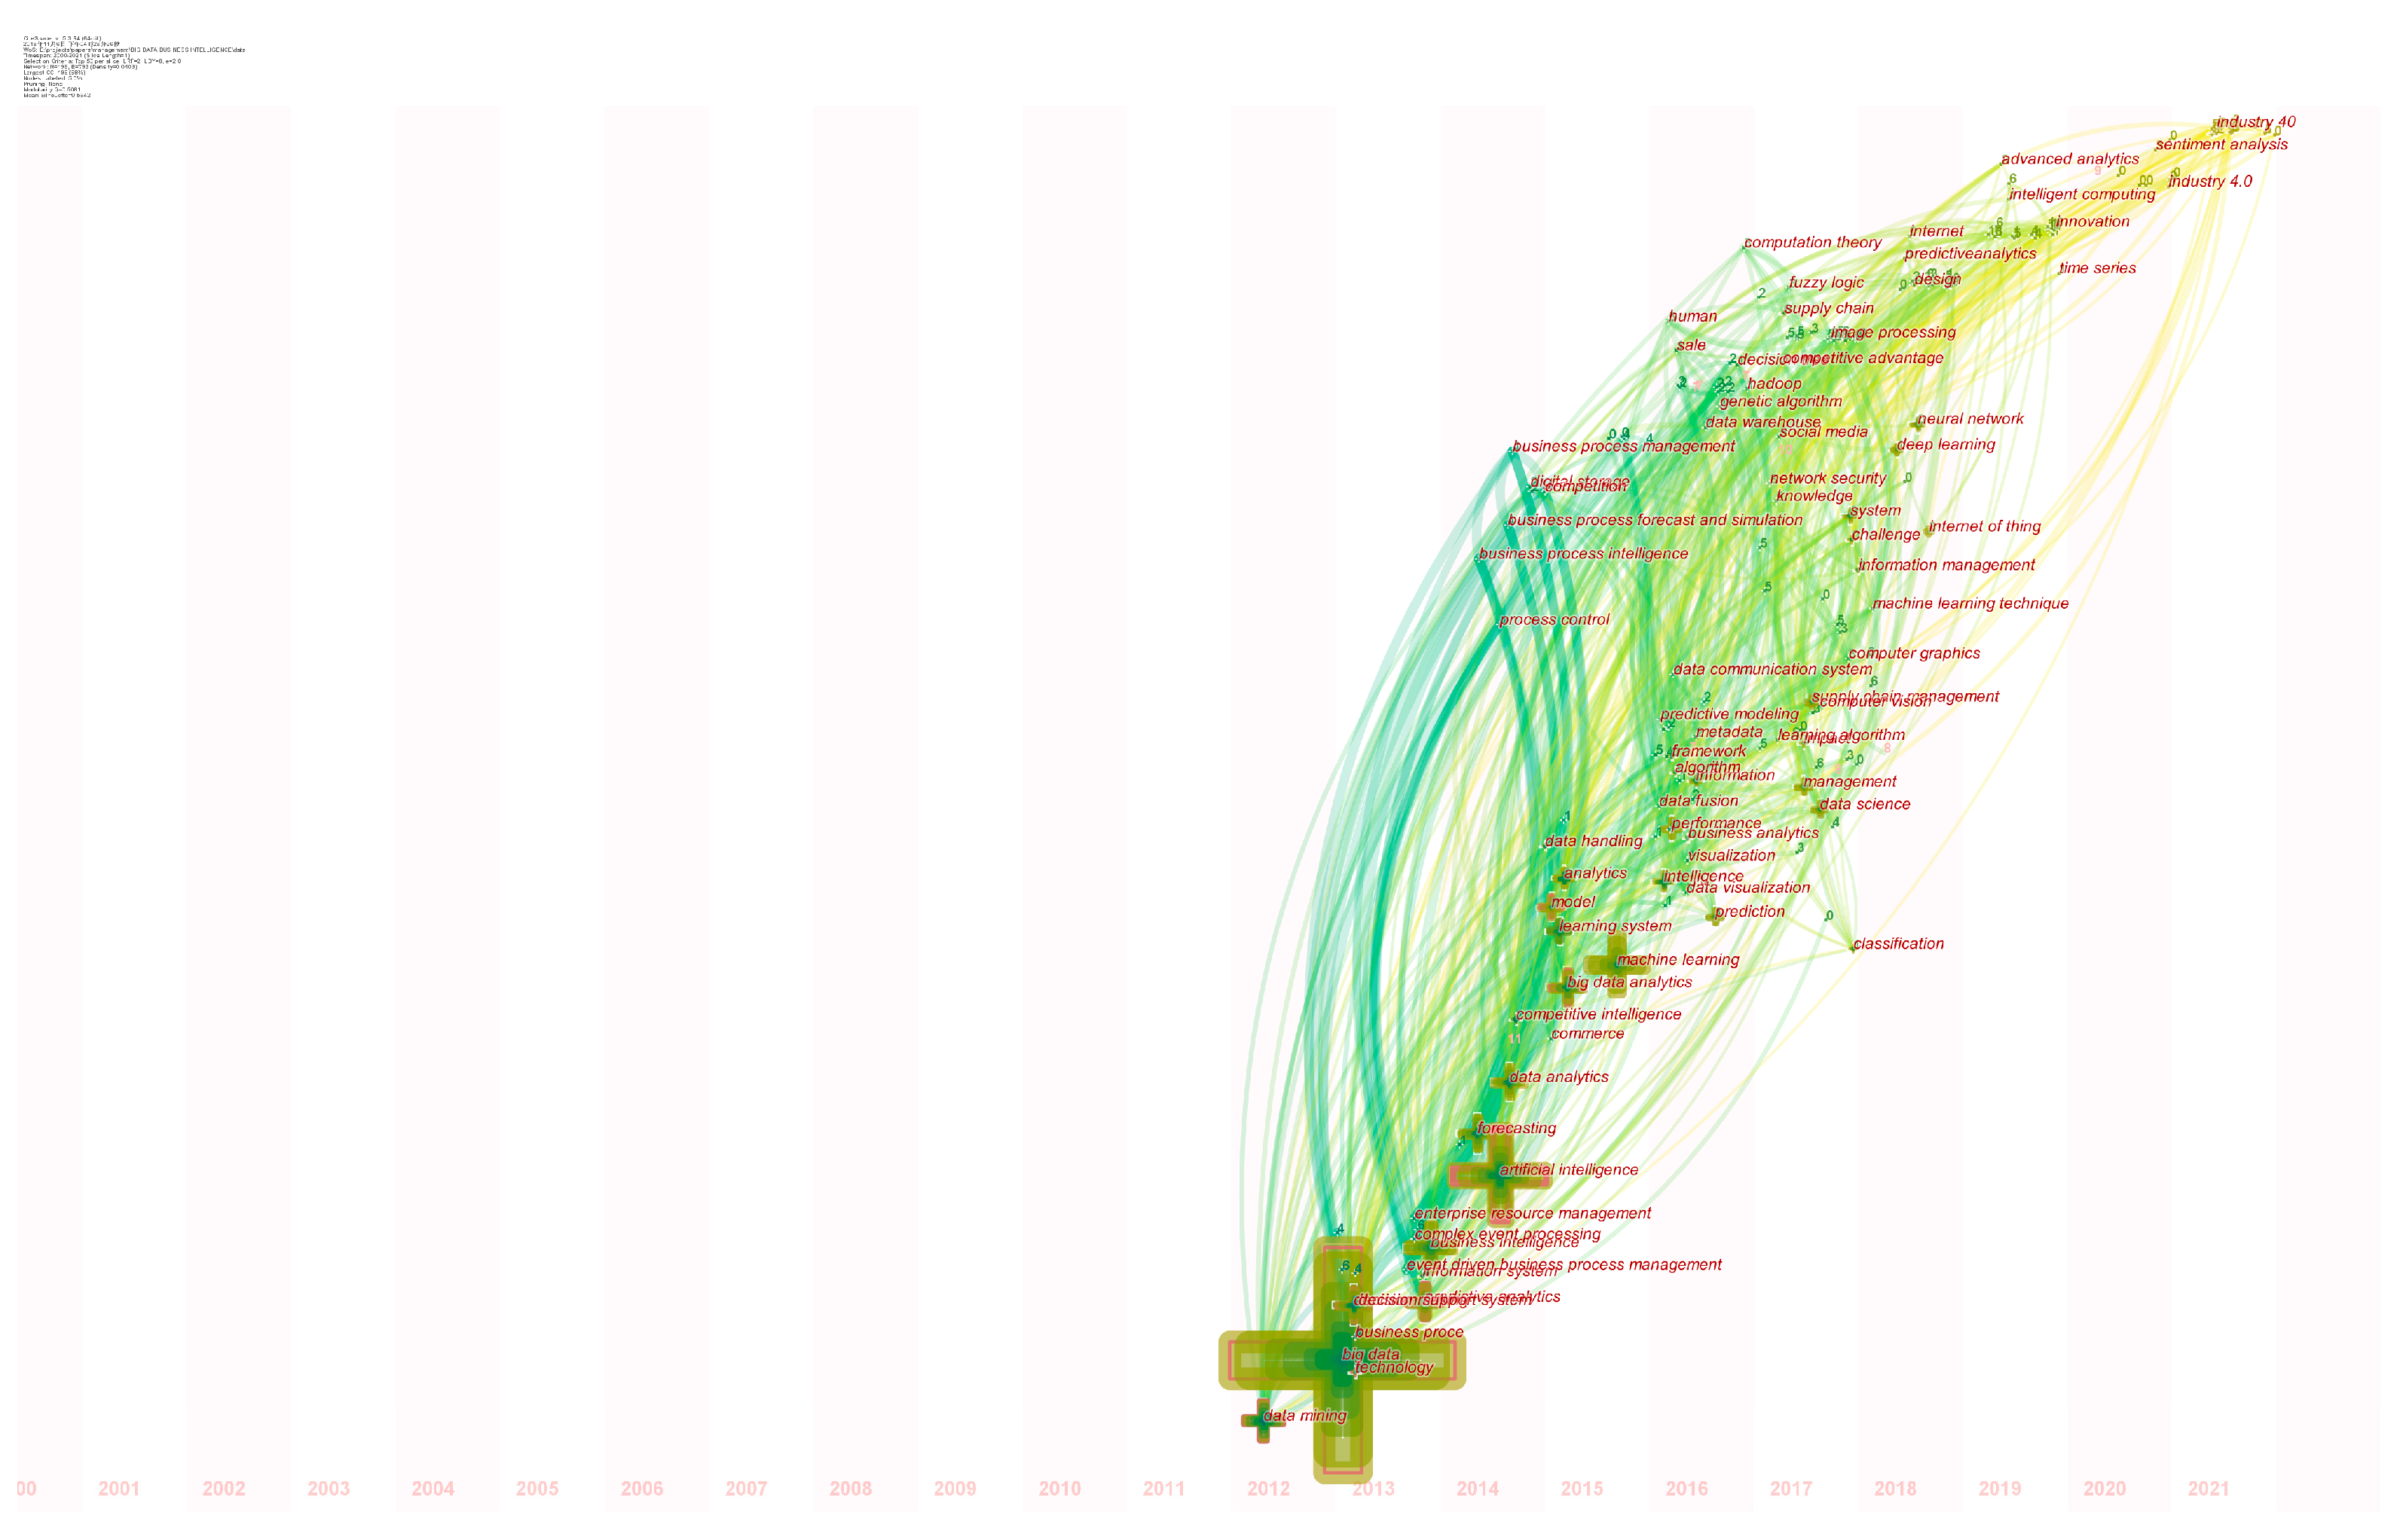
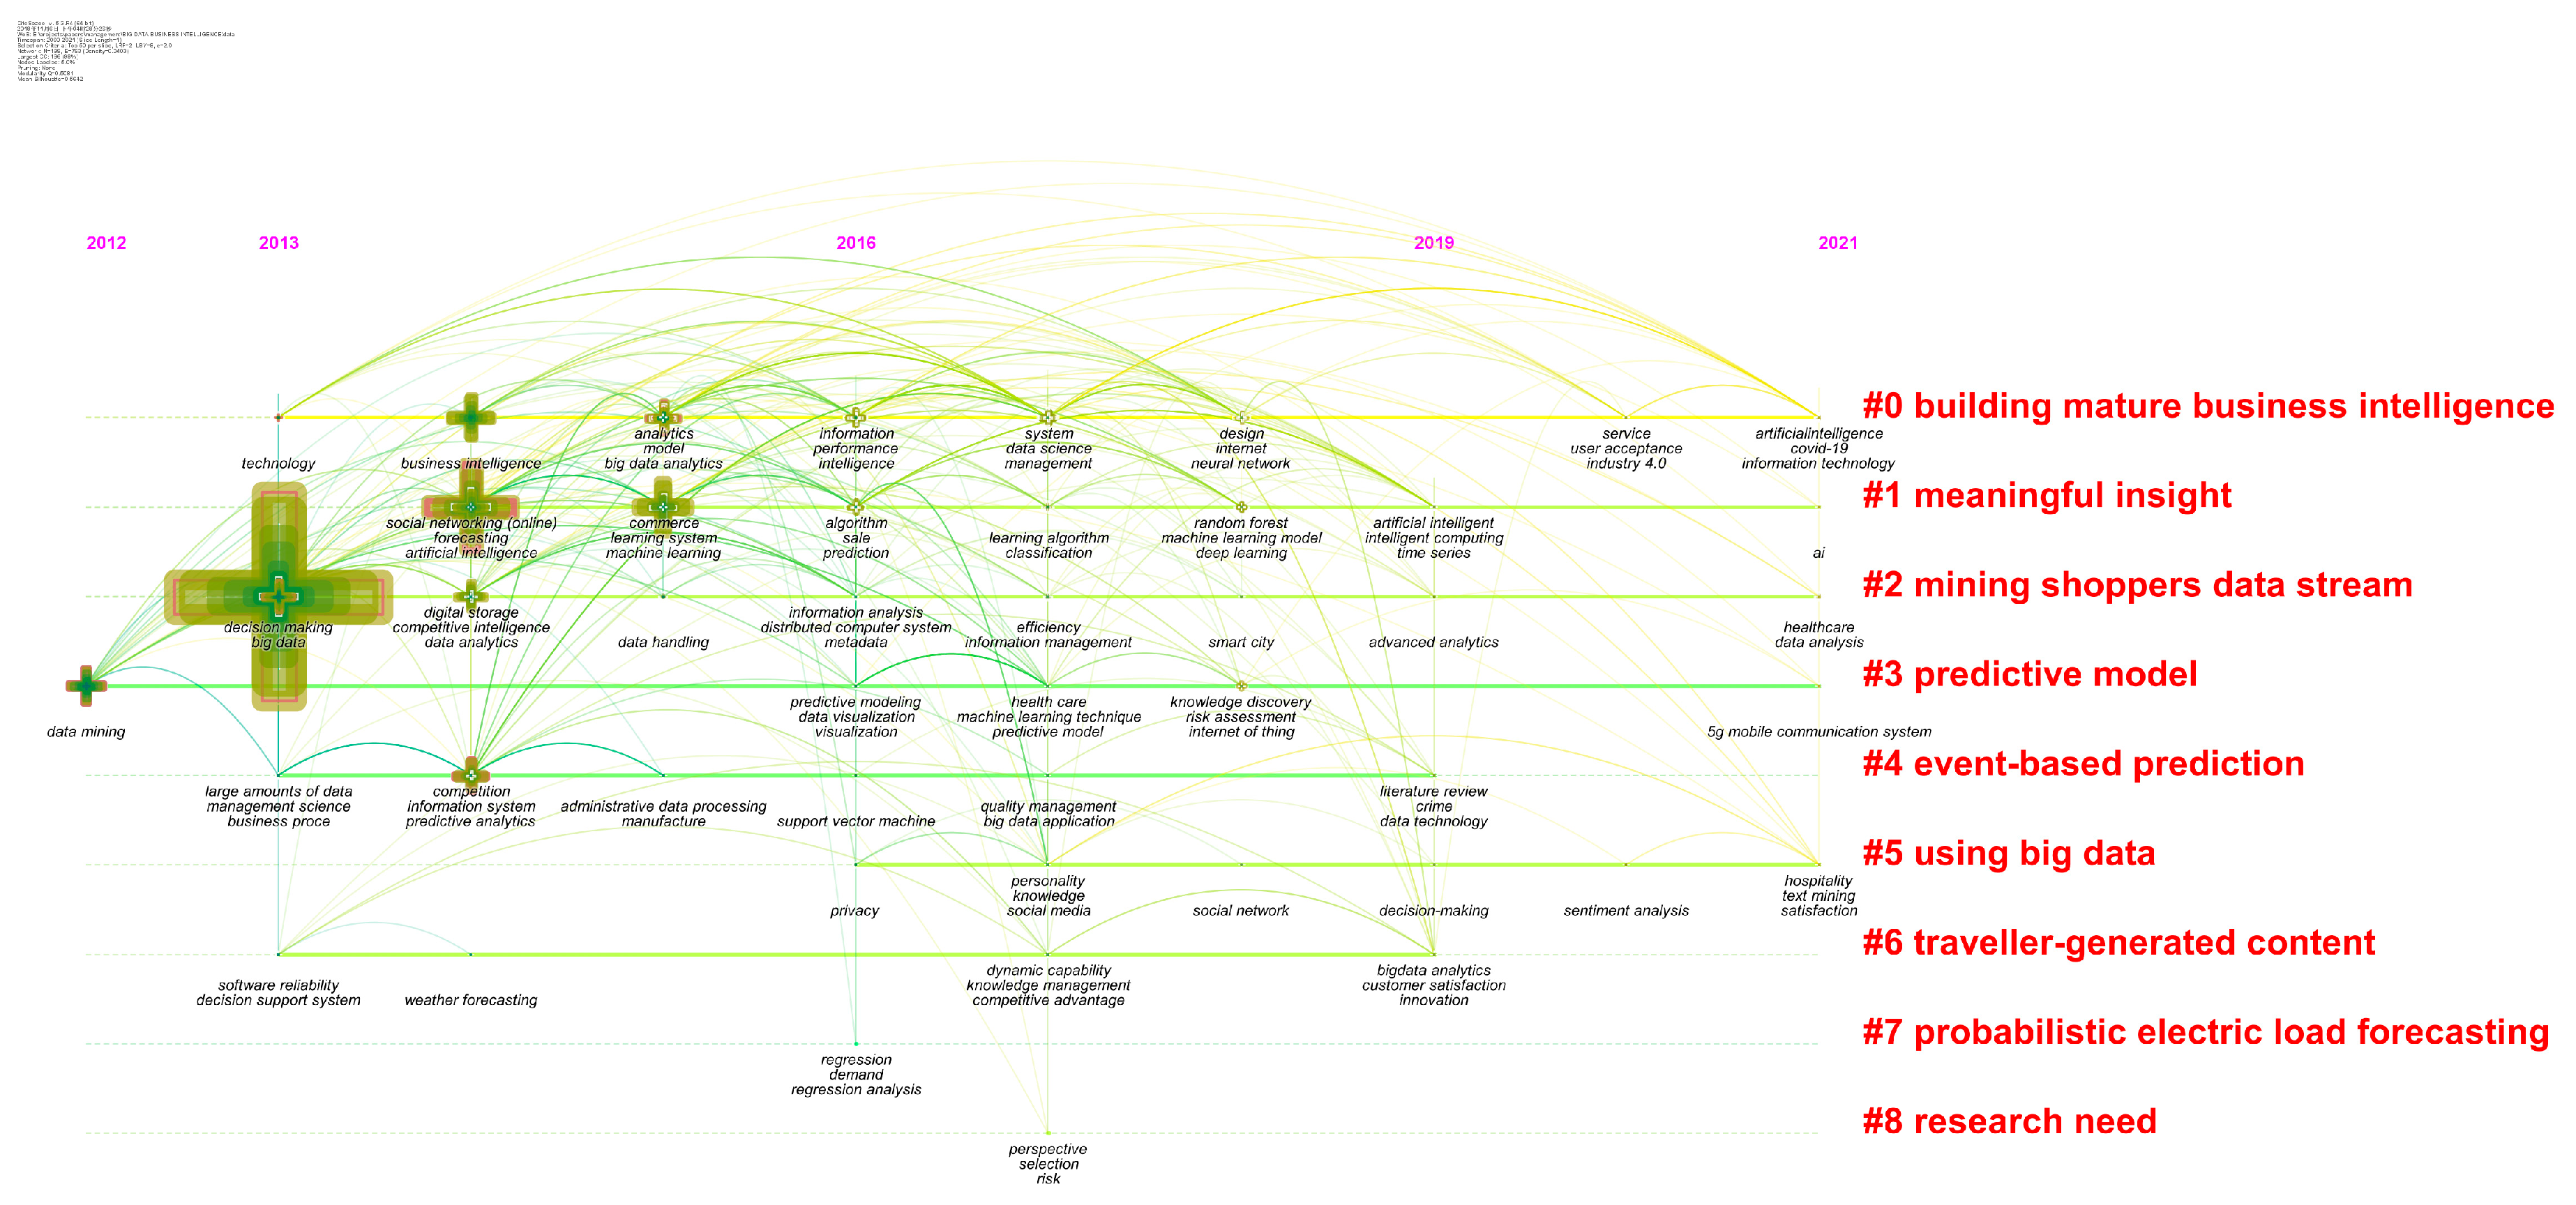
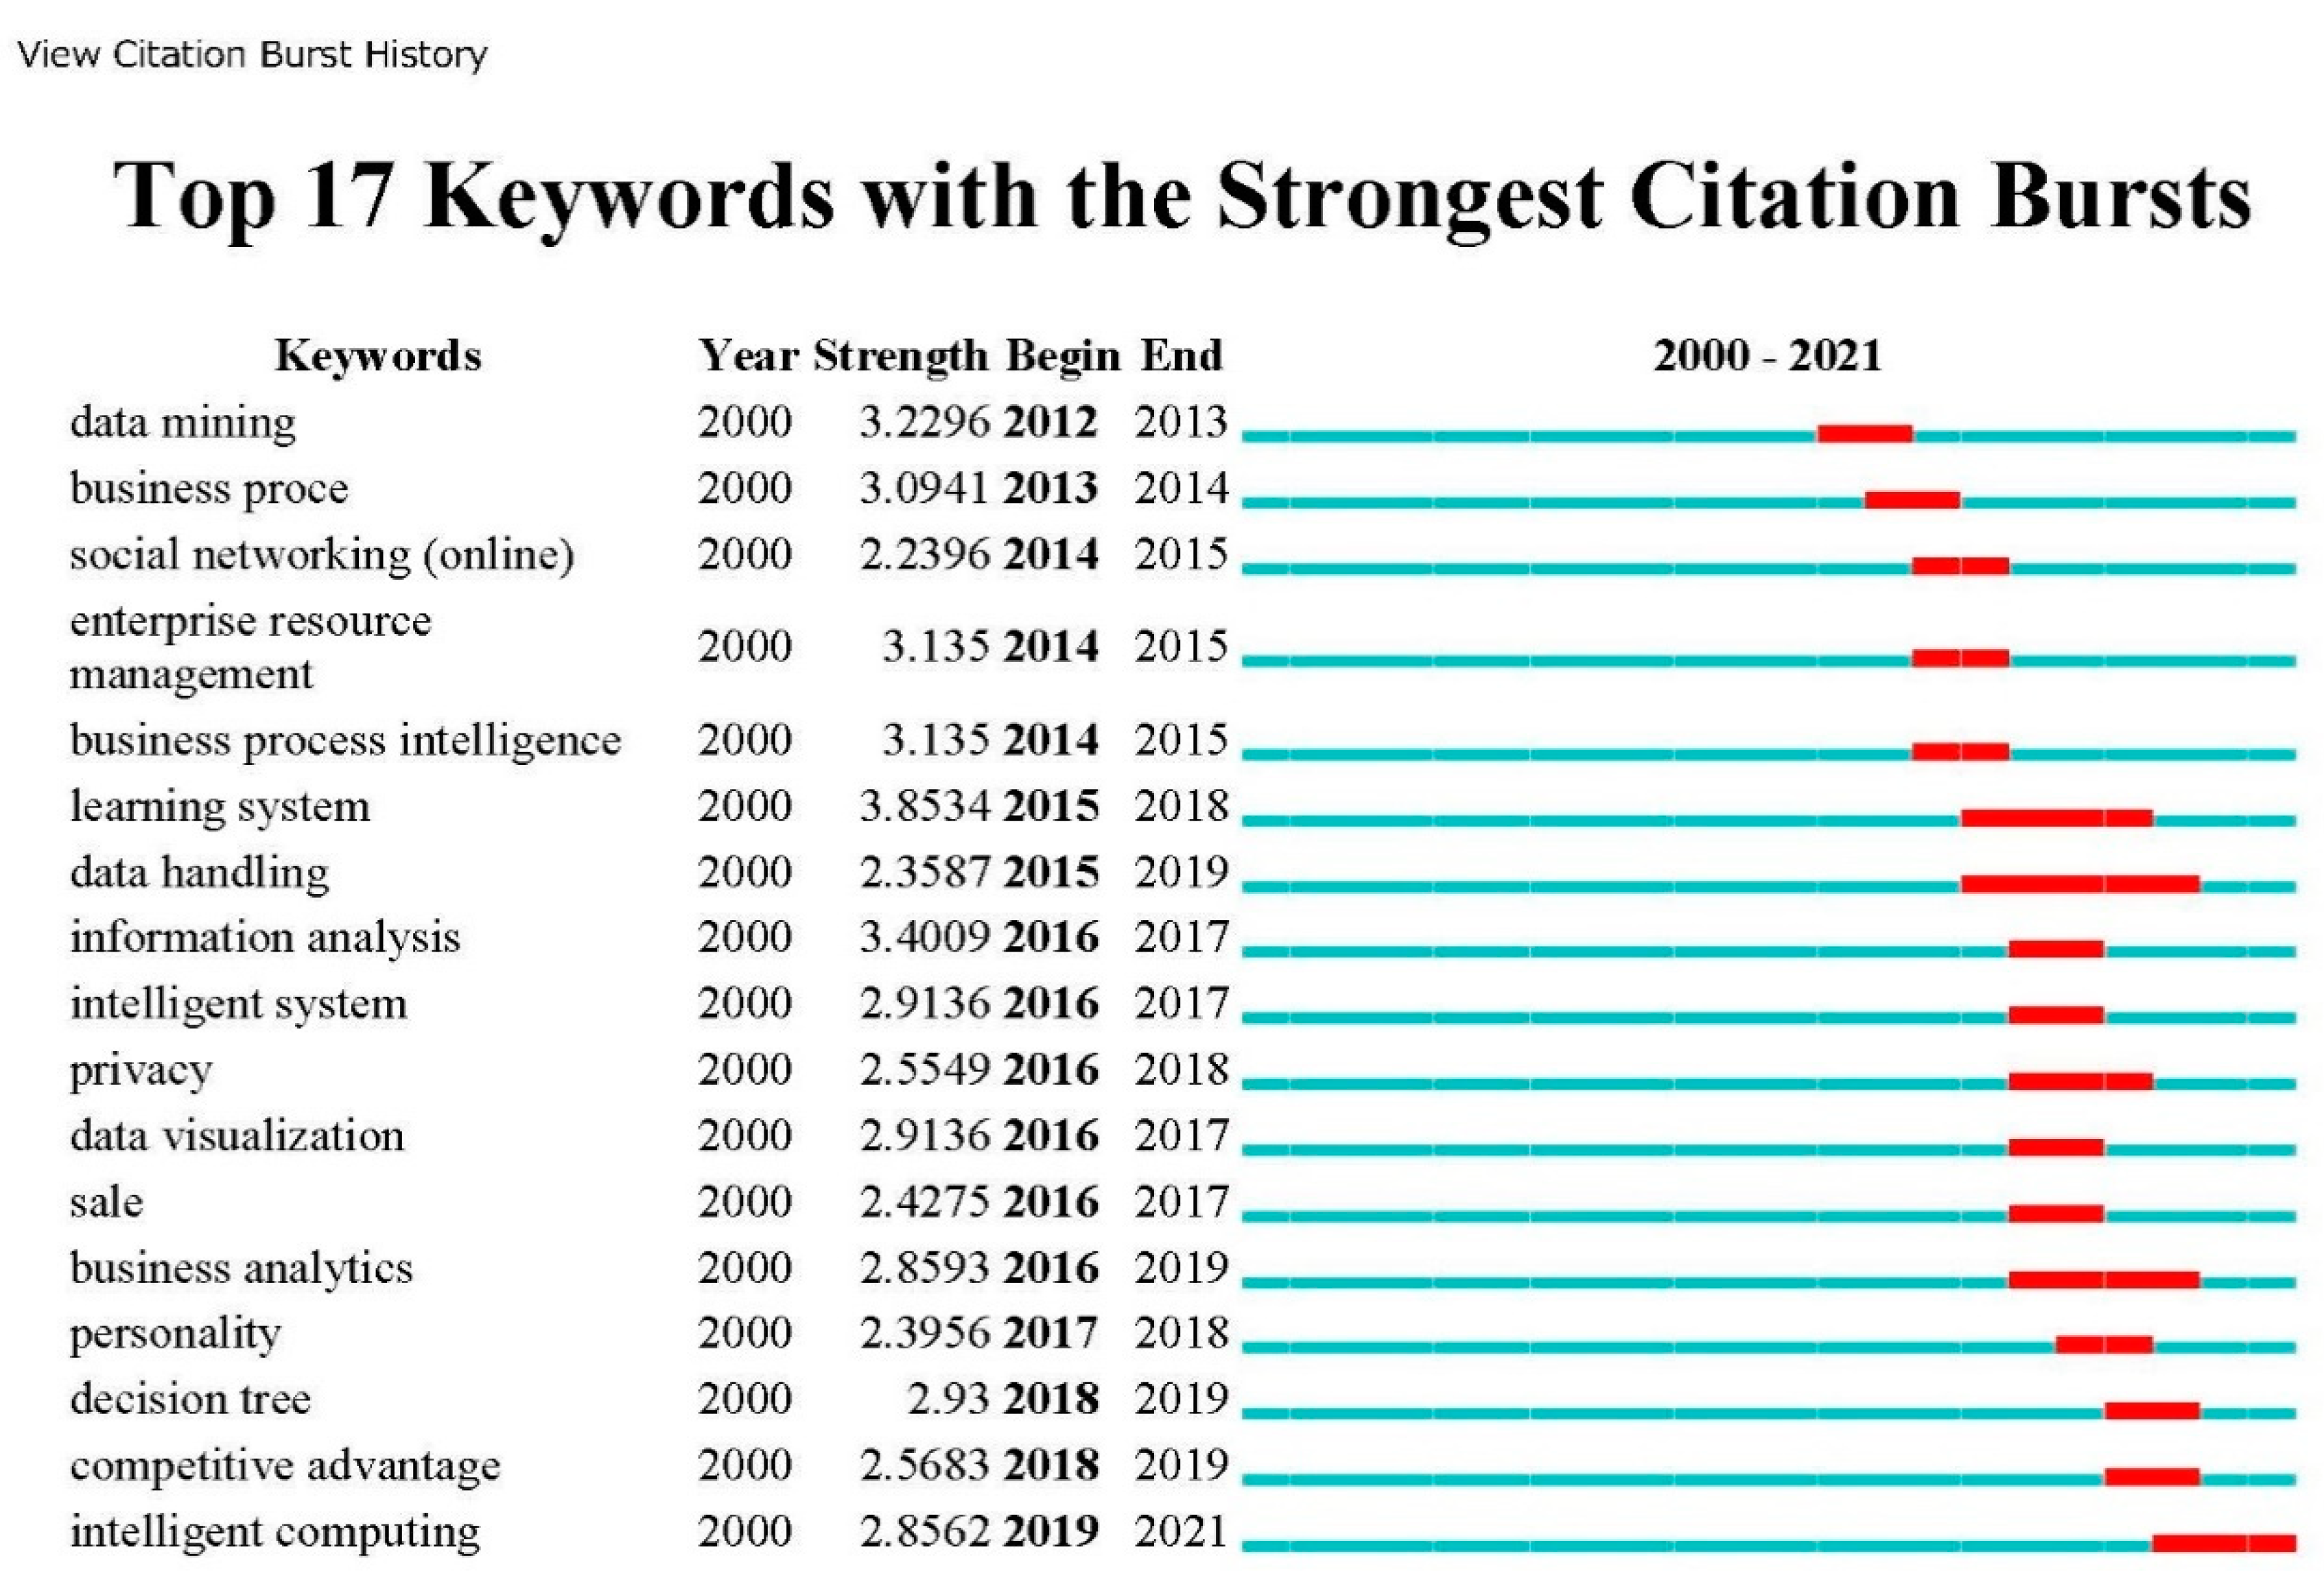
3.4. Analysis of Categories, Hotspots, and Burst Topic Historic Trends
3.5. Discussions
4. Conclusions
Author Contributions
Funding
Institutional Review Board Statement
Informed Consent Statement
Data Availability Statement
Conflicts of Interest
References
- Niu, Y.; Ying, L.; Yang, J.; Bao, M.; Sivaparthipan, C. Organizational business intelligence and decision making using big data analytics. Inf. Process. Manag. 2021, 58, 102725. [Google Scholar] [CrossRef]
- Chen, Y.; Lin, Z. Business intelligence capabilities and firm performance: A study in China. Int. J. Inf. Manag. 2021, 57, 102232. [Google Scholar] [CrossRef]
- Ransbotham, S.; Kiron, D. Analytics as a source of business innovation. MIT Sloan Manag. Rev. 2017, 58. [Google Scholar]
- Vicario, G.; Coleman, S. A review of data science in business and industry and a future view. Appl. Stoch. Models Bus. Ind. 2020, 36, 6–18. [Google Scholar] [CrossRef]
- Henrys, K. Role of Predictive Analytics in Business. SSRN Electron. J. 2021, 2, 3829621. [Google Scholar] [CrossRef]
- Alnoukari, M. From Business Intelligence to Big Data: The Power of Analytics. In Research Anthology on Big Data Analytics, Architectures, and Applications; IGI Global: Hershey, PA, USA, 2022; pp. 823–841. [Google Scholar]
- Shabbir, M.Q.; Gardezi, S.B.W. Application of big data analytics and organizational performance: The mediating role of knowledge management practices. J. Big Data 2020, 7, 1–17. [Google Scholar] [CrossRef]
- Linden, I. 30 Years Business Intelligence: From Data Analytics to Big Data. In EURO Working Group on DSS; Springer: Berlin/Heidelberg, Germany, 2021; pp. 115–128. [Google Scholar]
- Munim, Z.H.; Dushenko, M.; Jimenez, V.J.; Shakil, M.H.; Imset, M. Big data and artificial intelligence in the maritime industry: A bibliometric review and future research directions. Marit. Policy Manag. 2020, 47, 577–597. [Google Scholar] [CrossRef]
- Soriano, J.; Au, T.; Banks, D. Text mining in computational advertising. Stat. Anal. Data Min. ASA Data Sci. J. 2013, 6, 273–285. [Google Scholar] [CrossRef]
- White, D. Business Predictive Analytics: Tools and Technologies. In Data Analytics in Marketing, Entrepreneurship, and Innovation; Auerbach Publications: New York, NY, USA, 2021; pp. 31–51. [Google Scholar]
- Ferrari, A.; Russo, M. Introducing Microsoft Power BI; Microsoft Press: Redmond, WA, USA, 2016. [Google Scholar]
- Semerádová, T.; Weinlich, P. Using Google Analytics to Examine the Website Traffic. In Website Quality and Shopping Behavior; Springer: Berlin/Heidelberg, Germany, 2020; pp. 91–112. [Google Scholar]
- Deb Nath, R.P.; Hose, K.; Pedersen, T.B.; Romero, O.; Bhattacharjee, A. SETLBI: An integrated platform for semantic business intelligence. In Proceedings of the Companion Proceedings of the Web Conference, Taipei, Taiwan, 20–24 April 2020; pp. 167–171. [Google Scholar]
- Makris, P.; Vergados, D.J.; Mamounakis, I.; Tsaousoglou, G.; Steriotis, K.; Efthymiopoulos, N.; Varvarigos, E. A Novel Research Algorithms and Business Intelligence Tool for Progressive Utility’s Portfolio Management in Retail Electricity Markets. In Proceedings of the 2019 IEEE PES Innovative Smart Grid Technologies Europe (ISGT-Europe), Bucharest, Romania, 29 September–2 October 2019; pp. 1–5. [Google Scholar]
- Mingers, J.; Leydesdorff, L. A review of theory and practice in scientometrics. Eur. J. Oper. Res. 2015, 246, 1–19. [Google Scholar] [CrossRef]
- Leydesdorff, L.; Milojević, S. Scientometrics. arXiv 2012, arXiv:1208.4566. [Google Scholar]
- Wang, H. A Bibliographic Study and Quantitative Analysis of Age-related Macular Degeneration and Fundus Images. Ann. Ophthalmol. Vis. Sci. 2022, 5, 1–8. [Google Scholar]
- Han, W. A Review of Artificial Intelligence in Ophthalmology Field—Taking the Fundus Diagnosis Based on OCT Images as an Example. Artif. Intell. Robot. Res. 2021, 10, 306–312. [Google Scholar] [CrossRef]
- Sun, Y.; Li, C.; Zhao, Y.; Sun, J. Trends and developments in oral health literacy: A scientometric research study (1991–2020). BDJ Open 2021, 7, 1–10. [Google Scholar] [CrossRef]
- Yao, L. Freshwater microplastics pollution: Detecting and visualizing emerging trends based on Citespace II. Chemosphere 2020, 245, 125627. [Google Scholar] [CrossRef] [PubMed]
- Singh, V.K.; Singh, P.; Karmakar, M.; Leta, J.; Mayr, P. The journal coverage of Web of Science, Scopus and Dimensions: A comparative analysis. Scientometrics 2021, 126, 5113–5142. [Google Scholar] [CrossRef]
- Wang, H. A Survey of AI to AMD and Quantitative Analysis of AMD Pathology Based on Medical Images. Artif. Intell. Robot. Res. 2022, 11, 143–157. [Google Scholar] [CrossRef]
- Wang, H.; Li, Z. The application of machine learning and deep learning to Ophthalmology: A bibliometric study (2000–2021). Preprints 2021, 2021110080. [Google Scholar]
- Chen, C. CiteSpace II: Detecting and visualizing emerging trends and transient patterns in scientific literature. J. Am. Soc. Inf. Sci. Technol. 2006, 57, 359–377. [Google Scholar] [CrossRef]
- Wang, W.; Lu, C. Visualization analysis of big data research based on Citespace. Soft Comput. 2020, 24, 8173–8186. [Google Scholar] [CrossRef]
- Suliyanti, W.N.; Sari, R.F. Blockchain-based building information modeling. In Proceedings of the 2019 2nd International Conference on Applied Engineering (ICAE), Batam, Indonesia, 2–3 October 2019; pp. 1–5. [Google Scholar]
- Chen, C. The citespace manual. Coll. Comput. Inform. 2014, 1, 1–84. [Google Scholar]
- Chen, C. Searching for intellectual turning points: Progressive knowledge domain visualization. Proc. Natl. Acad. Sci. USA 2004, 101, 5303–5310. [Google Scholar] [CrossRef] [PubMed]
- Synnestvedt, M.B.; Chen, C.; Holmes, J.H. CiteSpace II: Visualization and knowledge discovery in bibliographic databases. AMIA Annu. Symp. Proc. 2005, 2005, 724–728. [Google Scholar]
- Liu, J.-W.; Huang, L.-C. Detecting and visualizing emerging trends and transient patterns in fuel cell scientific literature. In Proceedings of the 2008 4th International Conference on Wireless Communications, Networking and Mobile Computing, Dalian, China, 12–17 October 2008; pp. 1–4. [Google Scholar]
- McAfee, A.; Brynjolfsson, E.; Davenport, T.H.; Patil, D.; Barton, D. Big data: The management revolution. Harv. Bus. Rev. 2012, 90, 60–68. [Google Scholar] [PubMed]
- Chiang, R.H.; Grover, V.; Liang, T.-P.; Zhang, D. Strategic Value of Big Data and Business Analytics; Taylor & Francis: Abingdon, UK, 2018. [Google Scholar]
- Dubey, R.; Gunasekaran, A. Education and training for successful career in big data and business analytics. Ind. Commer. Train. 2015, 47, 174–181. [Google Scholar] [CrossRef]
- Davenport, T.H.; Patil, D. Data scientist. Harv. Bus. Rev. 2012, 90, 70–76. [Google Scholar]
- Chen, H.; Chiang, R.H.; Storey, V.C. Business intelligence and analytics: From big data to big impact. MIS Q. 2012, 1165–1188. [Google Scholar] [CrossRef]
- Waller, M.A.; Fawcett, S.E. Data Science, Predictive Analytics, and Big Data: A Revolution That Will Transform Supply Chain Design and Management; Wiley Online Library: Hoboken, NJ, USA, 2013. [Google Scholar]
- Wamba, S.F.; Akter, S.; Edwards, A.; Chopin, G.; Gnanzou, D. How ‘big data’can make big impact: Findings from a systematic review and a longitudinal case study. Int. J. Prod. Econ. 2015, 165, 234–246. [Google Scholar] [CrossRef]
- Gandomi, A.; Haider, M. Beyond the hype: Big data concepts, methods, and analytics. Int. J. Inf. Manag. 2015, 35, 137–144. [Google Scholar] [CrossRef]
- Wamba, S.F.; Gunasekaran, A.; Akter, S.; Ren, S.J.-f.; Dubey, R.; Childe, S.J. Big data analytics and firm performance: Effects of dynamic capabilities. J. Bus. Res. 2017, 70, 356–365. [Google Scholar] [CrossRef]
- Mazón, J.-N.; Zubcoff, J.J.; Garrigós, I.; Espinosa, R.; Rodríguez, R. Open business intelligence: On the importance of data quality awareness in user-friendly data mining. In Proceedings of the 2012 Joint EDBT/ICDT Workshops, Berlin, Germany, 30 March 2012; pp. 144–147. [Google Scholar]
- Vera-Baquero, A.; Colomo-Palacios, R.; Molloy, O. Business process analytics using a big data approach. It Prof. 2013, 15, 29–35. [Google Scholar] [CrossRef]
- Babu, M.P.; Sastry, S.H. Big data and predictive analytics in ERP systems for automating decision making process. In Proceedings of the 2014 IEEE 5th International Conference on Software Engineering and Service Science, Beijing, China, 27–29 June 2014; pp. 259–262. [Google Scholar]
- Qayumi, K.; Norta, A. Business-intelligence mining of large decentralized multimedia datasets with a distributed multi-agent system. Int. J. Comput. Inf. Eng. 2016, 10, 1160–1169. [Google Scholar]
- Ramesh, D.; Suraj, P.; Saini, L. Big data analytics in healthcare: A survey approach. In Proceedings of the 2016 International Conference on Microelectronics, Computing and Communications (MicroCom), Durgapur, India, 23–25 January 2016; pp. 1–6. [Google Scholar]
- Kavitha, S.; Varuna, S.; Ramya, R. A comparative analysis on linear regression and support vector regression. In Proceedings of the 2016 Online International Conference on Green Engineering and Technologies (IC-GET), Coimbatore, India, 19 November 2016; pp. 1–5. [Google Scholar]
- Valsamidis, S.; Kazanidis, I.; Kontogiannis, S.; Florou, G. Knowledge management for business intelligence measurement in an e-business system. Int. J. Electron. Bus. 2017, 13, 323–341. [Google Scholar] [CrossRef]
- Singh, V.; Verma, N.K. Deep learning architecture for high-level feature generation using stacked auto encoder for business intelligence. In Complex Systems: Solutions and Challenges in Economics, Management and Engineering; Springer: Berlin/Heidelberg, Germany, 2018; pp. 269–283. [Google Scholar]
- Hmamouche, Y.; Przymus, P.M.; Alouaoui, H.; Casali, A.; Lakhal, L. Large Multivariate Time Series Forecasting: Survey on Methods and Scalability. In Utilizing Big Data Paradigms for Business Intelligence; IGI Global: Hershey, PA, USA, 2019; pp. 170–197. [Google Scholar]
- Hajiali, M. Big data and sentiment analysis: A comprehensive and systematic literature review. Concurr. Comput. Pract. Exp. 2020, 32, e5671. [Google Scholar] [CrossRef]
- Jalali, S.M.J.; Park, H.W.; Vanani, I.R.; Pho, K.-H. Research trends on big data domain using text mining algorithms. Digit. Scholarsh. Humanit. 2021, 36, 361–370. [Google Scholar] [CrossRef]
- Provost, F.; Fawcett, T. Data science and its relationship to big data and data-driven decision making. Big Data 2013, 1, 51–59. [Google Scholar] [CrossRef]
- Di, J.; He, B.; Li, W. Research on Enterprise Competitive Intelligence Development and Strategies in the Big Data Era. In Proceedings of the 2014 IEEE International Conference on Computer and Information Technology, Xi’an, China, 11–13 September 2014; pp. 658–663. [Google Scholar]
- Marinov, O.; Tsankova, R. Impact of ICT on administrative management processes. In Proceedings of the VII МЕЖДУНАРОДНА НАУЧНА КОНФЕРЕНЦИЯ “Е-УПРАВЛЕНИЕ” в рамките на “Дни на науката–2015” на ТУ-Сoфия VII-th International Scientific Conference, Sozopol, Bulgaria, 13–14 June 2015; p. 61. [Google Scholar]
- Ilieva, G.; Yankova, T.; Klisarova, S. Big data based system model of electronic commerce. Trakia J. Sci. 2015, 13, 407–413. [Google Scholar] [CrossRef]
- Miškuf, M.; Zolotová, I. Application of business intelligence solutions on manufacturing data. In Proceedings of the 2015 IEEE 13th International Symposium on Applied Machine Intelligence and Informatics (SAMI), Herl’any, Slovakia, 22–24 January 2015; pp. 193–197. [Google Scholar]
- Karthika, I.; Gokulraj, P.; Saravanan, S. Prediction of sales using Big data analytics. J. Adv. Chem. 2016, 12, 20. [Google Scholar]
- Escorcia, A.; Mohan, R.; Saputelli, L. Improving Governance of Integrated Reservoir and Information Management Leveraging Business Process Management and Workflow Automation. In Proceedings of the SPE Annual Technical Conference and Exhibition, San Antonio, TX, USA, 9–11 October 2017. [Google Scholar]
- Li, X.; Tu, Z.; Jia, Q.; Man, X.; Wang, H.; Zhang, X. Deep-level quality management based on big data analytics with case study. In Proceedings of the 2017 Chinese Automation Congress (CAC), Jinan, China, 20–22 October 2017; pp. 4921–4926. [Google Scholar]
- Kamoun-Chouk, S.; Berger, H.; Sie, B.H. Towards integrated model of big data (BD), business intelligence (BI) and knowledge management (KM). In Proceedings of the International Conference on Knowledge Management in Organizations, Beijing, China, 21–24 August 2017; Springer: Cham, Switzerland; pp. 482–493. [Google Scholar]
- Chehbi-Gamoura, S.; Derrouiche, R.; Malhotra, M.; Koruca, H.-I. Adaptive management approach for more availability of big data business analytics. In Proceedings of the Fourth International Conference on Engineering & MIS, Istanbul, Turkey, 19–20 June 2018; pp. 1–8. [Google Scholar]
- Kitchens, B.; Dobolyi, D.; Li, J.; Abbasi, A. Advanced customer analytics: Strategic value through integration of relationship-oriented big data. J. Manag. Inf. Syst. 2018, 35, 540–574. [Google Scholar] [CrossRef]
- Madonsela, N.S. The Application of a Business Intelligence Tool for Service Delivery Improvement: The Case of South Africa; University of Johannesburg: Johanesburg, South Africa, 2020. [Google Scholar]
- Lian, J.-W.; Chen, C.-T.; Shen, L.-F.; Chen, H.-M. Understanding user acceptance of blockchain-based smart locker. Electron. Libr. 2020, 38, 353–366. [Google Scholar] [CrossRef]
- Sun, Y.; Lu, A.; Zhuo, L.; Li, G.; Jia, J.; Liu, W.; Hu, C. Quality Big Data Analysis and Management Based on Product Satisfaction Index. IOP Conf. Ser. Mater. Sci. Eng. 2021, 1043, 032004. [Google Scholar] [CrossRef]
- Agostino, A.; Søilen, K.S.; Gerritsen, B. Cloud solution in Business Intelligence for SMEs–vendor and customer perspectives. J. Intell. Stud. Bus. 2013, 3, 5–28. [Google Scholar] [CrossRef]
- Rajasekharaiah, K.; Dule, C.S.; Srimani, P. CRSA cryptosystem based secure data mining model for business intelligence applications. In Proceedings of the 2016 International Conference on Electrical, Electronics, and Optimization Techniques (ICEEOT), Chennai, India, 3–5 March 2016; pp. 879–884. [Google Scholar]
- Anjum, S.W. Risk magnification framework for clouds computing architects in business intelligence. In Proceedings of the 5th International Conference on Information and Education Technology, Tokyo, Japan, 10–12 January 2017; pp. 140–144. [Google Scholar]
- Nuseir, M.; Aljumah, A.; Alshurideh, M. How the Business Intelligence in the New Startup Performance in UAE During COVID-19: The Mediating Role of Innovativeness. Eff. Coronavirus Dis. Bus. Intell. 2021, 334, 63. [Google Scholar]
- Thakur, P.; Malhotra, M. Impact of COVID-19 on Cloud Business Intelligence. In Impacts and Challenges of Cloud Business Intelligence; IGI Global: Hershey, PA, USA, 2021; pp. 13–26. [Google Scholar]
- Sindar, A.; Sitio, A.S. Analisa Big Data Penyebaran Covid-19 Berdasarkan Peta Sebaran dan Peraturan Protokol Dengan Business Intelligence (BI). J. Ilm. KOMPUTASI 2021, 20, 393–402. [Google Scholar]
- Janyapoon, S.; Liangrokapart, J.; Tan, A. Critical Success Factors of Business Intelligence Implementation in Thai Hospitals. Int. J. Healthc. Inf. Syst. Inform. 2021, 16, 1–21. [Google Scholar] [CrossRef]
- Mosavi, N.; Santos, M. Implementation considerations for the applied business intelligence in healthcare. In International Conference on Decision Science & Management; Springer: Singapore, 2021. [Google Scholar]
- Pedersen, A.M.; Bossen, C. Data Work in Healthcare: An Ethnography of a BI Unit. In Infrahealth 2021-Proceedings of the 8th International Conference on Infrastructures in Healthcare 2019; European Society for Socially Embedded Technologies (EUSSET): Kristiansand, Norway, 2019. [Google Scholar]
- Chen, S.-H.; Tzeng, S.-Y.; Tham, A.; Chu, P.-X. Hospitality services in the post COVID-19 era: Are we ready for high-tech and no touch service delivery in smart hotels? J. Hosp. Mark. Manag. 2021, 30, 905–928. [Google Scholar] [CrossRef]
- Gaur, L.; Afaq, A.; Singh, G.; Dwivedi, Y.K. Role of artificial intelligence and robotics to foster the touchless travel during a pandemic: A review and research agenda. Int. J. Contemp. Hosp. Manag. 2021, 33, 4079–4098. [Google Scholar] [CrossRef]
- Koo, C.; Xiang, Z.; Gretzel, U.; Sigala, M. Artificial intelligence (AI) and robotics in travel, hospitality and leisure. Electron. Mark. 2021, 31, 473–476. [Google Scholar] [CrossRef]
- Alawad, H.A.; Kaewunruen, S. 5G intelligence underpinning railway safety in the COVID-19 era. Front. Built Environ. 2021, 7, 14. [Google Scholar] [CrossRef]
- Taboada, I.; Shee, H. Understanding 5G technology for future supply chain management. Int. J. Logist. Res. Appl. 2021, 24, 392–406. [Google Scholar] [CrossRef]
- Gaur, L.; Afaq, A.; Solanki, A.; Singh, G.; Sharma, S.; Jhanjhi, N.; My, H.T.; Le, D.-N.J.C.; Engineering, E. Capitalizing on big data and revolutionary 5G technology: Extracting and visualizing ratings and reviews of global chain hotels. Comput. Electr. Eng. 2021, 95, 107374. [Google Scholar] [CrossRef]
- Hand, D.; Mannila, H.; Smyth, P. Principles of data mining. MIT Press. Sect. 2001, 6, 2–6. [Google Scholar] [CrossRef] [PubMed]
- Giudici, P. Applied Data Mining: Statistical Methods for Business and Industry; John Wiley & Sons: Hoboken, NJ, USA, 2005. [Google Scholar]
- Bracke, P.; Datta, A.; Jung, C.; Sen, S. Machine Learning Explainability in Finance: An Application to Default Risk Analysis; Bank of England Working Papers 816; Bank of England: London, UK, 2019. [Google Scholar]
- Giudici, P.; Raffinetti, E. Shapley-Lorenz eXplainable artificial intelligence. Expert Syst. Appl. 2021, 167, 114104. [Google Scholar] [CrossRef]


| Ranking | Country | Count | Centrality |
|---|---|---|---|
| 1 | USA/The United States | 93/39 | 0.1/0.09 |
| 2 | India | 76 | 0.08 |
| 3 | China/Republic of China | 71/55 | 0.02/0.03 |
| 4 | England | 54 | 0.11 |
| 5 | Germany | 38 | 0.04 |
| Ranking | Institutions | Count | Centrality |
|---|---|---|---|
| 1 | Department of Computer Science, University of Nevada, Las Vegas, NV, the United States. | 16 | 0 |
| 2 | Swansea University, UK | 6 | 0 |
| 3 | University College London (UCL) | 6 | 0 |
| 4 | Nanjing University, China | 5 | 0 |
| 5 | National Institute of Industrial Engineering (NITIE), Mumbai, Maharastra | 4 | 0 |
| Ranking | Journals | Count | Centrality | Impact Factor (2021) |
|---|---|---|---|---|
| 1 | Management Science | 82 | 0.12 | 5.04 |
| 2 | MIS Quarterly | 130 | 0.09 | 7.198 |
| 3 | Harvard Business Review | 103 | 0.09 | 1.66 |
| 4 | Decision Support Systems | 124 | 0.08 | 7.04 |
| 5 | European Journal of Operational Research | 83 | 0.07 | 6.02 |
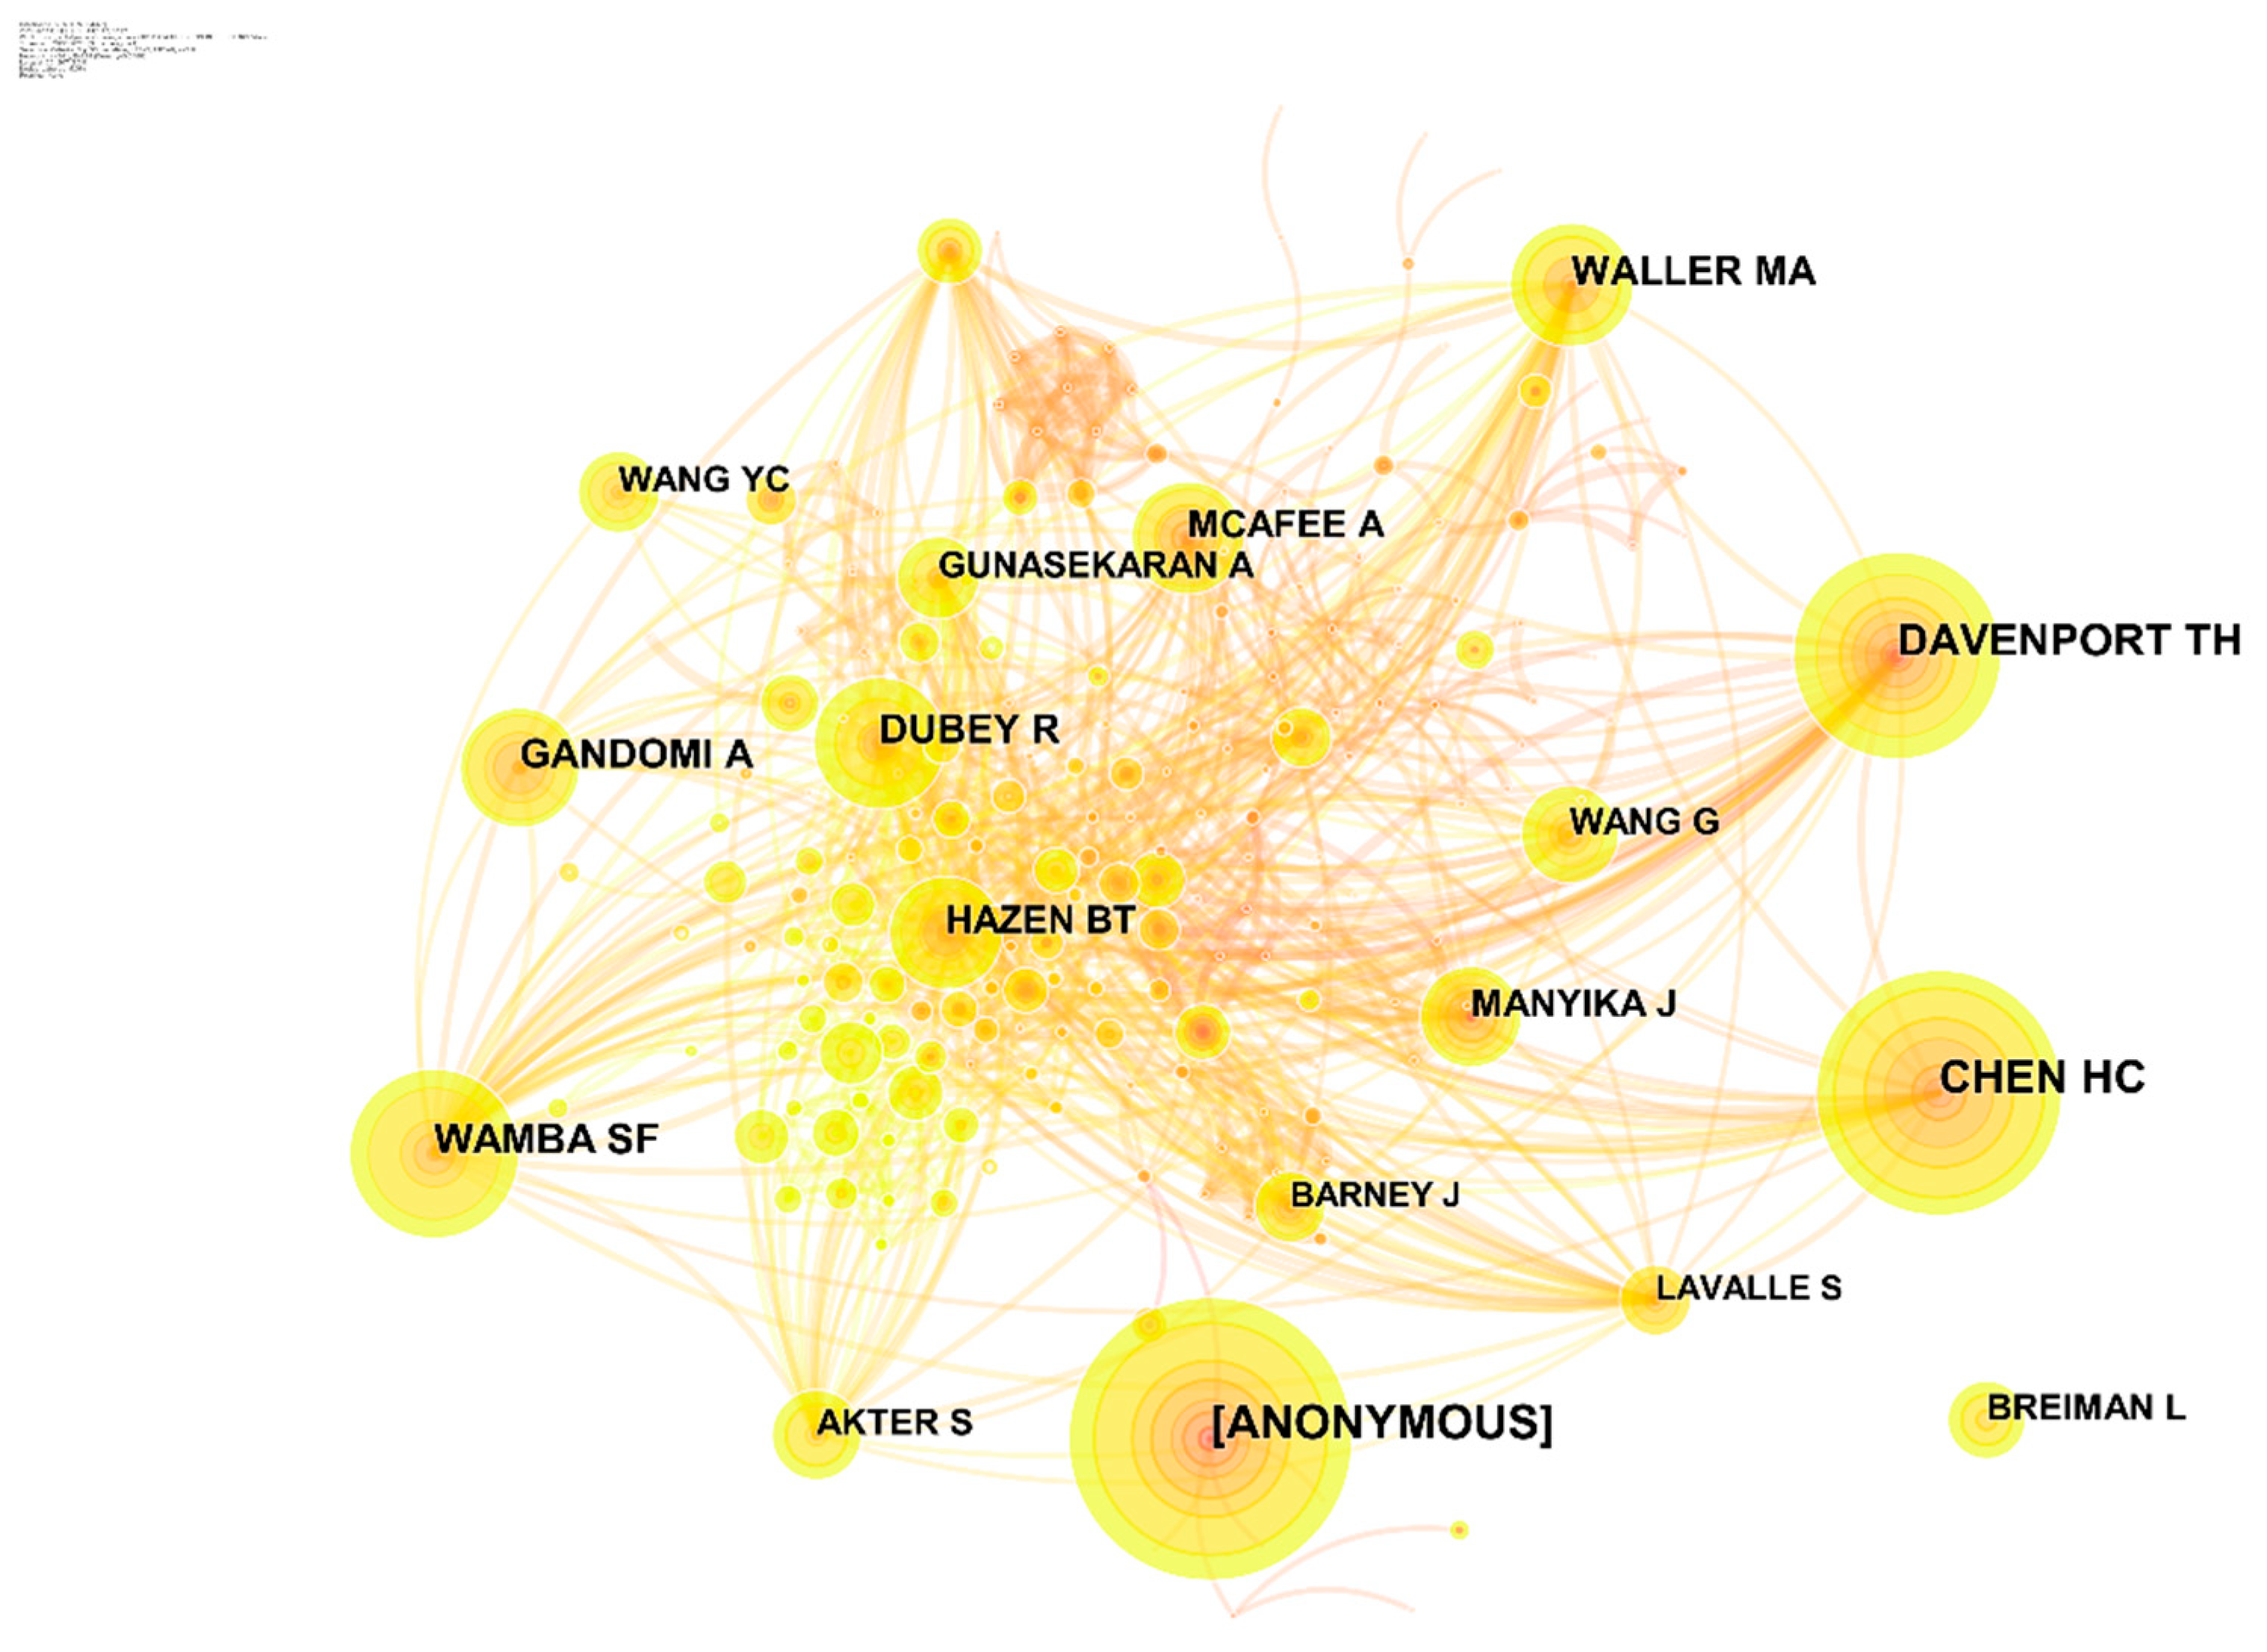
| Ranking | Authors | Count | Centrality | Involved Publications |
|---|---|---|---|---|
| 1 | Davenport, T.H. | 71 | 0.1 | Big data: the management revolution [32]. |
| 2 | Chiang, Roger HL | 5 | 0.07 | Strategic value of big data and business analytics [33]. |
| 3 | Dubey, Rameshwar | 45 | 0.06 | Education and training for successful careers in big data and business analytics [34]. |
| 4 | McAfee, Andrew | 39 | 0.06 | Big data: the management revolution [32]. |
| 5 | Davenport, Thomas H | 20 | 0.06 | Data scientist [35]. |
| Ranking | Count | Centrality | Year | Cited Reference | Number of Cited by (According to Google Scholar) |
|---|---|---|---|---|---|
| 1 | 71 | 0.12 | 2012 | Business intelligence and analytics: From big data to big impact [36] | 6376 |
| 2 | 45 | 0.05 | 2013 | Data science, predictive analytics, and big data: a revolution that will transform supply chain design and management [37]. | 1336 |
| 3 | 38 | 0.09 | 2015 | How ‘big data’ can make big impact: Findings from a systematic review and a longitudinal case study [38]. | 1407 |
| 4 | 34 | 0.07 | 2015 | Beyond the hype: Big data concepts, methods, and analytics [38,39] | 3929 |
| 5 | 31 | 0.05 | 2017 | Big data analytics and firm performance: Effects of dynamic capabilities [40]. | 986 |
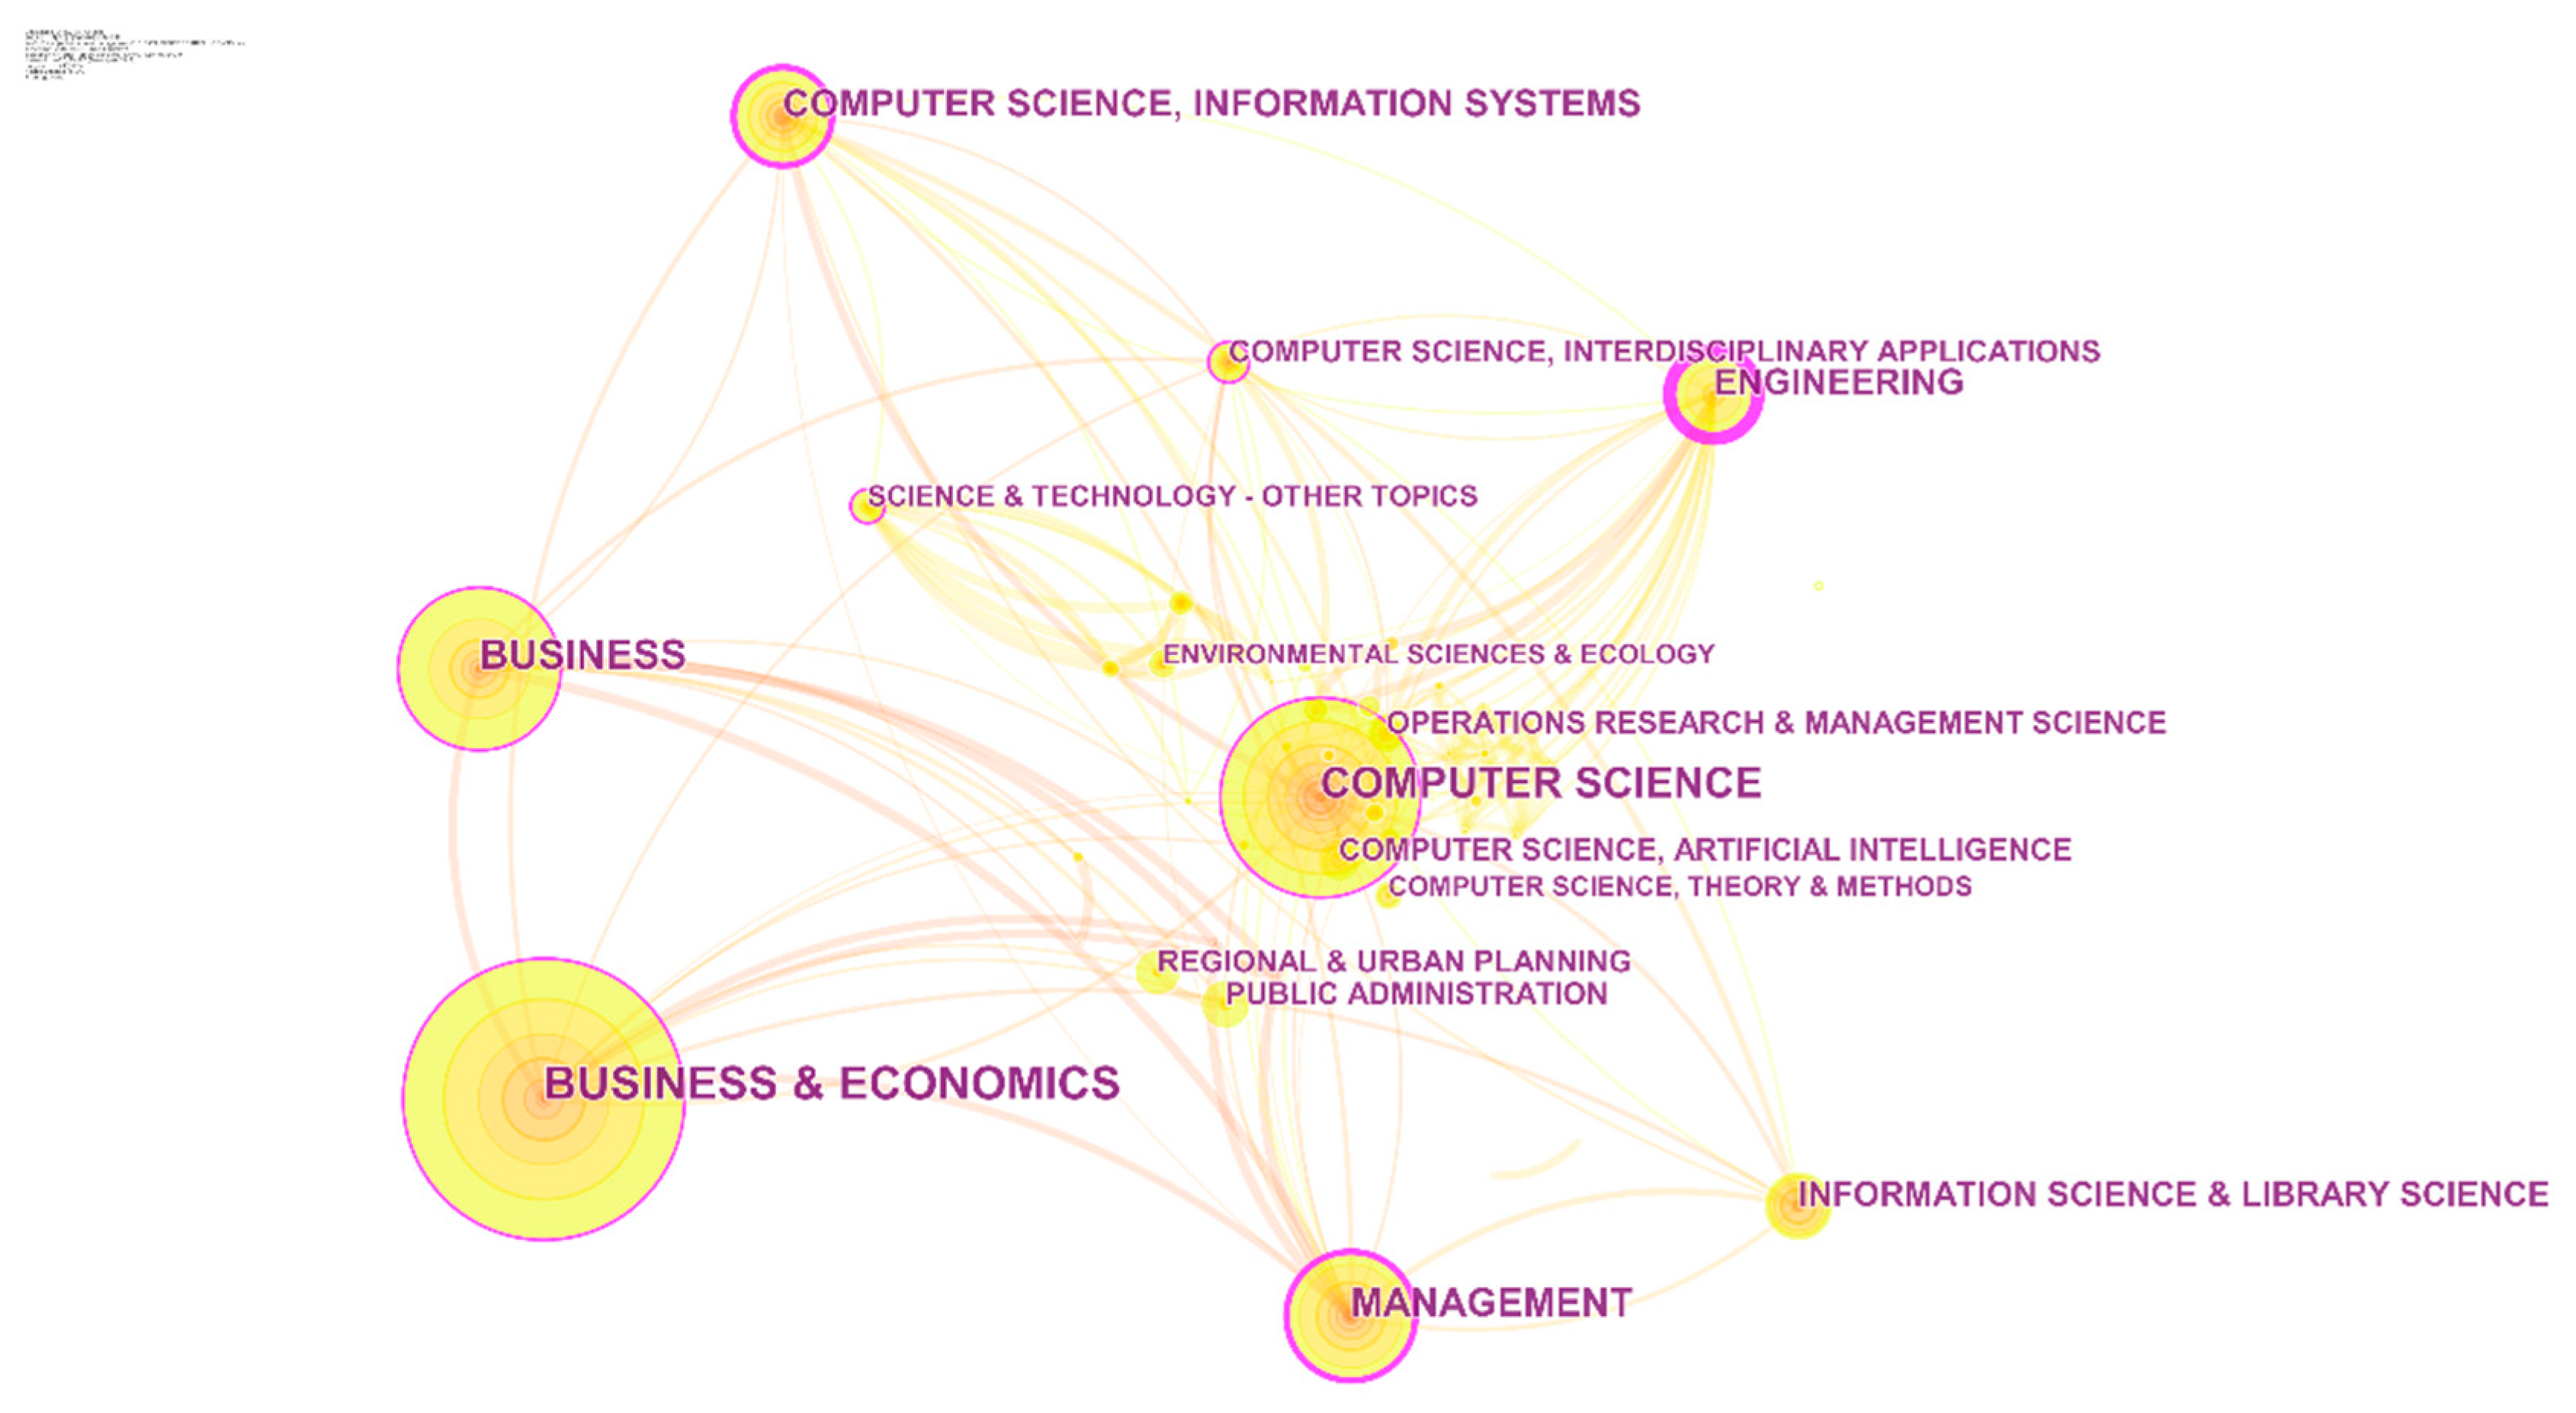
| Ranking | Category | Count | Centrality |
|---|---|---|---|
| 1 | Big data | 111 | 0.26 |
| 2 | Business, management & Economics | 207 | 0.25 |
| 3 | Computer science, Interdisciplinary applications | 23 | 0.13 |
| 4 | Machine learning | 24 | 0.12 |
| 5 | Economics | 13 | 0.12 |
| 6 | Engineering | 42 | 0.11 |
| 7 | Computer science | 102 | 0.1 |
| 8 | Big data analytics | 44 | 0.1 |
| 9 | Artificial intelligence | 74 | 0.09 |
| 10 | Mathematics | 46 | 0.04 |
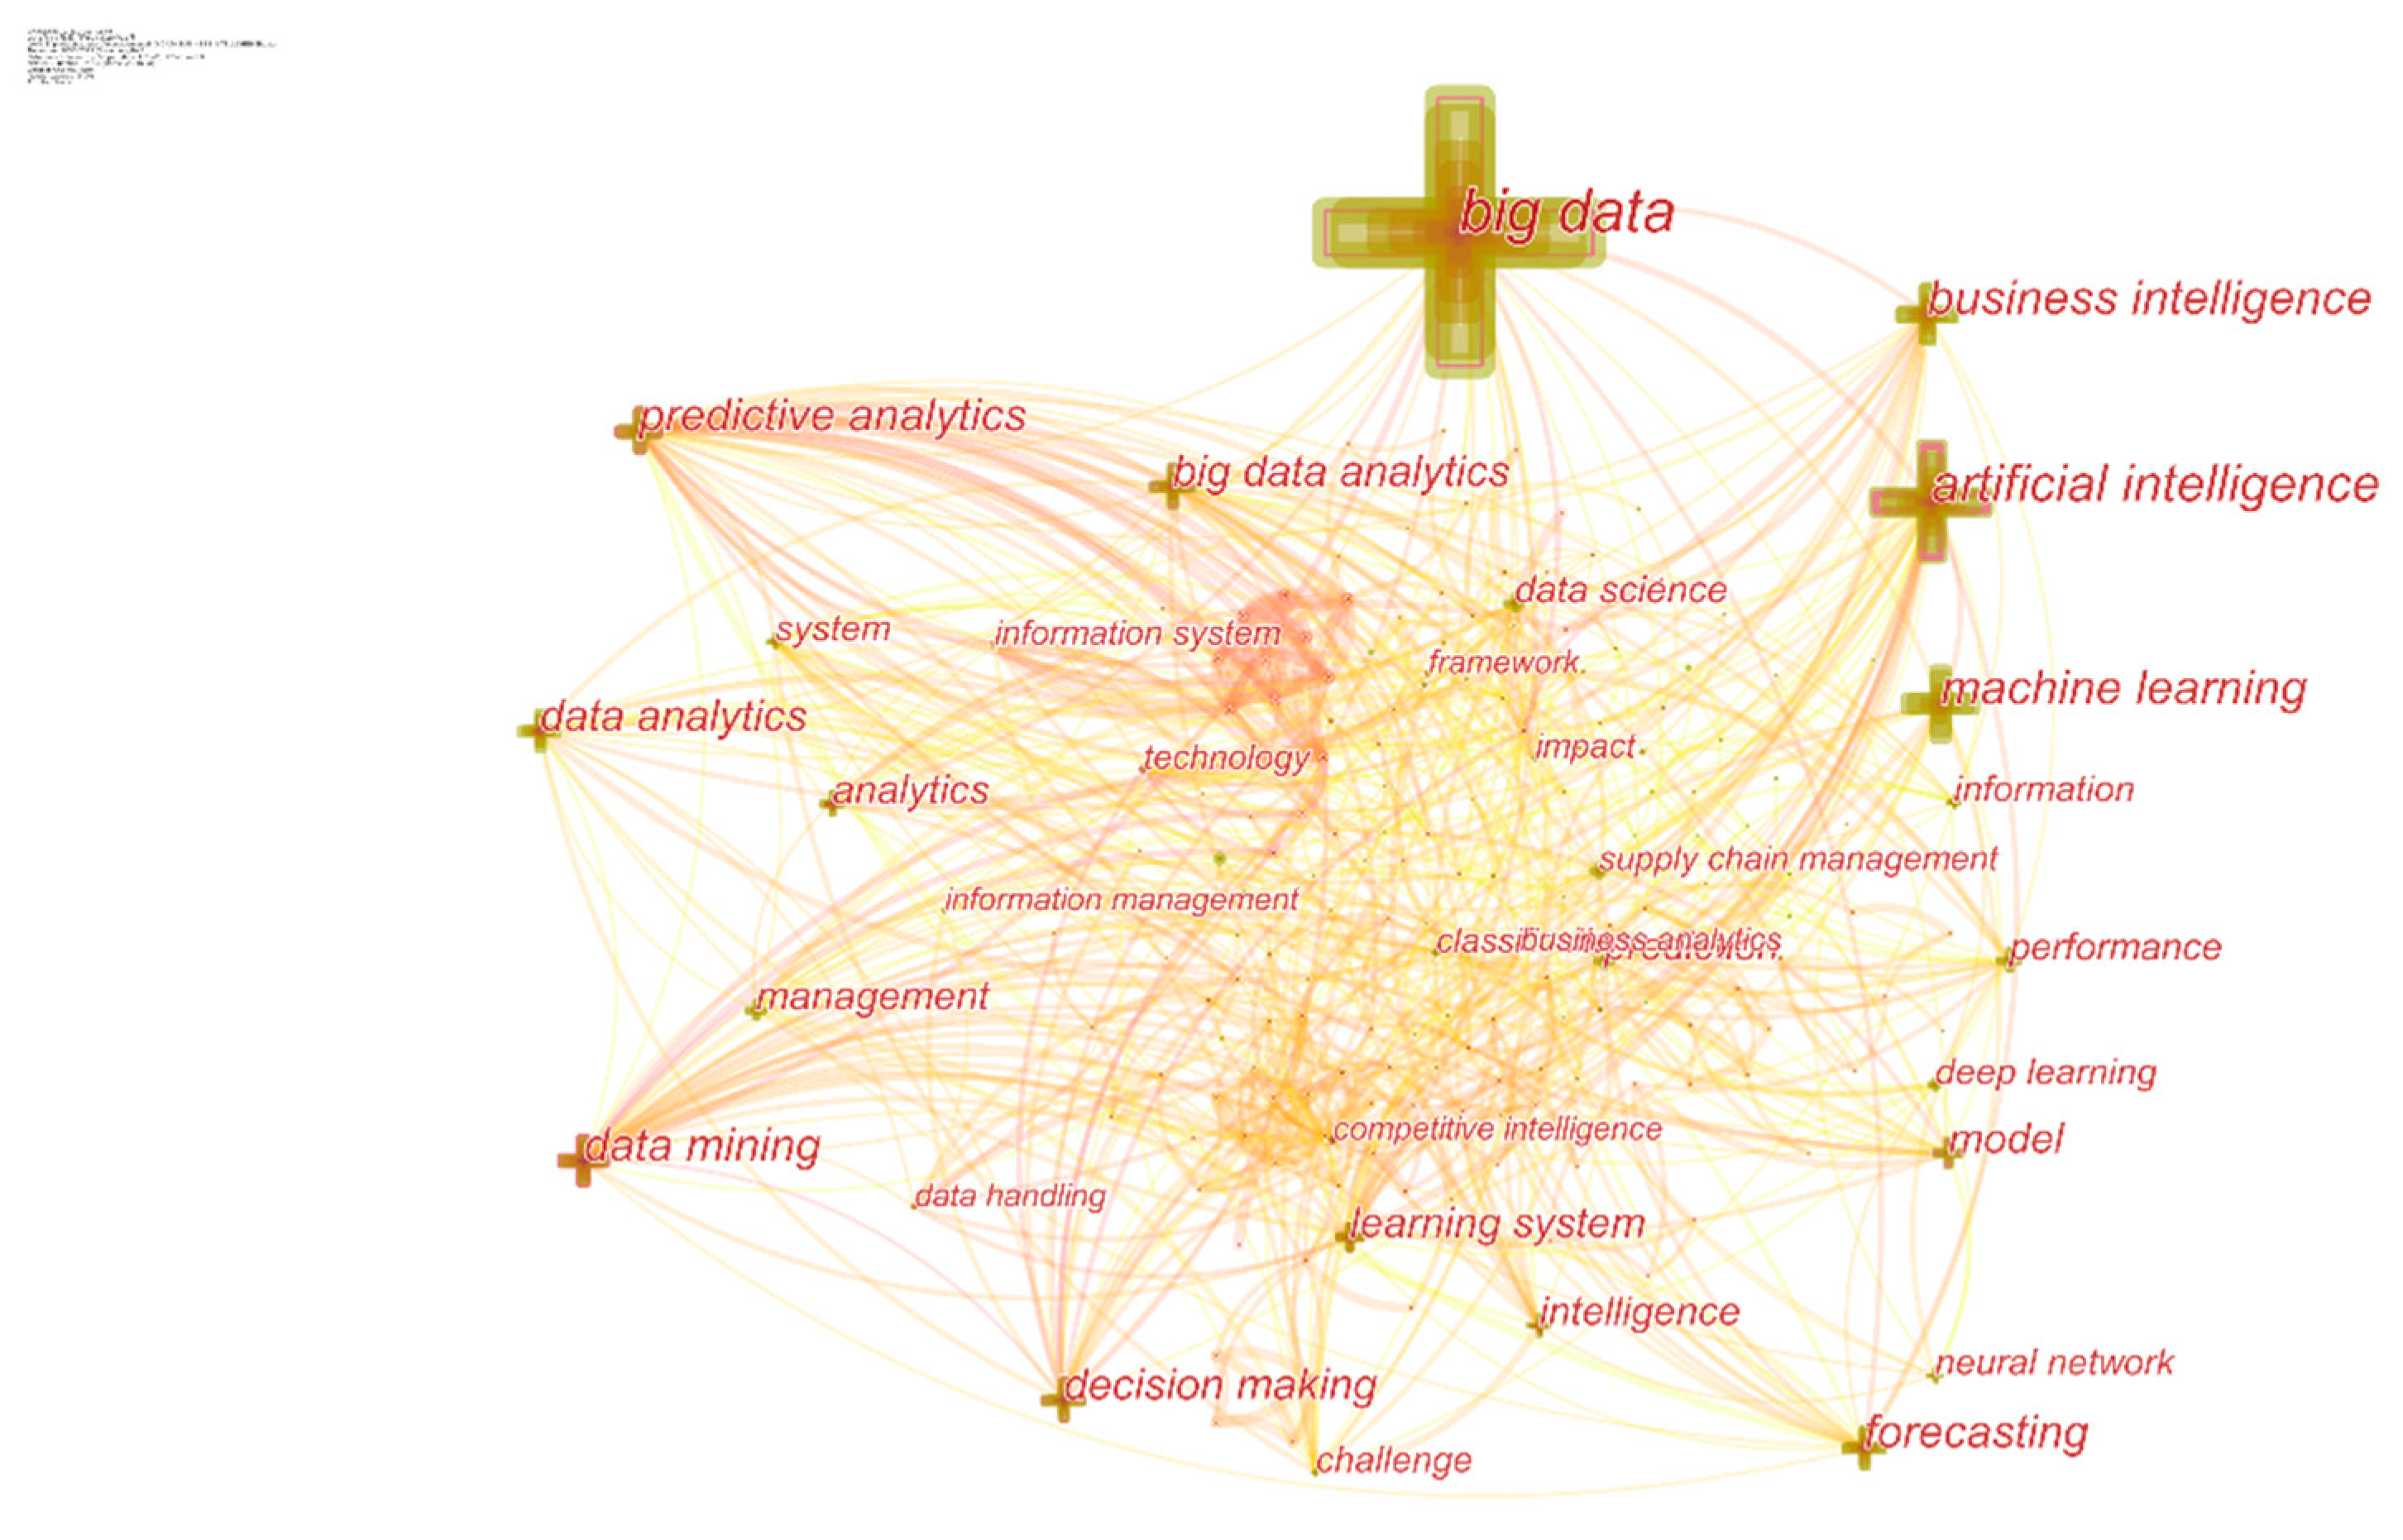
| Ranking | Keywords | Count | Centrality |
|---|---|---|---|
| 1 | big data | 368 | 0.14 |
| 2 | artificial intelligence | 160 | 0.25 |
| 3 | machine learning | 109 | 0.03 |
| 4 | business intelligence | 99 | 0.07 |
| 5 | data mining | 80 | 0.23 |
| 6 | predictive analytics | 78 | 0.26 |
| 7 | forecasting | 75 | 0.03 |
| 8 | big data analytics | 70 | 0.13 |
| 9 | decision making | 67 | 0.14 |
| 10 | data analytics | 64 | 0.08 |
| Burst Year | Methods | References | Conclusions |
|---|---|---|---|
| 2012 | data mining | Open business intelligence: on the importance of data quality awareness in user-friendly data mining [41]. | A highly qualified guiding mechanism of data mining of linked open data is necessary for open business intelligence, especially for non-expert users. |
| 2013 | digital storage | Business Process Analytics Using a Big DataApproach [42]. | Based on Hbase and Apache Hadoop, big data analytics in distributed environments present great advantages for business performance management. |
| 2014 | predictive analytics | Big data and predictive analytics in ERP systems for automating decision making processes [43]. | By identifying potential risks and opportunities, big data predictive analytics in enterprise resource planning (ERP) plays a great role in automating the decision-making process. |
| 2015 | ML | Efficient Machine Learning for Big Data: A Review | ML is responsible for decision making processes for BI, where efficient sustainable data modeling is necessary for big data processing. |
| 2016 | distributed computer system | Business-intelligence mining of large decentralized multimedia datasets with a distributed multi-agent system [44]. | Agent-oriented modeling techniques are novel solutions to meet the distributed data-mining processes. |
| 2016 | SVM | Big data analytics in healthcare: A survey approach [45]. | SVM is a typical ML algorithm for big data analytics in the BI area, which is responsible for classifying data into binomial classes or multilevel classes. |
| 2016 | regression | A comparative analysis on linear regression and support vector regression [46]. | Regression algorithms play a great role in BI research, which is mostly utilized for time-series data analytic tasks. |
| 2017 | classification algorithms | Knowledge management for business intelligence measurement in an e-business system [47]. | Algorithms of hierarchical ascendant classification and product classification present a great strength for BI knowledge management. |
| 2018 | NN | Deep learning architecture for high-level feature generation using stacked auto encoder for business intelligence [48]. | NN-based deep learning model delivers great performance for big data-based BI tasks. |
| 2018 | RF | ||
| 2018 | DL | Deep learning architecture for high-level feature generation using stacked auto encoder for business intelligence [48]. | Compared to ML algorithms, DL strategies show a great advantage for high-level representation extractions. |
| 2019 | prediction algorithm-based time-series | Large Multivariate Time Series Forecasting: Survey on Methods and Scalability [49]. | Forecasting models play a vital role in BI time series data analysis, where the prediction model optimization of selection, dimension reduction, and shrinkage are highlighted. |
| 2020 | sentiment analysis | Big data and sentiment analysis: A comprehensive and systematic literature review [50]. | Sentiment analysis based on textual big data is helpful for BI enhancements in aspects of efficiency, flexibility, and intelligence. |
| 2021 | text mining | Research trends on big data domain using text mining algorithms [51]. | Text mining based on big data for clustering and association evaluations is helpful for BI management, modern techniques like cloud computing, green information, and open source should be considered in future research. |
| Burst Year | BI Applications | References | Conclusions |
|---|---|---|---|
| 2013 | decision making | Data science and its relationship to big data and data-driven decision-making [52]. | Data-driven decision-making process has the potential for maintaining BI sustainability, especially for large-scale datasets. However, an explicit research design based on the fundamental of business management is necessary. |
| 2013 | business process intelligence | Business process analytics using a big data approach [42]. | Big data analytics in a distributed environment is a key solution for evidence-based business process management (BPM), especially to meet high requirements of low cost, high quality, and timely measurement. |
| 2014 | competitive intelligence and competition analysis | Research on Enterprise Competitive Intelligence Development and Strategies in the Big Data Era [53]. | Big data-driven strategies based on deep insight exploration are key for enterprise competitive intelligence development, especially for company organization, resource sharing, collaborations, and security protection. |
| 2015 | administrative management | Impact of ICT on administrative management processes [54]. | With the development of ICT, electronic administrative management is enhanced, and participants are able to be involved in the decision-making process directly. |
| 2015 | commerce enhancement | Big data-based system model of electronic commerce [55]. | By analyzing performances of customer behaviors, deliveries, sales, marketing, competitors, and payments, the big data-based e-commerce model shows a great advantage for online store management. |
| 2015 | manufacture development | Application of business intelligence solutions on manufacturing data [56]. | Analysis based on manufacturing data is an efficient way to generate strategic reports and enhance manufactory efficiency. |
| 2016 | sale prediction | Prediction of sales using Big data analytics [57]. | With big data solutions of Apache Flume, hive. And HDFS, analysis of smart data is an effective way for purchase intention exploration, which is significant for marketing enhancements. |
| 2017 | information management | Improving Governance of Integrated Reservoir and Information Management Leveraging Business Process Management and Workflow Automation [58]. | Information management plays an important role in business process management, which is responsible for process performance metric tracking, communicating value enlargement, strategic decision-making, etc. |
| 2017 | quality management | Deep-level quality management based on big data analytics with case study [59]. | Deep-level quality management based on process large-scale data |
| 2017 | knowledge management | Towards integrated models of big data (BD), business intelligence (BI) and knowledge management (KM) [60]. | An integrated pattern of big data, business intelligence, and acknowledgment management is an advanced solution for competitive advantage enhancements. |
| 2018 | risk assessment | Adaptive management approach for more availability of big data business analytics [61]. | Through forecasting and measuring analysis patterns, adaptive risk assessment methods based on a big data environment present a great advantage to meet the requirements of time-consuming and high accuracy. |
| 2018 | customer satisfaction management | Advanced customer analytics: Strategic value through integration of relationship-oriented big data [62]. | Big data-based customer analytics deliver the potential for companies’ sustainable competitive advantages. |
| 2020 | service improvement | The application of a business intelligence tool for service delivery improvement: The case of South Africa [63]. | BI-based decision supporting system (BIDSS) model is responsible for service improvement, big data analytics on users’ feedback and service delivery is a key method for BIDSS building. Quick response, quality service delivery, transparency, and accessibility are the key aspects of service improvement. |
| 2020 | user acceptance development | Understanding user acceptance of blockchain-based smart locker [64]. | The key factors that influence user acceptance of new technology-oriented products are function, convenience, and security insurance. |
| 2021 | satisfaction improvement | Quality Big Data Analysis and Management Based on Product Satisfaction Index [65]. | Big data analysis and product satisfaction management are effective solutions for customer relationships and quality performance management. |
| Burst Year | Challenges | References | Conclusions |
|---|---|---|---|
| 2013 | software reliability | Cloud solution in Business Intelligence for SMEs–vendor and customer perspectives [66]. | Reliability and cost are the core issues for BI analytics. |
| 2016 | privacy | CRSA cryptosystem based secure data mining model for business intelligence applications [67]. | Privacy and authenticity of datasets are significant issues for BI applications. Solutions of secure and privacy preserved mining models are responsible for resource and time saving and high accuracy, preventing. |
| 2017 | personal information | Risk magnification framework for clouds computing architects in business intelligence [68]. | Control system of sensitive and personal data is necessary for BI management, especially for a distributed cloud computing environment, which is significant for the maintenance of security, reliability, and compliance. |
| Burst Year | Latest Topics | References | Conclusions |
|---|---|---|---|
| 2021 | COVID-19 | [69,70,71] | The major topics of COVID-19, big data, predictive analytics, and BI research falls on the challenges and BI solution for firms due to the epidemic. The other topic is the application of BI utilized in the research on the influential effects of COVID-19 on business industries. |
| 2021 | healthcare | [72,73,74] | The major topics are related to the challenges and advanced technologies of BI applied to healthcare industries. Patient data safety and its business application are incentive topics, which should be discussed in the future. |
| 2021 | hospitality | [75,76,77] | Hospitality is one of the most influential industries by COVID-19, where BI and information technology-driven solution is the most effective and novel methods for levering the hospitality growth trend. |
| 2021 | 5G | [78,79,80] | 5G technology brings new opportunities for BI in the aspects of quality service monitoring, effective decision-making, efficient operation management, etc. |
Publisher’s Note: MDPI stays neutral with regard to jurisdictional claims in published maps and institutional affiliations. |
© 2022 by the authors. Licensee MDPI, Basel, Switzerland. This article is an open access article distributed under the terms and conditions of the Creative Commons Attribution (CC BY) license (https://creativecommons.org/licenses/by/4.0/).
Share and Cite
Chen, Y.; Li, C.; Wang, H. Big Data and Predictive Analytics for Business Intelligence: A Bibliographic Study (2000–2021). Forecasting 2022, 4, 767-786. https://doi.org/10.3390/forecast4040042
Chen Y, Li C, Wang H. Big Data and Predictive Analytics for Business Intelligence: A Bibliographic Study (2000–2021). Forecasting. 2022; 4(4):767-786. https://doi.org/10.3390/forecast4040042
Chicago/Turabian StyleChen, Yili, Congdong Li, and Han Wang. 2022. "Big Data and Predictive Analytics for Business Intelligence: A Bibliographic Study (2000–2021)" Forecasting 4, no. 4: 767-786. https://doi.org/10.3390/forecast4040042