Article

Diffusion of Solar PV Energy in the UK: A Comparison of Sectoral Patterns

1
Management and Health Laboratory, Institute of Management, Sant’Anna School of Advanced Studies Pisa, 56127 Pisa, Italy
2
Department of Statistical Sciences, University of Padua, 35121 Padova, Italy
3
Department of Economics and Management, University of Pisa, 56124 Pisa, Italy
4
The Belt and Road School, Beijing Normal University, Zhuhai 519085, China
*
Author to whom correspondence should be addressed.
Forecasting 2022, 4(2), 456-476; https://doi.org/10.3390/forecast4020026
Submission received: 27 February 2022 / Revised: 15 April 2022 / Accepted: 18 April 2022 / Published: 20 April 2022

Abstract

:
The paper applies innovation diffusion models to study the adoption process of solar PV energy in the UK from 2010 to 2021 by comparing the trajectories between three main categories, residential, commercial, and utility, in terms of both the number of installations and installed capacity data. The effect of the UK incentives on adoptions by those categories is studied by analyzing the timing, intensity, and persistence of the perturbations on adoption curves. The analysis confirms previous findings on PV adoption, namely the fragile role of the media support to solar PV, the ability of the proposed model to capture both the general trend of adoptions and the effects induced by ad hoc incentives, and the dramatic dependence of solar PV from public incentives. Thanks to the granularity of the data, the results reveal several interesting aspects, related both to differences in adoption patterns depending on the category considered, and to some regularities across categories. A comparison between the models for number of installations and for installed capacity data suggests that the latter (usually more easily available than the former) may be highly informative and, in some cases, may provide a reliable description of true adoption data.

1. Introduction

1.1. Background

The continuing increase in per-capita energy demand, coupled with the planet’s increasing population, is bringing critical threats to both the fight against global climate change and energy security issues. The COVID-19 pandemic and the consequent lockdown periods all over the world have emphasized the importance of secure, stable, and resilient electricity networks [1].
The process of decarbonization, which is the progressive shift from fossil fuels to renewable energy technologies, requires on one hand a rapid growth of renewables, namely solar photovoltaic and wind power, and on the other hand an optimization of the role of natural gas as a transition medium [2].
Solar photovoltaic energy (solar PV) is considered a very attractive solution among renewable energy sources (RES), especially for households. According to the most recent IEA report on renewables [3], the growth of renewable power capacity at the world level has reached another record in 2021, driven by solar photovoltaic energy; solar PV alone has accounted for more than half of all renewable power expansion in 2021, followed by wind and hydropower.
Despite this rapid growth, some key challenges and market barriers remain and hinder a faster RES diffusion process. As highlighted by [4], social acceptance and political feasibility are crucial elements for low-carbon transitions. The diffusion of renewable energy technologies is a complex process that involves multiple agents, with the interaction of firms and economic agents, public and private institutions, and final consumers (see, for instance, [5,6]). All these subjects may have different needs and expectations, different attitudes towards change, and respond to different economic and social incentives.
Focusing on PV adoption, a study on Switzerland aiming to explain the differences in PV growth at the subnational level [7] showed that solar PV is more spread in areas with higher technoscientific knowledge, higher education institutions, and widespread innovation activity. Moreover, the critical role of local authorities, dedicated citizens, and energy companies has been highlighted for its ability to accelerate the uptake of this technology through locally based strategies.
A recent analysis of barriers and enablers for PV installation in [8] identified economic, information, and administrative barriers, while enablers included subsidies, climate change concerns, as well as the opportunity to earn money. The analysis especially focused on the importance of the use of nonresidential buildings to strengthen the diffusion process. A meta-analysis of studies on residential PV adoption in [9] suggested that measures should focus on enhancing the perception of benefits.
However, many other aspects may be accounted for when dealing with the diffusion of a renewable energy such as PV. For example, a study on Greece by [10] highlighted the role of technological and demographic changes, in combination with climatic factors, to explain the differences among regions in terms of energy conservation and emissions reduction. The work by [11] took a broader perspective, considering European countries, and assessed the sustainability of rooftop PV systems by taking into consideration the different solar potential of countries as well as the variety of electricity mix throughout Europe. The results of such analysis show that PV systems may be a viable solution for the future, but this depends on location and the local electricity mix. A more technical assessment on the sustainability and performance of PV systems comparing five different technologies, conducted by [12], confirmed that overall, these technologies proved to be sustainable and environmentally friendly. As a general observation, these studies suggest that PV diffusion is characterized by many sources of heterogeneities, resulting from natural, technological, economic, social, and behavioral specificities.
Bearing in mind the multifaceted nature of a transition to PV systems and the multiplicity of agents and factors involved, in this paper we focus on the diffusion of solar PV in the United Kingdom, one of the top ten countries in terms of solar PV cumulative installed capacity according to the IEA-PVPS 2020 report [13].
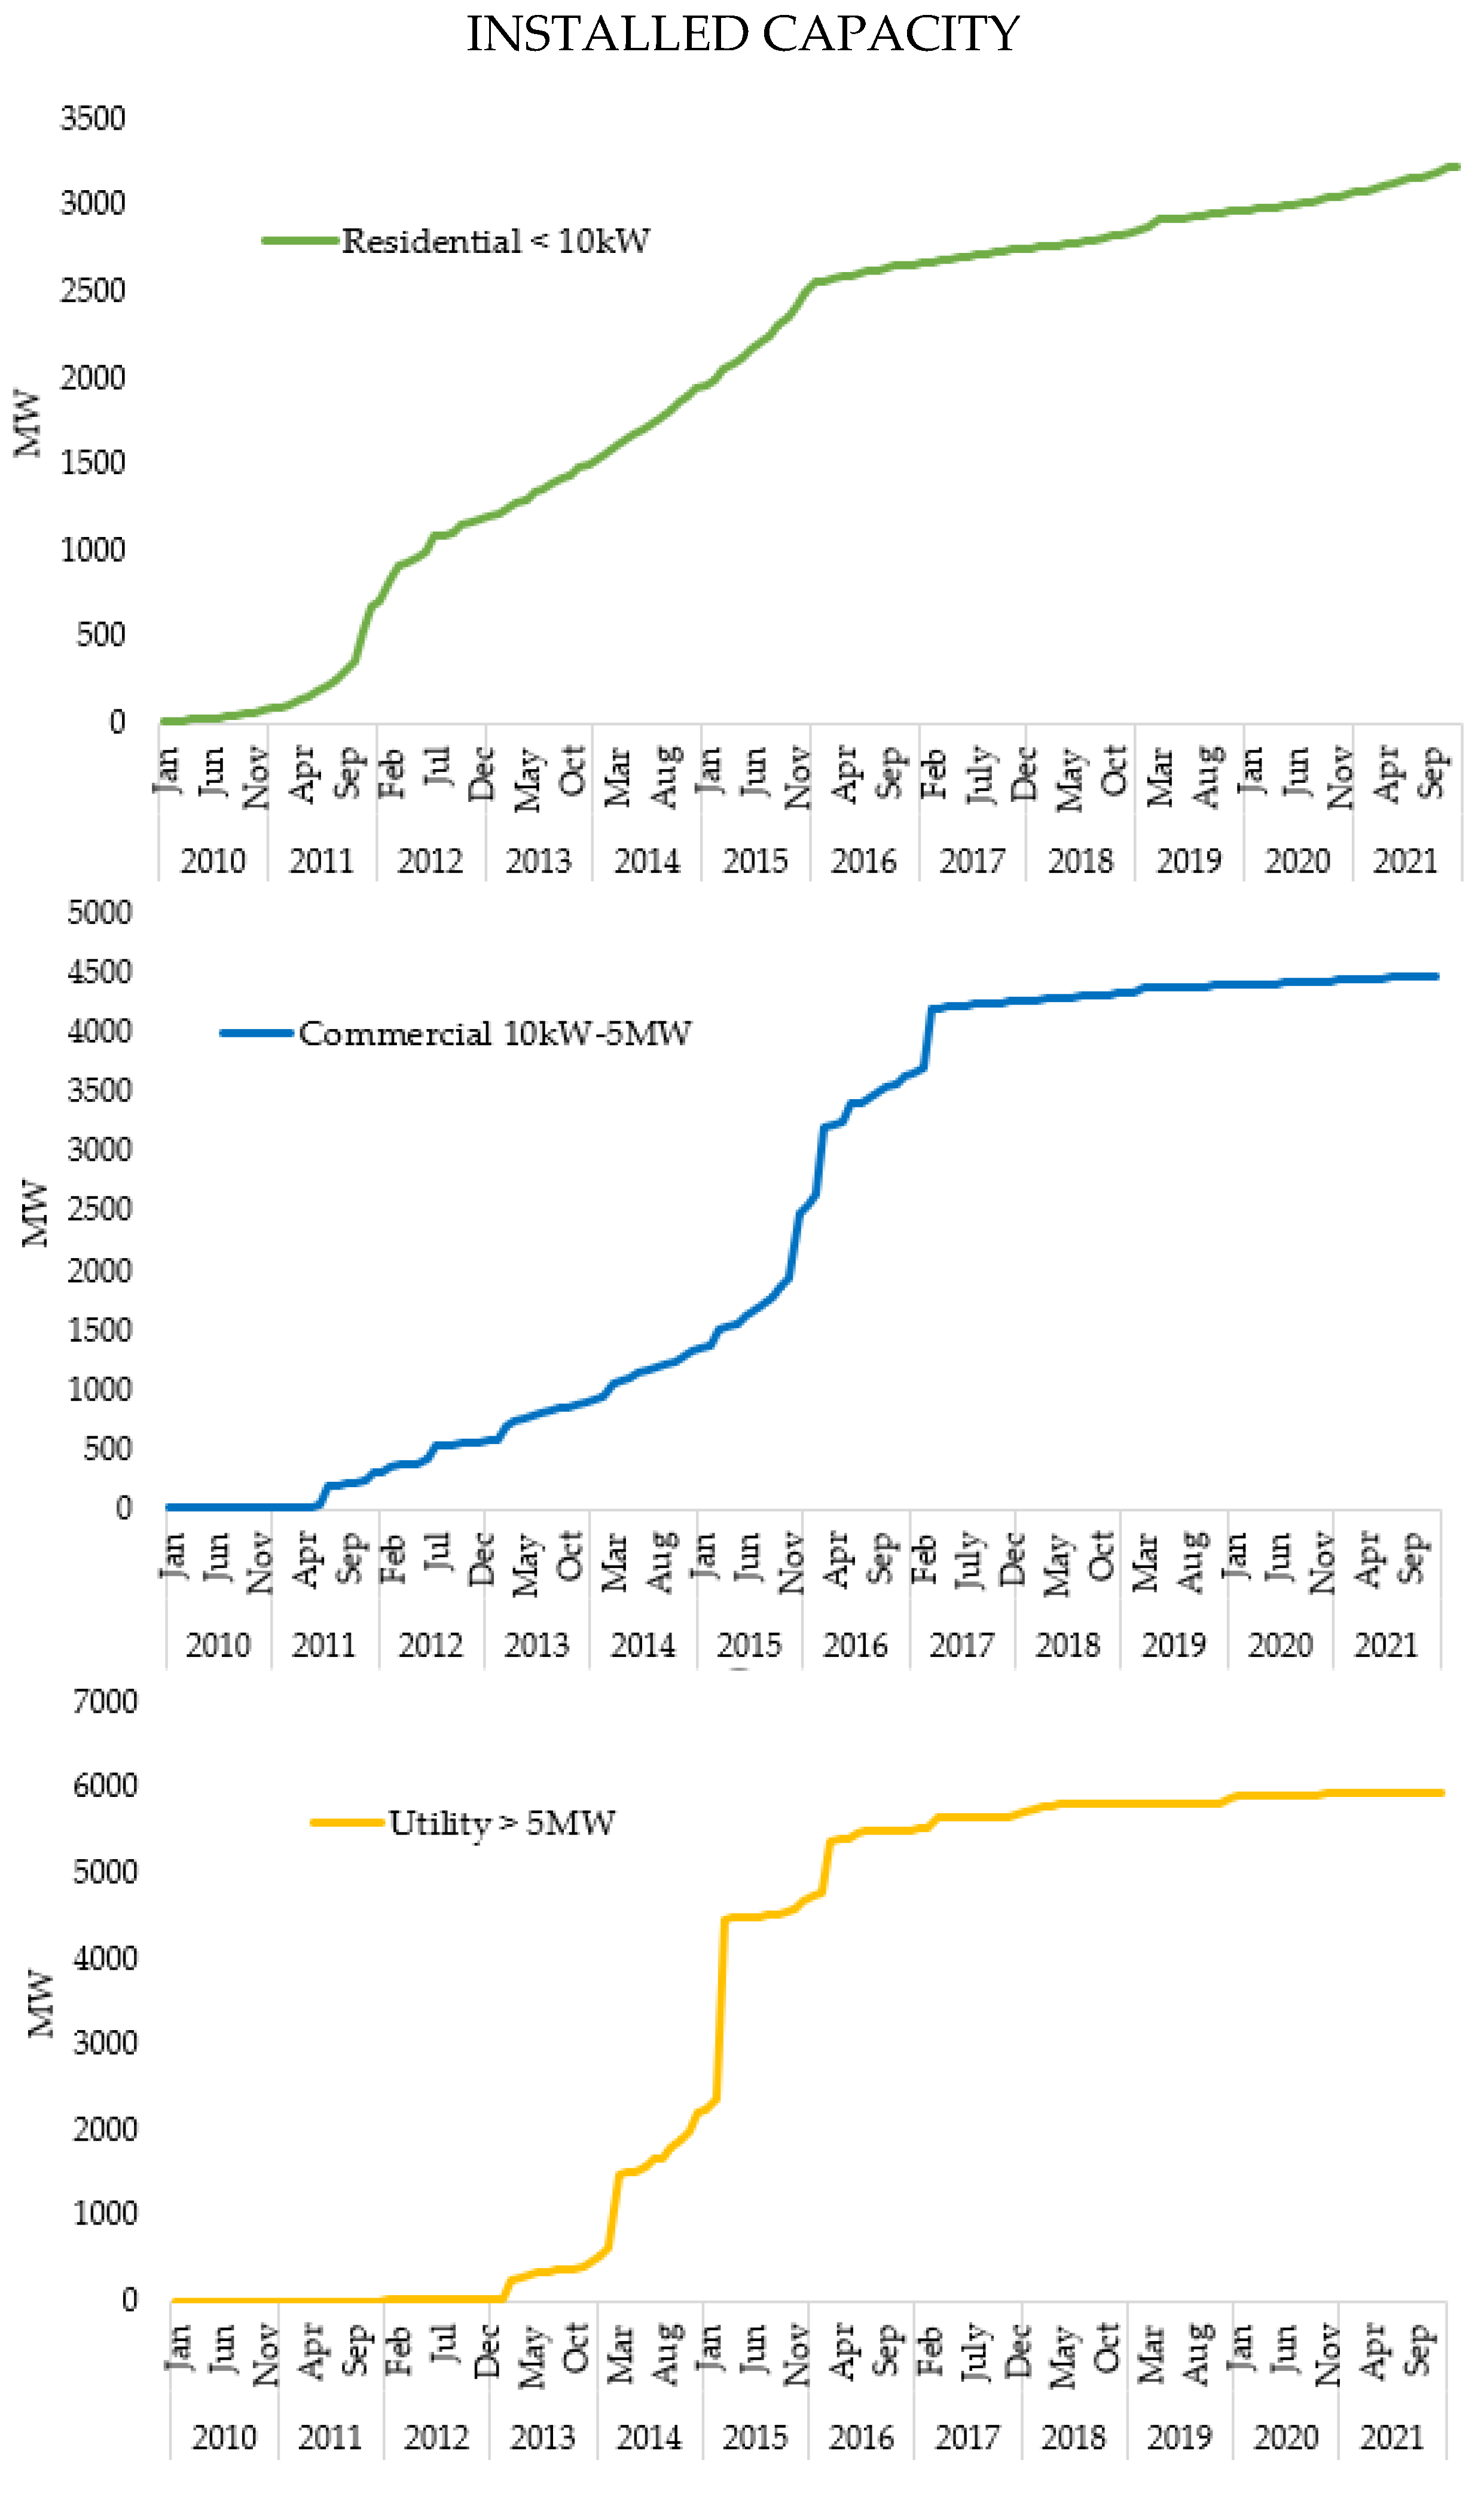
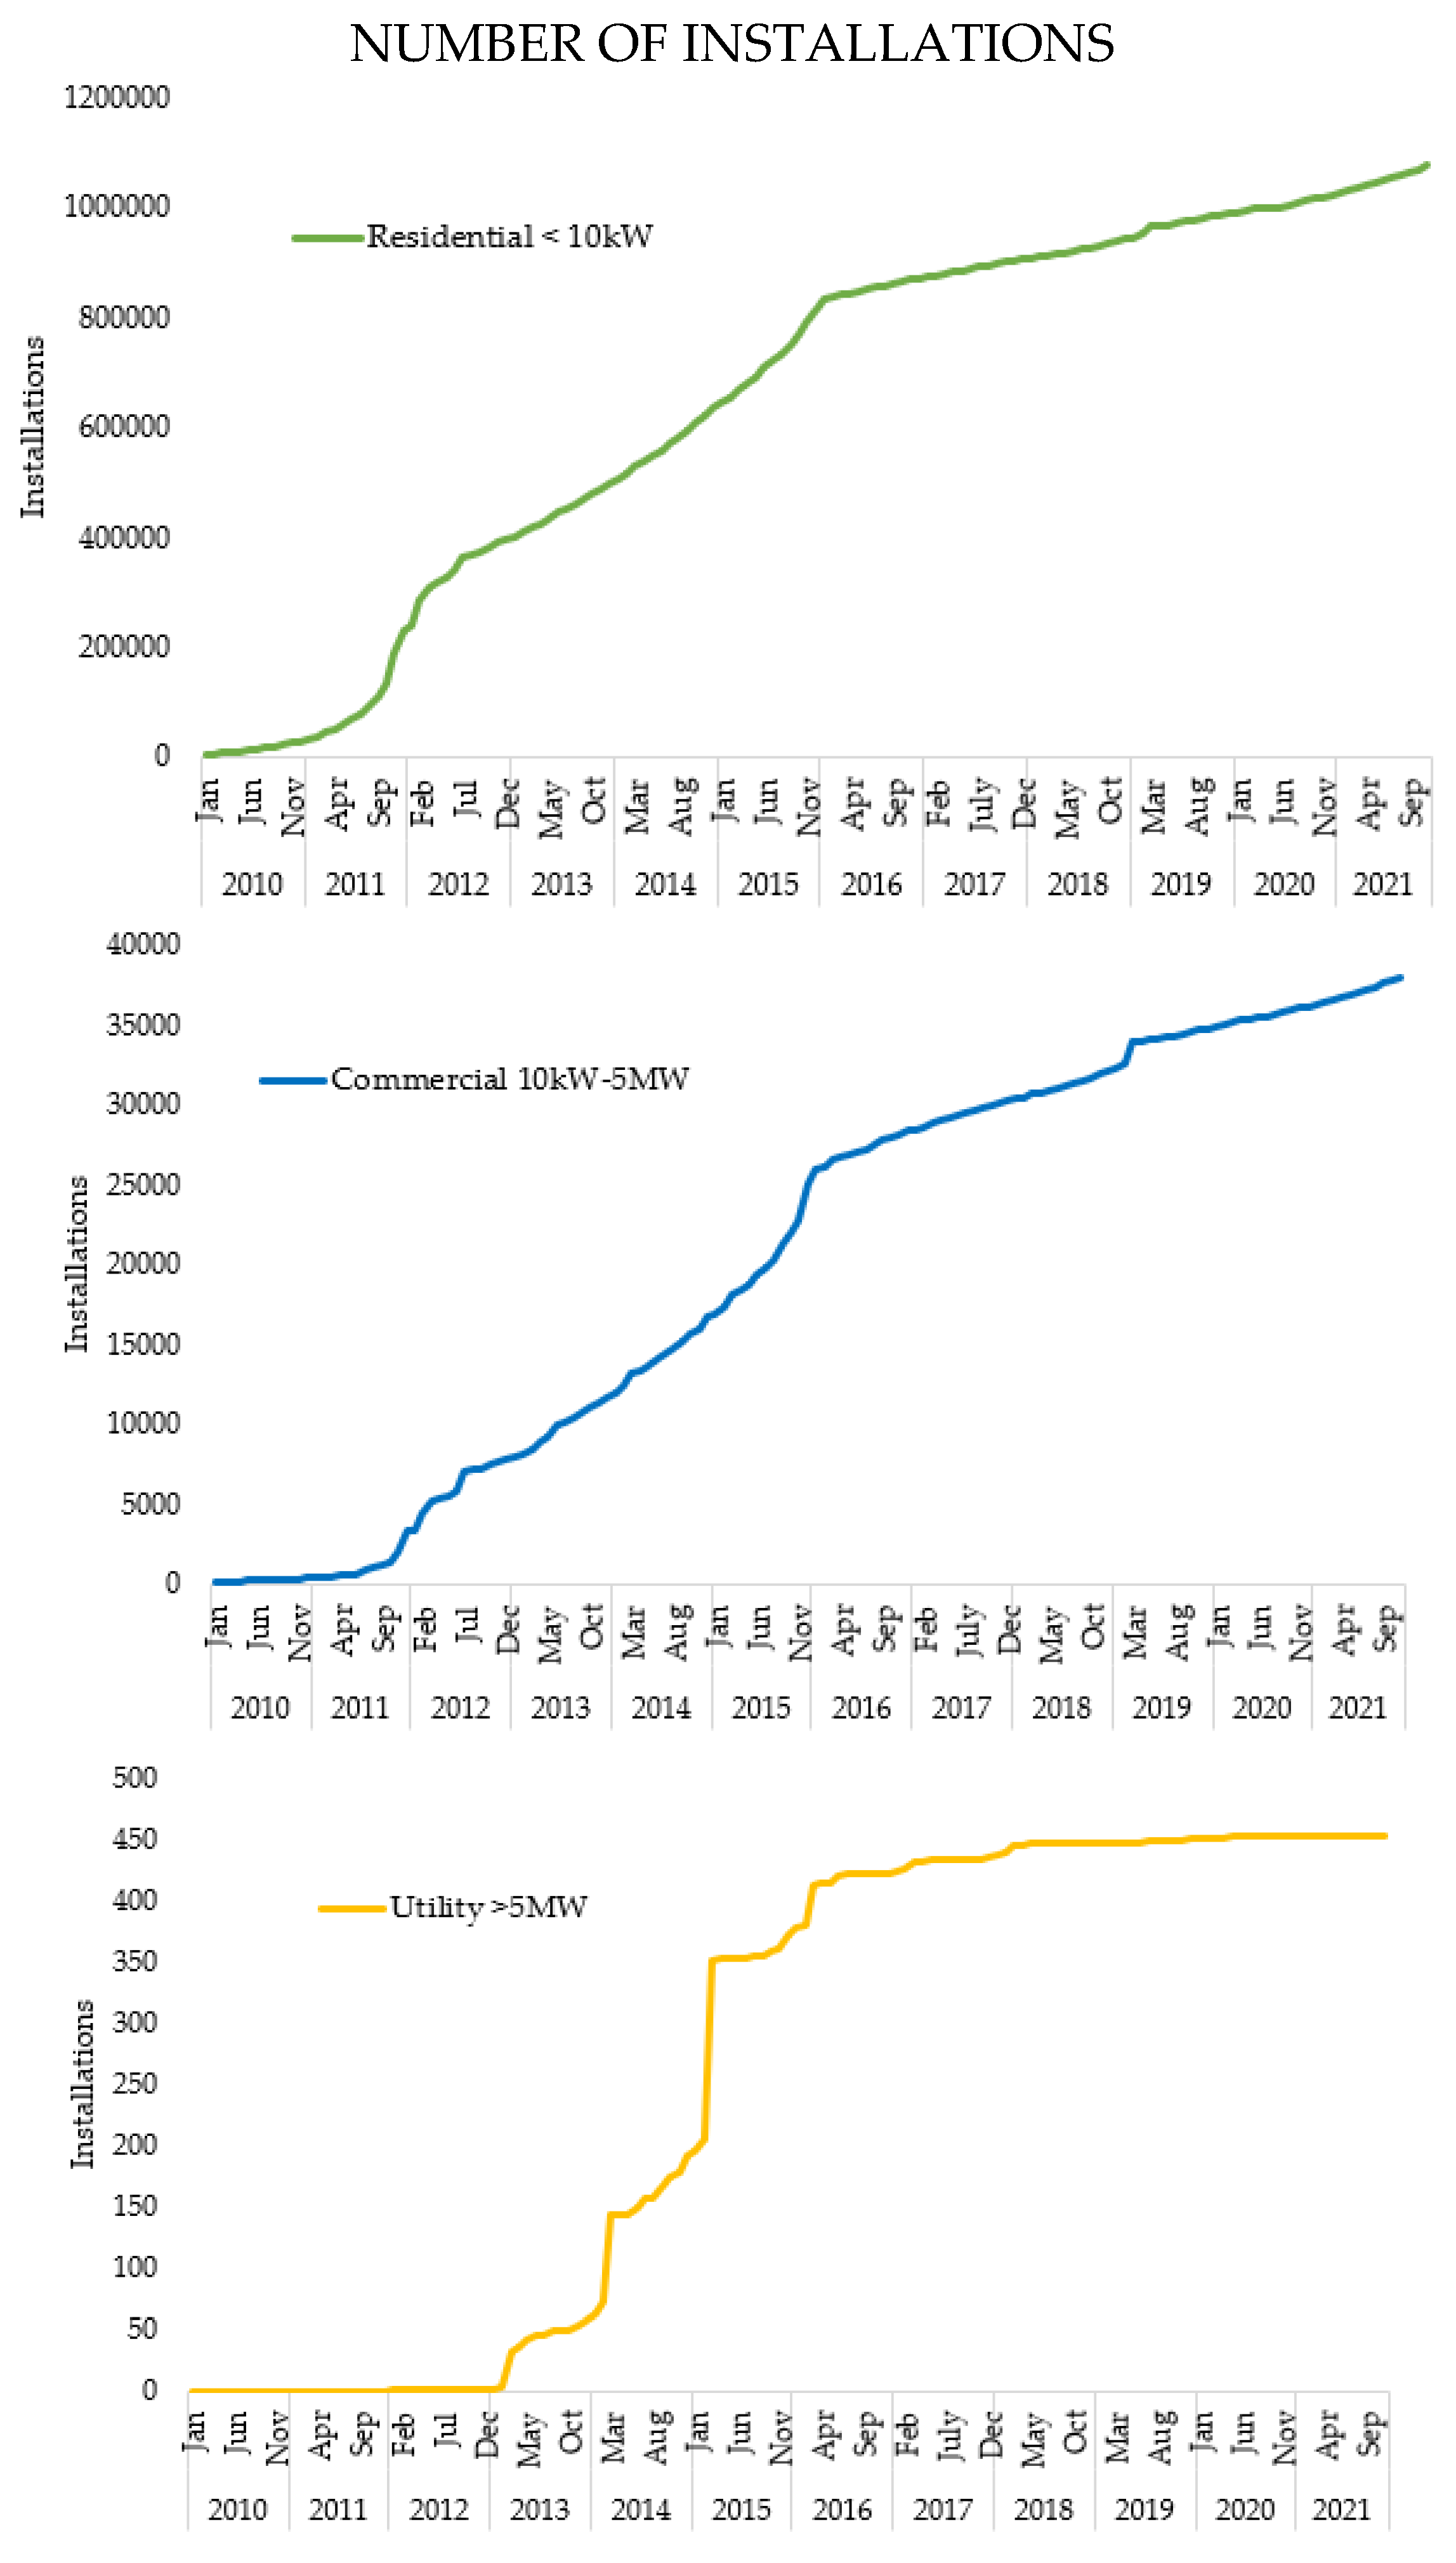
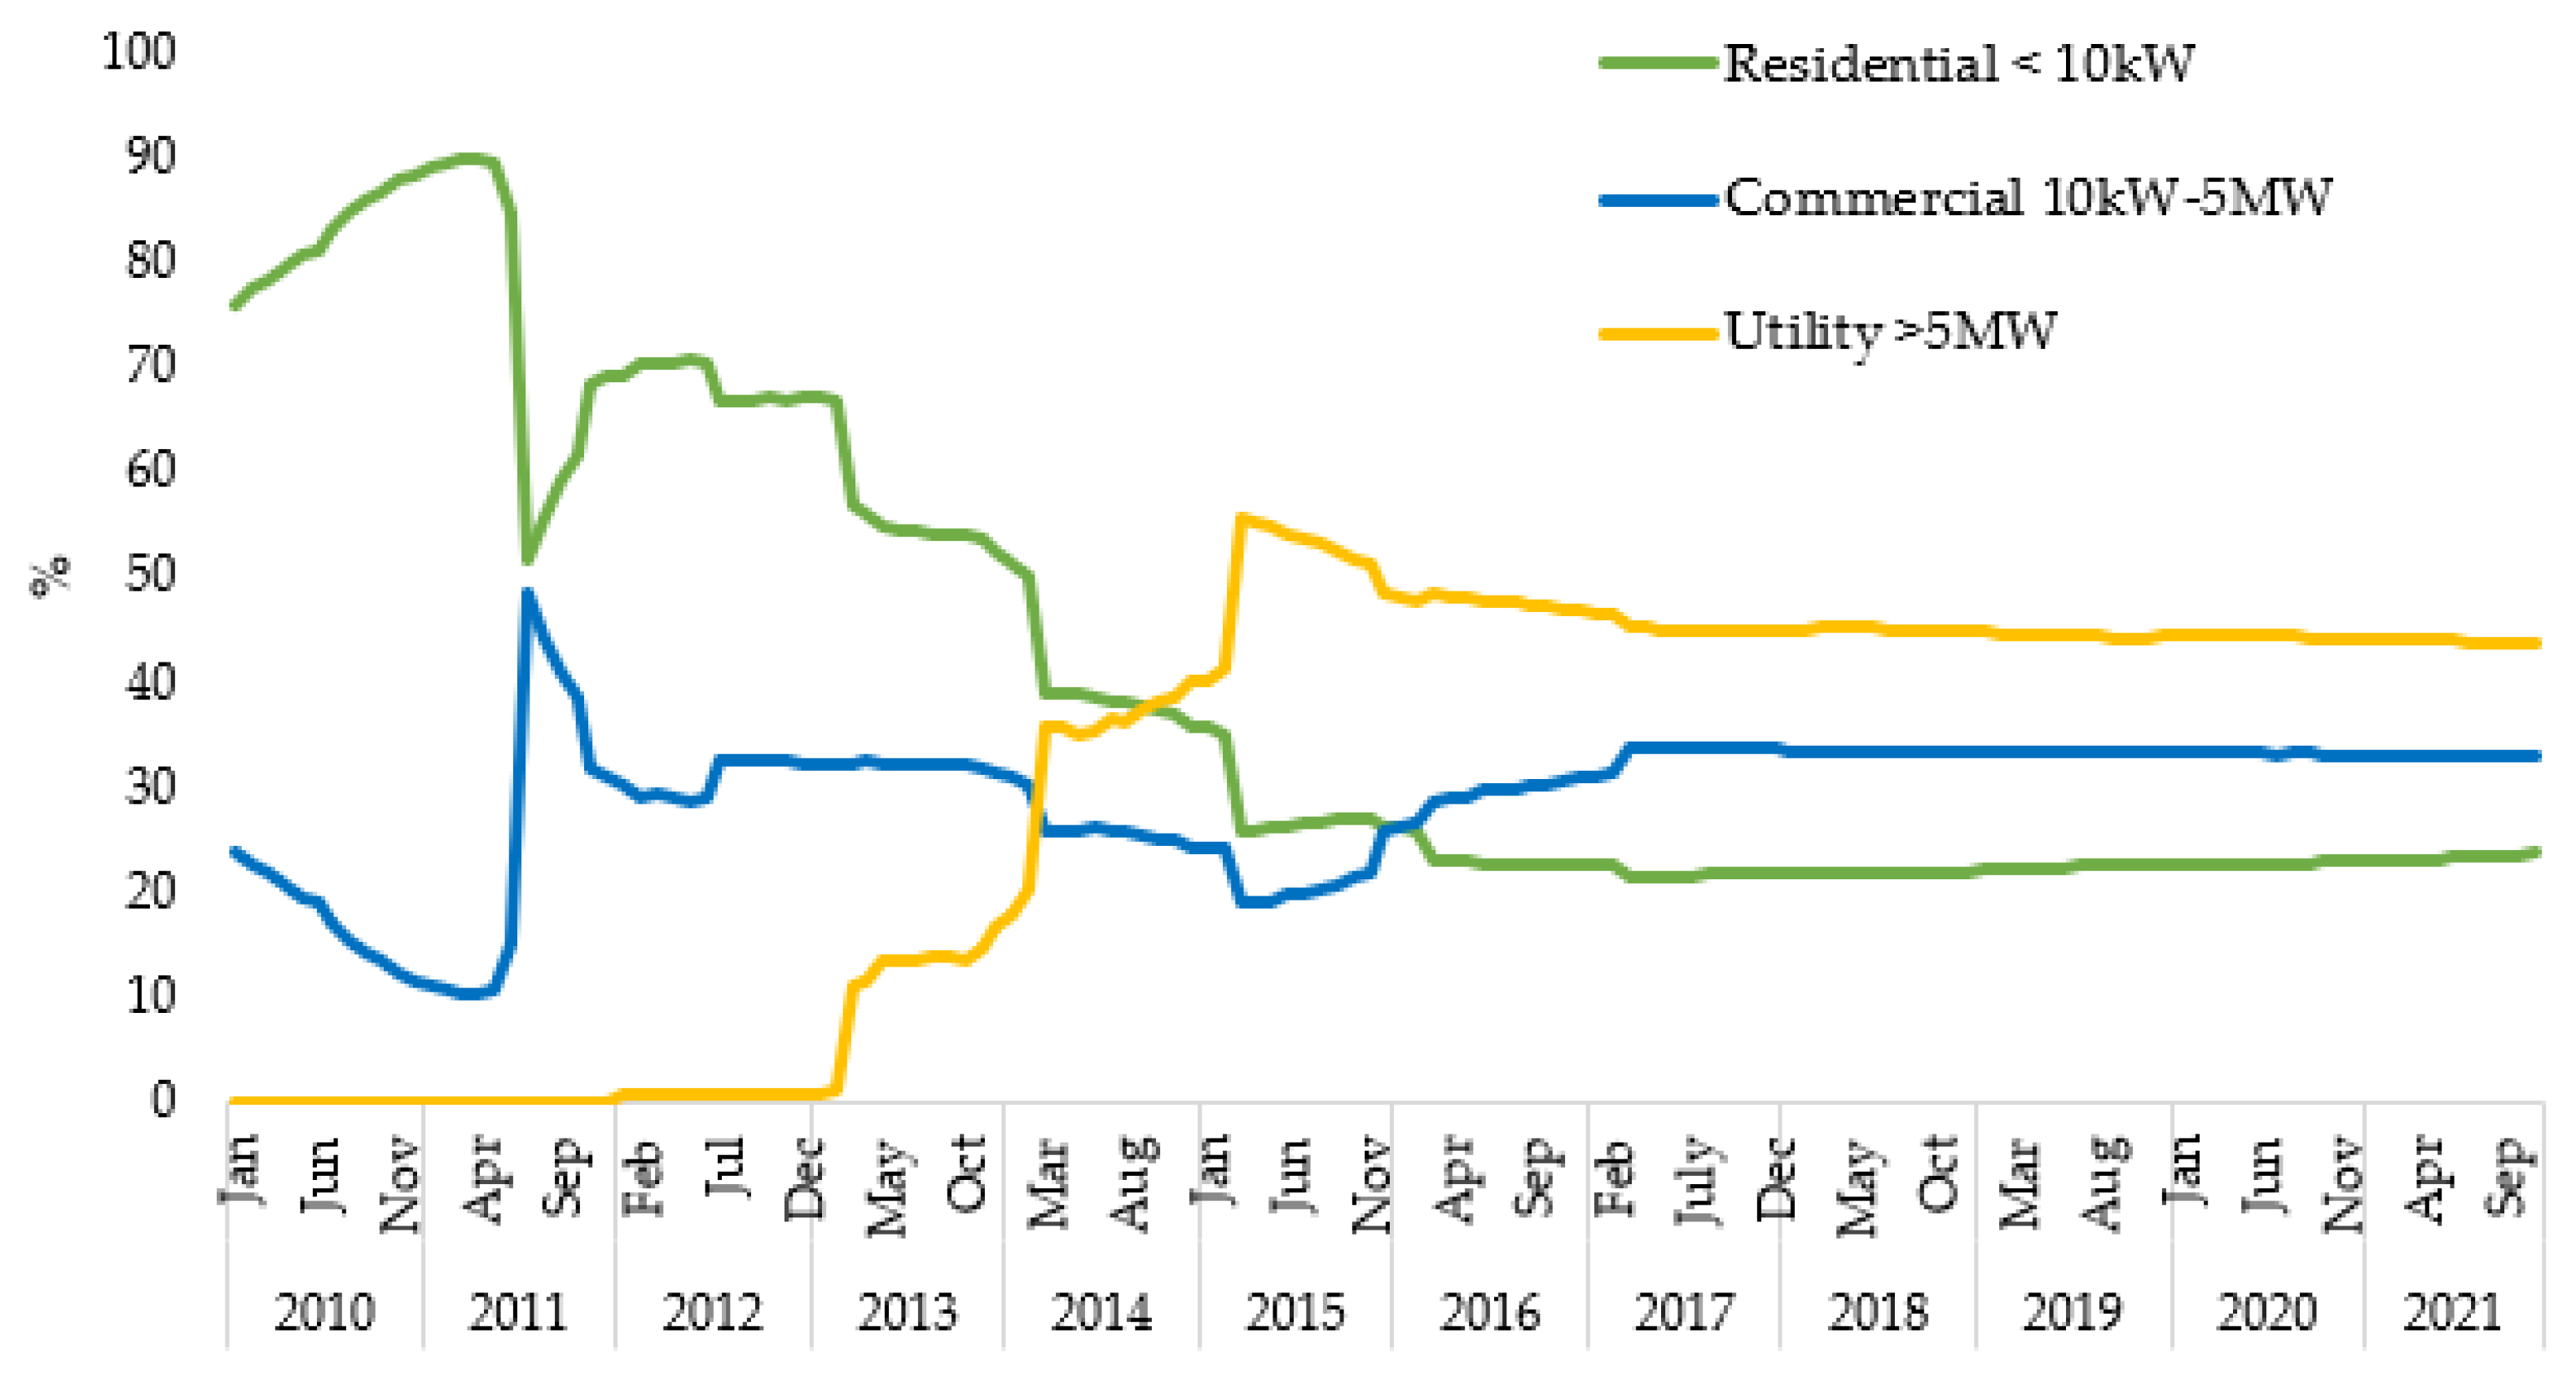
Compared with standard public data on energy diffusion, typically available only in a highly aggregated form, the UK case is of tantamount importance for the understanding of RES diffusion patterns, in view of the availability of highly disaggregated data, with time-granular (i.e., monthly) information on both installed capacity and number of installations of solar PV from January 2010 to November 2021, concerning three different and largely heterogeneous market categories: residential, commercial, and utility (i.e., licensed electricity suppliers).

1.2. Modelling the Diffusion of RES: A Short Review

The mathematical modelling of the temporal trends of diffusion processes has proved valuable in many applied sciences [14]. Innovation diffusion models, extensively used after the seminal work of [15], have also proved critically useful for describing and forecasting the growth of an energy source over the years, considering it as a technology that must be accepted in a market.
For recent reviews on the applications of innovation diffusion models for renewable energy technologies see [16,17]. Among the studies using innovation diffusion models for energy markets, [18] proposed an innovative application of the so-called Generalized Bass model (GBM) [19] to energy diffusions, whereby the GBM—thanks to the inclusion of suitable shock terms—was used as a diagnostic tool for describing the impact that external shocks (from, e.g., a war, a price shock or wave of policy incentives) exerted on diffusion trends.
In [20], the GBM was applied to yearly time series of national solar PV capacity in eleven countries up to 2006, finding that public incentives had a key role in stimulating the growth of this technology. A recent cross-country study on 26 countries by [21] has updated the findings of [20] by including the dramatic incentive-triggered adoption waves since 2007. Both these works exploited the ability of the GBM to capture the effect of policy interventions and ad hoc incentives in driving the diffusion of solar energy. In [21], the important role of the GBM as a parsimonious tool to capture the impact of “structured” shocks, i.e., shocks characterized by a precise pattern—as it might be the case of a policy intervention aiming to incentivize a market—on diffusions was noted. Structured shocks have a fully different nature compared, e.g., to standard stochastic perturbations. A complementary perspective based on the use of innovation diffusion models was proposed in [22,23], trying to understand the adoption of solar PV at the household level. In particular, the analysis proposed in [23] suggested that information from the media should explain more about investment criteria, feed-in tariffs (FIT), and environmental attributes.

1.3. Contribution and Paper Organization

Most modelling studies of the diffusion of solar PV based on the well-accepted methodological approach of innovation diffusion models, initiated by the Bass model, have typically relied on yearly, highly aggregated data, generally at the national level. This paper aims to contribute to the growing literature on the diffusion of solar PV technology by considering sectoral diffusion patterns in the UK as allowed by the high degree of granularity of data available for this country.
Some recent works have considered solar PV diffusion in the UK [24,25,26]. The authors of [24] conducted an analysis of PV adoption data, along with a study of implemented policies, finding that areas of similar installed PV capacity are clustered, indicating a strong dependence on local conditions for PV adoption. In [25], an interesting spatial analysis was performed in order to understand the socio-economic variables that help the adoption of solar PV and explain the spatial heterogeneity in the diffusion of such technology. In [26], a simulation study evaluated the effects of a cautious reduction in FIT in the UK solar PV market. Their results suggest the counterintuitive effect by which a reduction in incentives (i.e., in the FIT), while reducing the adoption of solar PV, could incentivize battery storage.
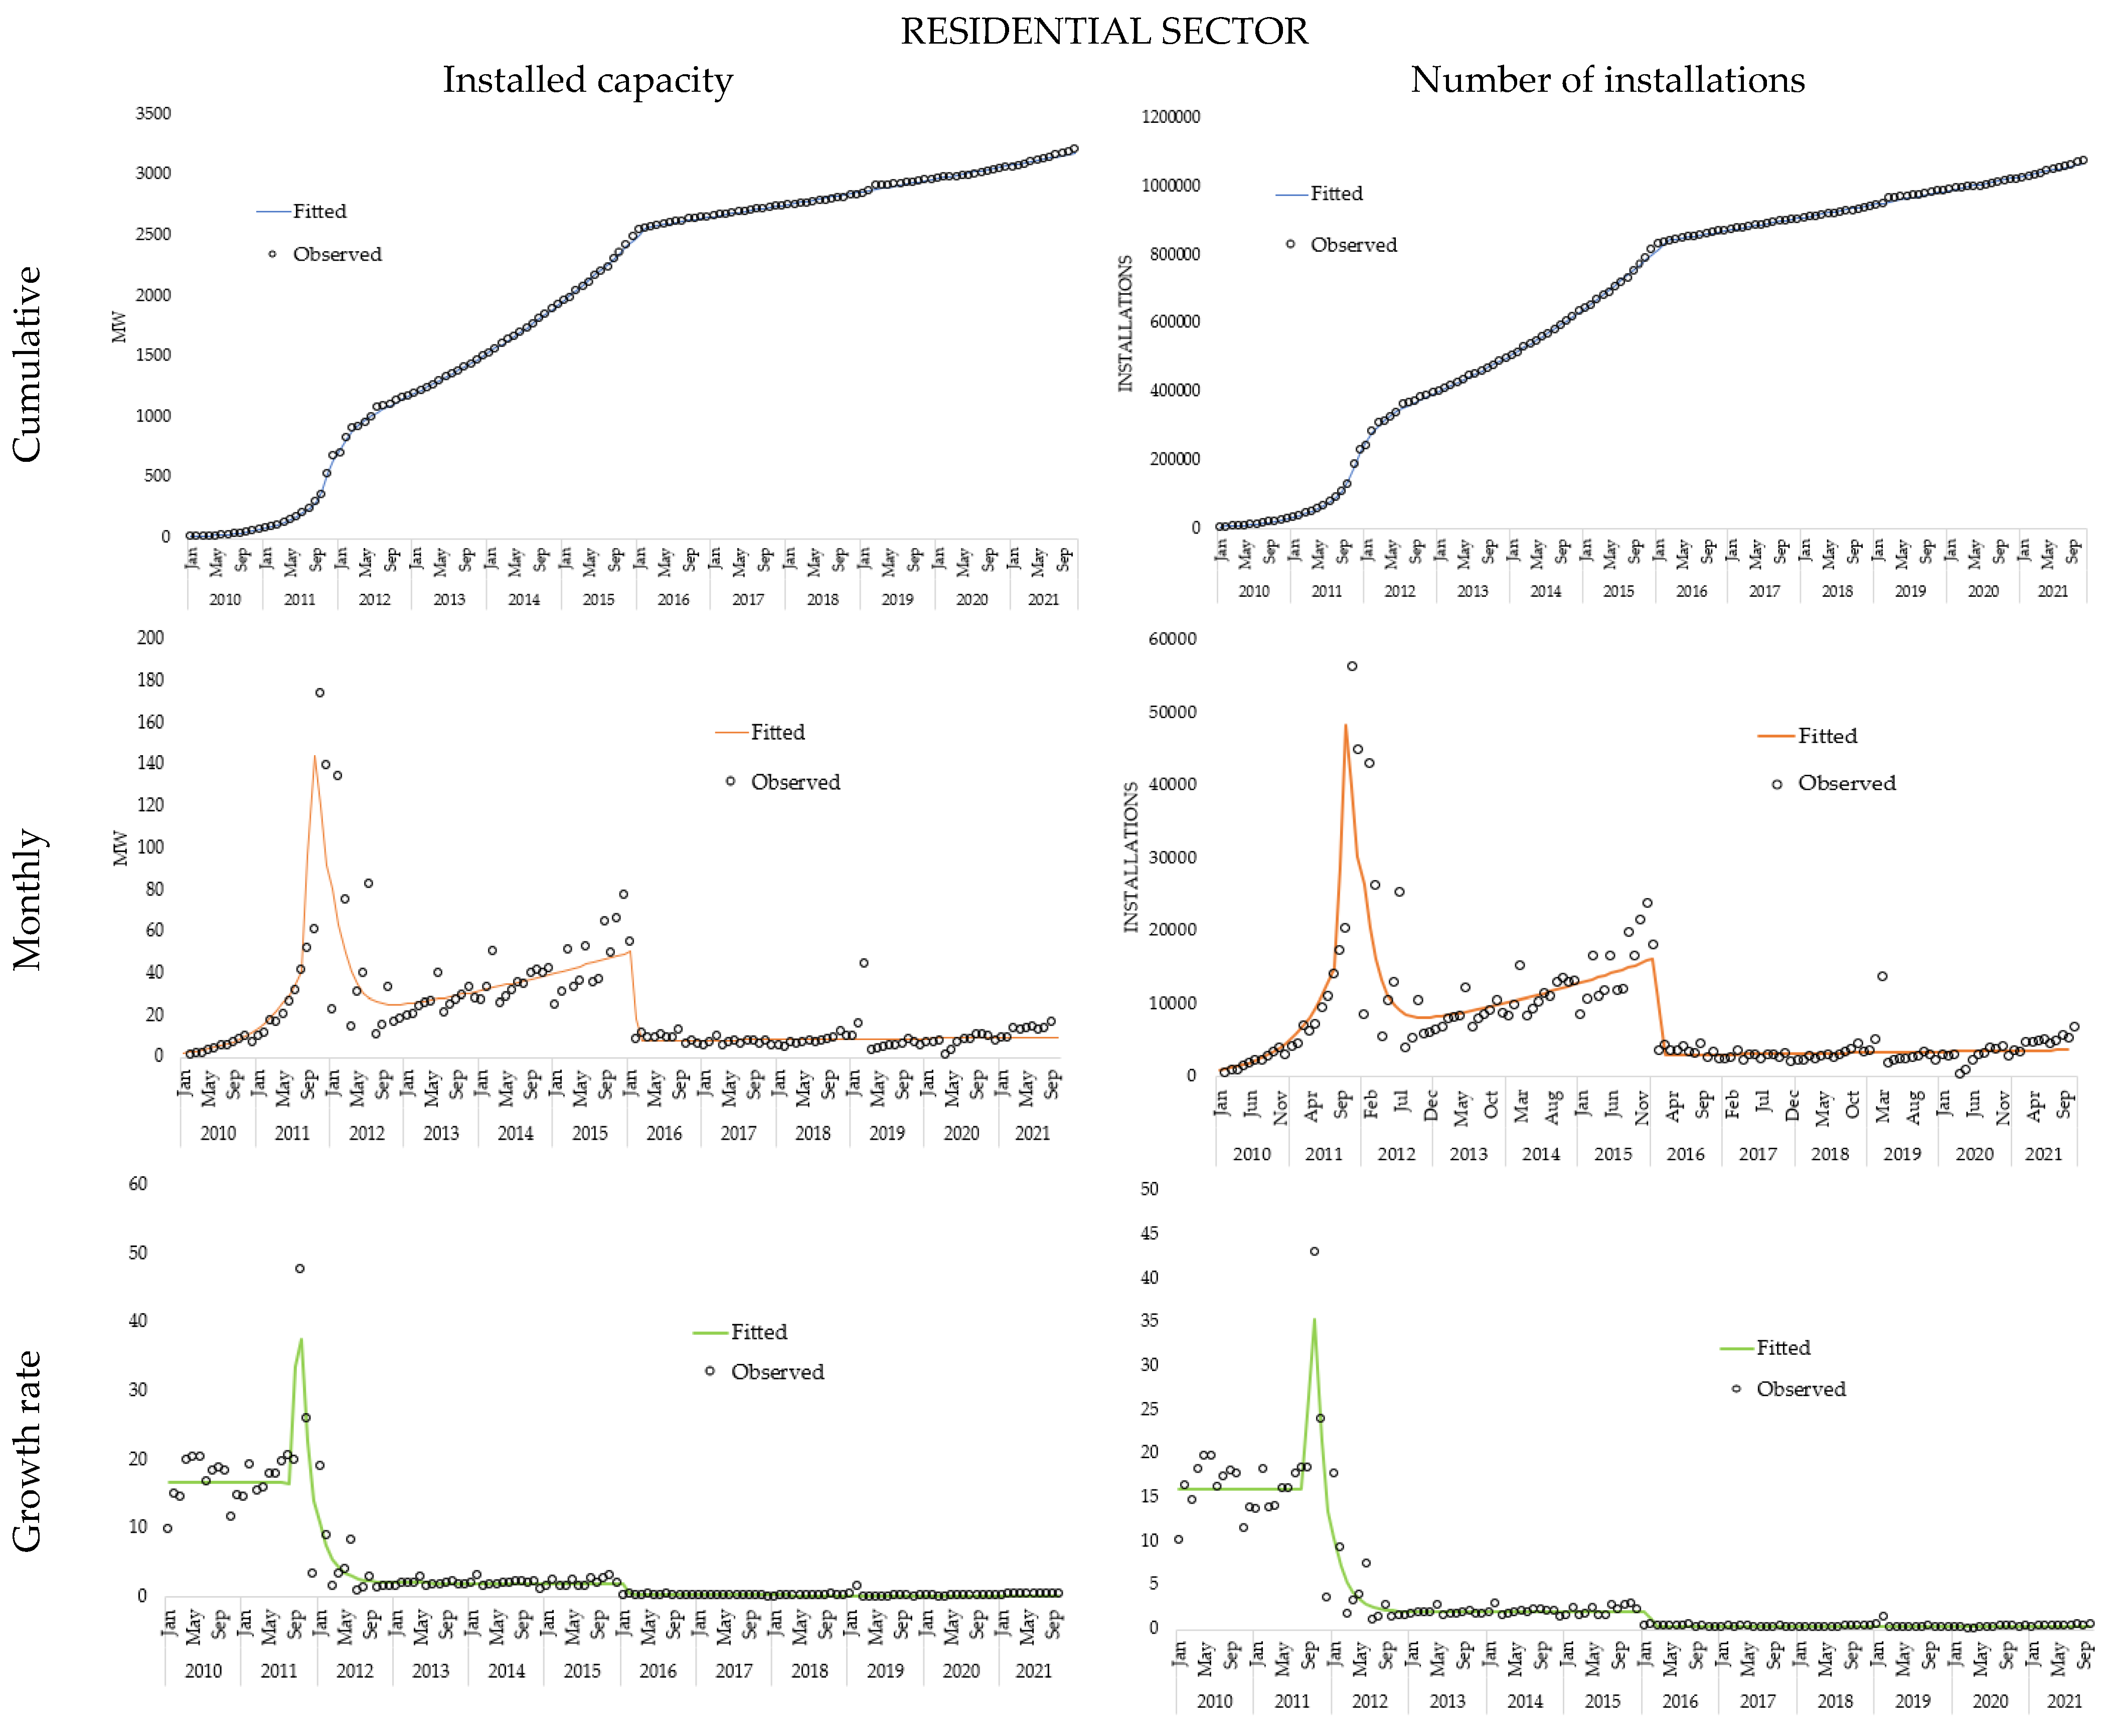
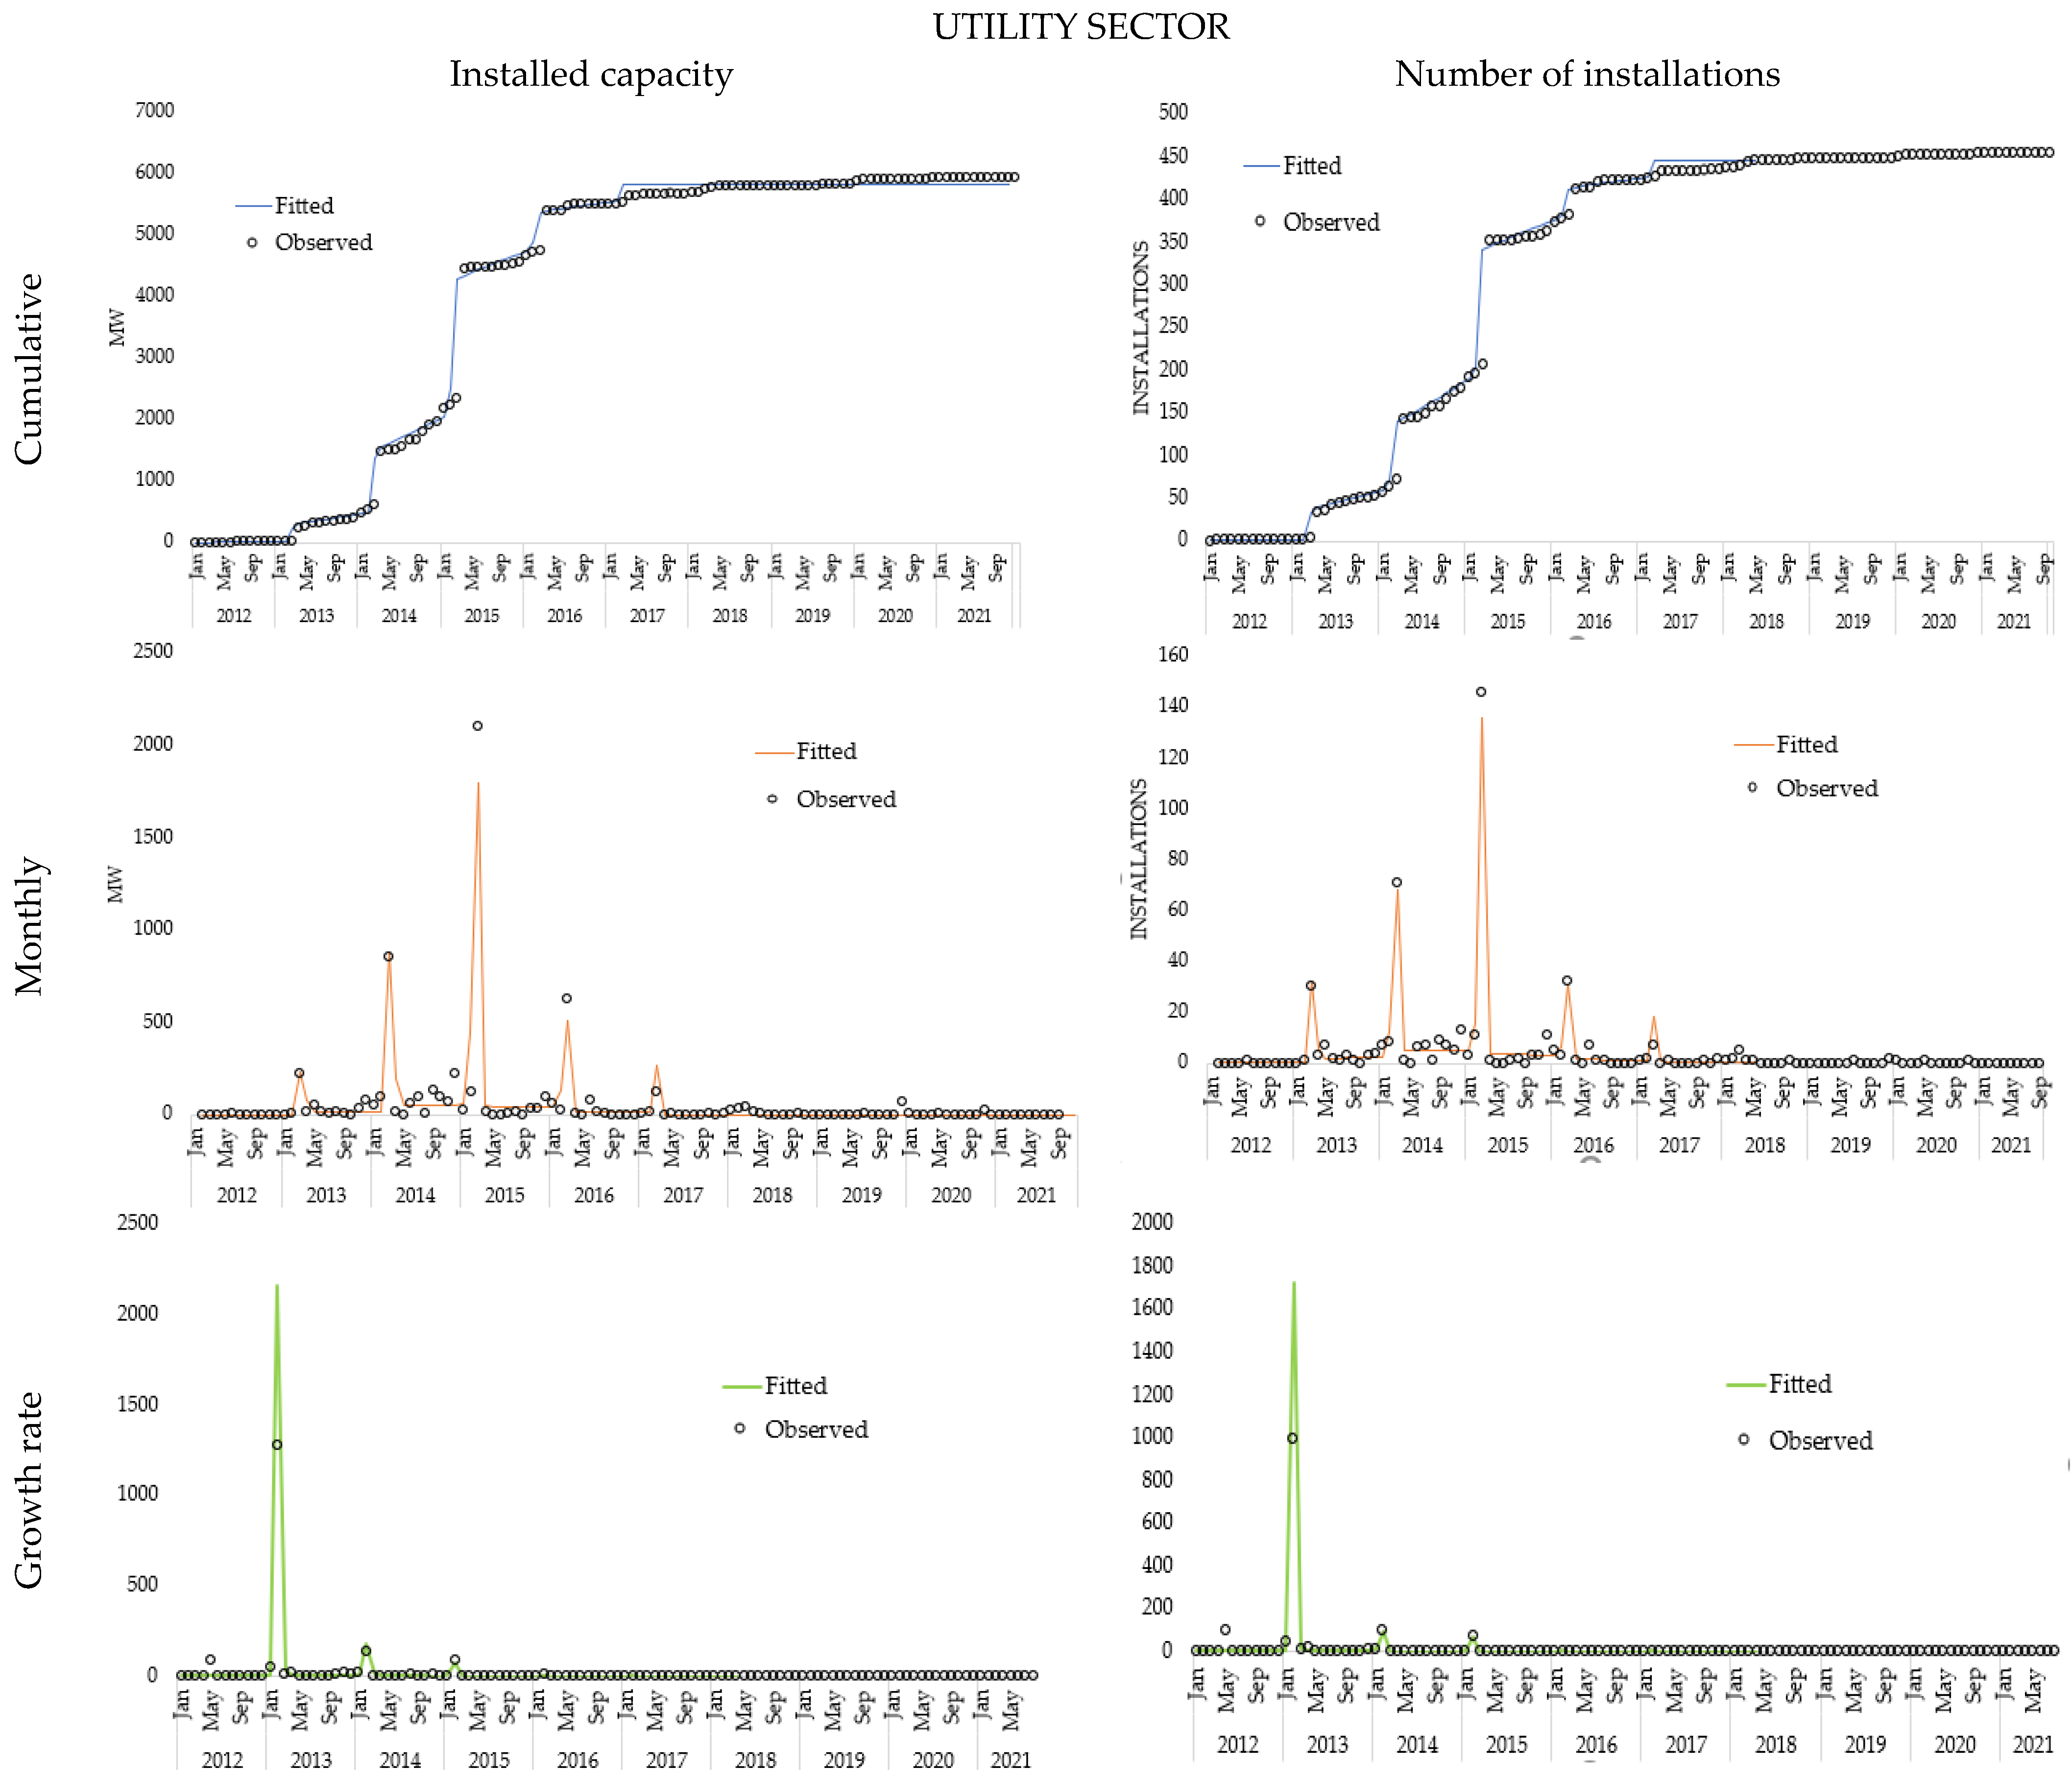
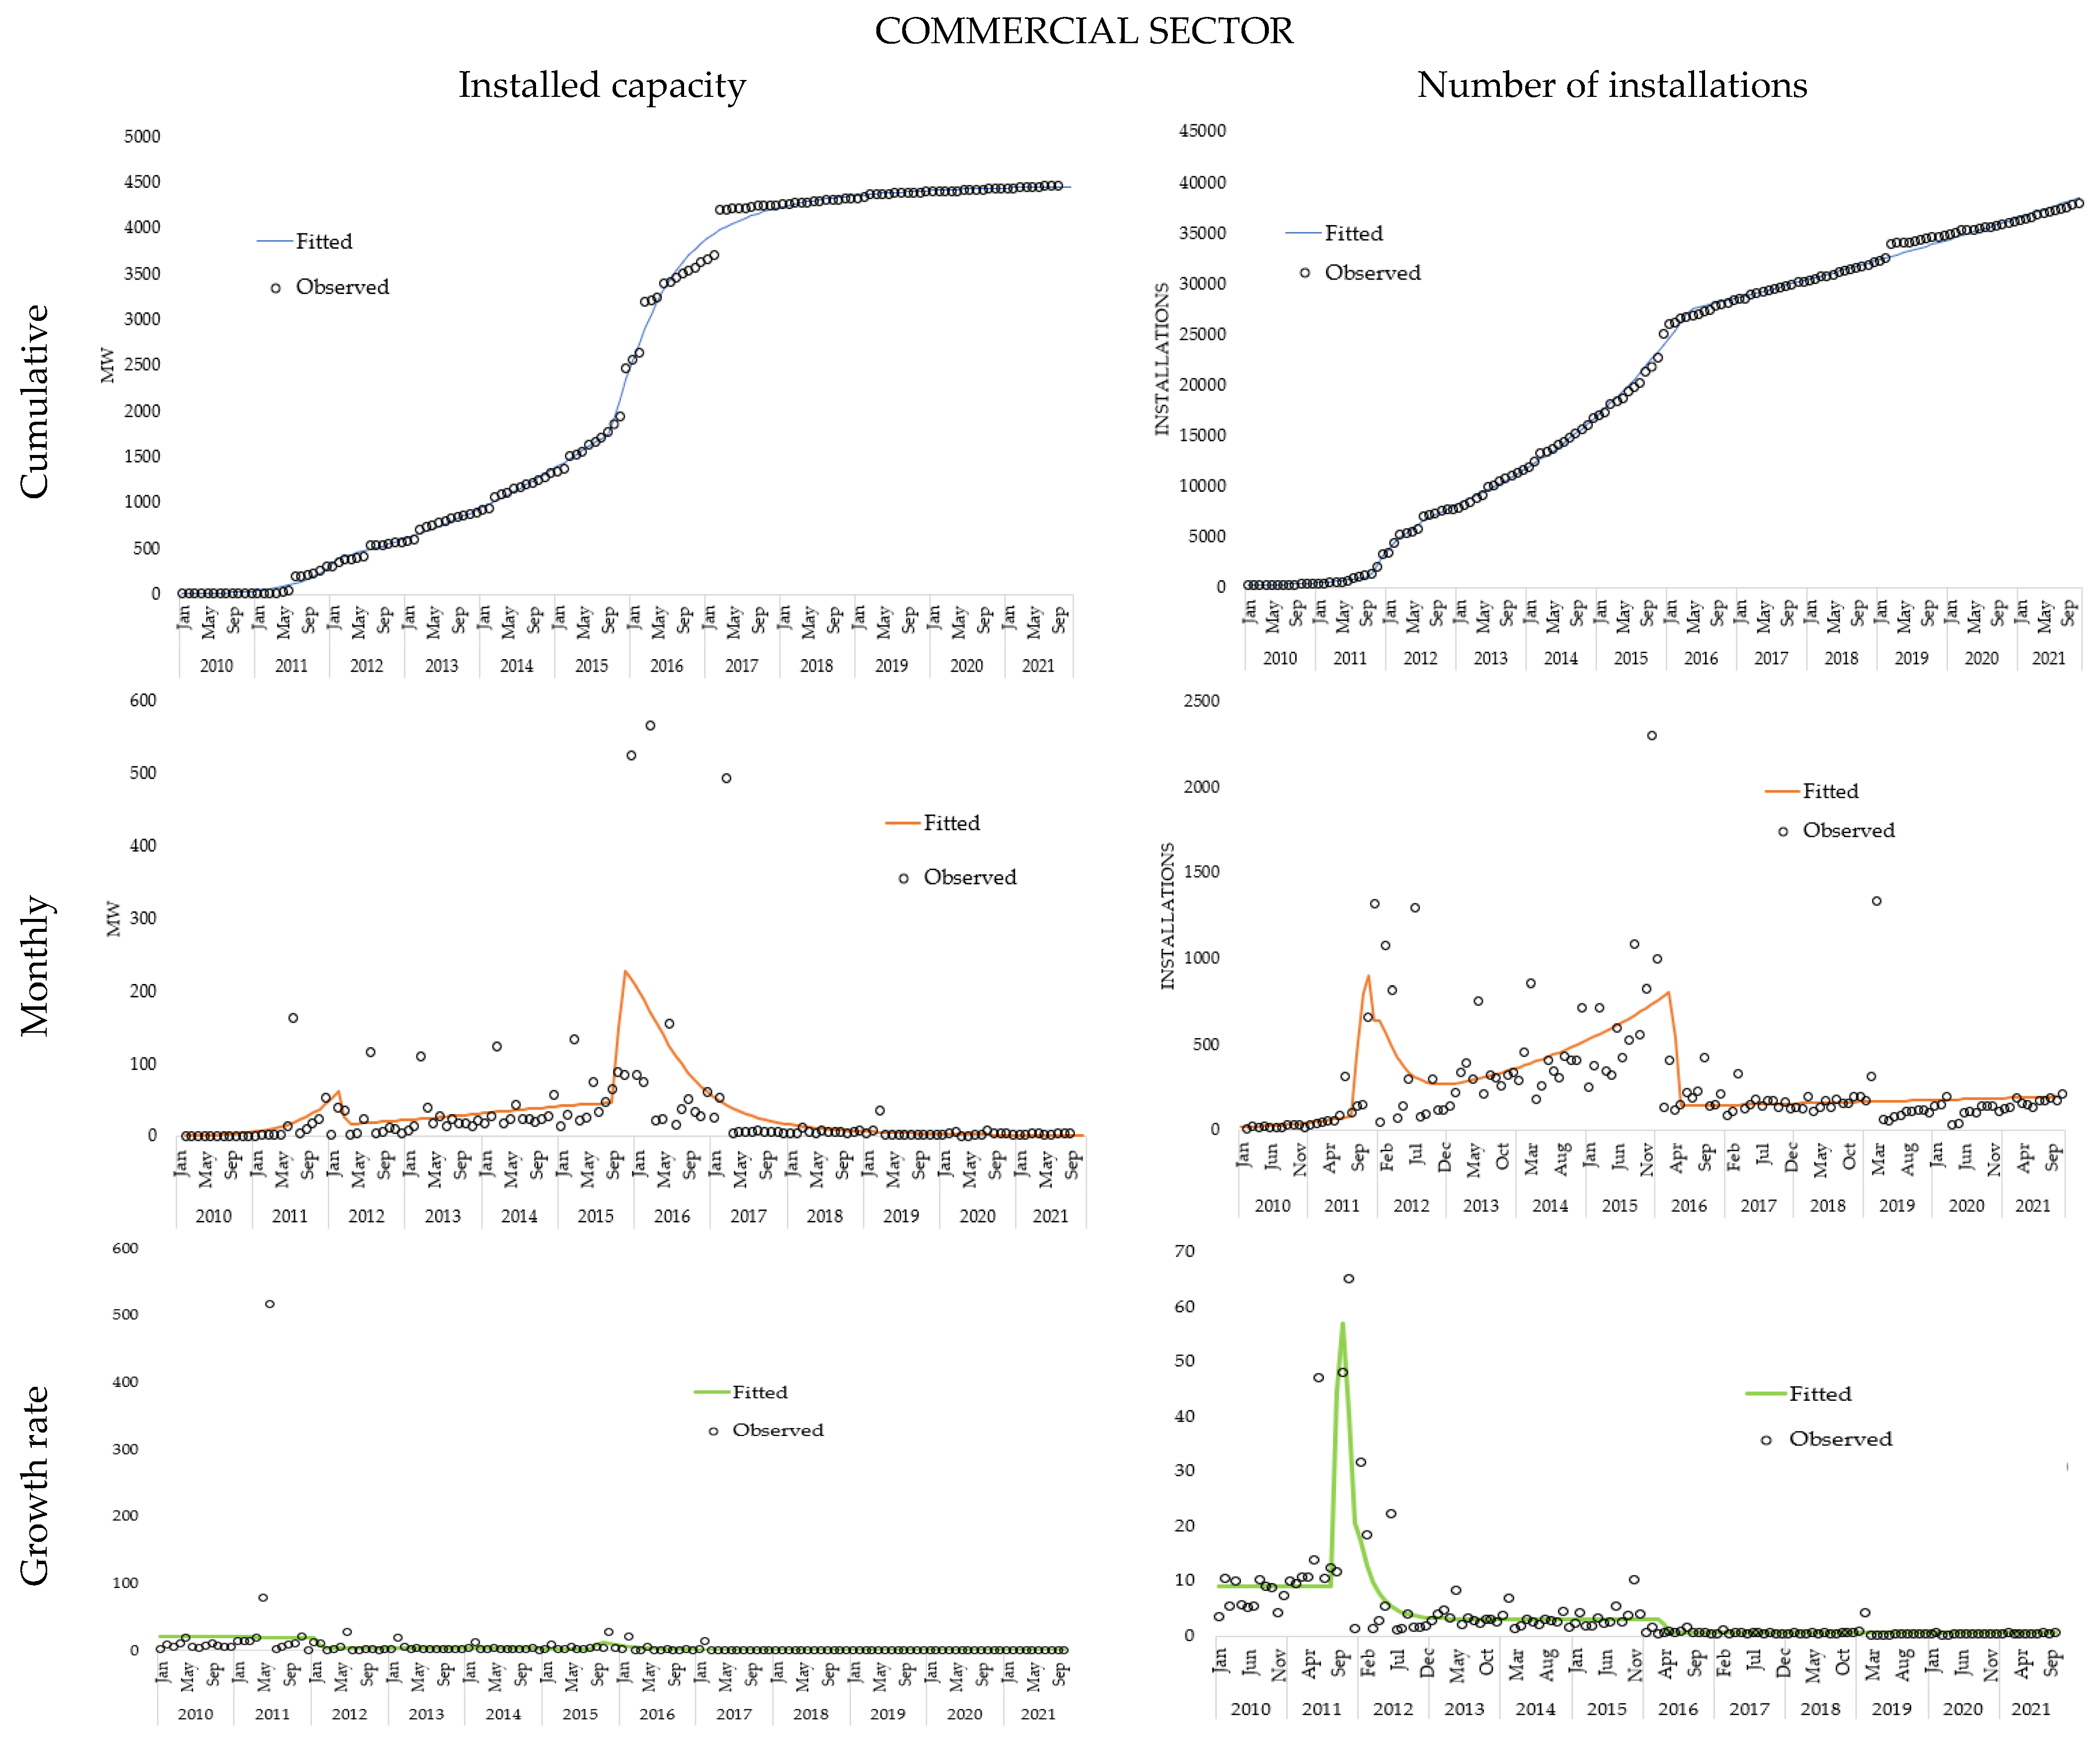
The present article uses the GBM to describe the heterogeneity in adoption behavior among different types of agents and on the related role played by the incentive measures provided by the UK government. To this end, we carried out separate nonlinear regressions with the GBM to the monthly time series of data on PV adoptions for each of the three sectors considered, namely residential, commercial, and utility. This allowed us to offer insights on how the UK government’s policies influenced the solar PV diffusion across these sectors in terms of persistence and intensity of the shocks emerging in the adoption trajectories. Additionally, we also highlighted the differences between these three categories in terms of the two main communication channels typical of Bass-type innovation diffusion models, i.e., the spontaneous communication among individuals (“word of mouth” or “imitation”) and the publicly available information supplied by the media. Moreover, as a by-product, we took advantage of the dual nature of the UK data, providing both the numbers of individual installations (which is the appropriate figure for diffusion models) and the installed capacity (which is the typically available figure), to discuss the appropriateness of installed capacity data.
Overall, our results indicate a general weakness of media support and a key role of incentives as the main drivers of the solar PV diffusion across sectors in the UK. Moreover, the imitation effect differs largely among the three sectors: while the residential market grows primarily because of public support, the commercial and utility sectors have an estimated imitation effect ten times larger. All in all, companies seem to make more rational decisions based on economic factors rather than being led by perceptions. Last, the results also highlight some nice regularities between the sectors analyzed, and situations where data by installed capacity and number of installations exhibit similar patterns, thus justifying the use of the former to predict the latter, at least in terms of trend.
The structure of the paper is as follows. Section 2 presents the data employed for our study and the methodology, based on the GBM and its reduced version, the Generalized Internal model (GIM). Section 3 presents an overview of the policies implemented in the UK for stimulating solar PV growth. Section 4 applies the GBM and GIM to the data concerning the three categories and discusses the results obtained. Section 5 is devoted to some discussion and Section 6 to general conclusions.

2. Data and Methodology

2.1. Data: Solar PV Adoption Data in UK

In this paper, we use monthly UK government data on cumulative installed capacity (Figure 1) and cumulative number of installations (Figure 2) from January 2010 to November 2021 [27]. Although the launch of solar PV took place in the early 1990s, the time span of our dataset is suitable for the purpose of our analysis as 2010 is the year in which the rapid diffusion of solar PV in the UK began. In fact, the technology grew from 26 MW of cumulative capacity in 2009 to almost 1 GW in 2011. The cumulative installed capacity in November 2021 was of 13.6 GW, while the number of installations was just above 1,116,000.
Based on previous classifications of the solar PV market [28,29,30], installations have been categorized by capacity size as follows: installations with fewer than 10 kW are attributed to the residential sector, installations between 10 kW and 5 MW are considered commercial sector, whereas installations above 5 MW are considered utility sector.
A first inspection of data, both in terms of cumulative installed capacity (Figure 1) and cumulative number of installations (Figure 2), reveals some interesting patterns.
On the one hand, the temporal trend of both installed capacity and number of installations appears consistent with the application of classical innovation diffusion models à la Bass [15], since an s-shaped pattern broadly emerges with evident saturation symptoms.
On the other hand, one may notice that this s-shaped pattern is not smooth, as is the case in many innovation diffusion processes, but rather shows “jumps”, suggesting the presence of shocks to the diffusion, which is investigated in more detail later.
Such jumps are especially visible in the utility sector, both in capacity and installation terms. Instead, the residential sector appears to follow a smoother profile. Nonetheless, a deeper glance at the residential trends suggests evidence a multiphasic adoption pattern, with three main phases of development. Finally, the commercial sector shows intermediate features. In relation to such types of patterns, the GBM represents an ideal tool to understand whether such patterns in the data are due to true external “structured” shocks affecting the market or to other factors, such as some form of seasonality.
Figure 2 suggests that the number of installations is essentially dominated by the residential sector (as evident from the adoption scales differing by orders of magnitude) and shows a nice regular pattern, which indicates the presence of a sequence of phases in the diffusion process.

2.2. Methodology: Generalized Bass Model

The Generalized Bass model, GBM [19], extends the Bass model, BM [15], by adding a multiplicative, time-dependent component, h t , in the hazard rate, yielding to:
y t = h t   α + q m y   m     y
where y t is the cumulative number of adoptions at time t , and y t is the variation in the number of adoptions per unit of time. Parameter α > 0 is the innovation rate governing adoptions by mediatic communication, while q > 0 is the imitation rate governing adoptions by individual communications through word-of-mouth, and m the market potential, representing the market saturation level.
The GBM reduces to the BM when h t = 1 . Moreover, the GBM may be usefully reduced to the Generalized Internal model, GIM, when parameter α is negligible [21].
Function h t is conveniently represented as h t = 1 + g t , where g represents the “shock” term. For g = 0 , at all times the GBM reduces to the BM, while the case g t     0   0 describes a positive (negative) shock. In applications, function g can be specified by appropriate parametric forms whose parameters can be estimated jointly with α ,   q ,   m . In [21], three types of shocks were used:
(i) A constant shock function (form 1, F 1 ) of intensity A over the time interval a , b :
g t = A   ·   I a , b t ,   0 < a < b ,   A     R
(ii) An exponential (either increasing or decreasing) shock function (form 2, F 2 ) suddenly arising at a point in time and then inflating or deflating at rate c :
g t = A   · e c t a         ·   I a , t ,   0 < a ,   A     R ,   c     R
(iii) An initially growing and then decaying shock function (form 3, F 3 )
g t = A   · t a e c t a         ·   I a , t ,   0 < a ,   A     R ,   c     R
where I a , b   t represents the indicator function of the time interval a , b . Inclusion of multiple shocks over different time periods is technically straightforward by using different shock functions h i t , one for each relevant interval of time [20,21].

2.3. Methodology: Estimation of Model Parameters

Besides the communication parameters ( α , q ) and the market potential ( m ), the number of further unknown parameters included in the GBM depends on the number of shock terms h i t considered. Including k shock functions of any of the above specified forms (2), (3) and (4) brings 3 k additional parameters.
The unknown model parameters were estimated by fitting the GBM to the UK monthly time series of sector-specific PV adoption data by both number of installations and installed capacity (Section 2.1). Estimates were computed by nonlinear least squares (NLS) [31].
As the estimation of the market potential m may raise bias issues [32] due to the brevity of the time series and the fact that the solar PV markets mainly develop due to public incentives [21], in most our fitting analyses, the market potential was assigned externally.

3. Solar PV Policies in the UK

Before presenting the results of our analyses, we provide an overview of the policies implemented in the UK to enhance PV adoption. As is made clear later, these policy measures have played an evident and significant role.
Research has agreed that the development of the solar PV market in the UK has needed substantial and stable adoption incentives to overcome the barriers to technology diffusion, reduce the high costs of the investment, and relax financial constraints [23,33]. The first incentives supporting the solar PV market in the UK were R&D investments (see Appendix A, Figure A1), projects, demonstration, and field programs. Among the numerous programs, the most successful in preparing the ground for the diffusion of PV was the Low Carbon Building Program (LCBP) in act from 2006 to 2010 [34]. The program, aimed at households, community organizations, schools and public sector, emphasized the relationship between microgeneration RES technology efficiency and low-carbon buildings in order to increase technology awareness among the possible adopters, an issue of crucial importance in the early stages of adoption [28,35].
However, although British households valued renewable energies significantly, a market development policy based only on these types of incentives proved insufficient to reduce financial barriers due to the substantially higher costs compared with households’ willingness to pay [33,34].
A previous incentive was established from 1990 under the “Non-Fossil Fuel Obligation” (NFFO) and replaced by the “Renewable Obligation Certificates” (ROC) in 2002 [20]. This type of policy aimed at encouraging firms and suppliers to invest in systems larger than 50 kW to produce “clean” electricity above a yearly pre-established minimum target in terms of share in total electricity. Studies that focused on this stage of the solar PV diffusion highlighted that the NFFO had a minor impact on this technology, forecasting a consistent reduction in subsequent years in the absence of further government measures [20].
The ROC obligation share increased from 3% in 2002 to 46.8% in 2019 at a slower pace of 1% per year until 2012 and of 5% per year thereafter (see Appendix A, Table A1). The obligation period starts from 1 April until 31 March of the following year [36].
Despite the ROC being in act since 2002, the neutrality of the scheme in the first decade, i.e., without distinguishing between the various types of RES, led only to the adoption of the most productive technologies [37].
In this sense, the diffusion of solar technology in the UK has been hindered by a predatory–prey relationship with wind technology. Indeed, the UK is considered one of the best locations for wind power worldwide, which contributes to this predatory role of wind towards solar PV [38]. Consequently, the RES market did not develop as expected and put at risk the achievement of the long-term carbon emissions reduction targets [39]. This forced the UK government to revise its policy in 2012, focusing on those technologies that mostly needed the support of incentives to develop, including solar PV [40].
The ROC scheme for new solar PV systems larger than 5 MW lasted until 1 April 2015, while for new smaller systems until April 2016 [41]. Thereafter, the ROC was gradually replaced by Contracts for Difference (CfD) starting from 2013 to 2017 (Energy Act, 2013 [36]). The CfD is a system of reverse auctions aiming at creating certainty among the RES market investors through fixed electricity prices [42]. However, the government considered the solar PV an already developed technology and excluded it from the auctions [43].
The UK government also provided production-related incentives by a FIT, based on the payment of a pre-established tariff for the electricity generated by an implant until the plant warranty expires, say after 20–25 years. The incentive is directed only to plants smaller than 5 MW for three levels of the tariffs (high, medium, and low) based on the commissioned date and overall number of installations [44]. The high values are presented in Figure A2 in Appendix A.
There were two dramatic reductions in the FIT level, at the beginning of 2012 and in January 2016, due to the excessive number of installations compared with the government expectations and to the technology’s decreasing price. Indeed, the module price for the systems under 4 kW decreased from GBP 15,000 in 2010 to GBP 6000 in 2016 [45]. The FIT phased out to new applicants on 1 April 2019 [46].
Last, the UK government also set a target to adopt 20 GW of solar PV by 2020 [47]. The goal aimed at reducing carbon emissions by 35% in 2020 and to further achieve an 80% reduction by 2050 compared with the 1990 baseline [48]. As highlighted in Section 2.1, by November 2021 only 13.6 GW (13.4 GW by December 2020) of solar PV has been installed in the UK, thus the target for 2020 was not achieved.

4. Results

As a preliminary reminder, the first period in the history of PV adoption in the UK, between 1992 and 2010, was characterized by a regime of low-intensity incentives (LCBP), yielding a rather constant growth rate and few cumulative adoptions until 2010 (only 26 MW by 5736 systems). A summary on this period, based on the analysis by [21] using only yearly aggregated capacity data and not distinguishing by sector, is reported in the Appendix A (Table A3).
Therefore, the present sectoral analysis for the 2010–2021 data focuses on the most active incentivization phase for the PV market. We highlight that the utility sector started its growth in 2012 with the reduction in PV technology prices and increased considerably up to a 56% share at the beginning of 2015. The PV market became more stable from 2017 to 2021 with, respectively, 22%, 33%, and 45% shares of the residential, commercial, and utility sectors in total installed capacity (Figure A3).
A preliminary analysis based on the BM revealed the lack of significance of the coefficient of innovation α in all sectors (Table A2), confirming that the UK solar PV market developed in absence of relevant continued public support. This is consistent with the results of [20,21]. Based on this evidence, subsequent analyses used the GIM instead of the GBM in all sectors, for both installed capacity and number of installations. For the estimation of the best model, at least two different shocks were needed to predict the solar PV curves, with significant variations among sectors. The results, reported in Table 1 and Figure 3, Figure 4 and Figure 5, are discussed by sector.

4.1. Residential Sector

The residential time series by installations increased from 5500 systems (January 2010) to 1,080,000 systems by November 2021. For this sector, the adoption patterns of installed capacity and number of installations are very similar and appear almost entirely incentive driven in a background of very poor self-sustaining abilities. Indeed, this sector shows a substantial weakness of imitation ( q = 0.003 / m o n t h and q = 0.004 / m o n t h for installed capacity and number of installations, respectively), which does not exceed the level of 5% per year.
Focusing on the installed capacity series, the resulting best model of the residential sector presents three shocks (Table 1). First, the dramatic increase in the growth rate during 2010–2011 (around 18%, i.e., 200% per year) compared with the previous period (about 30%), which possibly followed the launch of the FIT incentive in April 2010, is explained by a constant shock ( F 1 ), starting at the beginning of the series, which lasted about 2 years (Figure 3).
A second shock of F 2 -type started in November 2011, lasting two months ( 1 / c 2 = 2.2 ) but with high intensity ( A 2 = 154 ). This shock was probably caused by the government’s announcement during October 2011 of an incoming FIT cut by February 2012 [49]. Therefore, the dramatic short-term increase in the monthly growth rate (up to 50%) was the possible consequence of a “race” to install solar PV at a high value of FIT while taking advantage of the reduction in the installation cost. Following the drastic cuts by August 2012, the monthly growth rate declined to very low levels of 2–3%. In other words, the positive effect of the reduction in the cost was clearly secondary compared with the negative effect of the announcement of the FIT reduction.
Finally, a third ( F 1 ) long-lasting shock was estimated for the period between August 2012 and December 2015, bringing continued slow growth. Note that the monthly adoptions as well as the growth-rate curve suggests, besides evidence of pulses (occurring once a year), that such a long shock is rather the outcome of a sequence of four yearly shocks until December 2015. A possible explanation of the annual phases of growth might reflect the presence of small groups of adopters who had already decided to adopt but feared the possibility of a further FIT reduction. The model does not include the instantaneous shock that appears at the beginning of 2019 in line with the end of the FIT policy.
Last, from January 2016 until the end of the observed period, the growth rate fell to negligible levels (<0.3%) despite the presence of incentive (FIT still around 5 p/kWh compared with 45 p/kWh at the beginning).
As for the model selected for the number of residential installations, it may be easily noted from the estimated parameters that there is an almost perfect correspondence with the results for capacity data. This is not surprising given that the observed data have an almost overlapping trend (only differing by a scale factor). This is the consequence of the rather moderate variation in the average plant size, suggesting that, for this sector, installed capacity data are an excellent surrogate of individual installations data, which, in principle, best reflect the adoption process when the latter are unavailable.

4.2. Utility Sector

The solar PV diffusion among the utility sector started later than the other sectors, with the first system of 6 MW installed in January 2012. The absence of installations prior to 2012 is mostly explained by the high installation cost, making the utility-scale installations unprofitable [34,50], along with the revision of the ROC scheme which brought the share to 15.8% (+3.4 p.p. compared with 2011) and increased the buy-out price to 0.64 GBX/kWh (Table A1). Instead, in 2012, a substantial drop in PV technology price was registered [51].
Even at a first sight, the history of PV adoption in the utility sector (Figure 4, right column) is completely dominated by a few outliers in the form of massive “point adoption pulses” (i.e., lasting a single month), followed by a slow growth. This applies to both capacity and installations data. Reproducing such a pulsing behavior by the GIM model required 6 ( F 1 ) shocks for installed capacity (with 5 different intensity values) and 5 ( F 1 ) shocks for the number of installations, with 4 different intensities. These shocks emerged at the beginning of each year from 2012 up to 2017 for installations and up to 2019 for the installed capacity intensities (Figure 4). The resulting staircase shape of the cumulative growth of the utility sector might be explained by the proximity of the ROC’s deadline on 31 March of each year [52], suggesting that many electricity suppliers postponed their installations until just before the deadline. After 2019, the utility sector substantially saturated.
Going into details, the exceptional growth rate registered in March 2013 (980%, surely due to the low level of the market at that stage) was possibly forced by the fact that the buy-out price from the 2012–2013 obligation period increased by 0.16 p/kWh, an increase of 33% compared with the previous period (Table A1). The peak in monthly adoptions (March 2014, with 147 installations counting for more than 2 GW) can be explained by the fact that in this period the buy-out price grew substantially (by 36%). The worrying absence of adoptions after 2018 is also to be remarked: only two or three systems per year and none in 2021. This suggests that the end of the ROC scheme, along with the government’s decision to block solar PV from the CfDs [53], brought the market to a full stall. Last, the imitation effect in the utility sector is above 4.1%/month, much higher compared with the residential sector, q = 0.003 (0.3%/month).

4.3. Commercial Sector

Considering the installed capacity, the trend of the commercial sector (Figure 5) appears to show mixed characteristics between the residential and utility sectors. This can be explained by the fact that this sector benefits from both FIT and ROC (>50 kW) incentives. On the contrary, in the case of the number of installations, a pattern more comparable to the residential sector can be observed, as systems with capacity between 10 and 50 kW eligible only for FIT counted on average for approximately 90% of the commercial installations. In fact, the modelled pattern of the number of installations for the commercial sector is identical in shape with the residential one: a three-shock model ( F 1 + F 2 + F 1 ) with an initial constant shock lasting two years during the first stage of the FIT scheme followed by an exponential one ( F 2 ) initiated in November 2011, highly intense ( A 2 = 104 ) and lasting about three months on average ( 1 / c = 3.3 ). As it was the case of residentials, the second shock should be attributable to the announced FIT cut. Like the residential sector, we estimated a constant long-lasting shock ( F 1 ) in the period between August 2012 and December 2015. Finally, the imitation rate is also extremely low (0.5% monthly and 6% yearly), as in the case of the residentials.
Quite differently, the best model for the capacity data was a two-shock model ( F 1 + F 2 ), with an initial constant shock (two-year lasting) that is still present during the first stage of the FIT scheme. The second shock is a long-lasting ( 1 / c = 10 ) exponential one (F2) with low intensity ( A 2 = 4 ) that covered various smaller shocks over the period 2015–2017: in December 2015 before another drop in the FIT value and again in March before the 2016 and 2017 ROC deadlines. After 2017 and until November 2021, only one shock occurred with the March 2019 ROC deadline, although it was not estimated.
In more detail, the analysis of the installed capacity pattern shows the highest growth rate (around 500%) in July 2011 after the announcement of the dramatic drop in FIT value for standalone panels from August 2011. On average, the growth rate attributable to the ROC deadline lies around 13%. Similar spikes can also be observed considering the number of installations, again consistent with the dramatic changes in FIT and ROC deadlines, with the difference that the latter registered lower growth-rate spikes.
The low levels of medium–large commercial installations prior to 2012 might be explained by the low FIT values for medium–large systems [20]. This emphasizes the fact that both FIT and ROC schemes have significantly impacted the commercial sector over the years. In fact, the staircase pattern also observed for commercial adopters, although smoother than in the utility sector, is consistent with both FIT reduction announcements and ROC deadlines. Another similarity with the utility sector is the high value of the imitation rate, above 4.4%/month (52%/year).
Last, the difference between the shape of the number of installations and the installed capacity patterns for this sector deserves specific attention. This may likely be attributable to its large heterogeneity, which possibly ranges from small enterprises up to big companies, thereby yielding a dramatic heterogeneity in the adopted plants’ size. Therefore, the possibility to use the capacity trend to predict that of the number of installations appears quite limited as far as we consider such a coarsely grained level of analysis for commercial enterprises. Clearly, refining the analysis by further disaggregating the commercial class into subgroups based on more homogenous classes by plants’ size would show more homogeneous temporal trends. In the Appendix A, we report some supplementary analyses targeting small-sized commercial units (Figure A4 and Table A4). It is to be noted, however, that this would introduce several complications (e.g., the need to possibly account for different patterns of communication in the different subgroups of the sector) which would call for further and more detailed explanations.

5. Discussion

The application of the GIM to the three categories considered to study the UK solar PV adoption data confirms some key points already described in the literature [20,21,23]. The analysis proposed in our work supports those previous findings by showing (i) the fragile role of the media support to the uptake of solar PV, which is reflected in the systematically negligible—and nonsignificant—estimates of the innovation coefficient in the GBM, (ii) the ability of the resulting GIM to capture in a precise and meaningful way both the general trends of adoptions as well as the magnitude and duration of the effects induced by external perturbations, i.e., ad hoc incentives, and (iii) the dramatic dependence of the adoption process of solar PV from public incentives. Indeed, the application of the GIM to observed data showed that the trend of installations has been especially reactive to the changes in incentive schemes in all sectors considered; the increase in FIT has always resulted in a peak of installations, while their reduction has led to a parallel reduction in PV adoptions. The peculiar nature of these data was observed in [24], highlighting the unsuitability of both neoclassical economic models and simple s-curves, such as the logistic or the Bass model, and therefore the need for models able to describe the highly perturbed structure of data.
More generally, this paper offered a broader perspective on modelling the adoption process of solar PV, as made possible by the highly disaggregated dataset available for the UK, compared with past similar works [20,21]. This allowed to distinguish between type of data—capacity vs. installations—and between categories of adoption—residential, commercial, and utility. This more granular analysis stimulated several further interesting insights. First, the use of sector-specific disaggregated data revealed, despite a common dependency on incentives, highly different adoption patterns between sectors, likely due to different economic attitudes and reactivity to incentives as well as to the different types of incentives applied to the three different sectors. Second, the possibility to study separately both the installed capacity and the number of installations data for the different sectors suggested that the former, which are those most typically employed on renewable energy studies, may be used as a good and reliable representation of the true adoption process (embedded in the latter). This resulted to be especially true in the case of the residential and utility sectors. The fact that the same consideration did not hold for the commercial sector is clearly attributable to the high heterogeneity of this category which includes plants having a size ranging from 10 kw—possibly typical of a very small firm—up to 50 MW, surely reflecting a large-scale company.
The conclusions reached in this paper are broadly consistent with those proposed in [26], where the effects of FIT changes on PV penetration were studied with a system dynamics approach embedding, among others, a Bass diffusion model. Through simulations, the authors of [26] found that a cut in incentives would cause a decrease in PV installations and reduced benefits for solar companies; on the other hand, their analysis indicated that the reduction could sustain the growth of other energy-related technologies, such as PV-battery systems. This not obvious side effect could justify the decision to reduce FIT in the longer term. From a methodological point of view, the consistency of results obtained through different—but related—approaches, namely innovation diffusion models and system dynamics, suggests their combination for future studies, thanks to their joint ability of estimating systematic changes in observed adoption trajectories due to policy decisions and simulating “what-if” scenarios based on alternative policies.
As a last point, it is worth observing that our analysis is more descriptive than predictive, since no forecasting procedure has been proposed. However, all the data considered clearly show a flat behavior of adoptions in recent years, with a worrying market stall. In view of this pattern, we preferred to use all the information, until 2021, for estimation purposes only, while a useful forecasting exercise could be made if the market for solar PV shows some recovery soon.

6. Conclusions

In this work, innovation diffusion models (GBM and GIM) were used to characterize the temporal trends of the adoption process of solar PV energy in the UK over the period 2010–2021 for three main adopters’ categories, namely households, private enterprises, and public companies and for two types of data, i.e., number of installations and installed capacity. By exploiting the ability of the GBM and GIM to describe diffusion trajectories subjected to structured perturbations, as it might be the case of incentivizing interventions, the effects of the UK incentives on adoptions by those categories is studied by analyzing the timing, intensity, and persistence of the perturbations of adoption curves.
The results confirm previous findings on PV adoption, including the generalized lack of a persistent media support to solar PV, the ability of the GIM to capture both the general trend of adoptions, as well as the possible effects induced by ad hoc incentives and the dramatic dependence of the adoption process of solar PV from public incentives. In addition, we highlighted both regularities as well as the differences in sector-specific adoption patterns. Availability of data for both number of installations and installed capacity allowed a model-based comparison showing that the latter data (usually more easily available than the former) may be broadly representative of true adoption data, especially when disaggregated data by category are available.
As for the strengths of this work, the high degree of granularity of the UK data gave the opportunity to perform much more detailed modelling analyses of the temporal trends of PV diffusion compared with past studies (e.g., [20,21]) that had to rely solely on the highly aggregated data published at the international level on a yearly basis only. On the one hand, the availability of data on a monthly time scale allowed a finer characterization of the temporal patterns of the shocks in adoption trajectories induced by the strengthening/lifting of the incentive measures. On the other hand, the availability of sector-specific data permitted to characterize the diffusion of strongly different categories of adopters, likely responding in a different manner to policy interventions.
The present approach suffers the typical limitations of innovation diffusion models. It is indirect because it proceeds by identifying the shocks in the adoption trajectories to provide a post-hoc confirmation of the effectiveness of policy interventions. Integration with direct policy data (as reported in Section 3) would allow to complement the present approach by including the planned intensity of interventions. Moreover, the proposed approach focusing on separate analyses of sector specific trajectories ignores both between sectors’ interaction as well as other external interactions, such as, e.g., the unavoidable competition with other energy sources. Broader approaches, such as diffusion models in competitive settings [2,54] as well as the system dynamics approach used in [26], would allow to include some of these complexities. Overall, the general lesson that can be learned from the present modelling effort is the need for high-quality, open, and highly disaggregated data in the energy context, in order to provide a better understanding of RES adoption dynamics and of the effects of related public interventions. This is a precondition for designing better targeted policies aiming to stimulate the market. Though this paper focused on the UK case, an extension to other countries appears straightforward and would be useful to capture some key common factors across countries in PV adoption, while controlling for the effect of national specificities, such as climatic, technological, and institutional aspects. Of course, a replication of this study to other countries would need sector-specific data, as in the UK.
Therefore, making such types of high-quality and granular data rapidly open in all countries worldwide is an urgent need. This appears even more crucial in the current era, after two years of a deadly pandemic and with a war going on at the heart of Europe, where the pervasive threat of global climate change requires a rapid energy transition; science needs the best data to inform energy policies.

Author Contributions

A.M.B.: Conceptualization, software, methodology, investigation, data curation, writing, visualization. M.G.: Conceptualization, methodology, writing, visualization. P.M.: Conceptualization, methodology, investigation, writing, supervision. P.D.P.: Conceptualization, validation, writing, supervision. All authors have read and agreed to the published version of the manuscript.

Funding

This research received no external funding.

Institutional Review Board Statement

Not applicable.

Informed Consent Statement

Not applicable.

Data Availability Statement

The data used in this work are publicly available at: https://www.gov.uk/government/statistics/solar-photovoltaics-deployment (accessed on 26 February 2022).

Conflicts of Interest

The authors declare no conflict of interest.

Abbreviations

PVphotovoltaic
RESrenewable energy sources
IEAInternational Energy Agency
UKUnited Kingdom
GBMGeneralized Bass model
GIMGeneralized Internal model
GWGiga Watt
MWMega Watt
KWKilo Watt
BMBass model
NLSNonlinear Least Squares
LCBPLow Carbon Building Program
NFFONon-Fossil Fuel Obligation
ROCRenewable Obligation Certificates
CfDContracts for Difference
FITFeed-in tariff

Appendix A

Figure A1. Annual RD&D investments for solar power in million GBP (nominal) from 1974 to 2016. Data from IEA Online Data Service.
Forecasting 04 00026 g0a1
Table A1. Renewable Obligation Certificate (ROC) shares, buy-out prices, effective price per unit, and supply growth rate (in p.p) over the years (2002–2022). Data source: Ofgem [52].
Obligation Period (from 1 April to 31 March)Supply (%)Supply Growth Rate (p.p.)Buy Out Price (£/MWh)Effective Price per Unit (p/kWh)
2002–20033 £30.000.09
2003–20044.31.3£30.510.13
2004–20054.90.6£31.390.15
2005–20065.50.6£32.330.18
2006–20076.71.2£33.240.22
2007–20087.91.2£34.300.29
2008–20099.11.2£35.760.33
2009–20109.70.6£37.190.36
2010–201111.11.4£36.990.41
2011–201212.41.3£38.690.48
2012–201315.83.4£40.710.64
2013–201420.64.8£42.020.87
2014–201524.43.8£43.301.06
2015–2016294.6£44.331.29
2016–201734.85.8£44.771.56
2017–201840.96.1£45.581.86
2018–201946.85.9£47.22-
2019–202048.41.6£48.78-
2020–202147.1−1.3£50.05-
2021–202249.22.1£50.80-
Table A2. Standard Bass model estimates ( α ,   q ,   m ) by sector for installed capacity and number of installations.
Installed CapacityNumber of Installations
SectorRCUAggRCUAgg
α0.00610.00040.00050.00050.00660.00260.00100.0065
q0.040.080.160.080.030.050.140.03
m30914540581613,4561,043,26037,0374481,081,618
Figure A2. Standard Solar FIT values (high rate) by capacity range in kW from April 2010 to March 2019. Source: Ofgem—UK Government Statistics [44]. NB: FIT payment rates for solar photovoltaic installations determined by the Gas and Electricity Markets Authority (Ofgem) under Article 13 of the Feed-in Tariffs Order 2012.
Forecasting 04 00026 g0a2
Table A3. The GIM fit in the UK considered under the minimum target: summary information [21].
First ShockSecond Shock
CountrySelected ModelQ and Time to the 99th Percentile of the Minimum TargetYear of Achievement of the Minimum TargetPeakC1A1A1C2A2A2
GBRF3 + F30.31 (2044)2029Yes1.7517.2833.062.5321.4323.18
Figure A3. Monthly share in total cumulative installed capacity by sector: residential (green), commercial (orange), and Utility (purple) from January 2010 to November 2021. Own calculation based on data from [27].
Forecasting 04 00026 g0a3
Figure A4. Observed vs. fitted (by the best GIM model) PV monthly adoptions in the UK 2010–2021, for the small-size (10–50 kW) systems of the commercial sector: (left) installed capacity (F1 + F2 + F1); (right) number of installations (F1 + F2 + F1).
Forecasting 04 00026 g0a4
Table A4. Estimates of GIM parameters for the time series of PV adoptions in the UK 2010–2021 for the small-size (10–50 kW) commercial sector for the two types of data series considered (by installed capacity and by numbers of installations). The best-fit model is reported including the estimates of the basic Bass parameters ( q ,   m ) as well as the type and number of shocks.
Small-Size (10–15 kW) Commercial Sector
Installed CapacityNumber of Installations
Best Model3-shock (F1 + F2 + F1)3-shock (F1 + F2 + F1)
q0.0060.006
m525624,544,092
A114.813.3
a10.00
b12323
A2 (c2)0.40.4
a22021
b2 (A2)137107
A33.94.1
a32424
b37575

References

  1. Heffron, R.J.; Körner, M.F.; Schöpf, M.; Wagner, J.; Weibelzahl, M. The role of flexibility in the light of the COVID-19 pandemic and beyond: Contributing to a sustainable and resilient energy future in Europe. Renew. Sustain. Energy Rev. 2021, 140, 110743. [Google Scholar] [CrossRef] [PubMed]
  2. Bessi, A.; Guidolin, M.; Manfredi, P. The role of gas on future perspectives of renewable energy diffusion: Bridging technology or lock-in? Renew. Sustain. Energy Rev. 2021, 152, 111673. [Google Scholar] [CrossRef]
  3. IEA, Renewables. 2021. Available online: https://www.iea.org/reports/renewables-2021 (accessed on 21 January 2022).
  4. Geels, F.W.; McMeekin, A.; Pfluger, B. Socio-technical scenarios as a methodological tool to explore social and political feasibility in low-carbon transitions: Bridging computer models and the multi-level perspective in UK electricity generation (2010–2050). Technol. Forecast. Soc. Chang. 2020, 151, 119258. [Google Scholar] [CrossRef]
  5. Geels, F.W. Disruption and low-carbon system transformation: Progress and new challenges in socio-technical transitions research and the Multi-Level Perspective. Energy Res. Soc. Sci. 2018, 37, 224–231. [Google Scholar] [CrossRef]
  6. Sovacool, B.K.; Hess, D.J.; Amir, S.; Geels, F.W.; Hirsh, R.; Medina, L.R.; Yearley, S. Sociotechnical agendas: Reviewing future directions for energy and climate research. Energy Res. Soc. Sci. 2020, 70, 101617. [Google Scholar] [CrossRef]
  7. Hirt, L.F.; Sahakian, M.; Trutnevyte, E. What socio-technical regimes foster solar energy champions? Analyzing uneven photovoltaic diffusion at a subnational level in Switzerland. Energy Res. Soc. Sci. 2021, 74, 101976. [Google Scholar] [CrossRef]
  8. Reindl, K.; Palm, J. Installing PV: Barriers and enablers experienced by non-residential property owners. Renew. Sustain. Energy Rev. 2021, 141, 110829. [Google Scholar] [CrossRef]
  9. Schulte, E.; Scheller, F.; Sloot, D.; Bruckner, T. A meta-analysis of residential PV adoption: The important role of perceived benefits, intentions and antecedents in solar energy acceptance. Energy Res. Soc. Sci. 2022, 84, 102339. [Google Scholar] [CrossRef]
  10. Martinopoulos, G.; Tsalikis, G. Diffusion and adoption of solar energy conversion systems–The case of Greece. Energy 2018, 144, 800–807. [Google Scholar] [CrossRef]
  11. Martinopoulos, G. Are rooftop photovoltaic systems a sustainable solution for Europe? A life cycle impact assessment and cost analysis. Appl. Energy 2020, 257, 114035. [Google Scholar] [CrossRef]
  12. Peng, J.; Lu, L.; Yang, H. Review on life cycle assessment of energy payback and greenhouse gas emission of solar photovoltaic systems. Renew. Sustain. Energy Rev. 2013, 19, 255–274. [Google Scholar] [CrossRef]
  13. IEA-PVPS (2021), Snapshot of Global PV Markets 2021. Available online: https://iea-pvps.org/snapshot-reports/snapshot-2021/ (accessed on 21 January 2022).
  14. Rogers, E.M. Diffusion of Innovations, 4th ed.; Simon and Schuster: New York, NY, USA, 2010. [Google Scholar]
  15. Bass, F.M. A new product growth for model consumer durables. Manag. Sci. 1969, 15, 215–227. [Google Scholar] [CrossRef]
  16. Rao, K.U.; Kishore, V.V.N. A review of technology diffusion models with special reference to renewable energy technologies. Renew. Sustain. Energy Rev. 2010, 14, 1070–1078. [Google Scholar] [CrossRef]
  17. Petropoulos, F.; Apiletti, D.; Assimakopoulos, V.; Babai, M.Z.; Barrow, D.K.; Taieb, S.B.; Bergmeir, C.; Bessa, R.J.; Bijak, J.; Boylan, J.E.; et al. Forecasting: Theory and practice. Int. J. Forecast. 2022, in press. [Google Scholar] [CrossRef]
  18. Guseo, R.; Dalla Valle, A.; Guidolin, M. World Oil Depletion Models: Price effects compared with strategic or technological interventions. Technol. Forecast. Soc. Chang. 2007, 74, 452–469. [Google Scholar] [CrossRef]
  19. Bass, F.M.; Krishnan, T.V.; Jain, D.C. Why the Bass model fits without decision variables. Market. Sci. 1994, 13, 203–223. [Google Scholar] [CrossRef]
  20. Guidolin, M.; Mortarino, C. Cross-country diffusion of photovoltaic systems: Modelling choices and forecasts for national adoption patterns. Technol. Forecast. Soc. Chang. 2010, 77, 279–296. [Google Scholar] [CrossRef] [Green Version]
  21. Bunea, A.M.; Della Posta, P.; Guidolin, M.; Manfredi, P. What do adoption patterns of solar panels observed so far tell about governments’ incentive? Insights from diffusion models. Technol. Forecast. Soc. 2020, 160, 120240. [Google Scholar] [CrossRef]
  22. Islam, T.; Meade, N. The impact of attribute preferences on adoption timing: The case of photo-voltaic (PV) solar cells for household electricity generation. Energy Policy 2013, 55, 521–530. [Google Scholar] [CrossRef] [Green Version]
  23. Islam, T. Household level innovation diffusion model of photo-voltaic (PV) solar cells from stated preference data. Energy Policy 2014, 65, 340–350. [Google Scholar] [CrossRef]
  24. Snape, J.R. Spatial and temporal characteristics of PV adoption in the UK and their implications for the smart grid. Energies 2016, 9, 210. [Google Scholar] [CrossRef] [Green Version]
  25. Balta-Ozkan, N.; Yildirim, J.; Connor, P.M.; Truckell, I.; Hart, P. Energy transition at local level: Analyzing the role of peer effects and socio-economic factors on UK solar photovoltaic deployment. Energy Policy 2021, 148, 112004. [Google Scholar] [CrossRef]
  26. Castaneda, M.; Zapata, S.; Cherni, J.; Aristizabal, A.J.; Dyner, I. The long-term effects of cautious feed-in tariff reductions on photovoltaic generation in the UK residential sector. Renew. Energy 2020, 155, 1432–1443. [Google Scholar] [CrossRef]
  27. GOV.UK—National Statistics Solar Photovoltaics Deployment. Available online: https://www.gov.uk/government/statistics/solar-photovoltaics-deployment (accessed on 28 December 2021).
  28. Keirstead, J. The UK domestic photovoltaics industry and the role of central government. Energy Policy 2007, 35, 2268–2280. [Google Scholar] [CrossRef]
  29. CEBR: Solar Powered Growth in the UK. 2014. Available online: https://cebr.com/reports/solar-powered-growth-in-the-uk/ (accessed on 7 February 2019).
  30. International Finance Corporation: Utility-Scale Solar Photovoltaic Power Plants, World Bank Group. 2015. Available online: http://documents.worldbank.org/curated/en/690161467992462412/Utility-scale-solar-photovoltaic-power-plants-a-project-developer-s-guide (accessed on 7 February 2019).
  31. Seber, G.A.F.; Wild, C.J. Nonlinear Regression; John Wiley & Sons: New York, NY, USA, 1989. [Google Scholar]
  32. Van den Bulte, C.; Lilien, G.L. Bias and Systematic Change in the Parameter Estimates of Macro-Level Diffusion Models. Mark. Sci. 1997, 16, 338–353. [Google Scholar] [CrossRef]
  33. Faiers, A.; Neame, C. Consumer attitudes towards domestic solar power systems. Energy Policy 2006, 34, 1797–1806. [Google Scholar] [CrossRef] [Green Version]
  34. Hammond, G.P.; Harajli, H.A.; Jones, C.I.; Winnett, A.B. Whole systems appraisal of a UK Building Integrated Photovoltaic (BIPV) system: Energy, environmental, and economic evaluations. Energy Policy 2012, 40, 219–230. [Google Scholar] [CrossRef]
  35. Yamaguchi, Y.; Akai, K.; Shen, J.; Fujimura, N.; Shimoda, Y.; Saijo, T. Prediction of photovoltaic and solar water heater diffusion and evaluation of promotion policies on the basis of consumers’ choices. Appl. Energy 2013, 102, 1148–1159. [Google Scholar] [CrossRef]
  36. GOV.UK—Legislation. Available online: www.legislation.gov.uk (accessed on 5 July 2019).
  37. National Archive—Reform of the Renewables Obligation. May 2007. Available online: http://webarchive.nationalarchives.gov.uk/+/http:/www.berr.gov.uk/files/file39497.pdf (accessed on 5 July 2019).
  38. Duan, H.B.; Zhu, L.; Fan, Y. A cross-country study on the relationship between diffusion of wind and photovoltaic solar technology. Technol. Forecast. Soc. Chang. 2014, 83, 156–169. [Google Scholar] [CrossRef]
  39. Da Silva, P.P.; Dantas, G.; Pereira, G.I.; Câmara, L.; De Castro, N.J. Photovoltaic distributed generation–An international review on diffusion, support policies, and electricity sector regulatory adaptation. Renew. Sustain. Energy Rev. 2019, 103, 30–39. [Google Scholar] [CrossRef]
  40. GOV.UK—Government Response to the Consultation on Proposals for the Levels of Banded Support Under the Renewables Obligation for the Period 2013–17 and the Renewables Obligation Order. 2012. Available online: https://assets.publishing.service.gov.uk/government/uploads/system/uploads/attachment_data/file/42852/5936-renewables-obligation-consultation-the-government.pdf (accessed on 28 December 2021).
  41. OFGEM—Renewables Obligation (RO). Available online: https://www.ofgem.gov.uk/environmental-programmes/ro/about-ro/ro-closure (accessed on 28 December 2021).
  42. GOV.UK—Contracts for Difference. Available online: https://www.gov.uk/government/publications/contracts-for-difference/contract-for-difference (accessed on 28 December 2021).
  43. PV Magazine—UK: Solar Still Being Blocked in Next CFD Auction. Available online: https://www.pv-magazine.com/2016/11/09/uk-solar-still-being-blocked-in-next-cfd-auction_100026847/ (accessed on 28 December 2021).
  44. OFGEM—Feed-In-Tariffs (FIT). Available online: https://www.ofgem.gov.uk/environmental-programmes/fit/fit-tariff-rates (accessed on 12 January 2022).
  45. The Eco Experts. Available online: https://www.theecoexperts.co.uk/sites/default/files/filemanager/cost-of-solar-2017-graph (accessed on 12 January 2022).
  46. Soal Power Portal—Solar Made to Wait for Future Direction as Clean Growth Strategy Defers PV Policy. Available online: https://www.solarpowerportal.co.uk/news/solar_made_to_wait_for_future_direction_as_clean_growth_strategy_defers_pv (accessed on 12 January 2022).
  47. UK Solar Photovoltaic Roadmap—A Strategy for 2020. Available online: https://www.bre.co.uk/filelibrary/nsc/Documents%20Library/Not%20for%20Profits/KTN_Report_Solar-PV-roadmap-to-2020_1113.pdf (accessed on 12 January 2022).
  48. Dusonchet, L.; Telaretti, E. Economic analysis of different supporting policies for the production of electrical energy by solar photovoltaics in western European Union countries. Energy Policy 2010, 38, 3297–3308. [Google Scholar] [CrossRef]
  49. The Guardian—Solar Subsidies Government Loses Court Appeal. 2012. Available online: https://www.theguardian.com/environment/2012/jan/25/solar-subsidies-government-loses-court-appeal (accessed on 15 March 2019).
  50. Dusonchet, L.; Telaretti, E. Comparative economic analysis of support policies for solar PV in the most representative EU countries. Renew. Sustain. Energy Rev. 2015, 42, 986–998. [Google Scholar] [CrossRef]
  51. Green Business Watch—UK Domestic Solar Panel Costs and Returns. Available online: https://greenbusinesswatch.co.uk/uk-domestic-solar-panel-costs-and-returns-2010-2014#section4 (accessed on 7 February 2019).
  52. OFGEM—Renewables Obligation (RO) Buy-Out Price and Mutualisation Ceilings for 2018–19 RO Year. Available online: https://www.ofgem.gov.uk/publications-and-updates/renewables-obligation-ro-buy-out-price-and-mutualisation-ceilings-2018-19-ro-year (accessed on 23 July 2019).
  53. Soal Power Portal—Let Solar Back into CfDs. Available online: https://www.solarpowerportal.co.uk/news/let_solar_back_into_cfds_energy_uk_urges_government (accessed on 15 March 2019).
  54. Guidolin, M.; Guseo, R. The German energy transition: Modeling competition and substitution between nuclear power and Renewable Energy Technologies. Renew. Sustain. Energy Rev. 2016, 60, 1498–1504. [Google Scholar] [CrossRef]
Figure 1. Monthly cumulative installed capacity of solar PV (in MW) by sector: residential (green), commercial (blue), and utility (orange) from January 2010 to November 2021. Data from [27].
Forecasting 04 00026 g001
Figure 2. Monthly cumulative number of installations of solar PV by sector: residential (green), commercial (blue), and utility (orange) from January 2010 to November 2021. Data from [27].
Forecasting 04 00026 g002
Figure 3. Observed vs. fitted (by the best GIM model) PV adoptions in the UK 2010–2021 for the residential sector by installed capacity and by numbers of installations. For each category considered, the figure reports: (i) cumulative adoptions, (ii) monthly adoptions, and (iii) growth rate of cumulative adoptions.
Forecasting 04 00026 g003
Figure 4. Observed vs. fitted (by the best GIM model) PV adoptions in the UK 2010–2021 for the utility sector by installed capacity and by numbers of installations. For each category considered, the figure reports: (i) cumulative adoptions, (ii) monthly adoptions, and (iii) growth rate of cumulative adoptions.
Forecasting 04 00026 g004
Figure 5. Observed vs. fitted (by the best GIM model) PV adoptions in the UK 2010–2021 for the commercial sector by installed capacity and by numbers of installations. For each category considered, the figure reports: (i) cumulative adoptions, (ii) monthly adoptions, and (iii) growth rate of cumulative adoptions.
Forecasting 04 00026 g005
Table 1. Estimates of GIM parameters for the time series of PV adoptions in the UK 2010–2021 for the three sectors considered: residential (R), commercial (C), and utility (U) and for the two types of data series considered (by installed capacity and by numbers of installations). For each of the six categories considered, the best-fit model is reported including the estimates of the basic Bass parameters ( q ,   m ) as well as the type and number of shocks, e.g., “2-shock ( F 1 + F 2 )” means that two shocks having forms F 1   and F 2 were selected, while 5-shock F 1 ( 4   A ) refers to 5 rectangular shocks (form F 1 ) estimated with 4 different intensities ( A ).
Installed CapacityNumber of Installations
SectorRCURCU
Best Model3-shock (F1 + F2 + F1)2-shock (F1 + F2)6-shock F1 (5 A)3-shock (F1 + F2 + F1)3-shock (F1 + F2 + F1)5-shock F1 (4 A)
q0.0030.0440.0410.0040.0050.048
m31,1234477591427,457,64228,841,448448
A144.53.397.940.415.8110.0
a10.00130013
b1202514202314
A2 (c2)0.40.136.30.40.340.1
a2206825202025
b2(A2)15442613310425
A35.479.74.65133.8
a32437242436.99
b37337747637.20
A422.520.4
a44949
b45050
A54.6110.0
a56161.6
b56262.1
A697.9
a694
b695
Publisher’s Note: MDPI stays neutral with regard to jurisdictional claims in published maps and institutional affiliations.

