1. Introduction
Tourism has become one of the most vibrant, robust, and fastest growing economic sectors, contributing to gross domestic product (GDP), job creation, and social and economic development along its value chain over the last decade [
1]. According to World Tourism Barometer in January 2020 [
2], international tourist arrivals (overnight visitors) worldwide grew by 4% in 2019, led by the Middle East (+8%), as well as Asia and the Pacific (+5%). International arrivals in Europe and Africa both increased by 4% while the Americas saw growth of 2%.
In Vietnam, tourism has been one of the quickest growing sectors and most important driving forces to economic development. The industry has seen a dramatic growth ranging from 10 to 25% during the last 10 years, contributing from 4 to 10% to the national GDP [
3]. For 2015–2018, the average growth rate was 25%, ranking as one of the highest growth figures in the tourism sector in the world [
4]. In 2019, Vietnam witnessed a remarkable expansion of tourism in which international tourists reached 18 million, up 2.5 million compared to 2018 [
3].
The Vietnamese government has prioritized tourism as a strategic driver of socio-economic development. The prioritization has been translated into a resolution to promote tourism growth. The sector is also expected to meet ambitious sets of targets for the next coming decade. To achieve those quantitative targets, a long-term strategy and action plan for the industry have been made for the period 2018–2030 [
5]. A VND 30 trillion (USD 1.32 billion) program was approved to improve transport infrastructure at major tourist destinations in 2017 [
6]. Along with the above program, the government approved the establishment of a VND 300 billion (USD 12.9 million) tourism development fund for promotional activities in 2018 [
7]. In addition to funding activities, the government has relaxed immigration policies for foreign tourists from particular countries and regions.
Forecasting tourism demand is becoming increasingly important for predicting future economic development [
8]. Given the gap between limited resources for tourism and the stable growth rate of the industry, modelling and forecasting of tourism volume plays a vital role in the optimization of resource allocation [
9,
10,
11]. Accurate predictions are essential for tourism attractions where the decision-makers and business managers try to take advantage of the sector developments and/or to balance their local environmental aspect and economic performance [
12,
13]. For example, governments require accurate forecasting methods for informed decision making on issues such as infrastructure development and accommodation site planning [
14,
15]. Organisations need the forecasts to make tactical decisions related to tourism promotional activities [
16], and tourism and hospitality practitioners need precise forecasts for operational decisions, such as staffing and scheduling [
17,
18].
New themes and trends in tourism and hotel demand forecasting are comprehensively reviewed [
11,
13,
19,
20,
21]. The existing literature on predicting tourism demand is extensive, ranging from different countries, various statistical techniques, and different sets of data [
22]. To improve forecasting accuracy, new methods have been continually developed in the tourism demand forecasting field [
23]. Most recent studies often measured international tourism demand in terms of tourist arrivals [
9,
24,
25,
26,
27], tourism expenditure [
28,
29,
30], or overnight stays [
31,
32,
33,
34,
35]. As such, data are better aggregated [
13].
The studies on tourism demand forecasting can be categorized generally into qualitative and quantitative approaches [
17]. Major groups of methods used to forecasting tourism demand include time series models, econometrics models, artificial intelligence techniques, and qualitative methods [
8,
36,
37]. Time series models, econometric approaches, and artificial intelligence models are three main categories of quantitative forecasting methods [
38]. The fourth category is judgmental methods, which can be used for both qualitative and quantitative forecasting [
39]. Time series models and econometric models are most frequently used, and artificial intelligence models have started to gain popularity in the past decade [
40] thanks to their capability to deal with non-linear behaviour [
41]. In general, time series and econometrics models rely on the stability of historical patterns and economic structure, while artificial intelligence models are dependent on the quality and size of available training data [
17].
Given the significance of the tourism sector to the economy, an accurate forecast of tourist demand plays an essential role in predicting the future economic development of Vietnam. By using multilayer perceptron artificial neural networks methodology, the research aims to find the best structure to forecast the number of international tourists to Vietnam.
The paper is organised as follows.
Section 2 shows a descriptive analysis of materials and presentations of artificial neural network models experimented on in the scope of this study.
Section 3 presents empirical results, which are discussed in depth in
Section 4. Conclusions and implications for future works are presented in the final section.
2. Materials and Methods
Datasets for the study are mainly collected from two government organisations, i.e., the Vietnam National Administration of Tourism (VNAT) and the General Statistics Office of Vietnam (GSO). The collected data on Vietnam’s tourism include (1) the monthly number of international tourists to Vietnam, from January 2008 to December 2020; (2) the annual number of international tourists to Vietnam, from January 1995–December 2020; (3) the number of international tourists by mode of transport, from 1995 to 2020; (4) the number of international tourists by region, from 2008 to 2020; and (5) the average length of stay and expenditure of international tourists in Vietnam, from 2005 to 2020. The time series most used in the research is the monthly number of international tourists as income generated from this group of customers accounts for a larger part of total tourism revenues.
2.1. Descriptive Analysis
This section analyses the development of the tourism sector in Vietnam with a special focus on the number of international tourists that arrived in Vietnam between 1995 and 2020.
2.1.1. International Tourists Arriving in Vietnam
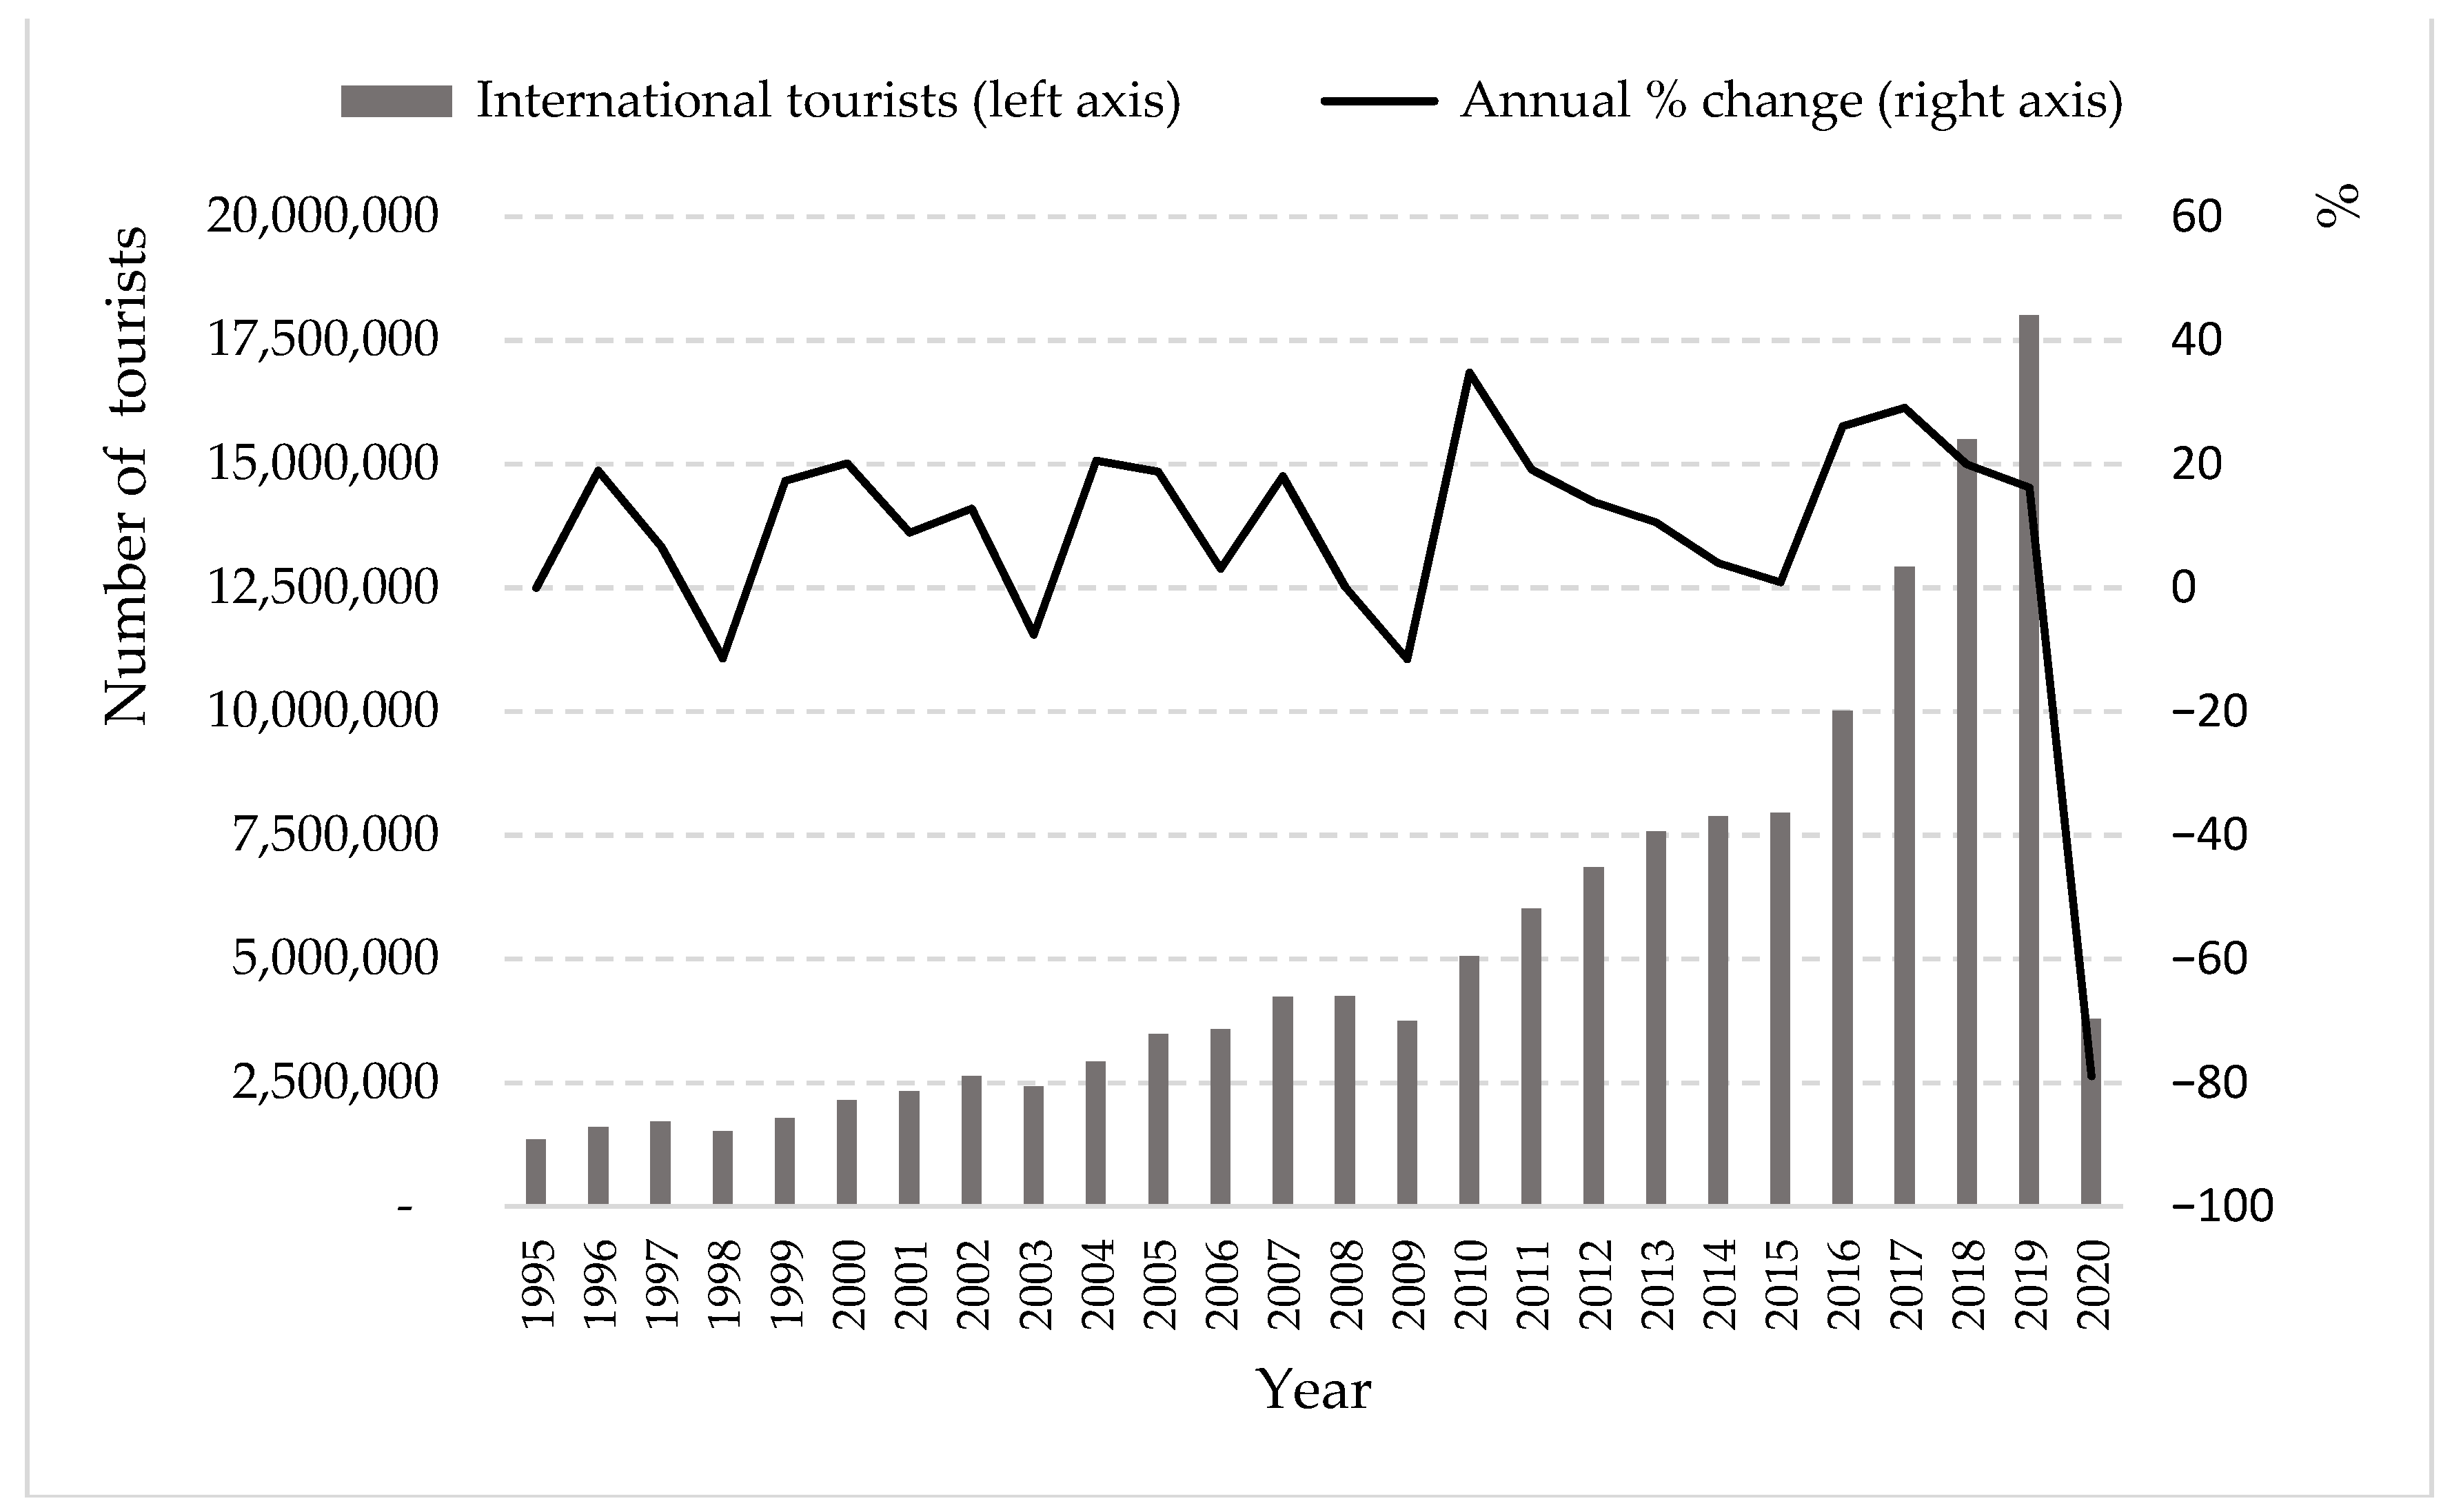
The period 1995–2019 witnessed a boom in inbound tourism in Vietnam. The number of international tourists to the country increased more than 13 times, from 1.35 million in 1995 to 18 million in 2019 (
Figure 1). Moreover, there has been a remarkable acceleration in international tourists in the last 3 years, from an average of around 9% per annum between 1995–2015 to an average of 23%, between 2016–2019.
Although the graph shows an increasing number of international tourists to Vietnam through the years, there were remarkable declines in tourism demand in 2003, 2008–2009, 2014–2015, and 2020. World tourism faced many distressing events in 2003, e.g., the Iraq war; the outbreak of severe acute respiratory syndrome (SARS) in 32 countries and regions, including Vietnam; and terrorist attacks in many parts of the world, such as Indonesia, Turkey, Russia, Columbia, Saudi Arabia etc. According to UNWTO’s Tourism Highlights Report [
42], international arrivals to Southeast Asia decreased by 14% in 2003. Vietnam’s tourism also suffered losses due to the outbreak of SARS, making international tourists decline by nearly 8%.
The global financial crisis in 2008–2009 and the influenza A/H1N1 at the same time caused a major hit to Vietnam’s tourism industry, leading to a lower low of foreign tourist volume than the previous years. According to a report on Vietnam’s socio-economic situation in 2009 by General Statistics Office [
43], international tourists from major markets continued to decrease in which those from China and South Korea recorded a double-digit decline by 18% and 19.4%, respectively. Other top source markets also saw significant loss, for example, Japan (8.6%), Taiwan (10.4%), Australia (6.9%), etc.
The number of international tourists to Vietnam in 2015 only increased by nearly 0.9% compared to 2014, making it the lowest growth rate among the last six years. Such a low rate was largely attributed to the 2014 China–Vietnam mutual sea crisis and the devaluation of the Russian currency [
44]. China’s deployment of an oil rig, together with civilian, coast guard, and army navy vessels in disputed waters (as known as the South China Sea or East Sea in Vietnam), triggered anti-China protests in Vietnam, resulting in a significant decline by 8.5% in the number of international tourists mainly from Chinese-speaking markets from May 2014 to the end 2015 [
45]. In the following year, however, the number of Chinese tourists to Vietnam increased again, marking a growth of nearly 51.4% year-on-year [
46]. On the other hand, in 2015, the number of tourists from Russia—an important market to Vietnams tourism thanks to visa relaxation policy for Russian tourists since 2009—declined by 7.1% compared to 2014 due to the continuous weakening of the Russian rouble as a result of the Ukraine incident [
44,
45].
After being hit by the COVID-19 crisis in early 2020, Vietnam has faced severe economic consequences. Tourism is among the most affected. Border closing and the ban on entry of foreign visitors since March 2020 until now immediately led to an abrupt decline in the number of international tourists, causing a significant decrease in the total tourism revenue of 2020 by 48.4% compared to that of 2019 [
47].
2.1.2. Monthly Trend of International Tourists to Vietnam
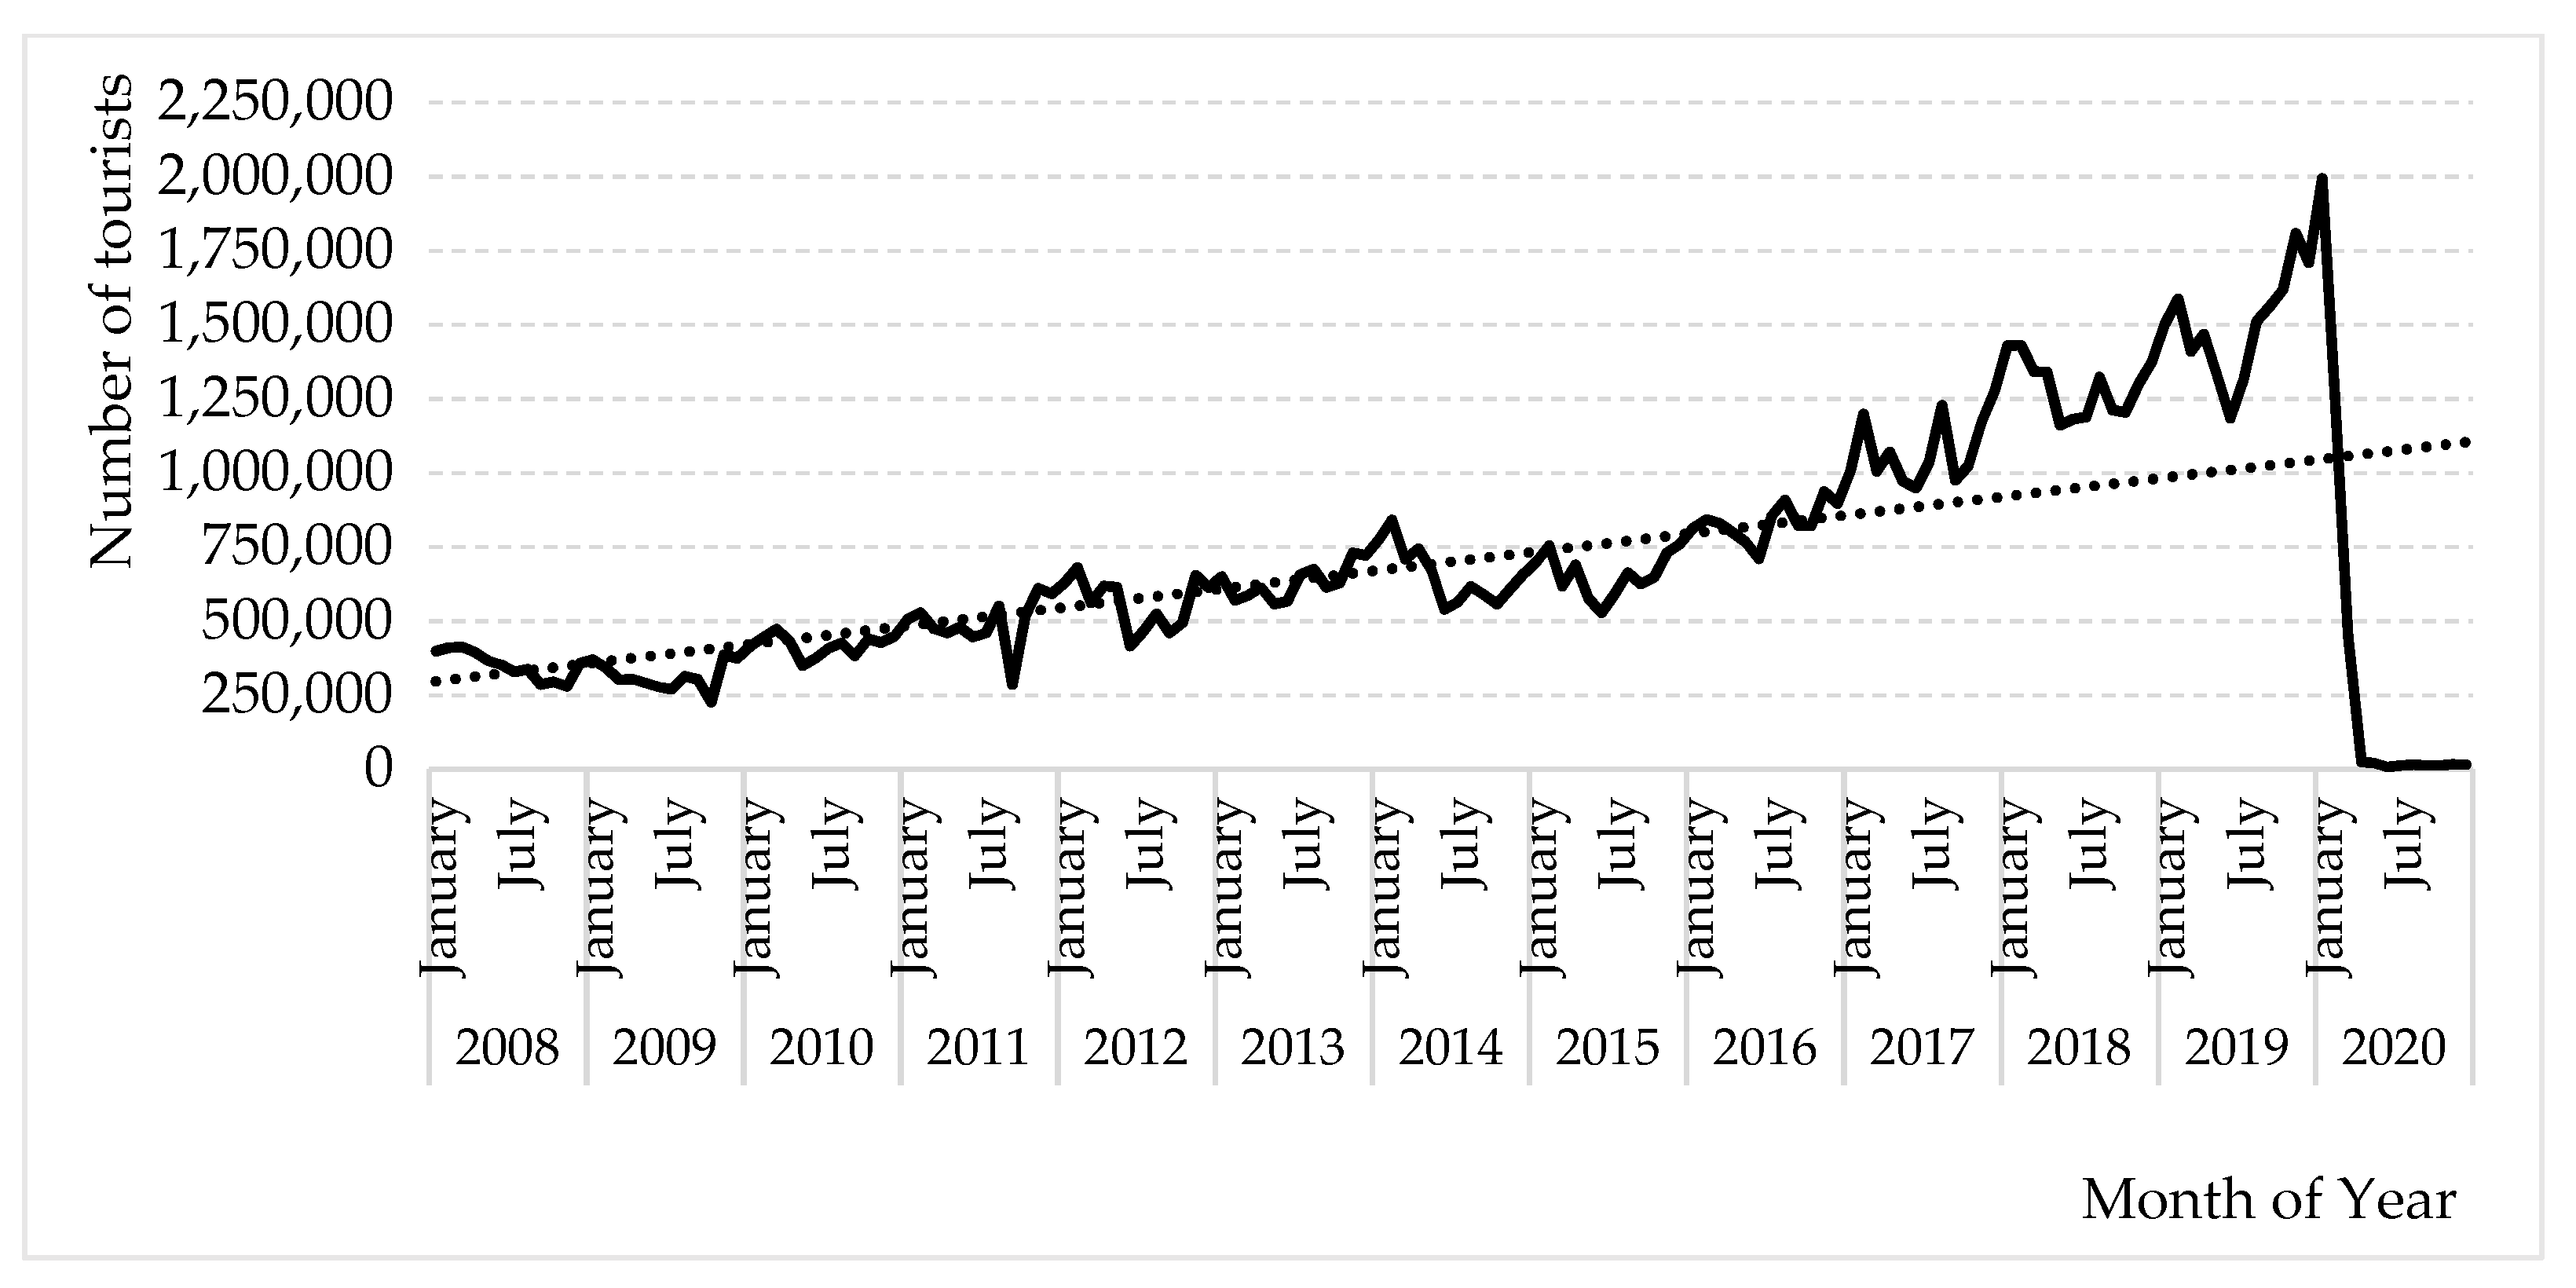
Although yearly data show a consistently increasing trend of international tourists to Vietnam, monthly statistics reveal fluctuations that could be attributed to the seasonality nature of tourism. November to March of next year and July–August are usually the highest seasons for international tourists to Vietnam because most people in the world have long holidays in these months, which enable them to take lengthy vacations abroad. The period from September to November every year is considered the low season for Vietnam’s tourism when the new school year and rainy season start, resulting in a sharp decrease in tourism demand. The number of international tourists hit the bottom in September 2009 and October 2011 but bounced back to a higher level in the next coming months.
At the beginning of 2020, the tourism sector in Vietnam witnessed robust growth in the number of both international and domestic tourists (up by 33% compared to the same period of 2019). However, at the end of January 2020, these numbers quickly plummeted due to the outbreak of the COVID-19 pandemic. In April 2020, the tourism demand hit rock bottom as social distancing and border closure were put into practice (
Figure 2). Domestic tourism was encouraged from May onwards but a new COVID-19 outbreak in Da Nang (one of the most popular tourist attractions in Vietnam) in July 2020 and May 2021 ruined local tourism recovery [
48,
49]. According to the Vietnam Statistical Yearbook 2020 by GSO, international tourists to Vietnam decreased by 78.7% compared to that of 2019 [
47].
2.1.3. International Tourists by Regions and Mode of Transport
According to the Vietnam National Administration of Tourism, in 2019, with respect to international tourists by region, short-haul markets from Asia took up the major part (79.9%), of which Northeast Asia accounted for 66.8% and Southeast Asia had a share of 11.3% [
3]. The remaining Asian markets accounted for 1.8%. Tourists from Europe comprised 12%, while the Americas and Australia followed with 5.4% and 2.4%, respectively, as presented in
Figure 3.
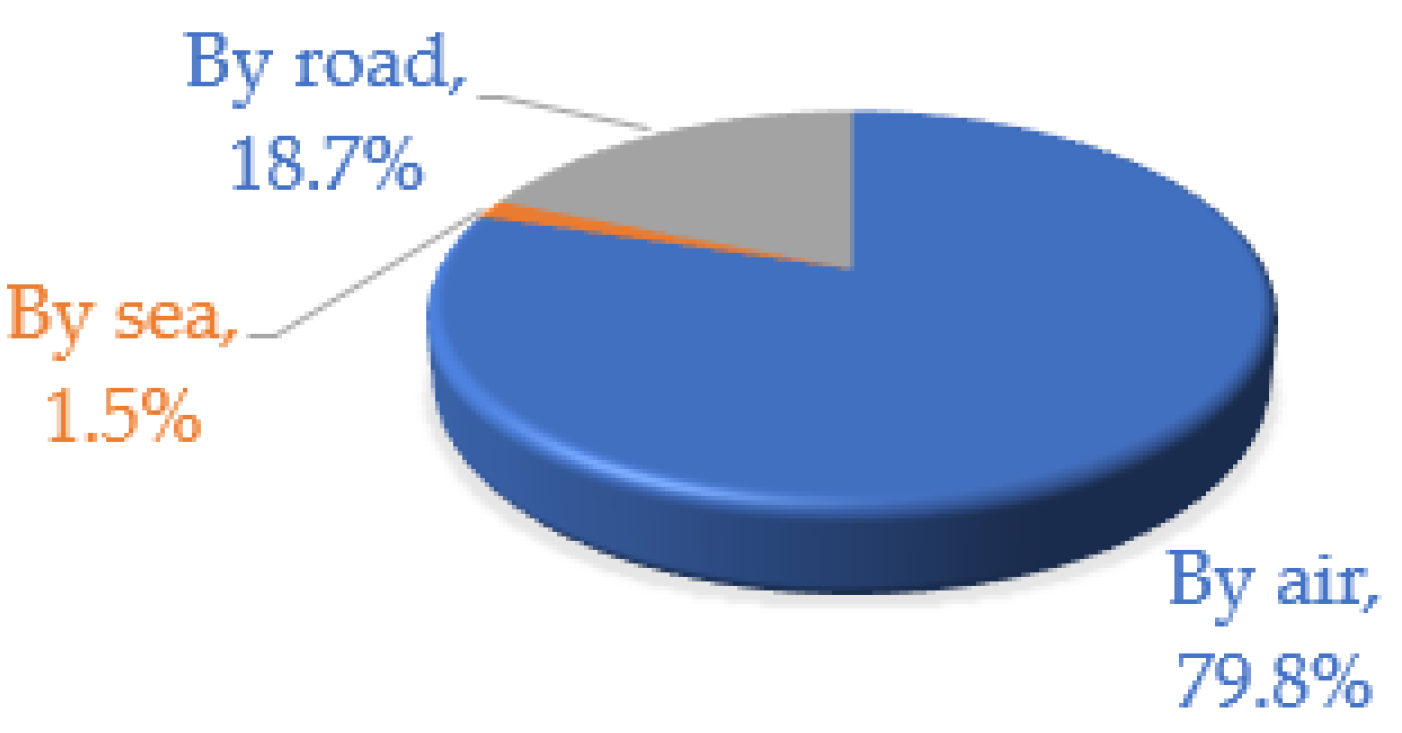
In 2019, international tourists to Vietnam by air accounted for 79.8%, tourists travelling by road accounted for 18.7%, and tourists travelling by sea accounted for 1.5%, as presented in
Figure 4. Especially, those travelling to Vietnam by air took up a considerably larger part in comparison to the average rate of global tourism. According to UNWTO, 58% of international visitors in the world travelled by air, 38% travelled by road, and 4% travelled by sea in 2019 [
48].
2.1.4. Average Length of Stay and Expenditure
In 2019, on average, an international tourist stayed at commercial accommodations for 8.02 days while the average overnight stay at non-commercial accommodations was 11.92 days (
Table 1). International tourists staying at commercial accommodations spent an average of USD 1083.36 while those staying at non-commercial accommodations (e.g., homes of friends, relatives, etc.) spent an average of USD 622.71 (
Table 1) [
3]. The cost for accommodation accounts for the major part of tourism expenditure. As a result, despite the longer days international tourists spent at non-commercial accommodations, the less they spent compared to ones staying at commercial accommodations.
Table 2 shows the average spending per day of international tourists in Vietnam, through the years. Compared to the spending of tourists in other tourist attractions in the same region of Southeast Asia, such a spending amount in Vietnam was rather low, below that of Singapore (286 USD), Philippines (128.3 USD), Indonesia (129 USD), Malaysia (134 USD), Phuket (Thailand) (USD 239), Bangkok (Thailand) (USD 173), etc. There are many reasons for this low spending of international tourists in Vietnam, i.e., the lack of entertainment and recreation centres and large scale of shopping malls, the weak links between travel agencies and shopping chains, the lack of value-added goods for tourists, etc.
2.2. Methodology
Artificial intelligence (AI) techniques that can explain non-linear data without prior knowledge about the relationships between input and output variables have been widely used for tourism forecasting in the last decade. The artificial neural network (ANN) model is one of the most frequently used AI-based models. A neural network is a machine that is designed to model how the brain performs a particular task or function of interest [
21]. A neural network is composed of a set of interconnected artificial neurons or a group of processing units, which process and transmit information through activation functions [
49]. Various studies show empirical evidence in favour of ANN models [
17,
50,
51,
52]. Fernandes [
53] used ANN to forecast tourism demand in the north and centre of Portugal. The study found that ANN was suitable for modelling and predicting the reference data. While comparing ARIMA and ANN models in forecasting tourism demand in Sweden, Höpken [
25] confirmed that ANN was more likely to outperform the ARIMA model when using a big data-based approach. Srisaeng and Baxter [
54] used ANN to predict passenger demand for international airlines in Australia. The result showed that ANN using multi-layer perceptron architecture provided highly predictive capability. Furthermore, according to Alamsyah and Friscintia [
55], ANN was able to accurately predict the monthly tourist arrivals in Indonesia. Álvarez-Díaz et al. [
50] found that a non-linear autoregressive neural network (NAR) shows slightly better performance than SARIMA in the case of forecasting international overnight stays and international tourist arrivals in Spain. The advantages of ANNs are (i) the capability to map linear or nonlinear function without any assumption imposed by the modelling process [
20]; (ii) its strong practicality and flexibility for treating imperfect data or handling almost any kind of nonlinearity [
13]; and (iii) the neural network methods can perform well for shorter records of tourism demand under unstable tourism conditions [
56].
Different ANN models have been applied to tourism forecasting practice, including multilayer perceptron (MLP) (the most widely used), radial basis function (RBF), generalized regression neural network (GRNN), and Elman neural network (Elman NN) [
13]. According to Haykin [
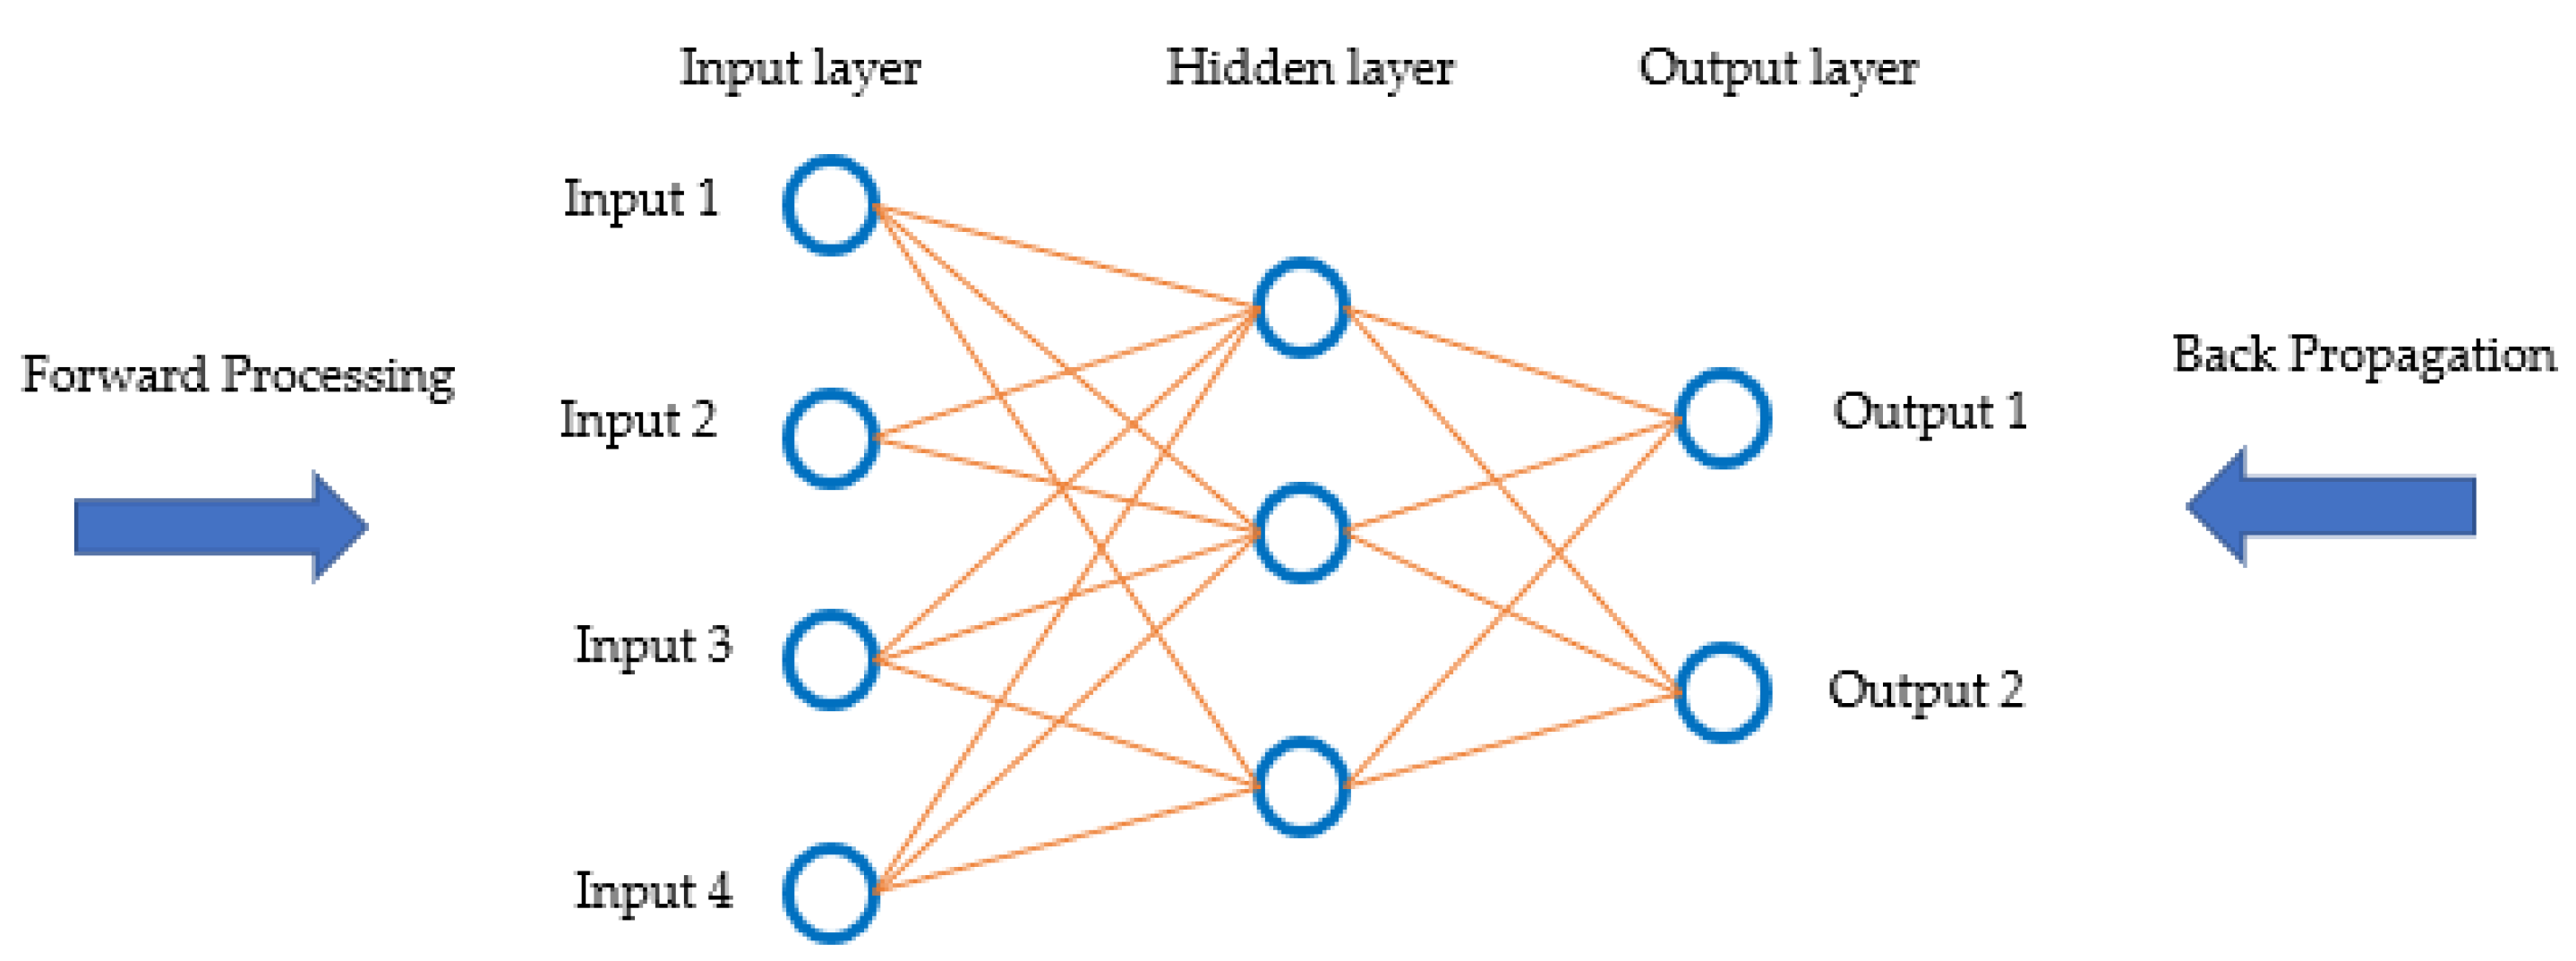
57], a multilayer perceptron is a neural network structure containing one or more layers that are hidden from both the input and output nodes. The model of each neuron in the network includes a nonlinear activation function that can be differentiable between layers. The nodes of adjacent layers of an MLP ANN are fully connected by the synaptic weights of the network.
The ANN is submitted to a training stage using a training dataset, and, later, the ANN is ready to perform classification or prediction using new data in its input.
The training process is carried out through the adjustment of the weights of the connections between the nodes of successive layers in a sequence of iterations or epochs using a back-propagation algorithm to reduce the error between the output of the ANN and the target of the training dataset [
49].
Figure 5 shows one architecture example of a multiplayer perceptron with one hidden layer and the output layer.
Given the available datasets and the research objectives, MLP ANN is employed to predict the number of international tourists to Vietnam in this study.
2.2.1. ANN Models
This section details the ANN models and methodologies experimented under the scope of this study. The objective of the ANN is to forecast the number of international tourists for next month as a way to forecast the tourism demand in Vietnam.
Several architectures of MLP ANN models are experimented with using two different dataset organisations concerning the test set. The experimented architectures vary in their input length, the number of nodes in the hidden layer, activation functions in hidden and output layers, and training functions. The test set is organised in two different ways: the random test set and the pre-defined test set. A discussion on these details is presented in the following sections.
2.2.2. ANN Architectures and Training
The ANN architectures are based on a multilayer perceptron with one hidden layer, similar to the one presented in
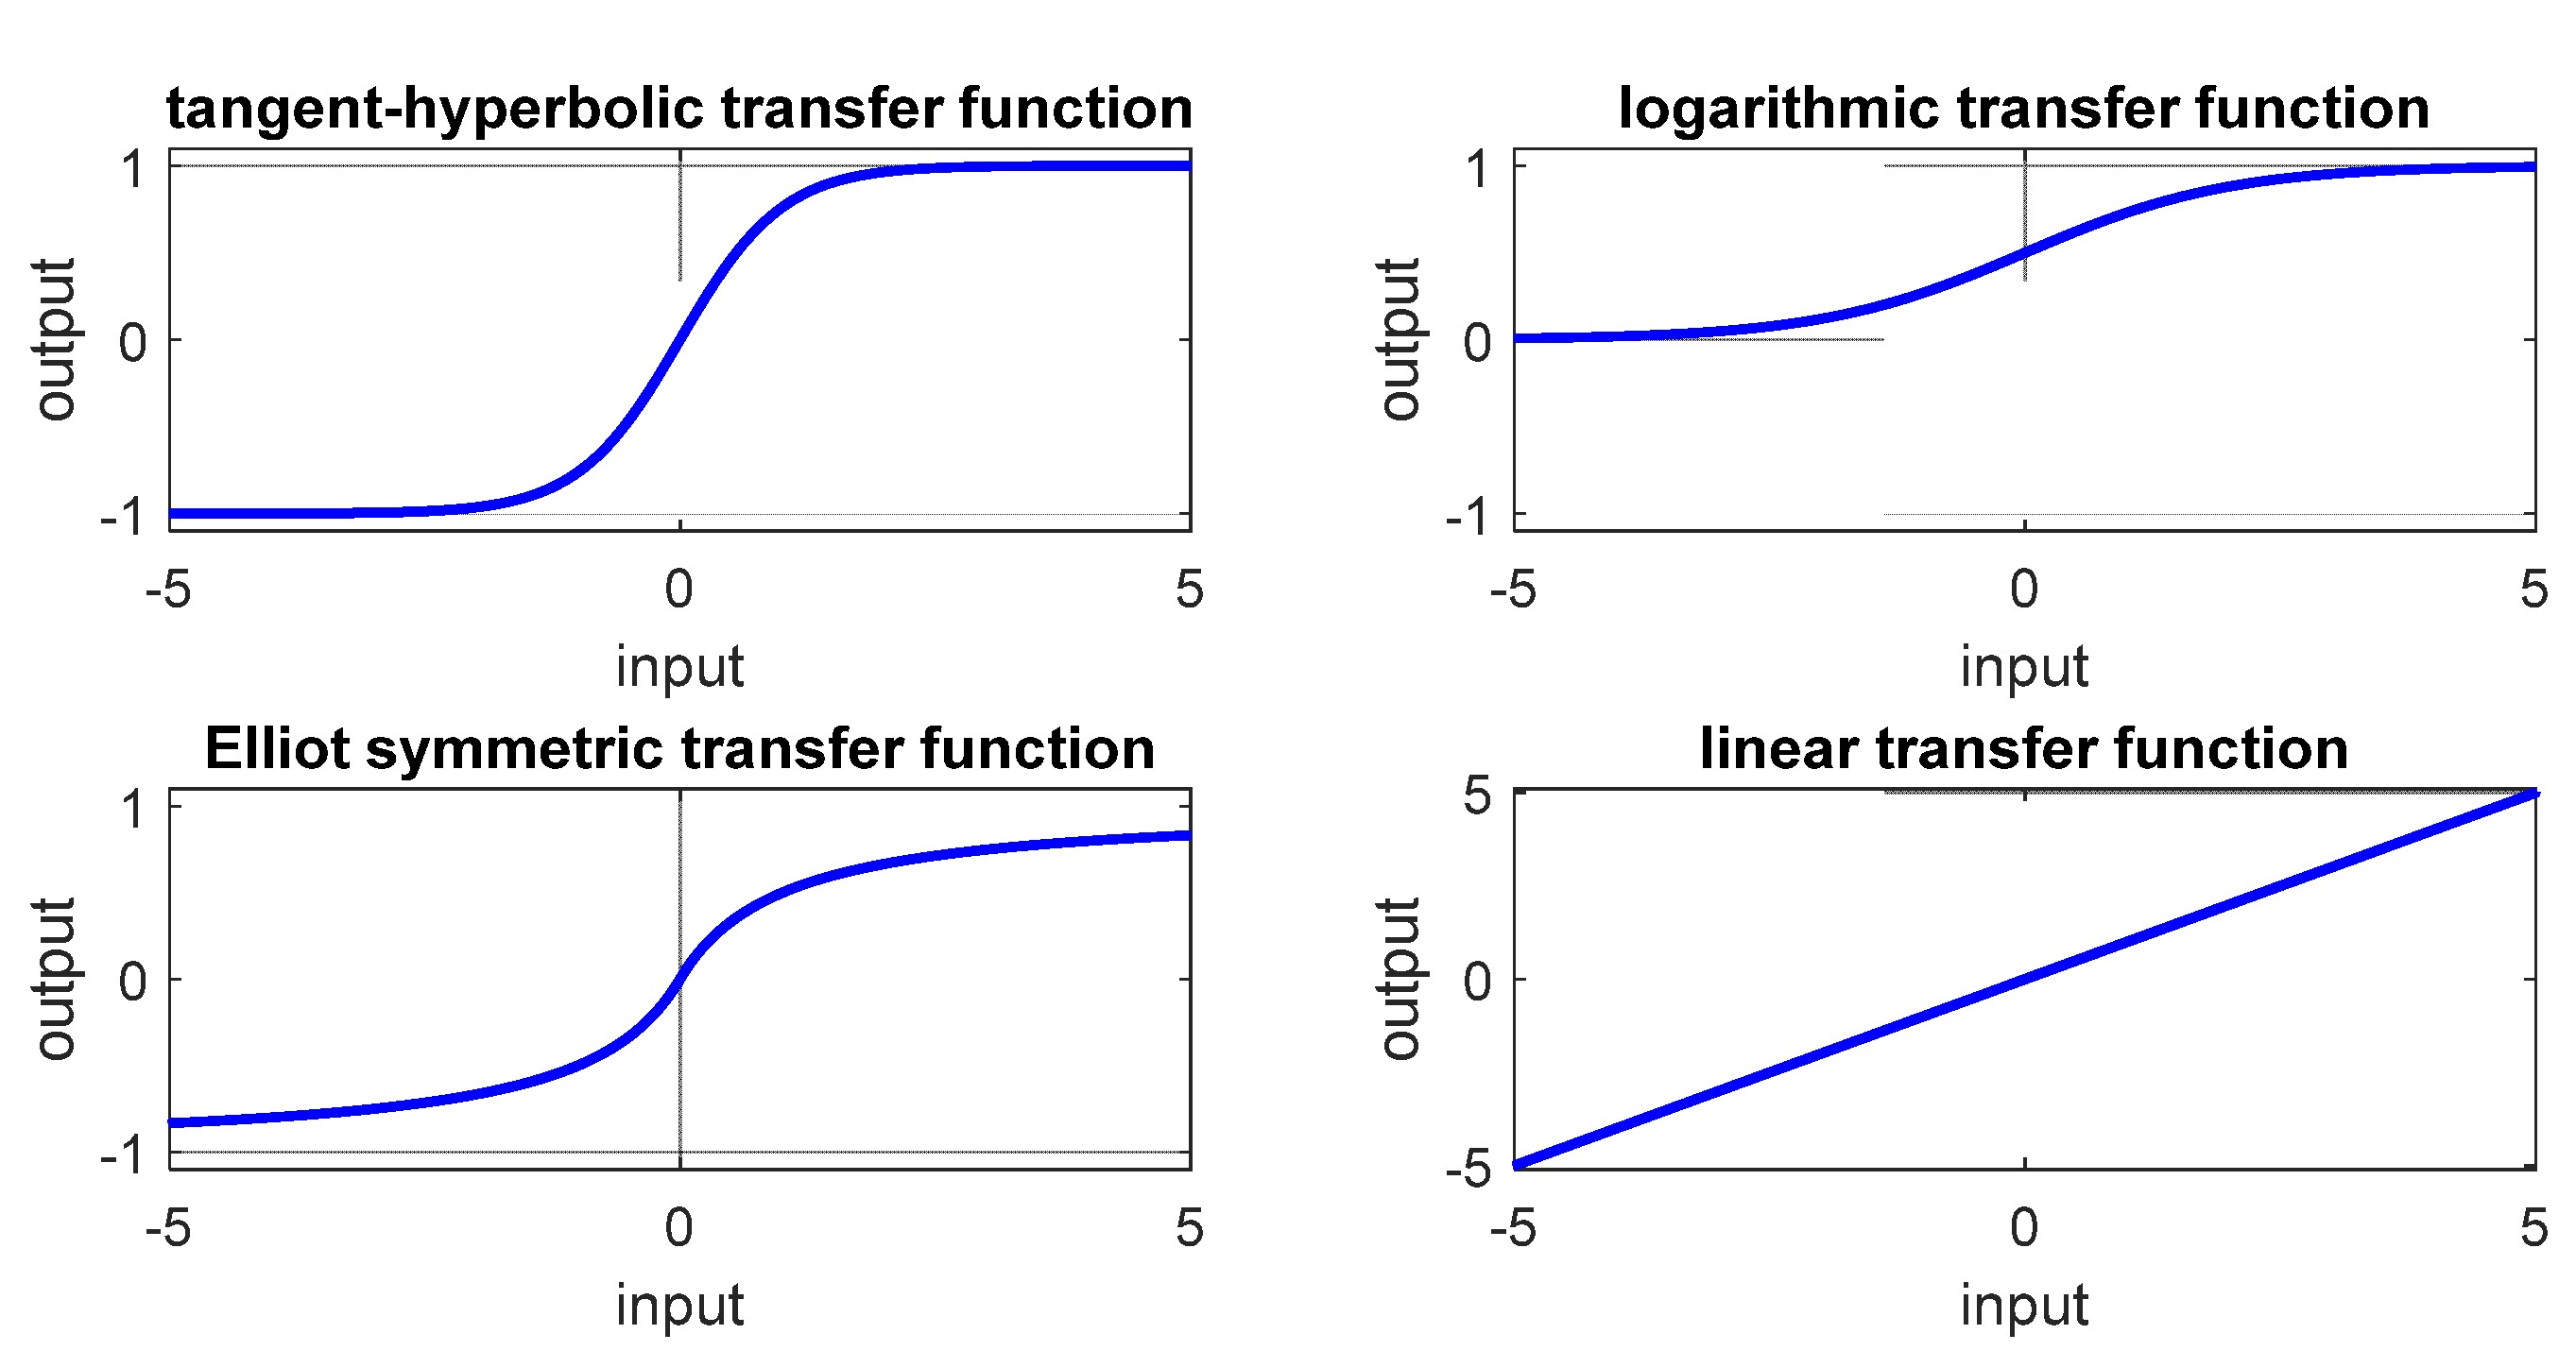
Figure 5. The number of input nodes is variable to accommodate information about previous months, the COVID-19 period, and South China Sea conflict information. Details are discussed in the next section. The output has only one node with the value of the forecasted number of international tourists. The number of nodes in the hidden layer varies between 2 and 20 in several experimental simulations. The activation function in the hidden and output layer has also experimented with the symmetric sigmoid transfer function, also known as the tangent hyperbolic transfer function (tansig), the logarithmic sigmoid transfer function (logsig), the Elliot symmetric sigmoid transfer function (elliotsig), and the linear transfer function (purelin). The first three functions squeeze the input into an interval between −1 and 1 or between 0 and 1 with an “S-shaped” function.
Figure 6 presents the activation transfer functions.
Some back-propagation algorithms were also experimented in the training stage of the ANN in combination with the varied architectures referred to above. These include the Levenberg–Marquardt algorithm (trainlm) [
58,
59], the resilient backpropagation algorithm (trainrp) [
60], the conjugate gradient backpropagation with Fletcher–Reeves updates (traincgf) [
61], and the Bayesian regularization backpropagation algorithm (trainbr) [
61].
2.2.3. ANN Input
The input of the ANN consists of the number of international tourists in previous months. The number of months can be variable and, according to previous studies, it typically varies around 12 previous months [
51,
52,
53]. In the work, a variation between 4 and 18 months have been experimented. The value of each month corresponds to one input of the ANN.
Additionally, because the abrupt lockdown caused by the COVID-19 pandemic led to a sudden plunge in the number of international tourists (see
Figure 2) after February 2020, a dummy variable is used to code the pandemic period. This variable is 0 before the pandemic period and 1 during the pandemic period. This variable requires one input in the ANN.
To also model the South China Sea conflict that caused a significant decrease in the international number of tourists to Vietnam between May 2014 and December 2015 (see
Figure 2), another dummy variable is used. This variable is 0 outside the period and 1 in the period. Another input is required for this variable.
Considering the input variables, the number of input nodes in the ANN is the number of previous months plus 2, for the dummy variables.
2.2.4. Datasets
The datasets are divided into the training and validation set plus the test set. The training and validation sets are used during the training phase. The training set is used to iteratively adjust the weights of the ANN to minimize the error between the output and the target (real observed volume of international tourists for next month), for all the months used in the training set. The validation set is also utilized during the training stage to evaluate after each iteration if the error in this set still improving, otherwise the training is stopped early to avoid overfitting. The test set is never used during the training stage; it serves only after the training stage to test the system with completely new data that were never seen during the training stage.
Since the final performance of the model depends on the initial values of the weights (randomly initialized), several training sessions for each architecture was performed. The error in the validation set is used to select the best model of each experimented architecture. Finally, the models are tested with the test set to produce the results presented in the next section.
Two approaches are used to divide the datasets. The first strategy is to divide all the datasets in a random way between each set with a proportion of 70%, 10%, and 20% for the training, validation, and test set, respectively. This strategy is denominated as a ‘random test set’. This is a very commonly used strategy when the data are balanced. The second strategy is to use the last months (one year) to the test set, and the months of the last-but-one year for the validation set [
51,
52,
53].
Anyhow, in the case of the number of international tourists along the time, the COVID-19 pandemic triggered a period with strong restrictions to the tourism sector as well as the number of international tourists. This situation caused a non-balanced time with the remaining period of the dataset. All datasets consist of 151 months but only 4 months during this lockdown period plus 2 in the transition period. For the ANN to learn the behaviour of the tourism demand in Vietnam during this period, some months also need to be added to the training set.
Then, the second strategy is modified to guarantee that at least 2 months of this period belong to the test set. This allows the test of the model for this very different period for the tourism demand.
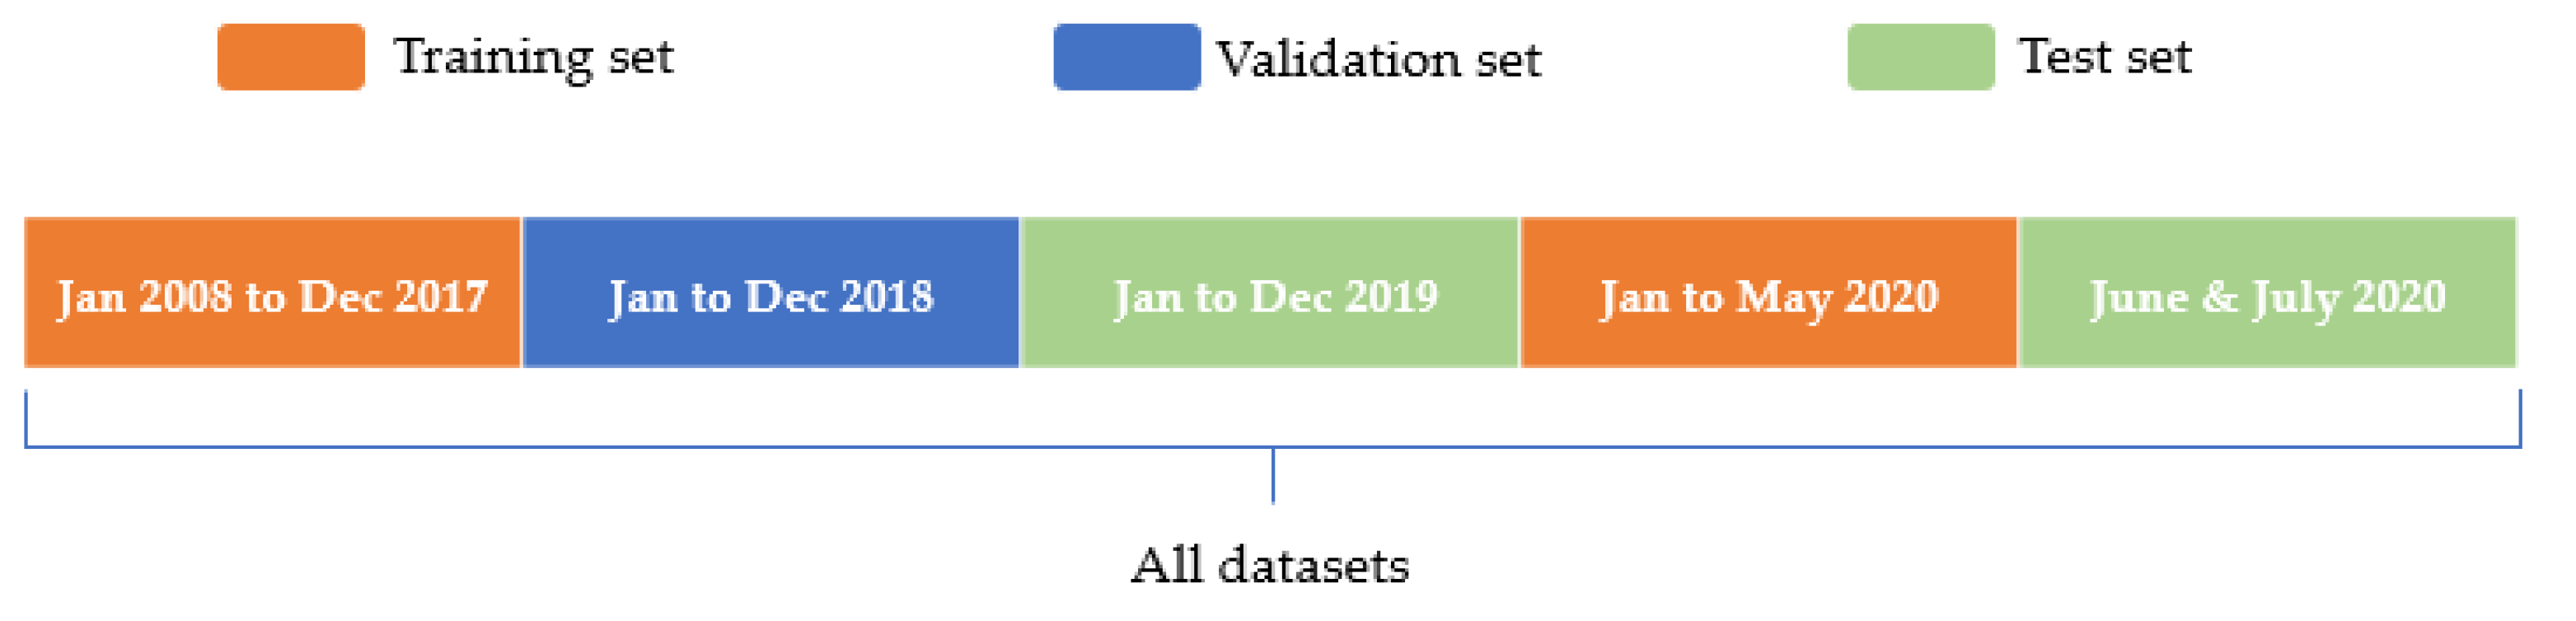
Therefore, the second strategy, denominated as the ‘fixed test set’, includes the data from the beginning of 2008 until December 2017 (plus January to May 2020 (transitions and COVID-19 period)) in the training set, the months from January to December of 2018 in the validation set, and January to December 2019 (plus June to July 2020) in the test set (see
Figure 7).
Finally, a remark to notice that the length of the training dataset is variable according to the number of previous months used in the ANN input. The forecast can be made only for the months after the previous ‘n’ months used in the input.
3. Results
This section presents the results of the most promising ANN models experimented in the study. The mean absolute error (MAE) (Equation (1)), mean absolute percentage error (MAPE) (Equation (2)), and Pearson’s correlation coefficient (
r) present the results of each model applied to the test sets. The MAE gives the magnitude of the average distance of the predicted values to the real values of the monthly number of international tourists to Vietnam. The MAPE gives this error concerning the real values; therefore, it allows a comparison with other models for other regions and countries. The
r mainly evaluates the similarity between the real and forecasted time series.
Table 3 presents the 10 most promising model architectures and results. For each model, the training algorithm, activation functions in hidden and output layers, the number of nodes in the hidden layer, and the previous months delays used in the input are presented. The MAPE, MAE, and
r determined with the forecasted values over the test set are presented for the two strategies (random test set and fixed test set). It can be seen that the best MAPE, MAE, and
r do not always match for the same model; therefore, the selections are based on the best MAPE because they can be compared with other models and are independent of the magnitude of the values of the time series. It should be noted that this magnitude is very different before and after the COVID-19 period.
From the analysis of the results presented in
Table 3, the M5 model has the lower MAPE for the random test set (7.9%), but a very high MAPE for the fixed test set (95.4%). The M10 model presents the lower MAPE for the fixed test set (8.5%) and a very low MAPE for the random test set (9.2%).
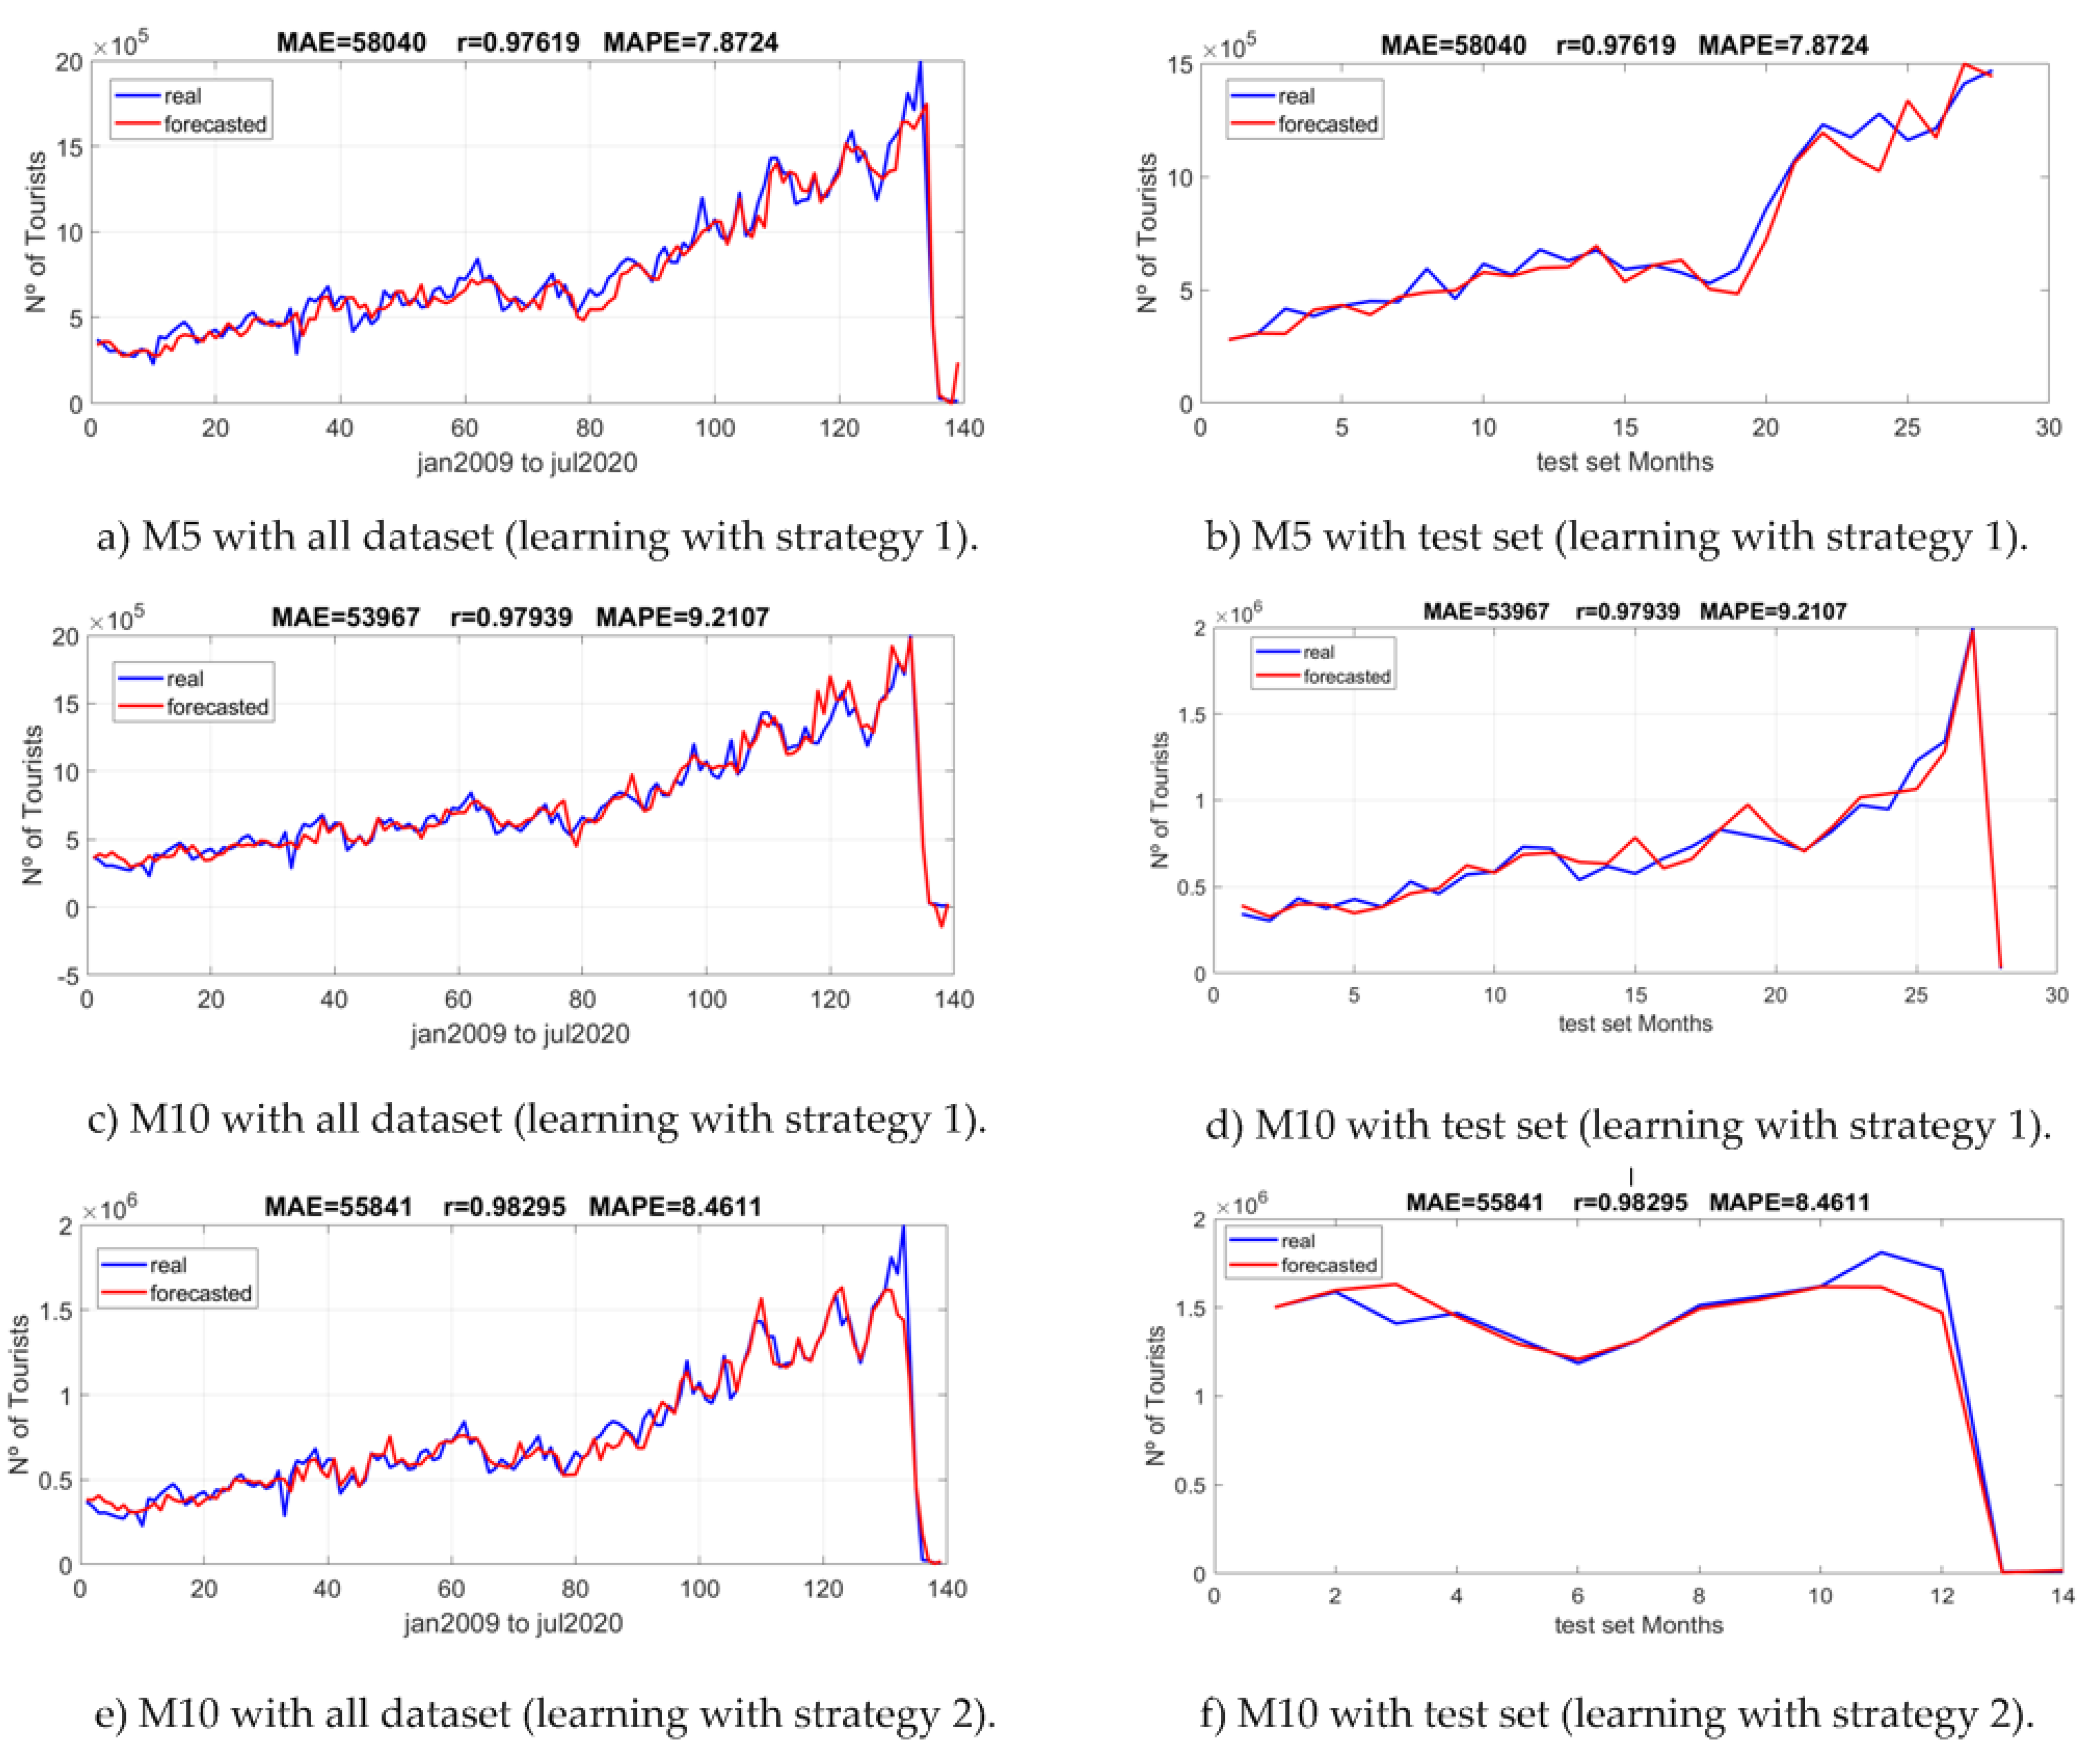
Figure 8a presents the real and predicted values of the monthly number of international tourists for all datasets.
Figure 8b presents the real and predicted values of the monthly number of international tourists only for the months of the random test set. Both use the M5 trained with the dataset of strategy 1 (random sets).
Figure 8c,d present the real and predicted values of the monthly number of international tourists for all datasets and the test set, respectively. Both use the M10 model trained with the dataset of strategy 1 (random sets).
Figure 8e,f present the real and predicted values of the monthly number of international tourists for all datasets and the test set, respectively. Both use the M10 model trained with the dataset of strategy 2 (fixed sets).
4. Discussion
According to the results presented in
Table 3 and analysis of the MAPE, the selected models are the M5 and M10 for each strategy used for the learning process of the model. The M5 and M10 models are similar in their architectures because both have the previous 12 months plus the 2 dummy variables for COVID-19 and South China Sea conflict modulation in the input. Both have a linear function in the output layer, and both use the Levenberg–Marquardt algorithm [
58,
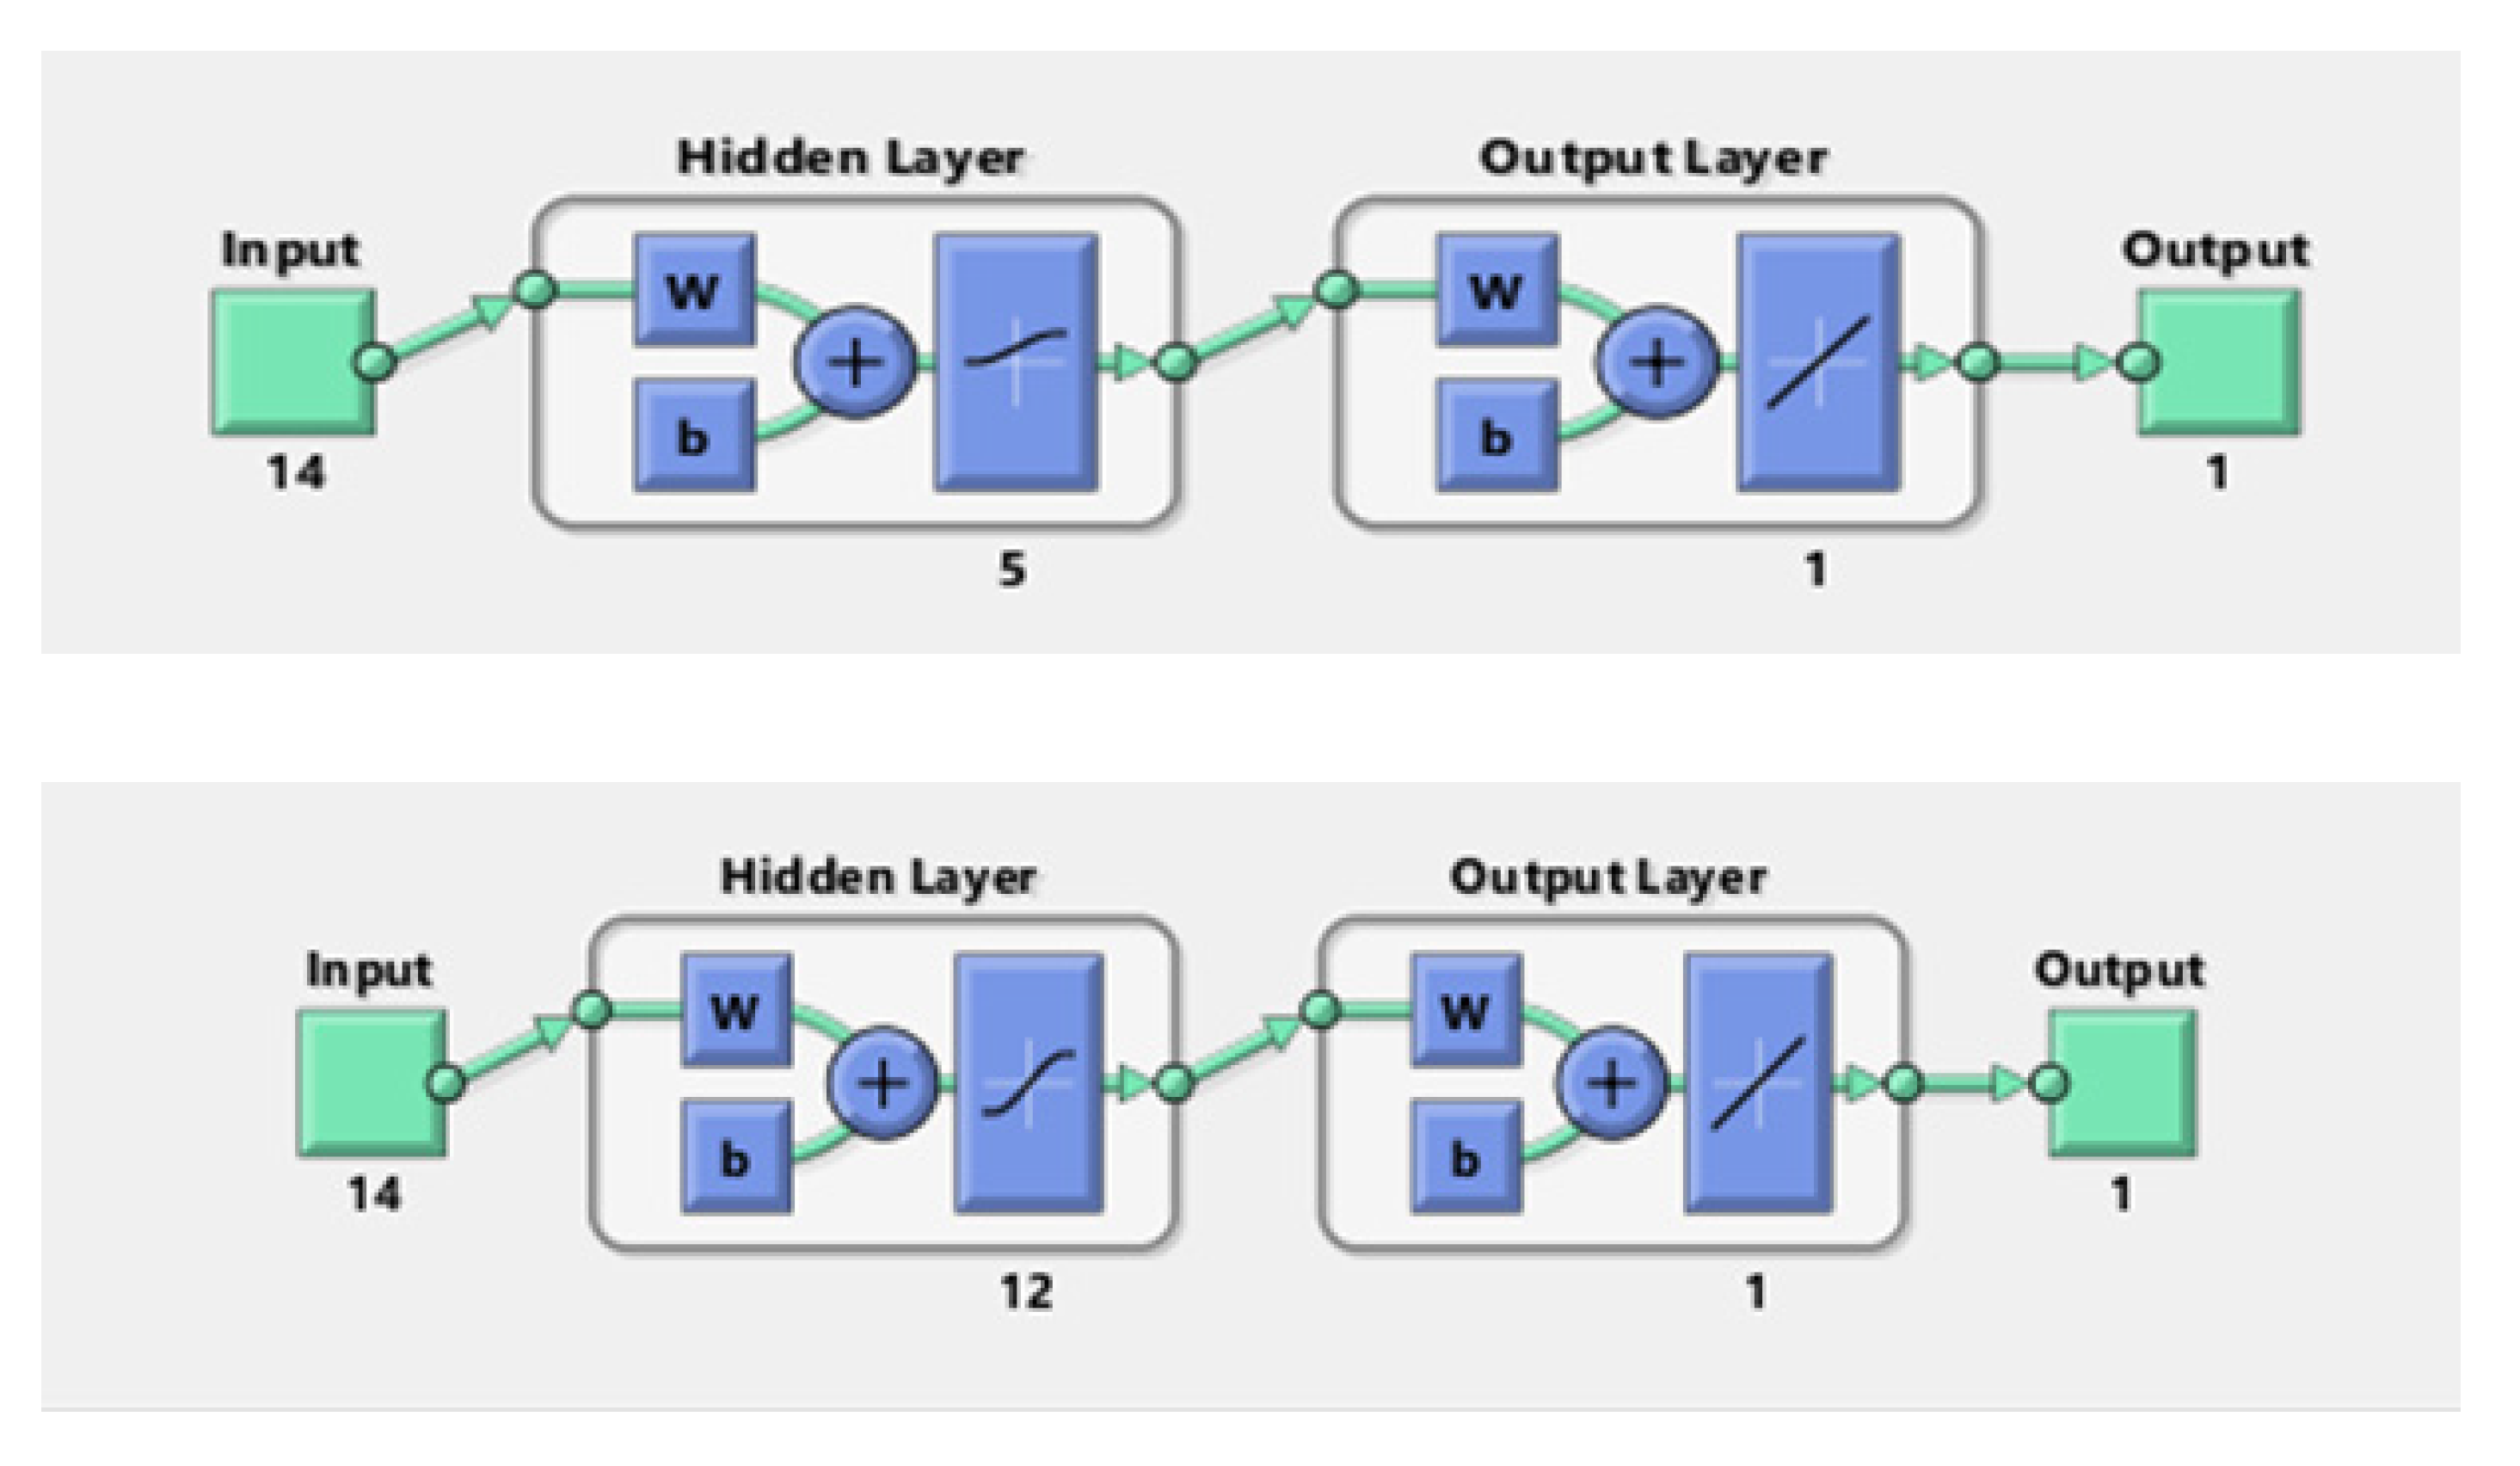
59] for the training procedures. They just diverge in the number of nodes and activation function in the hidden layer. M5 has 5 nodes and the logarithmic transfer function, while M10 has 12 nodes and the tangent hyperbolic transfer function.
Figure 9 shows the architecture of the best models, i.e., M5 and M10.
While M5 presents the lower MAPE for the test set using strategy 1 but a poor MAPE for strategy 2, the M10 model behaves more eclectically in both strategies. M10 gets the lower MAPE with strategy 2 and very low MAPE as well with strategy 1.
M10 gets a MAPE between 8.5% with strategy 2 and 9.2% with strategy 1. The correlation coefficients in both cases are about 0.98 and the MAE between 53 and 56 thousand international tourists per month. Regarding the curves of real and predicted values in
Figure 8, a nice fitting curve between forecasted and real values in both strategies can be seen, considering only the test set or all datasets.
5. Conclusions
Given the significant contribution of the tourism sector to Vietnam’s economy, accurate forecasting of tourism demand serves as a valuable tool for predicting economic growth. Hence, it is important to find a model with a highly predictive capability to forecast the demand of the sector. In this study, various forecasting ANN models were examined with a special focus on international tourists. The datasets of monthly international tourists to Vietnam are collected from January 2008 to December 2020. The paper also includes time series data of pre- and post-COVID-19 pandemics in its analysis. The ANN architectures are based on a multilayer perceptron (MLP) with one hidden layer.
The forecasted number of international tourists is the single output while inputs contain the number of international tourists in previous months varying between 4 to 18 months plus 2 for the dummy variables, namely the COVID-19 pandemic and the South China Sea conflict because these two distress events caused some sharp declines in the number of international tourists to Vietnam.
The datasets are divided according to two strategies: the random test set and the fixed test set. With respect to the random test set, the training, validation, and test set have a proportion of 70%, 10%, and 20% of all datasets, respectively, while according to the second approach, the test set includes data of last months (one year) and validation set contains the months of the last-but-one year.
The number of nodes in the hidden layer varies between 2 and 20 in several experimental simulations. The activation functions in the hidden and output layer include the tangent hyperbolic transfer function, the logarithmic sigmoid transfer function, the Elliot symmetric sigmoid transfer function, and the linear transfer function. In the training stage, experimented back-propagation algorithms include the Levenberg–Marquardt algorithm, the resilient backpropagation algorithm, the conjugate gradient backpropagation with Fletcher–Reeves updates, and the Bayesian regularization backpropagation algorithm.
There are two most well-performed models out of the 10 most promising ones, i.e., M5 and M10. The M5 model produces the lowest MAPE for the random test set (7.9%) but very high MAPE for the fixed test set (95.4%), while the M10 model shows very low MAPE in both learning strategies with MAPE = 8.5% and r = 0.983 for the fixed test set and 9.2% and 0.979, respectively, for the random test set. Therefore, the M10 model is the best performer in the study. The best architecture for the reference datasets is achieved by using inputs of the previous 12 months with two dummy variables, a linear function in the output layer, the Levenberg–Marquardt algorithm for training procedure, 12 nodes, and the tangent hyperbolic transfer function.
The outputs presented in
Figure 8 confirm the forecasting competence of the MLP ANN model for the tourism time series in Vietnam. This result is consistent with various research findings in different countries mentioned in the methodology section. Given the limited number of studies on forecasting tourism demand in Vietnam using the ANN approach, the contribution of the research is to fill this gap. In addition, the research provides policymakers and business managers in Vietnam with a useful instrument for planning tourism activities. Having suffered extreme losses due to the border closure for almost two years, the Vietnamese government and tourism businesses need accurate estimations of future demand to make vital decisions regarding pricing strategies, promotions, operations, and management, in order to gain full benefits out of their limited resources while keeping the sector sustainable. The recovery of tourism is more likely to create favourable effects on relevant sectors, which is expected to contribute significantly to the revival of the whole economy.
However, the study has some limitations. The modelling process is based mainly on historical observations collected before the COVID-19 outbreak. The data relating to the full lockdown and recovery period were not captured by the model developed in this study because, similar to other countries, Vietnam suspended the entrance for international tourists since March 2020. Therefore, the model can merely capture the past behaviour of tourists under normal circumstances while it is more likely that the behaviour would change considerably after the extreme period of COVID-19. New factors could have strong impacts on travel decisions, namely the restrictions and precautions that tourists must take while travelling. The rules on quarantining for 14 days; the limited choices of transports and accommodations; and the restricted access to tourist attractions, restaurants, and entertainment activities probably discourage tourists to visit the country.
According to the latest report from Worldometers, the total number of COVID-19 infected cases per 1 million people and the total deaths per 1 million people in Vietnam are rather low as the country ranks 151 and 133, respectively, out of 221 reported countries and territories [
62]. In early October 2021, the government of Vietnam announced a plan to reopen major tourist destinations to vaccinated tourists from countries with a low risk of COVID-19 from December 2021. It is expected that the number of international tourist arrivals in Vietnam will increase again and reach the pre-pandemic level in the next few years. Considering the post-pandemic outlook of tourism in Vietnam and the requirement for newly updated observations for ANN models to achieve adequately accurate predictions, an improvement in the ANN models in future research by using larger datasets on inbound tourism is recommended, including new data to be collected during the COVID-19 lockdown and recovery period. The improved model would facilitate all stakeholders in the sector to provide forward realistic action plans in order to efficiently utilise their depleted budgets while fully capturing the opportunity once Vietnam is entirely open for travel and tourism.


