Article

Cleaner Technology and Natural Resource Management: An Environmental Sustainability Perspective from China

1
Department of Economics, The University of Haripur, Haripur 22620, Pakistan
2
Department of Management Sciences, Abbottabad Campus, COMSATS University Islamabad, Abbottabad 22060, Pakistan
3
Faculty of Management, Czestochowa University of Technology, 42-200 Czestochowa, Poland
4
Industrial Engineering and Management, Lappeenranta-Lahti University of Technology LUT, P.O. Box 20, FI-53851 Lappeenranta, Finland
5
Department of Business Administration, Multan Campus, Air University, Multan 60650, Pakistan
6
Department of Economics, Government Post Graduate College Mansehra, Mansehra 21300, Khyber Pakhtunkhwa, Pakistan
*
Authors to whom correspondence should be addressed.
Clean Technol. 2022, 4(3), 584-606; https://doi.org/10.3390/cleantechnol4030036
Submission received: 8 May 2022 / Revised: 15 June 2022 / Accepted: 17 June 2022 / Published: 28 June 2022

Abstract

:
In economies, cleaner technology, increased demand for renewable energy, and more efficient use of natural resources contribute to meeting environmental sustainability targets. The Chinese economy is no exception in its attempts to conserve economic and natural resources via collaborative efforts to embrace cleaner technology, green energy sources, and resource conservation management to preserve resources for future generations. This research examines the influence of cleaner technologies, green energy sources, and natural resource management on reducing greenhouse gas emissions using quarterly data for the Chinese economy from 2000Q1 to 2020Q4. The findings demonstrate that increasing demand for green energy reduces greenhouse gas emissions, hence substantiating the premise of ‘green is clean’ energy development. Additionally, optimum resource usage enhances environmental quality, corroborating the ‘resource cleaner blessing’ hypothesis. The positive link between inward foreign direct investment and greenhouse gas emissions substantiates the ‘pollution haven’ concept, according to which inward foreign direct investment uses unsustainable technology in manufacturing processes, hence degrading air quality indicators. Inadequate access to clean cooking technology and increased population density has a detrimental effect on the country’s environmental sustainability agenda, which must be corrected via sustainable regulations. The causality estimates show the feedback relationship between renewable energy demand (and economic growth) and cleaner technology, between economic growth and green energy (and inbound foreign direct investment), and between population density and economic growth (and green energy). The Impulse Response function estimates suggested that economic growth and population density would likely increase GHG emissions. In contrast, cleaner technology, green energy demand, natural resource management, and inbound foreign direct investment would likely decrease greenhouse gas emissions for the next ten-year time period. The sustainability of the environment and natural resources in China is bolstered by developing cleaner technologies, a greater reliance on renewable energy sources, and better management of natural resources.

1. Introduction

Energy consumption is the most consistent indicator of a developing country’s progress toward a higher quality of life. Additionally, it has been observed that although renewable energy consumption is required for a sustainable environment, transitioning from non-renewable to renewable energy is very difficult due to extremely high costs, operational and start-up costs, and several other barriers to adoption. As a result, a well-developed financial system is required to finance and handle these difficulties. As a result, nations with a sound renewable energy industry need a secure financial system [1]. Financial development is critical for stimulating technical innovation and reducing our environmental imprint. Financial growth has a variety of effects on environmental quality. It subsidizes companies that increase trash creation and energy use. Additionally, it increases consumers’ buying power, causing them to seek more energy-intensive items, resulting in larger environmental footprints. Sponsoring initiatives that offer new technical advances reduce energy use and benefit ecological innovations [2]. Financial development stimulates Research and Development (R&D) in greener technology and alternative energy sources. Nowadays, governments promote green funding in order to avert environmental degradation. Green finance advocates for a new financial model that stimulates growth and protects the environment. Green finance is another strategy for environmental protection since it provides low-interest loans to businesses that adopt greener technology [3]. According to the Global Footprint Network, China has the world’s largest overall ecological footprint. Increased financial growth stimulates foreign investment and facilitates consumption, resulting in increased reliance on non-renewable energy sources, severe loss of natural resources, and deforestation, among other consequences. This contributes to China’s precarious status, destabilizes its ecosystem, and results in larger ecological footprints [4]. Economic growth, financial progress, energy use, and environmental quality are inextricably linked [5]. China’s financial growth has accelerated over the last decade, and the country has emerged as a worldwide power in terms of financial market development. This may result in green investment and sustainable growth in China [6]. As a result, one of China’s primary aims is to boost its renewable energy consumption, which results in financial growth [7].
Increased economic activity results in increased resource exploitation, fossil fuel use, and significant environmental degradation. Green technical advances are essential to solve these concerns and have become an inevitable option for China. The Chinese government has recently implemented several measures to tackle pollution [8]. Since 2013, China has ranked second in terms of R&D spending. In 2019, China spent USD 83.4 billion on clean energy research and development, putting it in first place globally for clean energy investment [9]. To combat environmental deterioration, it recently issued green bonds and tax-exempted them in order to increase the country’s green investment ratio. Additionally, China’s green bond financing banks have announced their intention to incorporate clean local technology to boost renewable energy and green investment [10,11]. Renewable energy is critical for China’s goal of developing a secure and clean, low-carbon energy system [12]. Carbon dioxide emissions from energy are the primary source of greenhouse gas emissions. Following the industrial revolution, fossil fuel usage skyrocketed. As a result, lowering greenhouse gas emissions and sustaining economic growth while using less non-renewable energy has become a global problem [13]. Regardless of the fact that China has made several attempts to minimize pollution and boost its use of renewable energy, fossil fuel energy consumption remains a dominating source of energy, accounting for about 70% of total energy consumption. As a result, China is confronted with significant environmental issues [14]. Since 2011, China has surpassed the United States as the largest CO2 emitter. China used nearly one-fourth of the world’s primary energy in 2018, totaling 3273.5 million tons. China has recently implemented several initiatives to reduce its carbon emissions and achieve carbon neutrality by 2060 [15].
Economic development benefits nations through raising living standards, reducing poverty, and developing infrastructure. Meanwhile, they make environmental sacrifices due to overexploitation of natural resources [16]. Natural resources promote pollution throughout the manufacturing process, increasing carbon dioxide emissions [17]. Environmental degradation and economic development are inextricably linked in two ways. First, natural resource exploitation increased in tandem with economic expansion. Excessive resource extraction as a result of rapid industrialization, urbanization, mining, and deforestation results in high carbon emissions. Proper regulations governing the exploitation of limited resources contribute to preserving a clean and safe environment. Technological advancements and stringent legislative procedures help to minimize ecological footprints [18]. Second, the consumption of natural resources in many areas of the economy, such as mining, deforestation, industrialization, and agriculture, accelerates carbon emissions. Economic growth accelerates natural resource exploitation, resulting in increased environmental damage. Strict management strategies reduce carbon emissions associated with natural resource depletion and exploitation [19].
The following research questions have evolved from the conversation. First, does access to clean fuel technology in cooking contribute to achieving the healthcare sustainability goal and the reduction of GHG emissions? The subject is critical because insufficient access to clean fuel technology results in increased health degradation and consequent environmental deterioration. Second, does increased demand for renewable energy and protection of natural resources contribute to the achievement of the green development agenda? Renewable energy demand is critical for mitigating amplified GHG emissions since it is carbon-neutral. On one hand, natural resource management enables the restoration of resources for future generations. At the same time, their depletion results in an increase in the quantity of carbon dioxide emitted into the atmosphere. Finally, is foreign FDI and increased population density jeopardizing economic and natural resource preservation? Responsible production and consumption are critical components of reducing dirty production and substituting cleaner production, while increased population density depletes economic and environmental resources; hence, these concerns should be addressed in the agenda for sustainable development. The following study aims are set in the framework of sound policymaking in the Chinese economy, i.e.,
(i)
To evaluate the role of cleaner technologies in reducing GHG emissions to achieve a green development agenda.
(ii)
To investigate the effect of renewable energy demand and natural resource management in enhancing environmental quality, and
(iii)
To support the pollution haven/halo concept and population-related emissions in a nation.
The pollution haven effect shows the relocation of polluting enterprises to regions with less rigorous environmental requirements whereas pollution halo effect contends that multinational corporations convey their greener technologies to the host country via FDI. Thus, both the concepts are important for assessing an environmental sustainability agenda in a given country context. The stated goals of the research were analyzed using advanced statistical methods to arrive at some policy recommendations.

1.1. Literature Review

Green technical developments are the most effective means of achieving a sustainable environment since they contribute to carbon reduction and provide sustainable production and consumption possibilities. Khan and Majeed [20] investigated the decoupling of carbon emissions and economic development in the Association of Southeast Asian Nations (ASEAN) nations at both the national and regional levels. The findings suggested that a country’s energy structure, affluence, and population are significant variables limiting the decoupling process and contributing to carbon emission. Carbon and energy intensities amplify the decoupling effect and help nations achieve an emission-free territory. It has been recommended that ASEAN member states develop and execute environmental policies on a national and regional level. Additionally, the usage of renewable energy should be encouraged. Hastuti et al. [21] used an input-output paradigm at the sectoral level in Indonesia to deconstruct variations in CO2 emissions between 1990 and 1995 and 2010 and 2015. Six elements have been recognized as contributing to changes in emissions: technology, energy intensity, demand structure, carbonization, ultimate demand, and consumer allocation patterns. According to the findings, a rise in economic activity or a scaled impact leads to increased emissions throughout both time frames. Meanwhile, carbon emissions surged fourfold between 2010 and 2015, even though the scale impact is diminishing and replaced by other variables such as technology, energy intensity, and demand structure. Diversification and efficiency improvements in primary energy seemed detrimental between 2010 and 2015. The Indonesian government has been urged to develop energy efficiency regulations in critical sectors such as mining, chemical, plastic, and rubber. Chakraborty and Mazzanti [22] examined the relationship between green energy innovation technologies and energy intensity in twenty-one OECD nations from 1975 to 2014. Relationships between short-run and long-run outcomes are estimated. The results indicate no Granger causality between energy intensity and green energy innovation; this might be attributable to country heterogeneity since the influence of green technology innovation is not uniform throughout the OECD. AsR&D investment is insufficient in certain nations, it is recommended that those nations spend to achieve the positive green technology energy aim. Gu et al. [23] examined the relationship between energy technical advancement, energy consumption, and carbon emissions in China from 2005 to 2016, utilizing data from 30 provinces. There is an inverted U-shaped link between energy technical advancement and carbon emissions. Additionally, energy consumption has an inverted U-shaped connection with carbon emissions during technological advancement. These findings vary by area. The findings recommended that Chinese policymakers prioritize long-term energy advancement investments and increase the sustainability of research and development. Koçak and Ulucak [24] examined the impact of energy research and development spending on carbon emissions in 19 high-income OECD nations from 2003 to 2015. The findings indicate that fossil fuels and energy research and development expenditures for energy efficiency have a growing effect on carbon emissions. At the same time, spending on research and development has no discernible effect on CO2 emissions. To minimize carbon emissions, rules and incentives should be developed to encourage the use of renewable energy. The study’s first and second hypotheses are as follows:
H1.
Access to cleaner technology is anticipated to reduce GHG emissions, hence assisting in the achievement of the healthcare sustainability goal.
H2.
It is expected that expanding renewable energy sources in the national energy system would enhance environmental quality.
Anser et al. [25] examined the importance of food production, knowledge transfer, and demand for renewable energy in reducing carbon emissions in 132 countries from 1995 to 2018. The findings substantiate an inverted U-shaped link between knowledge spillover and carbon emissions. Increased trade openness and foreign direct investment enhance carbon emissions and validate the pollution haven hypothesis’s reality. Additionally, the strong correlation between food production and CO2 emissions supports the existence of food footprints. Additionally, the data indicate a negative correlation between renewable energy and carbon emissions, indicating the need for cleaner manufacturing processes. Gu and Zhou [26] examined the effects of energy investment on emission reduction in China and other Belt and Road partner countries. If China boosts its investment in renewable energy generation in Belt and Road nations, it will help them improve their energy security and contribute to environmental and human survival. Godil et al. [27] examined the link between energy consumption, R&D, financial growth, globalization, and institutional quality in India from 1995 to 2018. The Quantile Autoregressive Distributed Lag (QARDL) method reveals that all of these factors substantially affect energy use. Energy usage is negatively correlated with institutional quality and research and development. In comparison, financial growth and globalization have a beneficial effect on India’s energy use. It has been argued that Indian policymakers should implement policies that encourage the use of renewable energy sources via improved institutional quality. Natural resources are essential in determining environmental quality since they assist in building the economy and provide basic human needs. However, the literature demonstrates that it has positive and negative ties to the environment. Balsalobre-Lorente et al. [28] examined the relationship between natural resources, economic growth, renewable energy, and carbon emissions in the five European Union member countries from 1985 to 2016. The findings show an N-shaped link between carbon emissions and economic development in these nations. Consumption of renewable energy and the richness of natural resources contribute to CO2 reduction. In contrast, trade liberalization, renewable energy and economic expansion wreak havoc on the environment. Renewable energy and energy innovation are necessary to safeguard the environment’s quality. Danish et al. [29] used yearly panel data from 1990 to 2015 to evaluate the influence of economic development, natural resource availability, and renewable energy on carbon emissions in BRICS nations. The findings establish the presence of a Kuznets Curve in the environment in South Africa, China, Brazil, and Russia. The richness of natural resources and renewable energy assist in minimizing carbon emissions. Kwakwa et al. [30] used the STIRPAT model to assess the influence of natural resource exploitation on carbon dioxide emissions and energy consumption in Ghana from 1971 to 2013. The ARDL findings indicate that although natural resource exploitation and urbanization increases carbon emissions, government development aid decreases them. On the other side, natural resource exploitation and income levels contribute to the country’s energy consumption. It has been urged that extractive operations be monitored and appropriate environmental protection legislation be enacted. The third and fourth hypotheses of the research are as follows:
H3.
Increased resource exploitation will wreak havoc on the natural ecosystem and worsen GHG emissions.
H4.
Increased incoming FDI and rapid population increase will degrade environmental quality.
The earlier literature evaluation on global green development agendas is shown in Table 1.
The more recent literature argued that a green business perspective contributes to sustained natural resource usage, hence advancing sustainable development [50]. The natural resource capital is essential for economic sustainability, as it provides natural resources as inputs to the manufacturing sector while promoting environmentally responsible production [51]. Environmental globalization is the period in which the global community’s actions must become clean and green [52], while cleaner energy is the optimal means of achieving sustainable objectives [53].

1.2. Contribution of the Study

According to the cited literature, the study made several contributions. First, it used a direct measure of cleaner technology (i.e., access to clean fuel technology for cooking) rather than creating an index of various factors that were not persuasive in capturing its full implication in the pollution damage function [54,55]. Second, instead of utilizing energy consumption as a factor, the research employed renewable energy consumption as the primary regressor, establishing a direct relationship between it and environmental protection and assisting in achieving the carbon neutrality objective [56,57]. Third, prior research examined the resource curse hypothesis primarily about a country’s per capita income [54,55]. In contrast, the current study used mineral resource rents as the primary predictor in the pollution function to assess the ‘resource curse emissions’ hypothesis. Finally, inbound foreign direct investment and population density were utilized to test the pollution haven/halo hypothesis and population-associated emissions in a nation.
After the Introduction section, Materials and Methods are presented in Section 2. Results are shown in Section 3. Discussion is presented in Section 4. The final section concludes the study with some generalized policy implications.

2. Materials and Methods

The study used GHG emissions (kiloton of carbon equivalent, denoted by GHG) as the response variable of the study. The remaining explanatory variables used in the study, i.e., access to clean fuels and technologies for cooking (% of population, denoted by CTECH), renewable energy consumption (% of total final energy consumption, denoted by REC), mineral rents (% of GDP) used as a proxy for natural resource in the study (denoted by NR), GDP per capita (constant 2015 USD, denoted by GDPPC), inbound FDI (% of GDP, denoted by FDI), and population density (people per sq. km of land area, denoted by PDEN). The study converted time series data into quarter data for the Chinese economy, i.e., 2000Q1 to 2020Q4 to increase the number of observations that helps to obtainsound statistical results because of an increase in the degree of freedom. The data is obtained from the World Bank [58] database.
The study used the IPAT equation as a base line modeling framework of the study, i.e.,
I = β0 + β1(P) + β2(A) + β3(T) + ε1
where ‘I’ show emissions intensity, ‘P’ shows population growth, ‘A’ shows affluent, ‘T’ shows technology, and ε shows error term.
It is expected that higher emissions are caused by massive population growth, unsustainable economic development, and conventional technology used. Hence, the study extended the given Equation (1) by more diverse factors that help to minimize emissions intensity and achieving zero carbon emissions level, i.e.,
GHG = β 0 + β 1 PDEN + β 2 GDPPC + β 3 FDI + β 4 NR + β 5 REC + β 6 CTECH + ε 2
where GHG shows GHG emissions, PDEN shows population density, GDPPC shows GDP per capita, FDI shows inbound FDI, NR shows natural resource rents, REC shows renewable energy consumption, and CTECH shows clean technologies.
The choice of the variables mainly based on Equation (1) expanded the IPAT equation by substituting ‘GHG’ emissions for ‘I’ emissions when the world average temperature exceeds, owing to a massive rise in GHG emissions into the atmosphere. Additionally, ‘P’ is substituted by ‘PDEN’ because huge population density depletes economic and environmental resources and exacerbates GHG emissions due to irresponsible production and consumption. ‘A’ is substituted for two variables, namely ‘GDPPC’ and ‘FDI’. As a result of ongoing economic expansion and inbound FDI, GHG emissions are anticipated to rise. The letter ‘T’ is substituted for ‘CTECH,’ since access to clean technologies is anticipated to reduce GHG emissions. Finally, the research introduced two additional variables, ‘REC’ and ‘NR’, to account for the fact that green energy sources and efficient use of natural resources are expected to enhance the indicatorsof environmental quality. As a result, the research employs Equation (2) as a testable equation.
The research employed the Robust Least Squares (RLS) estimator to carefully handle any outliers in both the dependent and independent variables in Equation (2). The research employed a dynamic RLS estimator to incorporate the dependent variable’s initial lagged value as a regressor to capture the temporal variation component in the proposed model. Before doing the aforementioned regression, it is necessary to conduct pre-requisite tests such as leverage plots and impact statistics. The former checks for discontinuities in the regressor, while the latter shows the number of discontinuities in the given model. Huber [59] developed the M-estimator to manage the residual’s size divergence from its actual size. The basic idea is that discontinuities in likely response variables result in a bigger change in residual size, which deviates from the actual norm. Influence statistics may aid in identifying discontinuities in response variables. It corrects structural discontinuities in regressors with high leverage in the data series [60]. As a result, it is repaired. Yohai [61] combined the M- and S-estimators to account for discontinuities in endogenous and exogenous variables. After obtaining RLS estimates, the study used a Granger causality test, an IRF, and a VDA technique (VDA). The former test determines if the explanatory factors affect the response variable positively or negatively. The latter test reveals the amount of the influencing response variable across time. Equations (3) and (4) illustrate Granger causality patterns, while Equation (5) illustrates the VDA estimates in the innovation accounting matrix equation. Granger causality tests are conducted using the VAR technique, i.e.,
[ ln (GHG) t ln (CTECH) t ln (REC) t ln (NR) t ln (GDPPC) t ln (FDI) t ln (PDEN) t ] = [ τ 0 τ 1 τ 2 τ 3 τ 4 τ 5 τ 6 ] + i = 1 p [ σ 11 t σ 12 t σ 13 t σ 14 t σ 15 t σ 21 t σ 22 t σ 23 t σ 24 t σ 25 t σ 31 t σ 32 t σ 33 t σ 34 t σ 35 t σ 41 t σ 42 t σ 43 t σ 44 t σ 45 t σ 51 t σ 52 t σ 53 t σ 54 t σ 55 t σ 61 t σ 62 t σ 63 t σ 64 t σ 65 t σ 71 t σ 72 t σ 73 t σ 74 t σ 75 t ] × [ ln (GHG) t 1 ln (CTECH) t 1 ln (REC) t 1 ln (NR) t 1 ln (GDPPC) t 1 ln (FDI) t 1 ln (PDEN) t 1 ] + j = p + 1 d max [ θ 11 j θ 12 j θ 13 j θ 14 j θ 15 j θ 21 j θ 22 j θ 23 j θ 24 j θ 25 j θ 31 j θ 32 j θ 33 j θ 34 j θ 35 j θ 41 j θ 42 j θ 43 j θ 44 j θ 45 j θ 51 j θ 52 j θ 53 j θ 54 j θ 55 j θ 61 j θ 62 j θ 63 j θ 64 j θ 65 j θ 71 j θ 72 j θ 73 j θ 74 j θ 75 j ] × [ ln (GHG) t j ln (CTECH) t j ln (REC) t j ln (NR) t j ln (GDPPC) t j ln (FDI) t j ln PDEN t j ] + [ ε 1 ε 2 ε 3 ε 4 ε 5 ε 6 ε 7 ]
Equation (3) is simplified by using VAR(4) model due to quarter data used in the given model, i.e.,
GH G t = c 1 + i = 1 4 β 1 GHG t i + i = 1 4 β 2 CTEC H t i + i = 1 4 β 3 RE C t i + i = 1 4 β 4 N R t i + i = 1 4 β 5 GDPP C t i + i = 1 2 β 6 FD I t i + i = 1 2 β 6 PDEN t i + ε 1 CTEC H t = c 1 + i = 1 4 β 1 CTECH t i + i = 1 4 β 2 GH G t i + i = 1 4 β 3 RE C t i + i = 1 4 β 4 N R t i + i = 1 4 β 5 GDPP C t i + i = 1 2 β 6 FD I t i + i = 1 2 β 6 PDEN t i + ε 2 RE C t = c 1 + i = 1 4 β 1 REC t i + i = 1 4 β 2 CTEC H t i + i = 1 4 β 3 GH G t i + i = 1 4 β 4 N R t i + i = 1 4 β 5 GDPP C t i + i = 1 2 β 6 FDI t i + i = 1 2 β 6 FPDEN t i + ε 3 N R t = c 1 + i = 1 4 β 1 NR t i + i = 1 4 β 2 CTEC H t i + i = 1 4 β 3 RE C t i + i = 1 4 β 4 GH G t i + i = 1 4 β 5 GDPP C t i + i = 1 2 β 6 FDI t i + i = 1 2 β 6 FPDEN t i + ε 4 GDPP C t = c 1 + i = 1 4 β 1 GDPPC t i + i = 1 4 β 2 CTEC H t i + i = 1 4 β 3 RE C t i + i = 1 4 β 4 N R t i + i = 1 4 β 5 GH G t i + i = 1 2 β 6 FDI t i + i = 1 2 β 6 PDEN t i + ε 5 FD I t = c 1 + i = 1 4 β 1 FDI t i + i = 1 4 β 2 CTEC H t i + i = 1 4 β 3 RE C t i + i = 1 4 β 4 N R t i + i = 1 4 β 5 GDPP C t i + i = 1 2 β 6 GHG t i + i = 1 2 β 6 PDEN t i + ε 6 PDE N t = c 1 + i = 1 4 β 1 PDEN t i + i = 1 4 β 2 CTEC H t i + i = 1 4 β 3 RE C t i + i = 1 4 β 4 N R t i + i = 1 4 β 5 GDPP C t i + i = 1 2 β 6 FDI t i + i = 1 2 β 6 GHG t i + ε 7
where GHG shows greenhouse gas emissions, CTECH shows clean technology, REC shows renewable energy consumption, NR shows natural resources, GDPPC shows GDP per capita, FDI shows inbound FDI, PDEN shows population density, ‘t − i’ show lagged of the time periods, and ƹ shows error term.
Equation (5) shows the VDA illustration, i.e.,
Var ( σ ( GHG , CTECH , REC , NR , GDPPC , FDI , PDEN ) = Var ( E [ σ CTECH , REC , NR , GDPPC , FDI , PDEN ] ) + E [ Var ( σ CTECH , REC , NR , GDPPC , FDI , PDEN ) ]
Equation (5) shows the variance error shocks pertaining to the regressors in the multivariate framework which would be assessed over the period of the next ten years.

3. Results

The variables’ descriptive statistics are shown in Table 2. The least amount of GFH emissions is 4,597,430 kt of carbon equivalent, the greatest amount is 12,355,240 kt, and the average amount is 9,411,779 kt. The average value of access to clean fuel technologies for cooking is 57.714% of the population, indicating that more than 40% of the people in a nation do not use clean fuel technologies. Renewable energy consumption accounts for a maximum of 29.603% of total energy consumption, demonstrating the country’s commitment and efforts to reduce GHG emissions via cleaner energy in manufacturing. Mineral resource rents, inbound FDI, per capita income, and population density, on average, are 0.754% of GDP, 3.001% of GDP, USD 5858.718 per sq. km of land area, and 142.206 per sq. km of land area, respectively.
The correlation matrix in Table 3 demonstrates that demand for renewable energy and inbound FDI is inversely correlated with GHG emissions, confirming the cleaner energy demand and pollution halo hypothesis in a nation. Cleaner technology, natural resource rents, economic growth, and population density positively correlate with GHG emissions. A country’s insufficient access to clean cooking technology, excessive resource extraction, unsustainable economic growth, and massive population jeopardy to the natural environment contributed to a country’s escalation of GHG emissions. The ultimate solution to achieving the carbon neutrality target would be effective environmental rules.
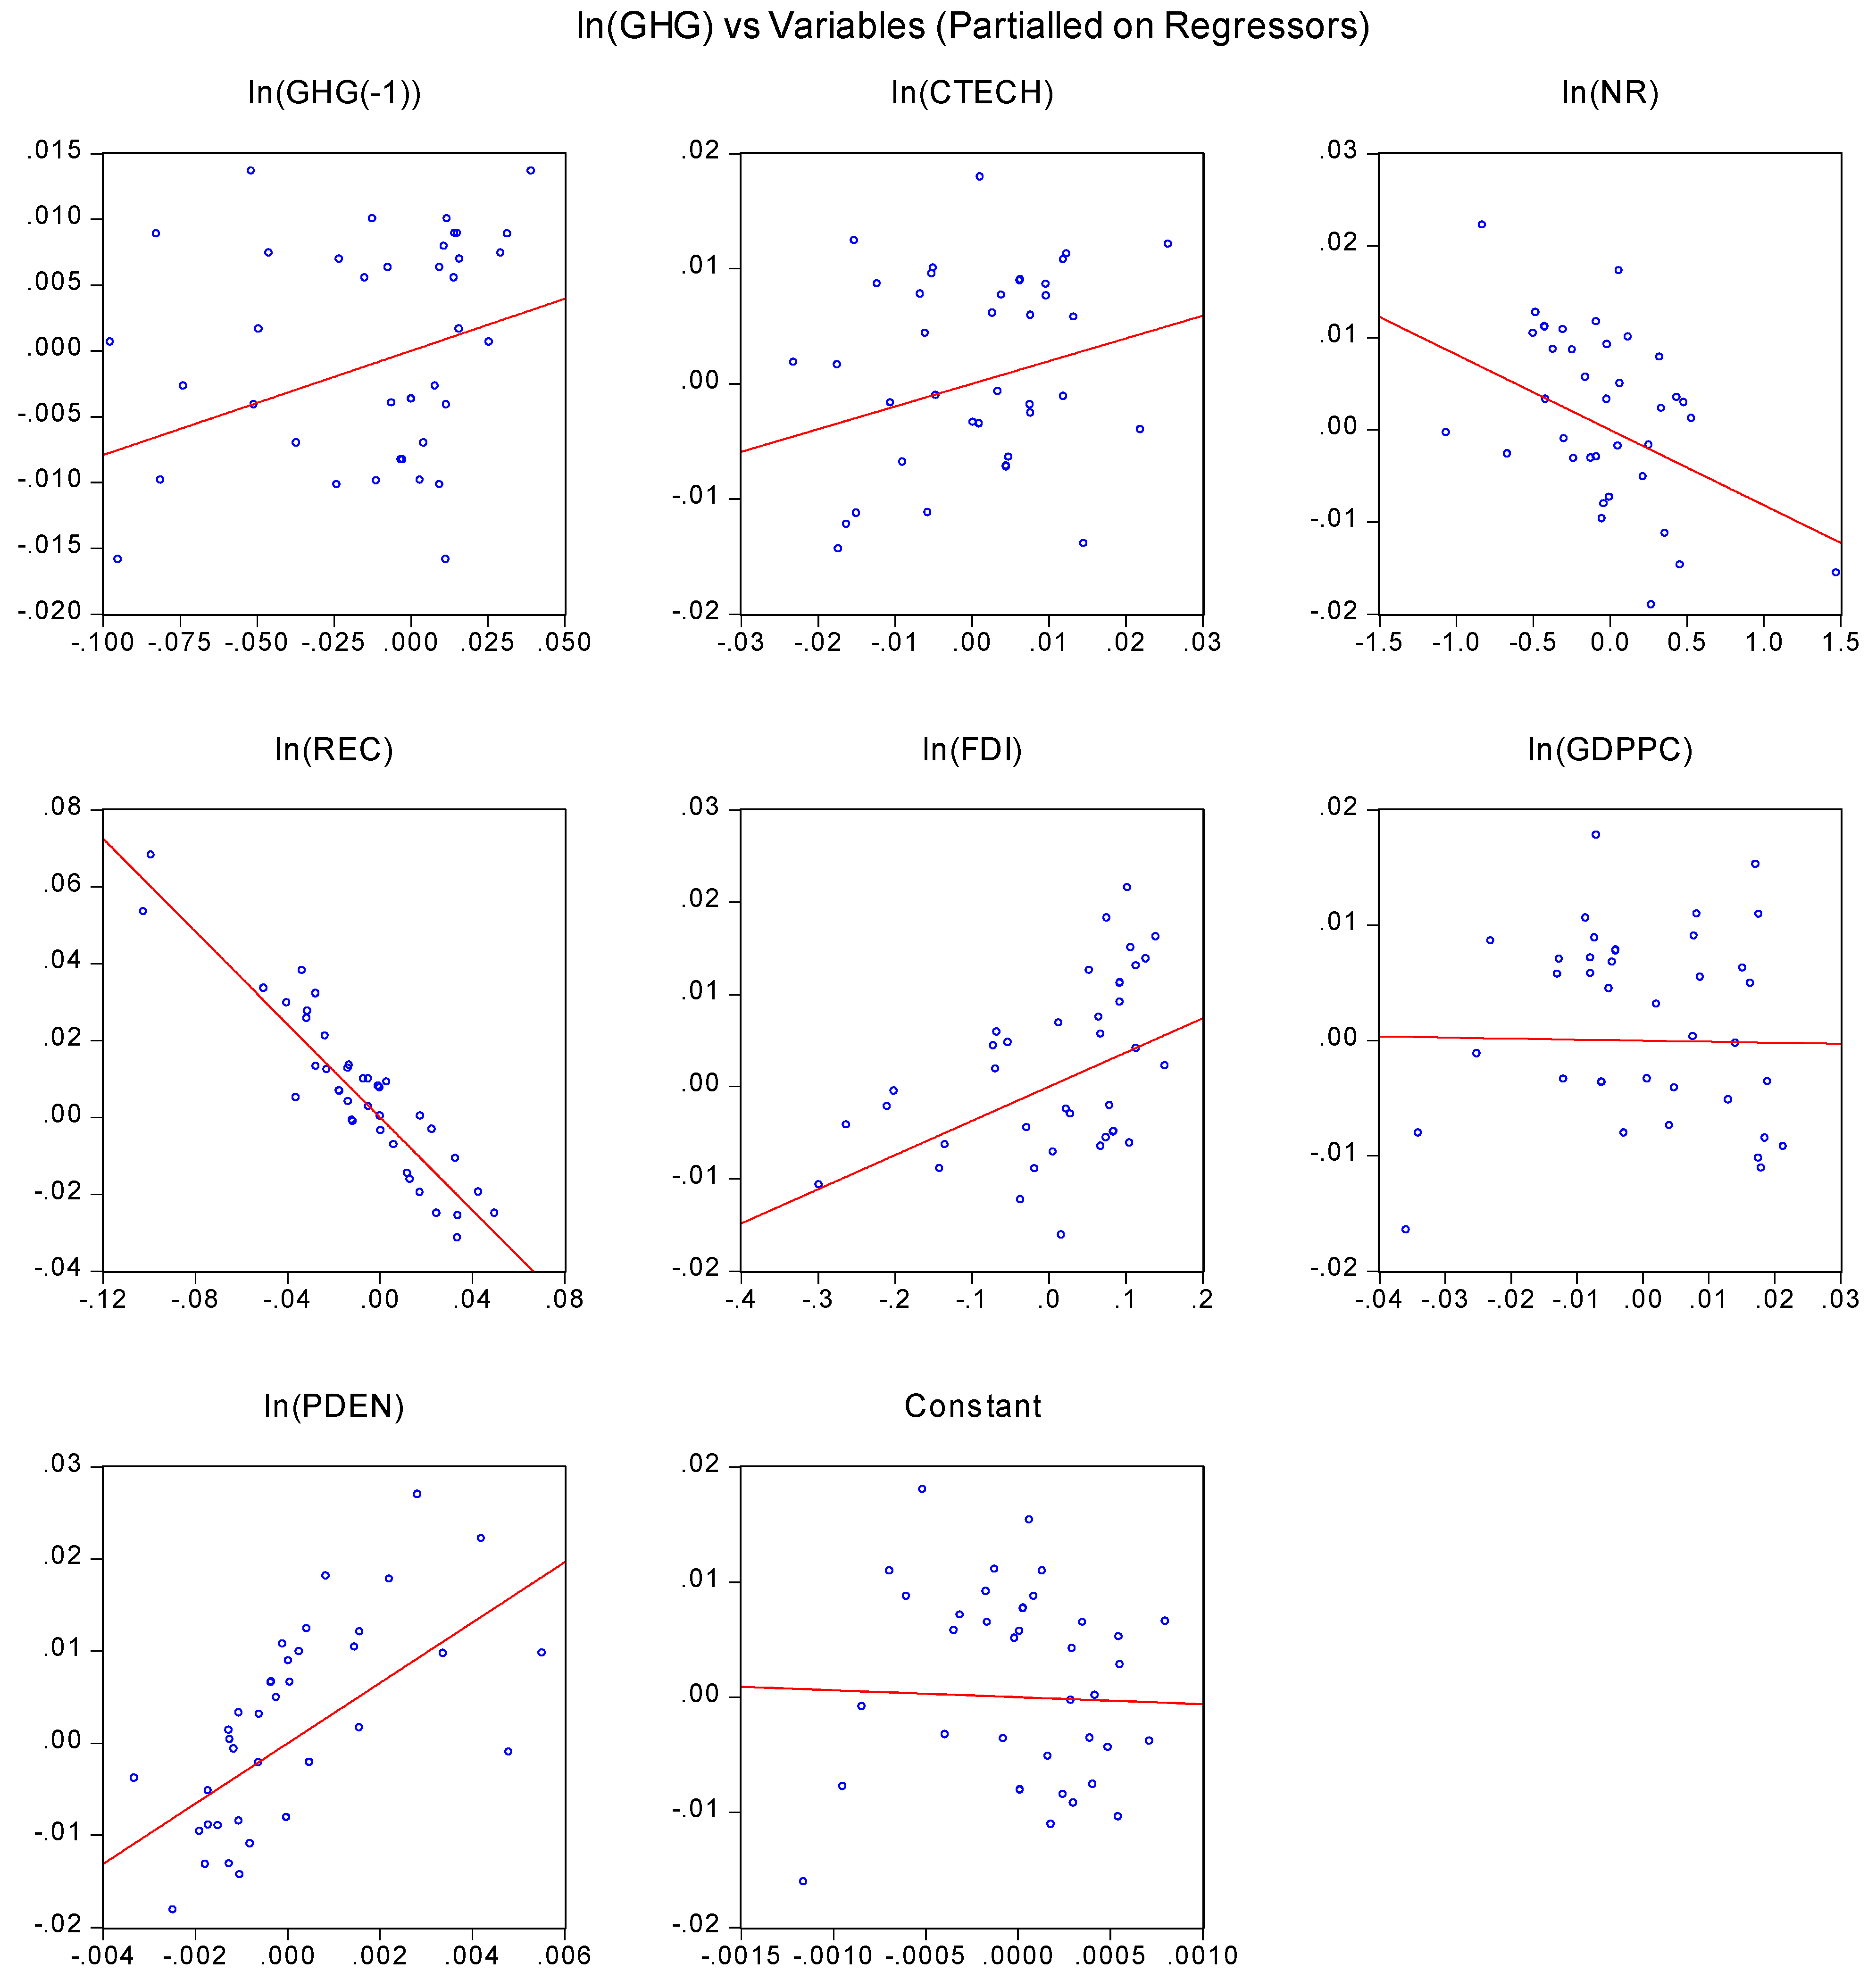
Figure 1 illustrates the variables’ leverage plots and demonstrates that, about GHG emissions, the regressors are widely spread around the actual relationship, indicating potential outliers in the given model. As a result, it is necessary to determine the number of outliers present in a particular model that must be handled using complex statistical approaches throughout the regression process.
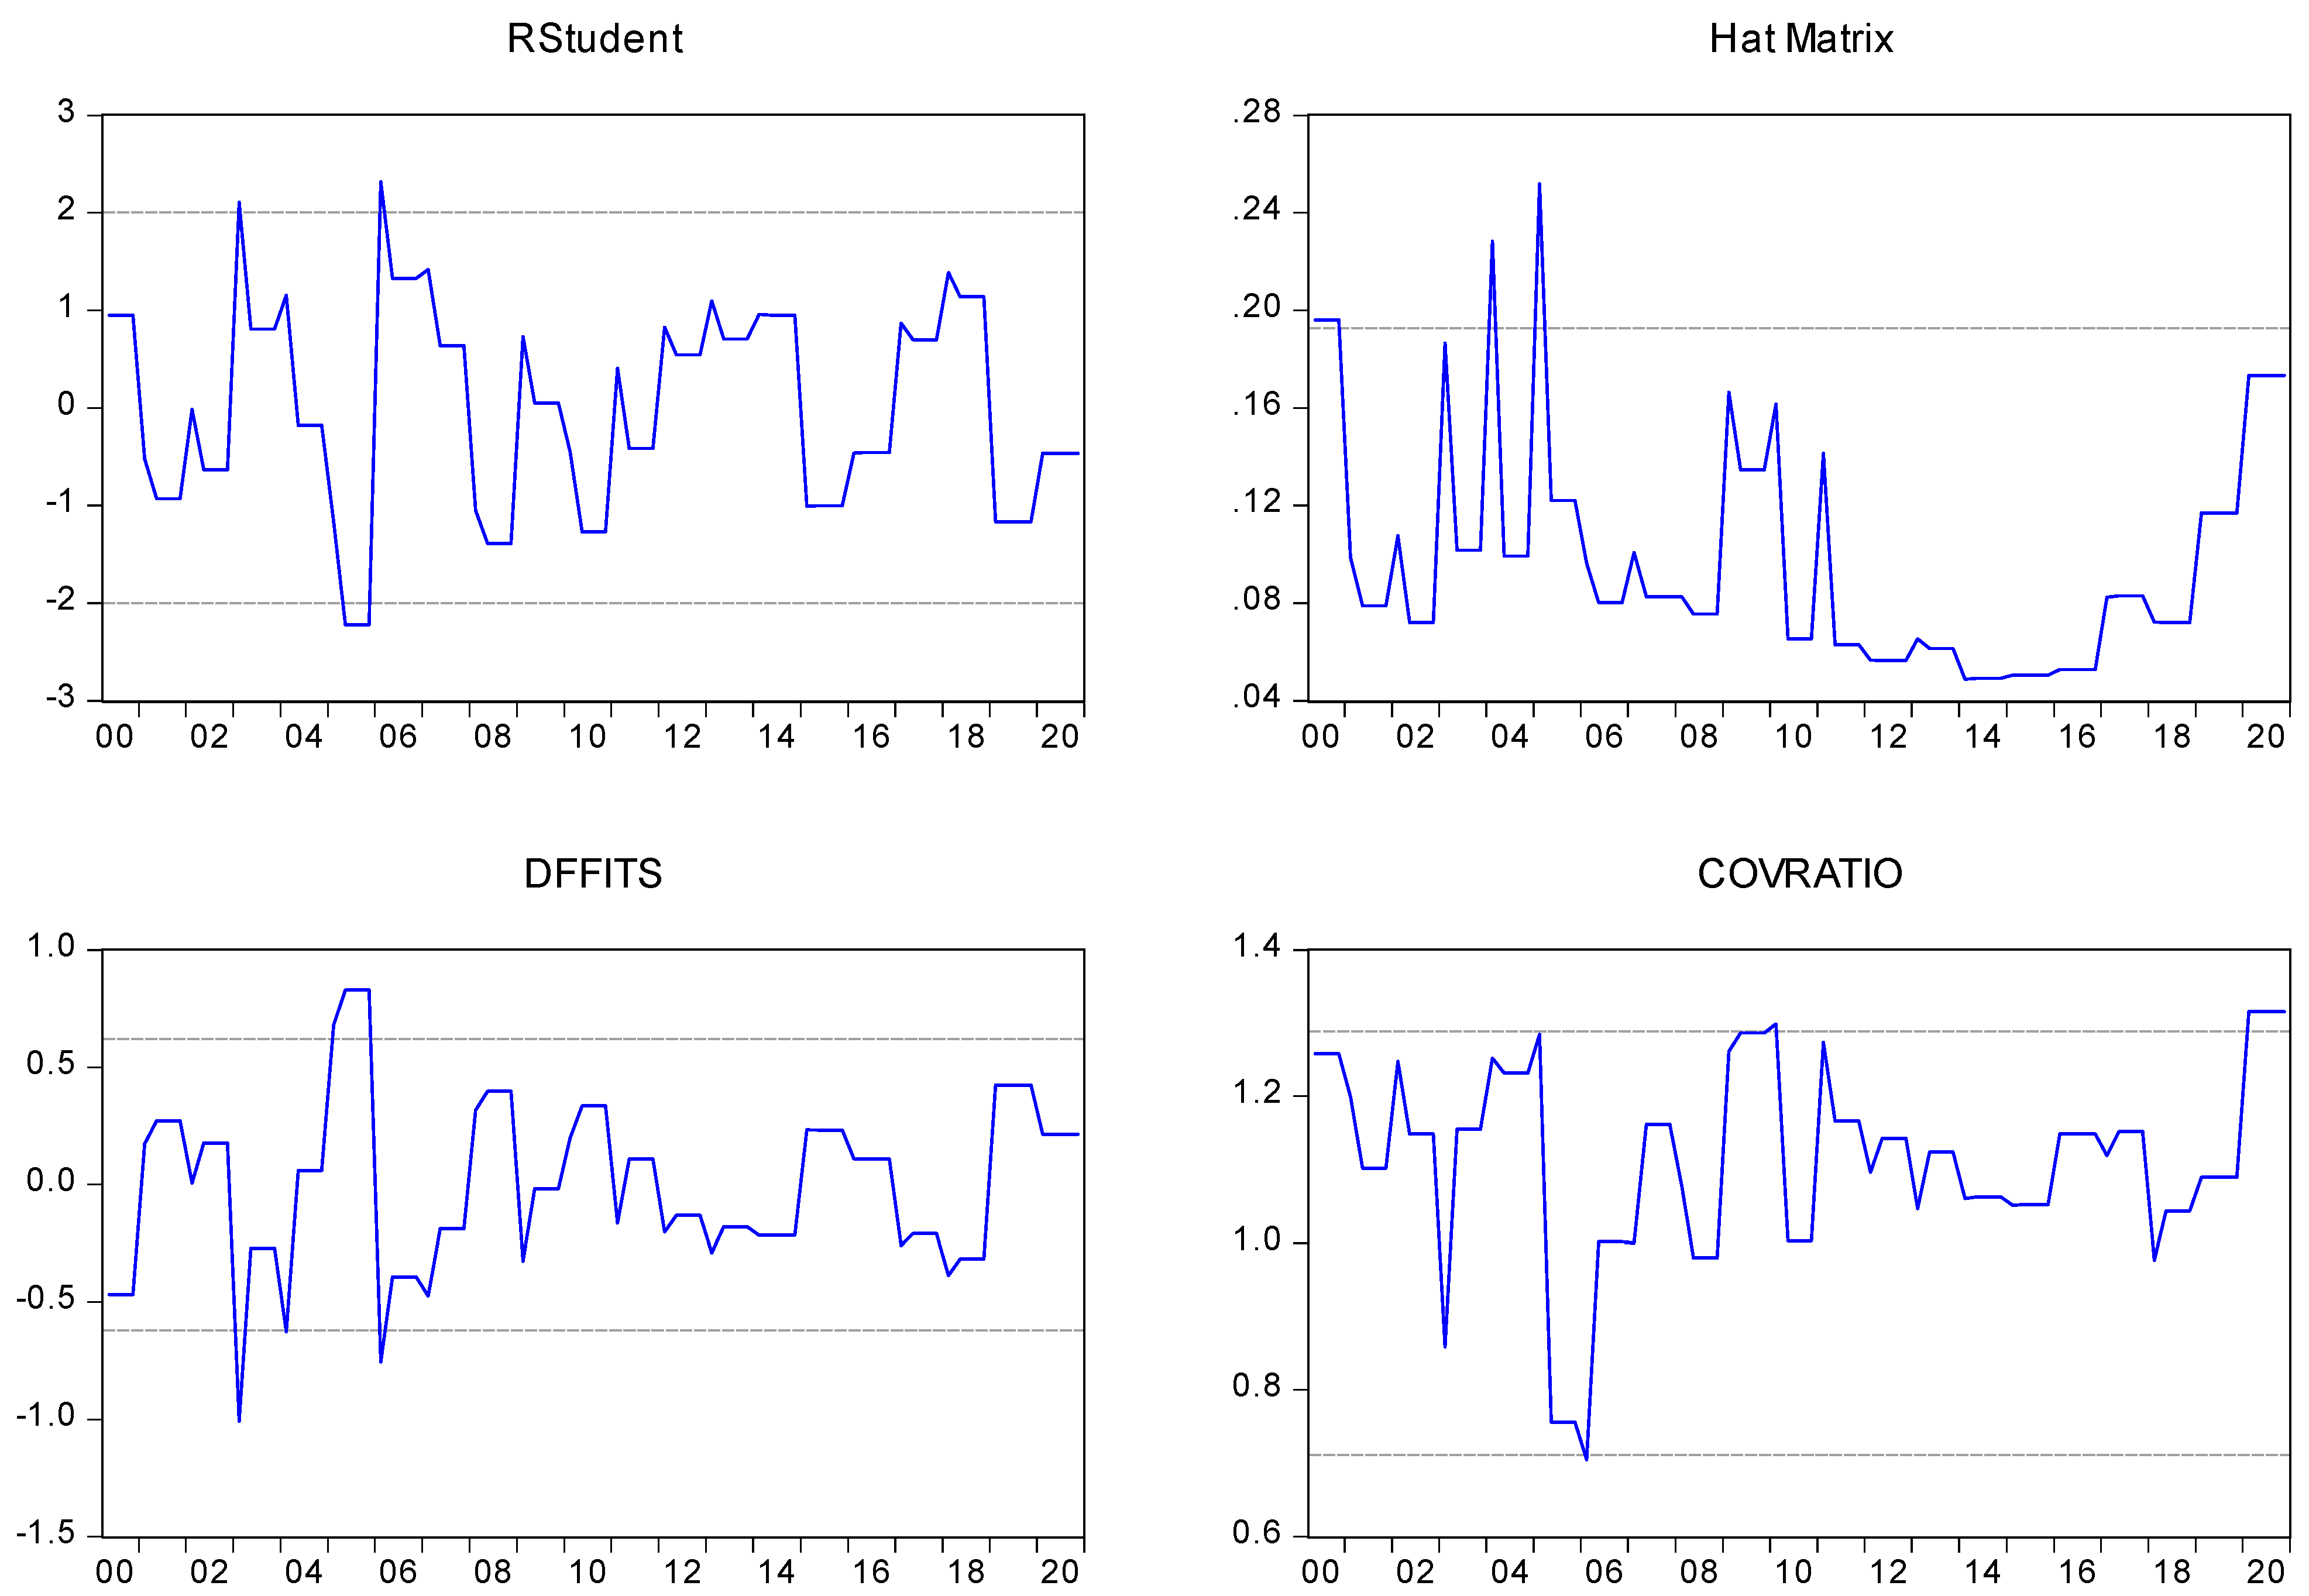
Figure 2 illustrates four distinct influence statistics for detecting the existence of outliers in a given model. Three outliers in 2003Q1, 2006Q1, and 2005Q3 were validated using Rstudent statistics. Two outliers are shown in the Hat Matrix for 2004Q1 and 2005Q1. DFFITS identifies three outliers in 2005Q2, 2003Q1, and 2006Q1, whereas COVRATIO identifies a single outlier in 2010Q1.
Before going to estimate the robust least squares regression, the unit root test is checked. Table 4 shows the Phillips–Perron unit root test estimates for ready reference.
The results show that GHG, CTECH, NR, and FDI are differenced stationary variables, whereas, the remaining variables are level stationary. The random walk series in the differenced stationary variables need to resolve through the RLS estimator in a way to handle possible internal shocks in the given seriesof variables. Table 5 shows the Granger causality estimates and found that cleaner technology, GDP per capita, and population density Granger cause GHG emissions and vice versa, which support the feedback relationship between them. Further, renewable energy demand and GDP per capita Granger cause clean technology and vice versa to support the two-way linkages between the variables. Finally, GDP per capita Granger cause renewable energy demand and FDI and vice versa, while population density Granger cause renewal energy and GDP per capita, and vice versa confirmed the bidirectional relationships between the variables. The one-way causation found is running from inward FDI and natural resource to GHG emissions, inward FDI and GHG emission to renewable energy demand, population density and natural resource to clean technologies, and natural resource to GDP per capita and population density.
Table 6 illustrates that the RLS M-findings estimator shows a negative association between renewable energy demand and GHG emissions, with an elasticity of 0.606 percentage points for every 1% rise in green energy. Consequently, increased usage of renewable energy sources contributes to reducing GHG emissions and increasing environmental quality, both of which are critical for achieving the Sustainable Development Goals [62,63]. Mineral resource rents are negatively associated with GHG emissions, with an elasticity of −0.007% for a 1% change in the natural resource. The conclusion suggests that effective mineral resource exploitation would help a nation minimize GHG emissions while also validating the resource cleaner hypothesis [64,65]. The lack of access to clean fuel technology, unsustainable foreign investment, and high population density jeopardize economic and environmental resources, contributing to a country’s increased GHG emissions. The research established the pollution haven hypothesis, which states that foreign investment degrades environmental quality [66,67]. Additionally, population-related emissions strain the natural environment, resulting in a country’s emissions intensity [68,69].
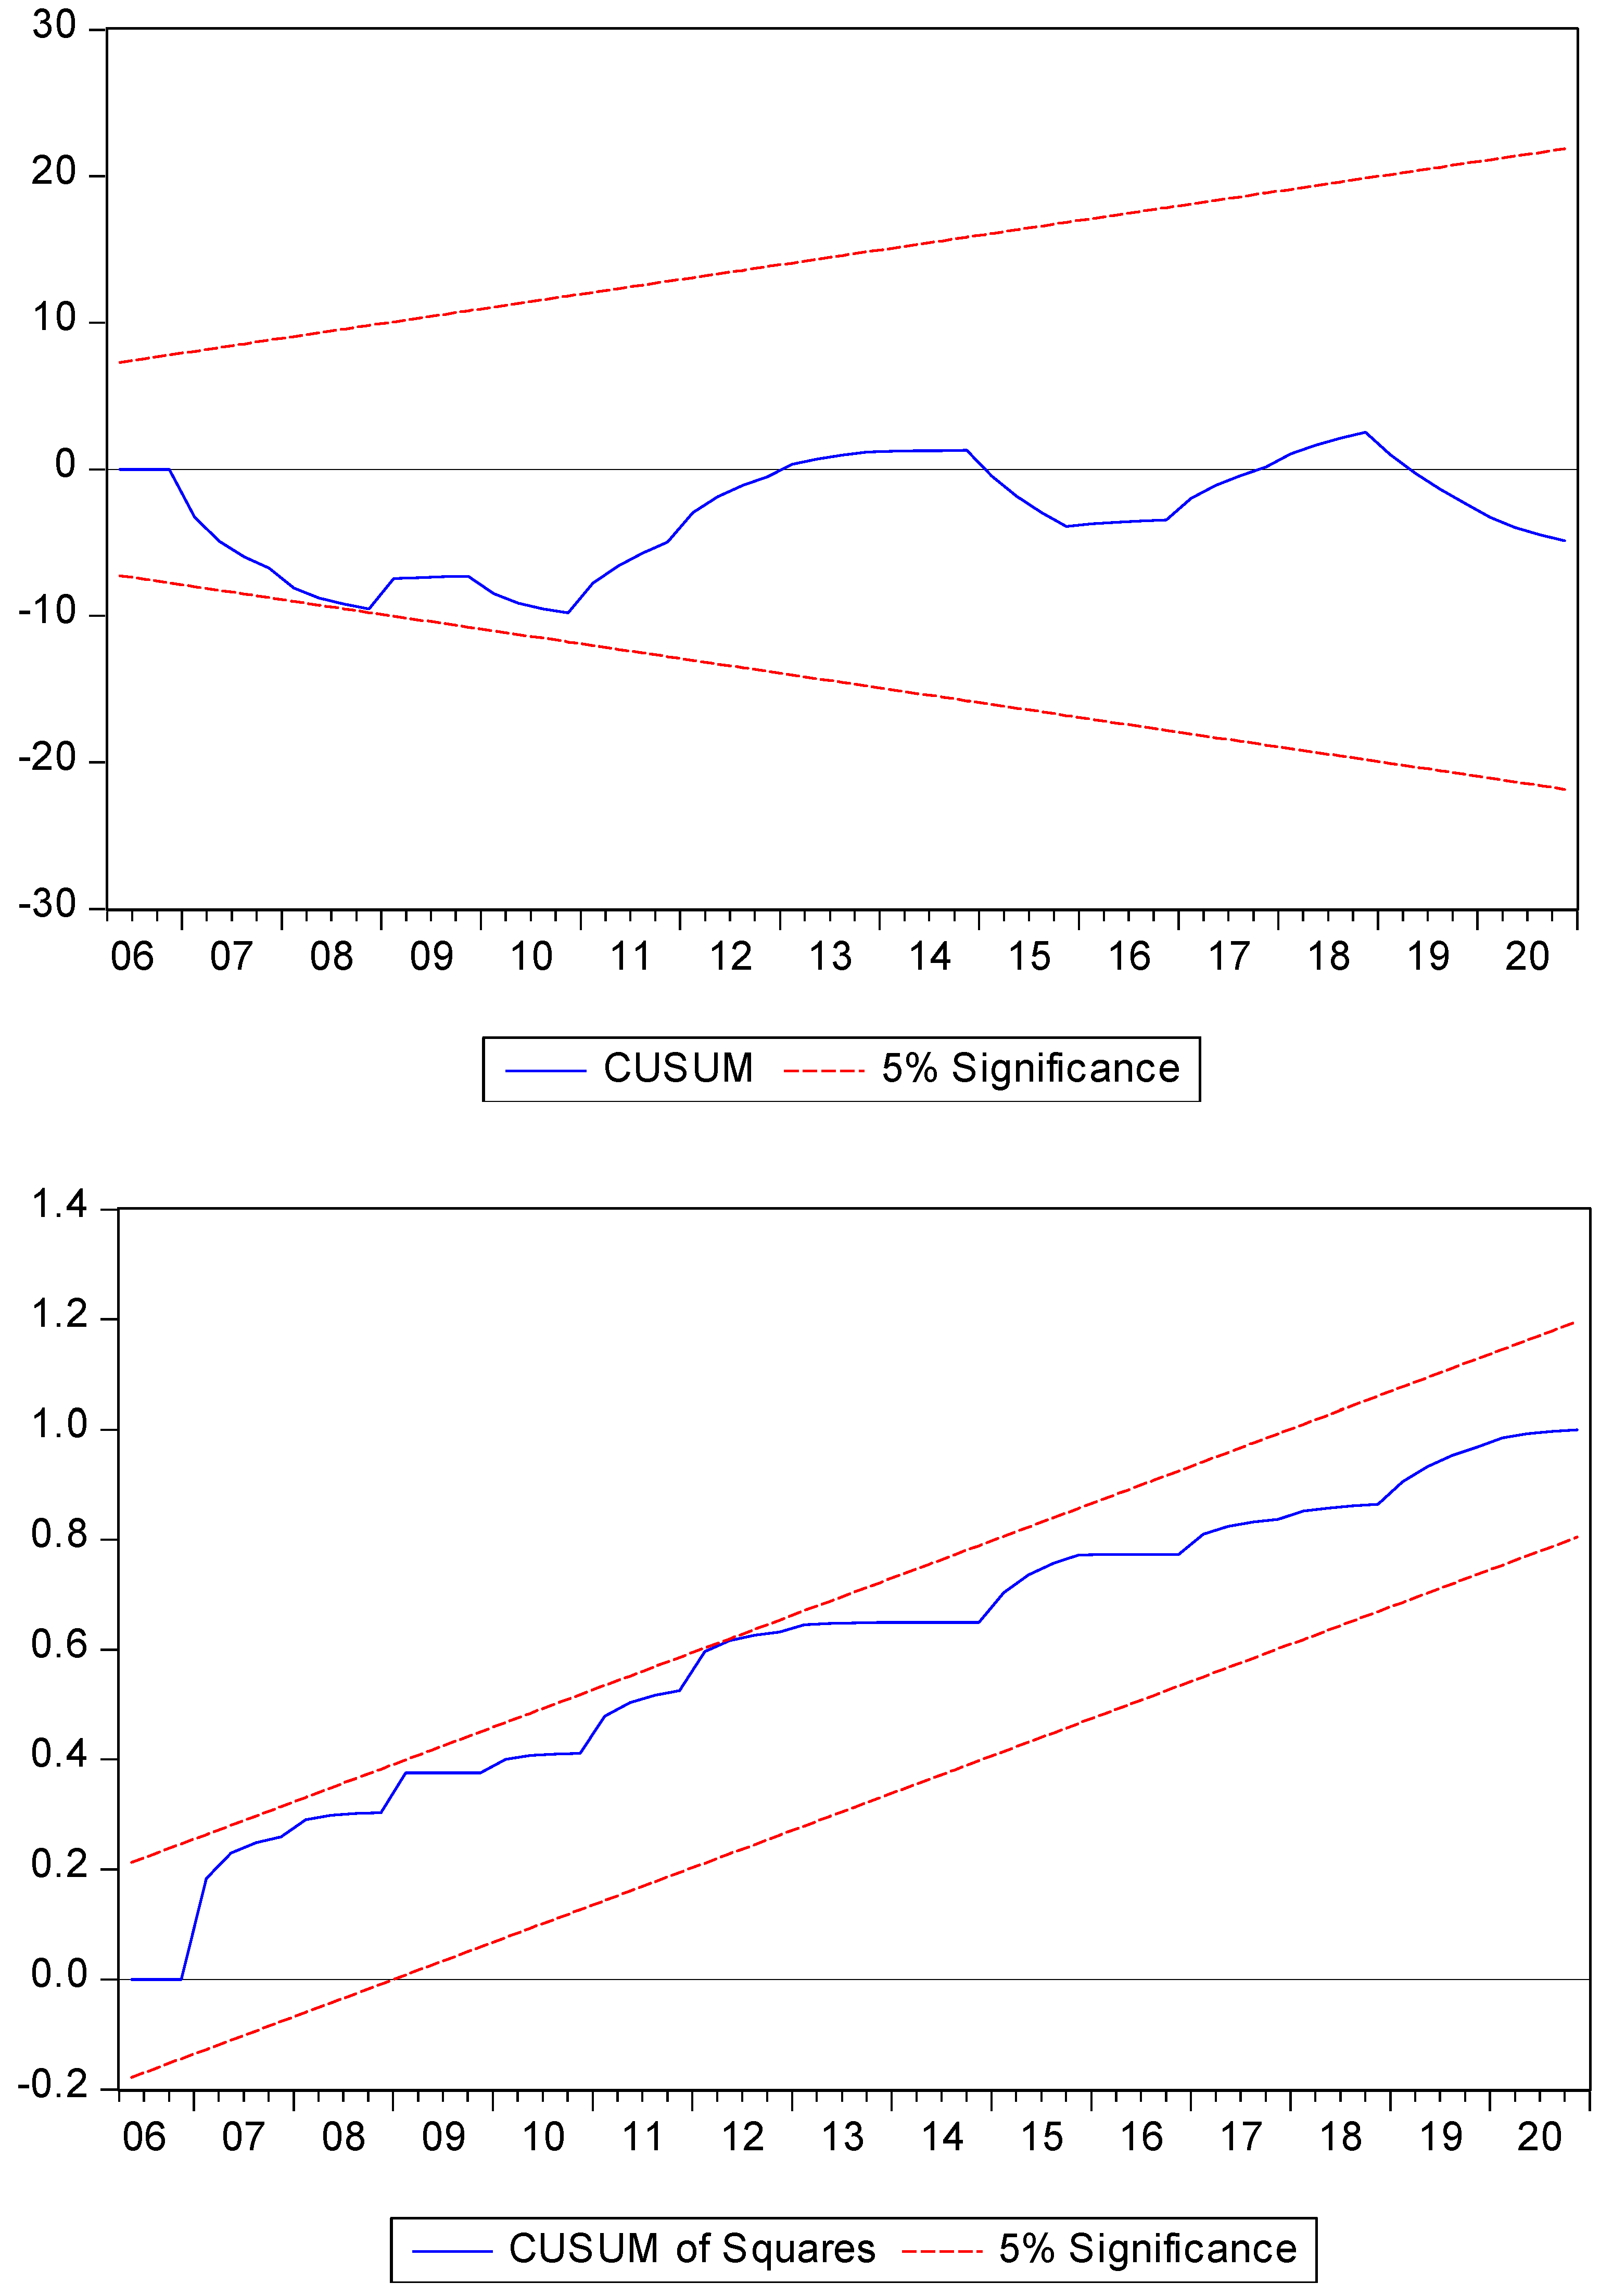
The model stability test (see, Figure 3), performed using CUSUM and CUSUM square statistics, demonstrated that the model is stable over time and statistically significant at a 5% confidence range. As a result, the regression estimates for forecasting are sound and reliable.
The IRF estimates in Table 7 indicate that clean technology, natural resource rents, green energy, and inbound FDI would likely reduce GHG emissions across the time horizon. Continued economic expansion and population density are projected to place increased strain on economic and environmental resources, resulting in increased GHG emissions during the next decade.
The VDA estimations in Table 8 reveal that increased inbound FDI significantly influences GHG emissions in a nation with a variance error shock of 1.550% in the year 2031. This proportion significantly grows from 0.003% in 2023 to 1.550% during the next ten years. Continued economic development, coupled with inbound FDI, is anticipated to impose a greater variance shock of 1.438% on GHG emissions until 2031. Renewable energy’s portion in the energy mix is expected to reach 1.246% in the next ten years. The least influencing factor on GHG emissions is expected to be natural resource rents, which must be utilized efficiently throughout the extraction process.

4. Discussion

The world is experiencing global warming, and investment in renewable energy development plays a critical role in limiting global temperature increase to less than 2 °C and ensuring sustainable development. Non-renewable energy usage accounts for two-thirds of world emissions, and other greenhouse gases also significantly affect climatic conditions. Investment in technological advances is critical to mitigating global warming. Green innovations are the most effective method of promoting a green economy and a sustainable environment [70]. Among the several strategies for reducing carbon emissions, green technology innovation is one of the most effective ways to enhance environmental quality. It encompasses renewable energy sources and a variety of energy efficiency solutions. Green technology is estimated to provide more than 60% of the aim for reducing carbon emissions [71].
Environmental deterioration is one of the most severe problems facing humanity in the 21st century. Foreign direct investment is seen as a critical component of a country’s economic progress. Due to growing globalization and capital mobility, FDI inflows have surged over several decades. Developing nations need FDI because they lack the resources necessary for economic progress. As a result, they seek foreign investment to help them reach their development objectives [72]. Numerous scholars have focused their attention on the link between carbon emissions and FDI, and they have conducted a study on it, but they have reached widely divergent findings. Several of them discovered the pollution halo idea, while others concluded that pollution havens exist. According to the pollution halo concept, inbound foreign direct investment benefits the economy by bringing cleaner technology and a green environment. Pollution haven hypothesis asserts a positive correlation between FDI and carbon emissions. Wealthy nations with more stringent environmental rules shift filthy businesses to developing countries with laxer environmental standards, cheaper labor, and abundant natural resources. Thus, these developing nations serve as a breeding ground for these filthy businesses [73,74].
A dramatic increase in greenhouse gas emissions resulting from unconstrained human competition for resources and other activities is the primary contributor to global warming. ReducingCO2 emissions are the world’s greatest issue and can only be accomplished by introducing cleaner technology, more research and development, and innovation in clean technologies [75]. Eco-innovation is developing goods and processes that contribute to the advancement of green production and consumption via technical advancements. It enables nations to adopt cost-effective and environmentally friendly manufacturing processes and counteract the adverse effects of economic expansion and trade on environmental quality [76]. Eco-innovations may help minimize energy use by increasing the quality of the environment. Carbon emissions, economic development, and commerce are all inextricably linked as nations embrace eco-innovations and green technology solutions to support economic growth. Eco-innovations result in more efficient resource usage and contribute to reducing carbon emissions [77]. Increased global competitiveness has compelled economies to introduce new technology breakthroughs in production and consumption. Among these inventions, green environmental innovations are particularly significant since they mitigate the adverse effects of human activities on the environment. These include trash management, waste recycling, sustainable resource use, energy efficiency, and environmental technology [78].
There is a positive correlation between population density and environmental damage. As the population accelerates economic development and increases demand for basic infrastructures such as electricity, buildings, and transportation, environmental pollution increases [79]. Generally, economies support industrialization from an early growth stage, and urbanization grows through time, which, in turn, increases energy consumption and carbon emissions. The industrial revolution accelerated industrialization and urbanization. This approach results in significant greenhouse gas emissions and accelerates the increase in fossil fuel usage [80]. Industrialization is also a significant factor in driving up CO2 emissions through increased energy use. Through industrialization, countries expanded their non-renewable energy sources such as oil, gas, and coal to achieve a high economic growth rate [81]. Human activities, particularly the industrial revolution and urbanization, account for most CO2 emissions [82]. Industrialization is a driver of economic expansion, but it also negatively impacts environmental quality, while developing industrialized nations prioritize manufacturing to achieve self-sufficiency, and environmental issues take a back seat. Natural resource depletion is accelerating, putting communities at risk of environmental deterioration and deteriorating air, water, and soil quality [83].
Economic sustainability is predicated on environmental sustainability. A nation cannot attain social and economic stability unless it protects its citizens’ environment by controlling pollution, increasing the use of renewable energy, minimizing natural resource depletion, and implementing green and eco-friendly infrastructure [84]. Researchers have paid close attention to natural resources and environmental sustainability during the last several years, and natural resource loss is outpacing replenishment in the modern age [85]. Countries may face severe environmental issues resulting from unsustainable resource usage, including climate change, water and energy scarcity, and deforestation [86,87]. The natural resource curse hypothesis examines the influence of natural resource ownership on economic development. In contrast, the Environmental Kuznets Curve (EKC) hypothesis is used to examine the effect of economic growth on environmental quality [88]. Excessive extraction and exploitation of natural resources negatively affect the environment, destroying natural greenery, polluting water, air, and soil quality, contributing to global warming, destroying landscapes, increasing deforestation, and leaving ecological footprints [89].
Clearer manufacturing methods may enhance environmental performance [90]. Asclean production methods predominate in natural resource management, comprehensive natural resource planning ensures maximum waste management efficiency [91]. As with other nations, China has been reducing its reliance on non-renewable energy sources via the use of new energy-efficient technologies that contribute to developing a more sustainable industrial structure consistent with global trends [92]. Quantum computers have the potential to lead the way in the solution of systems optimization problems and contribute to sustainability by simulating quantum-level atomic interactions [93]. However, material design and natural resource management abilities are critical for achieving sustainable goals [94,95,96].

5. Conclusions

Access to clean technology continues to be a bigger priority for developed and developing nations seeking to enhance their environmental quality and pursue a carbon-neutral agenda. The world temperature must be maintained below 1.50 degrees Celsius, achievable via environmental, technological advancements, effective natural resource management, increased use of green energy sources, and sustainable overseas investment. China’s economy is no exception, with laws promoting responsible consumption and production, and adaptation to climate change to decrease industrial waste and manage natural disasters via sustainable policies. The research examined China’s attempt to minimize GHG emissions by analyzing quarterly data from 2000Q1 to 2020Q4 to identify probable GHG emission causes. The findings indicate that green energy consumption and sustainable natural resource management are the primary factors influencing GHG emissions reduction. Insufficient access to clean cooking methods, inward FDI, and increased population density jeopardize a country’s environmental quality. The cause-effect interactions revealed bidirectional links between renewable energy and cleaner technology, indicating the need to increase the percentage of green energy sources in the national energy grid to progress toward cleaner technologies via foreign investment. The one-way links indicated that inward FDI results in GHG emissions and green energy consumption, hence, caution should be used when a nation seeks to increase inbound FDI. Forecasting calculations indicated that continuous economic expansion and large population density would likely increase pressure on air quality indicators, hence exacerbating GHG emissions over time.
The following short-, medium-, and long-term policy implications are recommended to assist the nation in transitioning to a green, clean resource conservation agenda with shared prosperity, i.e.,
-
Short-term Policy: The government must adopt the following sustainable activities in order to reap the benefits of technology advancement and resource conservation for future generations, i.e.,
(i)
Companies must modernize their operations and processes to create a user-friendly platform.
(ii)
ISO certification for environmental protection is still required for long-term technology transfer to be successful.
(iii)
A land-use policy that minimizes ecological footprints is required to maintain a healthy balance between natural resources and human needs.
(iv)
To encourage the development and utilization of resources sustainably.
(v)
To halt pollution of manufacturing, strict environmental rules must be implemented.
(vi)
To reduce resource waste via the use of more environmentally friendly manufacturing technology, and
(vii)
To contribute to the country’s economic development by expanding the country’s resource commodities market.
-
Medium-term Policy: The following medium-term policies should be undertaken in order to bring a country toward sustainable development:
(i)
Mechanisms of command and control for the protection of economic and natural resources should be practical and authoritative.
(ii)
Public–private partnerships and community participation contribute to conserving natural resources.
(iii)
The pricing of minerals contributes to the sustainability of its resources and the prevention of their depletion.
(iv)
Environmental rules, both official and informal, contribute to conserving natural resources, and
(v)
Technology transfer and research and development investment are essential for reducing resource damage.
-
Long-term Policy: The following long-term policies assist a country in re-connecting with its national development program objectives, i.e.,
(i)
Increasing the proportion of renewable energy sources in the national energy system to reduce greenhouse gas emissions.
(ii)
Regional collaboration and international support contribute to the long-term viability of natural resources.
(iii)
To stimulate public and private investment in the mining industry by establishing a fiscal policy environment that is friendly to investors.
(iv)
To provide an institutional framework for healthcare regulations in order to examine the impact of unsustainable resource exploitation on the health and wealth of the nation.
(v)
The priority for measuring resource efficacy should be maintaining regulatory uniformity, and
(vi)
To build an artisanal and small-scale mining business compliant with environmental regulations and guidelines.
Environmental laws, both official and informal, are considered beneficial for reducing greenhouse gas emissions in China. With the implementation of carbon pricing on dirty production, it is expected that another policy instrument will be added to the toolbox that may be utilized effectively during the vast exploitation of natural resources. The utilization of renewable energy is critical for long-term economic growth and the achievement of the carbon neutrality objective, thus climate finance and the sustainable use of natural resources have been essential for the Chinese economy inmoving towards a green healthcare policy agenda.

Author Contributions

Conceptualization, F.S., K.Z. and U.A; methodology, K.Z.; software, K.Z.; validation, F.S., K.Z., U.A., M.S.L., J.R.-S., M.A., W.A. and M.S.; formal analysis, K.Z.; investigation, K.Z. and U.A.; resources, M.S.L., U.A., J.R.-S., M.A., W.A. and M.S.; data curation, K.Z.; writing—original draft preparation, F.S. and K.Z; writing—review and editing, U.A., M.S.L., J.R.-S., M.A., W.A. and M.S.; visualization, K.Z. and U.A.; supervision, U.A.; project administration, U.A.; funding acquisition, U.A. All authors have read and agreed to the published version of the manuscript.

Funding

This research received no external funding.

Institutional Review Board Statement

Not applicable.

Informed Consent Statement

Not applicable.

Data Availability Statement

The data is freely available at World Development Indicators published by World Bank [59] at https://databank.worldbank.org/source/world-development-indicators (accessed on 10 February 2022).

Conflicts of Interest

The authors declare no conflict of interest.

References

  1. Khan, A.; Chenggang, Y.; Hussain, J.; Kui, Z. Impact of technological innovation, financial development and foreign direct investment on renewable energy, non-renewable energy and the environment in belt & Road Initiative countries. Renew. Energy 2021, 171, 479–491. [Google Scholar]
  2. Kihombo, S.; Ahmed, Z.; Chen, S.; Adebayo, T.S.; Kirikkaleli, D. Linking financial development, economic growth, and ecological footprint: What is the role of technological innovation? Environ. Sci. Pollut. Res. 2021, 28, 61235–61245. [Google Scholar] [CrossRef]
  3. Tahir, T.; Luni, T.; Majeed, M.T.; Zafar, A. The impact of financial development and globalization on environmental quality: Evidence from South Asian economies. Environ. Sci. Pollut. Res. 2021, 28, 8088–8101. [Google Scholar] [CrossRef]
  4. Afshan, S.; Yaqoob, T. The potency of eco-innovation, natural resource and financial development on ecological footprint: A quantile-ARDL-based evidence from China. Environ. Sci. Pollut. Res. 2022. [Google Scholar] [CrossRef] [PubMed]
  5. Hao, Y.; Wang, L.O.; Lee, C.C. Financial development, energy consumption and China’s economic growth: New evidence from provincial panel data. Int. Rev. Econ. Finance 2020, 69, 1132–1151. [Google Scholar] [CrossRef]
  6. Muganyi, T.; Yan, L.; Yin, Y.; Sun, H.; Gong, X.; Taghizadeh-Hesary, F. Fintech, regtech, and financial development: Evidence from China. Financ. Innov. 2022, 8, 1–20. [Google Scholar] [CrossRef]
  7. Lei, W.; Liu, L.; Hafeez, M.; Sohail, S. Do economic policy uncertainty and financial development influence the renewable energy consumption levels in China? Environ. Sci. Pollut. Res. 2022, 29, 7907–7916. [Google Scholar] [CrossRef]
  8. Zhou, X.; Yu, Y.; Yang, F.; Shi, Q. Spatial-temporal heterogeneity of green innovation in China. J. Clean Prod. 2021, 282, 124464. [Google Scholar] [CrossRef]
  9. Zahoor, Z.; Khan, I.; Hou, F. Clean energy investment and financial development as determinants of environment and sustainable economic growth: Evidence from China. Environ. Sci. Pollut. Res. 2022, 29, 16006–16016. [Google Scholar] [CrossRef]
  10. Miao, Z.; Tong, H.; Yao, W.; Lu, Z. Online high-band grid impedance measurement using variable frequency carrier-based PWM scheme. CSEE J. Power Energy Syst. 2020, 7, 128–139. [Google Scholar]
  11. Li, Z.Z.; Li, R.Y.M.; Malik, M.Y.; Murshed, M.; Khan, Z.; Umar, M. Determinants of carbon emission in China: How good is green investment? Sustain. Prod. Consum 2021, 27, 392–401. [Google Scholar] [CrossRef]
  12. Lin, B.; Zhu, J. Determinants of renewable energy technological innovation in China under CO2 emissions constraint. J. Environ. Manage 2019, 247, 662–671. [Google Scholar] [CrossRef] [PubMed]
  13. Li, Q.; Guo, R.; Li, F.; Xia, B. Integrated inventory-based carbon accounting for energy-induced emissions in Chongming eco-island of Shanghai, China. Energy Policy 2012, 49, 173–181. [Google Scholar] [CrossRef]
  14. Ruan, L.; Liu, H. Environmental, social, governance activities and firm performance: Evidence from China. Sustainability 2021, 13, 767. [Google Scholar] [CrossRef]
  15. Liu, J.; Murshed, M.; Chen, F.; Shahbaz, M.; Kirikkaleli, D.; Khan, Z. An empirical analysis of the household consumption-induced carbon emissions in China. Sustain. Prod. Consum 2021, 26, 943–957. [Google Scholar] [CrossRef]
  16. Danish; Ulucak, R.; Khan, S.U.D. Eterminants of the ecological footprint: Role of renewable energy, natural resources, and urbanization. Sustain. Cities Soc. 2020, 54, 101996. [Google Scholar] [CrossRef]
  17. Zeb, R.; Salar, L.; Awan, U.; Zaman, K.; Shahbaz, M. Causal links between renewable energy, environmental degradation and economic growth in selected SAARC countries: Progress towards green economy. Renew. Energy 2014, 71, 123–132. [Google Scholar] [CrossRef]
  18. Ulucak, R.; Ozcan, B. Relationship between energy consumption and environmental sustainability in OECD countries: The role of natural resources rents. Resour. Policy 2020, 69, 101803. [Google Scholar] [CrossRef]
  19. Wu, D.; Zhu, S.; Memon, A.A.; Memon, H. Financial Attributes, Environmental Performance, and Environmental Disclosure in China. Int. J. Environ. Res. Public Health 2020, 17, 8796. [Google Scholar] [CrossRef]
  20. Khan, S.; Majeed, M.T. Drivers of decoupling economic growth from carbon emission: Empirical analysis of ASEAN countries using decoupling and decomposition model. Pak. J. Commer. Soc. Sci. 2020, 14, 450–483. [Google Scholar]
  21. Hastuti, S.H.; Hartono, D.; Putranti, T.M.; Imansyah, M.H. The drivers of energy-related CO2 emission changes in Indonesia: Structural decomposition analysis. Environ. Sci. Pollut. Res. 2021, 28, 9965–9978. [Google Scholar] [CrossRef] [PubMed]
  22. Chakraborty, S.K.; Mazzanti, M. Energy intensity and green energy innovation: Checking heterogeneous country effects in the OECD. Struct. Chang. Econ. Dyn. 2020, 52, 328–343. [Google Scholar] [CrossRef]
  23. Gu, W.; Zhao, X.; Yan, X.; Wang, C.; Li, Q. Energy technological progress, energy consumption, and CO2 emissions: Empirical evidence from China. J. Clean Prod. 2019, 236, 117666. [Google Scholar] [CrossRef]
  24. Koçak, E.; Ulucak, Z.Ş. The effect of energy R&D expenditures on CO2 emission reduction: Estimation of the STIRPAT model for OECD countries. Environ. Sci. Pollut. Res. 2019, 26, 14328–14338. [Google Scholar]
  25. Anser, M.K.; Khan, M.A.; Nassani, A.A.; Abro MM, Q.; Zaman, K.; Kabbani, A. Dynamic Linkages between Green Energy, Knowledge Spillover, and Carbon Emissions: Global Evidence. Pol. J. Environ. Stud. 2021, 30, 3419–3423. [Google Scholar] [CrossRef]
  26. Gu, A.; Zhou, X. Emission reduction effects of the green energy investment projects of China in belt and road initiative countries. Ecosyst. Health Sustain. 2020, 6, 1747947. [Google Scholar] [CrossRef] [Green Version]
  27. Godil, D.I.; Sharif, A.; Ali, M.I.; Ozturk, I.; Usman, R. The role of financial development, R&D expenditure, globalization and institutional quality in energy consumption in India: New evidence from the QARDL approach. J. Environ. Manage 2021, 285, 112208. [Google Scholar]
  28. Balsalobre-Lorente, D.; Shahbaz, M.; Roubaud, D.; Farhani, S. How economic growth, renewable electricity and natural resources contribute to CO2 emissions? Energy Policy 2018, 113, 356–367. [Google Scholar] [CrossRef] [Green Version]
  29. Danish; Baloch, M.A.; Mahmood, N.; Zhang, J.W. Effect of natural resources, renewable energy and economic development on CO2 emissions in BRICS countries. Sci. Total Environ. 2019, 678, 632–638. [Google Scholar] [CrossRef]
  30. Kwakwa, P.A.; Alhassan, H.; Adu, G. Effect of natural resources extraction on energy consumption and carbon dioxide emission in Ghana. Int. J. Energy Sect. Manag. 2019, 14, 20–39. [Google Scholar] [CrossRef]
  31. He, Y.; Lin, B. Investigating environmental Kuznets curve from an energy intensity perspective: Empirical evidence from China. J. Clean Prod. 2019, 234, 1013–1022. [Google Scholar] [CrossRef]
  32. Jiang, W.; Liu, W. Provincial-Level CO2 Emissions Intensity Inequality in China: Regional Source and Explanatory Factors of Interregional and Intraregional Inequalities. Sustainability 2020, 12, 2529. [Google Scholar] [CrossRef] [Green Version]
  33. Wang, Y.; Liao, M.; Xu, L.; Malik, A. The impact of foreign direct investment on China’s carbon emissions through energy intensity and emissions trading system. Energy Econ. 2021, 97, 105212. [Google Scholar] [CrossRef]
  34. Wang, L. Role of FDI and energy intensity in mitigating the environmental pollution in the Chinese steel industry: Does technological innovation makes a difference? Environ. Sci. Pollut. Res. 2022, 29, 28127–28138. [Google Scholar] [CrossRef] [PubMed]
  35. Wenjuan, Z.; Jianhua, H.; Lei, Y. Revealing Dynamic Effects of China’s Regional Coal Consumption Control Policy on Energy Efficiency and Pollution Emissions. 2022. Available online: https://www.researchsquare.com/article/rs-1288951/v1 (accessed on 30 April 2022).
  36. Bu, Y.; Wang, E.; Qiu, Y.; Möst, D. Impact assessment of population migration on energy consumption and carbon emissions in China: A spatial econometric investigation. Environ. Impact Assess. Rev. 2022, 93, 106744. [Google Scholar] [CrossRef]
  37. Yu, J.; Yu, Y.; Jiang, T. Structural factors influencing energy carbon emissions in China’s service industry: An input-output perspective. Environ. Sci. Pollut. Res. 2022. [Google Scholar] [CrossRef]
  38. Wan, Y.; Sheng, N. Clarifying the relationship among green investment, clean energy consumption, carbon emissions, and economic growth: A provincial panel analysis of China. Environ. Sci. Pollut. Res. 2022, 29, 9038–9052. [Google Scholar] [CrossRef]
  39. Ma, Y.; Zhang, L.; Song, S.; Yu, S. Impacts of Energy Price on Agricultural Production, Energy Consumption, and Carbon Emission in China: A Price Endogenous Partial Equilibrium Model Analysis. Sustainability 2022, 14, 3002. [Google Scholar] [CrossRef]
  40. Lan, H.; Cheng, C.; Jafri, M.A.H.; Sohail, S. Asymmetric macroeconomic determinants of energy intensity in China: Does economic development matter? Environ. Sci. Pollut. Res. 2022. [Google Scholar] [CrossRef]
  41. Li, Z.; Shao, S.; Shi, X.; Sun, Y.; Zhang, X. Structural transformation of manufacturing, natural resource dependence, and carbon emissions reduction: Evidence of a threshold effect from China. J. Clean Prod. 2019, 206, 920–927. [Google Scholar] [CrossRef]
  42. Wang, K.; Wu, M.; Sun, Y.; Shi, X.; Sun, A.; Zhang, P. Resource abundance, industrial structure, and regional carbon emissions efficiency in China. Resour Policy 2019, 60, 203–214. [Google Scholar] [CrossRef]
  43. Ahmad, M.; Jiang, P.; Majeed, A.; Umar, M.; Khan, Z.; Muhammad, S. The dynamic impact of natural resources, technological innovations and economic growth on ecological footprint: An advanced panel data estimation. Resour. Policy 2020, 69, 101817. [Google Scholar] [CrossRef]
  44. Sarkodie, S.A.; Adams, S.; Owusu, P.A.; Leirvik, T.; Ozturk, I. Mitigating degradation and emissions in China: The role of environmental sustainability, human capital and renewable energy. Sci. Total Environ. 2020, 719, 137530. [Google Scholar] [CrossRef]
  45. Huang, Y.; Xue, L.; Khan, Z. What abates carbon emissions in China: Examining the impact of renewable energy and green investment. Sustain. Dev. 2021, 29, 823–834. [Google Scholar] [CrossRef]
  46. Ling, G.; Razzaq, A.; Guo, Y.; Fatima, T.; Shahzad, F. Asymmetric and time-varying linkages between carbon emissions, globalization, natural resources and financial development in China. Environ. Dev. Sustain. 2021, 24, 6702–6730. [Google Scholar] [CrossRef]
  47. Wang, Z.; Gao, L.; Wei, Z.; Majeed, A.; Alam, I. How FDI and technology innovation mitigate CO2 emissions in high-tech industries: Evidence from province-level data of China. Environ. Sci. Pollut. Res. 2022, 29, 4641–4653. [Google Scholar] [CrossRef] [PubMed]
  48. Sun, X.; Zhu, B.; Zhang, S.; Zeng, H.; Li, K.; Wang, B.; Dong, Z.; Zhou, C. New indices system for quantifying the nexus between economic-social development, natural resources consumption, and environmental pollution in China during 1978–2018. Sci. Total Environ. 2022, 804, 150180. [Google Scholar] [CrossRef]
  49. Xu, L.; Wang, X.; Wang, L.; Zhang, D. Does technological advancement impede ecological footprint level? The role of natural resources prices volatility, foreign direct investment and renewable energy in China. Resour. Policy 2022, 76, 102559. [Google Scholar] [CrossRef]
  50. Ali, S.A.; Alharthi, M.; Hussain, H.I.; Rasul, F.; Hanif, I.; Haider, J.; Ullah, S.; ur Rahman, S.; Abbas, Q. A clean technological innovation and eco-efficiency enhancement: A multi-index assessment of sustainable economic and environmental management. Technol. Forecast. Soc. Change 2021, 166, 120573. [Google Scholar] [CrossRef]
  51. Makhloufi, L.; Laghouag, A.A.; Meirun, T.; Belaid, F. Impact of green entrepreneurship orientation on environmental performance: The natural resource-based view and environmental policy perspective. Bus. Strategy Environ. 2022, 31, 425–444. [Google Scholar] [CrossRef]
  52. Dagar, V.; Khan, M.K.; Alvarado, R.; Rehman, A.; Irfan, M.; Adekoya, O.B.; Fahad, S. Impact of renewable energy consumption, financial development and natural resources on environmental degradation in OECD countries with dynamic panel data. Environ. Sci. Pollut. Res. 2022, 29, 18202–18212. [Google Scholar] [CrossRef] [PubMed]
  53. Usman, M.; Jahanger, A.; Makhdum MS, A.; Balsalobre-Lorente, D.; Bashir, A. How do financial development, energy consumption, natural resources, and globalization affect Arctic countries’ economic growth and environmental quality? An advanced panel data simulation. Energy 2022, 241, 122515. [Google Scholar] [CrossRef]
  54. Li, Z.; Wu, B.; Wang, D.; Tang, M. Government mandatory energy-biased technological progress and enterprises’ environmental performance: Evidence from a quasi-natural experiment of cleaner production standards in China. Energy Policy 2022, 162, 112779. [Google Scholar] [CrossRef]
  55. Haque, N. Planning for clean technology diffusion: Identifying innovation system functions in country technology action plans. Energy Res. Soc. Sci. 2022, 90, 102595. [Google Scholar] [CrossRef]
  56. Nathaniel, S.P.; Adeleye, N. Environmental preservation amidst carbon emissions, energy consumption, and urbanization in selected African countries: Implication for sustainability. J. Clean Prod. 2021, 285, 125409. [Google Scholar] [CrossRef]
  57. Yuping, L.; Ramzan, M.; Xincheng, L.; Murshed, M.; Awosusi, A.A.; Bah, S.I.; Adebayo, T.S. Determinants of carbon emissions in Argentina: The roles of renewable energy consumption and globalization. Energy Rep. 2021, 7, 4747–4760. [Google Scholar] [CrossRef]
  58. Rahim, S.; Murshed, M.; Umarbeyli, S.; Kirikkaleli, D.; Ahmad, M.; Tufail, M.; Wahab, S. Do natural resources abundance and human capital development promote economic growth? A study on the resource curse hypothesis in Next Eleven countries. Resour. Environ. Sustain. 2021, 4, 100018. [Google Scholar] [CrossRef]
  59. Haseeb, M.; Kot, S.; Hussain, H.I.; Kamarudin, F. The natural resources curse-economic growth hypotheses: Quantile–on–Quantile evidence from top Asian economies. J. Clean Prod. 2021, 279, 123596. [Google Scholar] [CrossRef]
  60. World Bank. World Development Indicators 2022; World Bank: Washington, DC, USA, 2022. [Google Scholar]
  61. Huber, P.J. Robust regression: Asymptotics, conjectures and Monte Carlo. Ann. Stat. 1973, 1, 799–821. [Google Scholar] [CrossRef]
  62. Rousseeuw, P.J.; Yohai, V.J. Robust Regression by Means of S-Estimators. In Robust and Nonlinear Time Series; Lecture Notes in Statistics No. 26; Franke, J., Härdle, W., Martin, D., Eds.; Springer: Berlin, Germany, 1984. [Google Scholar]
  63. Yohai, V.J. High breakdown-point and high efficiency robust estimates for regression. Ann. Stat. 1987, 15, 642–656. [Google Scholar] [CrossRef]
  64. Yuan, X.; Su, C.W.; Umar, M.; Shao, X.; Lobon, Ţ.O.R. The race to zero emissions: Can renewable energy be the path to carbon neutrality? J. Environ. Manag. 2022, 308, 114648. [Google Scholar] [CrossRef] [PubMed]
  65. Chopra, R.; Magazzino, C.; Shah, M.I.; Sharma, G.D.; Rao, A.; Shahzad, U. The role of renewable energy and natural resources for sustainable agriculture in ASEAN countries: Do carbon emissions and deforestation affect agriculture productivity? Resour. Policy 2022, 76, 102578. [Google Scholar] [CrossRef]
  66. Yang, X.; Anser, M.K.; Yusop, Z.; Abbas, S.; Khan, M.A.; Zaman, K. Volatility in mineral resource pricing causes ecological footprints: A cloud on the horizon. Resour. Policy 2022, 77, 102673. [Google Scholar] [CrossRef]
  67. Tang, C.; Irfan, M.; Razzaq, A.; Dagar, V. Natural resources and financial development: Role of business regulations in testing the resource-curse hypothesis in ASEAN countries. Resour. Policy 2022, 76, 102612. [Google Scholar] [CrossRef]
  68. Musah, M.; Mensah, I.A.; Alfred, M.; Mahmood, H.; Murshed, M.; Omari-Sasu, A.Y.; Boateng, F.; Nyeadi, J.D.; Coffie, C.P.K. Reinvestigating the pollution haven hypothesis: The nexus between foreign direct investments and environmental quality in G-20 countries. Environ. Sci. Pollut. Res. 2022, 29, 31330–31347. [Google Scholar] [CrossRef]
  69. Bulut, U.; Ucler, G.; Aksoz-Yilmaz, H.; Basaran, D.N. Is there a trade-off between financing current account deficits and environmental deterioration in developing countries? An empirical investigation for the validity of the pollution haven hypothesis. Environ. Sci. Pollut. Res. 2022. [Google Scholar] [CrossRef]
  70. Gao, C.; Tao, S.; He, Y.; Su, B.; Sun, M.; Mensah, I.A. Effect of population migration on spatial carbon emission transfers in China. Energy Policy 2021, 156, 112450. [Google Scholar] [CrossRef]
  71. Xiong, X.; Zhang, L.; Hao, Y.; Zhang, P.; Shi, Z.; Zhang, T. How urbanization and ecological conditions affect urban diet-linked GHG emissions: New evidence from China. Resour. Conserv. Recycl. 2022, 176, 105903. [Google Scholar] [CrossRef]
  72. Ganda, F. The impact of innovation and technology investments on carbon emissions in selected organisation for economic Co-operation and development countries. J. Clean Prod. 2019, 217, 469–483. [Google Scholar] [CrossRef]
  73. Du, K.; Li, P.; Yan, Z. Do green technology innovations contribute to carbon dioxide emission reduction? Empirical evidence from patent data. Technol Forecast. Soc. Change 2019, 146, 297–303. [Google Scholar] [CrossRef]
  74. Mert, M.; Caglar, A.E. Testing pollution haven and pollution halo hypotheses for Turkey: A new perspective. Environ. Sci. Pollut. Res. 2020, 27, 32933–32943. [Google Scholar] [CrossRef] [PubMed]
  75. Ur Rahman, Z.; Chongbo, W.; Ahmad, M. An (a)symmetric analysis of the pollution haven hypothesis in the context of Pakistan: A non-linear approach. Carbon Manag 2019, 10, 227–239. [Google Scholar] [CrossRef]
  76. Nasir, M.A.; Huynh, T.L.D.; Tram, H.T.X. Role of financial development, economic growth & foreign direct investment in driving climate change: A case of emerging ASEAN. J. Environ. Manag. 2019, 242, 131–141. [Google Scholar]
  77. Su, C.W.; Naqvi, B.; Shao, X.F.; Li, J.P.; Jiao, Z. Trade and technological innovation: The catalysts for climate change and way forward for COP21. J. Environ. Manag. 2020, 269, 110774. [Google Scholar] [CrossRef]
  78. Ding, Q.; Khattak, S.I.; Ahmad, M. Towards sustainable production and consumption: Assessing the impact of energy productivity and eco-innovation on consumption-based carbon dioxide emissions (CCO2) in G-7 nations. Sustain. Prod. Consum. 2021, 27, 254–268. [Google Scholar] [CrossRef]
  79. Wurlod, J.D.; Noailly, J. The impact of green innovation on energy intensity: An empirical analysis for 14 industrial sectors in OECD countries. Energy Econ. 2018, 71, 47–61. [Google Scholar] [CrossRef] [Green Version]
  80. Triguero, A.; Fernández, S.; Sáez-Martinez, F.J. Inbound open innovative strategies and eco-innovation in the Spanish food and beverage industry. Sustain. Prod. Consum. 2018, 15, 49–64. [Google Scholar] [CrossRef]
  81. Liu, X.; Bae, J. Urbanization and industrialization impact of CO2 emissions in China. J. Clean Prod. 2018, 172, 178–186. [Google Scholar] [CrossRef]
  82. Li, K.; Lin, B. Impacts of urbanization and industrialization on energy consumption/CO2 emissions: Does the level of development matter? Renew. Sust. Energ. Rev. 2015, 52, 1107–1122. [Google Scholar] [CrossRef]
  83. Pata, U.K. The effect of urbanization and industrialization on carbon emissions in Turkey: Evidence from ARDL bounds testing procedure. Environ. Sci. Pollut. Res. 2018, 25, 7740–7747. [Google Scholar] [CrossRef]
  84. Dong, F.; Wang, Y.; Su, B.; Hua, Y.; Zhang, Y. The process of peak CO2 emissions in developed economies: A perspective of industrialization and urbanization. Resour. Conserv. Recycl. 2019, 141, 61–75. [Google Scholar] [CrossRef]
  85. Mahmood, H.; Alkhateeb, T.T.Y.; Furqan, M. Industrialization, urbanization and CO2 emissions in Saudi Arabia: Asymmetry analysis. Energy Rep. 2020, 6, 1553–1560. [Google Scholar] [CrossRef]
  86. Anser, M.K.; Yousaf, Z.; Zaman, K.; Nassani, A.A.; Alotaibi, S.M.; Jambari, H.; Khan, A.; Kabbani, A. Determination of resource curse hypothesis in mediation of financial development and clean energy sources: Go-for-green resource policies. Resour. Policy 2020, 66, 101640. [Google Scholar] [CrossRef]
  87. Höök, M.; Li, J.; Oba, N.; Snowden, S. Descriptive and predictive growth curves in energy system analysis. Nat. Resour. Res. 2011, 20, 103–116. [Google Scholar] [CrossRef] [Green Version]
  88. Hassan, S.T.; Xia, E.; Khan, N.H.; Shah, S.M.A. Economic growth, natural resources, and ecological footprints: Evidence from Pakistan. Environ. Sci. Pollut. Res. 2019, 26, 2929–2938. [Google Scholar] [CrossRef]
  89. Erdoğan, S.; Çakar, N.D.; Ulucak, R.; Kassouri, Y. The role of natural resources abundance and dependence in achieving environmental sustainability: Evidence from resource-based economies. Sustain. Dev. 2021, 29, 143–154. [Google Scholar] [CrossRef]
  90. Costantini, V.; Monni, S. Environment, human development and economic growth. Ecol. Econ. 2008, 64, 867–880. [Google Scholar] [CrossRef] [Green Version]
  91. Gutti, B.; Aji, M.M.; Magaji, G. Environmental impact of natural resources exploitation in Nigeria and the way forward. J. Appl. Technol. Environ. Sanit 2012, 2, 95–102. [Google Scholar]
  92. Awan, U.; Kraslawski, A.; Huiskonen, J. Understanding the Relationship between Stakeholder Pressure and Sustainability Performance in Manufacturing Firms in Pakistan. Procedia Manuf. 2017, 11, 768–777. [Google Scholar] [CrossRef]
  93. Nassani, A.A.; Awan, U.; Zaman, K.; Hyder, S.; Aldakhil, A.M.; Abro, M.M.Q. Management of natural resources and material pricing: Global evidence. Resour.Policy 2019, 64, 101500. [Google Scholar] [CrossRef]
  94. Cheng, Y.; Awan, U.; Ahmad, S.; Tan, Z. How do technological innovation and fiscal decentralization affect the environment? A story of the fourth industrial revolution and sustainable growth. Technol. Forecast. Soc. Change 2021, 162, 120398. [Google Scholar] [CrossRef]
  95. Awan, U.; Hannola, L.; Tandon, A.; Goyal, R.K.; Dhir, A. Quantum computing challenges in the software industry. A fuzzy AHP-based approach. Inf. Softw. Technol. 2022, 147, 106896. [Google Scholar] [CrossRef]
  96. Awan, U.; Sroufe, R. Sustainability in the Circular Economy: Insights and Dynamics of Designing Circular Business Models. Appl. Sci. 2022, 12, 1521. [Google Scholar] [CrossRef]
Figure 1. Leverage Plots. Note: GHG shows GHG emissions, CTECH shows clean technologies, REC shows renewal energy consumption, NR shows natural resources, FDI shows inbound FDI, GDPPC shows GDP per capita, and PDEN shows population density.Small bracket shows probability value. Red lines show true lines while blue dots show observation plots. Source: Author’s estimate.
Cleantechnol 04 00036 g001
Figure 2. Influence Statistics. Note: Blue lines show observation plots between the two parallel black dotted lines. Black dotted lines show average observation plots. Source Author’s estimate.
Cleantechnol 04 00036 g002
Figure 3. CUSUM and CUSUM Square Estimates. Source: Author’s estimates.
Cleantechnol 04 00036 g003
Table 1. Literature Review on Environmental Sustainability Agenda.
AuthorsTime PeriodResults
He and Lin [31]2003–2017China’s energy intensity and pollutant emissions are gradually reducing. The relationship between income and pollution emission is non-linear. Additionally, for energy intensity, an inverted U-shaped Kuznets curve connection exists.
Jiang and Liu [32]2005–2015In China, the province’s CO2 emission intensity occurred; this disparity and its subsequent rise are primarily attributable to the intraregional component. Additionally, energy efficiency is the primary factor in interregional, Eastern, Western, and Central China disparity. It is suggested that policies relating to regional mitigation methods be established.
Wang et al. [33]2004–2016Between FDI and carbon emissions, there is an inverted U-shaped link. Additionally, the emission trading system has a significant negative influence on carbon emissions.
Wang [34]2000–2018Foreign direct investment and technological innovation have a detrimental effect on CO2 emissions, and energy consumption and environmental technologies have a negligible effect on carbon emissions. Responsible organizations should implement measures that mitigate the detrimental effects of economic expansion and urbanization on the Chinese steel industry.
Wenjuan and Jianhua [35]2005–2019Through improved technology and reorganized industries, coal consumption limitation policies have considerably lowered the carbon emission intensity. The study concluded that the government should act effectively and aggressively to minimize policy fragmentation. Second, with government backing, companies should adopt environmentally friendly structures that do not harm the environment.
Bu et al. [36]2000–2019Population mobility exacerbates energy demand and energy poverty, and energy poverty has a more severe impact than energy usage. Additionally, population mobility exacerbates China’s carbon emission and carbon reduction hurdles. It has been argued that China should push programs to reduce carbon emissions.
Yu et al. [37]2007–2017The rise of energy carbon emissions has been dramatically slowed by optimizing the structure of the building industry’s energy usage. Additionally, carbon emissions from the building sector fall dramatically as energy intensity and input structure increase.
Wan and Sheng [38]2003–2017The findings indicate the existence of the Environmental Kuznets Curve (EKC), as a U-shaped association between clean energy usage and per capita GDP was discovered. Additionally, green investment has a significant and beneficial effect on the use of clean energy and economic development. It is advantageous for the Chinese economy to promote green investment to improve the environment and economy.
Ma et al. [39]2018Energy prices have a detrimental effect on agricultural energy usage, and rising energy costs result in higher agricultural product prices. According to the findings, a method for establishing energy-efficient prices is essential for cleaner farm output and a clean environment.
Lan et al. [40]1985–2019Linear ARDL analysis demonstrates that energy pricing and economic development considerably lower energy intensity over the long term. Additionally, these factors have an unequal effect on the intensity of energy.
Li et al. [41]2003–2014Modernization and streamlining of the manufacturing sector contribute to reducing carbon emissions. Additionally, the higher the ratio of industrial production to GDP, the less constraining influence resource reliance has on manufacturing structure emissions reduction.
Wang et al. [42]2003–2016There was a negative correlation between resource quantity, emissions efficiency and abatement capacity, and carbon emission. Additionally, resource reliance works against industrial simplification and indirectly affects carbon emissions.
Ahmed et al. [43]1970–2016Carbon emissions are increased by natural resource rent, economic expansion, and urbanization. Environmental deterioration is mitigated by human capital and the interplay between urbanization and human capital.
Sarkodie et al. [44]1961–2016The EKC hypothesis is valid for the nation as low carbon emissions are caused by a highincome level, the use of renewable energy, and environmental sustainability. Carbon emissions are facilitated by fossil fuel energy use and human capital to become cleaner through labor-augmented technology.
Huang et al. [45]1995–2019For provincial statistics, there is the EKC. Technological advancements, renewable energy, and green investment all contribute to reducing carbon emissions, and financial development contributes to increased CO2 emissions. Appropriate legislation and promotion of renewable energy use are essential in China to ensure the protection of the environment.
Ling et al. [46]1980–2017Positive shocks to financial growth and globalization increase carbon emissions, but adverse shocks to natural resources have a positive and statistically significant effect on emissions.
Wang et al. [47]2004–2017Environmental quality and industrial economic trends are rising year after year. It has been projected that policies promoting sustainable industrial growth and environmental problems be promoted.
Sun et al. [48]1978–2018China’s rapid expansion has resulted in rising pollution and natural resource use, yet China has to confront the issue of resource depletion and ecological collapse. China has taken several measures to combat water pollution and forest degradation.
Xu et al. [49]1990–2017On one hand, natural resources, technological advancements, and renewable energy all contribute to reducing the ecological footprint or carbon emissions. On the other hand, foreign direct investment has a beneficial effect on carbon emissions.
Table 2. Descriptive Statistics.
MethodsGHGCTECHRECNRFDIGDPPCPDEN
Mean9,411,77957.71416.2370.7543.0015858.718142.206
Maximum12,355,24079.40029.6032.3624.55410,370.360149.705
Minimum4,597,4304211.3380.0501.3102193.893133.971
Std.Dev.2,812,63112.7405.9170.7911.0692721.2034.982
Skewness−0.4950.3091.2761.117−0.2800.215−0.010
Kurtosis1.7371.6933.1352.7581.8441.7251.775
Note: GHG shows GHG emissions, CTECH shows clean technologies, REC shows renewal energy consumption, NR shows natural resources, FDI shows inbound FDI, GDPPC shows GDP per capita, and PDEN shows population density.
Table 3. Correlation Matrix.
VariablesGHGCTECHRECNRFDIGDPPCPDEN
GHG1
-----
CTECH0.9281
(<0.001)-----
REC−0.913−0.7191
(<0.001)(<0.001)-----
NR0.082−0.1830.3771
(<0.001)(0.426)(0.091)-----
FDI−0.674−0.8590.3770.5201
(<0.001)(<0.001)(0.091)(0.015)-----
GDPPC0.9430.998−0.753−0.132−0.8391
(<0.001)(<0.001)(<0.001)(0.567)(<0.001)-----
PDEN0.9630.988−0.809−0.088−0.8040.9931
(<0.001)(<0.001)(<0.001)(0.702)(<0.001)(<0.001)-----
Note: GHG shows GHG emissions, CTECH shows clean technologies, REC shows renewal energy consumption, NR shows natural resources, FDI shows inbound FDI, GDPPC shows GDP per capita, and PDEN shows population density. Figures in brackets shows probability value.
Table 4. Phillips and Perron Unit Root Estimates.
VariablesLevelFirst Difference
InterceptIntercept and TrendInterceptIntercept and Trend
GHG−1.855−0.196−10.640 *−12.005 *
CTECH1.640−2.988−11.738 *−14.348 *
REC−3.426 **−0.774−9.729 *−16.787 *
NR−1.898−1.922−8.948 *−8.916 *
GDPPC1.272−3.840 **−13.738 *−15.883 *
FDI−0.872−2.445−9.008 *−9.010 *
PDEN−0.972−6.497 *−16.554 *−17.090 *
** Level of significance, p < 0.05; * Level of significance, p < 0.01.
Table 5. Granger Causality Estimates.
Null Hypothesis:ObsF-StatisticProb.
CTECH ↔ GHG809.431114 × 10−6
GHG ↔ CTECH62.13342 × 10−22
NR → GHG804.019660.0054
GHG ҂ NR0.144040.9651
REC ҂ GHG8010.38181 × 10−6
GHG → REC6.857580.0001
FDI → GHG804.553180.0025
GHG ҂ FDI1.849540.1289
GDPPC ↔ GHG808.560381 × 10−5
GHG ↔ GDPPC14.20301 × 10−8
PDEN ↔ GHG8016.25162 × 10−9
GHG ↔ PDEN14.00252 × 10−8
NR → CTECH8013.31404 × 10−8
CTECH ҂ NR0.245210.9117
REC ↔ CTECH8048.92191 × 10−19
CTECH ↔ REC4.635350.0022
FDI ↔ CTECH805.723810.0005
CTECH ↔ FDI3.392310.0135
GDPPC ↔ CTECH8017.78634 × 10−10
CTECH ↔ GDPPC7.770313 × 10−5
PDEN → CTECH8024.74418 × 10−13
CTECH ҂ PDEN0.344750.8468
GDPPC ҂ NR800.185260.9453
NR → GDPPC4.711930.0020
PDEN ҂ NR800.158150.9587
NR → PDEN3.074060.0215
FDI → REC802.622060.0418
REC ҂ FDI0.562900.6903
GDPPC ↔ REC804.847580.0016
REC ↔ GDPPC17.12937 × 10−10
PDEN ↔ REC808.495121 × 10−5
REC ↔ PDEN4.713700.0020
GDPPC ↔ FDI803.132380.0197
FDI ↔ GDPPC5.399100.0007
PDEN ↔ GDPPC8024.12151 × 10−12
GDPPC ↔ PDEN2.230340.0743
Note: GHG shows GHG emissions, CTECH shows clean technologies, REC shows renewal energy consumption, NR shows natural resources, FDI shows inbound FDI, GDPPC shows GDP per capita, and PDEN shows population density. ↔ shows bidirectional causality, → shows unidirectional causality, and ҂ shows no causality.
Table 6. Robust Least Squares M-Estimates.
Dependent Variable: ln(GHG)
VariableCoefficientStd. Errorz-StatisticProb.
ln(GHG)t-10.0890.0332.6760.007
ln(CTECH)t0.2160.0822.6340.008
ln(REC)t−0.6060.033−17.9540.000
ln(NR)t−0.0070.001−4.2540.000
ln(GDPPC)t−0.0360.066−0.5510.581
ln(FDI)t0.0360.0084.2090.000
ln(PDEN)t3.4150.5026.7920.000
Constant−1.3002.113−0.6150.538
Robust Statistics
R-square0.908Adjusted R-square0.900
Rw-square0.999Adjust Rw-square0.999
AIC61.88SIC87.375
Rn2117,267.8Prob(Rn2)0.000
Note: GHG shows GHG emissions, CTECH shows clean technologies, REC shows renewal energy consumption, NR shows natural resources, FDI shows inbound FDI, GDPPC shows GDP per capita, and PDEN shows population density.
Table 7. IRF Predictions.
ResponseofGHG
YearGHGCTECHNRRECFDIGDPPCPDEN
2022224,034.7000000
2023159,039.3−9000.992−1240.1369656.4571534.3833098.407−3502.213
2024173,815.0−7546.904−11,047.25−5423.767−10,021.9612,632.65−1036.167
2025165,061.4−10,127.40−15,860.29−10,102.58−15,435.6116,165.67−2704.579
2026163,651.3−11,818.26−16,535.49−15,891.84−20,413.7320,055.55947.3631
2027160,175.8−14,136.64−14,664.45−19,529.05−24,217.6022,903.404810.768
2028157,379.7−16,357.57−11,601.91−22,703.10−26,907.5025,122.939468.832
2029154,363.3−18,586.09−8033.300−25,343.93−28,518.0526,649.2914,044.42
2030151,343.9−20,696.03−4531.044−27,752.27−29,214.8827,624.5818,389.26
2031148,212.5−22,666.80−1442.076−30,016.04−29,165.1028,152.2622,306.77
Note: GHG shows GHG emissions, CTECH shows clean technologies, REC shows renewal energy consumption, NR shows natural resources, FDI shows inbound FDI, GDPPC shows GDP per capita, and PDEN shows population density.
Table 8. VDA Predictions.
VarianceDecompositionofGHG
YearS.E.GHGCTECHNRRECFDIGDPPCPDEN
2022224,034.7100000000
2023275,109.299.735720.1070460.0020320.1232040.0031110.0126840.016206
2024326,138.499.370540.1297160.1161830.1153230.0966420.1590580.012541
2025366,844.198.786840.1787390.2787510.1669900.2534300.3199060.015348
2026403,536.798.085200.2334840.3982700.2930920.4653430.5113780.013235
2027436,381.397.348840.3046040.4535020.4509100.7059150.7127620.023471
2028466,432.796.593570.3896060.4588180.6315940.9506730.9139870.061755
2029494,126.095.828970.4886400.4352610.8258531.1801901.1052770.135812
2030519,845.495.057030.5999840.4008541.0311591.3821331.2810010.247841
2031543,841.794.280770.7219190.3669631.2467921.5504501.4384170.394692
Note: GHG shows GHG emissions, CTECH shows clean technologies, REC shows renewal energy consumption, NR shows natural resources, FDI shows inbound FDI, GDPPC shows GDP per capita, and PDEN shows population density.
Publisher’s Note: MDPI stays neutral with regard to jurisdictional claims in published maps and institutional affiliations.

