Article

Carbon Footprint and Total Cost Evaluation of Different Bio-Plastics Waste Treatment Strategies

Department of Civil, Environmental, Land, Building Engineering and Chemistry (DICATECh), Politecnico di Bari, Via E. Orabona n.4, 70125 Bari, Italy
*
Author to whom correspondence should be addressed.
Clean Technol. 2022, 4(2), 570-583; https://doi.org/10.3390/cleantechnol4020035
Submission received: 16 May 2022 / Revised: 4 June 2022 / Accepted: 7 June 2022 / Published: 16 June 2022
(This article belongs to the Special Issue Green Processes and Technologies for Environmental Applications)

Abstract

:
To address the problem of fossil-based pollution, bio-plastics have risen in use in a wide range of applications. The current waste management system still has some weakness for bio-plastics waste (BPW) treatment, and quantitative data is lacking. This study combines environmental and economic assessments in order to indicate the most sustainable and suitable BPW management treatment between organic, plastic and mixed wastes. For the scope, the carbon footprint of each scenario was calculated by life cycle assessment (LCA), while the total cost of the waste management system was used as an economic parameter. The economic evaluation revealed that the organic, plastic and mixed waste treatment routes reached a total cost of 120.35, 112.21 and 109.43 EUR, respectively. The LCA results showed that the incomplete degradation of BPW during anaerobic digestion and composting led to the disposal of the compost produced, creating an environmental burden of 324.64 kgCO2-Eq. for the organic waste treatment route, while the mixed and plastic treatment routes obtained a benefit of −87.16 and −89.17 kgCO2-Eq. respectively. This study showed that, although the current amount of BPW does not affect the treatment process of organic, plastic and mixed wastes, it can strongly affect the quality of the output, compromising its further reuse. Therefore, specific improvement of waste treatment should be pursued, particularly with regard to the anaerobic digestion of organic waste, which remains a promising technology for BPW treatment.

Graphical Abstract

1. Introduction

Due to its properties, wide range of application and low-cost production, conventional fossil plastic has reached a production of 57.9 million tons in Europe alone over the past centuries [1]. In the recent decades, Europe has addressed the high amount of waste from massive plastic production with material and energy recovery. However, the amount of plastic waste that is disposed in landfill is nowadays still 24.9% of the collected post-consumer plastic waste [2]. In addition, waste management remains inadequate or non-existent in many locations, resulting in the release of plastic waste into the environment. Once plastics reach the environment, their resistance and durability allow them to persist for hundreds of years, leading to the high possibility of interaction, ingestion and hazardous effects across food webs [3]. One possible solution to overcome the problem of plastic pollution is bio-plastics. Bio-plastics are a wide range of materials with different properties and applications. Based on the source (natural or fossil) and biodegradability, bio-plastics can be (i) bio-based and biodegradable, (ii) bio-based and non-biodegradable and (iii) fossil-based and biodegradable. In 2020, the global production of bioplastics was about 2.11 million tons (about 1% of the plastic produced annually), but the market for bio-plastics is continuously growing in terms of the quantity and diversification of possible applications [4]. Packaging, especially flexible packaging, remains the largest market for bioplastics, with 47% of the total bioplastics market in 2020 [5].
At end-of-life, bio-plastics waste (BPW) is not collected in a separate stream and can generally be collected with other municipal solid waste (MSW) fractions [6]. Generally, if the compostability standard (UNI EN 13432) is achieved, BPW can be treated with the organic fraction of MSW through industrial anaerobic digestion and/or composting [7]. In several studies, it has been shown that BPW does not affect anaerobic and composting treatment [8,9], as well as the effect on the soil of the produced compost [10]. On the other hand, the conditions of industrial composting and anaerobic digestion (e.g., temperature, retention time) may differ greatly from those that occurred during the compostability test. Thus, large amounts of non-degraded bioplastics remain at the end of the process, resulting in the contamination of the digestate and/or compost [11]. Italian legislation admits only 0.5 % w/w of inert materials such as glass, metals and plastics, without any distinction between biodegradable and conventional [12]. In fact, plastics, and even bio-plastics, are mechanically separated before biological processes and are often disposed of in landfills [13].
The spread of the amount and type of BPW is opening a re-thinking of its collection with organic waste. Therefore, the collection of BPW with plastics and mixed waste could be a suitable option for their treatment.
Nowadays, a comprehensive evaluation of different types of waste management from BPW is still missing. Most works have focused on anaerobic digestion and/or composting treatment of BPW, evaluating the suitability of different types of bio-plastics in this process [14,15]. BPW management with municipal plastic waste has rarely been investigated. Only the recycling process of conventional plastics has been evaluated, showing how even 5% w/w of BPW in a homogeneous plastic waste stream affects the quality of recycled polymers in terms of mechanical and thermal properties [16,17]. However, the influence of BPW on mixed waste processing is, to the best of our knowledge, lacking in the scientific literature. Only in Muenmee et al. [18] was the degradation of plastics after several different pretreatments with mixed waste in a semi-aerobic landfill environment. This lack is due to the still-low amount of BPW compared to other waste fractions. For this reason, the influence of BPW in the current MSW management system is still unclear but, neglecting clear consumer education and coordination of waste collection and treatment, BPW could influence the performance of the MSW management system [19].
Quantitative results are necessary for good planning of sustainable BPW management. Therefore, a combined environmental and economic impact assessment can be used to analyze the sustainability and suitability of the waste management system [20].
In this context, the present study aims to evaluate the sustainability and suitability of different waste treatment for BPW from an environmental and economic perspective. To this end, three waste treatment routes were assumed through the collection of BPW with organic, plastic and mixed waste streams. Then, in line with the current waste management system, the relative waste treatments were studied by combining a life cycle assessment (LCA) approach with an economic analysis.

2. Materials and Methods
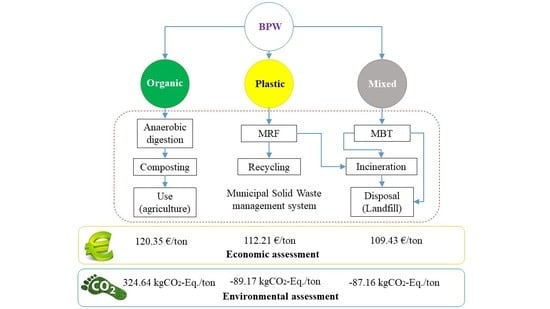
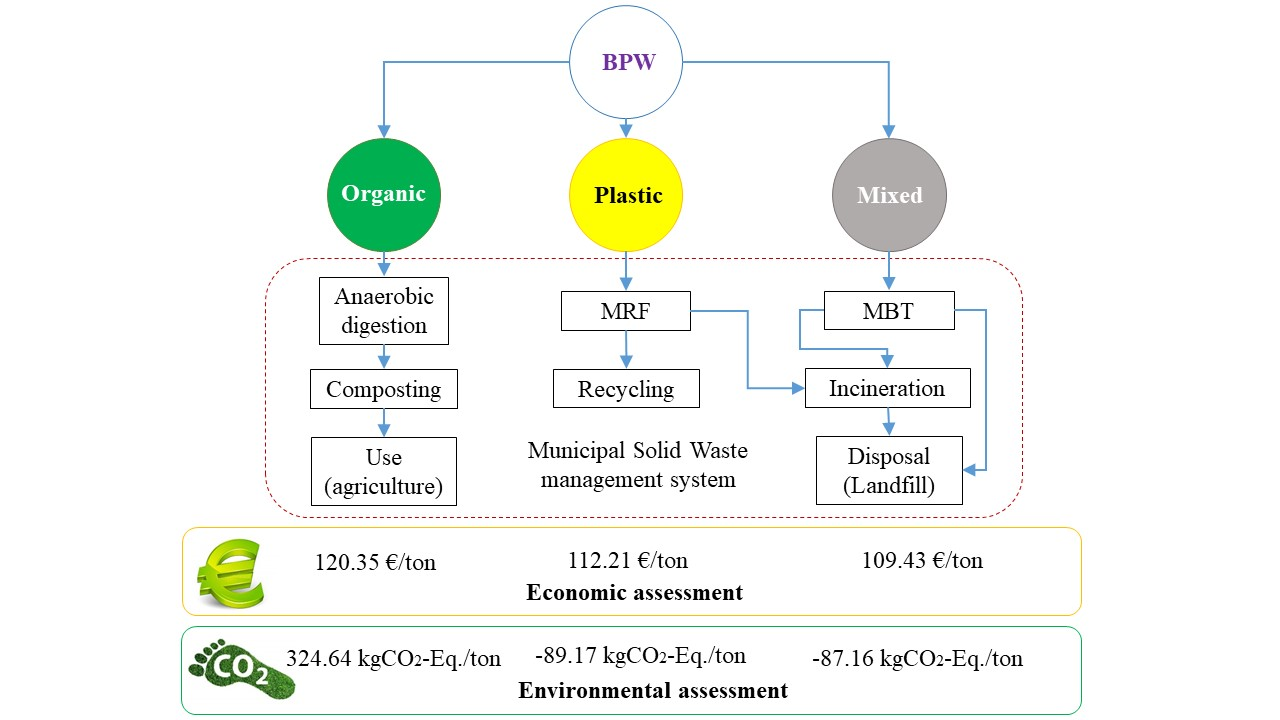
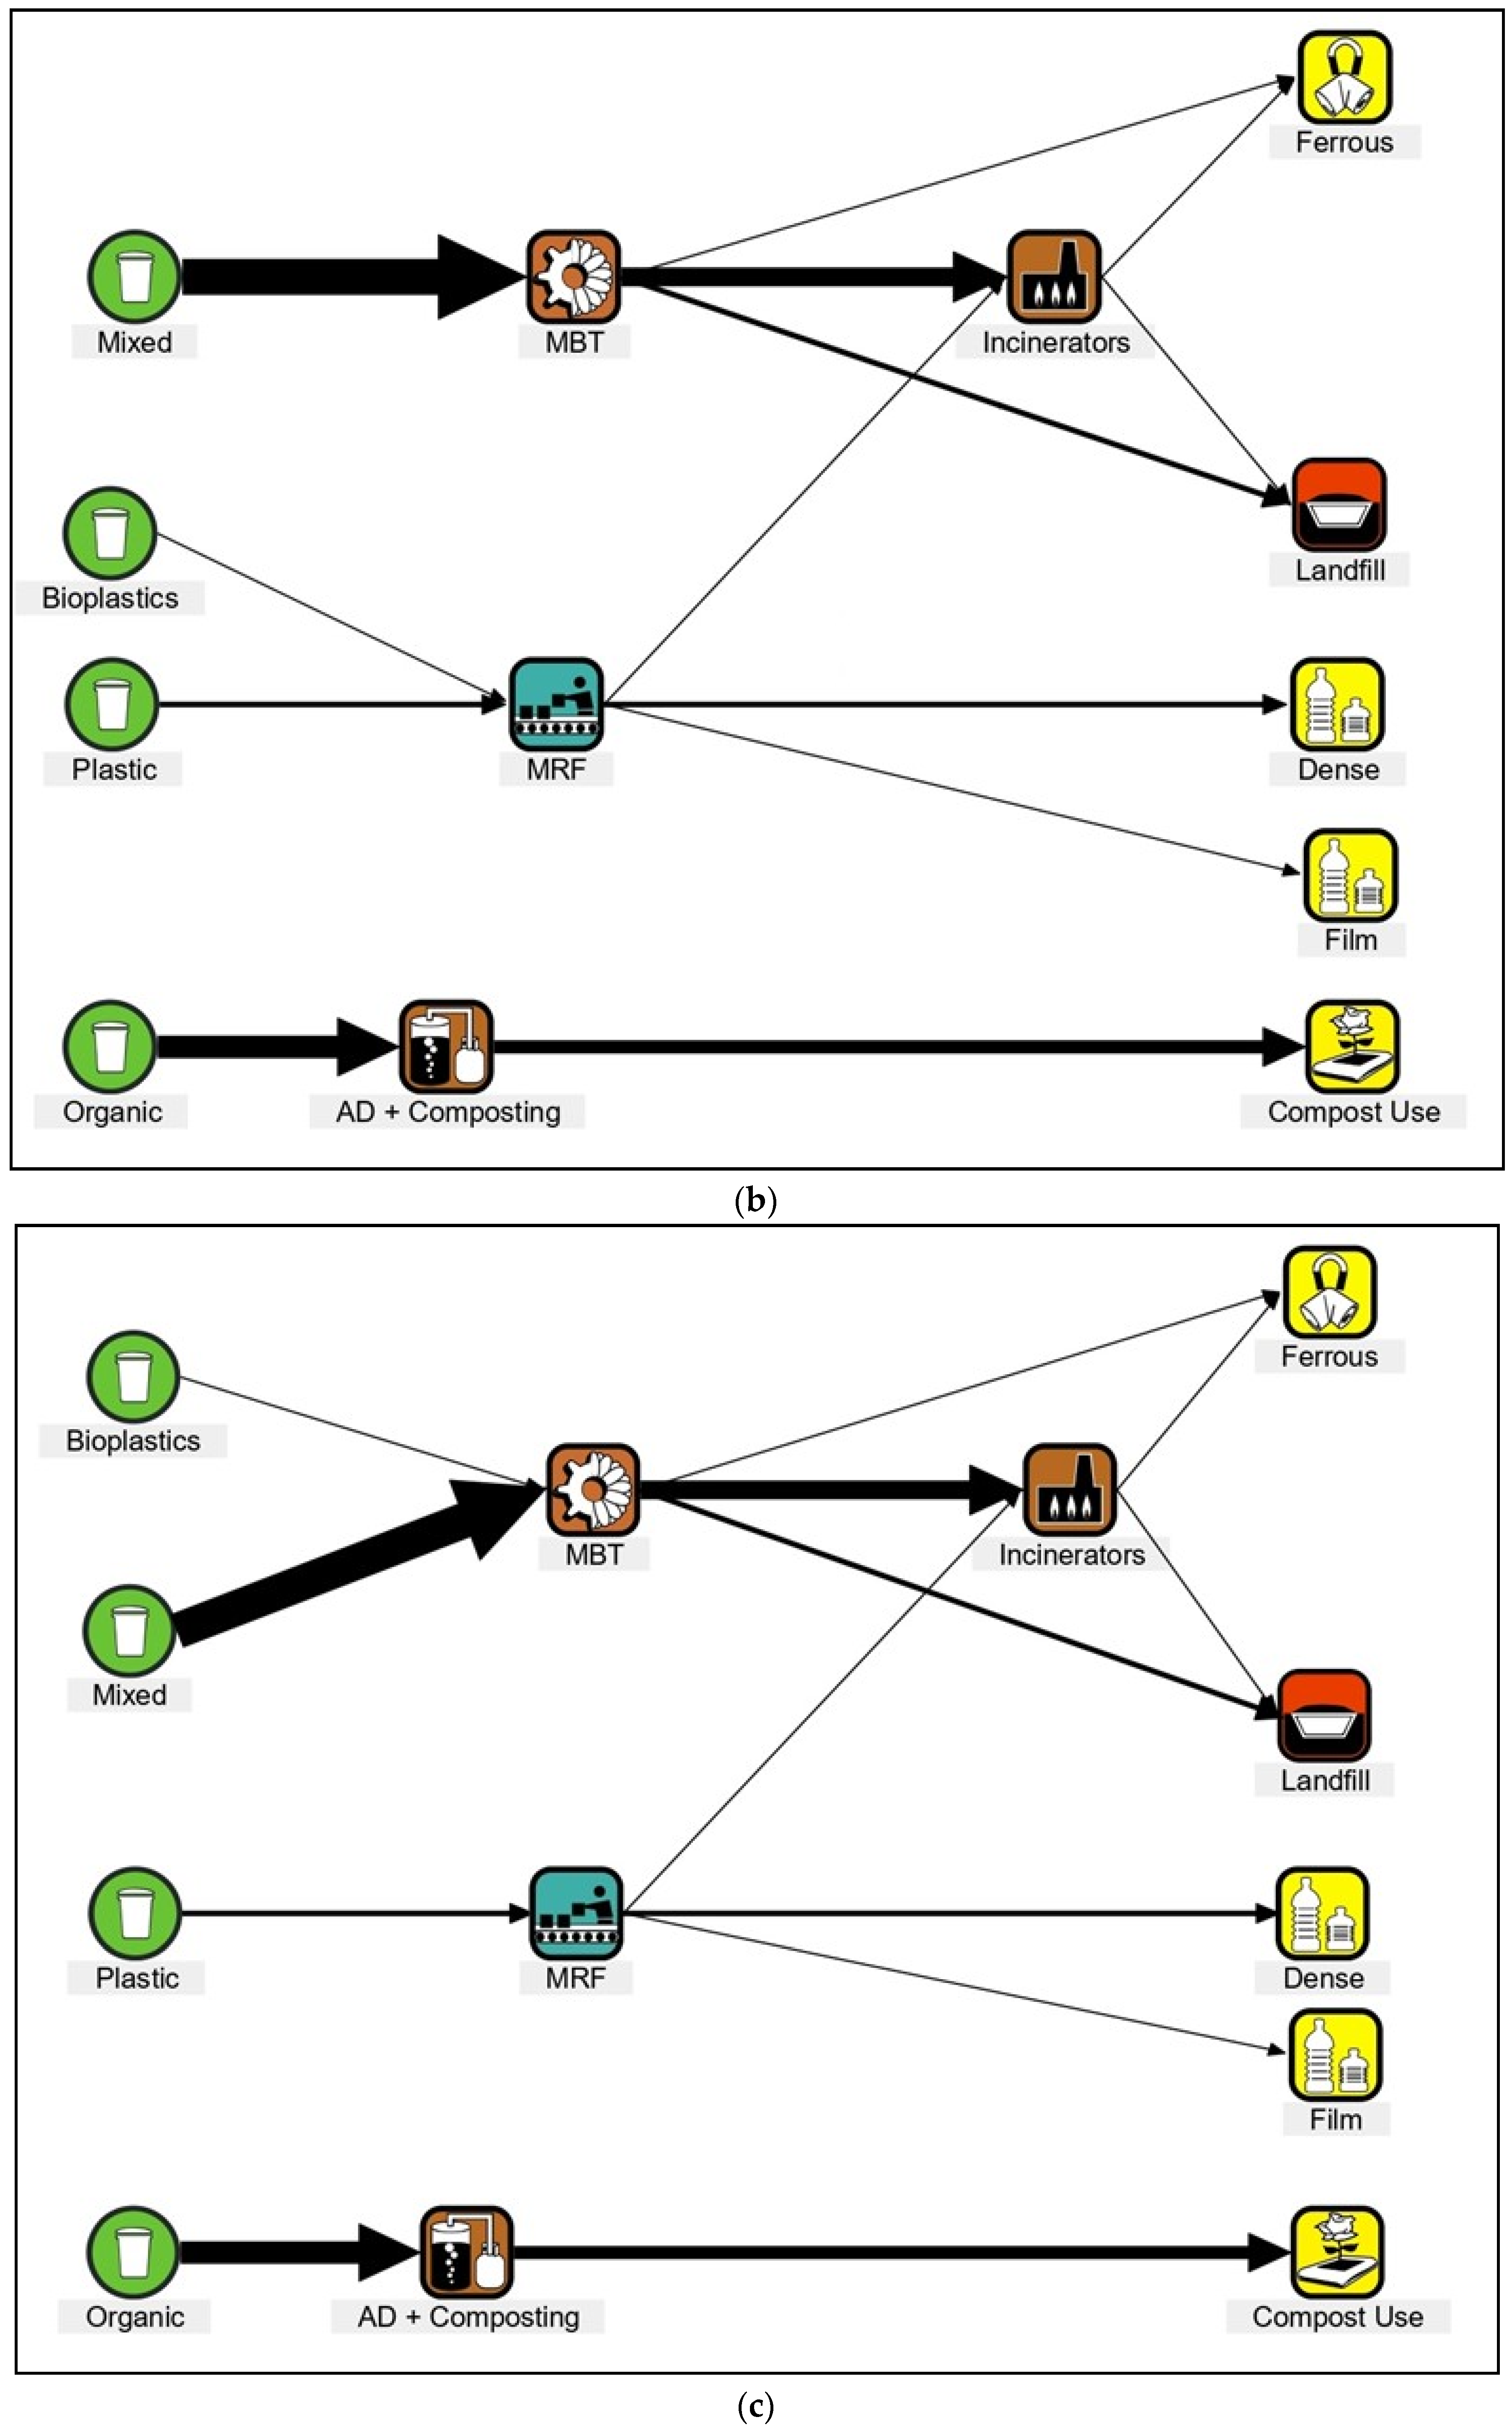
2.1. Framework

Both economic and environmental factor are complementary in the decision-making process and have to be consider together. Economic assessment provided a expense–revenue analysis of different solutions, while their performance from an environmental perspective was carried out through LCA. LCA was carried out with the WRATE (Waste and Resource Assessment Tool for Environment) software, provided by Golder. Due to its user-friendly view and its wide database, WRATE is the software suggested by the Italian Ministry of Ecological Transition for regional waste management planning. The use of WRATE in this study strengthened the application of the results for the BPW management planning. Economic and environmental assessment were based on the same system boundaries and assumptions. This analysis has been carried out from the waste-management-administration point of view: it has been hypothesized that the waste manager owned all of the waste treatment plants (except the landfill).

2.2. Goal and Scope Definition

The aim of this assessment was to identify the most suitable waste treatment route for BPW management, from a combined economic and environmental point of view. In this context, the BPW management has been assessed in the current waste management system, assuming their collection with the organic, plastic and mixed waste fractions of MSW, respectively. The assessment has been carried out on the waste management system as described in Figure 1.
The treatment for organic waste was composed by a combined anaerobic and composting process. During anaerobic digestion, thermal and electric energy are recovered through a combined heat and power (CHP) system. The output from anaerobic digestion is sent to composting in order to obtain compost for use in agriculture, if in compliant with the Italian quality standard [12]. If the quality is not ensured by a higher presence of contaminant BPW residues (>0.5%), the compost is disposed in a landfill, as it is not dangerous waste. The treatment of plastic waste consisted in a first sorting in a material recovery facility (MRF), wherein the plastic waste is sorted into two main streams: one for mechanical recycling and the other composed of a mix of non-recyclable plastics (PLASMIX), for energy recovery. Mixed waste was pre-treated with a mechanical–biological treatment (MBT), the aim of which is to increase the stability of waste through aerobic biostabilization. The biostabilite is then sorted into two main streams: a refuse-derived fuel (RDF) composed of dry waste as plastic, paper and textiles used for energy recovery; a stabilized organic fraction (SOF) that is disposed in a landfill. RDF and PLASMIX are treated together in an incinerator for thermal and electric energy recovery through a CHP system. In this system, three different routes have been identified by collecting BPW with each waste fraction. Thus, organic, plastic and mixed waste treatment scenarios have been proposed by assessing the collection of BPW in the organic, plastic and mixed waste streams, respectively.
In order to ensure the comparison of the different waste treatment routes, a consistent functional unit of 1 ton of MSW has been considered. The assessment boundaries comprised the transportation, treatment and disposal of waste (collection of waste has been neglected). Any environmental burdens for energy and material costs arising during the manufacture or use of the waste were excluded in this study (zero burdens approach) [21].

2.3. Inventory

With the inventory step, the determination of mass flows and the collection of all the data within the system boundaries are determined. LCA data included both materials and energy inputs and outputs (emissions into water and soil, residual waste amount and recovered materials), while economic data included expenses and revenues. For the first, the WRATE database Ecoinvent 2.1 and background data have been used. Instead, the economic assessment was based on data reported in scientific literature.
In line with the current amount of waste produced in Italy, BPW was 1.88% of the functional unit, while the organic, plastic and residual fraction of waste was 35.38%, 7.98% and 54.76%, respectively [22]. The amount of BPW in the MSW was calculated by summing the amount of bio-plastics in each waste stream assessed. In particular, 4.0% [13,23] and 1.1% [16] of organic and plastic waste, respectively, is made of bio-plastics. In addition, for the quantification of bio-plastics in a mixed waste stream, a specific analysis was performed in Italy [24], which revealed how bio-plastics are 0.58% of mixed waste. In life cycle analysis, the BPW properties considered were provided by the WRATE database.
To be consistent with the current Italian situation, the electricity mix has been assumed equal to the “Medium carbon mix” available in WRATE, in which fossil fuels and natural gas represented the main primary energy sources.
Concerning waste transportation, the assumed properties were described in D’Onza [25]. This stage has not been considered in the environmental analysis, since it was the same in all the scenarios.
The biological treatment has been modeled as a combined anaerobic digestion and composting process. After the pre-sorting of extraneous waste with a rotary drum, the waste is anaerobically digested at mesophilic temperature for 3 weeks. It resulted in a methane yield of 575 and 519 LCH4/kgVS for organic waste and BPW, respectively [8]. The energy from anaerobic digestion has been calculated considering a low heating value (LHV) of biogas of 35.2 MJ/m3 and an electrical and thermal efficiency of CHP system of 35% and 50%, respectively [26]. At the end of the anaerobic digestion stage, the waste is dewatered through a press and the pressed digestate is composted for 3 weeks with intensive aeration and for two months in piles at ambient temperature (curing). It was assumed that the plant has an air-emission treatment process, and the wastewater produced is treated before release. The final degradation of organic waste and BPW was equal to 73.50% and 73.82% of the incoming waste, respectively [8].
The materials recovery facility (MRF) was modeled according to the current sorting plant for plastic waste in Italy. The sorting process adopted consists of a semi-automatic procedure including optical sensors, magnetic separators, eddy separators and manual sorting [27]. After sorting, the valuable materials recovered are recycled and non-recyclable waste (PLASMIX) are sent to incineration for energy recovery, 47.26% and 52.74% of the input, respectively. The whole amount of BPW was considered collected in the PLASMIX stream, since it is mainly flexible packaging [5].
Aerobic MBT consists of a metal-separation step first, using magnetic sorting, and the subsequent aerobic biostabilization for 10–14 days; the result was that 23.8% and 22.55% of the incoming mixed waste and BPW were biodegraded respectively [18]. Exhausted hot air from active waste is re-circulated into the waste to ensure a high temperature. Finally, a screening allowed the separation of dry high calorific fractions used as RDF in incineration and low calorific fractions (SOF), which were sent to landfill (32.6% and 42.6% of the input, respectively) [28].
Concerning incineration, the grate furnace technology was considered in this study. Energy is recovered through a CHP system from flue gases, leaving the furnaces using a water-tube boiler and finned tube economizer. The gross energy generated during the incineration process was calculated from the LHV of the waste in the input. The LHV of RDF, PLASMIX, virgin and processed BPW from MBT were 21,123, 38,416, 18,932 and 18,316 kJ/kg, respectively [29,30]. The CHP efficiencies were 15% and 37.1% for electrical and heat recovery, respectively [31]. Fly and bottom ashes (consisting of 3% of the input [32]) were recovered and disposed in a landfill; CO and NOx abatement was performed with an Ecotube system.
A sanitary landfill was chosen for waste final disposal. The surface of the landfill area is covered progressively with inert materials. No gas recovery process has been selected.

2.4. Impact Assessment

2.4.1. Environmental

The adopted Life Cycle Impact Assessment (LCIA) methodology was IPCC-Fifth Assessment Report, using the Global Warming Potential (GWP) with a 100-year horizon [33] as characterization factor. The impact category indicator used is CO2 equivalent emissions (kg CO2-Eq), estimated as the weighted average of the emissions of each GHG and their corresponding GWP. The levels of carbon dioxide (CO2), methane (CH4) and nitrous oxide (N2O) has been evaluated, as these are the main direct GHGs regulated by the Kyoto Protocol and produced by various waste types through treatment plants [34].

2.4.2. Economic

The economic analysis has been carried out estimating the expenses and revenues of the waste management system in each scenario (Table 1). Then, by subtracting the revenues from the expenses, the specific cost of each scenario has been calculated.
The only expenses considered were related to plant operation, waste transportation and disposal. The waste-treatment tariff was not considered because of the assumption that the waste treatment facilities are owned by the waste management administration.
In addition to that presented in Table 1, revenue from the waste management system was also evaluated, as presented in the framework. For organic waste treatment, revenue came from the energy production during anaerobic digestion. For plastic waste treatment, the revenue from plastic waste sorting (for recycling and energy recovery has been) was considered. The revenue related to mixed waste treatment came from the energy from the incineration of the stabilized mixed waste and the sorted plastic waste, used for energy recovery. The prices for the selling of electric and thermal energy has been treated as equal to 0.2 and 0.045 EUR/kWh respectively [35].

3. Results

3.1. Mass and Energy Inventory

Figure 2 shows the waste-management-system mass streams for organic, plastic and mixed routes for BPW treatments. In Table 2, the mass and energy flows involved are summarized.
Concerning the organic waste treatment route, the collection of BPW with the organic fraction of MSW led to significant variation in the system. The conversion of BPW during the anaerobic digestion stage increased the amount of methane by about 18% compared to the one generated in the other two scenarios. Despite this increase of methane and then energy produced during the anaerobic digestion stage, the overall degradation of BPW was not suitable for compost quality standards, leading to the disposal of the produced compost in landfill (Figure 2a). Thus, that waste management system resulted in the largest amount of waste for disposal, despite the incineration generating the smallest amount of ashes.
In the plastic waste treatment route (Figure 2b), the input of MRF increased for the addition of BPW. This led to a higher amount of PLASMIX due to the shape of bio-plastics, easily comparable to non-recyclable plastic film. Compared to the organic route, the high amount of PLASMIX in input to incineration increased the energy recovered during this stage, generating a small amount of ashes. The use of pure organic waste in the biological treatment allowed the achievement of high-quality compost, which could be used in agriculture as fertilizer. This recovery resulted in a significant reduction (about 28%) of waste landfilled: from 333.50 kg in the organic scenario to about 240 kg in the other ones.
Finally, the mixed waste treatment route (Figure 2c) showed a rise in RDF produced during the MBT. The degradation occurred during this stage reduced the amount of BPW in the further incineration process but, since the LHV was comparable to the non-processed one, the final amount of the produced energy during this step was comparable with the one obtained in the plastic waste treatment route. However, compost recovery maintained the amount of waste landfilled below 300 kg. Importantly, this system generated the smallest amount of energy compared to the previous two scenarios.

3.2. Economic Results

The total cost of the waste management system for each BPW treatment route was used as the economic result. Table 3 provides each expense and revenue for the organic, plastic and mixed waste treatment routes for each treatment in the system.
First, the combined anaerobic digestion and composting process achieved the highest cost in each scenario, accounting for between 49.4% and 44.1% of the total expenses. Most of the expenses come from transportation (around 27%), while the expenses of the whole treatment did not exceed 17%. Instead, the landfilling cost for this treatment was present in the organic waste treatment route, because the low quality of compost required its disposal. Due to the large amount of waste processed, the second process with the highest expenses was the mixed waste one, composed by the MBT and incineration. However, transportation had a strong influence on expenses, constituting 17.3% to 19.1% of the total, but had fewer expenses than the biological treatment. Concerning the treatment process, the MBT achieved higher expenses (17.14–17.73€) than the incineration method (6.73–7.31€). Due to the high amount of SOF and also ashes post-incineration, the cost of landfilling was up to 28.83 EUR. Plastic sorting and the recycling process achieved a relatively low cost in the waste management system: 38.23 (12.3%) and 30.93 EUR (15.9%). The reason could be the well-established process in Italian society but also the lower amount of waste in the input. On the other hand, the MRF process revealed a cost comparable that of the MBT, although the amount of waste processed was nearly 15% of that treated by MBT. Overall, it can be seen that the collection of BPW in each waste stream has obviously increased the expenses of each specific treatment process.
Concerning revenues, the highest values were obtained from the mixed waste treatment during incineration. Although the efficiency of energy production is higher in the treatment of organic waste during biogas combustion, the highest waste input into the mixed waste system allowed for more energy and thus, more revenues. In fact, more than 90% of revenues were from the sale of energy; the remaining part came from the sorting of plastic waste.
Finally, all the scenarios achieved a positive cost, revealing how the expenses calculated exceeded the revenues. It is important to note that revenues from the tariff paid by users of the waste management system were not considered, as this assessment focused only on treatment. The BPW treatment cost revealed how the highest cost was achieved by the organic scenario (120.35 EUR), followed by the plastic (112.21 EUR) and mixed one (109.43 EUR).
The contribution of each process in the calculation of the total cost is shown in Figure 3. With the exception of landfilling, all of the process achieved a similar contribution. The overall treatment (anaerobic digestion and composting, MBT, MRF and incineration) was slightly over 20%. These values indicate how focusing on treatment alone would have led to an incorrect result. Waste transport accounted for the highest contribution in the economic evaluation, as this stage has a great influence in the waste management system [40]. Regarding energy generation, the results revealed that the collection of BPW in different waste streams did not significantly change the system. The same considerations can be highlighted for sorting revenues obtained in MRFs. The significant difference was found in landfilling. Considering that the amount of ash at the end of incineration is very similar in all scenarios, the key difference is based on the use of compost: the incomplete degradation of BPW reduces the quality of compost that has to be disposed of in the landfill. Thus, the contribution of landfilling in the organic waste treatment route increased from about 7% to 10.65%. Although BPW showed no significant effect on each waste treatment, its presence might strongly influence the quality of the output and thus its further use.

3.3. Environmental Results

The carbon footprint (CF) in terms of kgCO2-Eq. was used in this study in order to quantify the environmental impact of each scenario: CF results are shown in Table 4 and Figure 4.
The organic waste treatment route achieved the highest CF (324.64 kgCO2-Eq.) among the three scenarios, followed by mixed and plastic waste treatment routes (−87.16 and −89.17 kgCO2-Eq. respectively). The first main finding is that only two scenarios (plastic and mixed) showed a negative value, revealing how these systems generated an environmental benefit. Instead, the organic one achieved a positive CF, which signifies an environmental burden on the system. Indeed, a negative CF value means an environmental benefit/credit, whereas a positive value indicates an environmental burden [41]. With this concept, it is easy to note that the environmental credit in every scenario has been given from the combined anaerobic digestion and composting process and from the recycling of waste (plastics, compost, etc.). In fact, energy production during anaerobic digestion and the reuse of materials instead of virgin ones have reduced the GHG emissions in the systems. On the other hand, MRF, MBT, incineration and, especially, landfilling achieved a positive CF value. MRF and MBT are processes that require energy and generate GHG. In each of them, the introduction of BPW in plastic and mixed waste, respectively, (slightly) increased the CF values of about 0.3 kgCO2-Eq. Actually, the MRF in the waste management system had a negligible effect from an environmental point of view, since the contribution in the CF calculation was lower than 1%. Furthermore, incineration resulted in a positive value: the highest impact was the one obtained in the organic waste treatment route, wherein the energy production was the lowest. Indeed, despite incineration allowing the recovery of energy, it is known that this process is a source of GHG in the form of CO2, CO and N2O [42]. Finally, the highest environmental burden was achieved in every scenario by landfilling. In the plastic and mixed waste treatment routes, the CF value was 54.3 and 56 kgCO2-Eq., and the value was almost 10 times higher (454 kgCO2-Eq.) in the organic route. Indeed, the highest amount of waste landfilled, composed mainly of organic materials in the form of compost, increased the GHG emission produced during this stage. The degradation of compost in a semi-aerobic environment of landfill also generated CH4, with a GWP 21–23 times higher than CO2 [43]. This amount was not recovered by the plant and increased the CF value, resulting in 67.78% of the total CF value (Figure 4b).
On the overall, the contribution of each process in the CF calculation remained unchanged for mixed and plastic waste treatment routes. However, the collection of the current amount of BPW did not result in any significant variation on the environmental impact of the system. Landfilling maintained its 20% of the impact, while recycling constituted almost 49% (in a beneficial way). Anaerobic digestion and composting, incineration and MBT resulted in about 17%, 8% and 4% of the CF, respectively. On the other hand, the disposal of compost at the end of organic treatment diverged due to this tendency: all the other processes, except landfilling, showed a lower contribution, because disposal was predominant.

4. Discussion and Conclusions

The reduction of conventional fossil-based polymers has increased the use of bio-plastics, which is growing as a component of MSW. This study combined economic and environmental assessment to evaluate the impact of these wastes in the current waste management system, opening up other potential strategies. Three scenarios were then assumed, varying the collection of BPW with organic, plastic and mixed waste streams.
The economic evaluation revealed that the cost of the waste management system reached a positive value in each scenario. The highest was achieved by the organic waste treatment route, followed by plastic and mixed waste, respectively. In this evaluation, transportation had a significant cost, while the revenue was mainly driven by energy production during the anaerobic digestion and incineration stages. The incomplete degradation of BPW in the organic waste treatment route did not allow for the use of compost, which was landfilled. In fact, landfilling was the process that resulted in the cost difference.
The environmental assessment showed that the organic waste treatment route resulted in an environmental burden, while the plastic and mixed waste treatment routes resulted in an environmental benefit. This result was again due to compost disposal: the recycling benefit (which accounted for nearly half of the CF) was not sufficient to mitigate this impact. Anaerobic digestion produced an environmental benefit. Incineration and the other waste treatment (MRF and MBT) also contributed to the environmental burden.
This study showed that the current amount of BPW in the waste management system is still low and highlighted significant variation in each treatment process (anaerobic digestion, composting, MRF, MBT and incineration). On the other hand, even a small amount of BPW could strongly influence the quality of waste treatment process output, generating significant impact both economically and environmentally. Therefore, new management strategies should be pursued to achieve the adequate efficiency of the current waste management system. In addition, waste treatment (especially the organic route) needs to be improved by focusing on waste-to-energy strategies. Indeed, anaerobic digestion has remained a suitable method for treating organic waste as BPW but needs to be improved by adopting a higher temperature (thermophilic) or retention time. The specific treatment of bio-plastics in appropriate facilities could also help avoid contamination of outputs.

Author Contributions

Conceptualization, S.D.G. and G.G.; methodology, S.D.G. and G.G.; software, G.G. and F.T.; validation, S.D.G. and M.N.; formal analysis, G.G.; investigation, G.G.; resources, S.D.G. and M.N.; data curation, G.G. and F.T.; writing—original draft preparation, S.D.G. and G.G.; writing—review and editing, S.D.G., F.T. and M.N.; supervision, M.N.; project administration, S.D.G.; funding acquisition, S.D.G. All authors have read and agreed to the published version of the manuscript.

Funding

This research was funded by the project Prin 2017 “MultIFunctional poLymer cOmposites based on groWn matERials (MIFLOWER)” from the Italian Ministry of Education University and Research, grant number 2017B7MMJ5_001.

Institutional Review Board Statement

Not applicable.

Informed Consent Statement

Not applicable.

Acknowledgments

The authors would like to specially acknowledge the support from Golder that provided the academic license for the WRATE software.

Conflicts of Interest

The authors declare no conflict of interest.

References

  1. PlasticsEurope. Plastics Europe; Association of Plastics Manufacturers: Washington, DC, USA, 2020. [Google Scholar]
  2. Geyer, R.; Jambeck, J.R.; Law, K.L. Production, use, and fate of all plastics ever made. Sci. Adv. 2017, 3, e1700782. [Google Scholar] [CrossRef] [PubMed] [Green Version]
  3. Horton, A.A.; Barnes, D.K.A. Microplastic pollution in a rapidly changing world: Implications for remote and vulnerable marine ecosystems. Sci. Total Environ. 2020, 738, 140349. [Google Scholar] [CrossRef] [PubMed]
  4. Mazhandu, Z.S.; Muzenda, E.; Mamvura, T.A.; Belaid, M.; Nhubu, T. Integrated and consolidated review of plastic waste management and bio-based biodegradable plastics: Challenges and opportunities. Sustainability 2020, 12, 8360. [Google Scholar] [CrossRef]
  5. European Bioplastics Bioplastics Market Development Update 2019. Available online: https://www.european-bioplastics.org/market/ (accessed on 6 June 2022).
  6. De Gisi, S.; Gadaleta, G.; Gorrasi, G.; La Mantia, F.P.; Notarnicola, M.; Sorrentino, A. The role of (bio)degradability on the management of petrochemical and bio-based plastic waste. J. Environ. Manag. 2022, 310, 114769. [Google Scholar] [CrossRef]
  7. Girotto, F.; Lavagnolo, M.C.; Pivato, A.; Cossu, R. Acidogenic fermentation of the organic fraction of municipal solid waste and cheese whey for bio-plastic precursors recovery—Effects of process conditions during batch tests. Waste Manag. 2017, 70, 71–80. [Google Scholar] [CrossRef] [PubMed]
  8. Gadaleta, G.; De Gisi, S.; Picuno, C.; Heerenklage, J.; Cafiero, L.; Oliviero, M.; Notarnicola, M.; Kuchta, K.; Sorrentino, A. The influence of bio-plastics for food packaging on combined anaerobic digestion and composting treatment of organic municipal waste. Waste Manag. 2022, 144, 87–97. [Google Scholar] [CrossRef]
  9. Bandini, F.; Frache, A.; Ferrarini, A.; Taskin, E.; Cocconcelli, P.S.; Puglisi, E. Fate of Biodegradable Polymers under Industrial Conditions for Anaerobic Digestion and Aerobic Composting of Food Waste. J. Polym. Environ. 2020, 28, 2539–2550. [Google Scholar] [CrossRef]
  10. Haider, T.P.; Völker, C.; Kramm, J.; Landfester, K.; Wurm, F.R. Plastics of the Future? The Impact of Biodegradable Polymers on the Environment and on Society. Angew. Chem. Int. Ed. 2018, 58, 50–62. [Google Scholar] [CrossRef] [Green Version]
  11. Cucina, M.; De Nisi, P.; Trombino, L.; Tambone, F.; Adani, F. Degradation of bioplastics in organic waste by mesophilic anaerobic digestion, composting and soil incubation. Waste Manag. 2021, 134, 67–77. [Google Scholar] [CrossRef]
  12. Decreto Legislativo Decreto Legislativo 29 Aprile 2010, n. 75, 2010. Riordino e Revisione Della Disciplina in Materia di Fertilizzanti, a Norma Dell’articolo 13 Della Legge 7 Luglio 2009 n. 88. Gazz. Uff. n. 121—Suppl. Ordin. n.106, Roma. 2010. Available online: www.gazzettaufficiale.it/eli/gu/2010/05/26/121/so/106/sg/pdf (accessed on 6 June 2022).
  13. Cucina, M.; de Nisi, P.; Tambone, F.; Adani, F. The role of waste management in reducing bioplastics’ leakage into the environment: A review. Bioresour. Technol. 2021, 337, 125459. [Google Scholar] [CrossRef]
  14. Bandini, F.; Taskin, E.; Vaccari, F.; Soldano, M.; Piccinini, S.; Frache, A.; Remelli, S.; Menta, C.; Cocconcelli, P.S.; Puglisi, E. Anaerobic digestion and aerobic composting of rigid biopolymers in bio-waste treatment: Fate and effects on the final compost. Bioresour. Technol. 2022, 351, 126934. [Google Scholar] [CrossRef] [PubMed]
  15. Battista, F.; Frison, N.; Bolzonella, D. Can bioplastics be treated in conventional anaerobic digesters for food waste treatment? Environ. Technol. Innov. 2021, 22, 101393. [Google Scholar] [CrossRef]
  16. Alaerts, L.; Augustinus, M.; Van Acker, K. Impact of bio-based plastics on current recycling of plastics. Sustainability 2018, 10, 1487. [Google Scholar] [CrossRef] [Green Version]
  17. Kuciel, S.; Kuźniar, P.; Nykiel, M. Biodegradable polymers in the general waste stream—The issue of recycling with polyethylene packaging materials. Polymers 2018, 63, 31–37. [Google Scholar] [CrossRef]
  18. Muenmee, S.; Chiemchaisri, W.; Chiemchaisri, C. Enhancement of biodegradation of plastic wastes via methane oxidation in semi-aerobic landfill. Int. Biodeterior. Biodegrad. 2016, 113, 244–255. [Google Scholar] [CrossRef]
  19. Calabrò, P.S.; Grosso, M. Bioplastics and waste management. Waste Manag. 2018, 78, 800–801. [Google Scholar] [CrossRef]
  20. Liu, J.; Huang, Z.; Wang, X. Economic and environmental assessment of carbon emissions from demolition waste based on LCA and LCC. Sustainability 2020, 12, 6683. [Google Scholar] [CrossRef]
  21. Oldfield, T.L.; White, E.; Holden, N.M. The implications of stakeholder perspective for LCA of wasted food and green waste. J. Clean. Prod. 2018, 170, 1554–1564. [Google Scholar] [CrossRef]
  22. ISPRA. Rapporto Rifiuti Urbani Edizione 2021; Institute for Environmental Protection and Research (ISPRA): Rome, Italy, 2021. [Google Scholar]
  23. Dolci, G.; Venturelli, V.; Catenacci, A.; Ciapponi, R.; Malpei, F.; Romano Turri, S.E.; Grosso, M. Evaluation of the anaerobic degradation of food waste collection bags made of paper or bioplastic. J. Environ. Manag. 2022, 305, 114331. [Google Scholar] [CrossRef]
  24. IPLA spa—Istituto per le Piante da Legno e l’Ambiente. Composition Analysis Evaluation of LHV of Mixed Municipal Waste to Incineration; Istituto per le Piante da Legno e l’Ambiente: Torino, Italy, 2015. (In Italian) [Google Scholar]
  25. D’Onza, G.; Greco, G.; Allegrini, M. Full cost accounting in the analysis of separated waste collection efficiency: A methodological proposal. J. Environ. Manag. 2016, 167, 59–65. [Google Scholar] [CrossRef]
  26. Molino, A.; De Gisi, S.; Petta, L.; Franzese, A.; Casella, P.; Marino, T.; Notarnicola, M. Experimental and theoretical investigation on the recovery of green chemicals and energy from mixed agricultural wastes by coupling anaerobic digestion and supercritical water gasification. Chem. Eng. J. 2019, 370, 1101–1110. [Google Scholar] [CrossRef]
  27. Gadaleta, G.; De Gisi, S.; Binetti, S.M.C.; Notarnicola, M. Outlining a comprehensive techno-economic approach to evaluate the performance of an advanced sorting plant for plastic waste recovery. Process Saf. Environ. Prot. 2020, 143, 248–261. [Google Scholar] [CrossRef]
  28. Gadaleta, G.; Todaro, F.; De Gisi, S.; Gadaleta, V.; Notarnicola, M. Evaluating the performance of a Municipal Solid Waste MBT plant. Ing. Dell’Ambiente 2021, 8, 91–102. (In Italian) [Google Scholar] [CrossRef]
  29. Gala, A.; Guerrero, M.; Serra, J.M. Characterization of post-consumer plastic film waste from mixed MSW in Spain: A key point for the successful implementation of sustainable plastic waste management strategies. Waste Manag. 2020, 111, 22–33. [Google Scholar] [CrossRef]
  30. Van der Harst, E.; Potting, J. A critical comparison of ten disposable cup LCAs. Environ. Impact Assess. Rev. 2013, 43, 86–96. [Google Scholar] [CrossRef]
  31. Di Maria, F.; Sisani, F. Effectiveness of municipal solid waste incinerators in replacing other fuels. A primary energy balance approach for the EU28. Waste Manag. Res. 2018, 36, 942–951. [Google Scholar] [CrossRef]
  32. Xin-Gang, Z.; Gui-Wu, J.; Ang, L.; Yun, L. Technology, cost, a performance of waste-to-energy incineration industry in China. Renew. Sustain. Energy Rev. 2016, 55, 115–130. [Google Scholar] [CrossRef]
  33. IPCC Intergovernmental Panel on Climate Change. Fifth Assessment Report: Climate Change. 2013. Available online: https://www.ipcc.ch/report/ar5/syr/ (accessed on 6 June 2022).
  34. Marrucci, L.; Marchi, M.; Daddi, T. Improving the carbon footprint of food and packaging waste management in a supermarket of the Italian retail sector. Waste Manag. 2020, 105, 594–603. [Google Scholar] [CrossRef]
  35. Gadaleta, G.; De Gisi, S.; Notarnicola, M. Feasibility analysis on the adoption of decentralized anaerobic co-digestion for the treatment of municipal organic waste with energy recovery in urban districts of metropolitan areas. Int. J. Environ. Res. Public Health 2021, 18, 1820. [Google Scholar] [CrossRef]
  36. Palese, A.M.; Persiani, A.; D’Adamo, C.; Pergola, M.; Pastore, V.; Sileo, R.; Ippolito, G.; Lombardi, M.A.; Celano, G. Composting as manure disposal strategy in small/medium-size livestock farms: Some demonstrations with operative indications. Sustainability 2020, 12, 3315. [Google Scholar] [CrossRef] [Green Version]
  37. Rigamonti, L.; Borghi, G.; Martignon, G.; Grosso, M. Life cycle costing of energy recovery from solid recovered fuel produced in MBT plants in Italy. Waste Manag. 2019, 99, 154–162. [Google Scholar] [CrossRef] [PubMed]
  38. Bozorgirad, M.A.; Zhang, H.; Haapala, K.R.; Murthy, G.S. Environmental impact and cost assessment of incineration and ethanol production as municipal solid waste management strategies. Int. J. Life Cycle Assess. 2013, 18, 1502–1512. [Google Scholar] [CrossRef]
  39. Ghosh, S.K.; Di Maria, F. A comparative study of issues, challenges and strategies of bio-waste management in India and Italy. Detritus 2018, 1, 8–17. [Google Scholar] [CrossRef]
  40. Gadaleta, G.; De Gisi, S.; Todaro, F.; Campanaro, V.; Teodosiu, C.; Notarnicola, M. Sustainability assessment of municipal solid waste separate collection and treatment systems in a large metropolitan area. Sustain. Prod. Consum. 2021, 29, 328–340. [Google Scholar] [CrossRef]
  41. Coelho, L.M.G.; Lange, L.C. Applying life cycle assessment to support environmentally sustainable waste management strategies in Brazil. Resour. Conserv. Recycl. 2018, 128, 438–450. [Google Scholar] [CrossRef]
  42. Yang, N.; Zhang, H.; Chen, M.; Shao, L.M.; He, P.J. Greenhouse gas emissions from MSW incineration in China: Impacts of waste characteristics and energy recovery. Waste Manag. 2012, 32, 2552–2560. [Google Scholar] [CrossRef] [PubMed]
  43. Sohoo, I.; Ritzkowski, M.; Heerenklage, J.; Kuchta, K. Biochemical methane potential assessment of municipal solid waste generated in Asian cities: A case study of Karachi, Pakistan. Renew. Sustain. Energy Rev. 2021, 135, 110175. [Google Scholar] [CrossRef]
Figure 1. Scheme of the waste management system and waste treatment routes hypothesized.
Cleantechnol 04 00035 g001
Figure 2. Mass inventory of organic (a), plastic (b) and mixed (c) waste treatment routes.
Cleantechnol 04 00035 g002aCleantechnol 04 00035 g002b
Figure 3. Contribution of each process in the economic assessment of organic, plastic and mixed waste treatment routes.
Cleantechnol 04 00035 g003
Figure 4. Carbon footprint results (a) and process contribution in the CF value (b) of organic, plastic and mixed waste treatment routes.
Cleantechnol 04 00035 g004aCleantechnol 04 00035 g004b
Table 1. Specific expenses and revenues in terms of EUR/ton used in the economic analysis.
Waste TreatmentExpense/Revenue Ref.
OrganicAnaerobic digestion plant operational cost105[35]
Anaerobic digestion plant operational cost13[36]
Organic waste transportation cost183[25]
PlasticWaste sorting revenue (recycling)210[27]
Waste sorting revenue (PLASMIX)75[27]
Fines for waste contamination4.25[27]
MRF operational cost159[27]
Plastic waste transportation cost224[25]
MixedMBT operational cost31[37]
Incineration plant operational cost31[38]
Mixed waste transportation cost79[25]
Disposal in landfill tariff120[39]
Table 2. Mass and energy inventory of organic, plastic and mixed waste treatment routes for every treatment.
TreatmentStreamOrganicPlasticMixed
AD + compostingInput [kg]372.66353.82353.82
Compost [kg]98.7193.7893.78
% BPW in compost [%]5.000.000.00
Biogas produced [m3CH4]54.8746.6146.61
Electric energy [kWh]187.78159.51159.51
Thermal energy [kWh]268.25222.87222.87
MRFInput [kg]79.7798.6179.77
Recycled [kg]37.7737.7737.77
PLASMIX [kg]42.0760.9142.07
MBTInput [kg]547.57547.57566.41
RDF [kg]178.51178.51193.10
SOF [kg]233.10233.10233.10
IncinerationInput [kg]220.58239.42235.17
Electric energy [kWh]224.45239.31235.59
Thermal energy [kWh]555.13591.90582.69
Ashes [kg]6.627.187.06
TotalWaste landfilled [kg]333.50240.28240.16
Electric energy [kWh]412.23398.82395.09
Thermal energy [kWh]823.39819.77810.55
Table 3. Waste management system expenses, revenues and costs of the organic, plastic and mixed waste treatment routes’ values and contribution (%).
OrganicPlasticMixed
EUR%EUR%EUR%
EXPENSES250.93 241.36 236.01
Organic123.9249.4%106.4144.1%106.4145.1%
Treatment43.9717.5%41.7517.3%41.7517.7%
Landfill11.854.7%0.000.0%0.000.0%
Transportation68.1027.2%64.6626.8%64.6627.4%
Plastic30.9312.3%38.2315.9%30.9313.1%
Fines0.340.1%0.420.2%0.340.1%
Treatment12.695.1%15.686.5%12.695.4%
Transportation17.907.1%22.139.2%17.907.6%
Mixed96.0838.3%96.7240.0%98.6741.8%
Treatment (MBT)17.146.8%17.147.1%17.737.5%
Treatment (Inc.)6.732.7%7.313.0%7.183.0%
Landfill28.7711.5%28.8311.9%28.8212.2%
Transportation43.4417.3%43.4418.0%44.9419.1%
REVENUES130.58 129.15 126.58
Organic49.6338.0%42.1632.6%42.1633.3%
Energy49.6338.0%42.1632.6%42.1633.3%
Plastic11.088.5%12.499.7%11.088.7%
Recycling7.926.1%7.926.1%7.926.3%
PLASMIX3.162.4%4.573.6%3.162.5%
Mixed69.8753.5%74.5057.7%73.3458.0%
Energy69.8753.5%74.5057.7%73.3458.0%
COST120.35112.21109.43
Table 4. Carbon footprint (CF) in terms of kgCO2-Eq. of the whole waste management system and for each treatment for organic, plastic and mixed waste treatment routes.
TreatmentOrganicPlasticMixed
MRF1.241.531.24
AD + composting−54.6−47.2−47.2
MBT11.411.411.8
Incineration30.621.822
Landfill45454.356
Recycling−118−131−131
Total324.64−89.17−87.16
Publisher’s Note: MDPI stays neutral with regard to jurisdictional claims in published maps and institutional affiliations.

