1. Introduction
Global warming, i.e., the rapid and unusual increase in the earth’s average surface temperature, is considered one of the major current environmental issues. It is caused by the increased amount of anthropogenic greenhouse gas emissions (carbon dioxide, methane, nitrous oxide and water), which can trap solar radiation in the form of heat. To respond to these environmental pressures, the target set by the European Union in the Roadmap for 2050 is the reduction of greenhouse gas emissions by 40% below the 1990 values by 2030, by 60% by 2040 and by 80% by 2050. The European Commission has thus defined three alternative approaches that could contribute positively towards achieving these targets: (a) wider implementation of renewable energy sources, (b) low carbon energy supply options, supported by carbon capture, and (c) energy-saving measures.
Carbon capture has been thus recognised by many as a mitigation tool for global warming. In terms of carbon capture and storage (CCS), it can reduce carbon dioxide (CO2) emissions by capturing and storing CO2 underground. Carbon capture and utilization (CCU) is an alternative way of reducing CO2 emissions via recycling, by capturing CO2 and purifying it to the required standards of industries. The purified CO2 is transported by the available means of transportation to an industrial process to be sold for profit and reuse.
CCU value chains have not been widely commercialised yet because they face multiple technical, legislative and social barriers (e.g., utilization options, source-sink matching, lack of relevant policy and regulations, market, public acceptance, construction rate), but the most critical parameter towards their commercialization is their economic viability [
1,
2,
3]. The economic components of a CCU value chain include capture cost, transportation cost, utilisation cost (which expresses the modification required in the production line of the receiver) and the profits from the carbon trading market and selling of captured CO
2. A CCU value chain is considered viable when the profits from selling captured the CO
2 and carbon trading market are higher than capture, transportation and utilization costs [
4]. Estimations show that capture costs comprise 70–90% of costs of the whole value chain, making capture costs the component with the greatest importance and the critical economic barrier (or driver) in the development and commercialization of CCU value chains [
5,
6].
For this reason, and since capture is an integral part of CCS value chains as well, carbon capture has been given a lot of attention and many studies focused on the quantification and reporting of CO2 capture costs. This paper will therefore aim to review such studies, where capture costs have been quantified, homogenise the approaches used and explain how their quantification can be incorporated in the optimisation of CCS or CCU value chains to facilitate its commercialisation. The paper also presents statistical models, and the methodology of developing such models, for the quantification of CO2 capture costs using chemical absorption, physical absorption and oxyfuel combustion capture technologies.
2. Materials and Methods
To build the models for the estimation of carbon capture costs, a thorough literature review has been performed, collecting all the relevant published literature, and presented in
Section 2.1. The collected data have been grouped based on the carbon source and technology used, and several models have been developed (
Section 2.2).
2.1. Carbon Capture Costs
The importance of the economic viability of CCS and CCU value chains has led many authors and organisations to quantify and report them and as a result, different nomenclature and costing/reporting methods emerged [
7,
8]. Although there are many approaches and methods to estimate economic data, which are carried without specified boundary conditions or consistency, certain similarities exist across studies, which show consistency in the cost elements and metrics of CCS and CCU. Various previously published reviews highlighted the inconsistencies in nomenclature, costing and reporting methods and proposed a framework for the reporting of CCS and CCU cost data [
7,
8,
9,
10].
2.1.1. Components of Carbon Capture Costs
Carbon capture costs are divided into two categories; capital costs and operating and maintenance costs. Capital costs can be expressed in a number of ways where each expression covers the required costs for building and completing a project in increasing depth of detail considering more costs.
The Bare Elected Cost (BEC) of a carbon capture project is a value estimated by the contractor to complete the project and includes the cost of all the required equipment, materials and labour. BEC can be rated according to the level of detail ranging from simplified, least detailed to finalised, most detailed. BEC serves as the core for costing CCS projects as other cost elements are estimated as a percentage of this value [
7,
11].
The Engineering, Procurement and Construction (EPC) cost is the BEC cost increased by the cost of fees for additional engineering services, estimated as a percentage of BEC. EPC costs include direct and indirect costs related to project management, engineering, facilities, equipment and labour [
7,
12].
The Total Plant Cost (TPC) is a term that includes BEC, additional engineering services and contingency costs. The contingency costs of a project are included to account for the risks associated with technological maturity, performance and regulatory difficulties. Contingency costs can be estimated as a percentage of BEC or EPC according to the level of detail [
7,
11,
12]. TPC is rarely used for reporting capital costs.
The Total Overnight Cost (TOC) equals the total plant cost increased by the owner’s cost, which covers components that have not been taken into account (e.g., feasibility studies, surveys, land, insurance, permitting, finance transaction costs, pre-paid royalties, initial catalyst and chemicals, inventory capital, pre-production (start-up), other site-specific items unique to the project). The owner’s costs do not include interest during construction [
7,
11,
12]. TOC is rarely used for reporting capital costs.
Finally, the Total Capital Requirement (TCR) sometimes referred to as Total As Spent Cost (TASC) or Total Capital Cost (TCC) is the sum of all the previously mentioned costs, before including interest during construction [
7,
11,
12]. TCR is the most common method of reporting capital costs.
Operating and maintenance costs are expressed as fixed and variable depending on whether a component has a fixed or variable cost and involve all costs of running a project. They are usually reported as a single value, but they can be broken down into more components if needed, using estimations provided from different organisations. O&M costs are estimated as a percentage of capital cost (usually between 3–15%) [
7,
13,
14].
Fixed operating and maintenance costs are independent of plant size and consist of operating, maintenance, administrative and support labour, maintenance materials, property taxes and insurance [
7]. Variable operating and maintenance costs include cost components that are directly proportional to the production of the product (usually the amount of electricity produced). Those components include fuel, other consumables, waste disposal, by-product sales or emissions tax [
7].
2.1.2. Carbon Capture Metrics
A series of metrics have been introduced to express the economic viability of a carbon capture plant investment and allow the comparison between different configurations.
The Levelized Cost of Electricity (LCOE) is a metric that is widely applied but can only be applied to power producing industries. It expresses the price that electricity should be sold, for the capture investment to be profitable, based on a specified return on investment (ROI) and project lifetime. It is estimated by incorporating all expenses related to producing a certain amount of electricity per year, for a specified project lifetime and ROI [
7,
9,
15]. Therefore, it serves as an indicator for the potential profitability of a specific project and allows comparison between projects with different plant sizes and electricity generation technologies, assuming project lifetime and ROI are the same and TCR costs are estimated in similar ways. Another similar metric is the first-year cost of electricity, which is identical to LCOE with the only difference that inflation rates and cost escalation rates are assumed to be zero for the first year of operation [
7,
9].
The cost of CO
2 avoided quantifies the average cost of avoiding a unit of CO
2 per unit of useful product by comparing a plant with capture to a reference plant of similar type and size, without a capture unit. This metric is equal to the CO
2 emission tax for which the cost of producing a unit of product for a plant without capture is equal to the same cost of a plant with capture and includes costs of capture (including transportation and storage/utilization, otherwise CO
2 will not be avoided) [
7,
9,
10]. The cost of CO
2 captured is a similar indicator with the only difference that it covers only the cost of capturing and producing CO
2 as a chemical product, and unlike the cost of CO
2 avoided metric, it excludes transportation and storage/utilization. Both indicators are expressed in monetary units per tCO
2 [
1,
2,
10].
The cost of CO
2 abated quantifies the cost of minimising CO2 emissions by changing the process of producing electricity, i.e., by modifying the process in any way, changing generators, fuel, region, country, and utility system, anything that changes the current situation to one with lower CO
2 emissions including CCS [
10]. The energy penalty metric expresses the power output difference between a power plant with carbon capture and a similar reference power plant without capture.
From all the above-mentioned metrics, the only metric that quantifies the cost of CO2 capture and is appropriate for our study is the “cost of CO2 captured”. It includes only the stage of capturing and excludes the transportation and any potential storage or utilization.
2.2. Estimation of Carbon Capture Costs
The objective of this manuscript is to develop models for the estimation of capture costs (TCR and O&M), by extracting the relevant data from the published studies. These models will have as parameters the amount of CO2 captured, the capture technology used and the carbon source type.
2.2.1. Data Collection
For that purpose, a literature review was performed to collect the cost of CO
2 captured from published studies.
Table 1 summarises the studies used in the analysis and the parameters retrieved from each one of them. The data required for the analysis are the capital cost of capture (TCR, TOC or TPC), annual O&M costs and the annual amount of CO
2 captured. The capture cost elements reported usually include the capital costs of both the base plant and the CO
2 capture plant and, if a reference case is provided, then the capital cost of capture can be estimated by subtracting the cost of the reference case from the cost with capture. Annual O&M costs, if not reported, can be estimated by assuming to be equal to a percentage of capital costs. The annual amount of CO
2 captured also needs to be reported, which can be used to adjust the cost of capture based on the required size of the capture plant.
From the parameters reported in
Table 1, the “source type” indicates whether the published study included data for power related sources, non-power related sources or both. The separation principle determines if the type of capture technology used was specified. The amount of CO
2 capture indicates if the annual amount of CO
2 captured is directly reported or if it can be estimated. Currency, base year, constant/current, project lifetime and working hours per year are the data required to standardise cost. The base year specifies the year of the reported costs, whereas constant or current indicates if inflation is included. The cost of CO
2 captured, cost of CO
2 avoided and LCOE are not required for this study, but they were included as reference values.
2.2.2. Data Standardisation
The extracted cost data were standardised to constant USD
2018 prices [
31]. The method adjusts for inflation of the reported currencies to 2018 prices using local CPI values and then converting currencies to USD
2018 using market exchange rate data from [
32]. The selected studies usually report cost data in US dollars, British pounds or euro. A base year was always provided, and it was specified whether inflation was included. For US dollars and British pounds, it was easy to find CPI values which are based on location because it is a country-based index, but for costs reported in Euro, it was not possible to find CPI values because there was no indication of country. Instead, the costs were converted to USD of the base year and then adjusted for inflation to USD
2018 using the USD CPI. Cost data in current values were standardised for inflation of currencies to 2018 prices using local CPI values by dividing the CPI
2018 by 100 and multiplying by the current price and then converting currencies to USD
2018 using market exchange rate data from [
32].
2.2.3. Data Aggregation
The extracted data include information on the source type and capture technology and ideally a model can be developed for each type of source using all available capture technologies. Because of the lack of data, this was not possible for all of them. Instead of developing a model for each capture technology applied on every source the data were sorted per source type and capture technology, and a model was developed for each source and capture technology (where enough data existed).
The extracted data were sorted according to source type for non-power related sources (metal industry, fluid catalytic cracking (FCC), combined stack, cement industry, hydrogen, ammonia, ethylene oxide production and synthetic fuel) and power-related sources (pulverised coal (PC), integrated gasification combined cycle (IGCC), supercritical pulverised coal (SCPC), ultra-supercritical pulverised coal (USCPC), natural gas combined cycle (NGCC), gas-fired furnaces, combined heating and power station (CHP), fluidised bed combustion (CFB)). To develop a model for each case, it was required to have at least 10 data points, which at the same time cover a reasonable range of flowrates (at least 2 MtCO2/yr).
The cost data from each source were also sorted according to the classification of capture technologies per separation principle, chemical absorption, physical absorption, oxyfuel combustion, chemical adsorption, chemical looping, cryogenics, inorganic membranes and hydrate crystallization). The criteria used to be able to develop a model were the same with the sorting per source. Therefore, it was not possible to develop models for chemical adsorption, chemical looping, cryogenics, inorganic membranes and hydrate crystallization CO2 capture technologies because there are less than 10 pieces of data for each of them that cover a very small range of flows.
3. Results
Numerous regression analyses were performed and assessed to develop a model that best describes the investment cost and O&M cost based on the amount of CO2 captured. Power regression analysis was chosen to develop a model that predicts the total capital requirement (TCR) and annual operating and maintenance cost (O&MC) (dependent variables) based on the annual amount of CO2 captured (independent variable). The proposed models are presented in the following sections.
3.1. Capture Costs Based on the Separation Principle
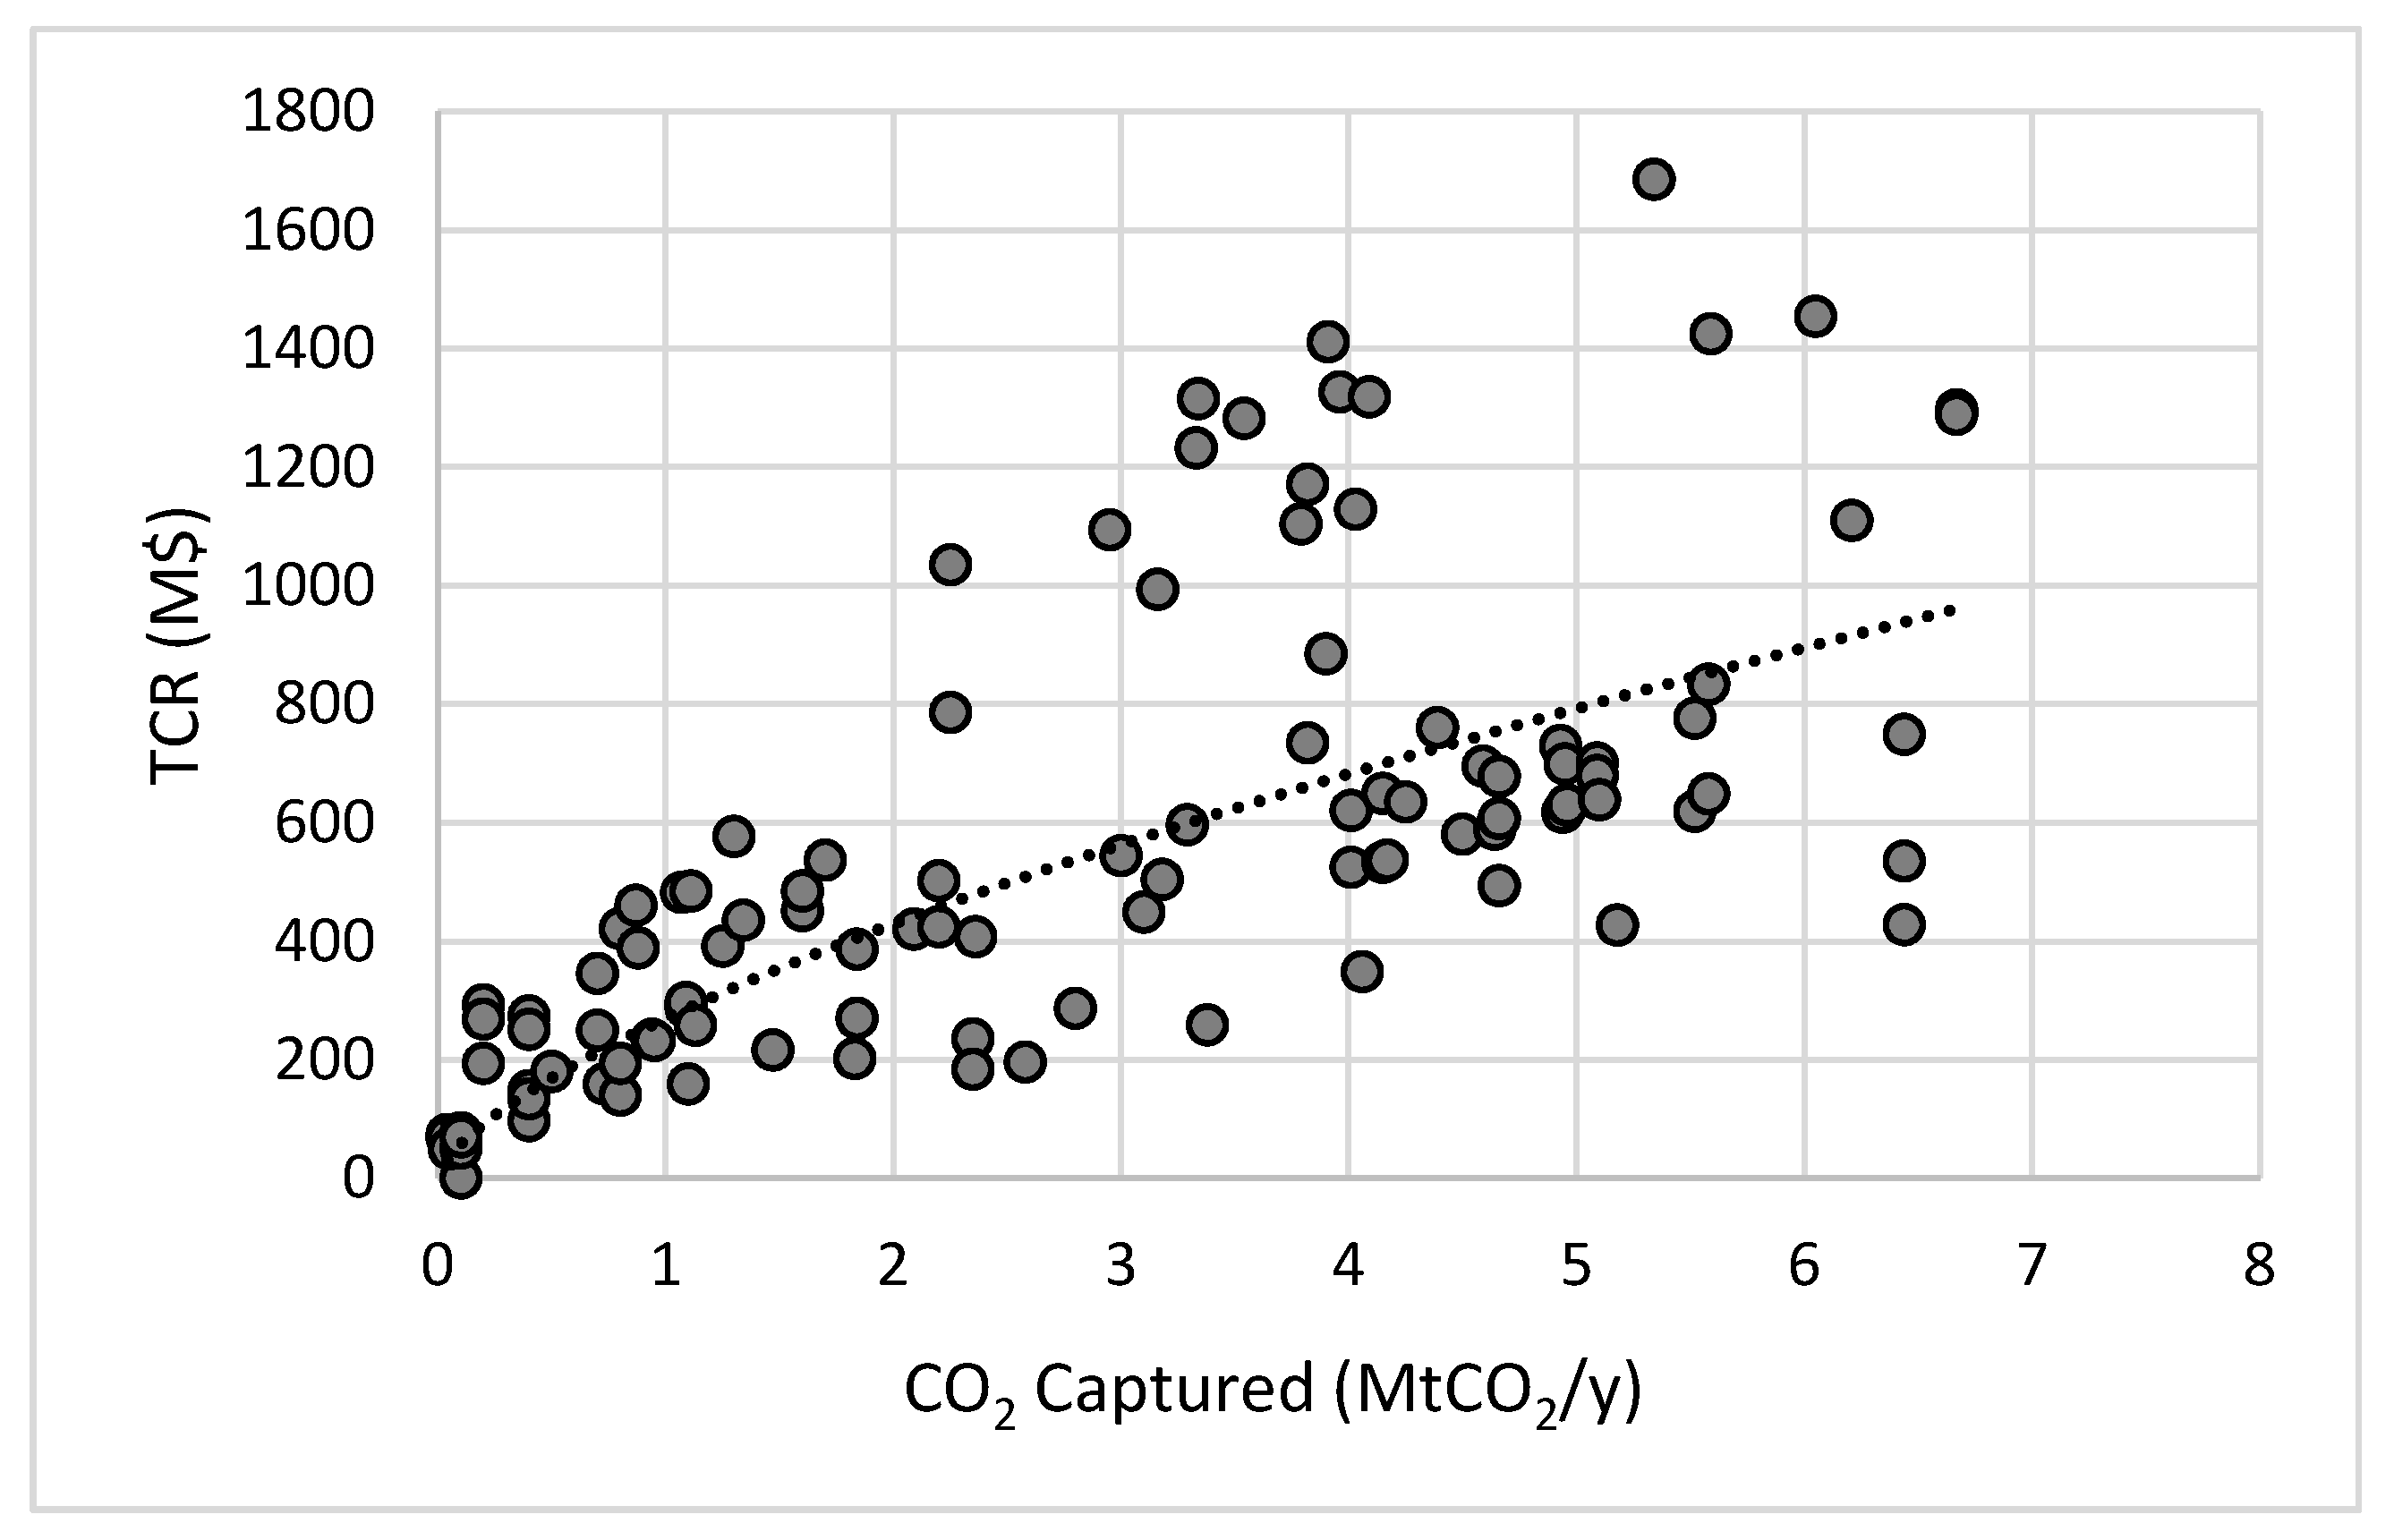
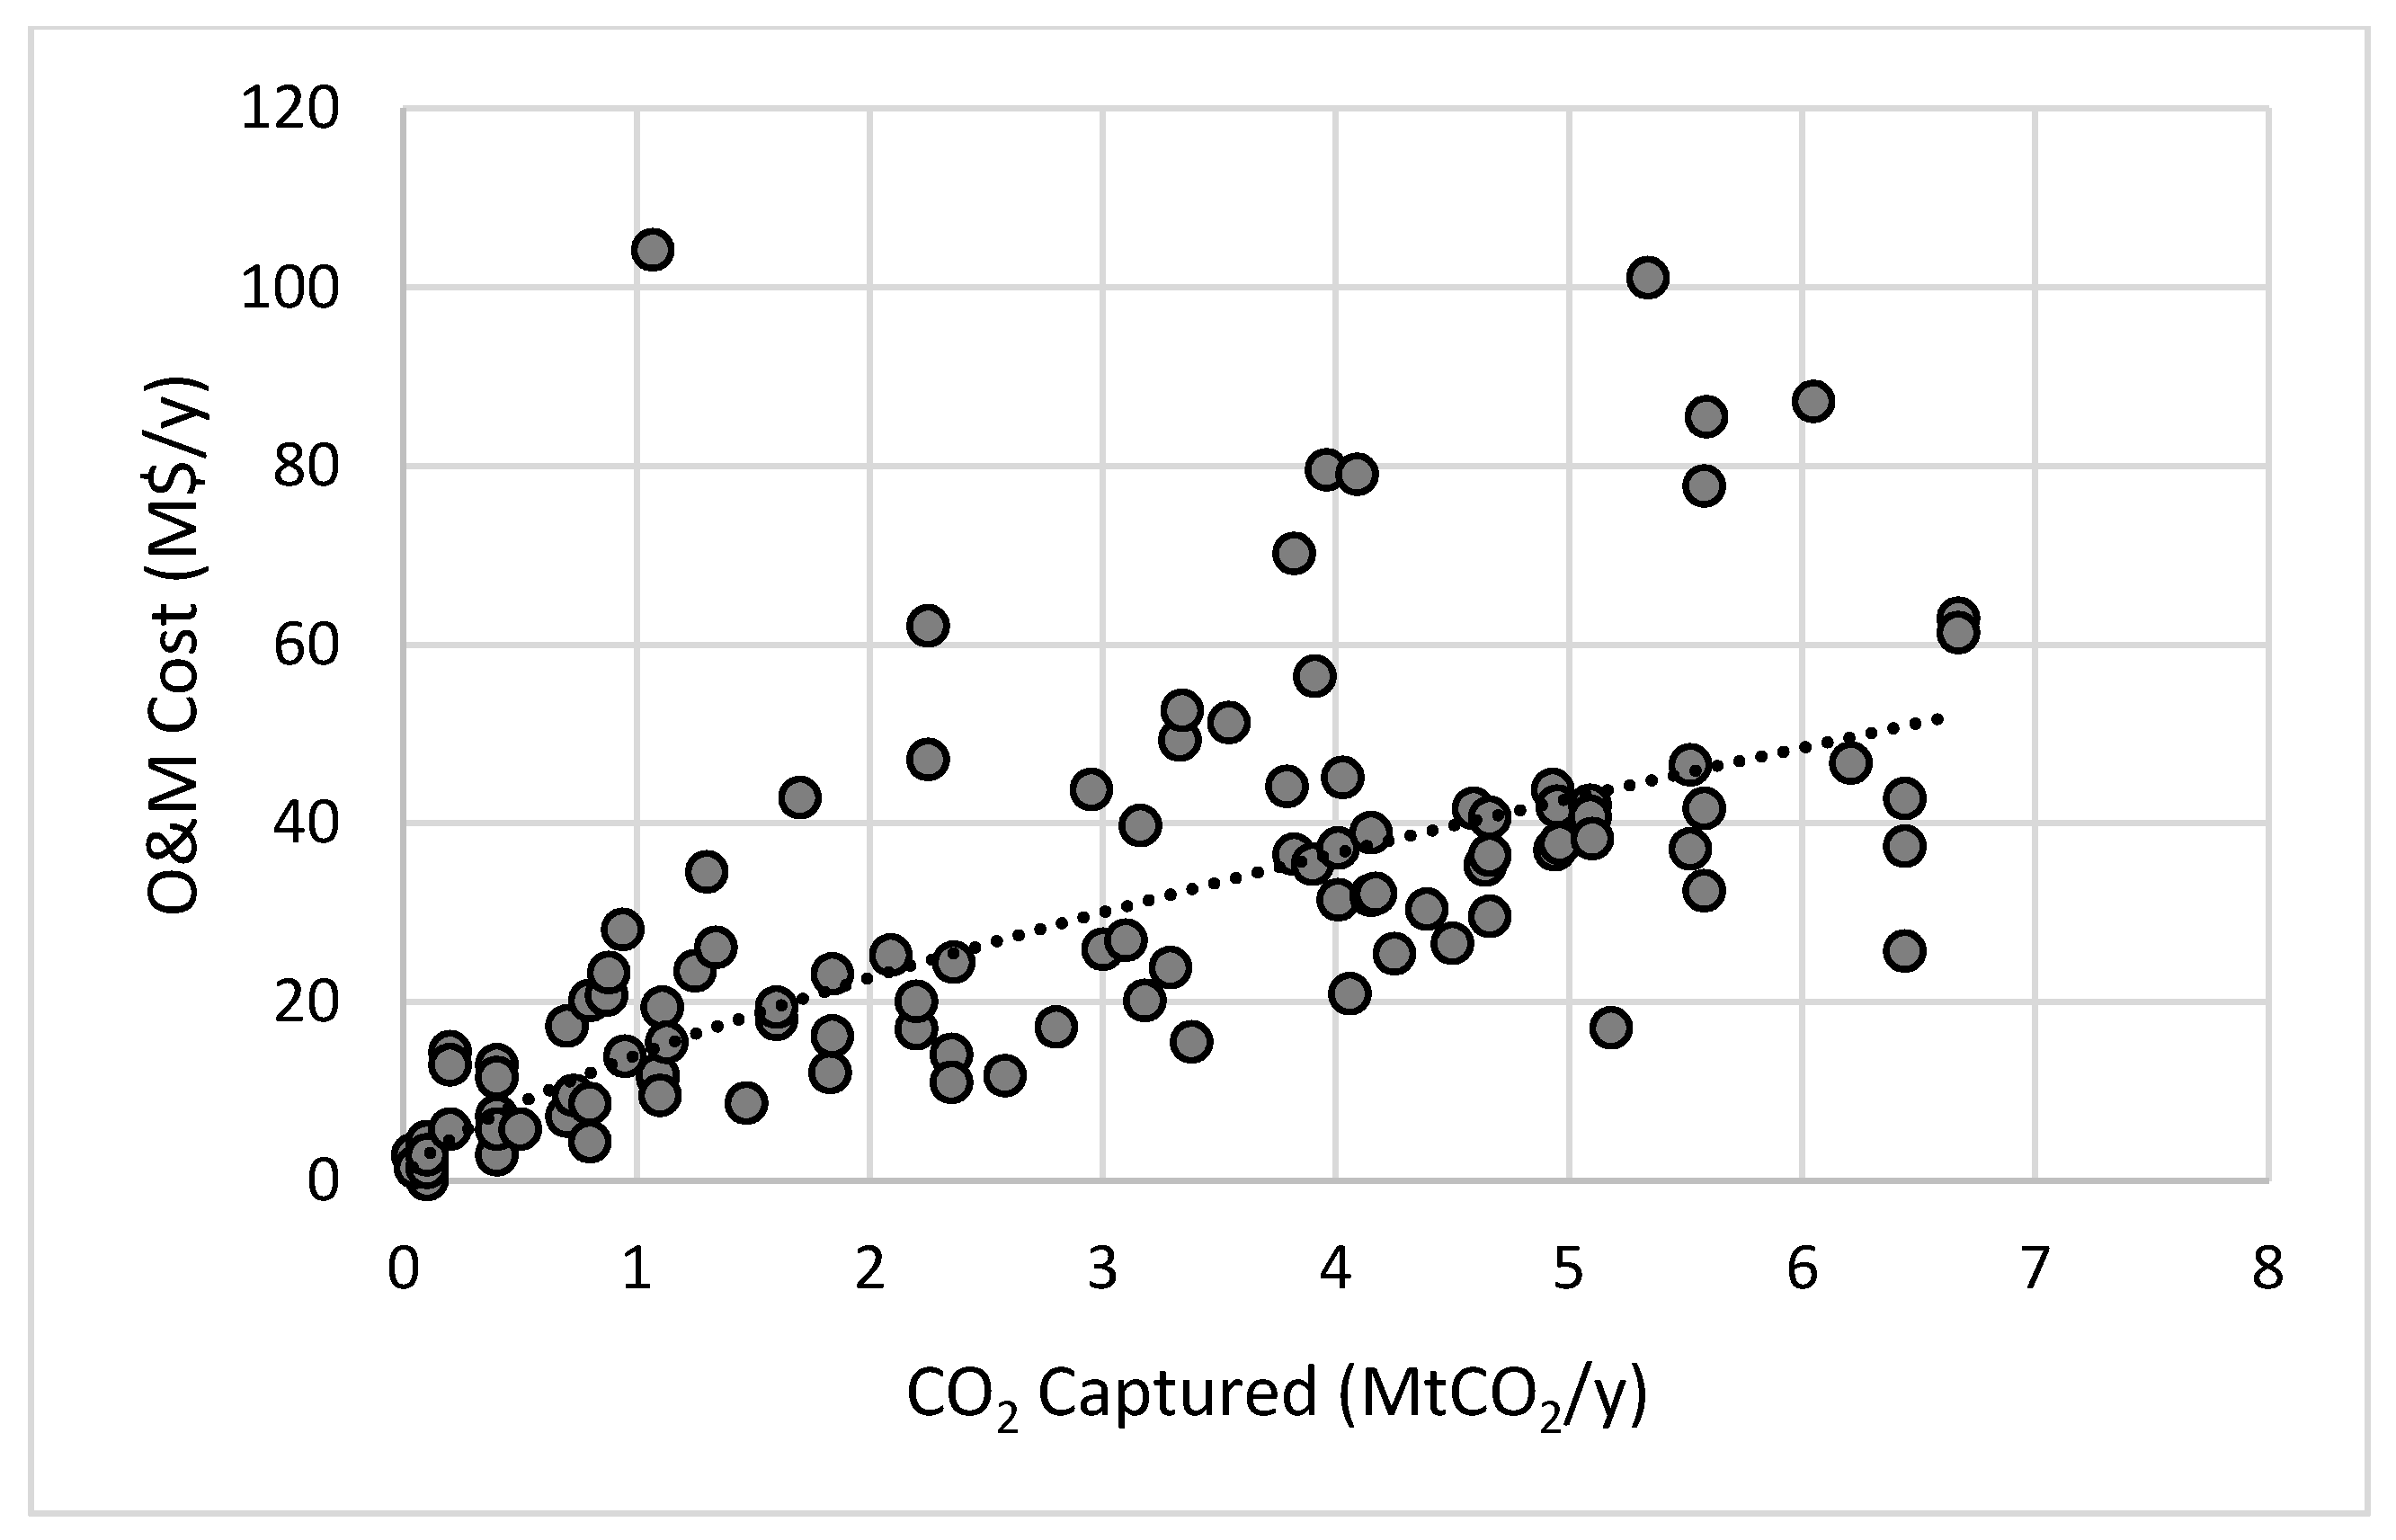
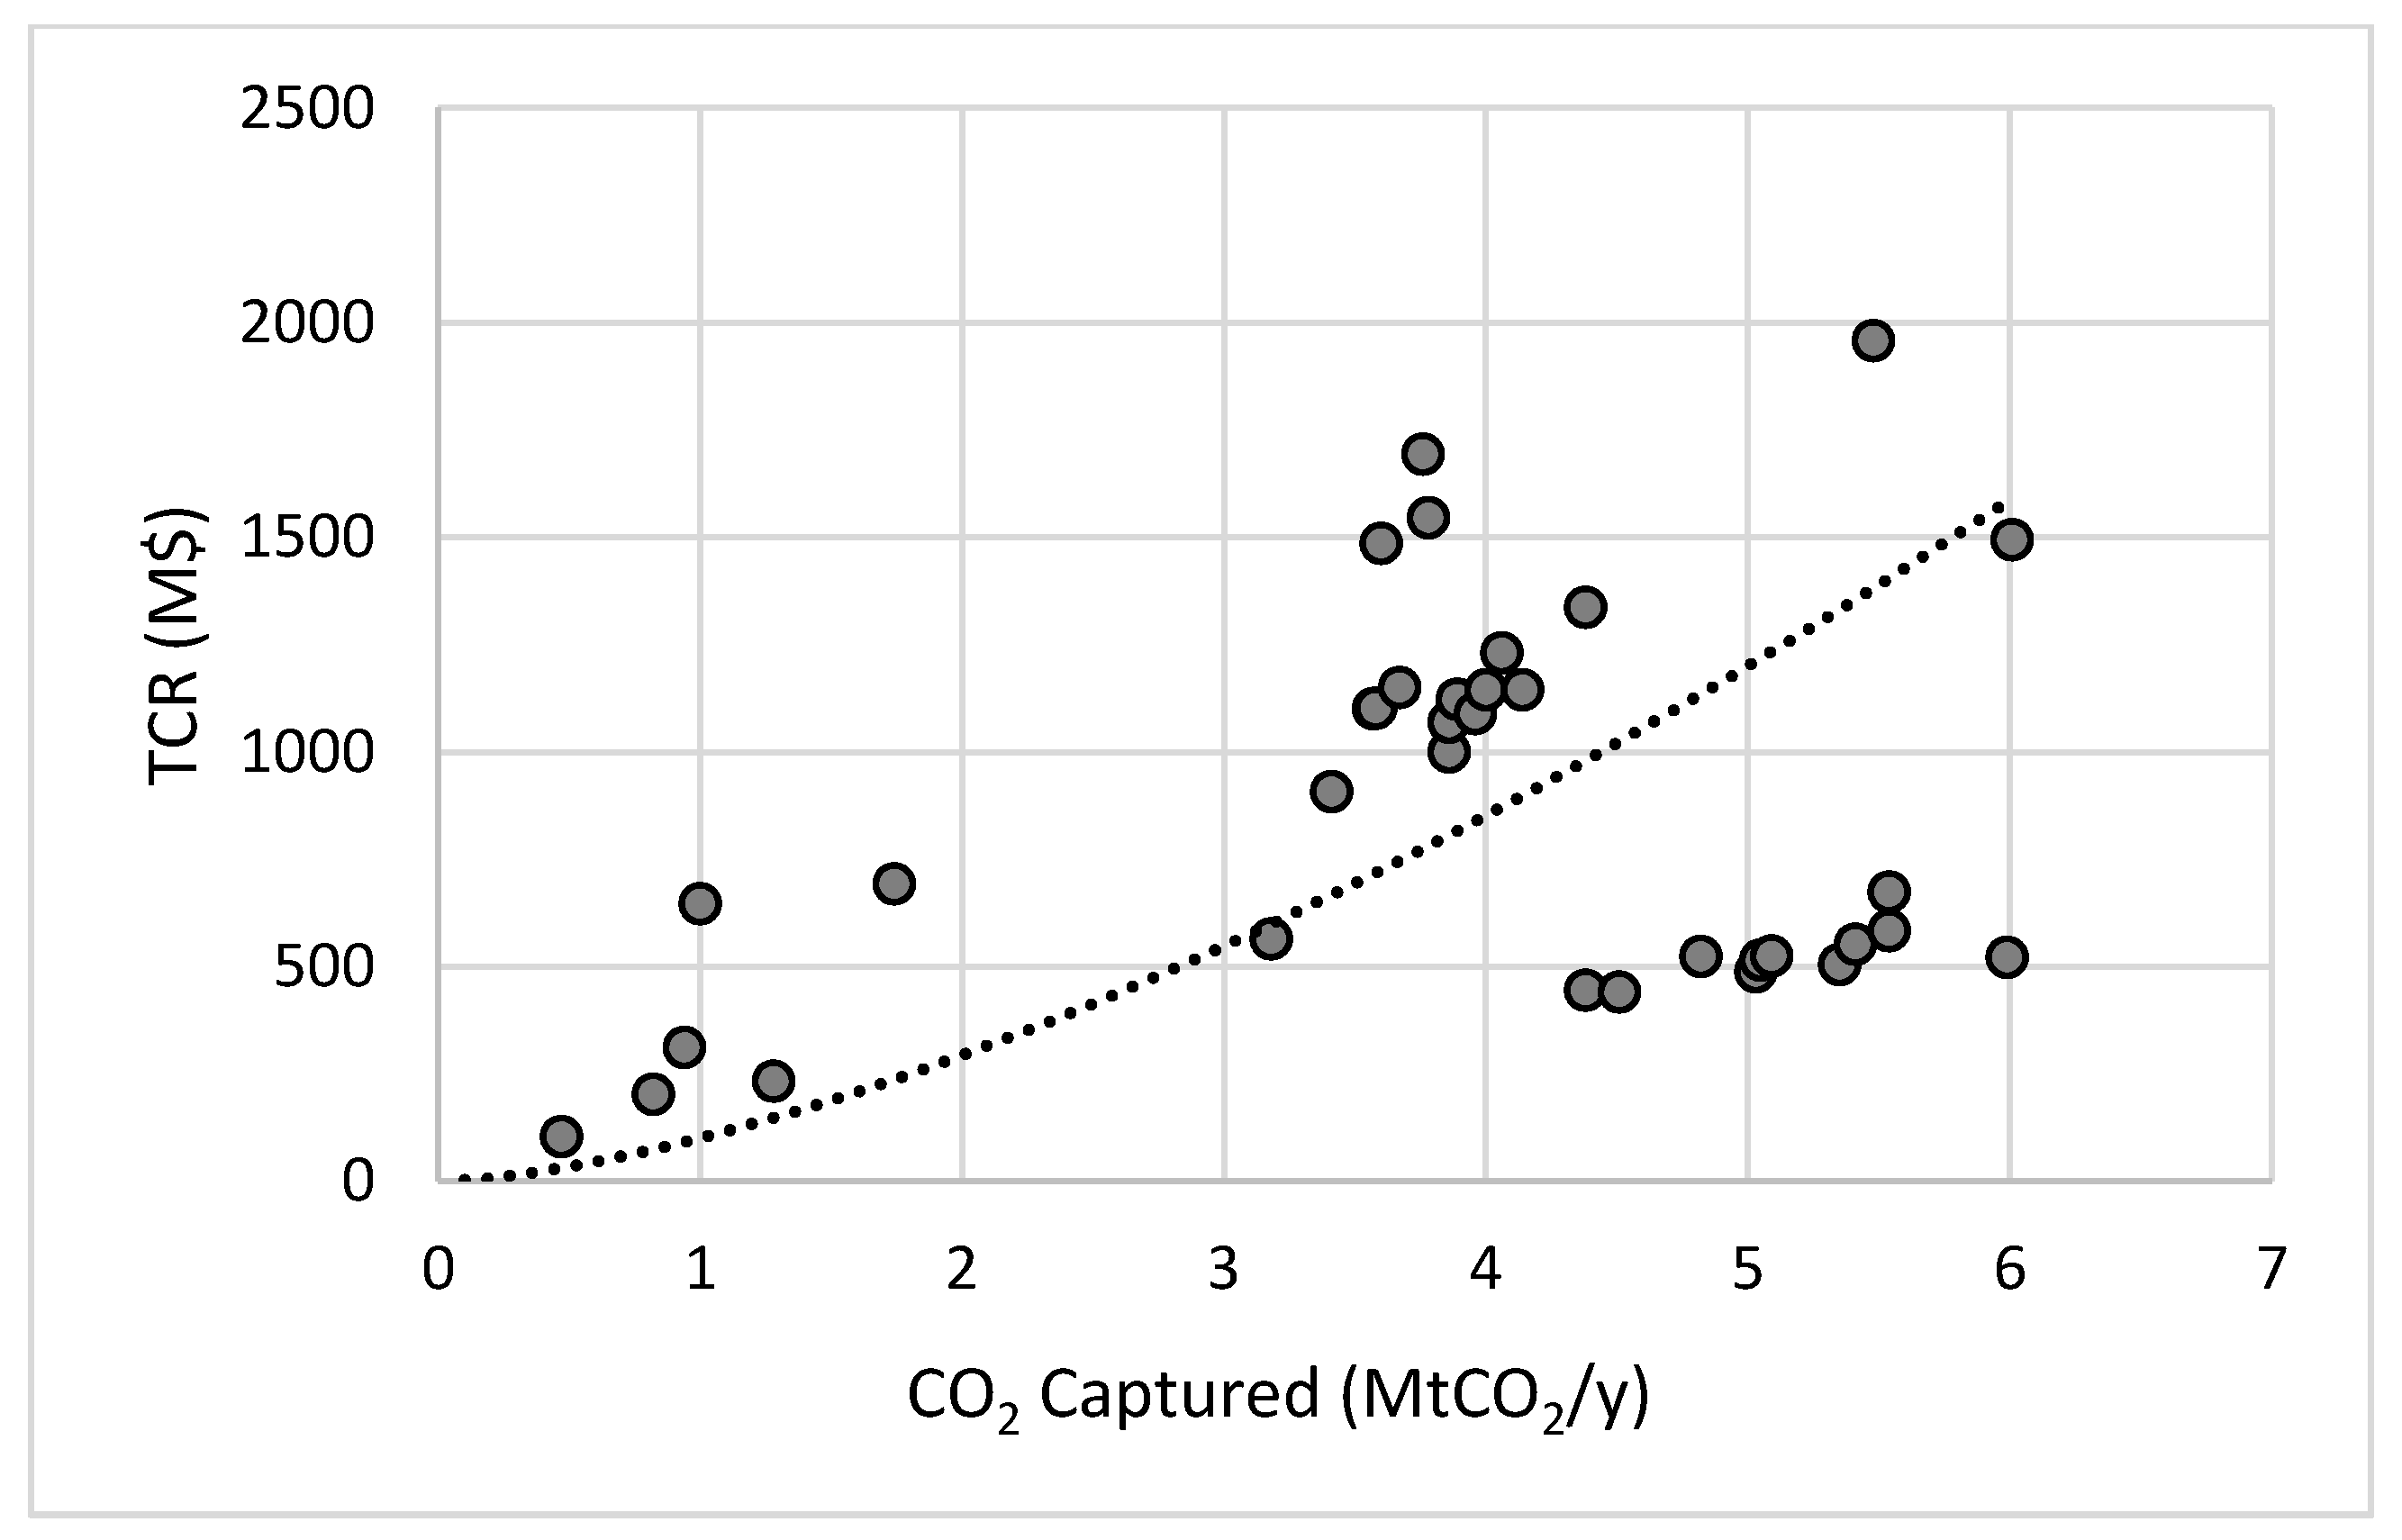
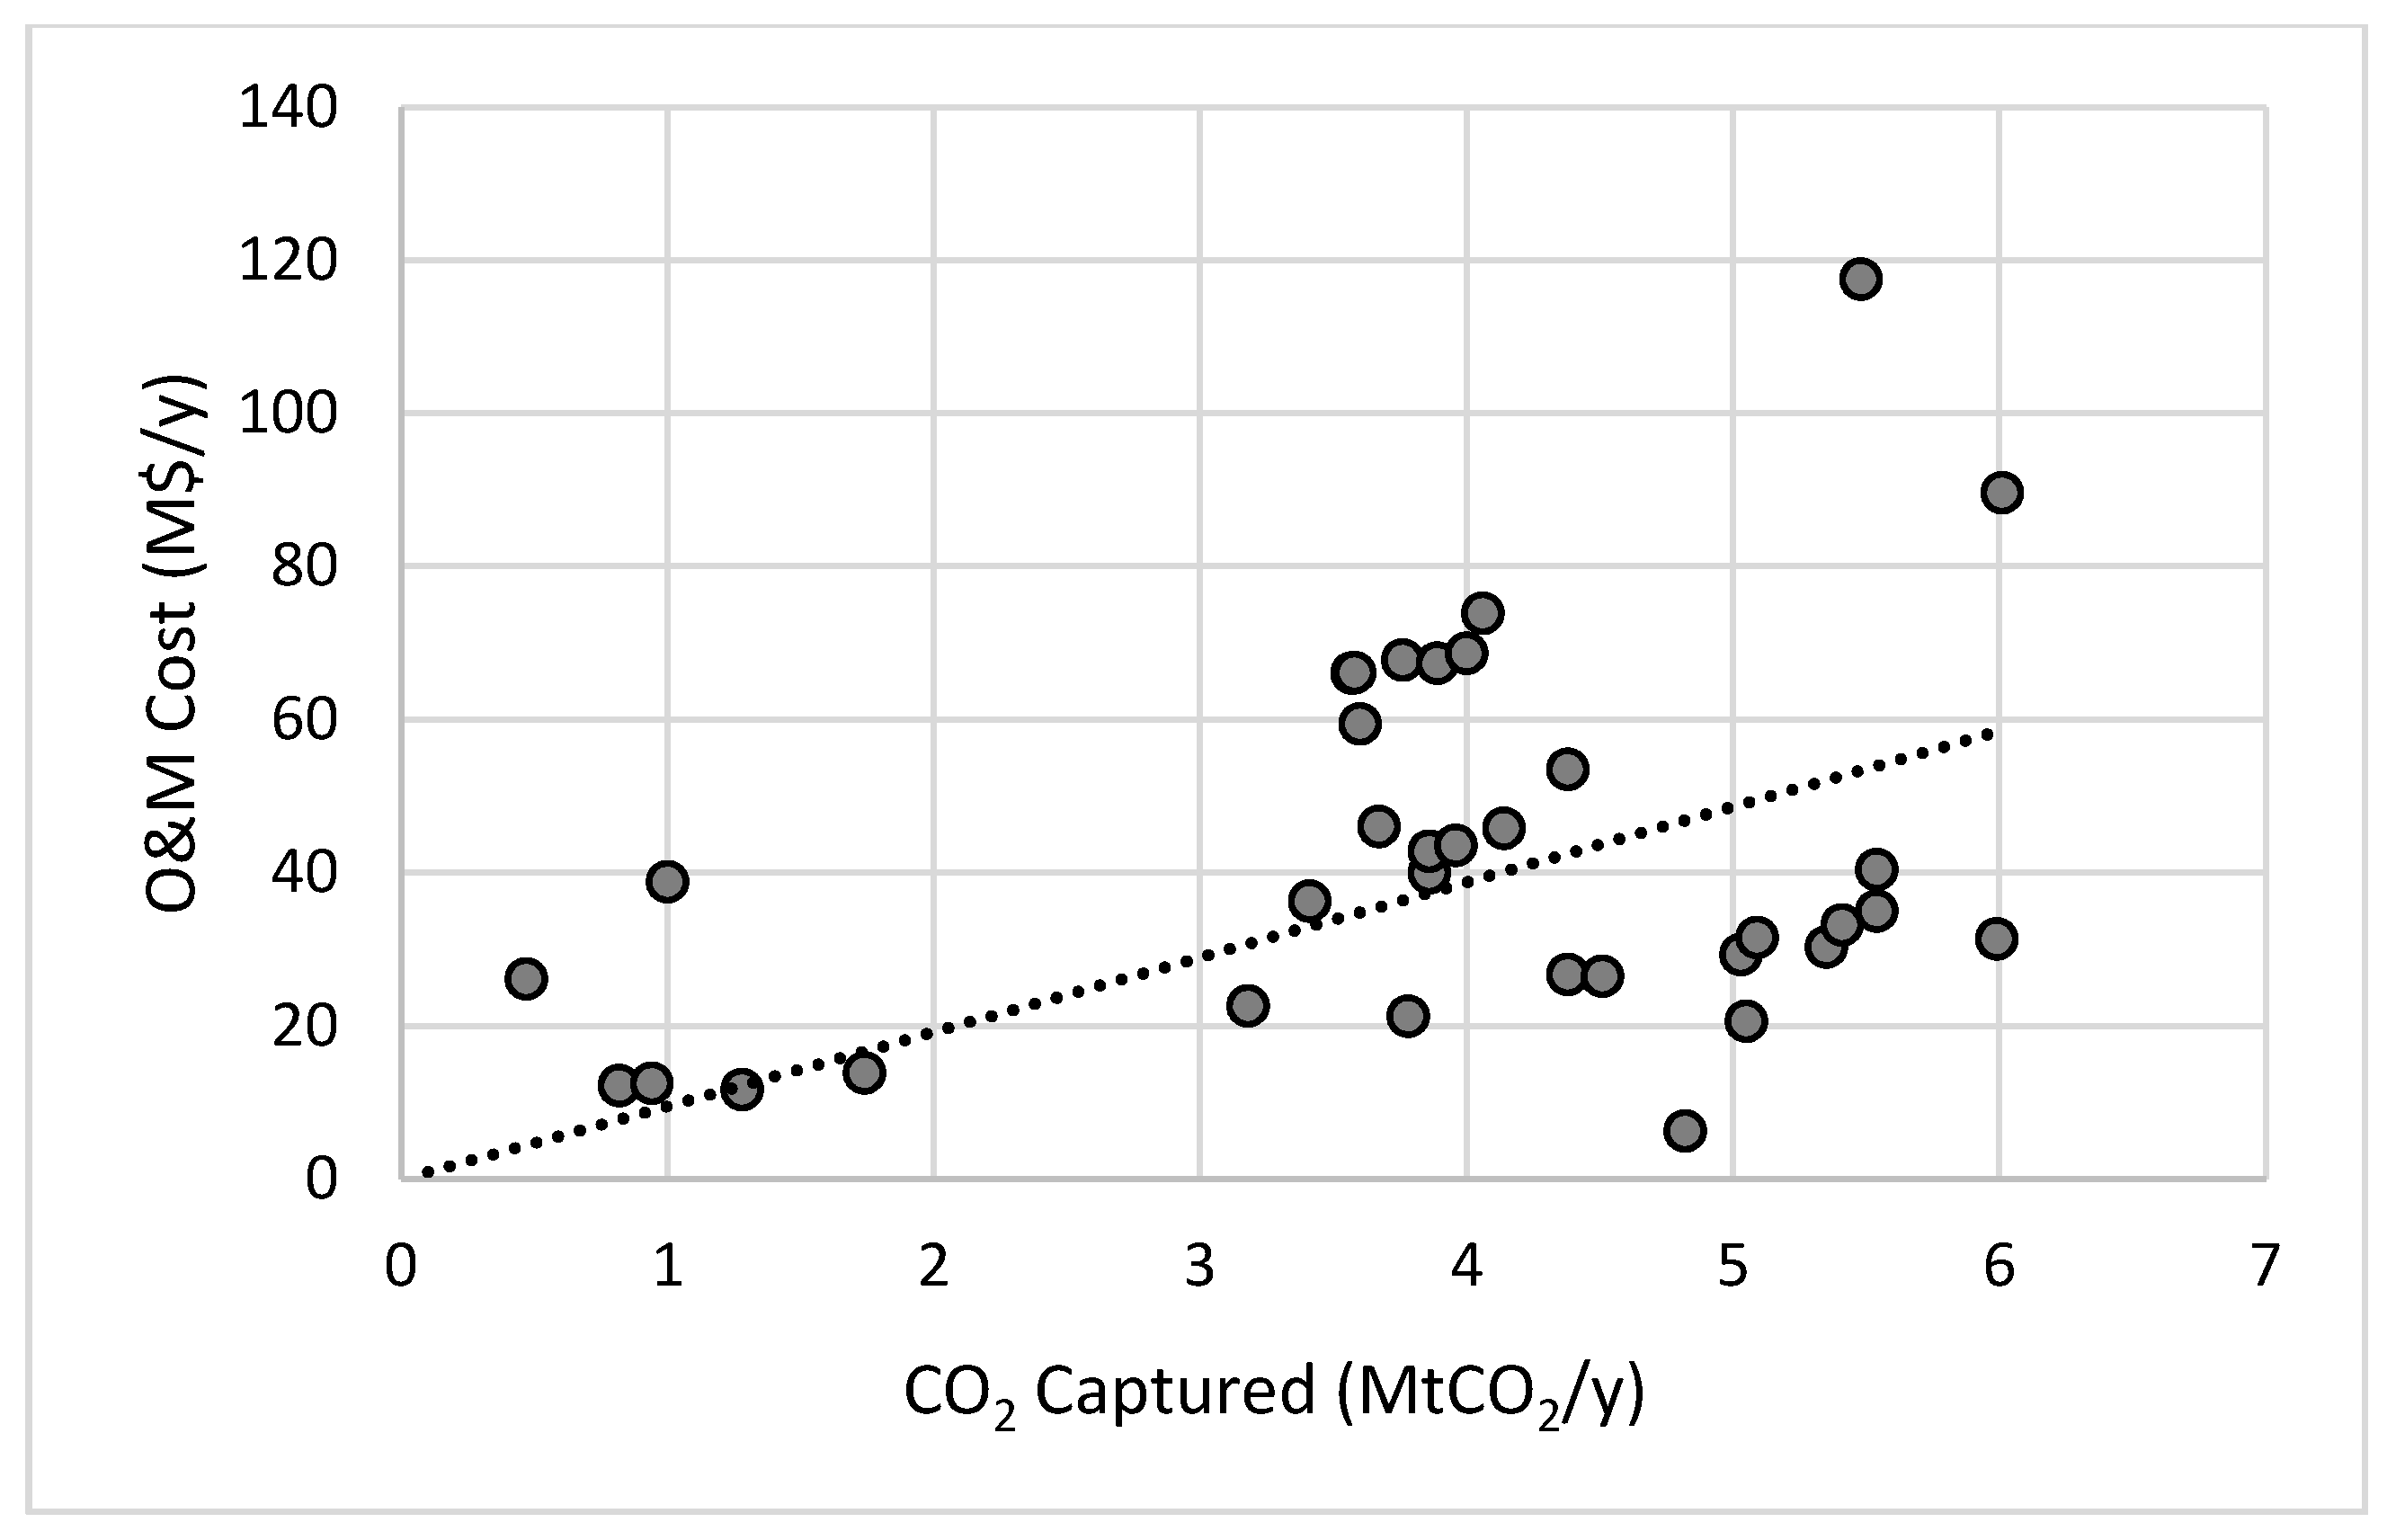
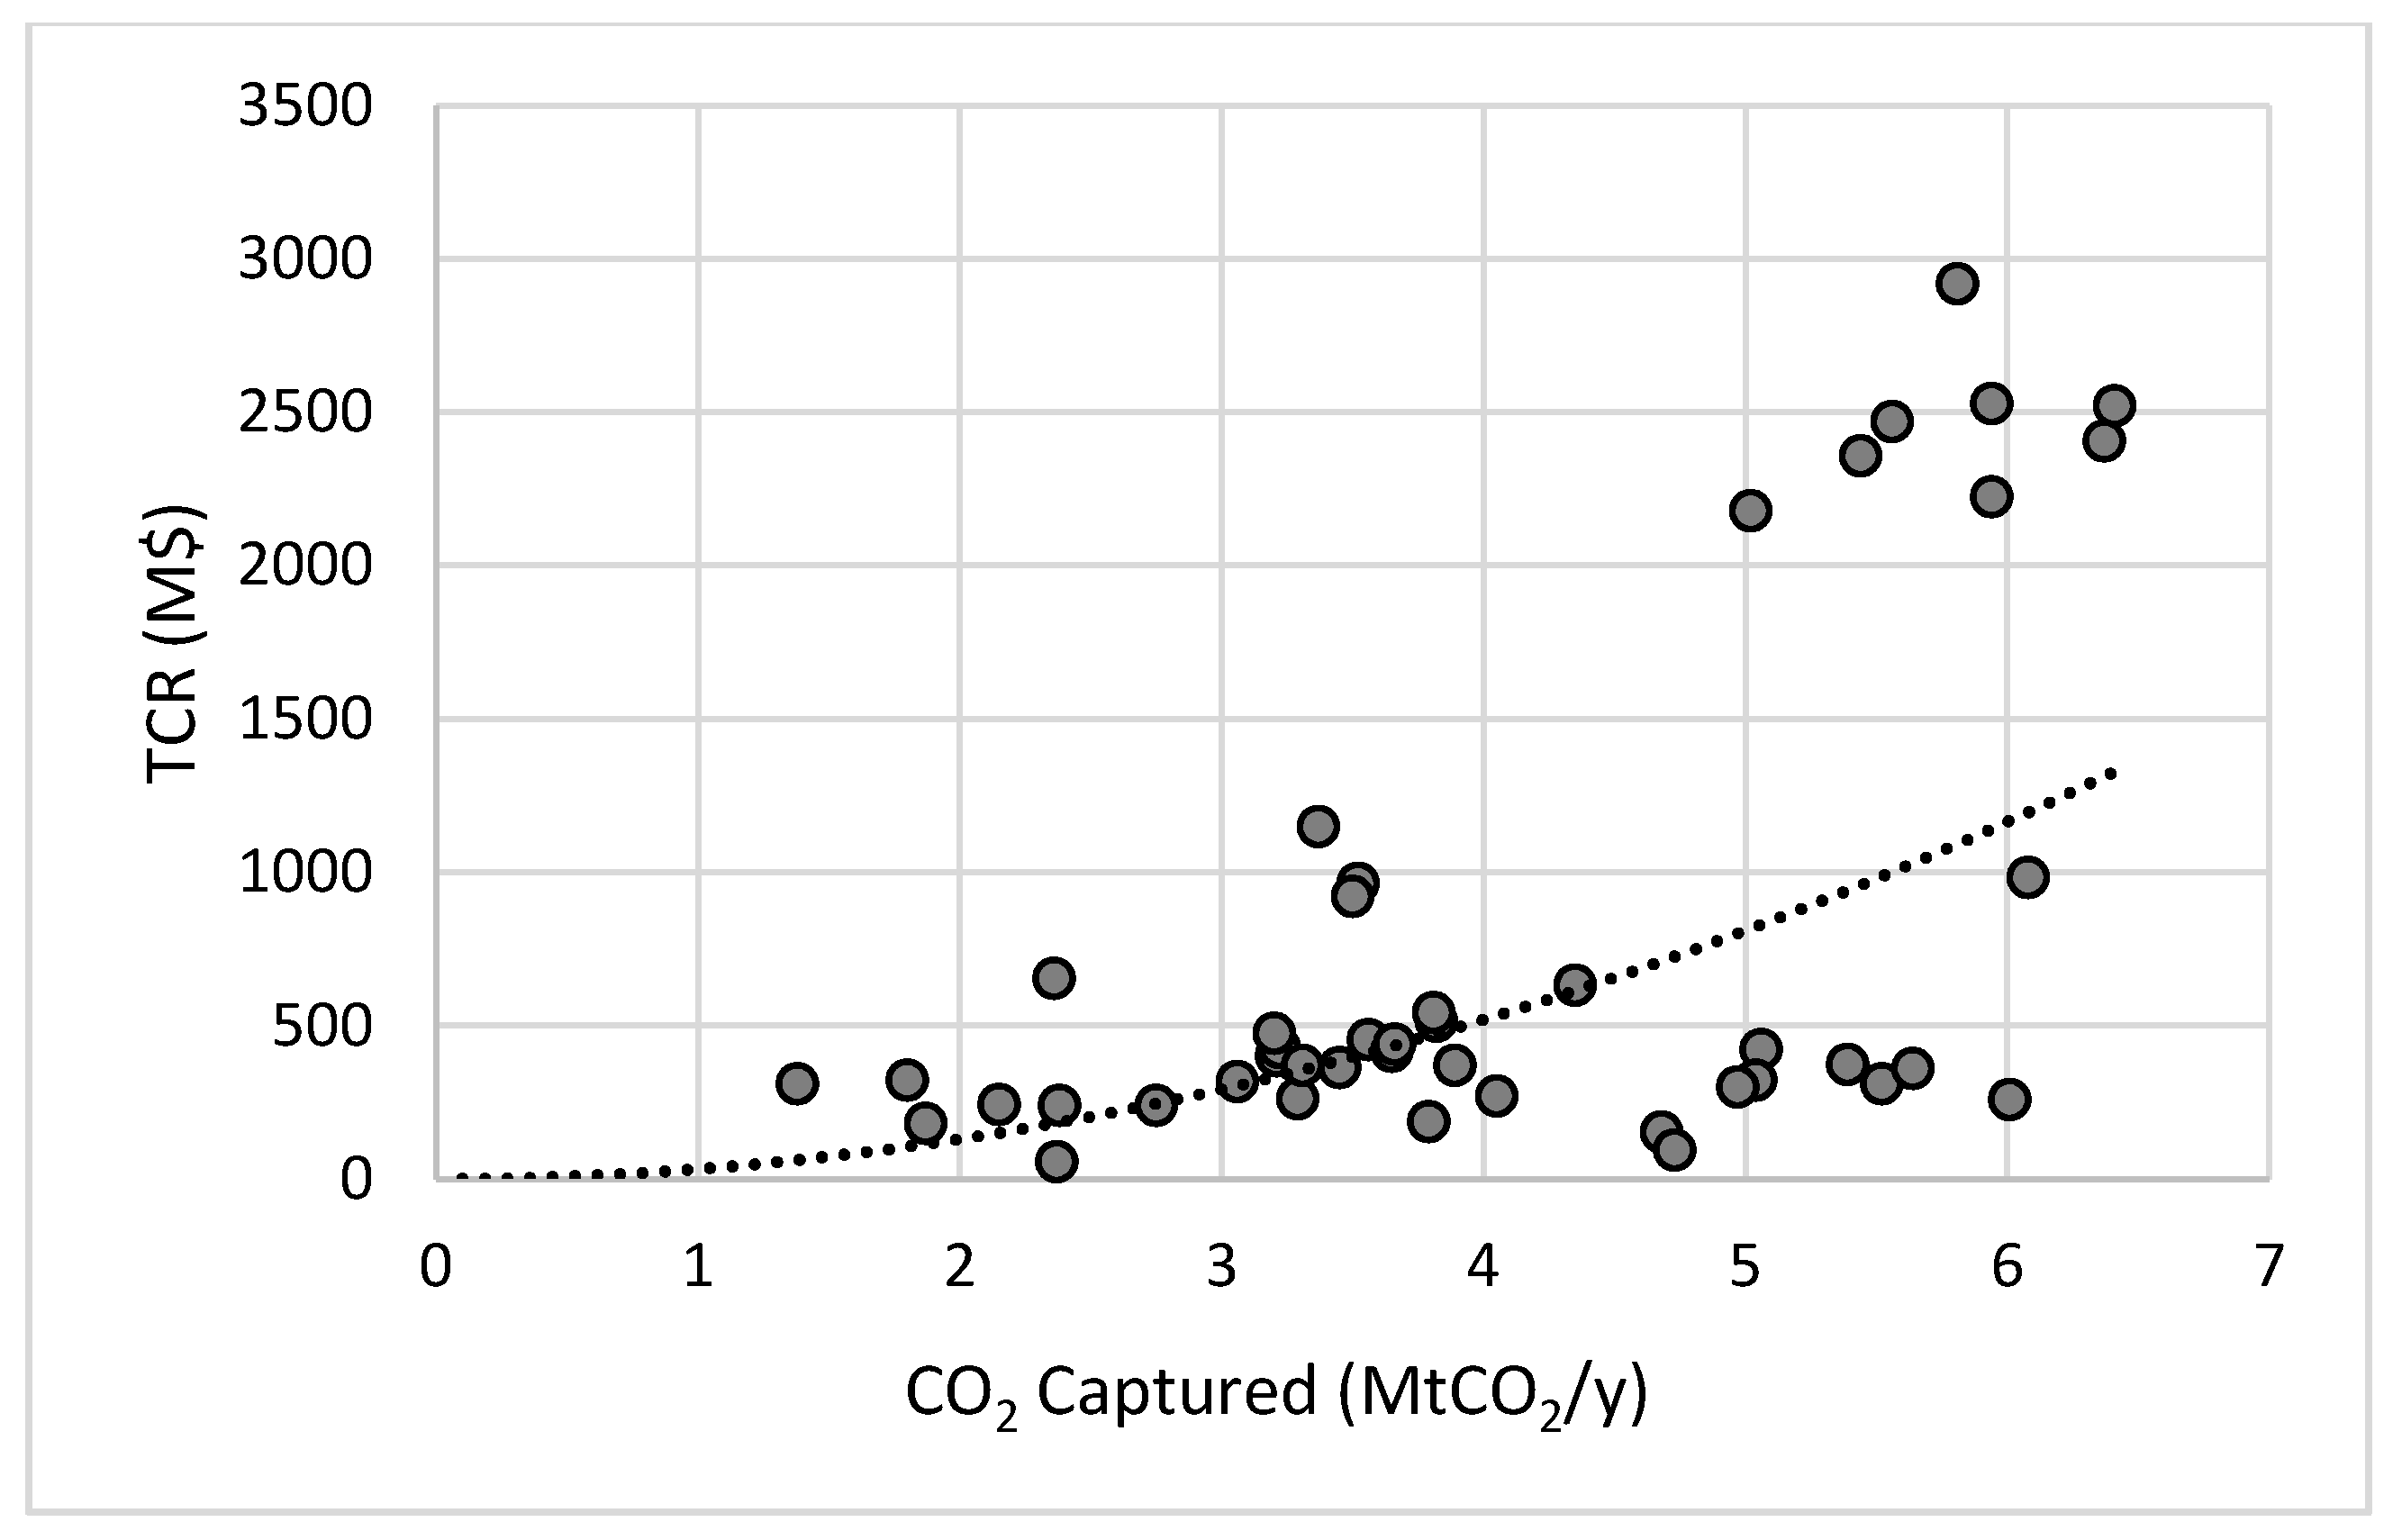
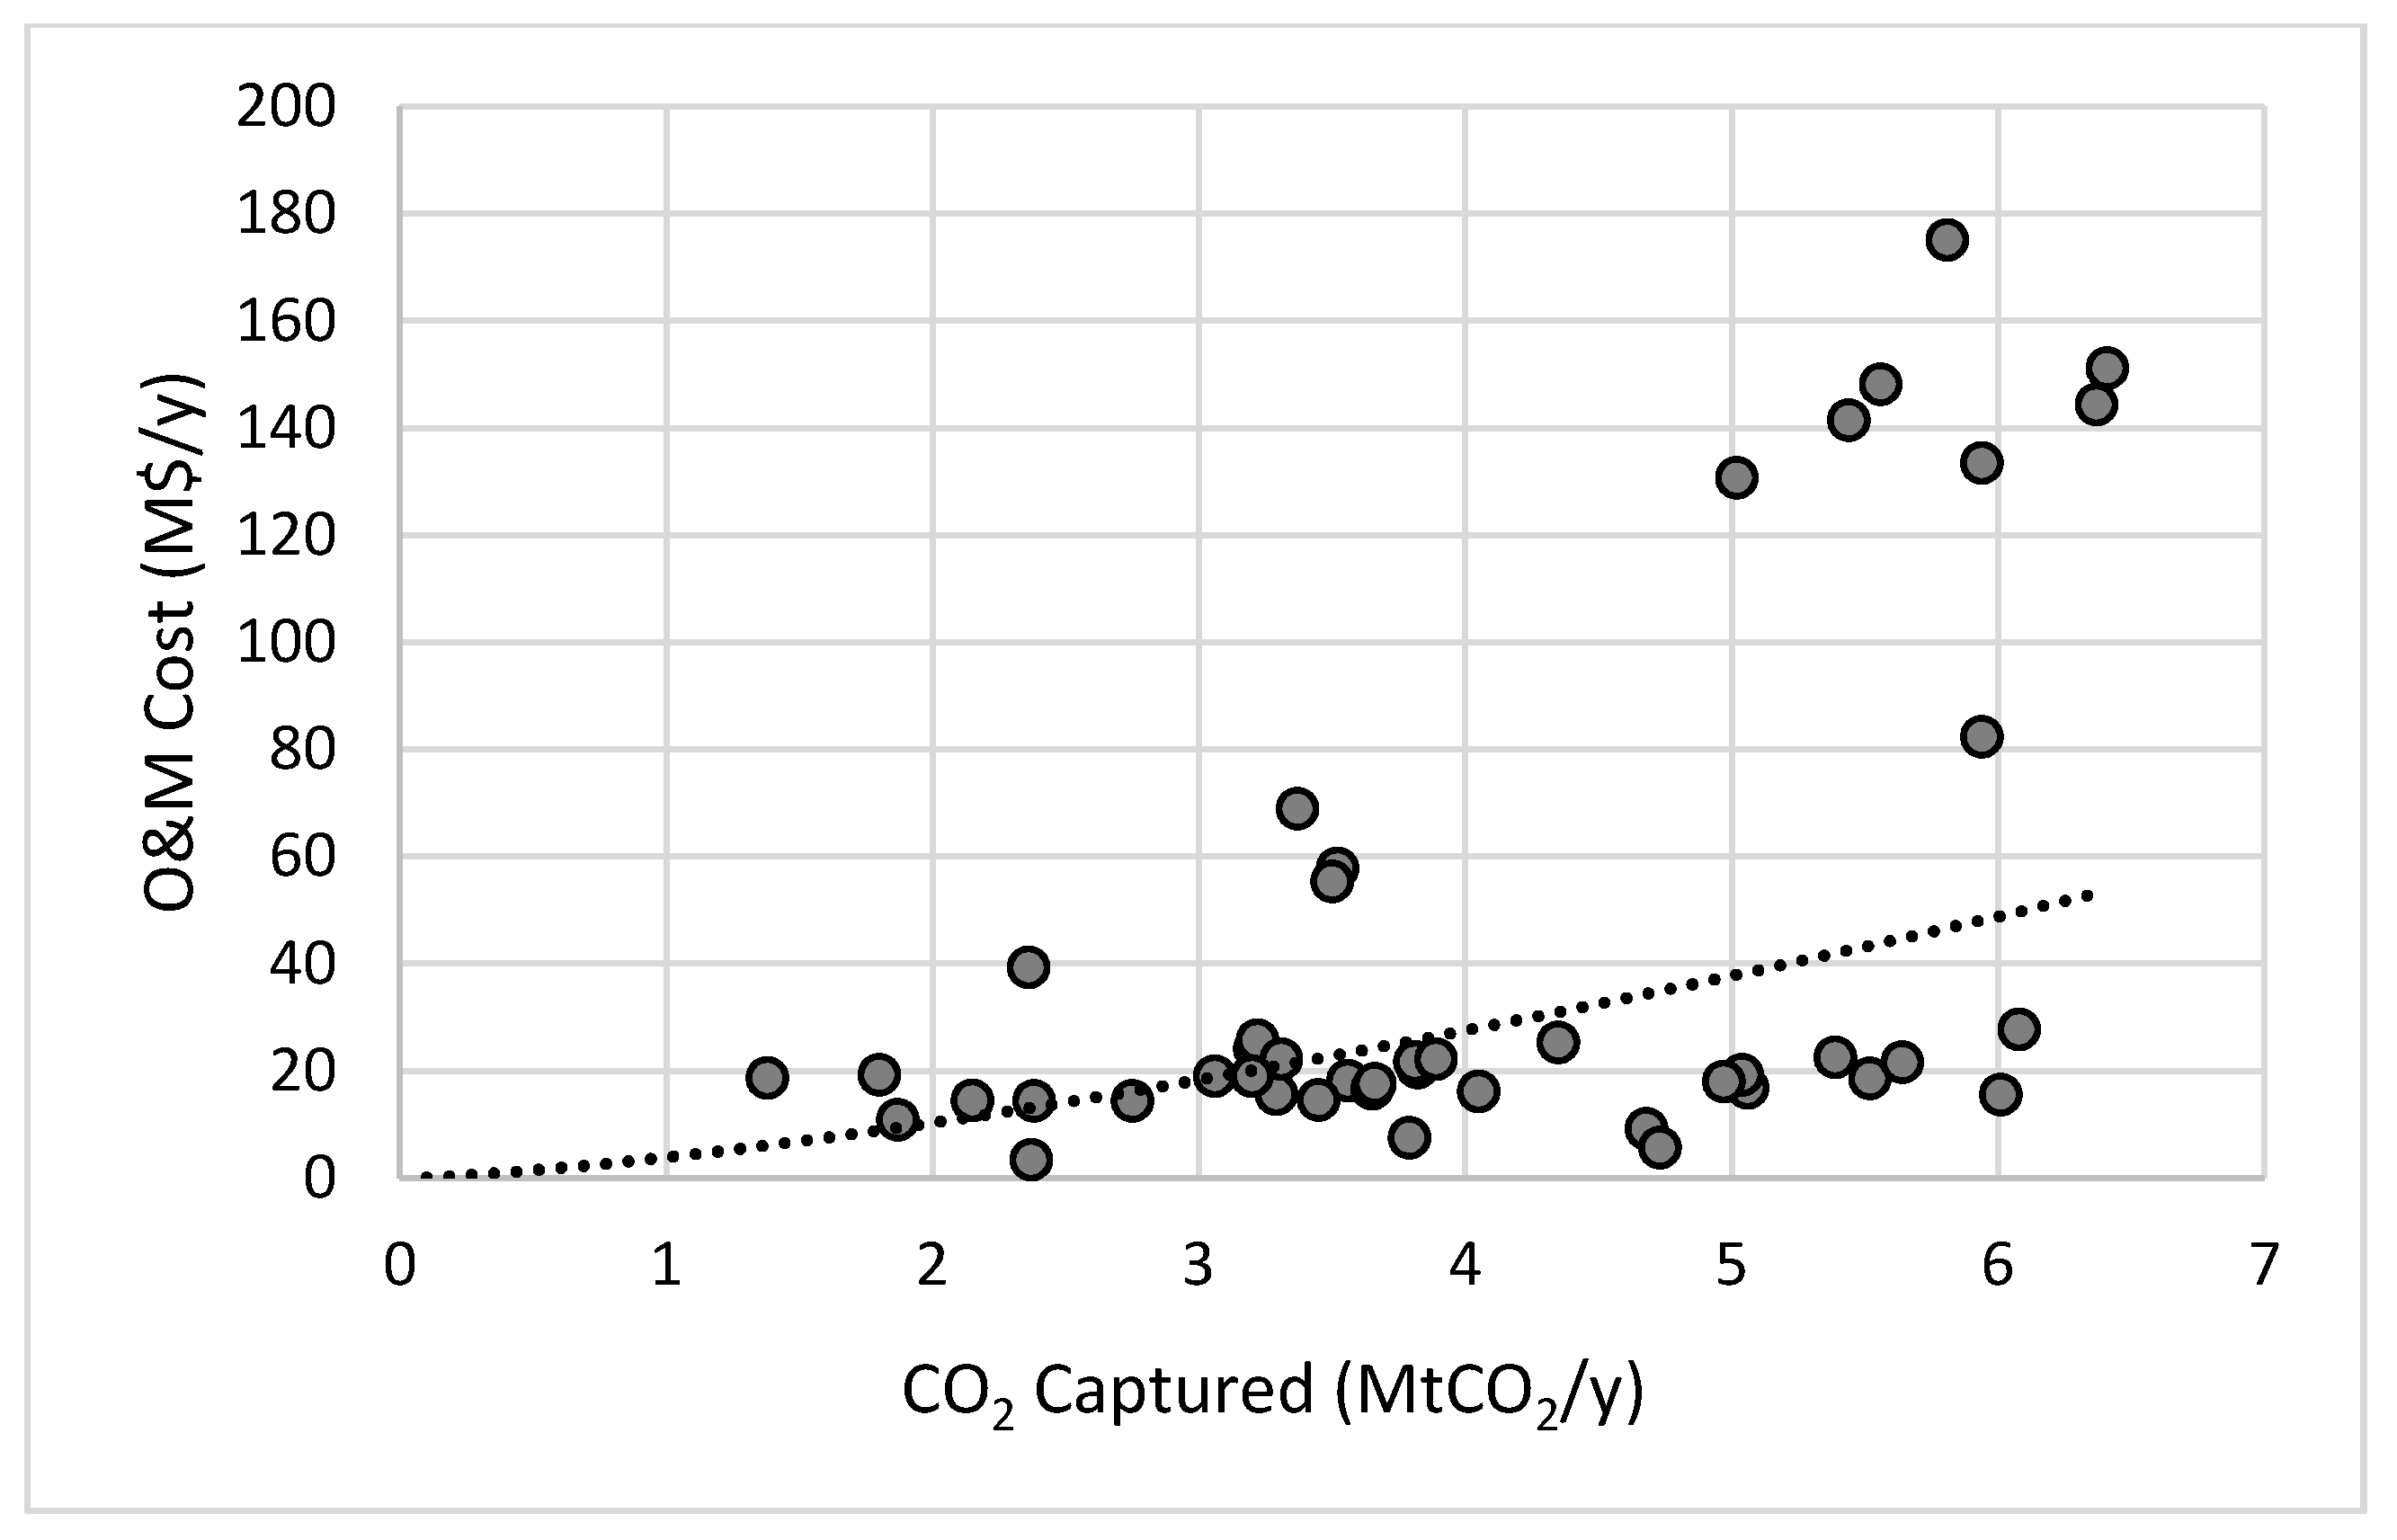
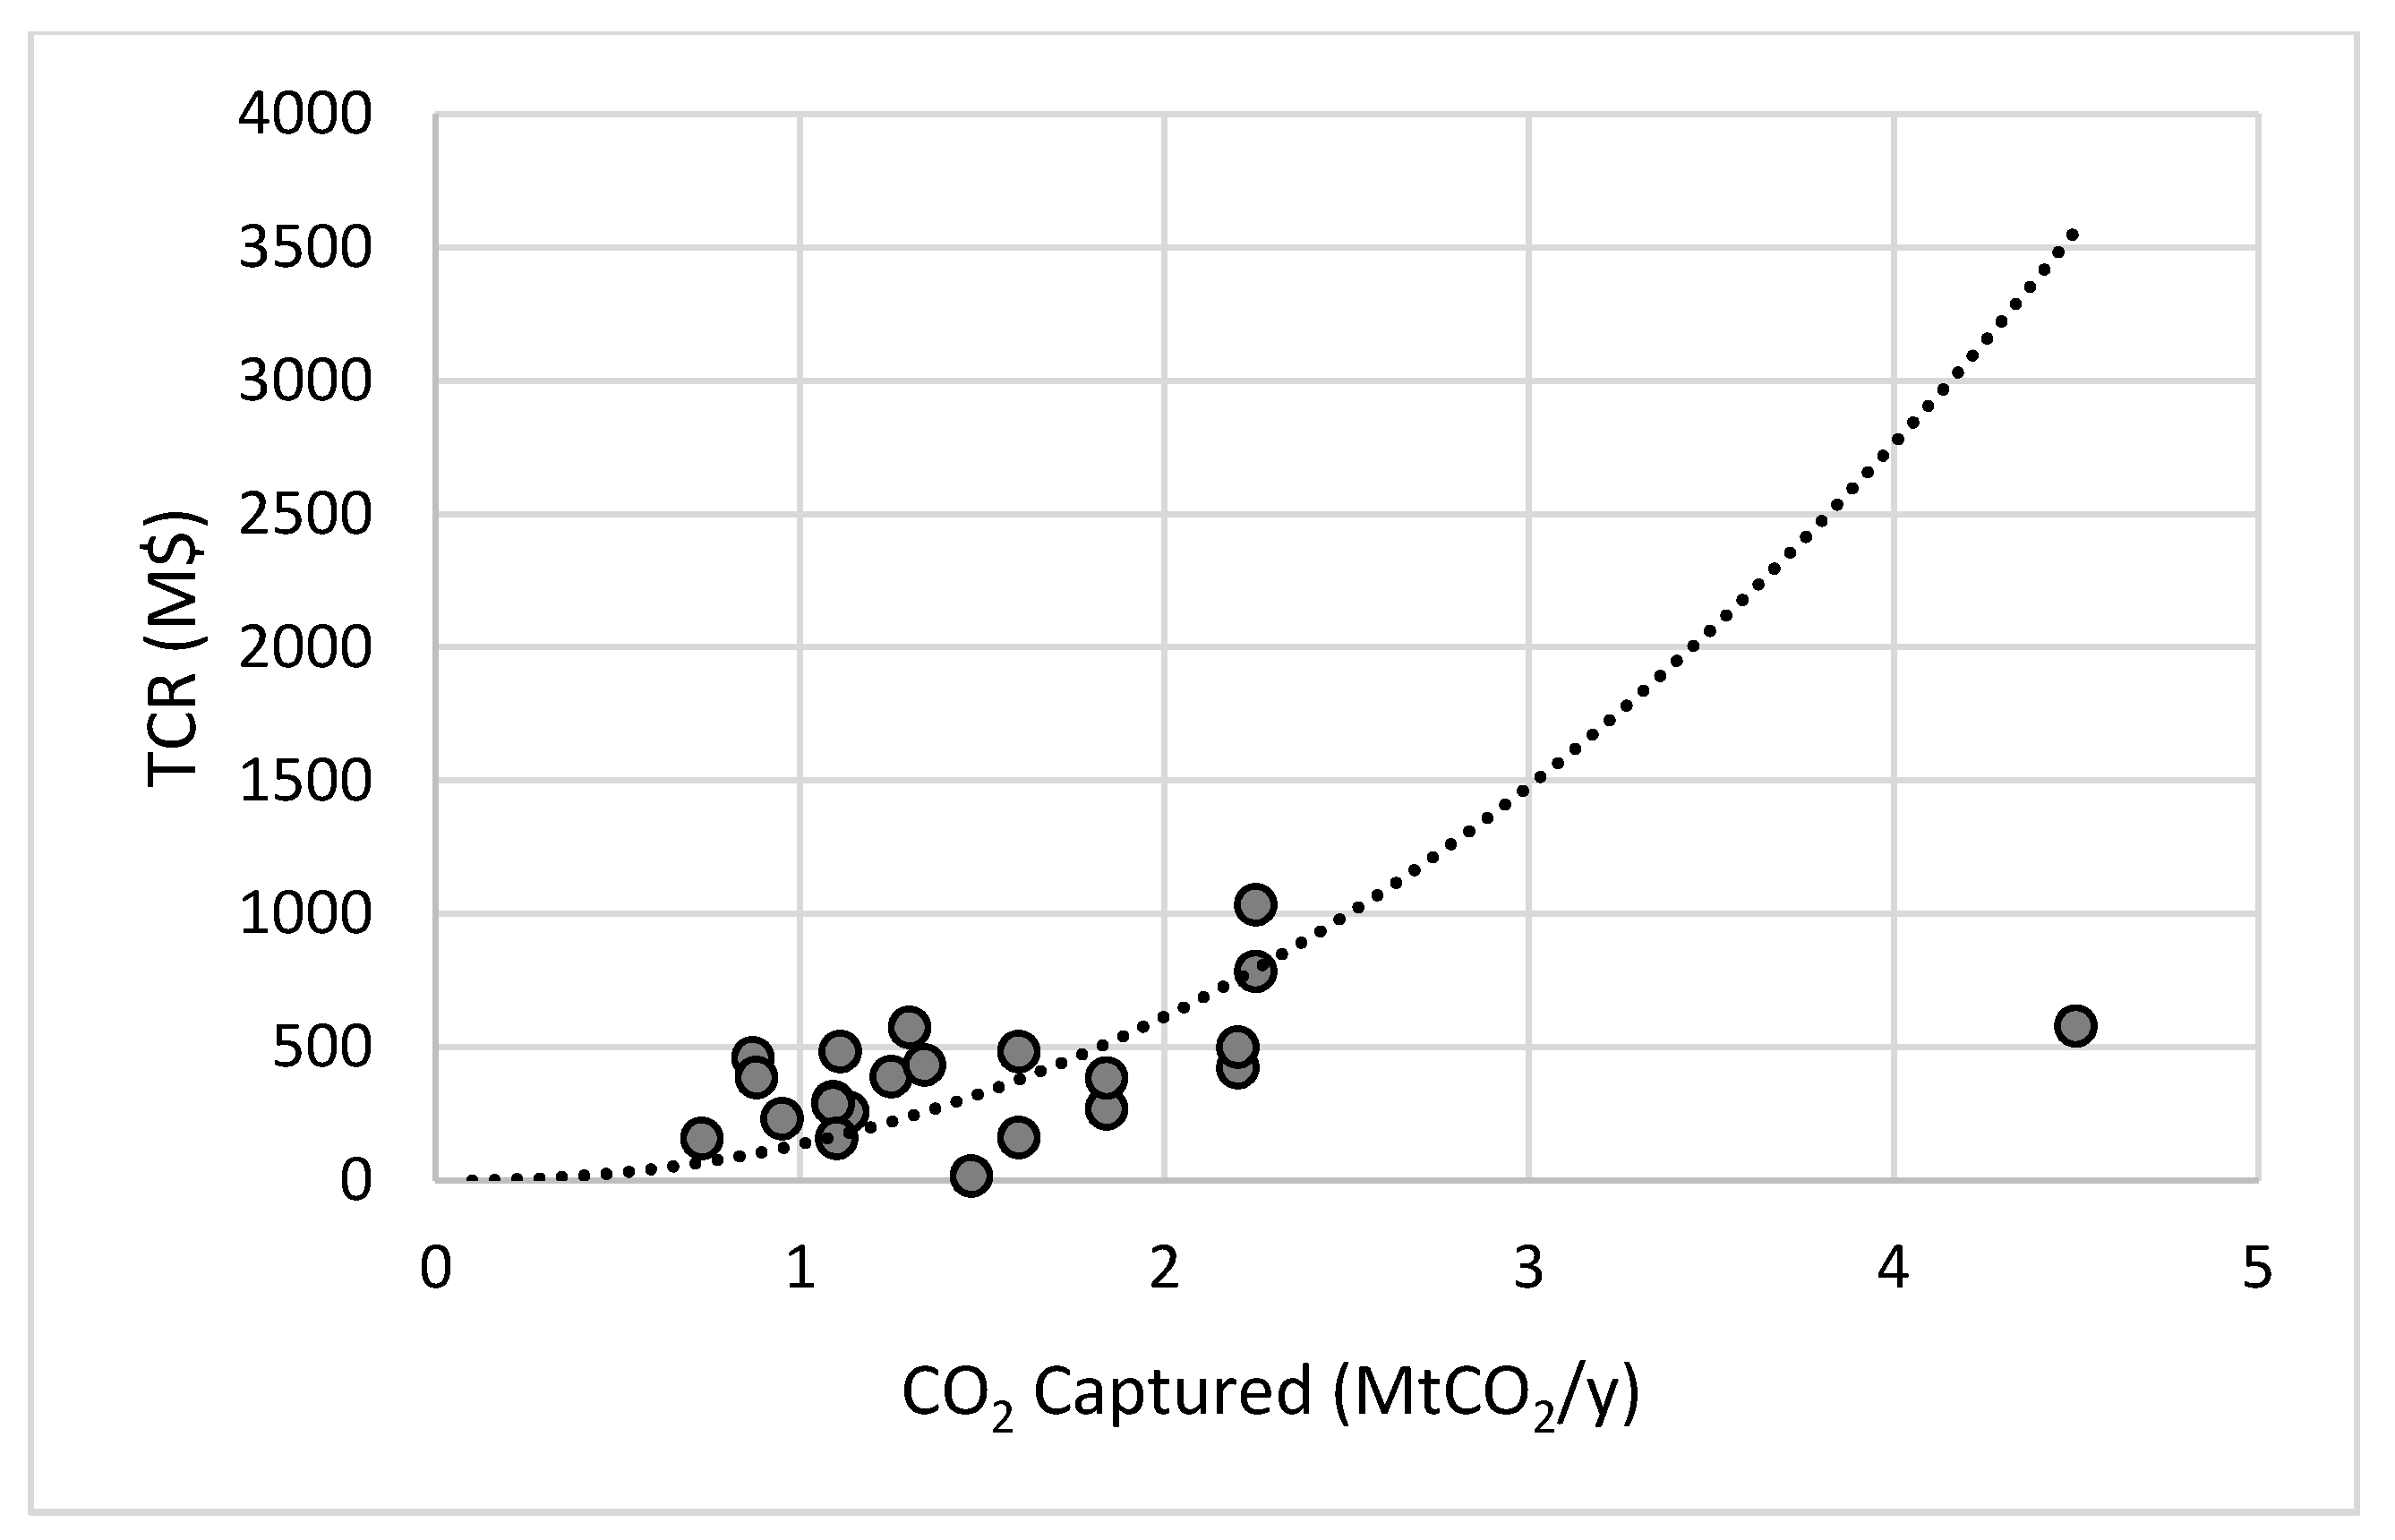
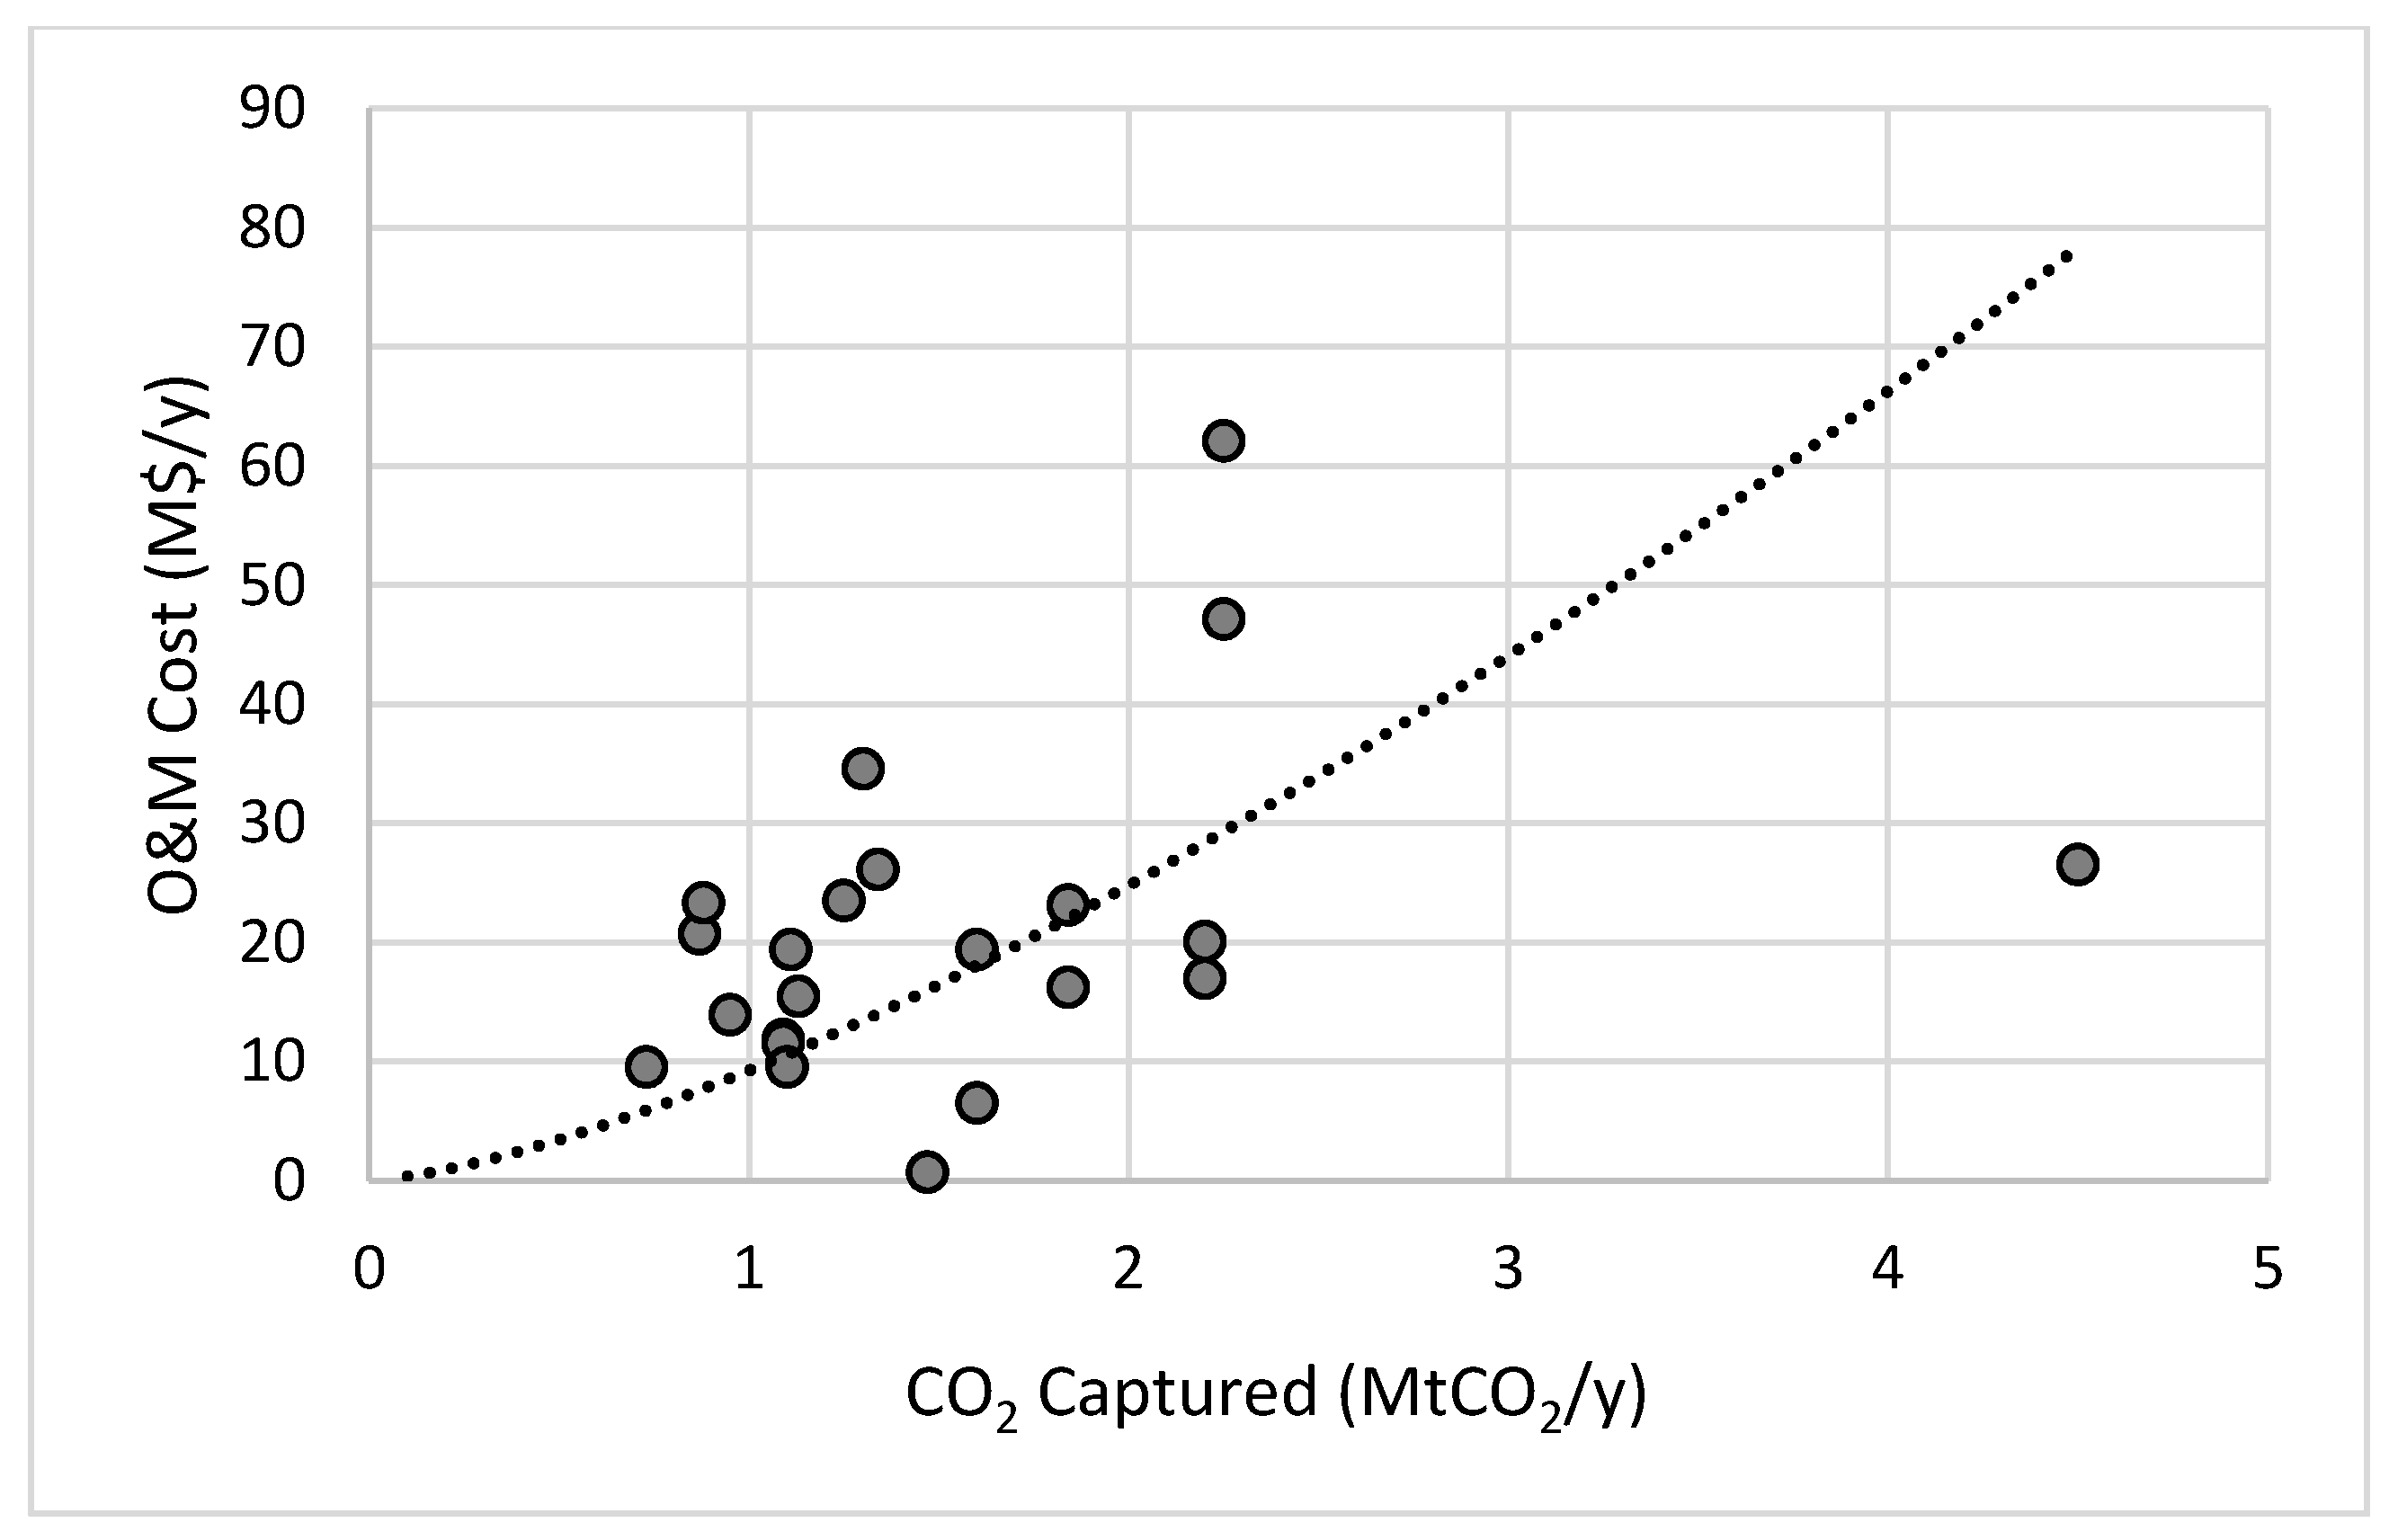
Data were split based on the separation principle used in each case into three categories; chemical absorption, physical absorption and oxyfuel combustion. Regarding chemical absorption, many data points covered a decent range of flowrates between 0–6.7 Mt
CO2/yr. This data group includes data from various CO
2 sources. The analysis showed that the curve which best described the data has the form of
y = a
xb where a and b are constants calculated from regression (
Figure 1 and
Figure 2).
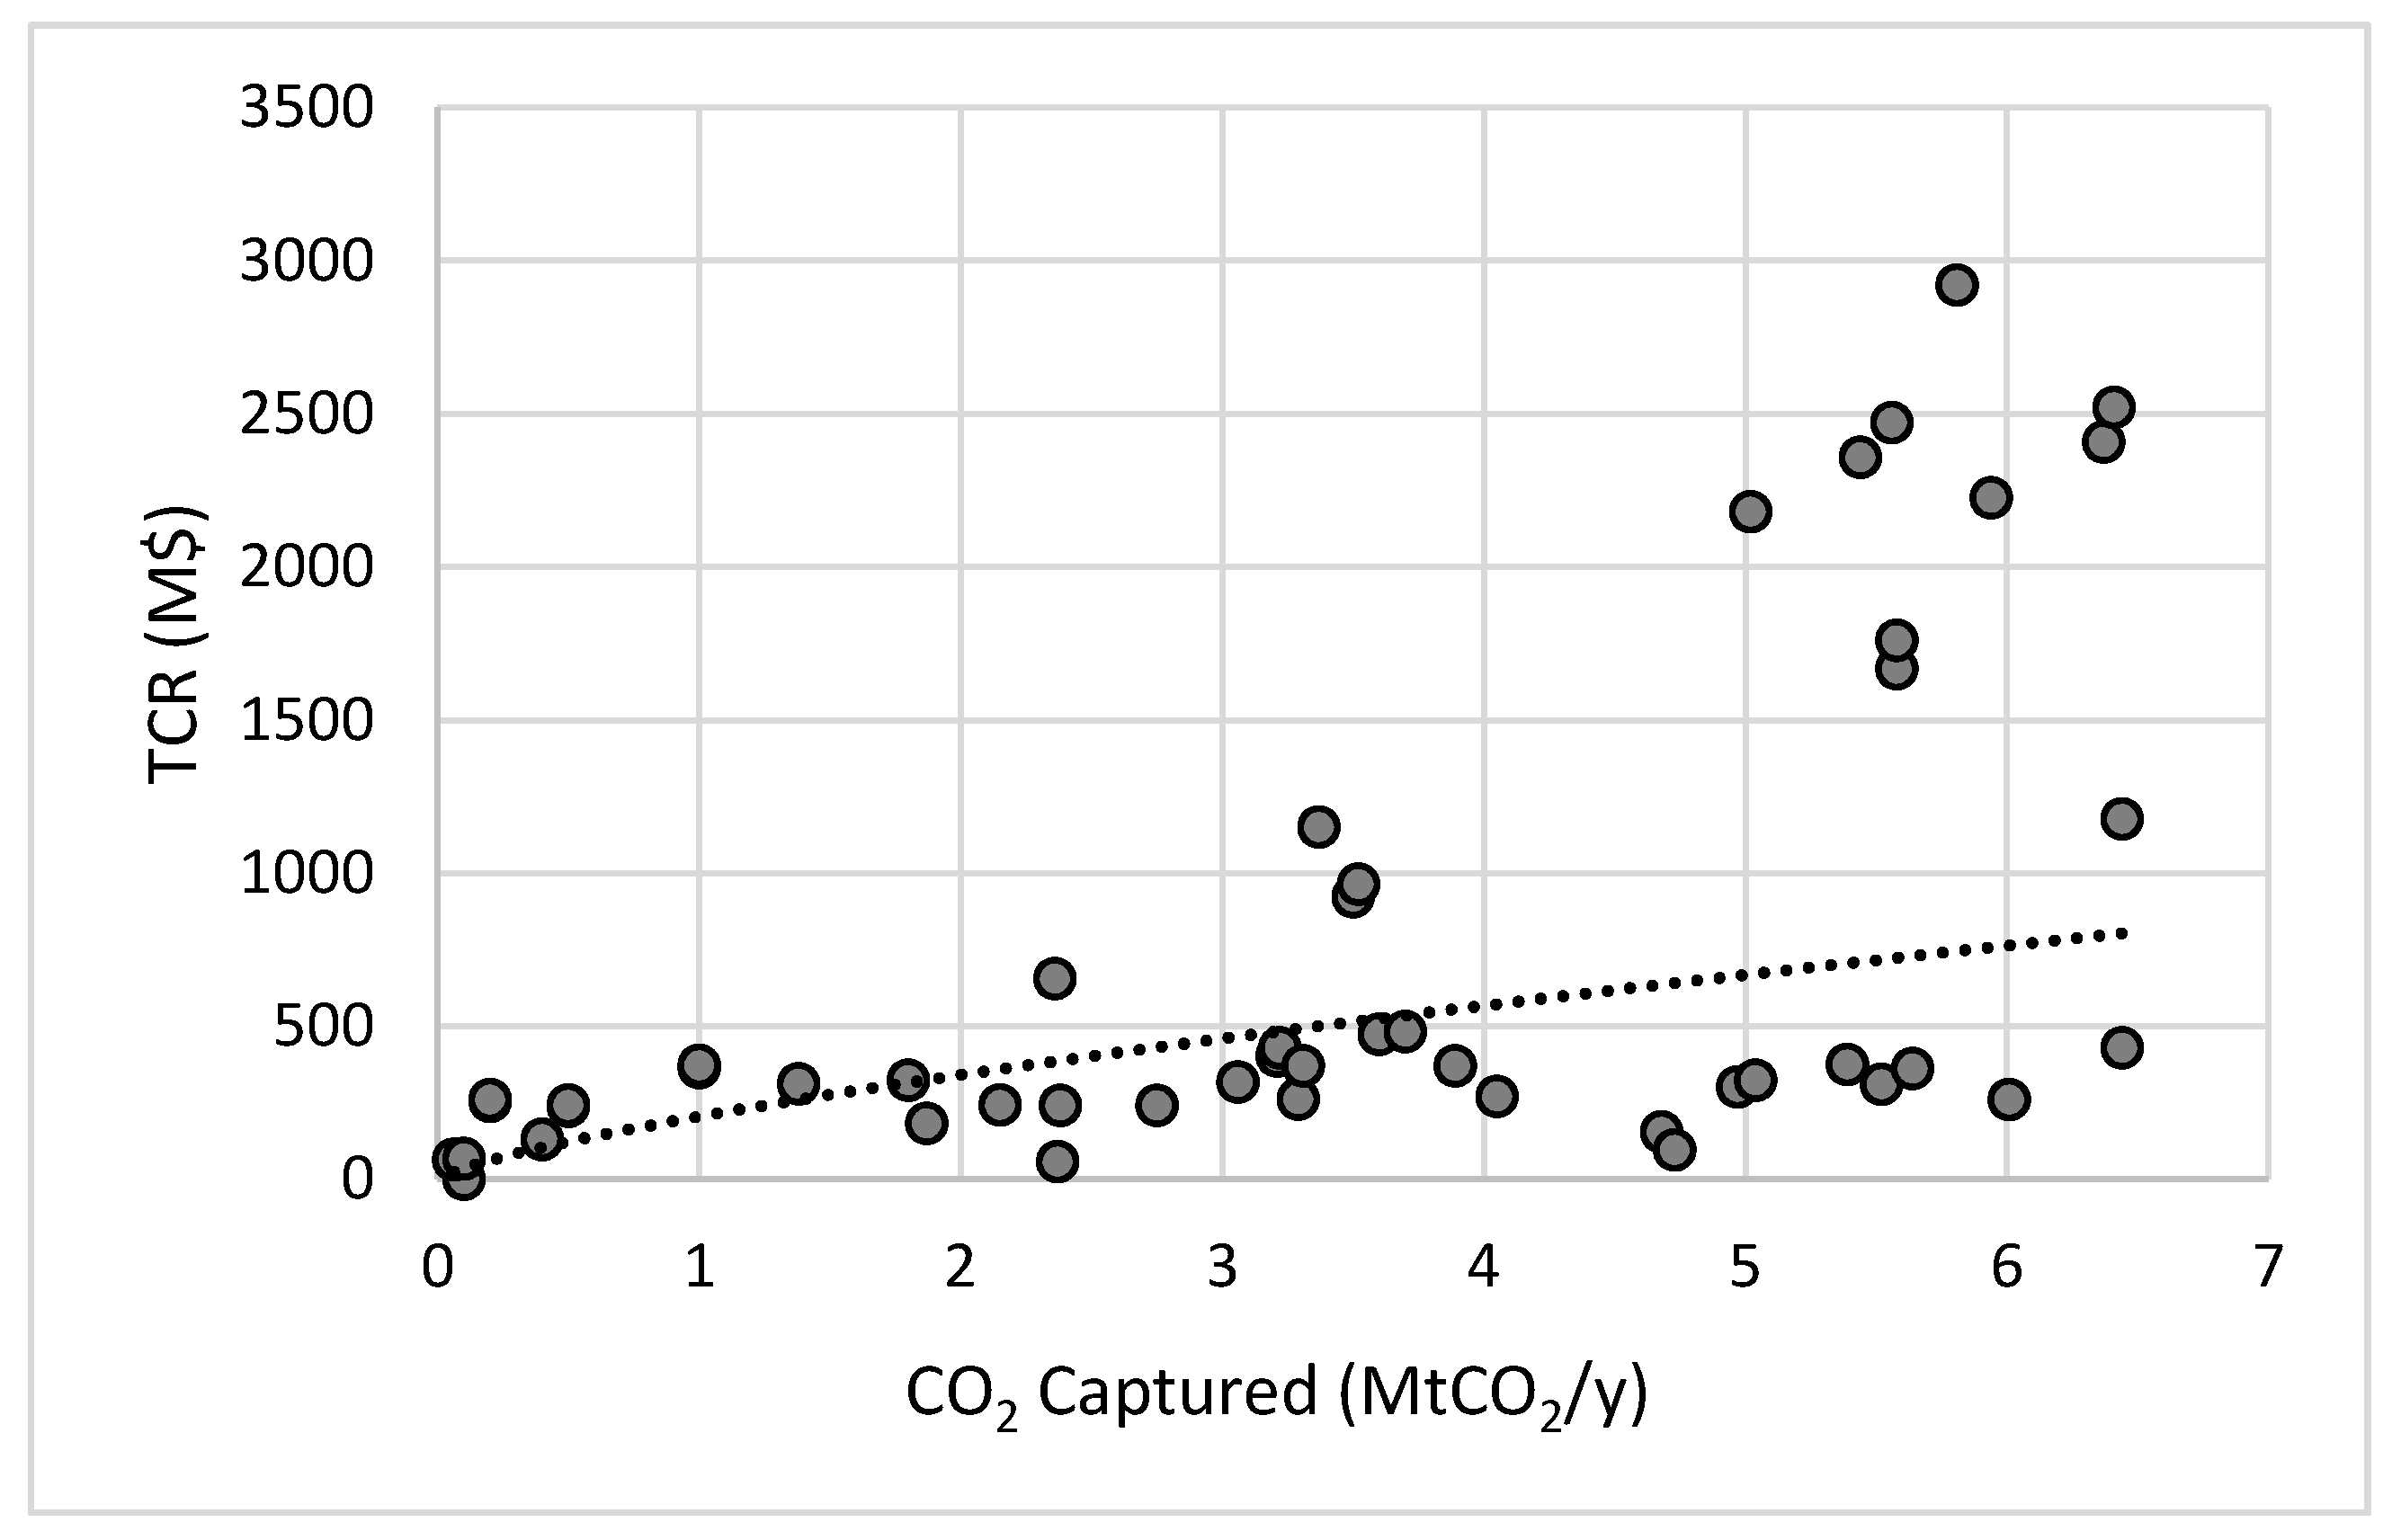
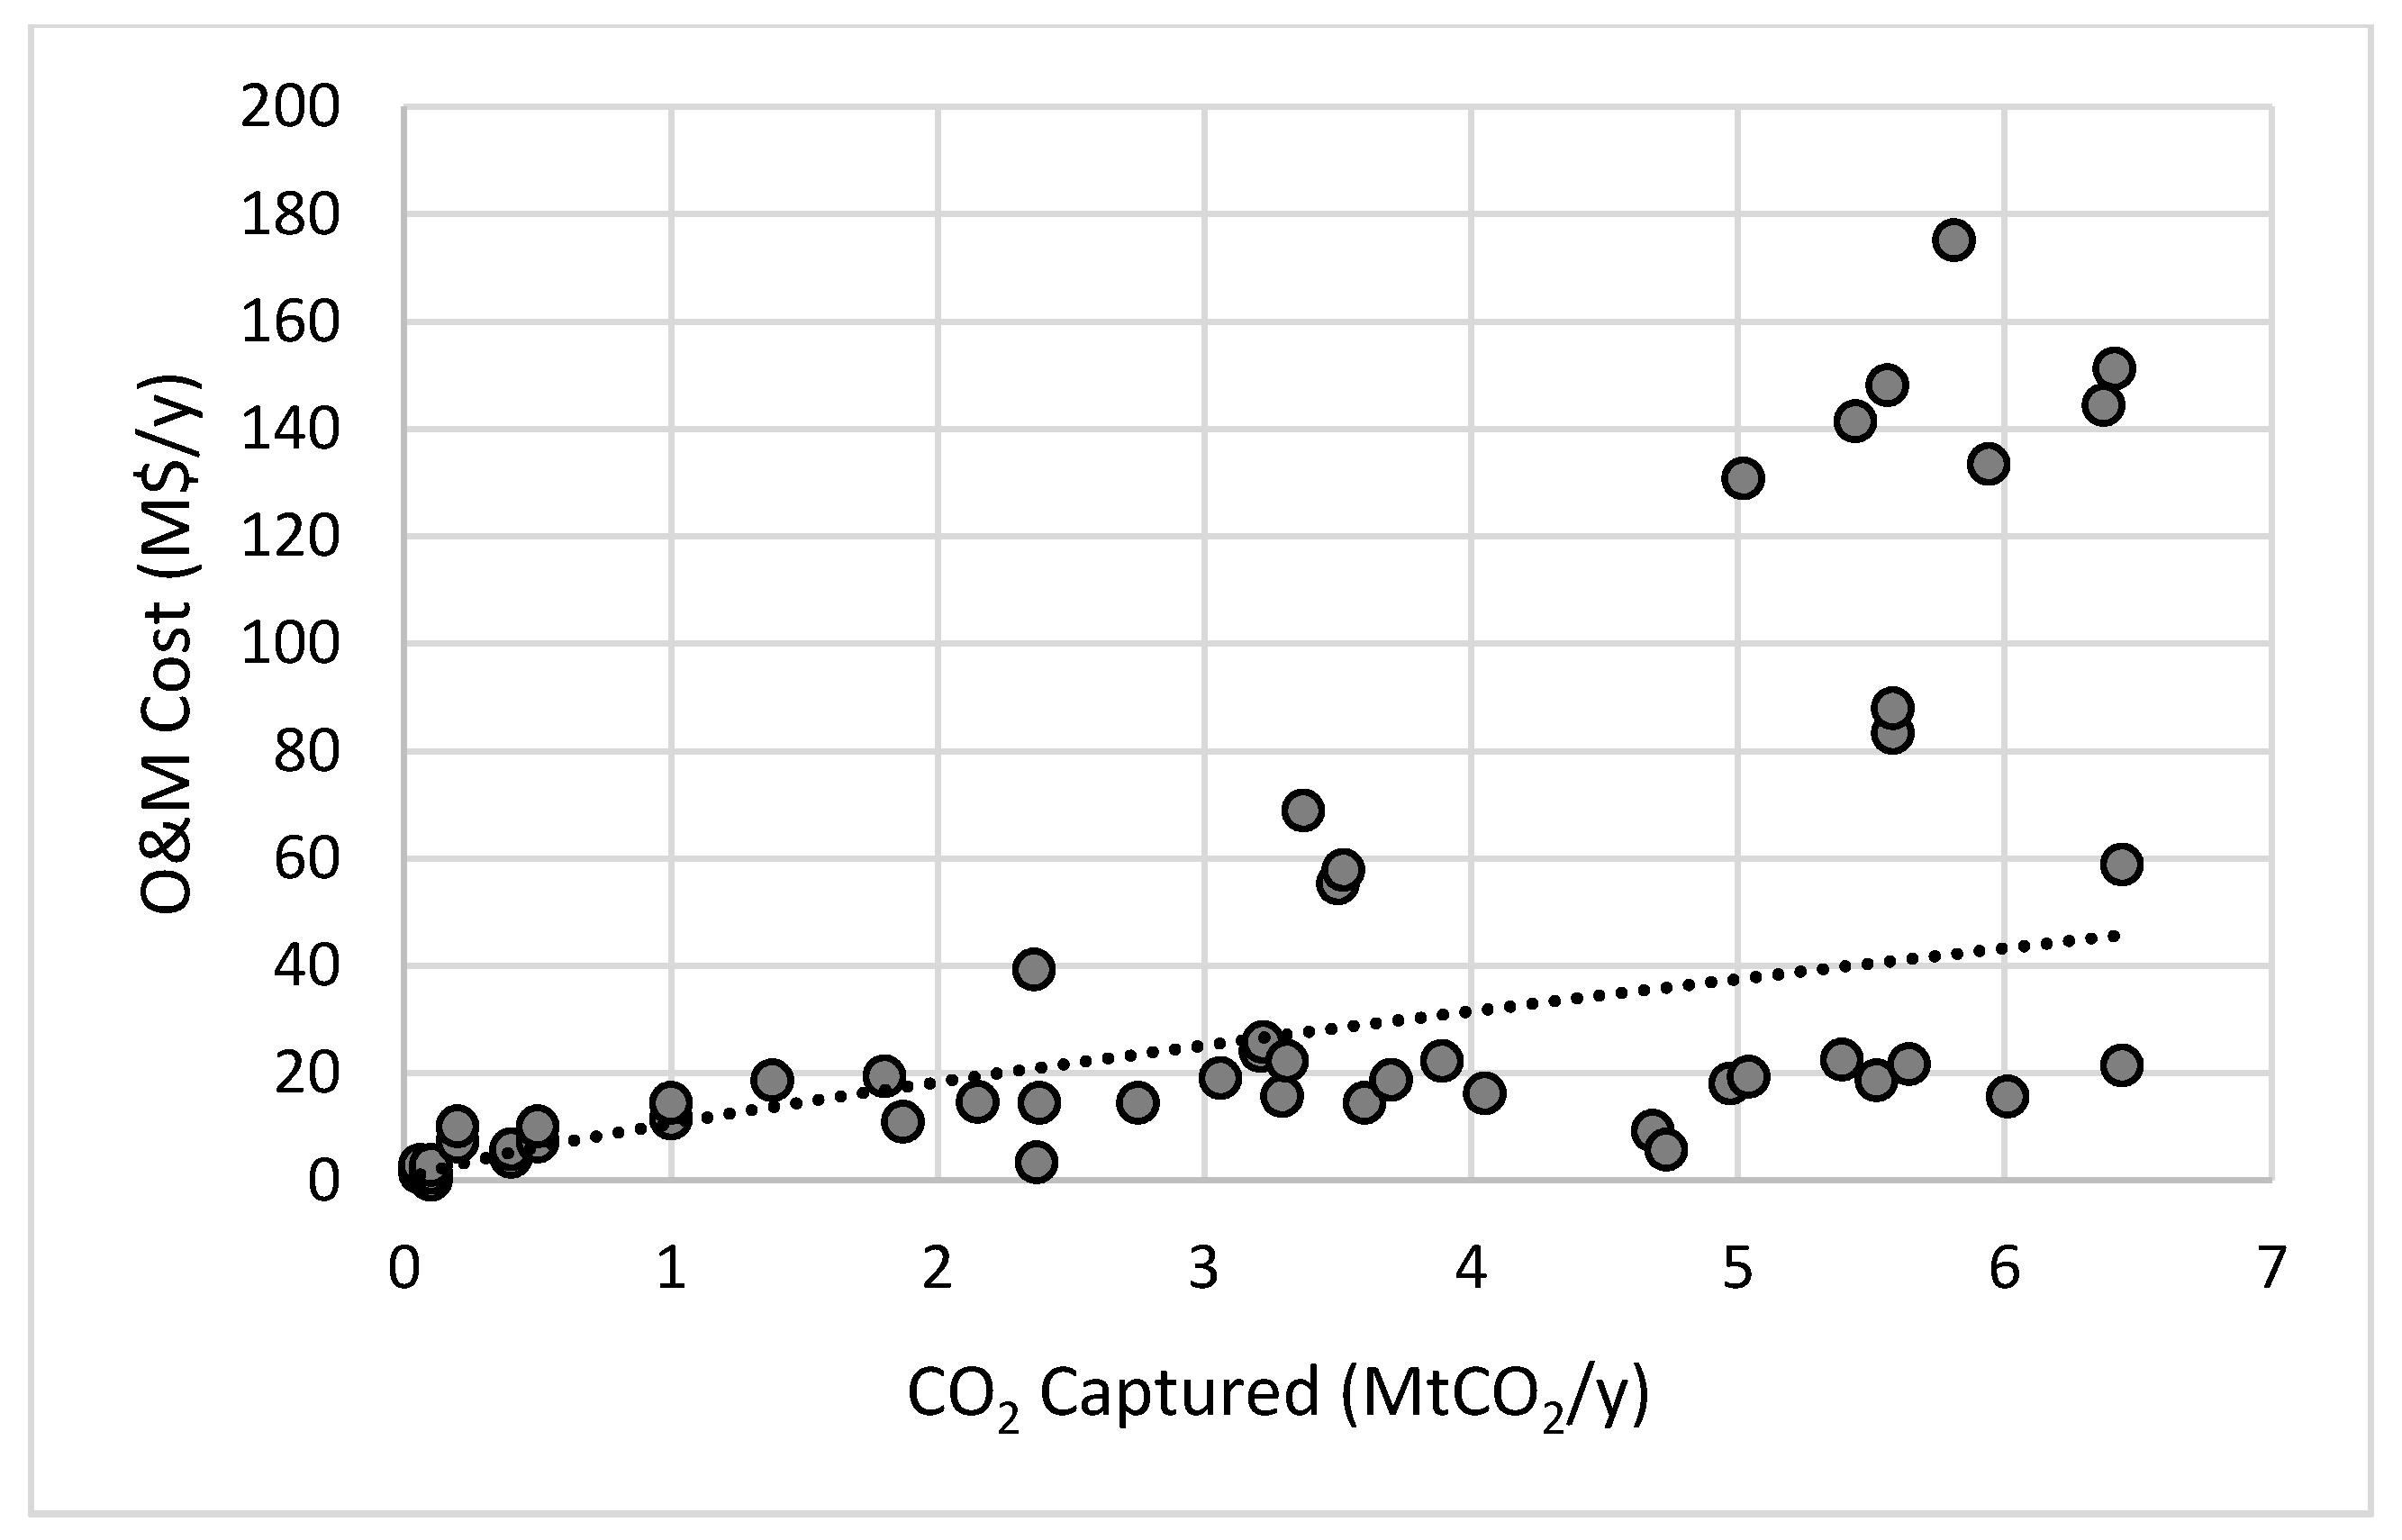
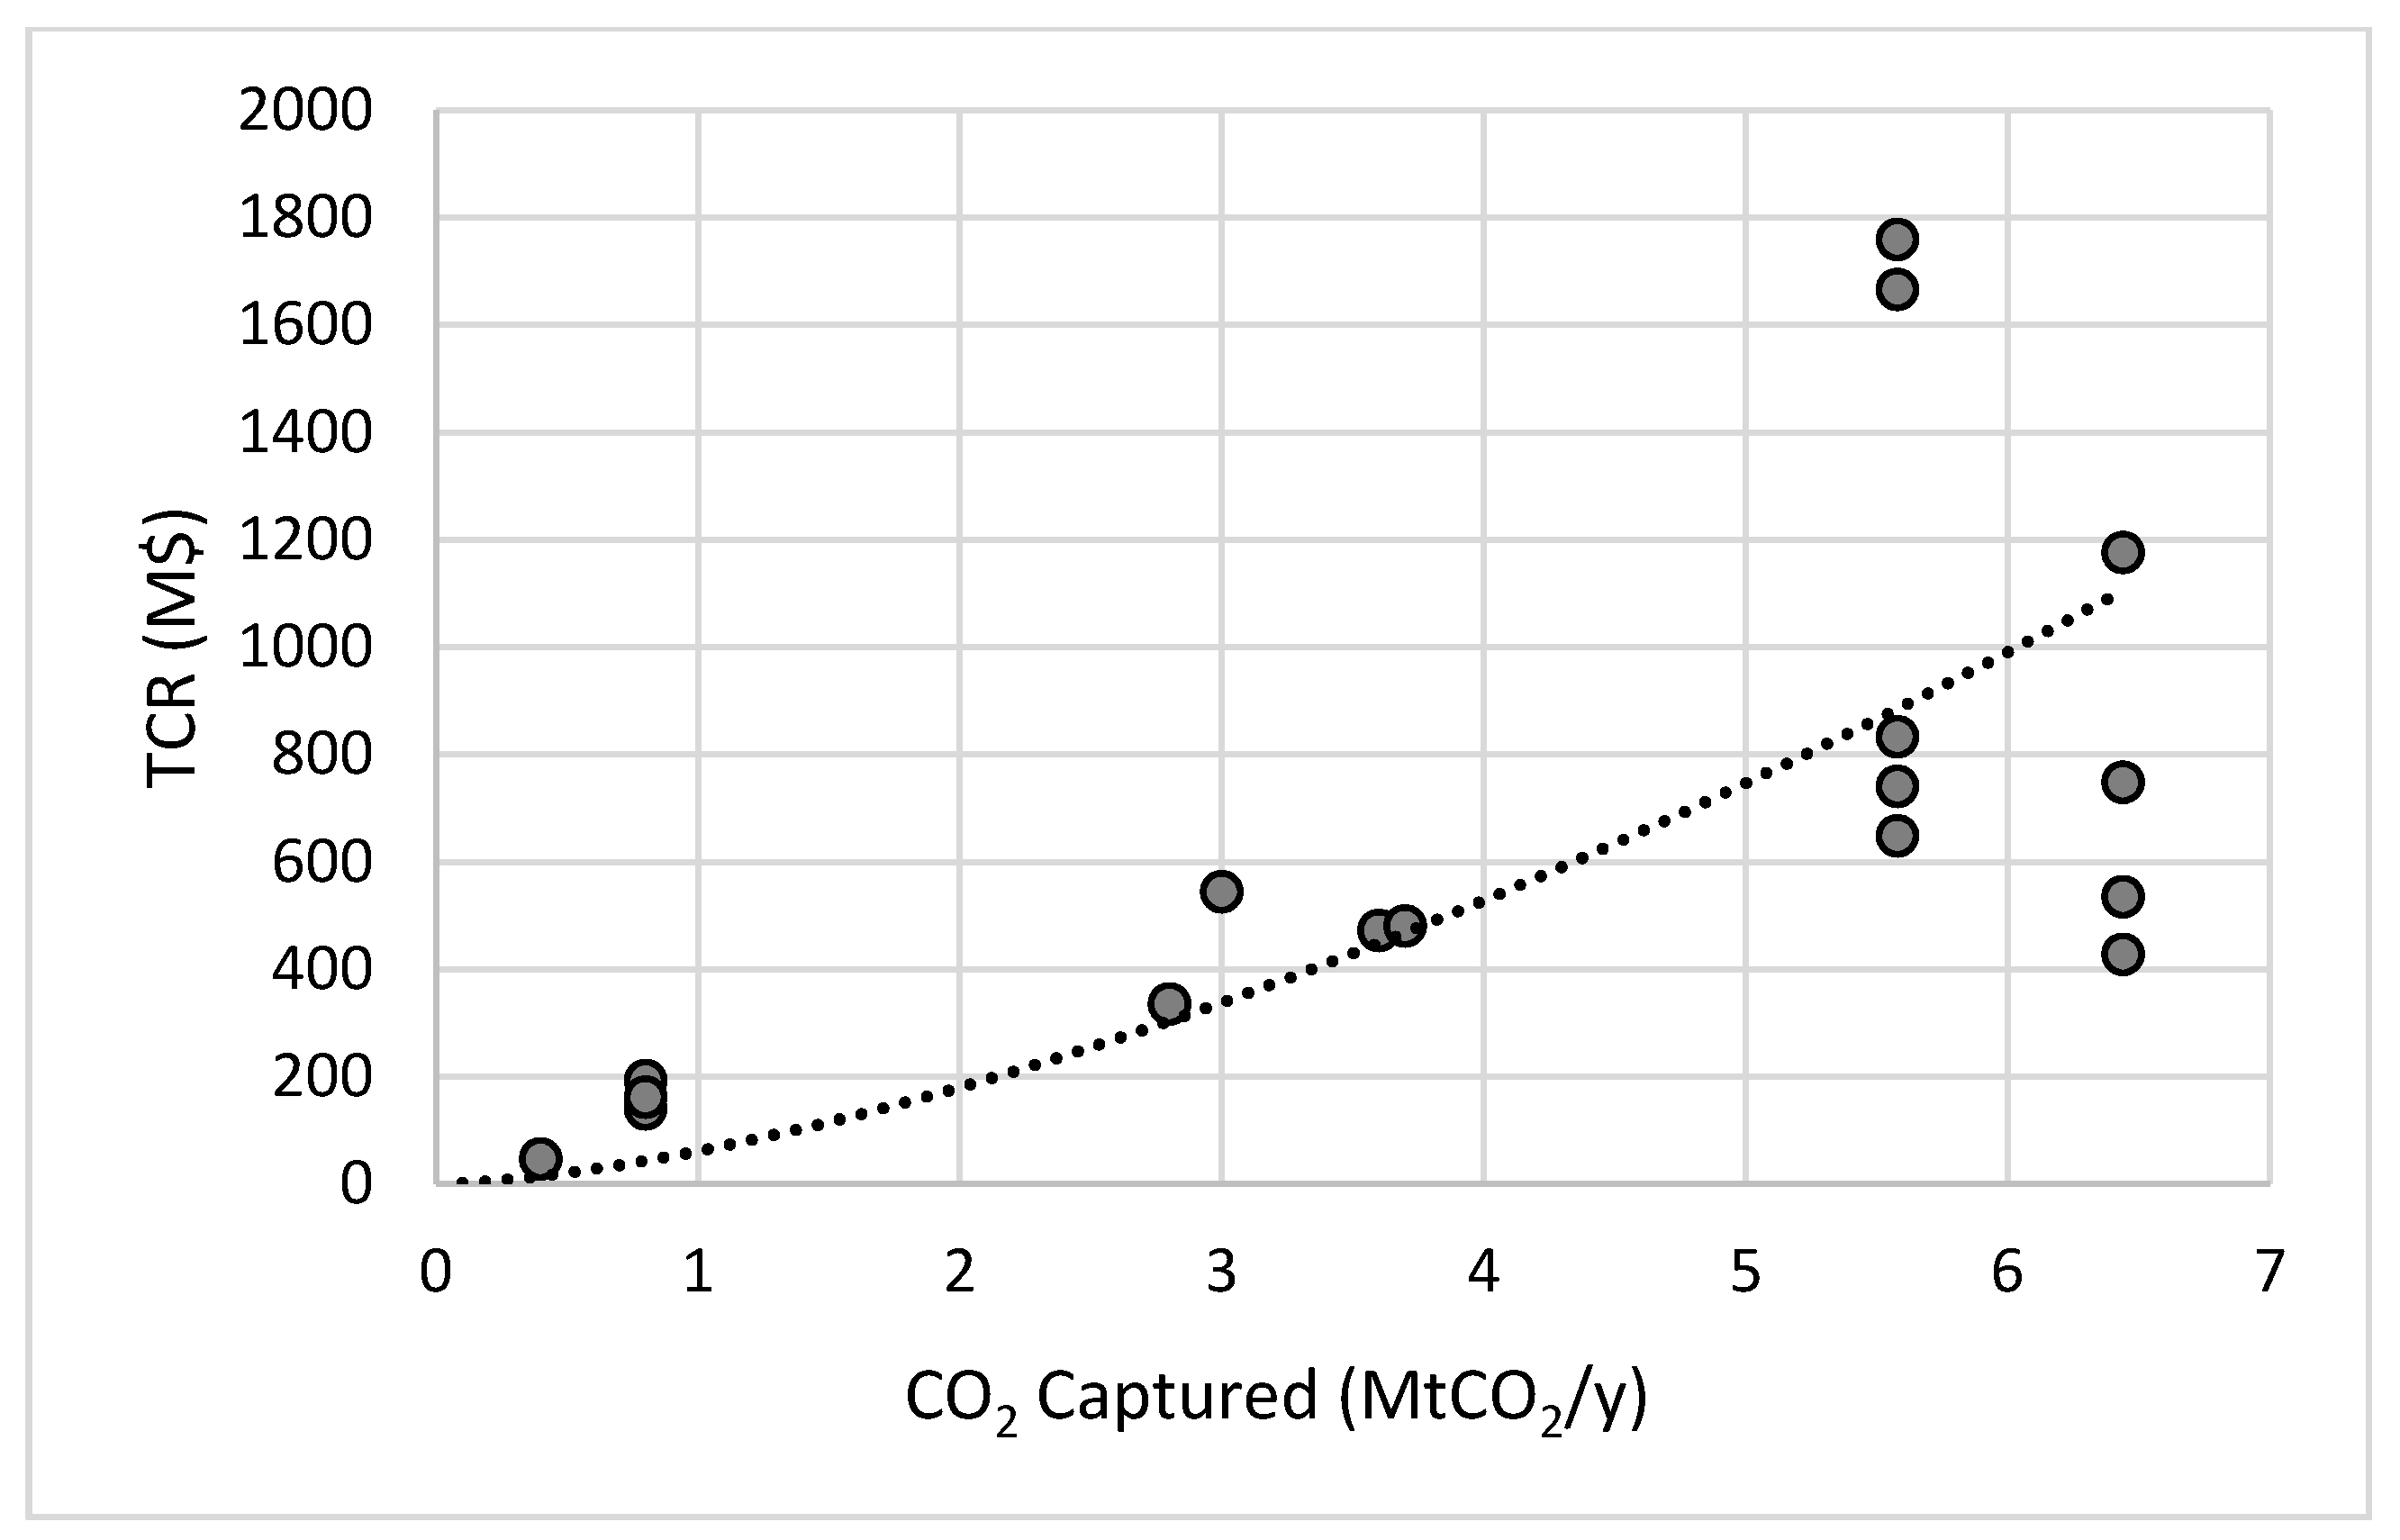
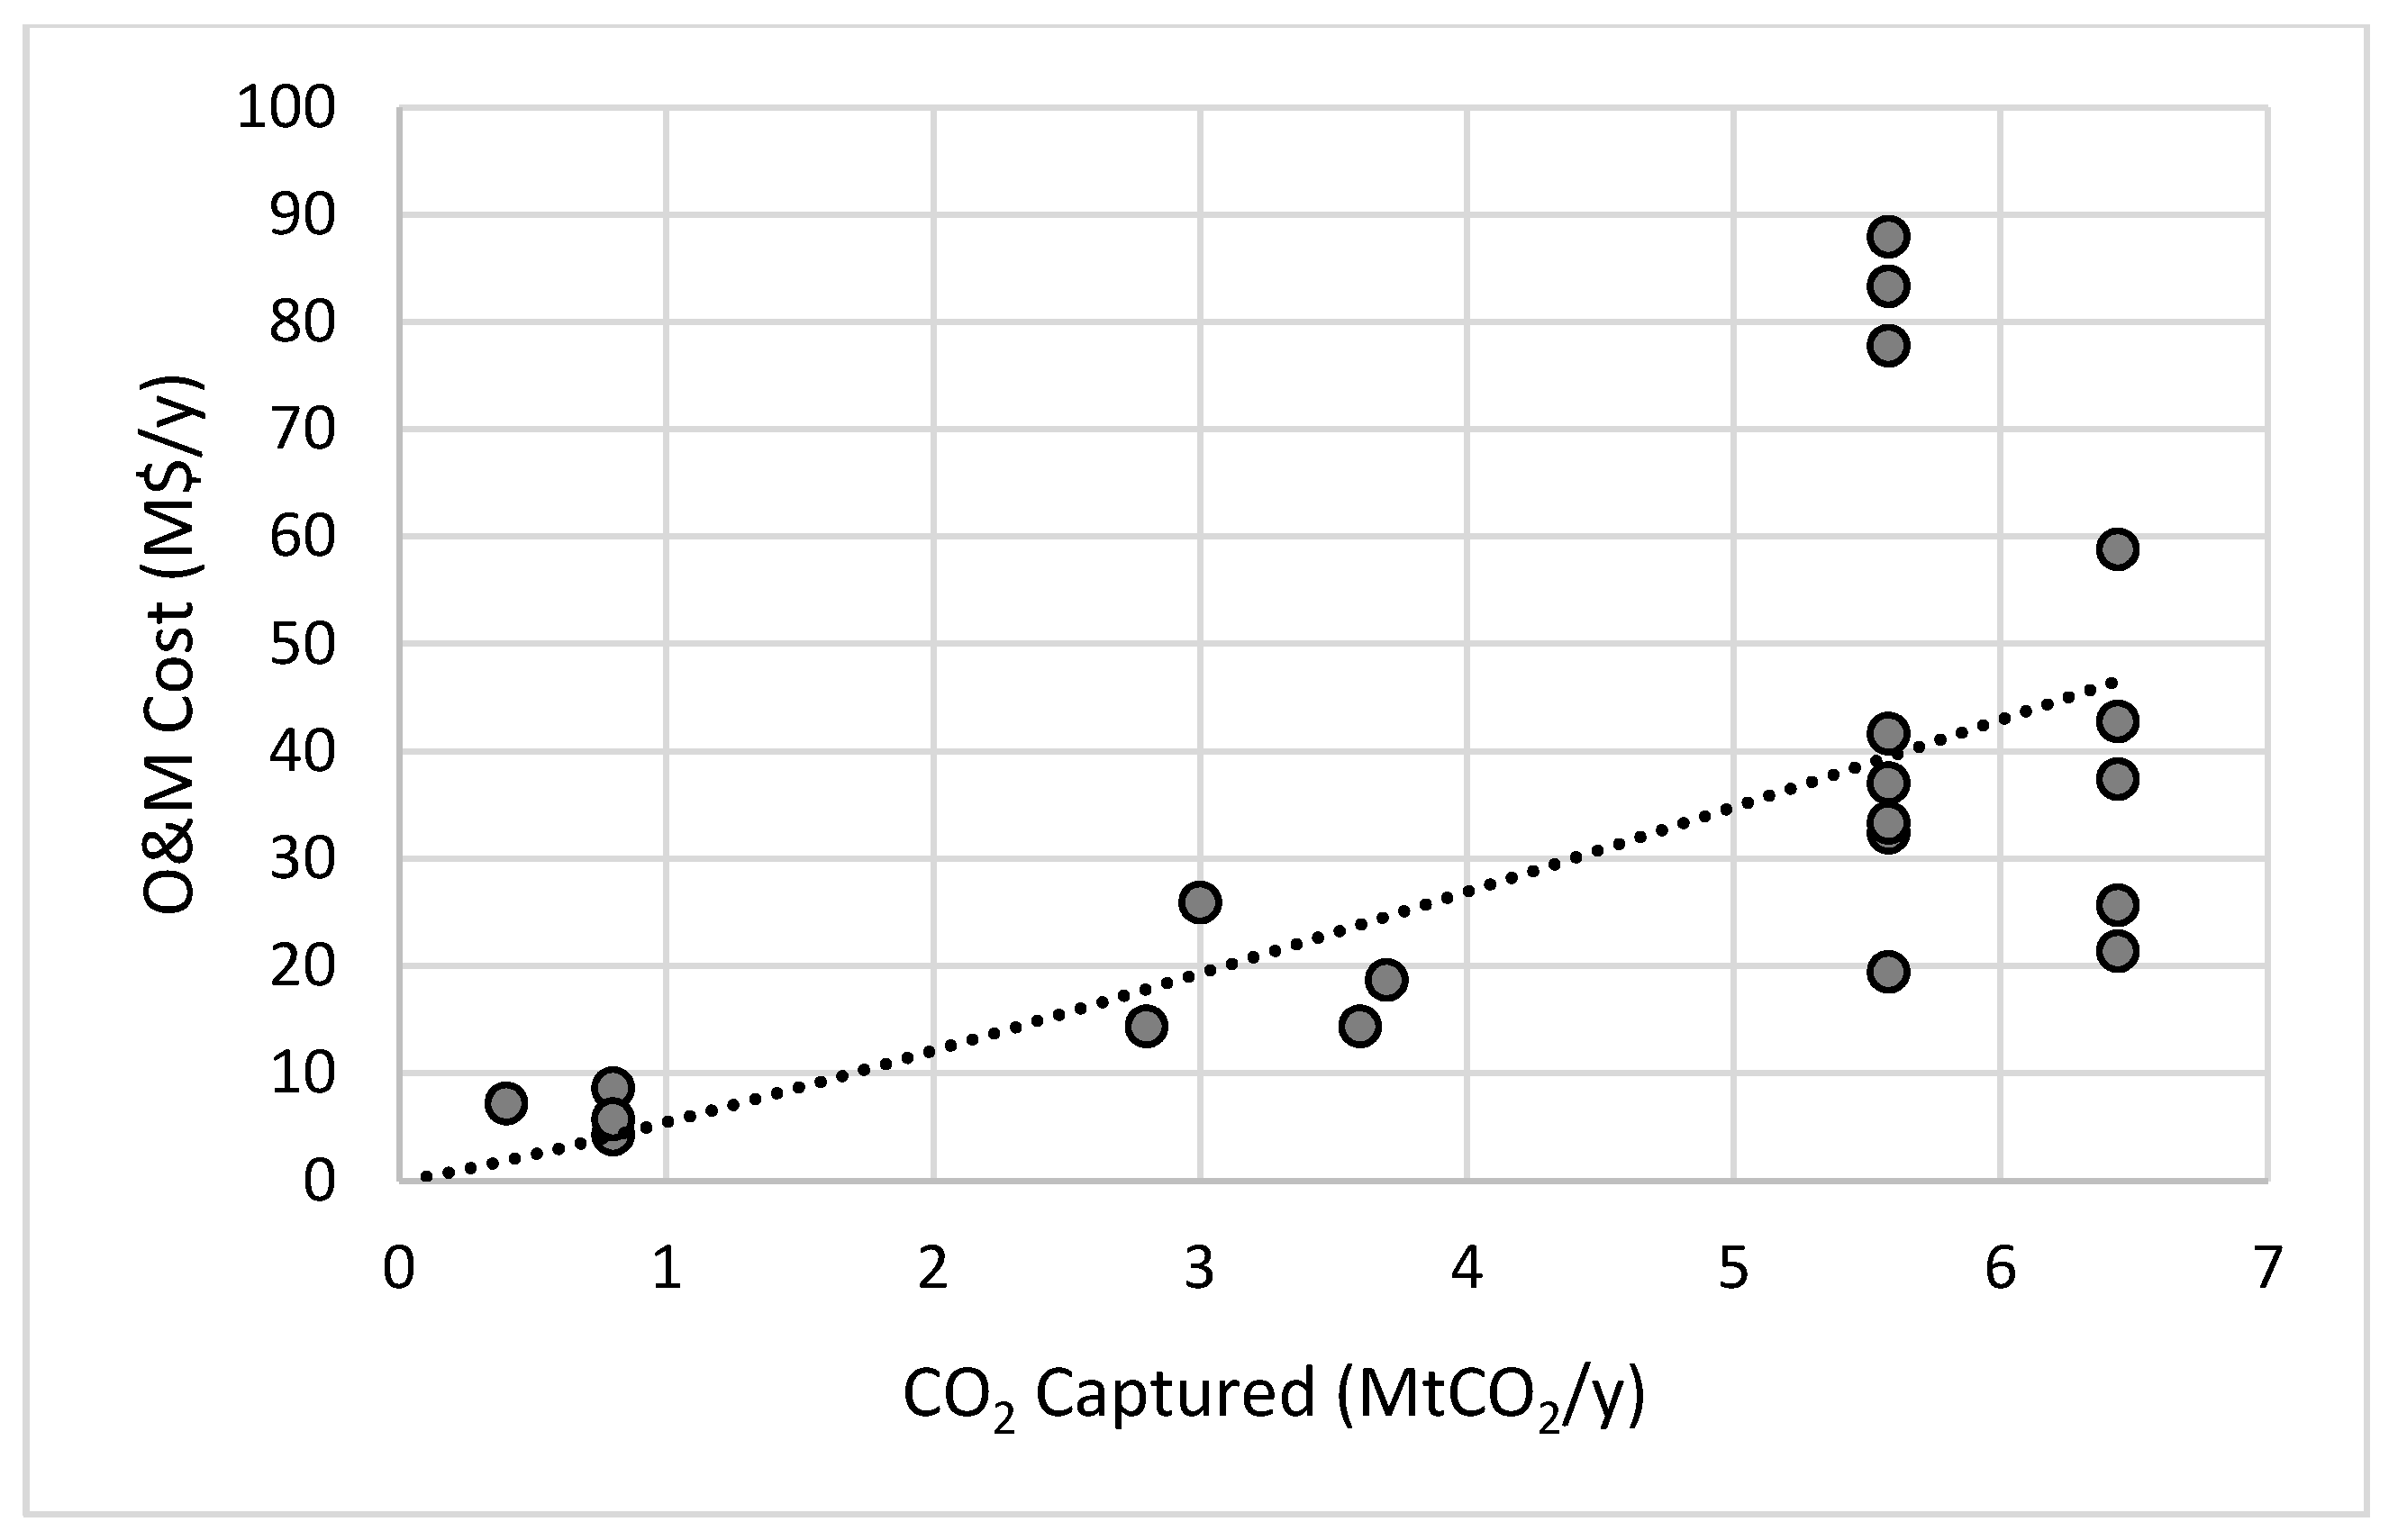
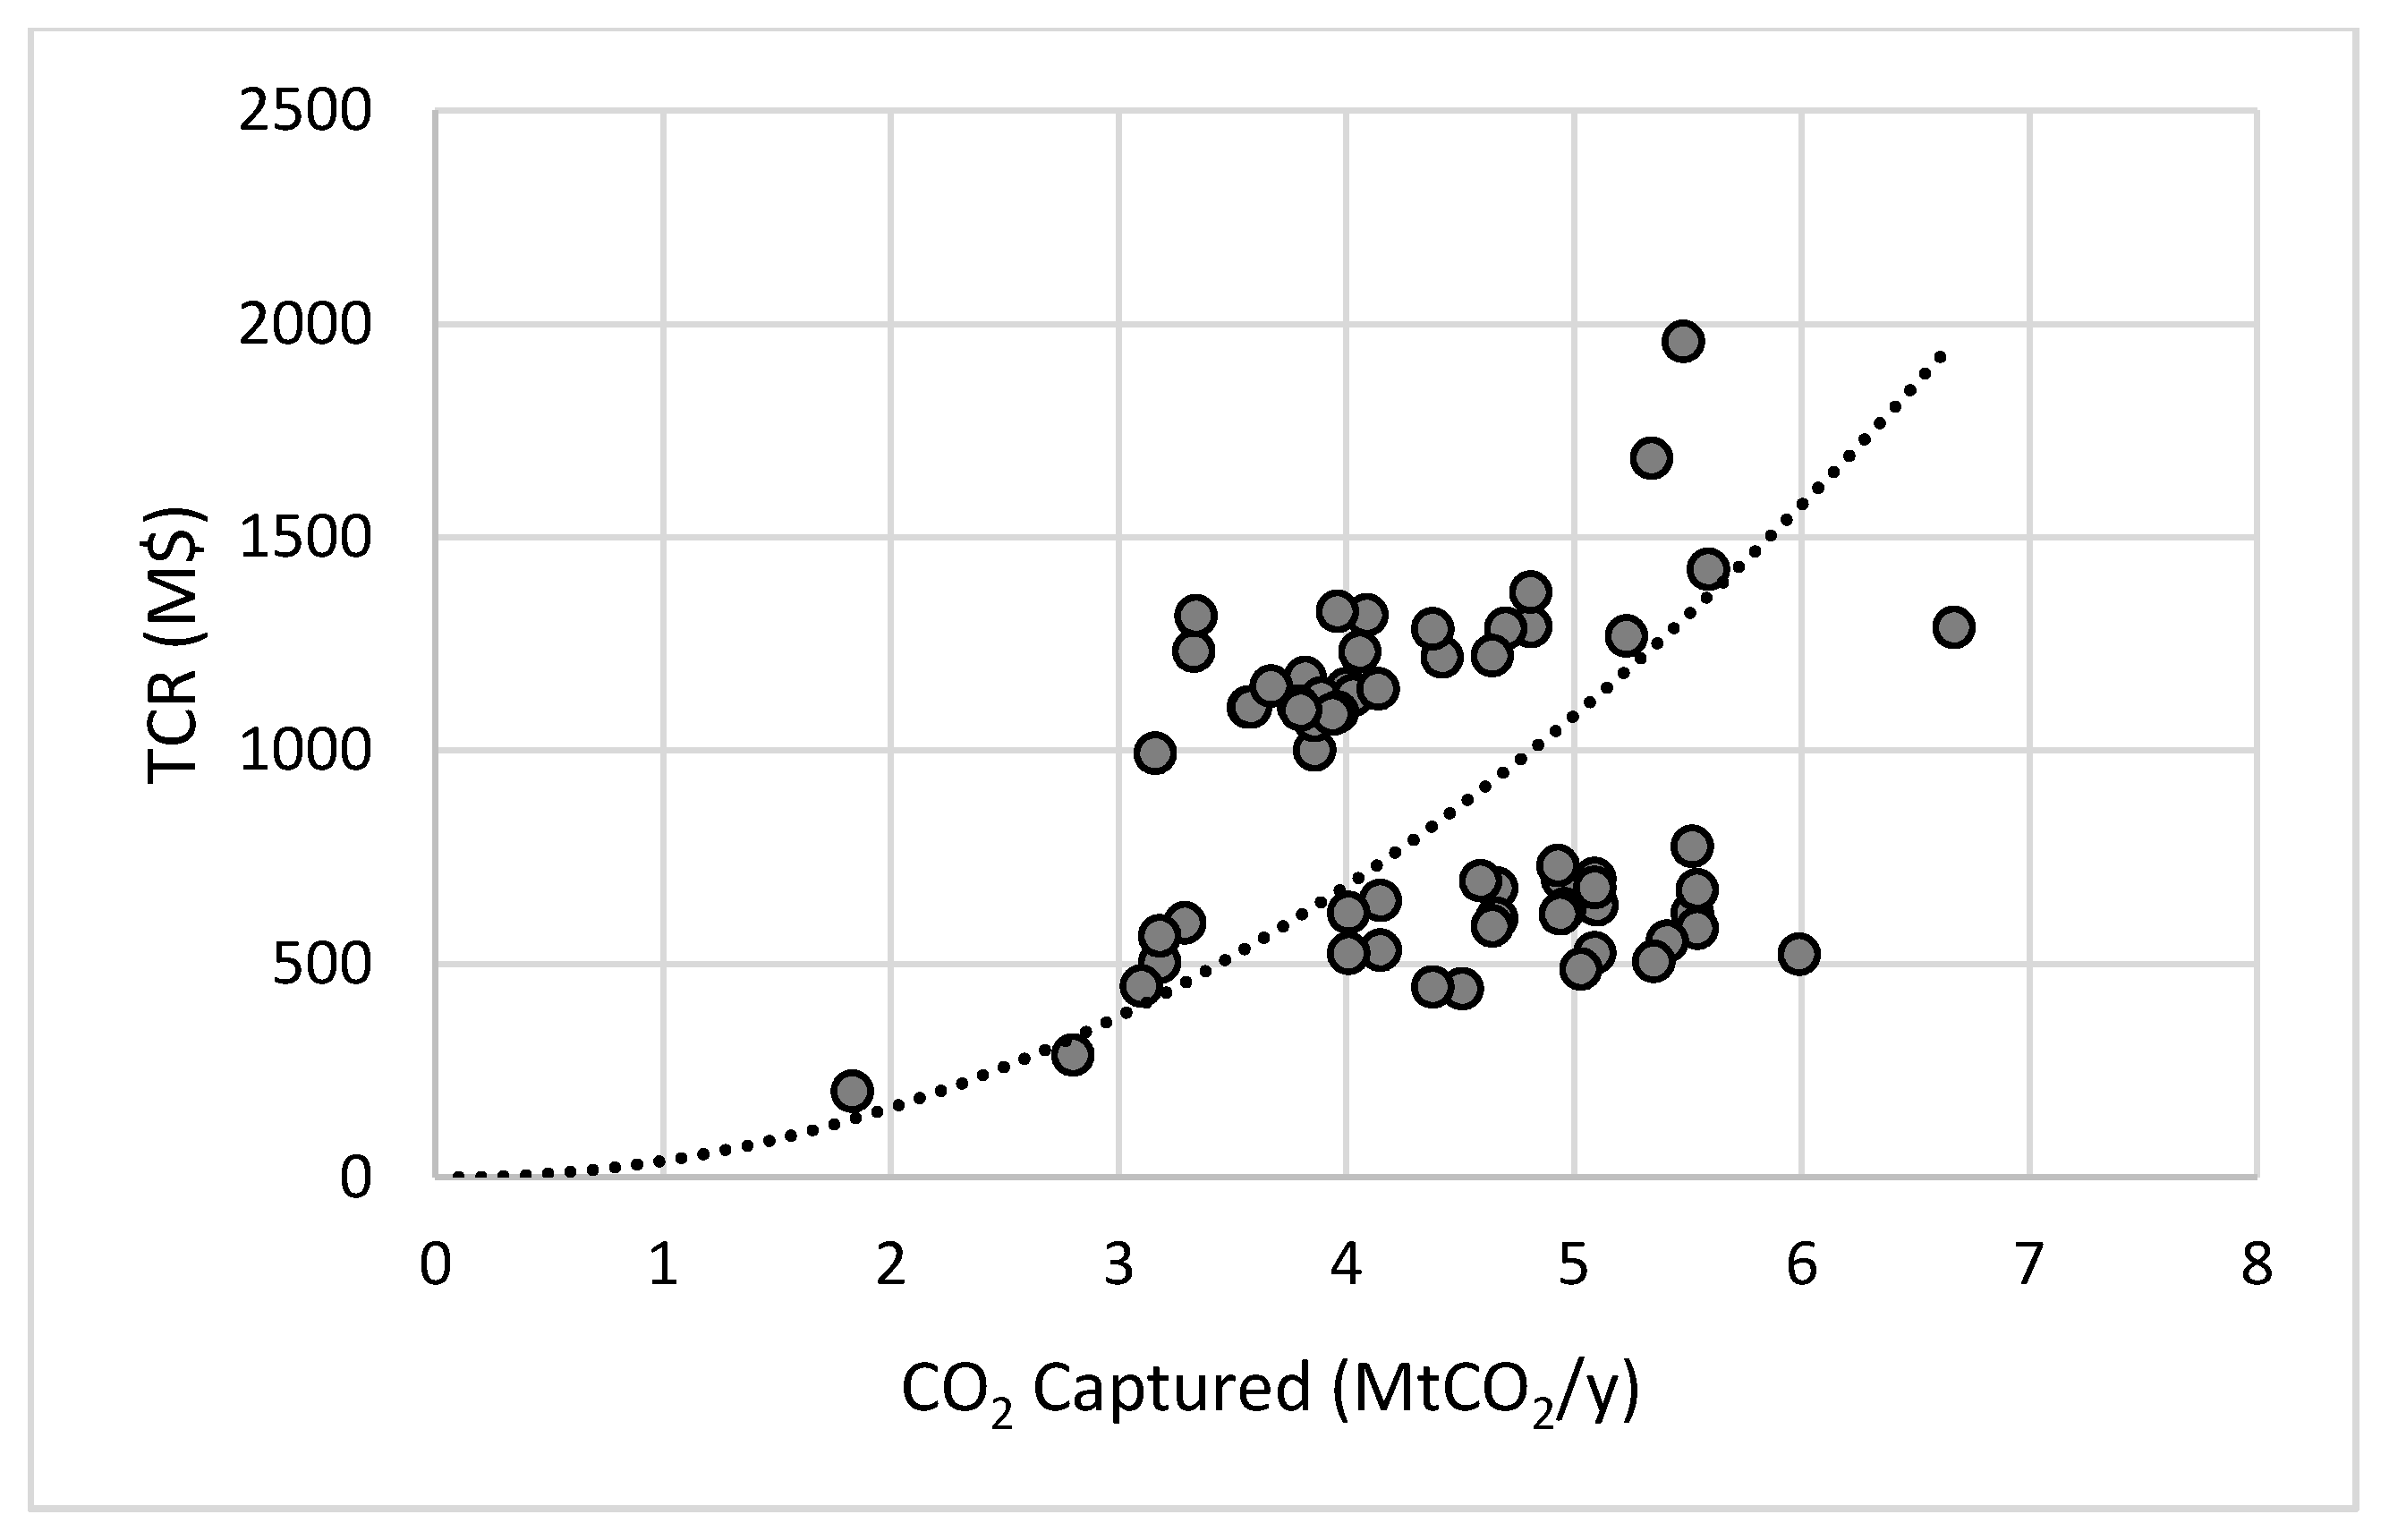
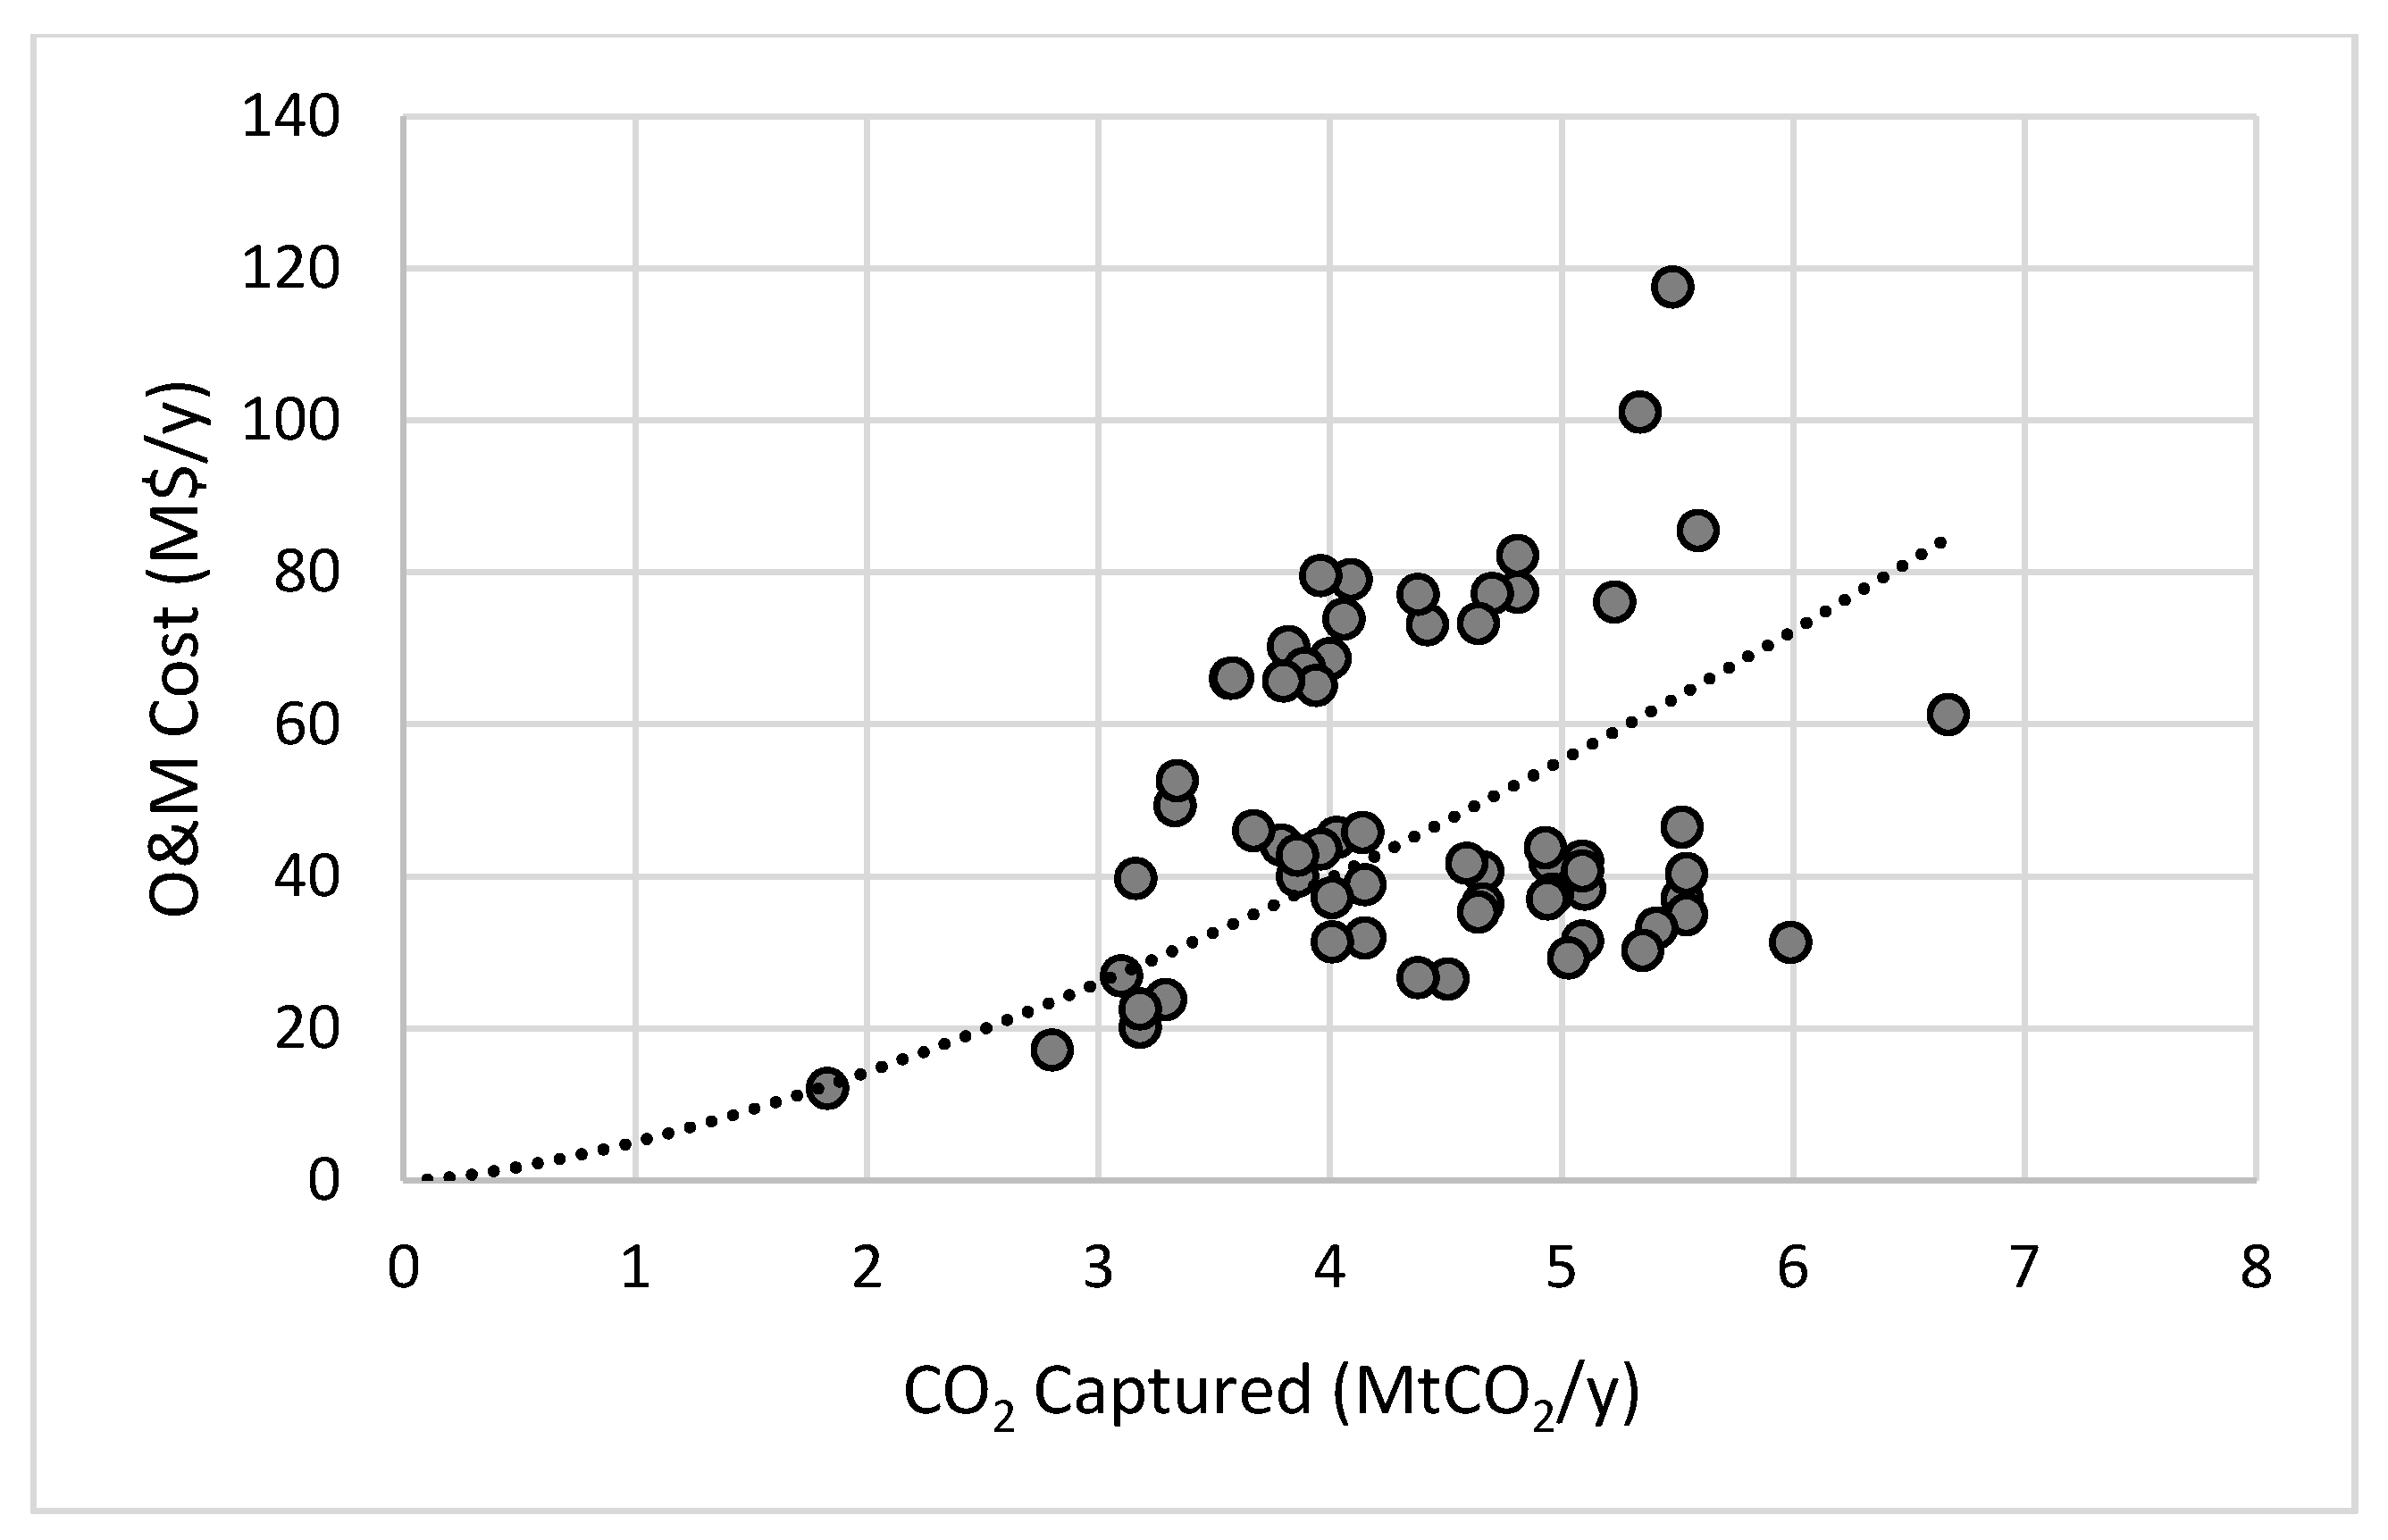
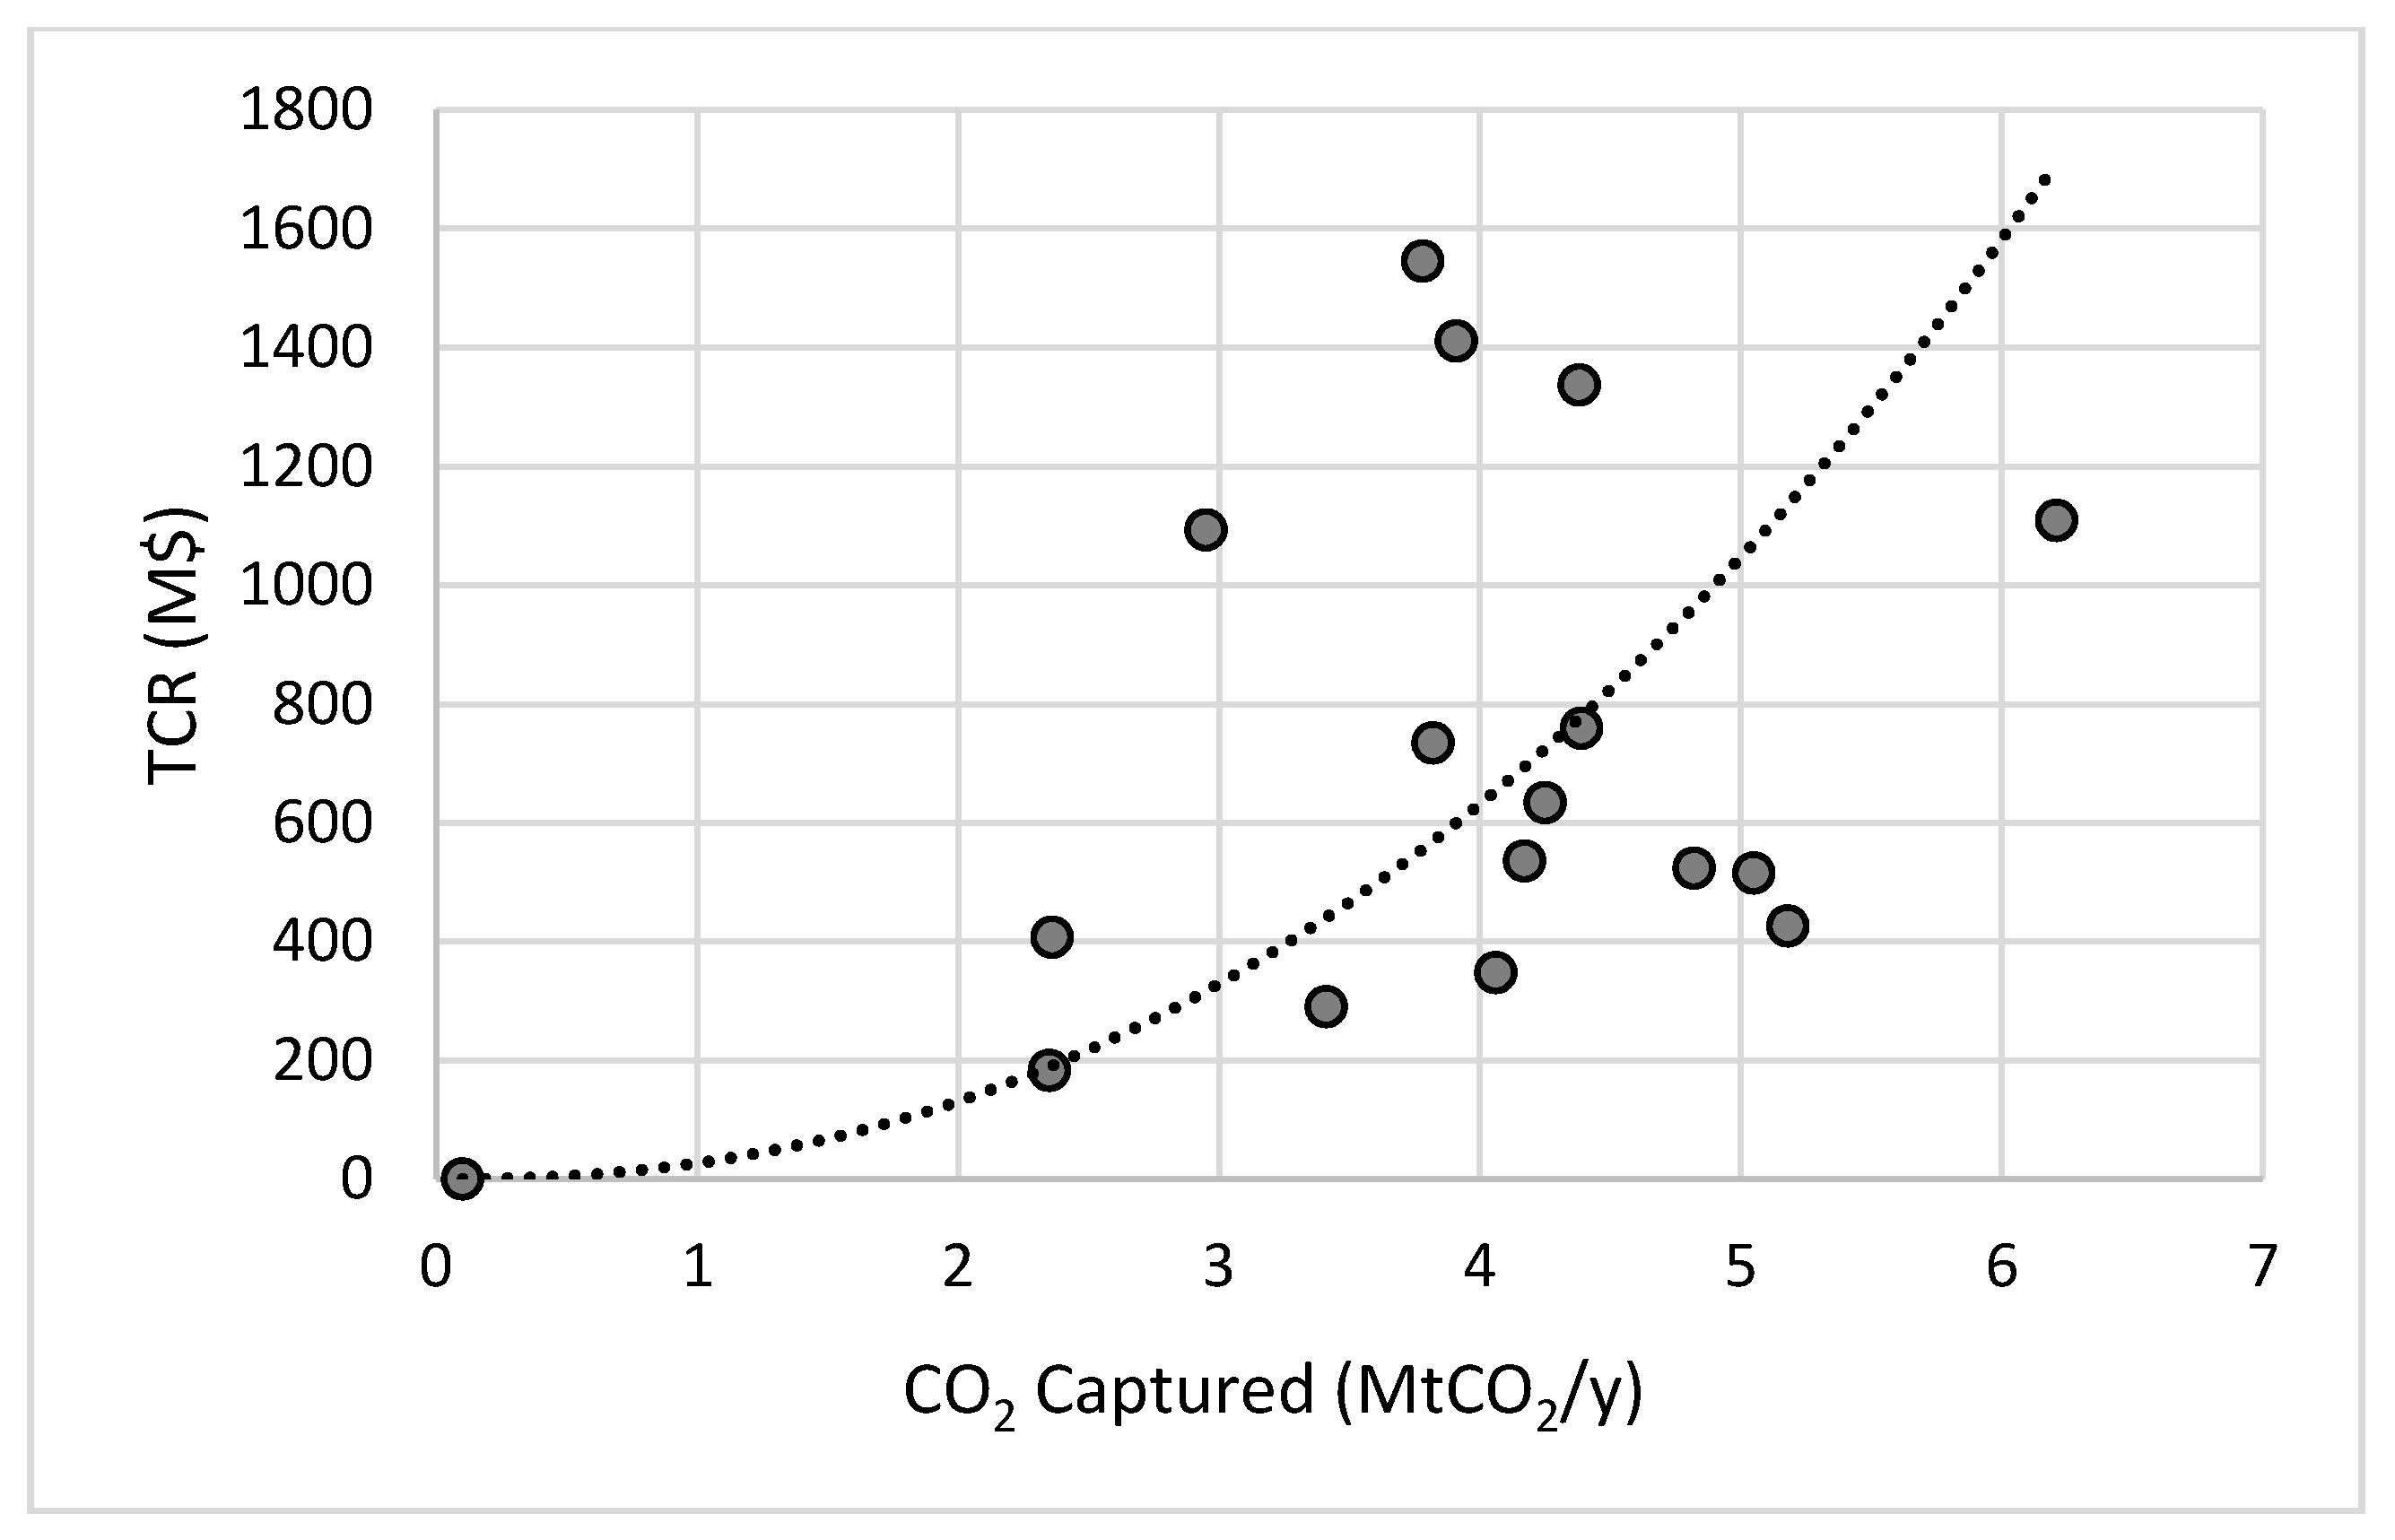
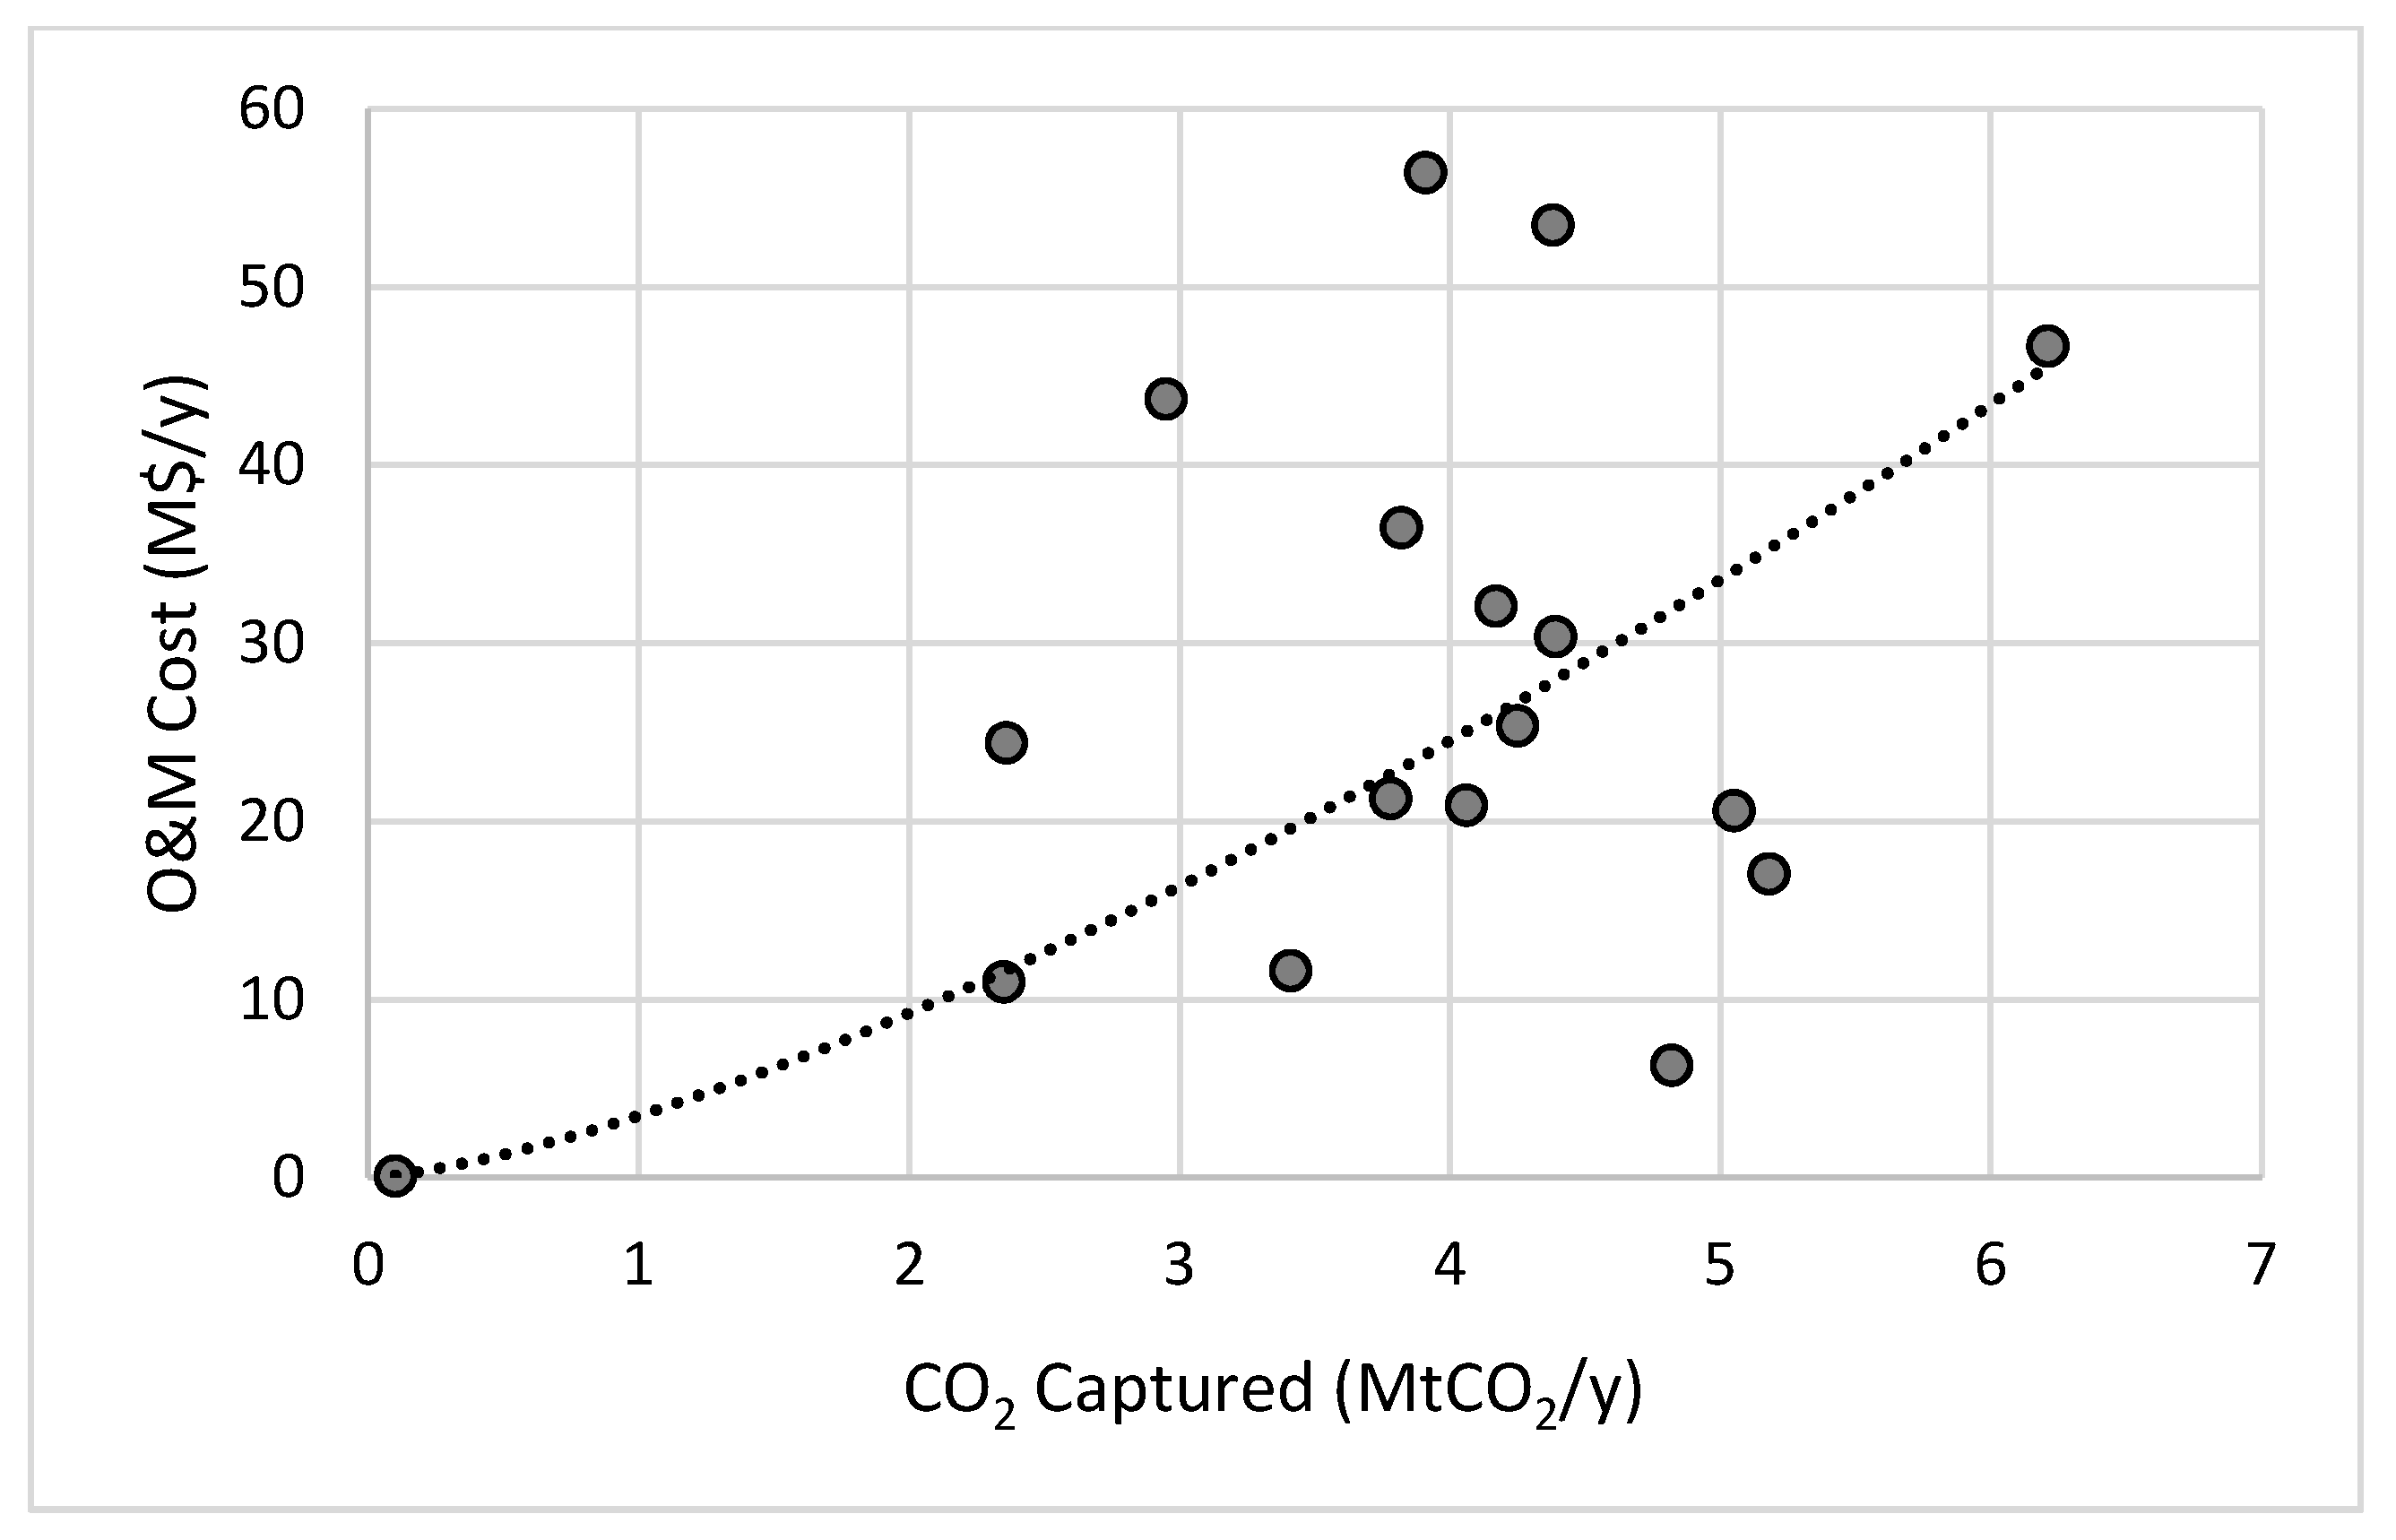
For physical absorption, the data points covered a decent range of flowrates between 0–6.4 Mt
CO2/yr and included data from various non-power related CO
2 sources like the metal industry, cement industry, chemical and petrochemical industry and only IGCC from power-related sources. The analysis showed a curve of the shape of
y = a
xb where a and b are constants calculated from regression (
Figure 3 and
Figure 4).
For the oxy-fuel combustion capture technology, there were fewer data points, still covering a decent range of flowrates between 0–6 Mt
CO2/yr. This data group includes data from sources that include combustion like SCPC, USCPC, CFB, PC&NGCC and chemical and petrochemical industry and cement industry. The power model that was proposed by the regression analysis is presented in
Figure 5 and
Figure 6.
3.2. Capture Costs Based on the Source Type
It was also decided to categorise the data points based on the type of the source and, for those sources who had an appropriate number of data points, specify the model that best described their profile.
3.2.1. Metal Industry
The different CO
2 sources of the metal industry, including blast furnace, top gas recycling blast furnace (TGRBF), smelting reduction iron and raw material production, were all grouped under the metal industry because there were not enough data to develop a model for each one individually. There were 20 points of data that covered a range of flowrates between 0–6.4 Mt
CO2/yr. Some data points are stacked, because the authors of the references cited, wanted to compare different capture technologies applied on the same CO
2 source. This data group includes various capture technologies like chemical absorption, physical absorption, inorganic porous membranes, physical adsorption, calcium looping and cryogenics. The power model that was proposed by the regression analysis is presented in
Figure 7 and
Figure 8.
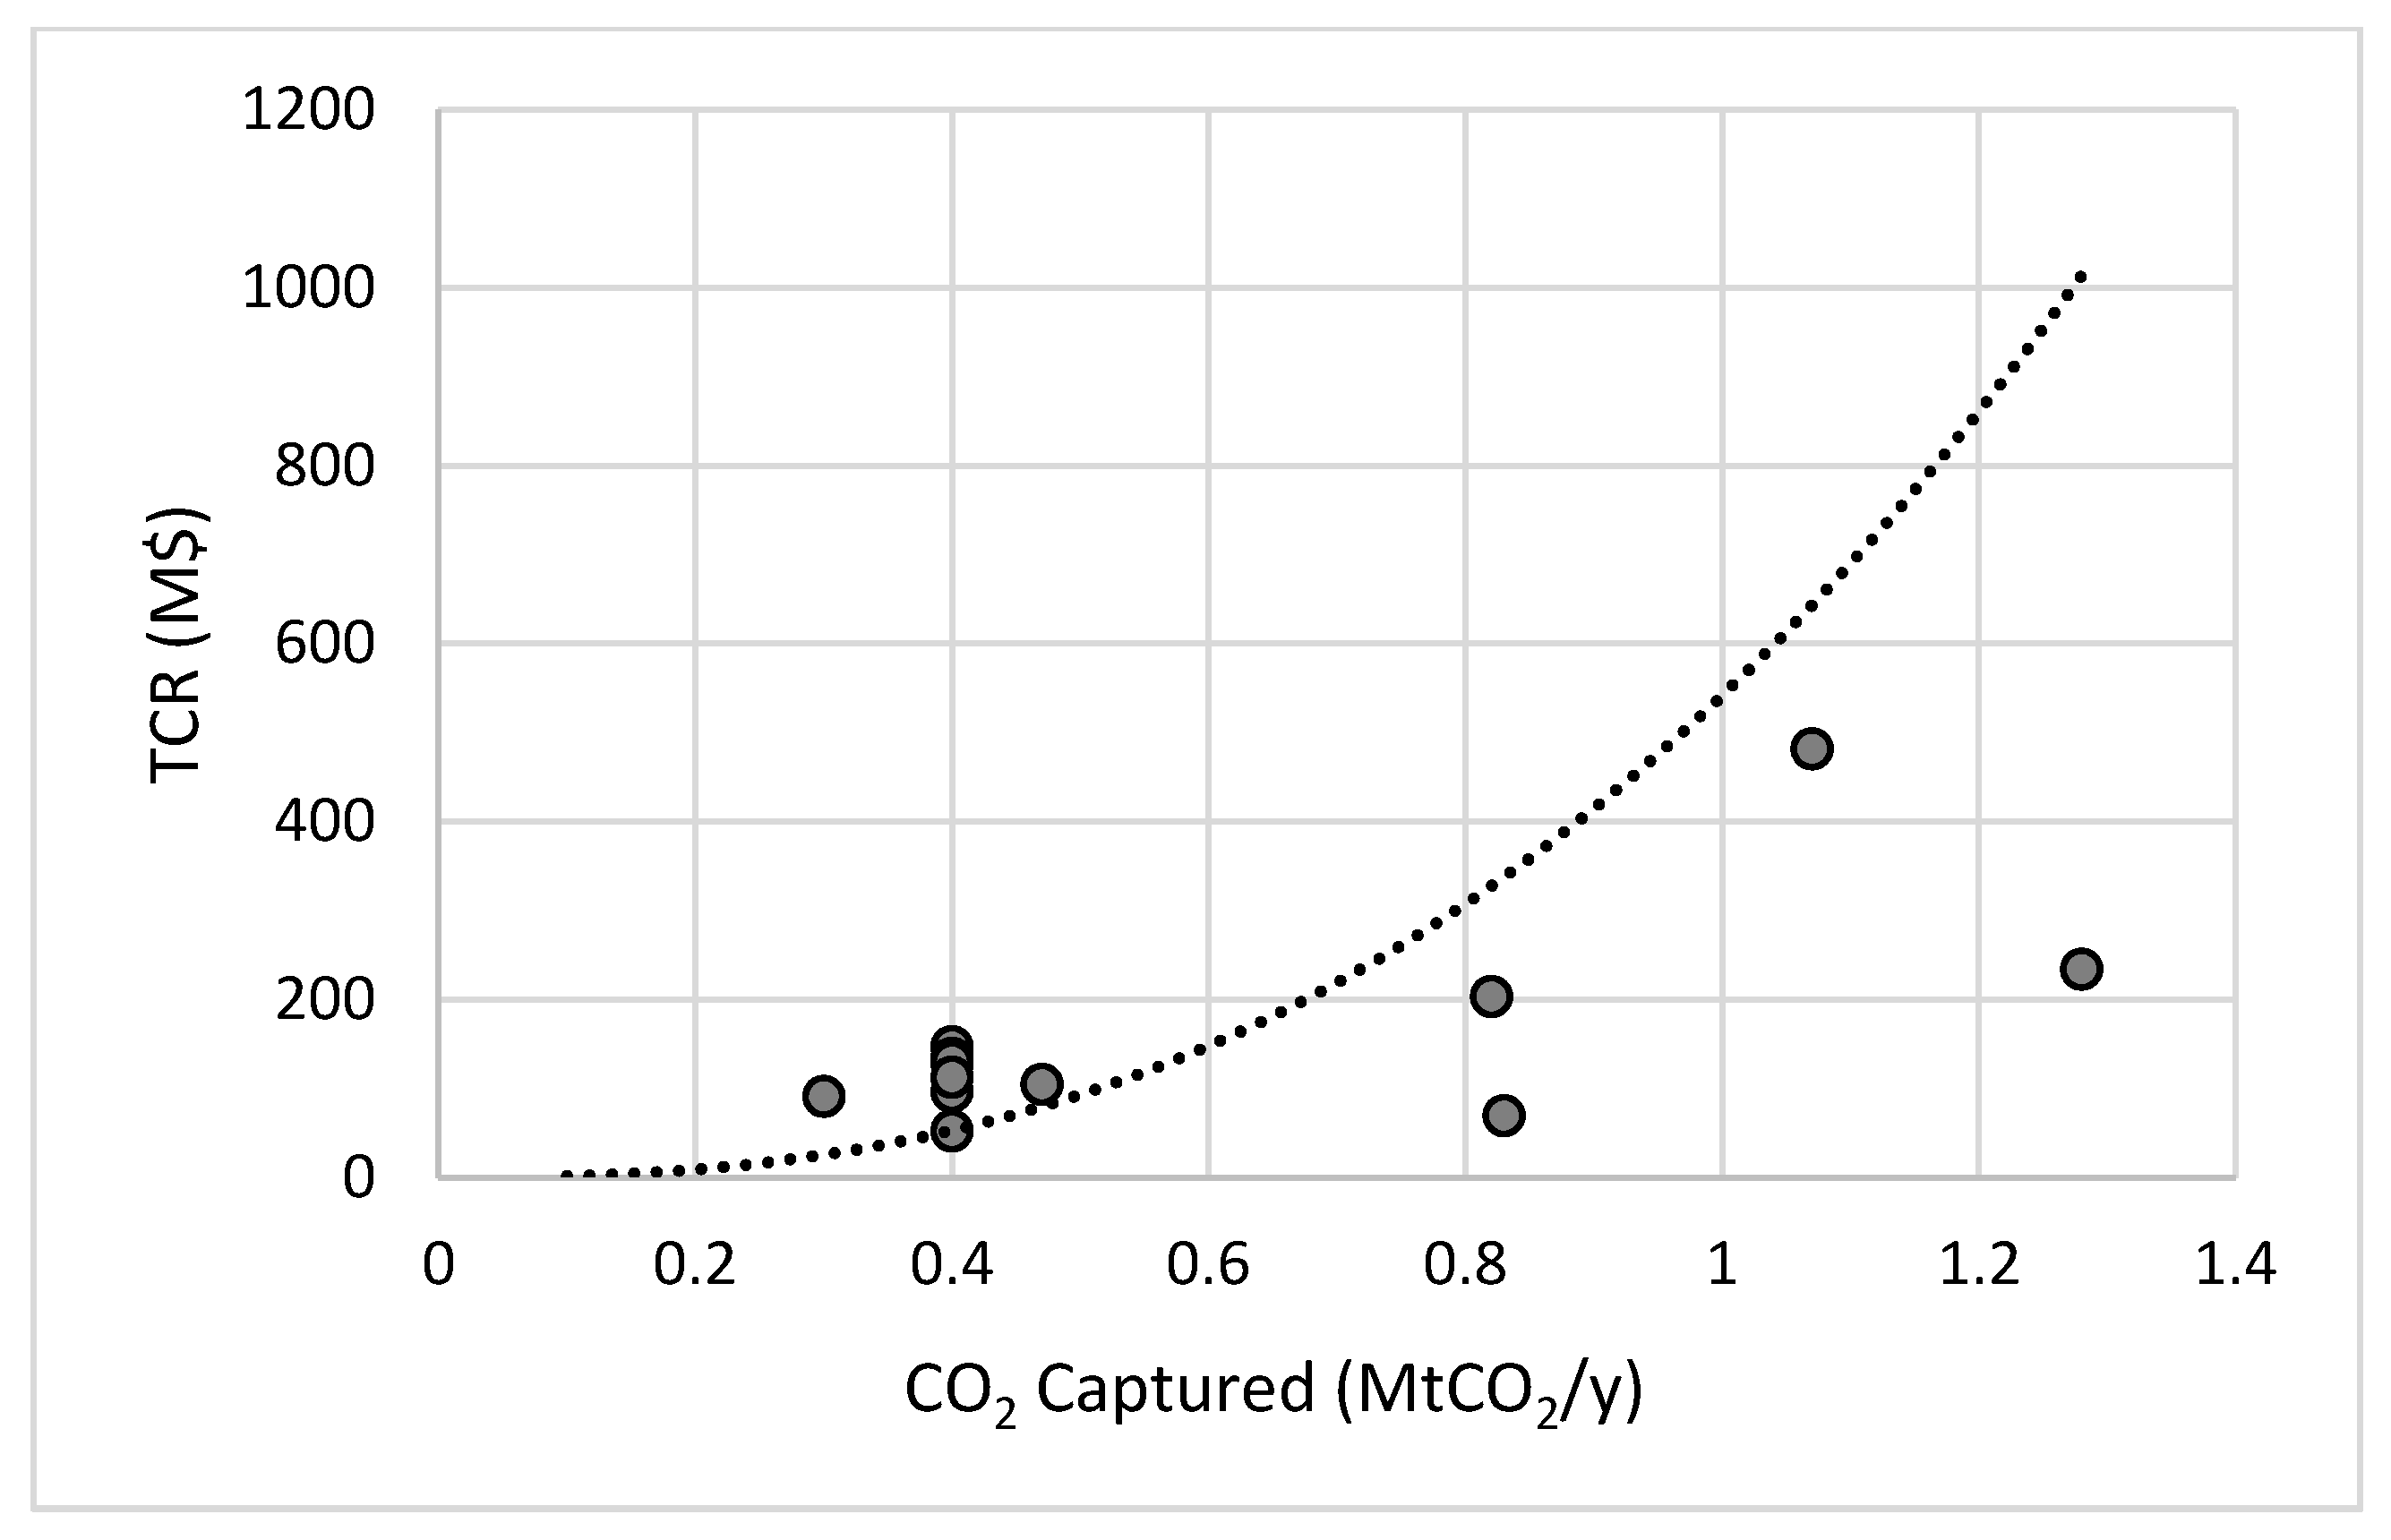
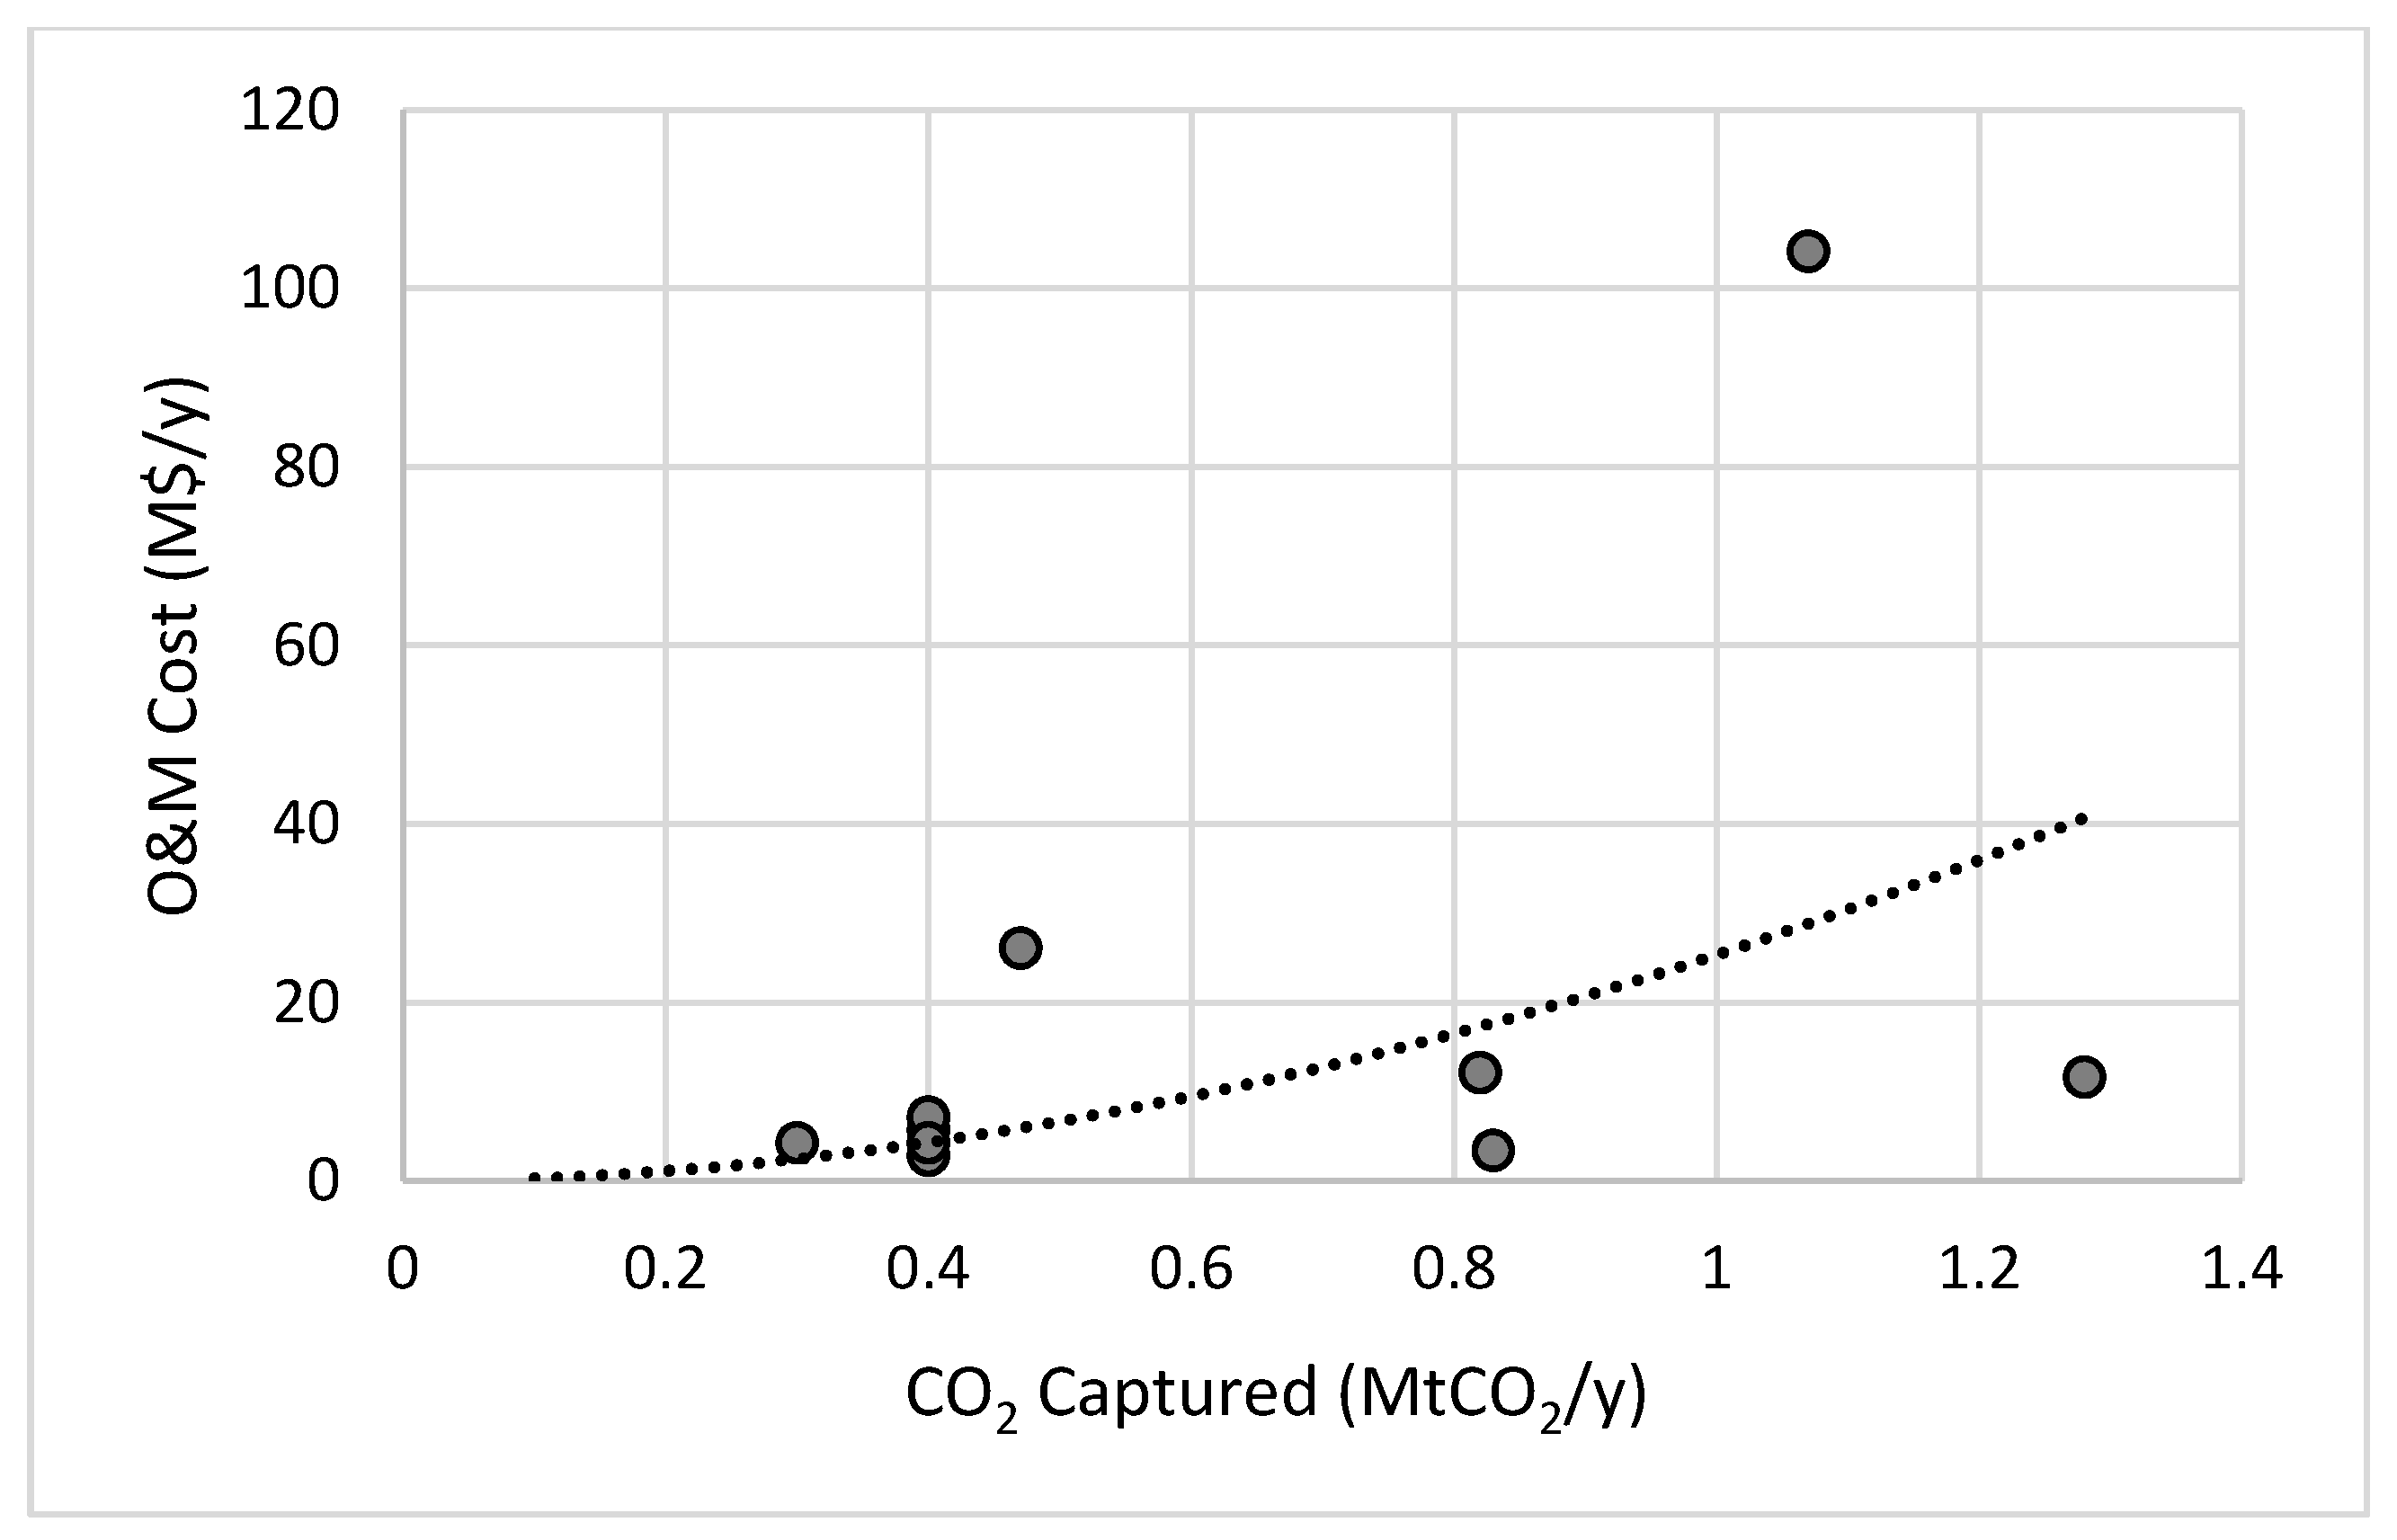
3.2.2. Cement Industry
For the cement industry, data from the pre-calciner and the entire cement plant were grouped together, because there were not enough data to develop a model for each one individually. There were 13 points of data that covered flowrates between 0–1.4 Mt
CO2/y although some data points are stacked. This data group includes various capture technologies like oxy-fuel combustion, chemical looping, chemical absorption, physical absorption and cryogenics. The power model that was proposed by the regression analysis is presented in
Figure 9 and
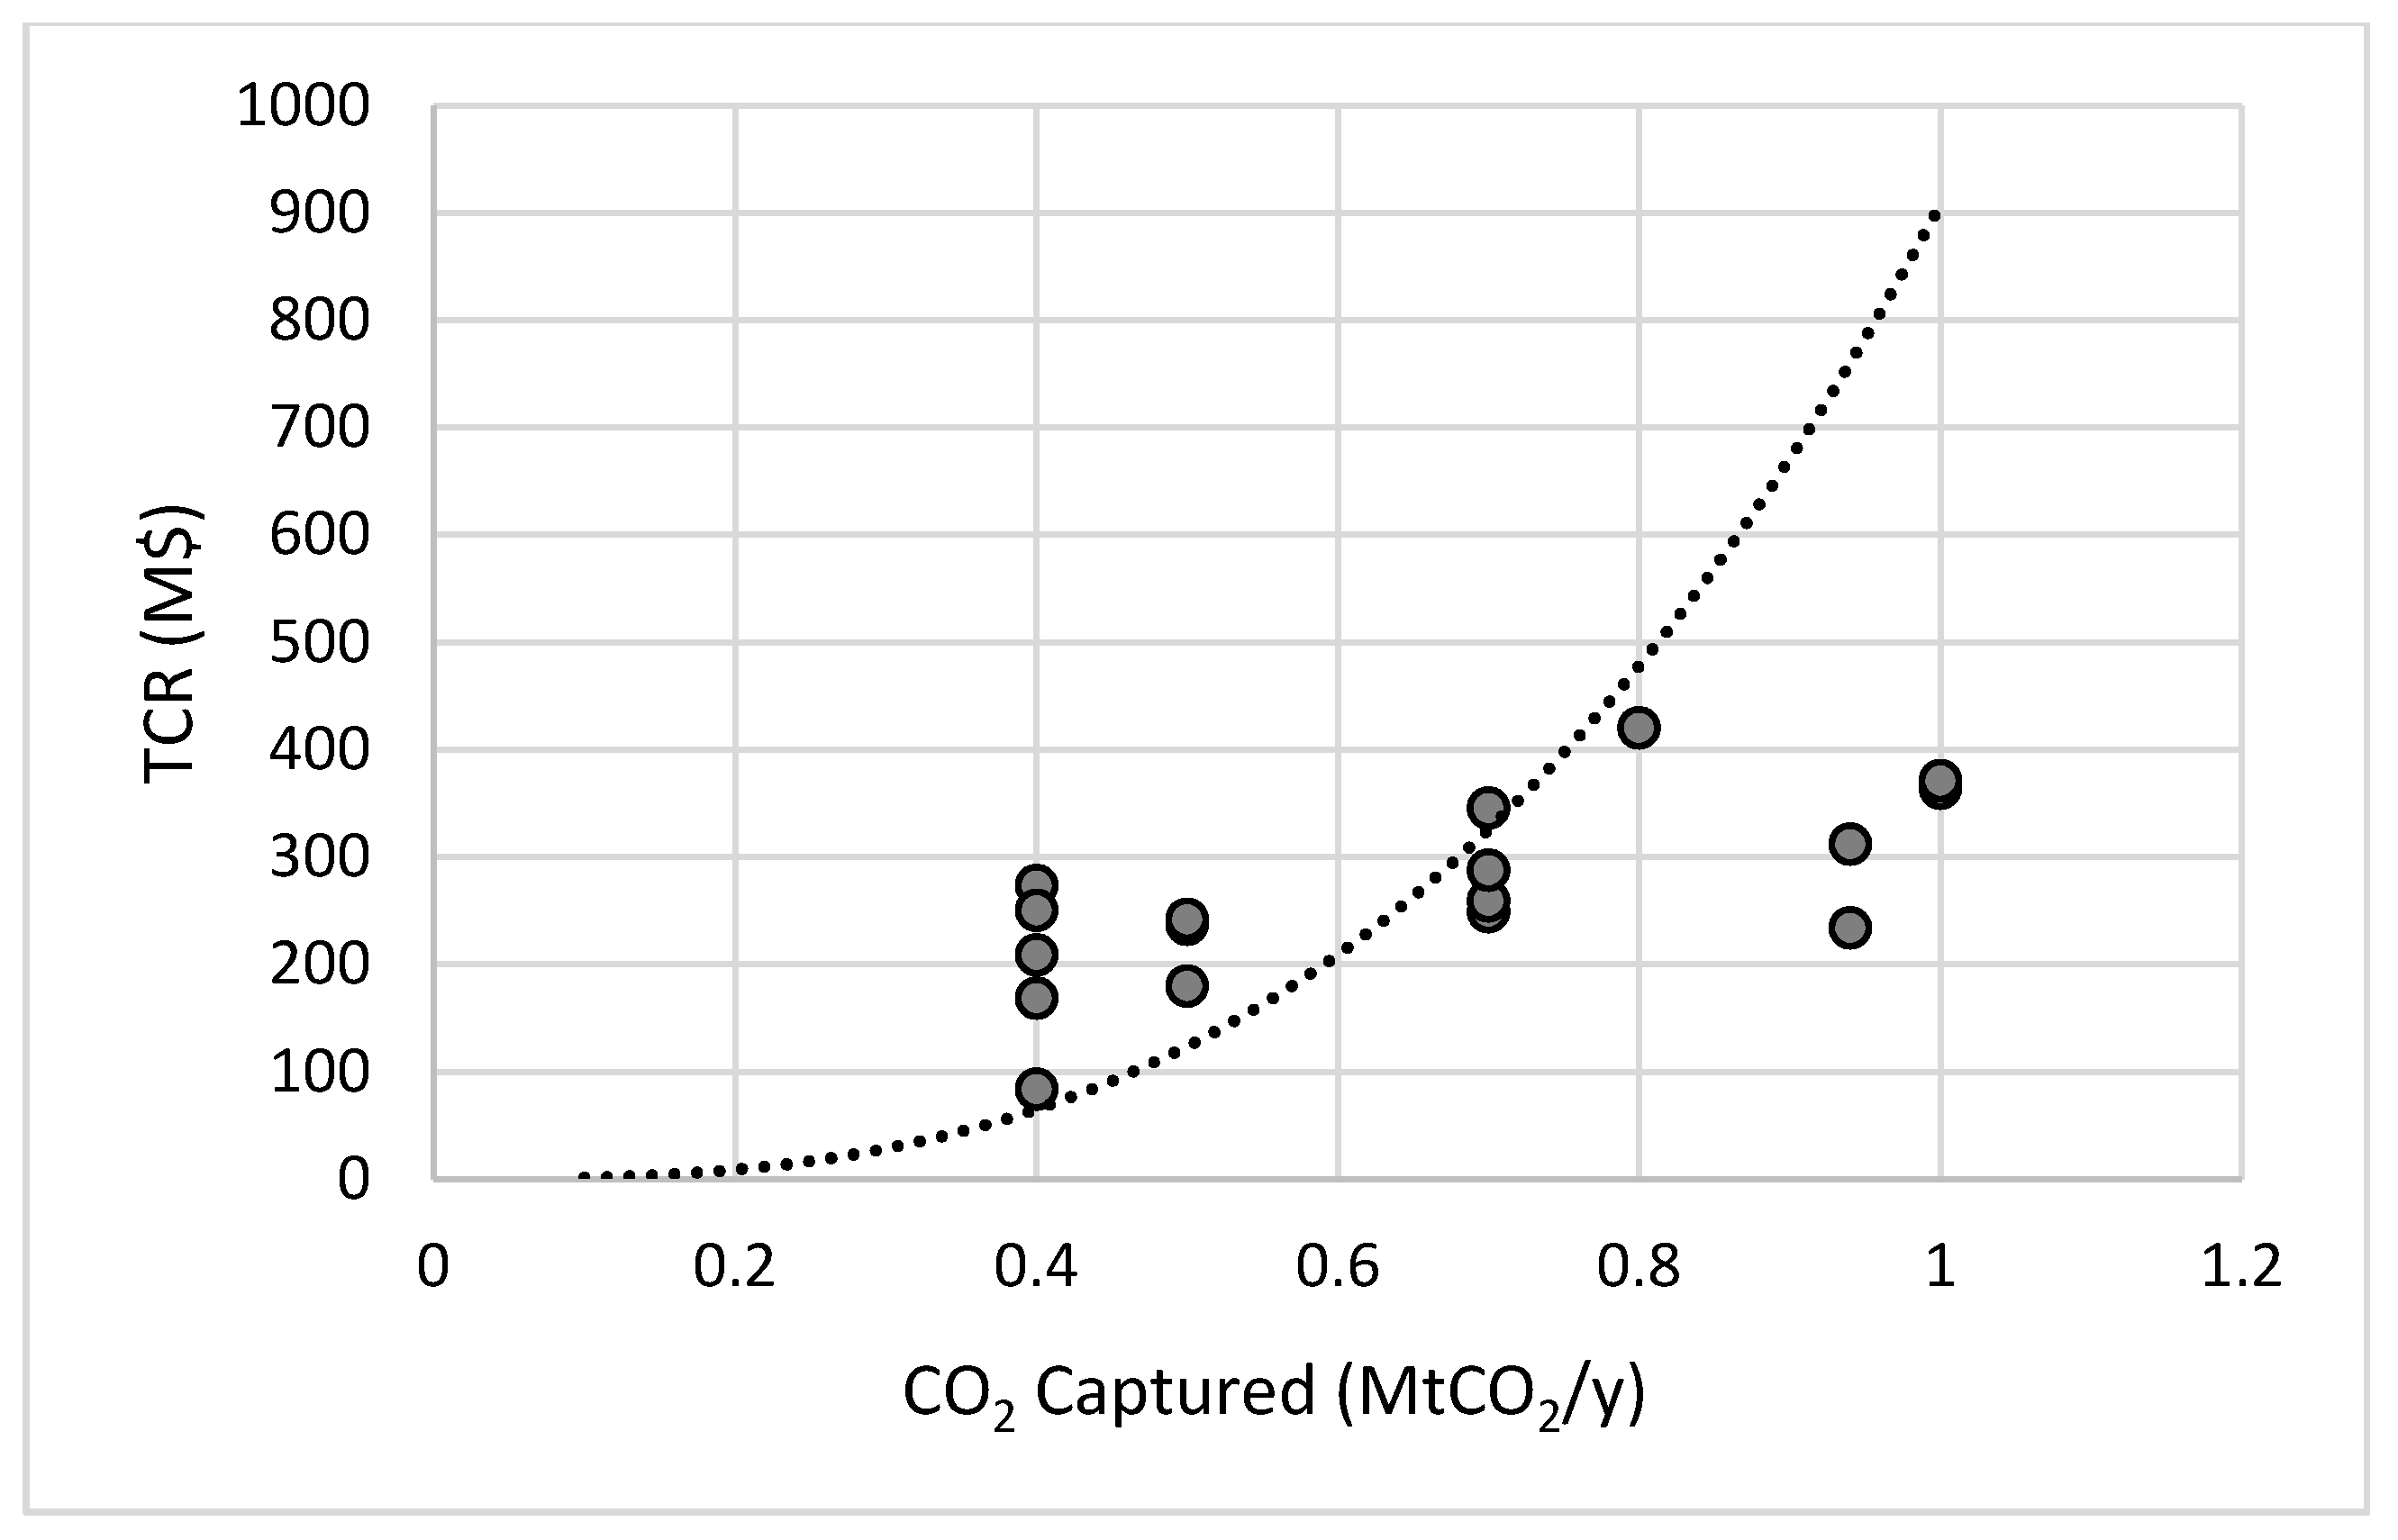
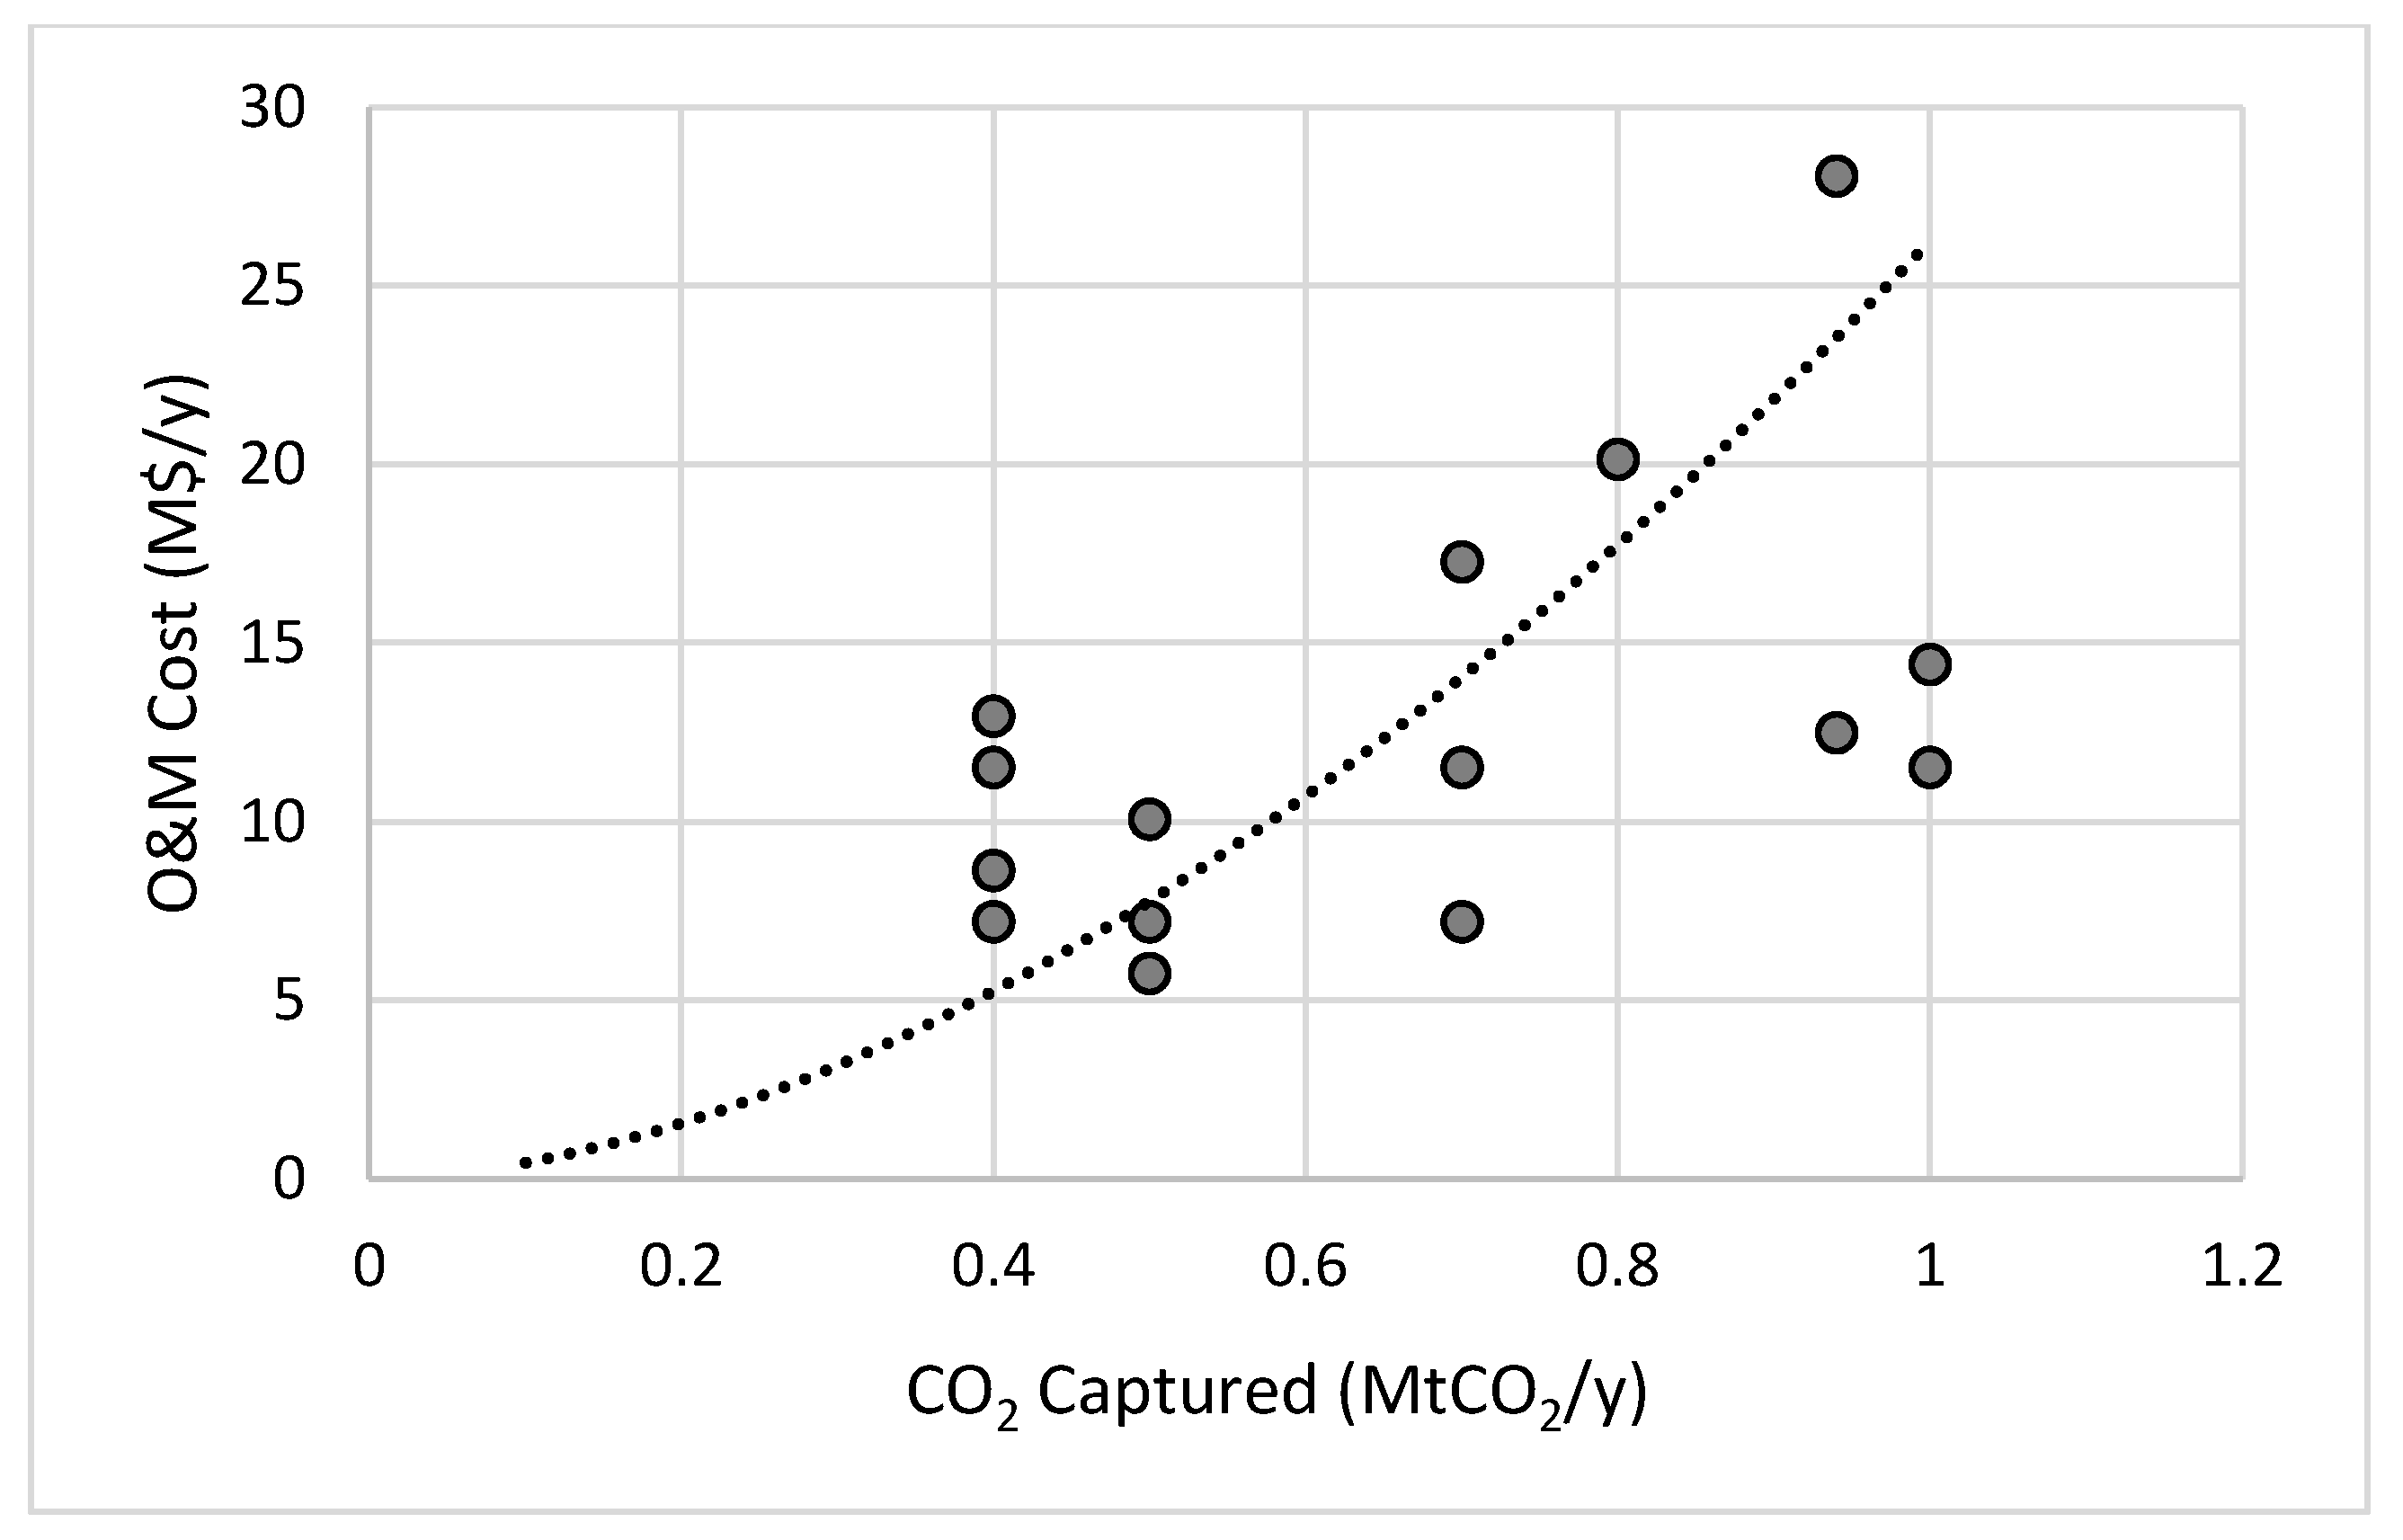
Figure 10 3.2.3. Fluid Catalytic Cracking (FCC)
There were 18 points of data for FCC that covered flowrates between 0–1 Mt
CO2/y. The range is relatively small, but representative of the size of the source, when compared to power related ones. The power model that was proposed by the regression analysis is presented in
Figure 11 and
Figure 12.
3.2.4. Power Related Sources
The power-related sources were the category with the most available data. There were 57 data points for IGCC, 65 for SCPC, 23 points of data for NGCC and 16 for USCPC. All of them covered a range greater than 4.5 Mt
CO2 (from 0–4.5 Mt
CO2 to 0–6.7 Mt
CO2). For IGCC, the data set includes only physical absorption capture technology, mainly (selexol), whereas for SCPC includes chemical absorption, oxy-fuel combustion and gas separation membranes capture technologies. For NGCC the data set include only chemical absorption (mostly MEA) and for USCPC it combines chemical absorption and oxy-fuel combustion capture technologies. The power model that was proposed by the regression analysis is presented in
Figure 13,
Figure 14,
Figure 15,
Figure 16,
Figure 17,
Figure 18,
Figure 19 and
Figure 20.
3.3. Model Validation
The regression analysis in all cases was forced to go through (0,0) because the cost to capture zero amount of CO2 is zero. Since some of the models are not valid for (0,0), the data point (0.1, 0.1) was used instead. The model that best fitted the data in all cases was a power model, y = axb, where a and b are constants calculated from regression. Further analysis was carried out to the obtained model to determine its statistical characteristics like R2 value and the p-value. The R2 value which indicates the accuracy of the model is high in all cases with the lowest being 0.415 and the highest 0.908 and shows that most of the models would produce accurate predictions. The p-value, which signifies the statistical significance of the model, is significantly small in all cases and allows to demonstrate that the model is statistically significant by rejecting the null hypothesis.
The last characteristic “trend” indicated if the model follows economies of scale or reverse economies of scale. Economies of scale is a term that relates the cost of production to the amount produced. If economies of scale are followed, then a product would cost less if the production was increased. However, economies of scale are only observed up to a certain point. When that point is passed, reverse economies of scale describe the process. In the carbon capture case, if the amount of CO
2 captured is doubled and the cost less than doubles, then economies of scale are observed. In any other case, reverse economies of scale are followed. All data are summarised in
Table 2 and
Table 3.
4. Discussion
All models have been analysed for the type of economies they follow in the long term, by observing the effect on costs when the amount of CO
2 captured is doubled. If costs exactly double, then a linear relationship is observed, if the costs are more than double then reverse economies of scale are observed and if the costs are less than double then economies of scale are observed [
33]. All models show to follow reverse economies of scale except for the models of chemical absorption and physical absorption, where economies of scale are observed. This is sensible because, when more CO
2 needs to be captured, then bigger capture equipment would be required to accommodate that flow. On first thought, this would justify only the reverse economies of scale for capital costs for the larger equipment and larger quantities of solvents, but it also justifies the O&M cost models following reverse economies of scale too because more energy would be required to regenerate the additional amount of solvent that is now required.
The required data used for the development of the models introduced some limitations to the models in the sense that the data used were gathered from various sources and standardised to process and use them. Capital costs were reported in different currencies and sometimes these were not expressed using the same metric. The reported capital costs did not always include the same cost components. Additionally, CO2 compression is most of the time, but not always, included. Costs were reported in various currencies and base years. O&M costs were not always reported in the amount of money per year and had to be converted using assumptions. In other cases, they were not directly reported but instead reported as estimates using percentages of capital cost. The annual amount of CO2 captured was not always reported and sometimes had to be estimated from plant capacity and annual working hours.
Nevertheless, the developed models are valid equations that only require one parameter (the annual amount of CO2 to be captured) to estimate the capital cost of capture and the annual O&M cost of capture. In that sense, they can be used by industries, to estimate the total cost of carbon capture plants, having in mind the limitations. In terms of data validation, the models have been applied in real industrial cases as part of a pre-feasibility assessment of a potential carbon capture investment. The major observations from the application are that the models might not provide an accurate estimate in the boundary regions. Moreover, in some cases/categories the sources analysed have varying purities, thus requiring a different level of purification before being captured, which affects the overall capture costs, and thus the accuracy of the models.
Although the extracted data differed slightly and were standardised to allow for the development of the models, the models can provide robust, accurate estimations, with statistical significance. This allows for the cost estimation for any CO2 source or any one of the most widely used capture technologies.
Author Contributions
Conceptualization, A.A.-D. and T.P.; methodology, T.P.; software, T.P.; validation, A.A.-D. and T.P.; formal analysis, T.P.; investigation, T.P.; resources, T.P.; data curation, T.P.; writing—original draft preparation, T.P.; writing—review and editing, A.A.-D.; visualization, A.A.-D. and T.P.; supervision, A.A.-D. All authors have read and agreed to the published version of the manuscript.
Funding
This research received no external funding.
Conflicts of Interest
The authors declare no conflict of interest.
References
- Budinis, S.; Krevor, S.; Mac Dowell, N.; Brandon, N.; Hawkes, A. An assessment of CCS costs, barriers and potential. Energy Strategy Rev. 2018, 22, 61–81. [Google Scholar] [CrossRef]
- Rubin, E.S.; Davison, J.E.; Herzog, J.H. The cost of CO2 capture and storage. Int. J. Greenh. Gas Control 2015, 40, 378–400. [Google Scholar] [CrossRef]
- Wu, N.; Parsons, J.E.; Polenske, K.R. The impact of future carbon prices on CCS investment for power generation in China. Energy Policy 2013, 54, 160–172. [Google Scholar] [CrossRef]
- Xing, Y.; Ping, Z.; Xian, Z.; Lei, Z. Business model design for the carbon capture utilisation and storage (CCUS) project in China. Energy Policy 2018, 121, 519–533. [Google Scholar]
- Spigarelli, B.P.; Kawatra, K.S. Opportunities and challenges in carbon dioxide capture. J. CO2 Util. 2013, 1, 69–87. [Google Scholar] [CrossRef]
- Wang, M.; Lawal, A.; Stephenson, P.; Sidders, J.; Ramshaw, C. Post-combustion CO2 capture with chemical absorption: A state of the art review. Chem. Eng. Res. Des. 2011, 89, 1609–1624. [Google Scholar] [CrossRef] [Green Version]
- Rubin, E.S.; Short, C.; Booras, G.; Davison, J.; Ekstrom, C.; Matuszewski, M.; McCoy, S. A proposed methodology for CO2 capture and storage cost estimates. Int. J. Greenh. Gas. Control 2013, 17, 488–503. [Google Scholar] [CrossRef]
- Hu, B.; Zhai, H. The cost of carbon capture and storage for coal-fired power plants in China. Int. J. Greenh. Gas. Control 2017, 65, 23–31. [Google Scholar] [CrossRef]
- Rubin, E.S.; Booras, G.; Davison, J.; Ekstrom, C.; Matuszewski, M.; McCoy, S.; Short, C. Towards a Common Method of Cost Estimation for CO2 Capture and Storage at Fossil Fuel Power Plants; Global CCS Institute: Canberra, Australia, 2013. [Google Scholar]
- Rubin, E.S. Understanding the pitfalls of CCS cost estimates. Int J. Greenh. Gas. Control 2012, 10, 181–190. [Google Scholar] [CrossRef]
- Element Energy. Demonstrating CO2 Capture in the UK Cement, Chemical, Iron and Steel and Oil Refining Sectors by 2012, A Techno-Economic Study; Element Energy: Cambridge, UK, 2014. [Google Scholar]
- Finkerath, M. Cost and Performance of Carbon Dioxide Capture from Power Generation; IEA: Paris, France, 2011. [Google Scholar]
- SNC Lavalin. Impact of Impurities on CO2 Capture, Transport and Storage; IEA: Paris, France, 2004. [Google Scholar]
- Kuramochi, T.; Ramirez, A.; Turkenburg, W.; Faaij, A. Comparative assessment of CO2 capture technologies for carbon-intensive industrial processes. Prog. Energy Combust. 2012, 38, 87–112. [Google Scholar] [CrossRef]
- Davison, J.; Mancuso, L.; Ferrari, N. Costs of CO2 capture technologies in coal-fired power plants. Energy Proced. 2014, 63, 7598–7607. [Google Scholar] [CrossRef] [Green Version]
- Porter, R.T.J.; Fairweather, M.; Kolster, C.; Mac Dowell, N.; Shah, N.; Woolley, R.M. Cost and performance of some carbon capture technology options for producing different quality CO2 product streams. Int. J. Greenh. Gas. Control 2017, 57, 185–195. [Google Scholar] [CrossRef]
- Kuramochi, T.; Ramirez, A.; Turkenburg, W.; Faaij, A. Techno-economic prospects for CO2 capture from distributed energy systems. Renew. Sus Energy Rev. 2013, 19, 328–347. [Google Scholar] [CrossRef]
- David, J.; Herzog, H. The Cost of Carbon Capture; MIT: Cambridge, MA, USA, 2011. [Google Scholar]
- Adams, T.A.; Hoseinzade, L.; Bhaswanth Madabhushi, P.; Okeke, I.J. Comparison of CO2 capture approaches for fossil-based power generation: Review and meta-study. Processes 2017, 5, 44. [Google Scholar] [CrossRef] [Green Version]
- ZEP. The Costs of CO2 Capture: Post-Demonstration CCS in the EU; ZEP: Brussels, Belgium, 2011. [Google Scholar]
- IEA GHG. CO2 Capture in Cement Industry; IEA Greenhouse Gas R&D Program: Cheltenham, UK, 2008. [Google Scholar]
- NETL. Carbon Dioxide Capture Handbook; National Energy Technology Laboratory: Albany, OR, USA, 2015.
- Irlam, L. Global Costs of Carbon Capture and Storage; Global CCS Institute: Canberra, Australia, 2017. [Google Scholar]
- Hendriks, G.; Crijns-Graus, W.H.J.; van Bergen, F. Global Carbon Dioxide Storage Potential and Costs; ECOFYS: Utrecht, The Netherlands, 2004. [Google Scholar]
- Rotterdam Climate Initiative. CO2 Capture, Transport and Storage in Rotterdam; DCMR: Schiedam, The Netherlands, 2009.
- Barker, D.J.; Turner, S.A.; Napier-Moore, P.A.; Clark, M.; Davison, J.E. CO2 Capture in the cement industry. Energy Procedia 2009, 1, 87–94. [Google Scholar] [CrossRef] [Green Version]
- EPRI. Program on Technology Innovation: Integrated Generation Technology Options; EPRI: Washington, DC, USA, 2011. [Google Scholar]
- IEA. CO2 Capture and Storage; IEA: Paris, France, 2010. [Google Scholar]
- NETL. Current and Future Technologies for Natural Gas Combined Cycle (NGCC) Power Plants; NETL: Albany, OR, USA, 2013.
- IPCC. Carbon Dioxide Capture and Storage: Capture of CO2; Cambridge University Press: Cambridge, UK; New York, NY, USA, 2005. [Google Scholar]
- Turner, H.C.; Lauer, J.A.; Tran, B.X.; Teerawattananon, Y.; Jit, M. Adjusting for inflation and currency changes within health economic studies. Value Health 2019, 22, 1026–1032. [Google Scholar] [CrossRef] [PubMed] [Green Version]
- Consumer Price Index (2010=100) United States. Available online: https://data.worldbank.org/indicator/FP.CPI.TOTL?end=2018&locations=US&start=1995&view=chart (accessed on 25 April 2020).
- Knoope, M.M.J. Costs, Safety and Uncertainties of CO2 Infrastructure Development. Ph.D. Thesis, University of Utrecht, Utrecht, The Netherlands, 4 September 2015. [Google Scholar]
Figure 1.
Estimation of TCR based on the amount of CO2 captured for chemical absorption.
Figure 1.
Estimation of TCR based on the amount of CO2 captured for chemical absorption.
Figure 2.
Estimation of O&M cost based on the amount of CO2 captured for chemical absorption.
Figure 2.
Estimation of O&M cost based on the amount of CO2 captured for chemical absorption.
Figure 3.
Estimation of TCR based on the amount of CO2 captured for physical absorption.
Figure 3.
Estimation of TCR based on the amount of CO2 captured for physical absorption.
Figure 4.
Estimation of O&M cost based on the amount of CO2 captured for physical absorption.
Figure 4.
Estimation of O&M cost based on the amount of CO2 captured for physical absorption.
Figure 5.
Estimation of TCR based on the amount of CO2 captured for oxy-fuel combustion.
Figure 5.
Estimation of TCR based on the amount of CO2 captured for oxy-fuel combustion.
Figure 6.
Estimation of O&M cost based on the amount of CO2 captured for oxy-fuel combustion.
Figure 6.
Estimation of O&M cost based on the amount of CO2 captured for oxy-fuel combustion.
Figure 7.
Estimation of TCR based on the amount of CO2 captured for metal industry.
Figure 7.
Estimation of TCR based on the amount of CO2 captured for metal industry.
Figure 8.
Estimation of O&M cost based on the amount of CO2 captured for the metal industry.
Figure 8.
Estimation of O&M cost based on the amount of CO2 captured for the metal industry.
Figure 9.
Estimation of TCR based on the amount of CO2 captured for the cement industry.
Figure 9.
Estimation of TCR based on the amount of CO2 captured for the cement industry.
Figure 10.
Estimation of O&M cost based on the amount of CO2 captured for the cement industry.
Figure 10.
Estimation of O&M cost based on the amount of CO2 captured for the cement industry.
Figure 11.
Estimation of TCR based on the amount of CO2 captured for FCC.
Figure 11.
Estimation of TCR based on the amount of CO2 captured for FCC.
Figure 12.
Estimation of O&M cost based on the amount of CO2 captured for FCC.
Figure 12.
Estimation of O&M cost based on the amount of CO2 captured for FCC.
Figure 13.
Estimation of TCR based on the amount of CO2 captured for IGCC.
Figure 13.
Estimation of TCR based on the amount of CO2 captured for IGCC.
Figure 14.
Estimation of O&M cost based on the amount of CO2 captured for IGCC.
Figure 14.
Estimation of O&M cost based on the amount of CO2 captured for IGCC.
Figure 15.
Estimation of TCR based on the amount of CO2 captured for SCPC.
Figure 15.
Estimation of TCR based on the amount of CO2 captured for SCPC.
Figure 16.
Estimation of O&M cost based on the amount of CO2 captured for SCPC.
Figure 16.
Estimation of O&M cost based on the amount of CO2 captured for SCPC.
Figure 17.
Estimation of TCR based on the amount of CO2 captured for NGCC.
Figure 17.
Estimation of TCR based on the amount of CO2 captured for NGCC.
Figure 18.
Estimation of O&M cost based on the amount of CO2 captured for NGCC.
Figure 18.
Estimation of O&M cost based on the amount of CO2 captured for NGCC.
Figure 19.
Estimation of TCR based on the amount of CO2 captured for USCPC.
Figure 19.
Estimation of TCR based on the amount of CO2 captured for USCPC.
Figure 20.
Estimation of O&M cost based on the amount of CO2 captured for USCPC.
Figure 20.
Estimation of O&M cost based on the amount of CO2 captured for USCPC.
Table 1.
Summary of Literature Sources Characteristics.
Table 1.
Summary of Literature Sources Characteristics.
| Parameters | [10] | [16] | [2] | [17] | [11] | [18] | [19] | [1] | [12] | [20] | [21] |
| Source type | NPR | PR | PR | PR | Both | PR | PR | Both | PR | PR | NPR |
| Separation principle | Y | Y | Y | Y | Y | Y | Y | N | Y | Y | N |
| Compression | Y | Y | Y | Y | Y | Y | N | N | Y | Y | Y |
| Amount of CO2 captured | E | Y | Y | N | Y | E | N | N | E | Y | Y |
| Currency | Y | Y | Y | Y | Y | Y | Y | Y | Y | Y | Y |
| Year | Y | Y | Y | Y | Y | Y | Y | Y | Y | Y | N |
| Constant/Current | Co | Co | Co | Co | Co | N | N | Co | N | Co | Cu |
| Project lifetime | Y | Y | N | Y | Y | N | N | N | Y | Y | Y |
| Annual Working Hours | Y | Y | Y | Y | Y | Y | N | N | A | Y | Y |
| Reference Plant Capacity | N | Y | Y | Y | N | N | N | N | Y | Y | N |
| Reference Capital cost | N | N | Y | Y | N | Y | N | N | Y | Y | Y |
| Reference O&M cost | N | N | N | Y | N | Y | N | N | Y | Y | Y |
| With Capture Plant Capacity | Y | Y | Y | Y | N | N | Y | N | Y | Y | N |
| With Capture Capital cost | Y | Y | Y | Y | Y | Y | N | Y | Y | Y | Y |
| With Capture O&M cost | Y | Y | N | Y | Y | Y | N | N | Y | Y | Y |
| Cost of CO2 captured | N | N | Y | N | N | N | N | N | N | N | N |
| Cost of CO2 avoided | N | Y | Y | N | N | N | N | N | Y | Y | N |
| LCOE | N | Y | Y | N | N | Y | Y | N | Y | Y | N |
| Parameters | [22] | [23] | [24] | [25] | [15] | [26] | [13] | [27] | [28] | [29] | [30] |
| Source type | PR | PR | PR | PR | PR | NPR | PR | PR | Both | PR | Both |
| Separation principle | Y | Y | N | N | Y | Y | Y | N | Y | N | Y |
| Compression | Y | N | N | Y | Y | Y | Y | Y | N | | Y |
| Amount of CO2 captured | E | Y | N | Y | Y | Y | Y | Y | N | | Y |
| Currency | Y | Y | Y | Y | Y | Y | Y | Y | Y | | Y |
| Year | Y | Y | N | Y | Y | N | Y | Y | Y | | Y |
| Constant/Current | Cu | Y | N | Co | Co | Co | N | Cu | N | | Co |
| Project lifetime | N | Y | Y | N | Y | Y | Y | Y | N | | N |
| Annual Working Hours | A | N | Y | N | N | N | N | N | N | | N |
| Reference Plant Capacity | Y | Y | N | N | Y | N | Y | N | N | Y | Y |
| Reference Capital cost | Y | Y | N | N | Y | Y | Y | Y | N | Y | Y |
| Reference O&M cost | Y | Y | N | N | A | Y | N | N | N | N | N |
| With Capture Plant Capacity | Y | Y | N | Y | Y | Y | Y | Y | Y | Y | Y |
| With Capture Capital cost | Y | Y | Y | Y | Y | Y | Y | Y | N | Y | Y |
| With Capture O&M cost | Y | Y | N | Y | A | Y | N | N | N | N | N |
| Cost of CO2 captured | Y | N | N | N | N | Y | Y | N | Y | Y | Y |
| Cost of CO2 avoided | Y | N | N | N | Y | Y | Y | N | Y | Y | Y |
| LCOE | Y | N | N | N | Y | N | N | N | N | Y | Y |
Table 2.
Statistical analysis of TCR and O&M costs models per separation principle.
Table 2.
Statistical analysis of TCR and O&M costs models per separation principle.
| Type | Cost | Model | R2 | p-Value | Trend |
|---|
| Chemical Absorption | TCR | y = 270.3x0.668 | 0.531 | <0.001 | Less than doubles |
| | O&M | y = 14.089x0.690 | 0.669 | <0.001 | Less than doubles |
| Physical Absorption | TCR | y = 206.2x0.731 | 0.415 | <0.001 | Less than doubles |
| | O&M | y = 10.698x0.781 | 0.584 | <0.001 | Less than doubles |
| Oxyfuel Combustion | TCR | y = 101.9x1.533 | 0.652 | <0.001 | More than doubles |
| | O&M | y = 9.503x1.014 | 0.650 | <0.001 | More than doubles |
Table 3.
Statistical analysis of TCR and O&M costs models per source type.
Table 3.
Statistical analysis of TCR and O&M costs models per source type.
| Type | Cost | Model | R2 | p-Value | Trend |
|---|
| Metal Industry | TCR | y = 61.629x1.550 | 0.777 | <0.001 | More than doubles |
| | O&M | y = 5.464x1.151 | 0.817 | <0.001 | More than doubles |
| Cement Industry | TCR | y = 543.5x2.538 | 0.637 | <0.001 | More than doubles |
| | O&M | y = 25.382x1.913 | 0.637 | <0.001 | More than doubles |
| FCC | TCR | y = 908.8x2.875 | 0.711 | <0.001 | More than doubles |
| | O&M | y = 26.265x1.754 | 0.668 | <0.001 | More than doubles |
| IGCC | TCR | y = 32.931x1.990 | 0.696 | <0.001 | More than doubles |
| | O&M | y = 3.889x1.412 | 0.557 | <0.001 | More than doubles |
| SCPC | TCR | y = 39.333x2.060 | 0.774 | <0.001 | More than doubles |
| | O&M | y = 5.152x1.475 | 0.745 | <0.001 | More than doubles |
| NGCC | TCR | y = 137.4x2.165 | 0.644 | <0.001 | More than doubles |
| | O&M | y = 9.276x1.419 | 0.517 | <0.001 | More than doubles |
| USCPC | TCR | y = 27.436x2.263 | 0.908 | <0.001 | More than doubles |
| | O&M | y = 3.488x1.407 | 0.800 | <0.001 | More than doubles |
| Publisher’s Note: MDPI stays neutral with regard to jurisdictional claims in published maps and institutional affiliations. |
© 2021 by the authors. Licensee MDPI, Basel, Switzerland. This article is an open access article distributed under the terms and conditions of the Creative Commons Attribution (CC BY) license (https://creativecommons.org/licenses/by/4.0/).


