1. Introduction
The global power sector faces a key challenge in the 21st century: achieving rapid emissions reductions despite strong demand growth [
1]. The target set at the Paris Climate Agreement [
2] is to limit the global average temperature increase to “well below 2 °C” by the end of the century. The models presented by the Intergovernmental Panel on Climate Change (IPCC) requires zero or even negative emissions from the power sector to comply with the 2 °C target [
3].
Several options are available to reduce CO
2 emissions depending on the source of origin, including energy efficiency, renewable energy, nuclear energy, fuel switching, and CO
2 capture and storage (CCS). Among these pathways, CCS is arguably the most promising for drastic emissions reduction for three main reasons: (1) CCS retrofits can achieve emissions reductions from plants that have already been built, (2) CCS can be applied to sectors other than electricity such as direct industrial emissions or clean fuels, and (3) CCS can achieve negative emissions through BECCS or direct air capture. Unfortunately, the deployment of CCS is lagging far behind the trajectory required by the Paris Climate Accord [
4], mostly because of economic and political challenges. Capturing and storing CO
2 will always be more expensive than simply emitting it to the atmosphere, and, to date, there have been limited policy incentives for covering these added costs.
However, the added cost of CCS can be minimized through more advanced CO
2 capture processes. Lowering the energy demand for the CO
2 separation process presents one promising pathway towards lower operating and capital costs of CCS plants. In the case of power production from solid fuels, the integration of a chemical looping combustion (CLC) [
5,
6] unit in an integrated gasification combined cycle (IGCC) system offers a promising pathway to a lower energy penalty [
7]. In the IGCC system, the fuel is gasified and burned in a combined cycle gas turbine for power production. In general, the net electric efficiency of an IGCC power plant is around 47% without capture, whereas, if the conventional pre-combustion CO
2 capture is added, the efficiency drops as low as 36% [
8]. This substantial energy penalty presents the major obstacle to CCS deployment.
CLC offers a way to substantially reduce this energy penalty, leading to considerable reductions in the CO
2 avoidance cost [
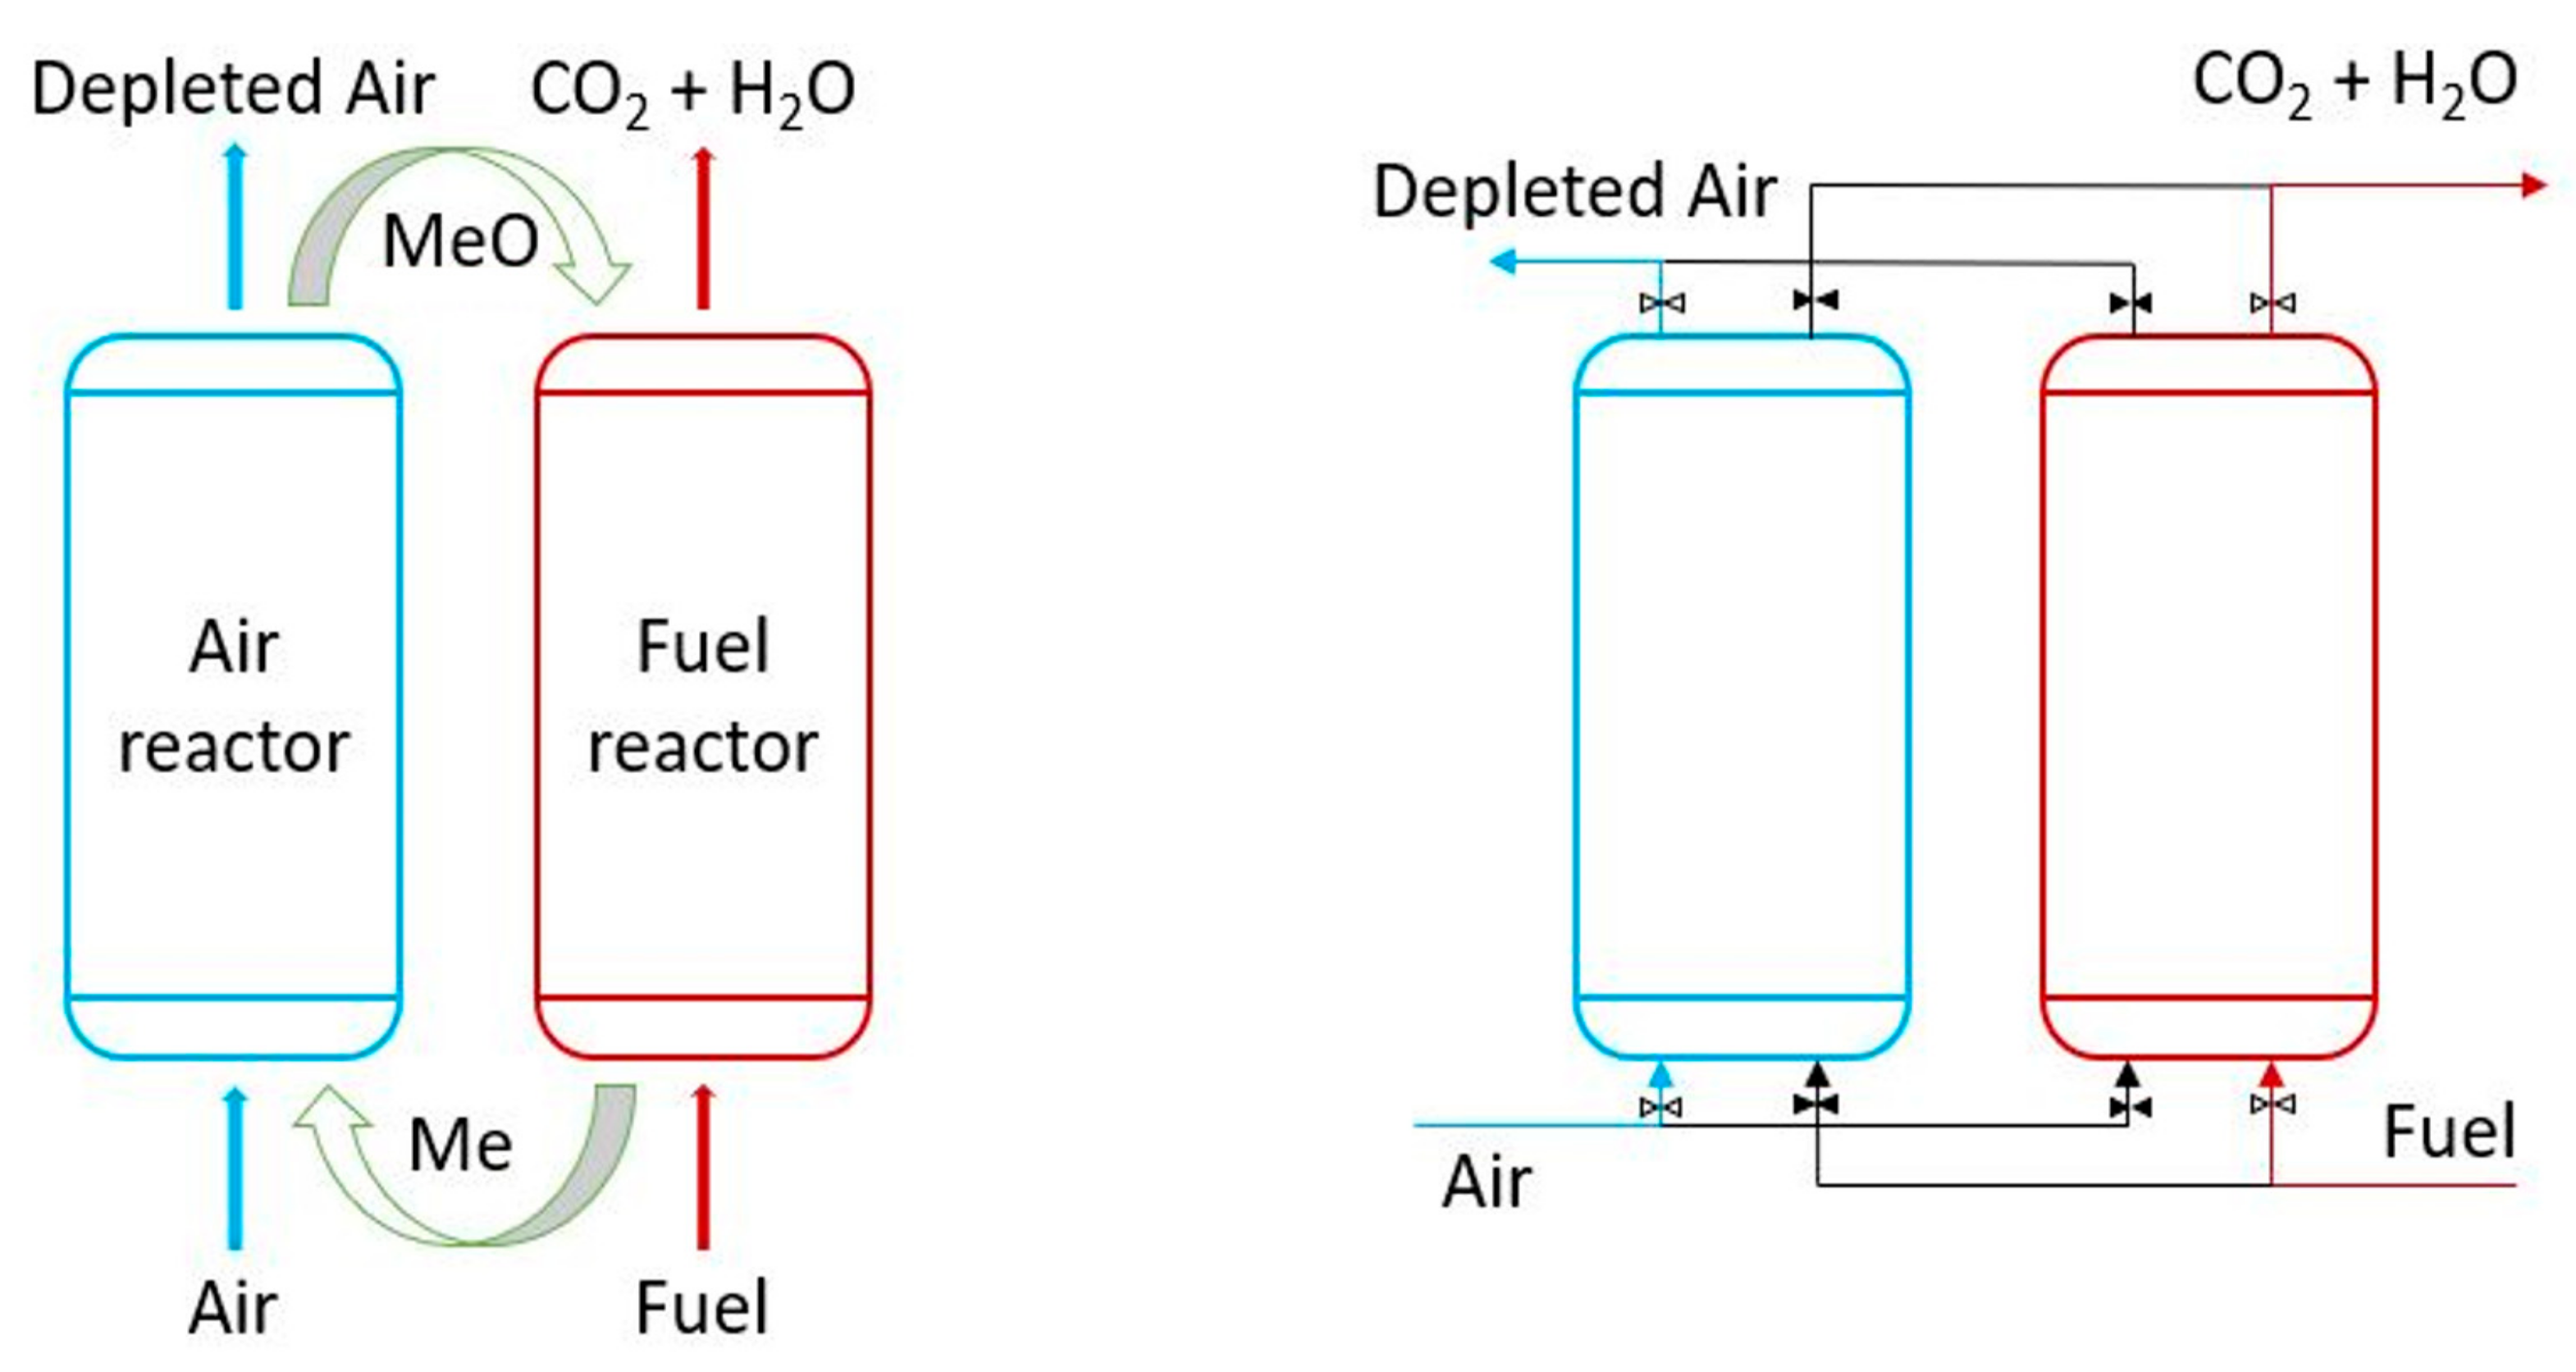
9]. The CLC process relies on the basic idea of supplying oxygen in the combustion media via a solid oxygen carrier, as presented in
Figure 1 (left). Oxygen is separated from air in the air reactor and transported to the fuel reactor via the OC, where it reacts with the fuel. Combustion occurs in a nitrogen-free zone, thus requiring only water condensation for delivering a high-purity CO
2 stream. Spallina et al. [
10] compared the performance of several packed bed CLC-IGCC power plant strategies, obtaining an electrical efficiency of 41%, lowering the energy penalty relative to a pre-combustion capture benchmark with 5.7%-points. Hamers et al. [
11] compared the performance of packed and fluidized bed reactors in CLC-IGCC systems but found no significant effect on the efficiency of the plant. In this case, net efficiency as high as 42% was obtained, further reducing the energy penalty with 6.92% points relative to pre-combustion. Cloete et al. [
12] replaced the air separation unit within the IGCC plant with a chemical looping oxygen production unit reducing the energy penalty by 8.1%-points for an efficiency of 43.4% and reaching 45.4% if hot gas clean-up technology is employed.
Alternatively, a 3-step chemical looping combustion configuration can be employed where an extra reactor is used to partially oxidize an iron-based oxygen carrier using steam to produce hydrogen for driving a combined cycle. Sorgenfrei et al. [
13] present the design and evaluation of a CLC IGCC system based on this configuration, achieving a net electric efficiency of 44.8% using a British Gas/Lurgi gasifier. Wu et al. [
14] evaluated a similar configuration to obtain net efficiencies as high as 45.6%. This three-step configuration achieves efficiency benefits because the hydrogen firing can achieve considerably higher turbine inlet temperatures (TIT) than the hot depleted air stream from the conventional CLC configuration. However, the extra reactor makes the configuration considerably more complex than conventional two-reactor CLC, and equilibrium limitations enforce the use of moving beds, adding further complexity and increasing reactor size.
One important challenge with CLC is scale-up under pressurized conditions. To overcome this challenge, gas switching combustion (GSC) [
15] was proposed. As shown in
Figure 1 (right), the GSC concept keeps the solid OC in a single reactor where it is alternately oxidized with air and reduced by the fuel. The alternating feed gas streams are fed to the reactor using inlet switching valves. Similar switching valves are needed at the reactor outlet to separate the alternating depleted air and CO
2 streams emerging from each gas switching reactor. Such a simple standalone bubbling fluidized bed reactor promises to be substantially easier to scale up and pressurize than the interconnected dual circulating fluidized bed CLC configuration. To maintain continuous operation, a coordinated cluster of several dynamically operated GSC reactors can be used.
Figure 1 (right) illustrates a simple cluster of two reactors where the reactor on the left is being oxidized and the one on the right is being reduced. When the desired degree of oxygen carrier conversion is achieved, the feed valves will switch to start reducing the reactor on the left and oxidizing the one on the right. A cluster of only two reactors is shown here for simplicity, but, since the air flowrate is much larger than the fuel flowrate, it is necessary to split the air feed between a larger number of reactors to maintain a similar fluidization velocity in all reactors [
16].
The GSC-IGCC configuration was recently investigated with the aim of maximizing the process efficiency by circumventing two main efficiency challenges [
17]. First, an additional combustor fired by natural gas was added after the GSC reactors to increase the TIT, thereby increasing the power cycle efficiency. Second, a recuperator was implemented to recover heat from the reduction outlet gases and transfer this thermal energy through the topping power cycle for more efficient electricity production. In addition, the condensation enthalpy in the steam originating from fuel combustion could be partially recovered at suitable temperatures in the steam cycle due to the high pressure of the GSC reduction outlet gases. Combined, these features succeeded in eliminating the energy penalty of CO
2 capture from an IGCC power plant, reaching efficiencies as high as 50%.
A major contributor to auxiliary consumption in an IGCC power plant is the air separation unit (ASU), the unit providing the necessary oxygen for the gasification of the fuel. The chemical looping process can be successfully applied for the separation of oxygen from the other constituents of air [
18] using several metal oxides. Shi et al. [
19] investigated several chemical looping air separation layouts, both continuous and batch types, and concluded that batch operation is more cost-effective for oxygen production. Deng et al. [
20] modelled a chemical looping air separation unit using a fluidized bed reactor and optimized the process. A gas switching variant of this principle, called gas switching oxygen production (GSOP), was recently proposed to displace the ASU in a pre-combustion CO
2 capture IGCC configuration [
21]. This oxygen production pre-combustion (OPPC) plant could achieve a net efficiency of more than 45%, albeit with a somewhat lower CO
2 avoidance of around 80%. Another benefit is that the relatively low operating temperature of the GSOP reactors will circumvent possible technical challenges with downstream valves and filters after GSC reactors.
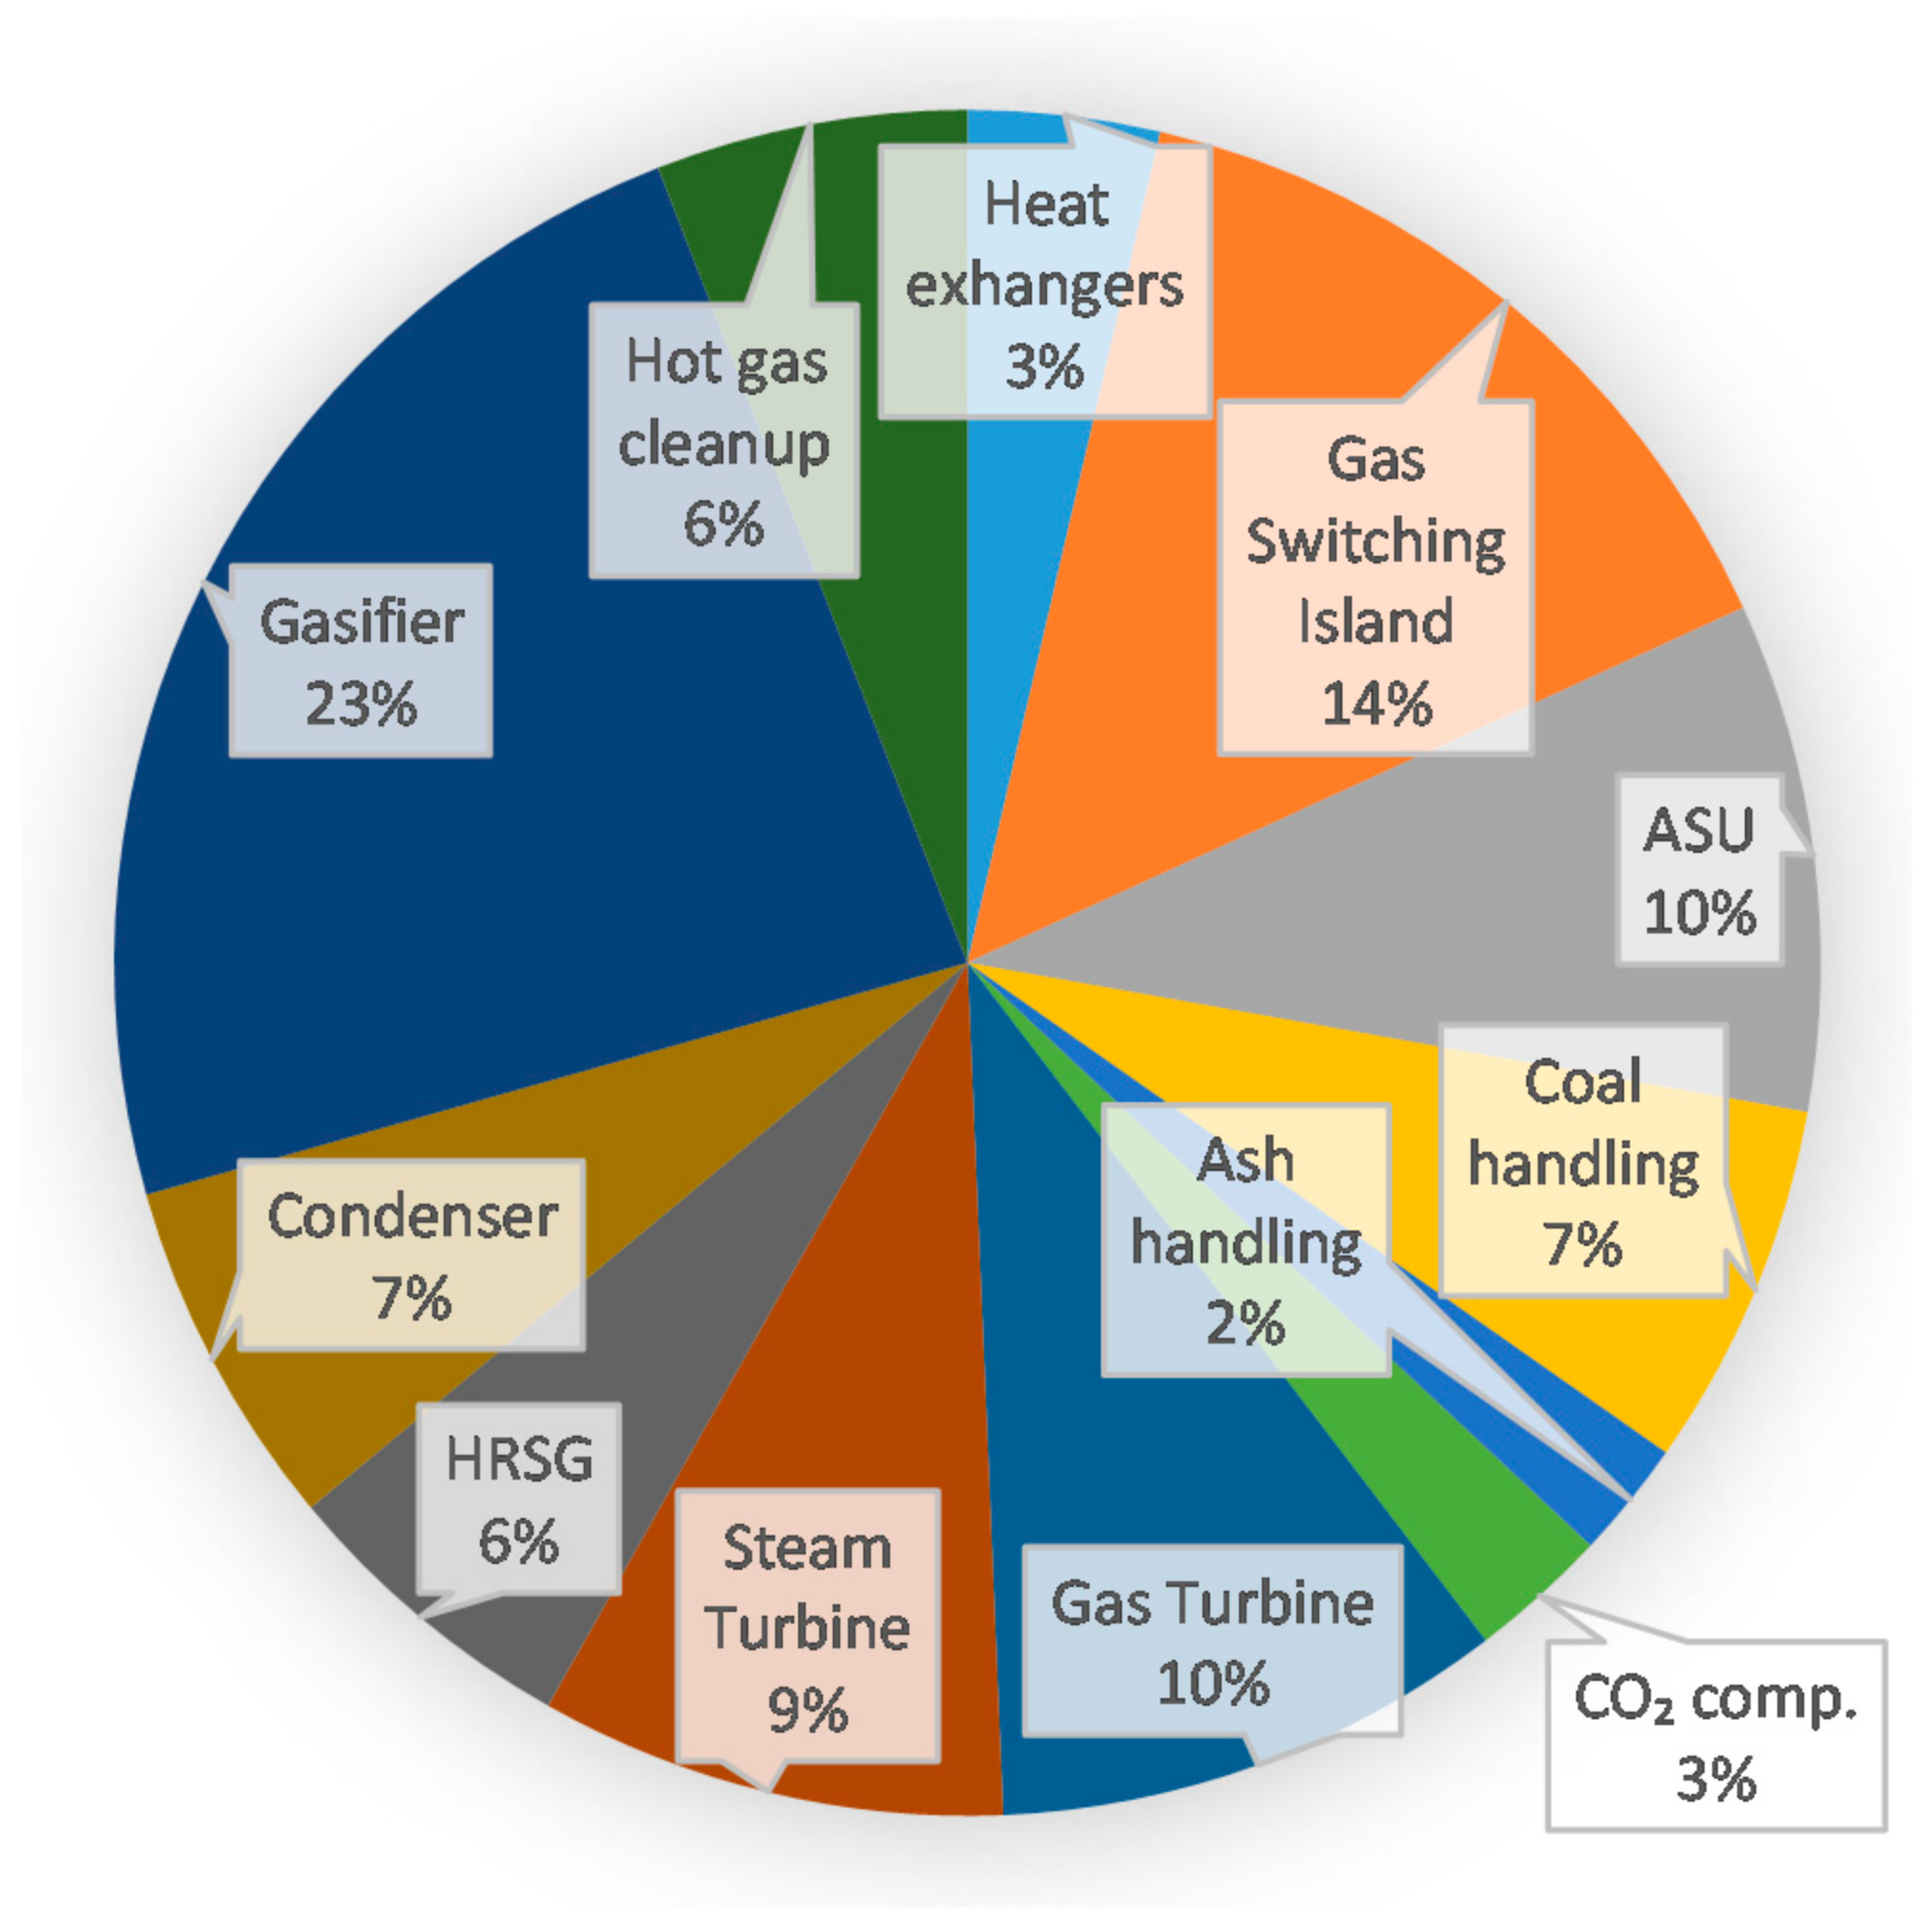
The present study will investigate the effects of these large efficiency gains from an economic point of view. For the GSC configuration with added natural gas firing, greater efficiency will decrease levelized costs related to coal fuel and CO2 transport and storage. Extracting more power from the syngas by means of a higher TIT will also substantially reduce the levelized costs of the expensive gasification train (coal and ash handling, gasifier, air separation unit, and gas clean-up). On the other hand, the use of natural gas for added firing will increase fuel costs because natural gas is more expensive than coal and reduce CO2 avoidance because the CO2 from natural gas combustion is not captured. For the OPPC configuration, levelized cost reductions can also be expected due to the high efficiency, but the relatively diluted syngas produced by this configuration will substantially increase the capital cost of the gasifier and gas clean-up units.
To quantify these trade-offs, this study presents a bottom-up economic assessment of GSC-IGCC plants with and without added natural gas firing and the OPPC plant. These results are compared to several benchmarks, including IGCC plants with and without conventional pre-combustion CO2 capture. The plant performance will be quantified in terms of the levelized cost of electricity and CO2 avoidance cost, relative to the IGCC and supercritical pulverized coal plant without CO2 capture. In addition, the sensitivity of these performance measures to key economic assumptions such as fuel costs and discount rate will be identified. Finally, the economic performance of these advanced IGCC plants will be benchmarked against other clean energy technologies, including nuclear, wind, and solar PV, in a future energy system with high CO2 prices.
2. Methodology
In this paper, five coal-fired IGCC power plant layouts are compared from a techno-economic point of view:
Case 1: IGCC power plant without CO2 capture (IGCC);
Case 2: IGCC power plant with pre-combustion CO2 capture using SelexolTM liquid-gas absorption (IGCC-PCC);
Case 3: GSC-IGCC power plant with inherent CO2 capture (GSC);
Case 4: GSC-IGCC power plant with added natural gas firing (GSC-AF);
Case 5: GSOP-IGCC power plant with pre-combustion CO2 capture using SelexolTM liquid-gas absorption (OPPC).
The results are also compared to a supercritical pulverized coal power plant [
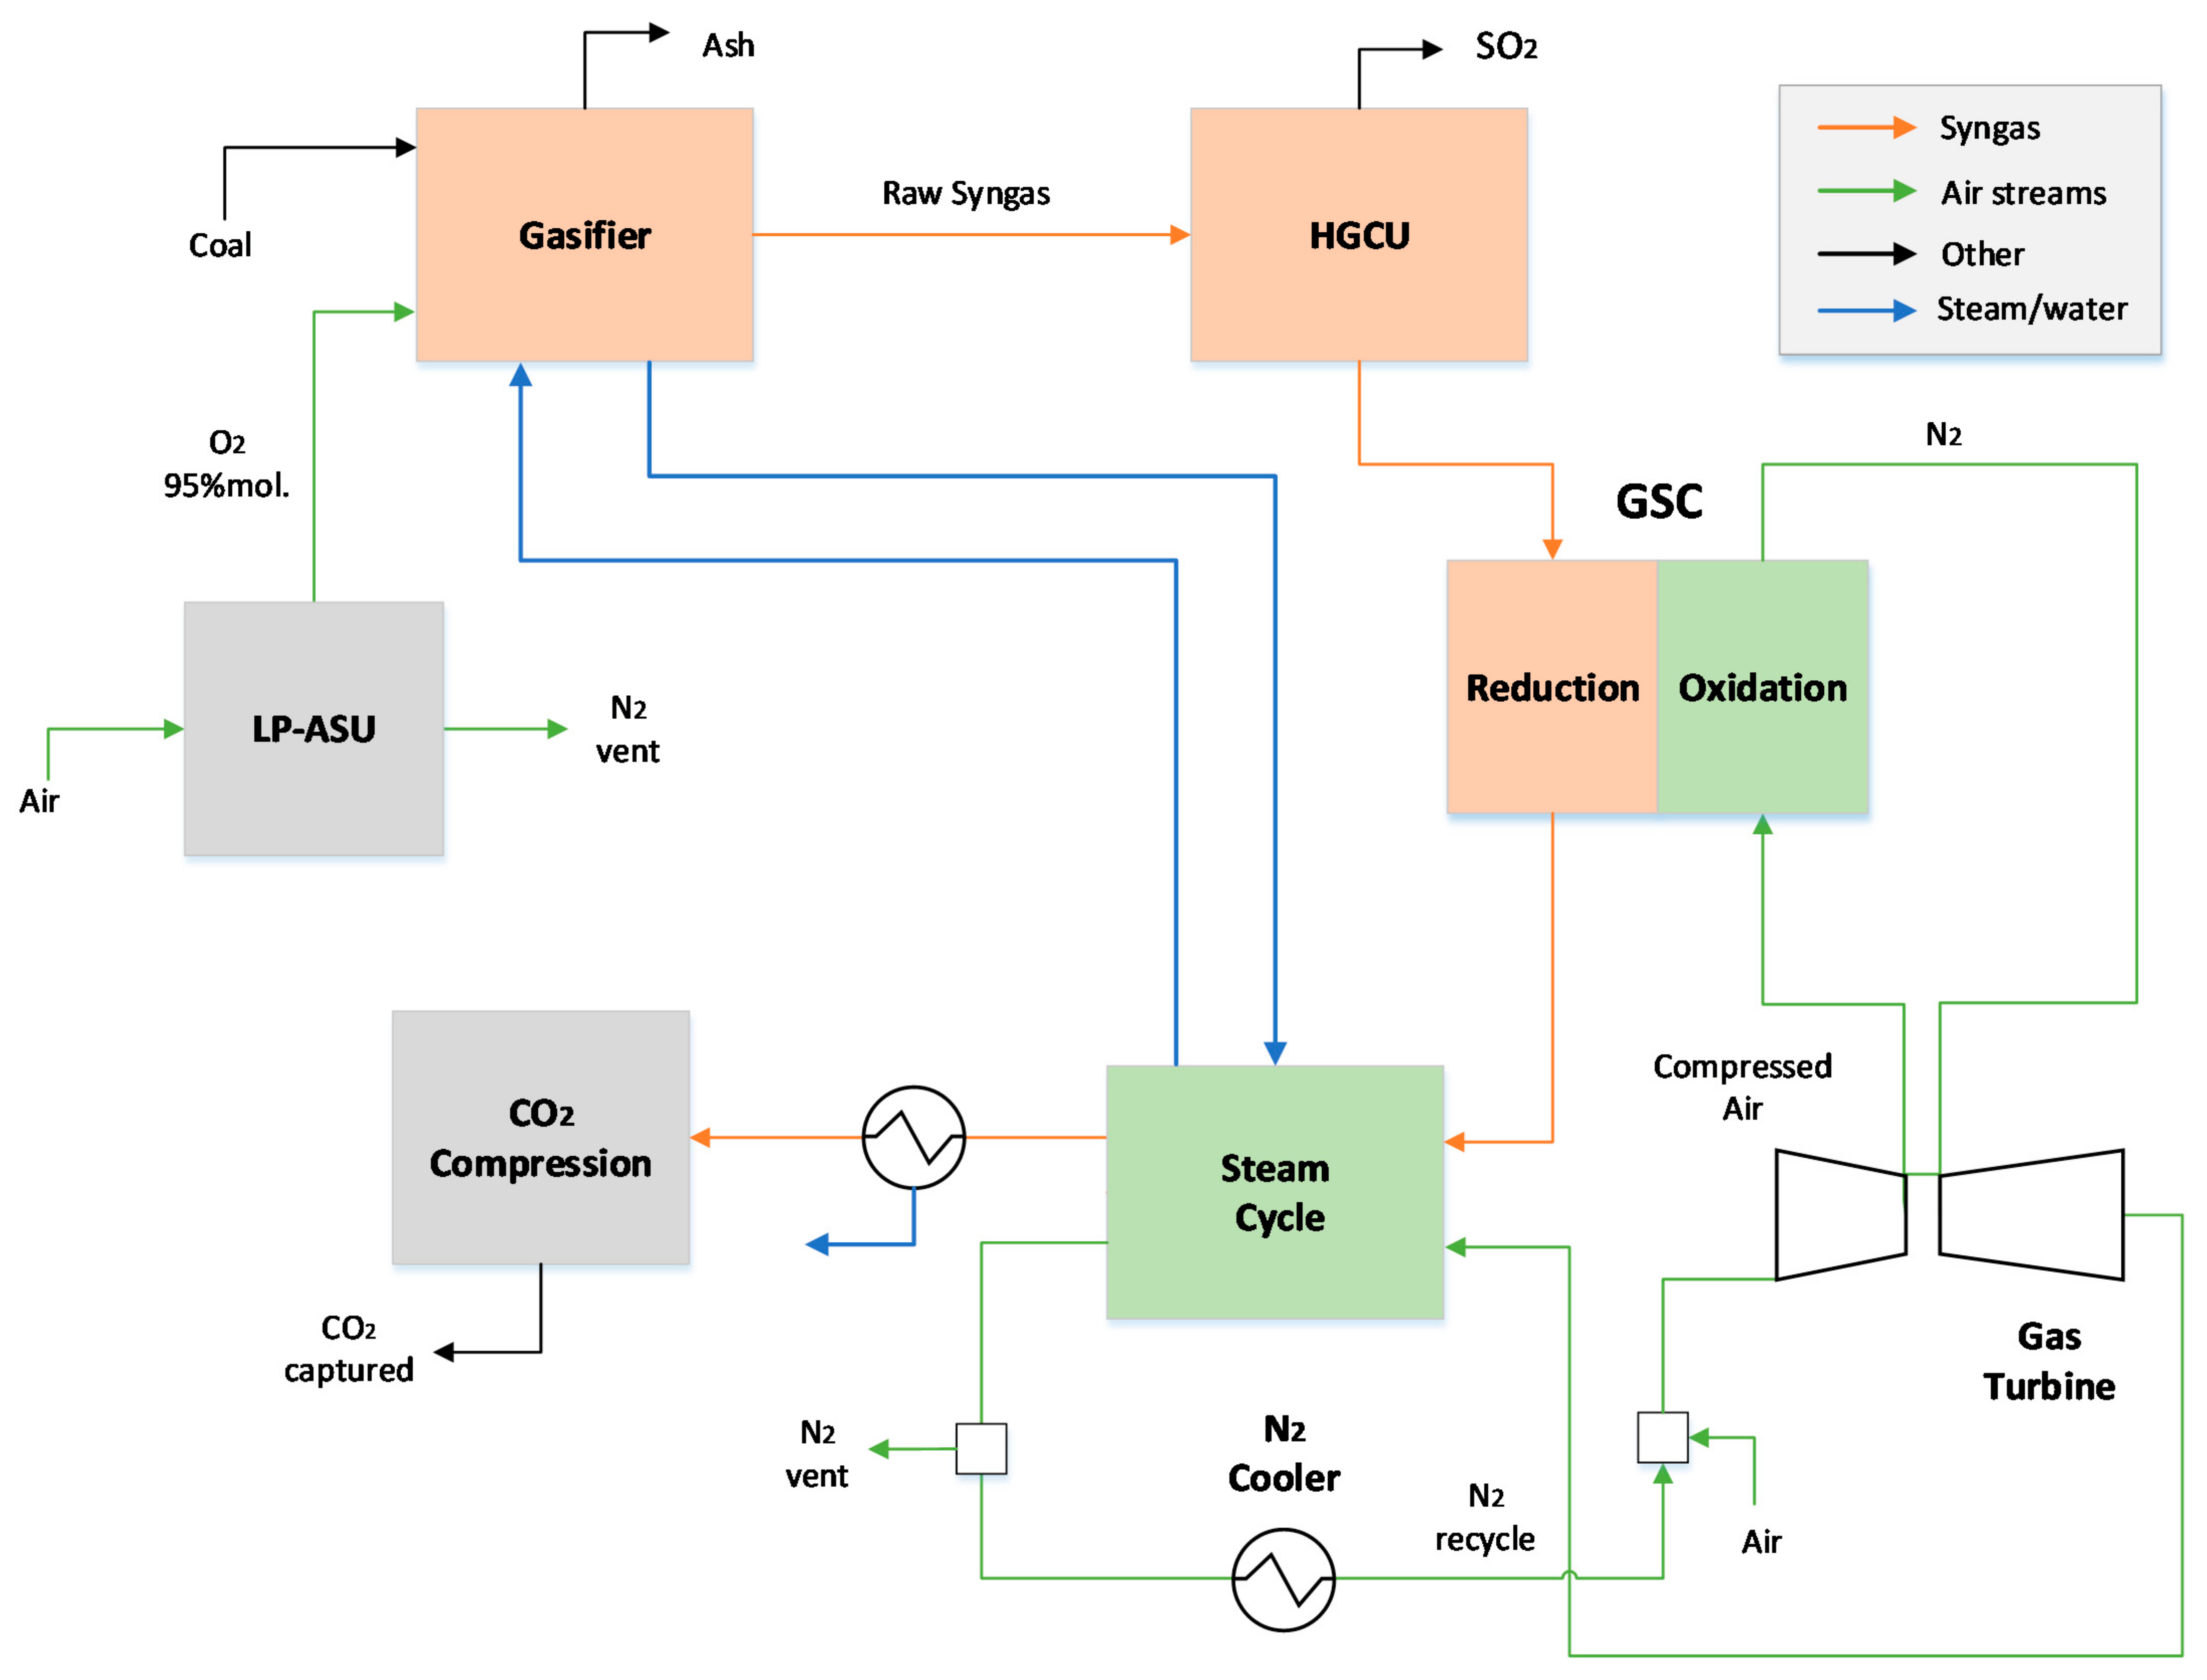
8] as this technology is widely deployed in the power sector today. Simplified schematics of the power plants for Cases 3, 4, and 5 are shown in
Figure 2,
Figure 3 and
Figure 4, respectively. More detailed schematics can be found in previously published technical assessments [
17,
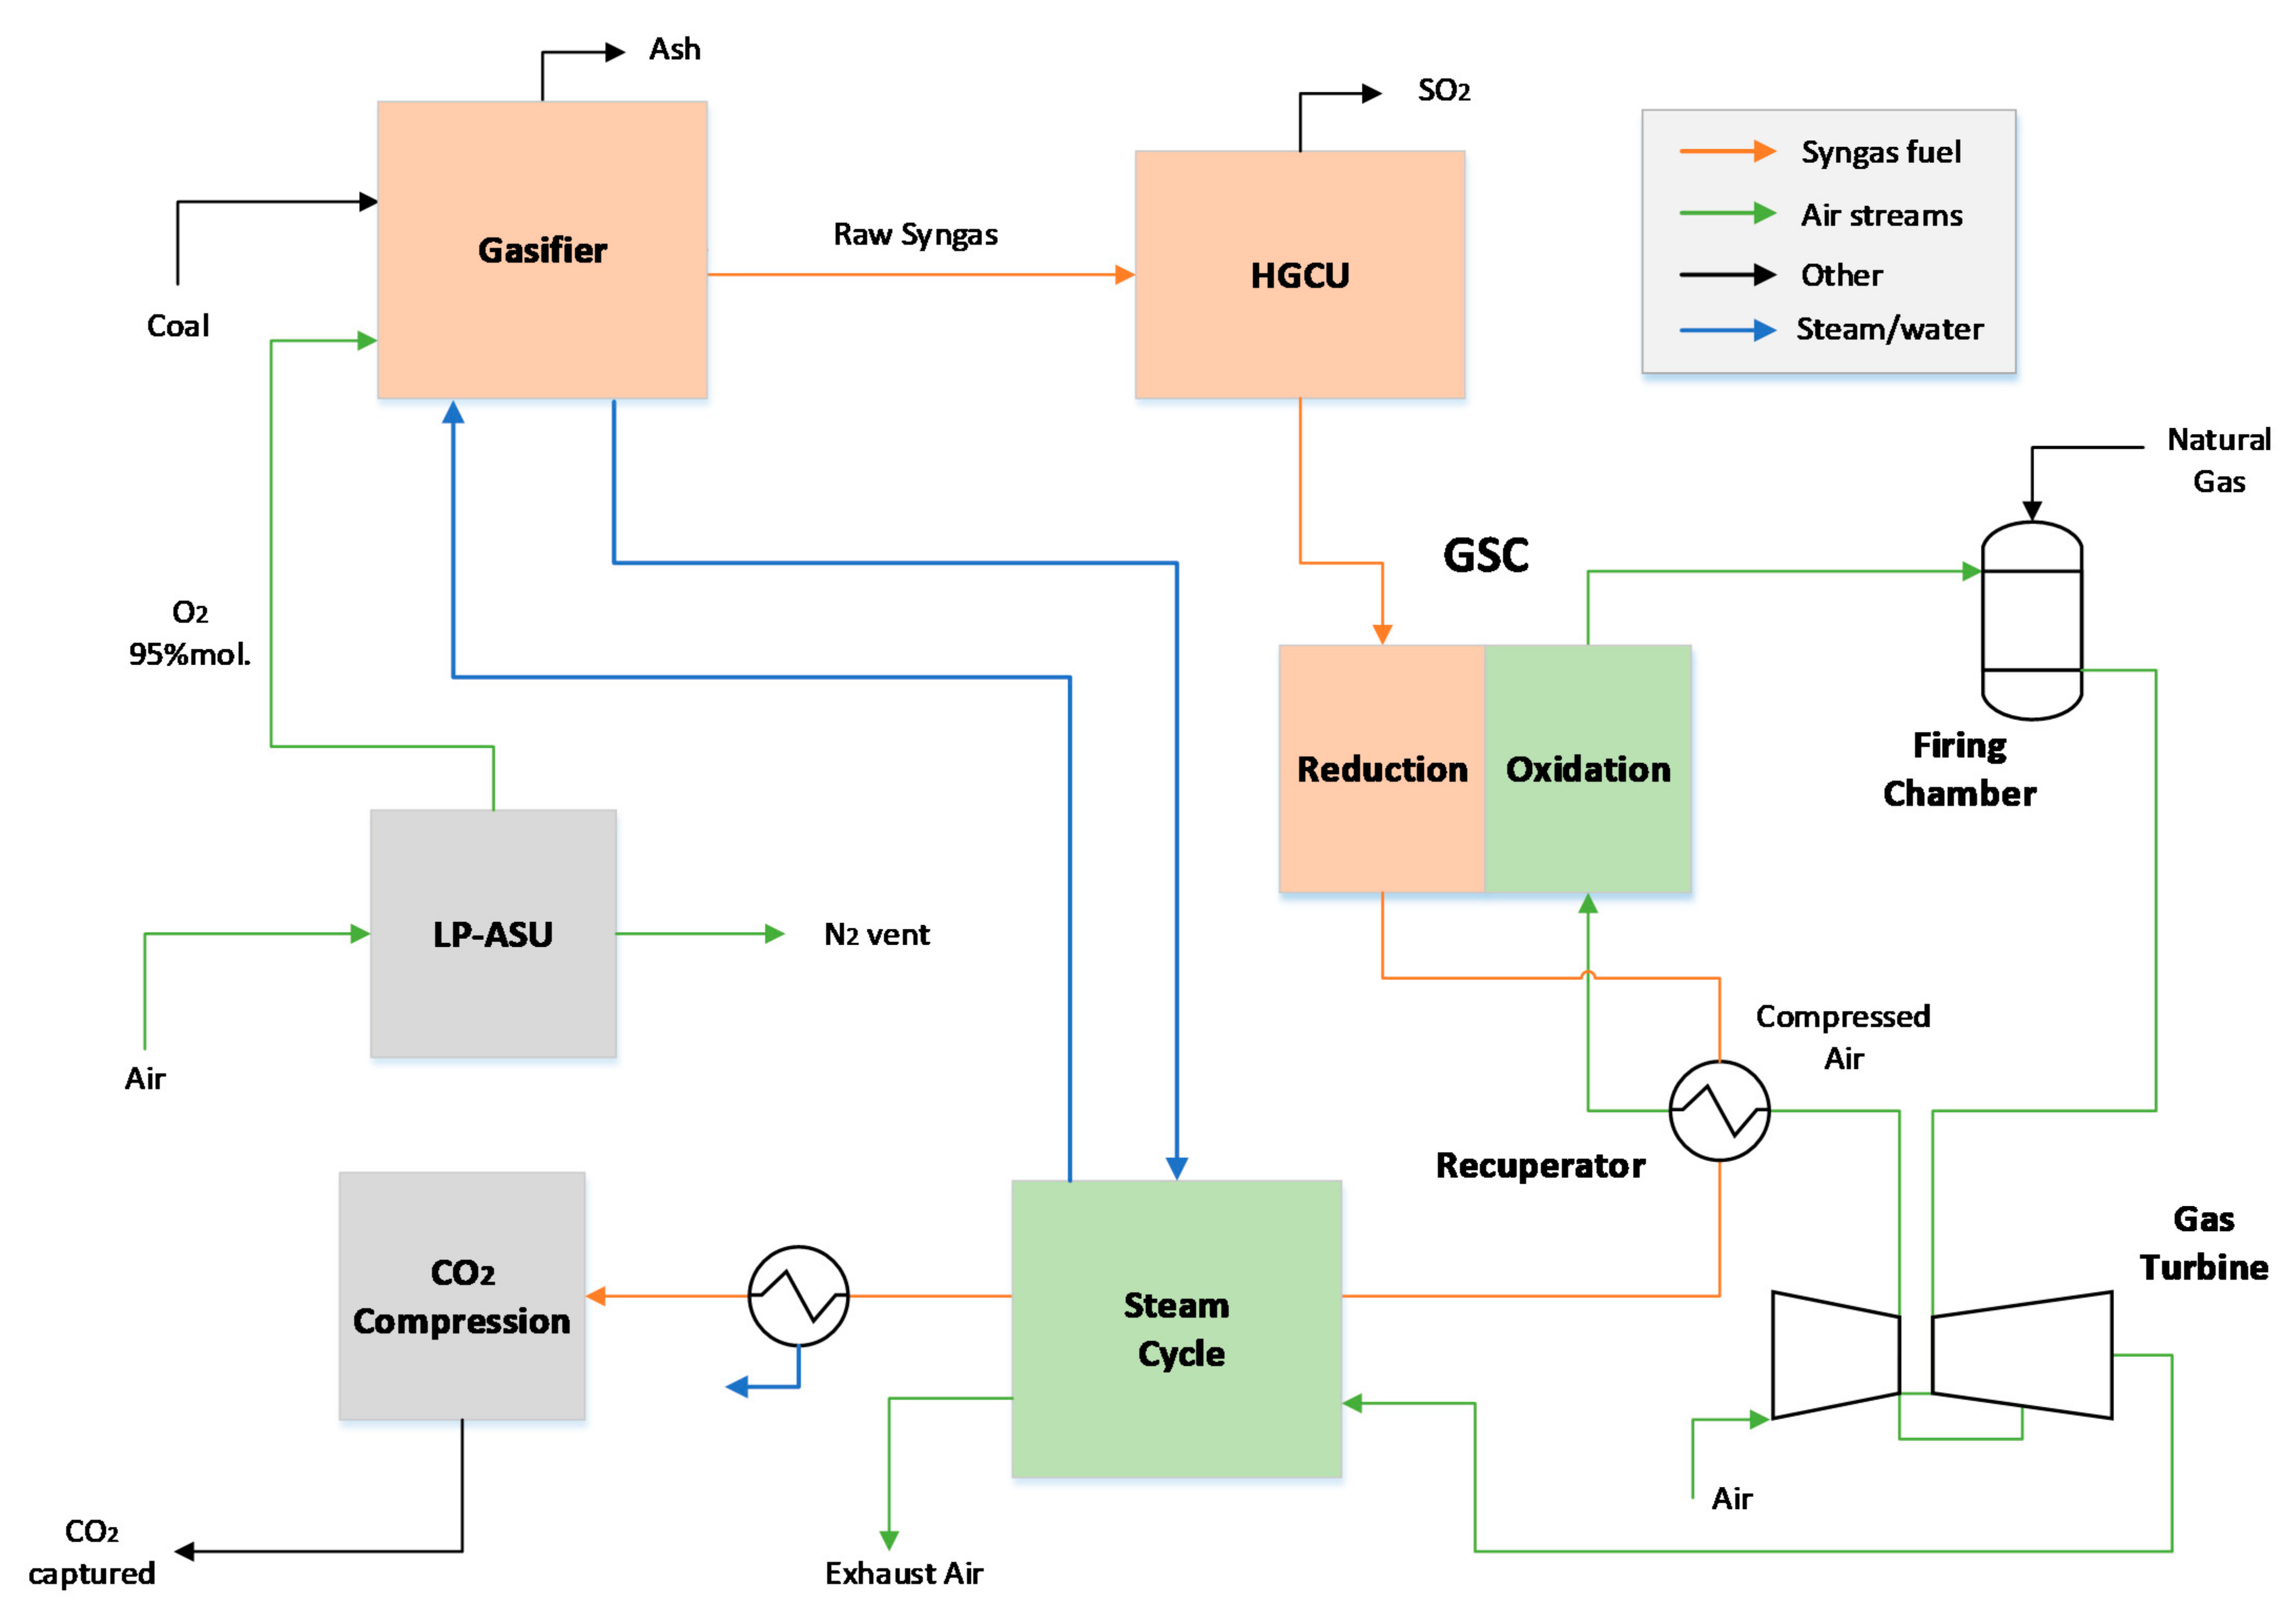
21]. The most important differences between the GSC (
Figure 2) and GSC-AF (
Figure 3) plants are (1) the GSC-AF plant fires natural gas after the GSC oxidation step to increase the TIT, and (2) the GSC-AF plant transfers heat from the CO
2 rich reduction step outlet gases to the compressed air stream using a recuperator. In contrast, the GSC plant must use the relatively high-grade heat in the GSC reduction step outlet gases to superheat steam for the bottoming cycle because insufficient high-grade heat is available from the gas turbine outlet gases, resulting from the lower GT firing temperature.
The OPPC plant (
Figure 4) does not use GSC reactors, relying on a conventional pre-combustion CO
2 capture train to separate CO
2. However, large efficiency gains are achieved by using GSOP reactors to produce an N
2-free oxidant stream (17%mol of O
2) for the gasifier and pre-heating the air to 900 °C. In this way, the OPPC plant avoids the energy penalty of an ASU and greatly reduces the amount of H
2 required (and the associated steam consumption) to reach the desired TIT relative to a conventional pre-combustion plant. The process flowsheets of the reference plants (Cases 1 & 2) are similar to the layouts shown in Gazzani et al. [
22].
2.1. Process Simulation
Two benchmark IGCC plants are considered in this work: the unabated IGCC model (Case 1) consists of a dry fed entrained flow gasifier (Shell Type), syngas scrubbing, and heat recovery with cold gas desulphurization unit. O
2 is delivered by a high-pressure air separation unit, and coal is loaded with high purity N
2. The ASU is 50% integrated with the gas turbine compressor, while all available N
2 is mixed with the syngas fuel to minimize NOx emissions for complying with regulations. The power island assumptions considered in this work are similar to the ones in Spallina et al. [
10], assuming an F-class turbine adapted to operate with syngas instead of natural gas.
The pre-combustion CO
2 capture model (Case 2) has a similar setup to the unabated IGCC plant, but a low-pressure ASU is used instead (no integration is advised for H
2 co-production and reliability), while coal is loaded with CO
2, resulting in slightly higher cold gas efficiency. After syngas scrubbing and steam addition from the HP stage steam turbine outlet (reaching a steam to CO ratio of 1.9 to avoid catalyst deterioration), the water-gas shift (WGS) reaction is carried out in two intercooled adiabatic reactors. CO
2 is removed with Selexol
TM absorption, modelled based on the work of Kapetaki [
23] for component solubility, and compressed in a five-stage intercooled compressor. H
2-rich fuel is saturated and mixed with N
2 from the ASU for NOx abatement and fired in the gas turbine (GT).
The GSC plants (Cases 3 and 4) are modelled with a similar approach as in Arnaiz del Pozo et al. [
17], with the notable difference of employing an NiO oxygen carrier instead of Ilmenite, which shows higher feasibility to operate under the assumed maximum temperatures (1200 °C) [
24] and has a better performance in terms of undesired mixing, achieving higher capture ratios due to the higher oxygen carrying capacity that facilitates longer reactor cycles. The same component efficiencies for the power island are taken and, considering the reduced turbine inlet temperature resulting from the mechanical limits of the oxygen carrier, a simple correlation by Horlock [
25] is taken to determine stator cooling, neglecting cooling of the rotor (Case 3). For the GSC plant with natural gas extra firing, the plant simulations performed in the present study consider a GT cooling flow model resulting a small decrease in efficiency, a lower capture rate, and a higher heat input provided by the extra natural gas relative to the results reported in Arnaiz del Pozo et al. [
17] (Case 4). The latter study reveals that carrying out extra firing with a portion of syngas results in significantly lower (more than 15%-points below) carbon capture relative to natural gas, because of its larger carbon intensity, while lower electrical efficiency is attained, due to thermal losses of syngas production and treating, which curtails the attractiveness of this option. Similar to the benchmark IGCC plants, the configurations integrating GSC technology produce syngas with a Shell gasifier, but also include hot has desulphurization as an additional efficiency enhancement.
The OPPC plant presented here (Case 5) has a similar configuration to the one shown in Arnaiz del Pozo et al. [
21], where a GSOP cluster delivers an oxidant stream to a Winkler gasifier to produce syngas. After hot gas desulphurization and contaminant removal, a portion of the syngas, together with some intermediate pressure steam from the bottoming cycle, is routed to the GSOP cluster. The remaining syngas is sent to a WGS unit similarly to the pre-combustion capture model. Subsequent CO
2 sequestration is performed with a simplified Selexol
TM unit (as H
2S has already been removed). The compressed air is firstly heated in the GSOP oxidation stage to 900 °C, and then it enters an extra firing chamber to reach higher temperatures by combustion of the H
2-rich fuel produced in the WGS unit. When incorporating the coolant flows in the GT model, a smaller portion of air passes through the GSOP cluster relative to Arnaiz del Pozo et al. [
21] and, in parallel, a larger fraction of syngas must be sent to the WGS unit to generate sufficient H
2 to reach the required combustor outlet temperature (COT).
The calibrated natural gas-fired turbine has a COT of 1440 °C and a TIT of 1360 °C with a turbine outlet temperature of 603 °C, operating with a pressure ratio of 18.1 and a simple cycle efficiency of 39%. When applied to the syngas fired models, it is assumed that the turbine operates at its nominal design point (equal pressure ratio and polytropic efficiencies of compressor and expansion stages) and that the cooling flows are adjusted to operate at the same TIT with the same cooling fraction to the rotor. This assumes a higher level of blade cooling technology and an appropriate compressor design to account for the higher flow rate of lower energy density fuel relative to the natural gas case. Furthermore, the coal flow rate to the plant is fixed, resulting in a different size of the GT for each case. This is consistent with the fact that the gasification island is the major cost component of the plant, with a constant heat input for all cases, and since GSC technology has a long deployment horizon, it is safe to assume some flexibility in GT design. The steam cycle consists of a three-pressure level with a reheat heat recovery steam generator (HRSG).
For NOx control, a large amount of N
2 from the ASU is mixed with the fuel in the IGCC-PCC case, while the GSC case requires no special measures due to the flameless combustion in the GSC reactors. For the GSC-AF case, it is assumed that the spontaneous combustion of natural gas in the hot depleted air stream from the GSC reactors can be carried out in a manner approaching the behavior of a premixed combustor by employing many fuel injectors and high turbulence [
26]. A similar approach is followed in the OPPC case.
The power plant models were built with the process simulator Unisim Design R451 using the Peng Robinson equation of state and the ASME steam tables for thermodynamic property calculations. Detailed modelling assumptions of the plant units are provided in the
Appendix A. The time-averaged operating points of the gas switching reactors as input for the power plant were determined with a transient 0-D model in Matlab, described in more detail in the technical assessments of the GSC and GSC-AF plants [
17] and the OPPC plant [
21]. This model assumes ideal gas behavior of the gaseous species, which is acceptable due to the high temperature and relatively low-pressure values encountered in the reactors. The reactions included in the models for the GSC (Equations (1)–(4)) and GSOP (Equations (5)–(8)) processes are summarized below. Equations (1)–(7) are assumed to proceed to completion, whereas Equation (8) is assumed to reach equilibrium as defined in Arnaiz del Pozo et al. [
21]:
2.2. Economic Assessment
The economic assessment methodology is presented in four parts: (1) the design and cost assessment of gas switching reactors and heat exchangers, (2) other capital cost assumptions, (3) operating and maintenance cost assumptions, and (4) the methodology for calculating the levelized cost of electricity and the cost of CO2 avoidance.
2.2.1. Reactor and Heat Exchanger Design
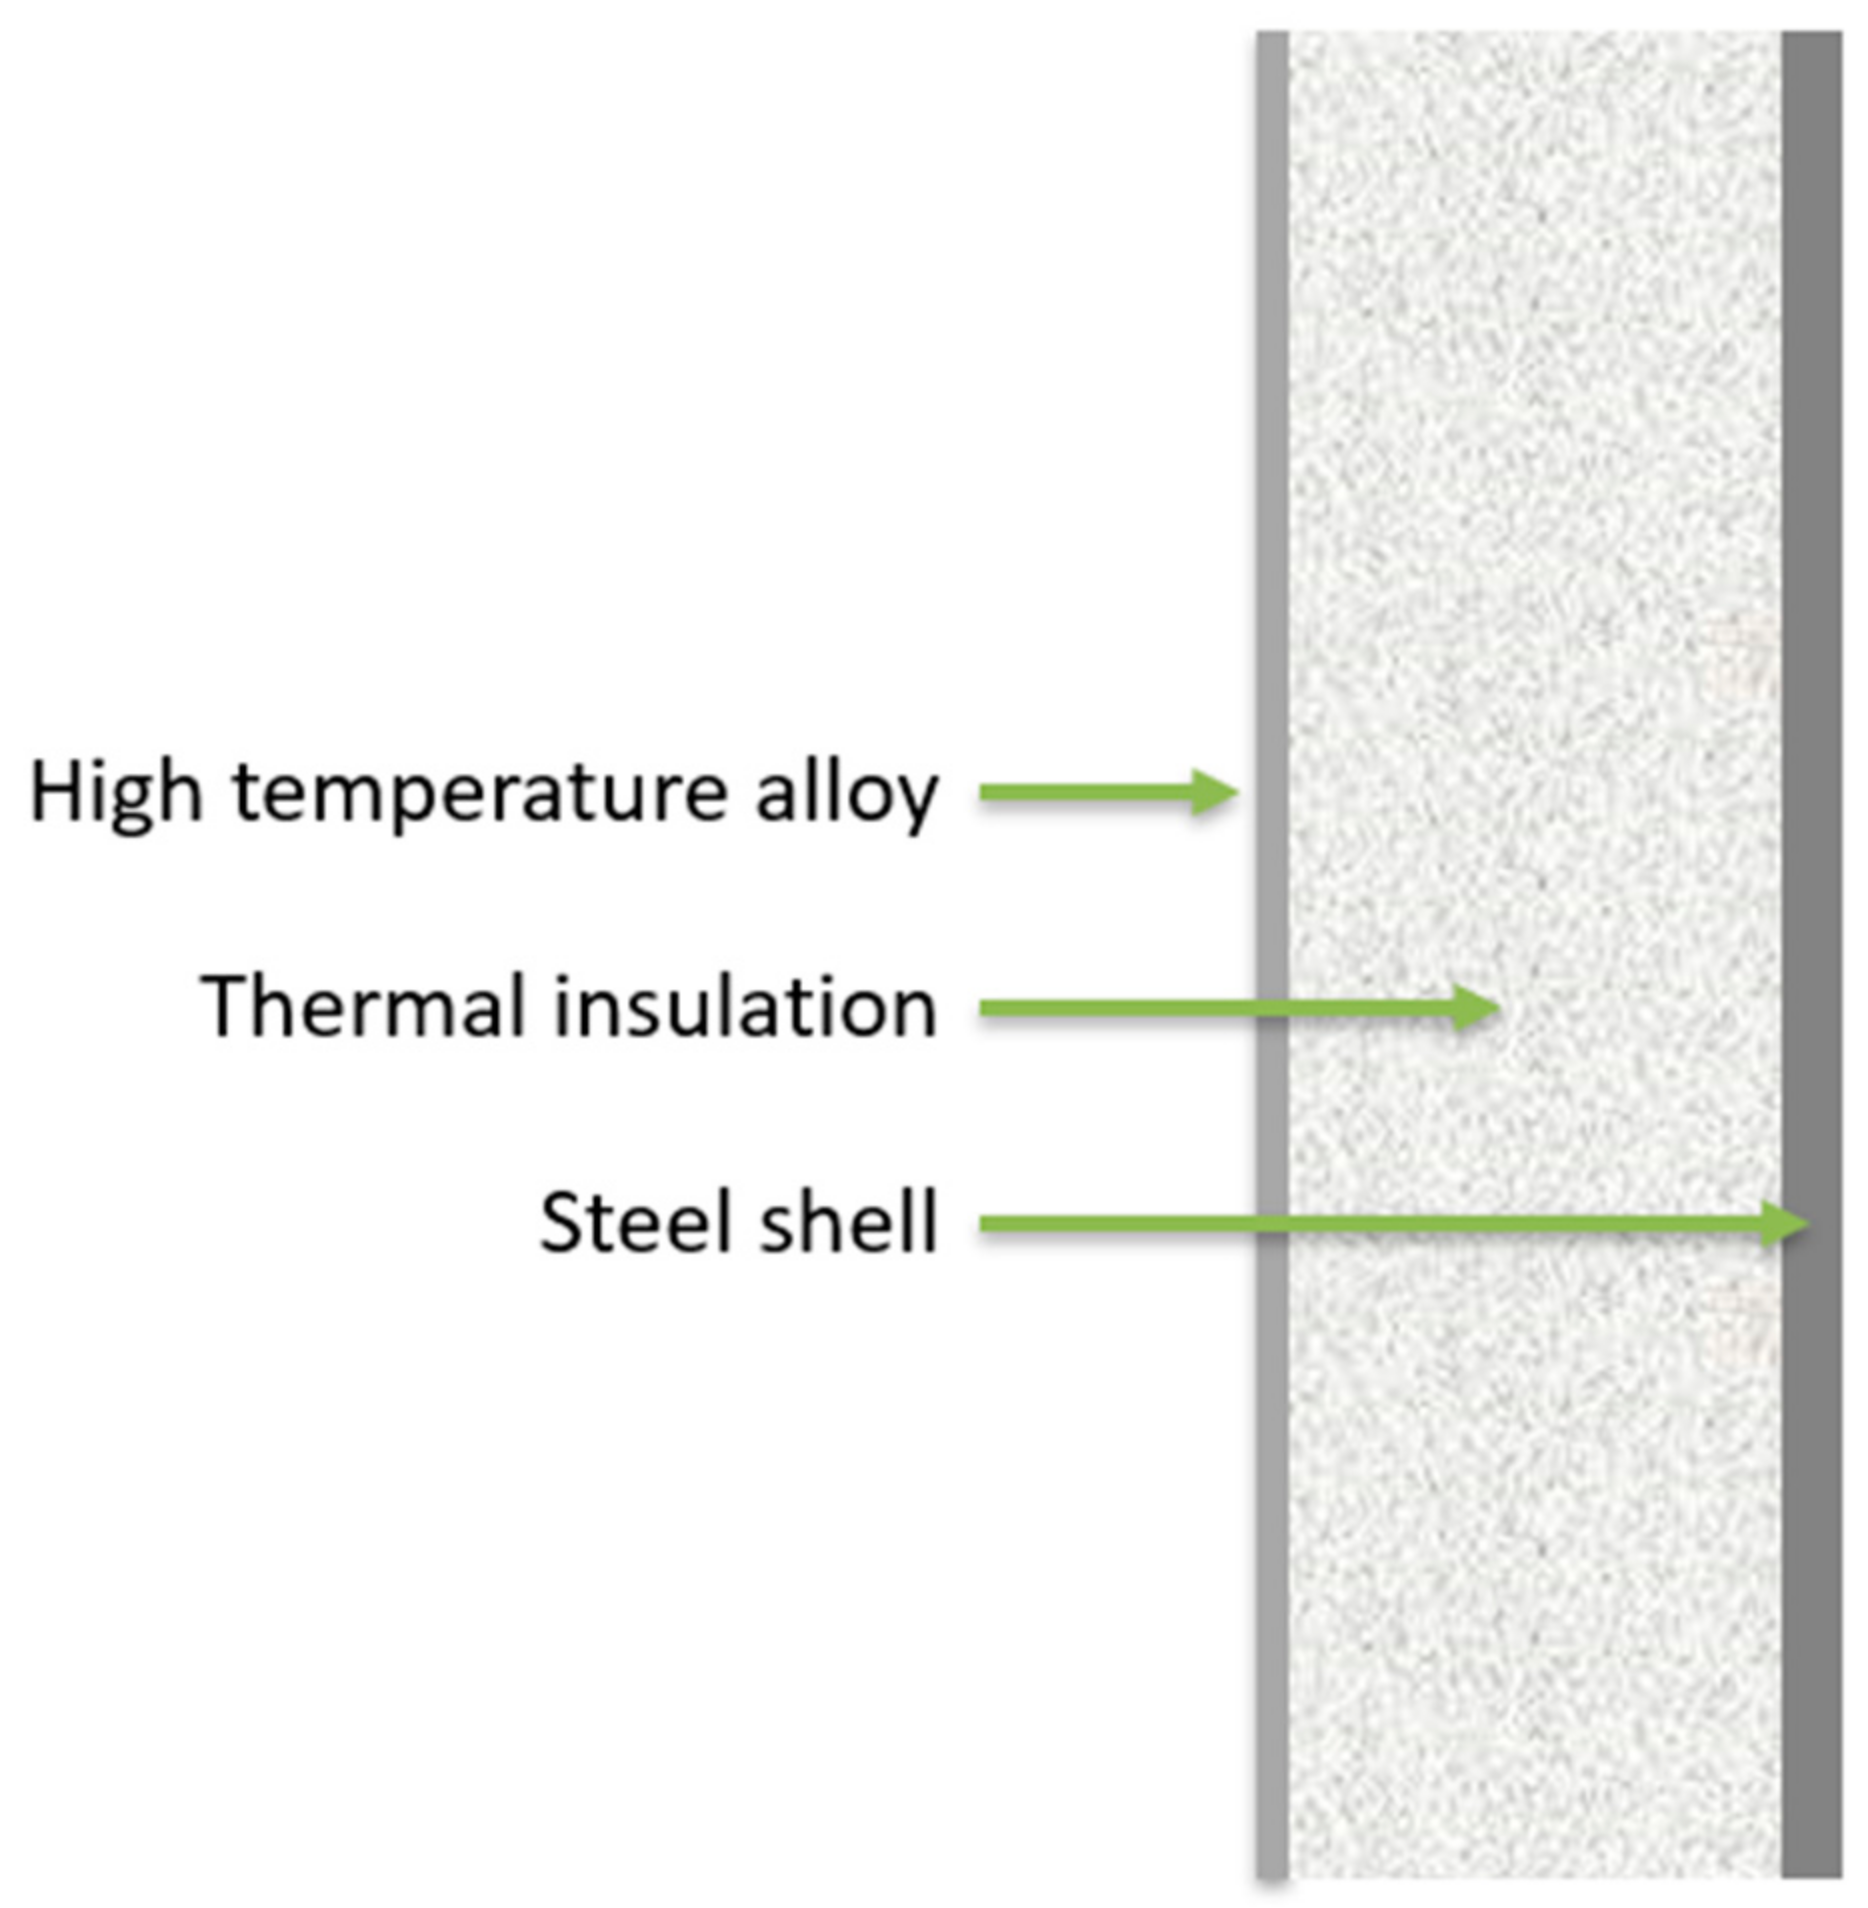
The reactor cost was estimated by assuming the wall structure presented in
Figure 5 where, from left to right, the layers represent the inner Ni-alloy to withstand the temperature, corrosion and abrasion loads, the middle 0.54 m thick layer of thermal insulation for an outer wall temperature of 80 °C, and the outer carbon steel shell to carry the pressure load. The cost of the reactor strongly depends on the cost of the shell, which depends on the insulation thickness employed. This is investigated in a sensitivity analysis in the results section. Each reactor was assumed to consist of two process vessels: an inner Ni-alloy vessel and an outer carbon steel vessel. The fully installed cost of these vessels is estimated using the correlations given by Turton [
27], with the cost of the inner vessel being doubled to account for elements such as the gas distributor and downstream particle filters. However, the cost of high-temperature outlet valves is included following Hamers et al. [
11]. The cost of the initial load of OC is added to the capital cost of the reactor.
The fluidization velocity in the reactor is assumed to be 1 m/s, which will be on the upper edge of the bubbling fluidization regime (shortly before the transition to turbulent fluidization) when 150 μm particles are used according to the correlations of Bi and Grace [
28]. This assumed fluidization velocity requires the total cross-sectional area of all the reactors to be 191.5 m
2. The reactors in the cluster are 1.84 m in diameter, 3.68 m in height, and a total number of 72. Costs are updated for the year 2018 using the Chemical Engineering Plant Cost Index [
29].
For the GSOP reactors, a similar methodology is applied as in the case of the GSC reactors with the following differences: the required cross-section of the reactors is 105.4 m2, the height is 3.66 m, the diameter is 1.83 m, and the number of units is 40 to maintain the desired fluidization velocity of 1 m/s. Since the GSOP reactors operate at a considerably lower temperature than the GSC reactors, a thinner insulation layer of 0.31 m could be used to maintain the outer wall temperature of 80 °C.
The cost estimation methodology for the heat exchangers involved a similar methodology. Shell-and-tube heat exchangers are selected with stainless steel used for both the shell and the tubes. Information about the heat transfer duty and log mean temperature difference from the process simulation is combined with calculated film and overall heat transfer coefficients necessary to determine the heat transfer area required in each heat exchanger. This heat transfer area is then used in the cost functions presented in Turton [
27]. The overall heat transfer coefficient is calculated as a function of film coefficients of the cold and hot streams using Nusselt number correlations from the literature [
30].
2.2.2. Capital Cost Estimation
Capital costs are estimated using the costs from Franco et al. [
8] and scaled to a chosen modeling parameter as presented in the general form of the cost (Equation (9)).
C0 and
Q0 are the reference cost and capacity of the unit, and
M is an exponent that depends on the equipment type. The parameters for the cost calculation are presented in
Table 1 and
Table 2 for the cases without CO
2 capture and with CO
2 capture, respectively. The obtained capital cost is updated using the Chemical Engineering Plant Cost Index [
29] for the year 2018:
The capital cost estimation for the base case IGCC power plant without CO
2 capture is performed using the reference data presented in
Table 1 and applied in Equation (9).
The capital cost estimations of Cases 2–5 are performed using the parameters presented in
Table 2. Case 2 involves standard technologies for gas clean-up, whereas the other three cases use hot gas clean-up as this offers significant efficiency improvements for IGCC systems [
31]. The standard gas clean-up is assumed to consist of the following units: acid-gas removal, gas cleaning, water treatment, and the Claus burner. The cost correlation parameters for the hot gas clean-up are obtained as 75% of the standard gas clean-up unit presented by Franco et al. [
8] as estimated from an RTI report [
32]. The cost of the WGS unit used in Cases 2 and 5 is obtained from the work of Spallina et al. [
33]. All other costs are taken from Franco et al. [
8]. A scaling exponent of 1 was employed for the CO
2 compression because the lower costs for the cases with GSC that generate already pressurized CO
2 streams stem from fewer compression stages and not from smaller compressors.
Table 2.
Reference costs, capacities and scaling exponents for the cases with CO2 capture used in Equation (9).
Table 2.
Reference costs, capacities and scaling exponents for the cases with CO2 capture used in Equation (9).
| Equipment | Scaling Parameter | Reference Cost (M€) | Reference Capacity | Scaling Exponent | Year | Ref. |
|---|
| ASU | Oxygen produced [kg/s] | 72.80 | 31.45 | 0.67 | 2011 | [8] |
| Coal handling | Coal input [kg/s] | 53.89 | 38.72 | 0.67 | 2011 | [8] |
| Ash handling | Ash flowrate [kg/s] | 17.42 | 5.48 | 0.67 | 2011 | [8] |
| HRSG | ST gross power [MW] | 34.10 | 168.46 | 0.67 | 2011 | [8] |
| Gas turbine | Net power output [MW] | 93.32 | 282.87 | 1 | 2011 | [8] |
| Steam turbine | ST gross power [MW] | 52.00 | 168.46 | 0.67 | 2011 | [8] |
| Condenser | ST gross power [MW] | 39.00 | 168.46 | 0.67 | 2011 | [8] |
| Gasifier | Thermal input [MW] | 180.00 | 954.08 | 0.67 | 2011 | [8] |
| Gasifier for Case 5 | Raw syngas flowrate [kg/s] | 167.1 | 65.60 | 0.67 | 2011 | [8] |
| Gas clean-up | Syngas flowrate [kg/s] | 61.49 | 89.21 | 0.67 | 2011 | [8] |
| Hot gas clean-up | Syngas flowrate [kg/s] | 46.12 | 89.21 | 0.67 | 2011 | [8] |
| SelexolTM CO2 capture unit | Shifted syngas flowrate [kg/s] | 45.00 | 111.04 | 0.67 | 2011 | [8] |
| WGS unit | Syngas flowrate [kg/s] | 21.12 | 89.21 | 0.67 | 2011 | [33] |
| CO2 compression | Compressor power [MW] | 30.00 | 20.69 | 1 | 2011 | [8] |
One important uncertainty is the gasifier cost assessment for Case 5. First, a different gasification technology is used (fluidized bed in Case 5 vs. entrained flow in the other cases). Second, the produced syngas has a much lower heating value, because the O
2 diluted oxidant stream (17%mol) from the GSOP employed for gasification, resulting in more than double the raw syngas flowrate relative to the other cases. This higher syngas flowrate can be expected to increase the required gasifier cross-sectional area, but it is also reasonable to expect that the gasification reactions will proceed faster due to the high concentration of CO
2 and H
2O in the oxidant stream and the high temperature at which this stream enters the gasifier, thus mitigating the required gasifier volume increase. In addition, elements like lock hoppers will be cheaper because the coal feed rate is the same, but the gasifier operating pressure is lower. To account for these conflicting effects, two scaling parameters were used for the gasifier cost: (1) the thermal input like the other cases and (2) the raw syngas flowrate that resulted in a much higher cost. In
Table 2, scaling with the raw syngas flowrate (before water addition in the scrubber) is done from the reference cost of the gasifier in the pre-combustion plant in this study, which is slightly smaller than the one in Franco et al. [
8]. The gasifier cost was then taken as the average of these two cost estimations. The effect of this uncertainty on the LCOE will be quantified in the results section.
The total investment cost was calculated as outlined in
Table 3. A process contingency of 30% was added to the GSC reactor cluster due to its low level of technological maturity, while a 10% contingency was added to the hot gas clean-up unit which is near commercial readiness [
34]. A project contingency of 18% and owner’s cost of 12% are applied in line with our previous work [
9]. These relatively high values are assumed to account for the technological uncertainty involved in IGCC technology.
2.2.3. Operating and Maintenance Costs
Table 4 presents the assumptions for the fixed and variable operating and maintenance (O&M) costs used in every case. The operating labour cost is included in the maintenance cost, according to Franco et al. [
8], in both without and with carbon capture cases. The maintenance cost is estimated based on the gross power output of the plant. References are provided in the table for the estimations, and the fuel costs are varied in a sensitivity assessment in the results section.
The oxygen carrier replacement period is selected as two years (also varied in a sensitivity analysis later), and the Selexol
TM absorbent loss in the system is assumed to be 7 g lost/MWh gross power generated [
8]. The economic parameters used for the OC in the GSOP reactors are the same as in the case of the GSC option.
2.2.4. Cash Flow Analysis
The levelized cost of electricity (LCOE) is calculated as the electricity price that would yield a net present value (NPV) of zero at the end of the plant’s economic lifetime, according to Equation (10). Here,
i is the discount rate, and
ACF is the annual cash flow in every year over the construction and operating periods specified in
Table 5. The annual cash flow combines revenues from electricity sales and expenditures from capital, fuel, and O&M costs. The construction period for the reference case without CO
2 capture is assumed to be lower, 3 years. A sensitivity analysis to the discount rate and capacity factor is presented in the results section.
The cost of CO
2 avoidance (COCA) is calculated using Equation (11), where LCOE represents the levelized cost of electricity and E the specific CO
2 emissions of the plant, respectively. Subscript CC denotes the plant with CO
2 capture and ref the reference plant without CO
2 capture, respectively:
COCA is calculated based on two references: the IGCC plant evaluated in this study (COCA
IGCC) and the supercritical pulverized coal plant from previous work [
9] (COCA
SCPC). The supercritical pulverized coal plant has an LCOE of €55.7/MWh and an emission intensity (E) of 763 kg/MWh.
4. Summary and Conclusions
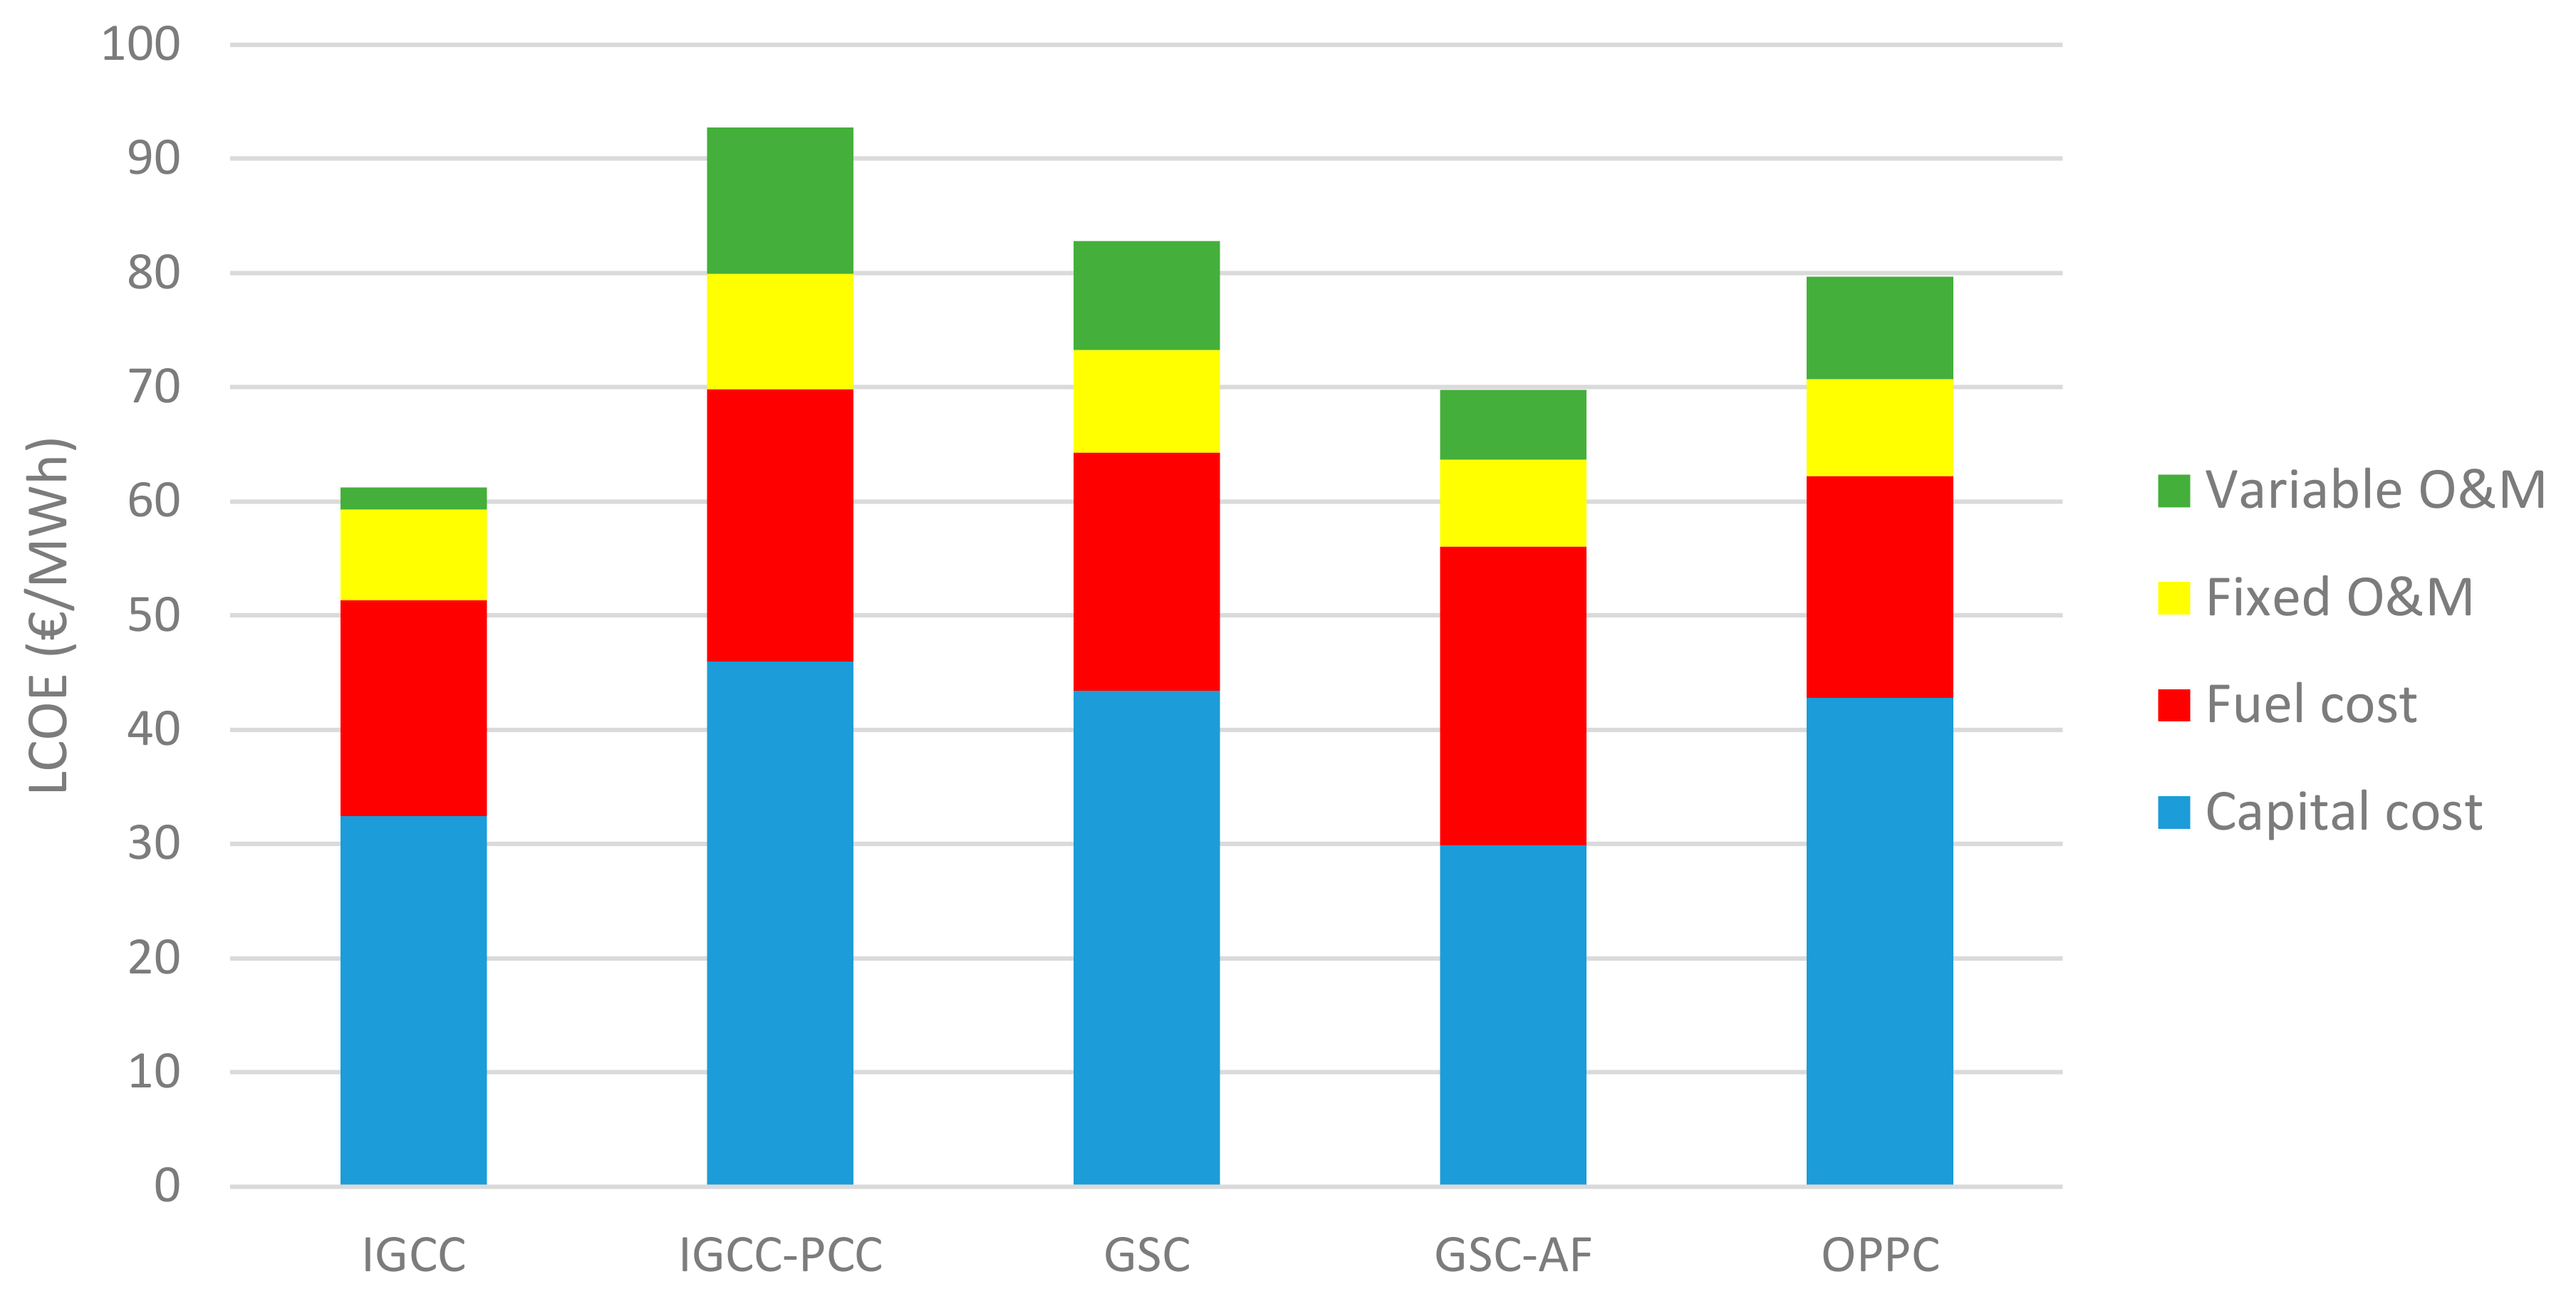
This study compared the economic performance of five different IGCC power plant configurations: a benchmark IGCC plant without CCS, conventional pre-combustion CCS, gas switching combustion (GSC), GSC with added firing with natural gas (GSC-AF) to increase the TIT, and the oxygen production pre-combustion (OPPC) configuration that replaces the air separation unit (ASU) with more efficient gas switching oxygen production (GSOP) reactors.
The GSC plant returned a 10.7% lower LCOE than the conventional pre-combustion benchmark (82.7 €/MWh vs. 92.7 €/MWh) while maintaining a CO2 capture rate of over 94%. Despite the higher cost of natural gas relative to coal, the high efficiency of the GSC-AF plant reduced the LCOE by another 15.7% to 69.8 €/MWh, reducing the cost of CO2 avoidance as low as 22.4 €/ton when compared to a supercritical pulverized coal power plant. The large efficiency benefit of replacing the ASU with GSOP reactors in the OPPC configuration was partially counteracted by an increase in the gasifier cost and a lower CO2 capture rate, resulting in a similar CO2 avoidance cost to the GSC plant, despite achieving a 3.8% lower LCOE.
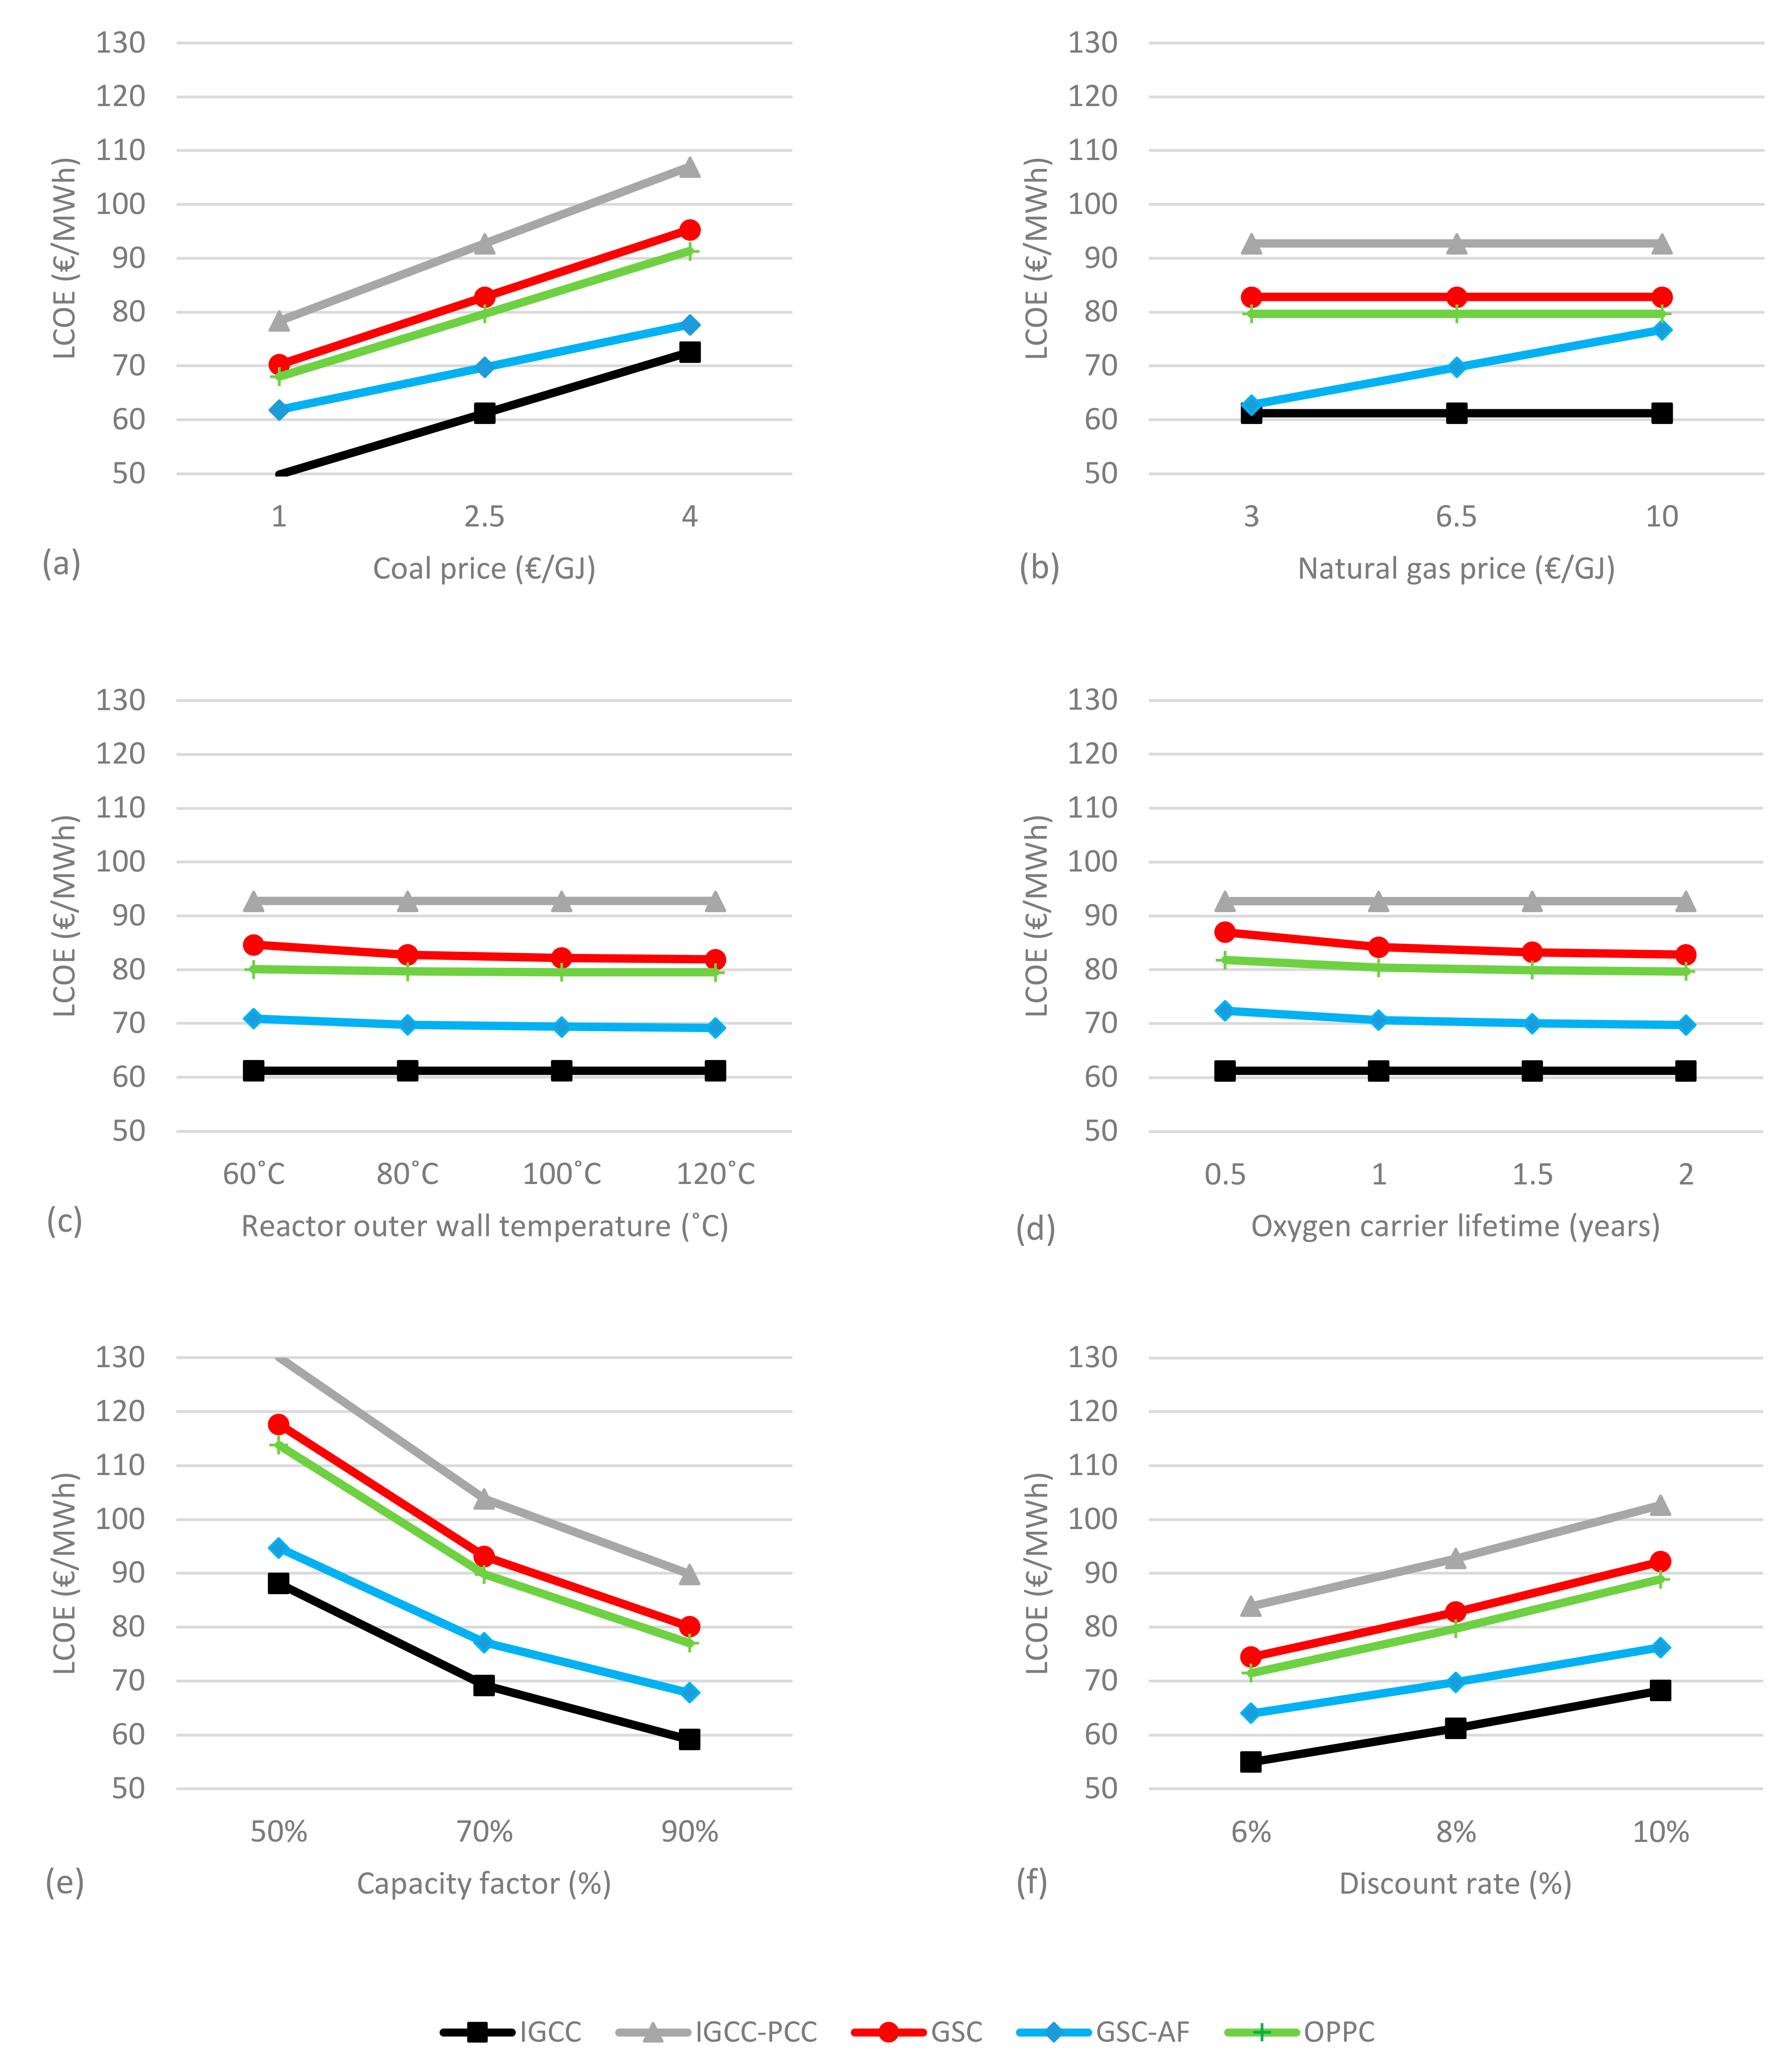
These results reveal that the GSC-AF configuration holds the most promise. In the sensitivity analysis, this case also showed reduced risk from several sources of uncertainty. Fuel costs are split evenly between coal and natural gas, limiting the sensitivity to price variations in either fuel. Uncertainties related to the GSC reactor cost and oxygen carrier lifetime are also limited since the added firing makes these components a smaller fraction of the LCOE. Added natural gas firing also makes the GSC-AF case less capital intensive (30% lower specific capital cost than GSC), limiting the cost increase related to lower capacity factors and higher discount rates. This plant could also hold benefits related to flexible operation for balancing wind and solar power since the expensive natural gas consumption can be ramped down first during part-load operation, requiring only a modest turndown of the relatively inflexible gasification train. The GSC-AF plant faces some risk from very high CO2 prices due to the emissions from added natural gas firing, but this risk is mitigated by the possibility to do the added firing with clean hydrogen instead.
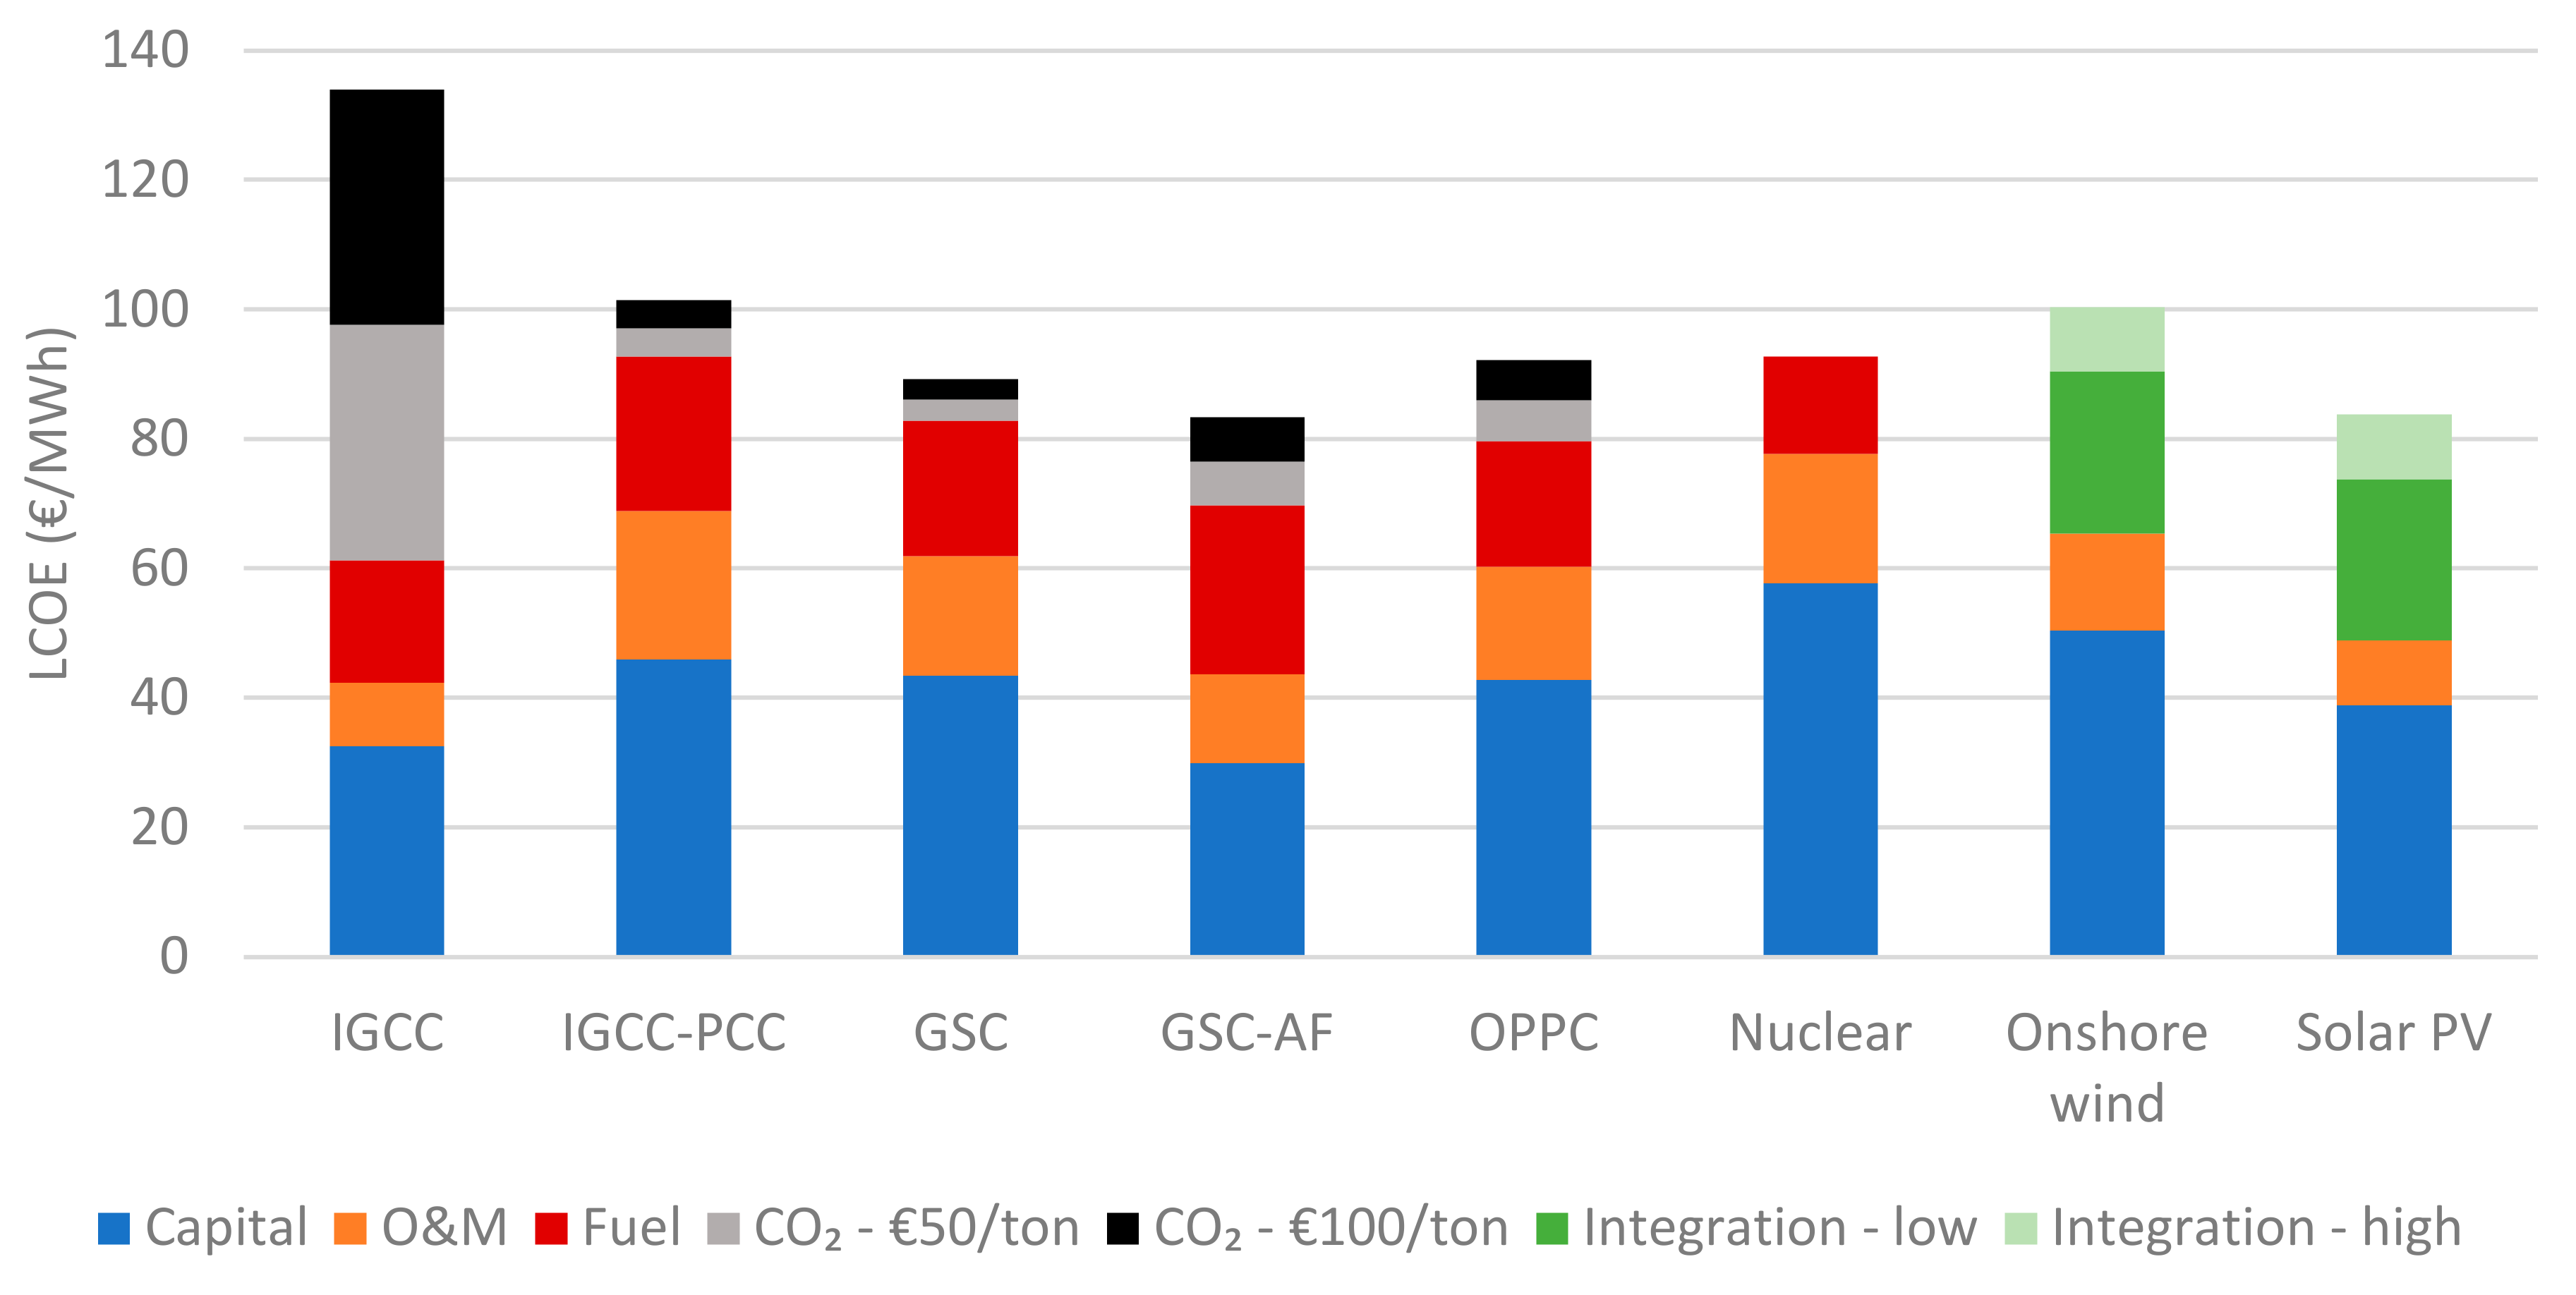
The good performance of the GSC-AF case was confirmed in comparisons to nuclear, wind, and solar power, where it emerged as the only CCS technology consistently less expensive than other clean energy benchmarks. Among the advanced IGCC power plant configurations investigated in this study, the GSC-AF configuration therefore emerges as the preferred option for further development. Future work will investigate the possibility of further performance gains using more advanced gas turbine technology and the potential to do the added firing with hydrogen extracted from the syngas stream.


 ,
, 


