Article

Local Calibration of TDR Measurements for Determining Water and Organic Carbon Contents of Peaty Soils

by
Claudia Kalla Nielsen
1,2,* and
Anton Gårde Thomsen
1
1
Department of Agroecology, Faculty of Technical Sciences, Aarhus University, Blichers Alle 20, 8830 Tjele, Denmark
2
CBIO, Centre for Circular Bioeconomy, Aarhus University, 8830 Tjele, Denmark
*
Author to whom correspondence should be addressed.
Soil Syst. 2023, 7(1), 10; https://doi.org/10.3390/soilsystems7010010
Submission received: 12 December 2022 / Revised: 20 January 2023 / Accepted: 21 January 2023 / Published: 2 February 2023

Abstract

:
Time domain reflectometry (TDR) measurements of the volumetric water content (θ) of soils are based on the dielectric permittivity (ε), relating ε to θ, using an empirical calibration function. Accurate determination of θ for peaty soils is vital but complicated by the complexity of organic soils and the lack of a general calibration model. Site-specific calibration models were developed to determine θ from TDR measurements for a heterogenous peatland across gradients of peat decomposition and organic carbon (OC) content; derived by soil organic matter conversion. The possibility of predicting OC contents based on the corrected θ (θcor); ε; electrical impedance (Ζ); and a categorical predictor variable was explored. The application of plot-specific and local area calibration models resulted in similar results. Compared to common calibrations, the threshold for accurate determination of θ was at ε = 5; with higher ε underestimating θ by up to 25%. Including the von Post degree of peat humification as a bioindicator, the OC content could be modelled across the area and the full range of θ with an accuracy of ±1.2% for 496 measurements. In conclusion, a strong indication was found for determining OC in peatlands in situ using TDR and a site-specific calibration model for θ together with indices of peat decomposition.

1. Introduction

Soil moisture content, a critical variable for emissions of greenhouse gases (GHG) from soils and especially peatlands [1,2,3], is not necessarily well-related to measurements of water table depth (WTD). While monitoring of WTD indicates the lower boundary of the vadose zone of peaty soils over time, it provides no information regarding the soil volumetric water content (θ)—critically related to redox conditions [4,5] and dynamics of atmosphere—soil exchanges of, in particular, CH4 and N2O.
Time domain reflectometry (TDR) is a well-established, non-destructive in situ method to determine θ of porous media, most commonly soils [6,7,8] but also grains [9] or roadbeds [10], based on the relationship with the dielectric permittivity (ε) (or previously, dielectric constant). Over decades, most empirical calibration models focused on mineral soils, e.g., [11,12], typically characterised by ε < 40, dependent on soil texture. However, for porous soil media like peat, characterised by higher water-holding capacities [13] and typically with ε > 40 [14], the use of commonly used calibration equations for mineral soil, e.g., [11] results in underestimated values for θ [15,16,17].
While the accuracy related to dielectric calibration models and TDR-instrumentation for soils with high organic carbon (OC) content has been investigated, e.g., [13,14,18], there remains a lack of consent regarding the applicability of calibration models across gradients of OC for peat substrates. In organic soils, bulk density (BD) has been found highly correlated to both OC concentration, e.g., [19] and gravimetric water content [20]. Serving as a bioindicator (i.e., a proxy) for peat degradation and substrate composition, this relationship has been used as an aid for determining specific soil conditions, influencing the TDR-derived determination of θ [21].
With an increasing acknowledgement of the importance of peatlands and their hydrological status for a variety of different ecosystem services, e.g., habitat provision and biodiversity, climate mitigation, and nutrient cycling [22], peatland restoration is on the agenda of many national and international policies [23]. Agricultural practices have led to the wide deterioration of peatland ecosystems, including the degradation of peat substrate quality [24]. Therefore, an improvement of time- and cost-efficient in situ methods for determining soil moisture and carbon contents can not only aid in pinpointing priority areas for peatland restoration, but can also refine the outcomes of digital mapping approaches by more rapid ground-truthing [25].
This study aimed to explore the possibility of determining OC contents in peaty soil by empirical models based on the corrected θ (θcor), ε, electrical impedance (Ζ), and a categorical bioindicator predictor variable for soil texture and peat degradation. Further, it discusses whether an individual calibration of ε, for accurate determination of θ, needs to be performed for individual organic soil sites, considering the organic carbon content. In this context, single-plot and ‘all-in-one’ calibrations across gradients of peat substrate quality and OC contents were performed to compare the accuracy of the resulting empirical models.

2. Methods

2.1. TDR System

The TDR system used included a TDR100 TDR instrument (Campbell Scientific, Logan, USA), an Allegro (DOS) handheld field PC (Juniper Systems, Logan, USA), and a 50 to 200 Ω hand balun to connect the TDR instrument to permanently-installed measuring probes. Details on the TDR system applied are given in [26].

2.2. Study Site and Sampling Procedure

In February 2022, a total of 16 intact cylindrical soil columns (20 cm length, 10 cm diameter) were extracted from a riparian fen peatland located in the Nørre Å river valley, Denmark (56°26′15.3″ N, 9°32′44.1″ E). Over decades, the area has mainly been used for animal grazing due to its low productivity and relatively high wetness, despite drainage by ditches and tile drains which were established during the first half of the 20th century. The site is currently cultivated with flood-tolerant perennial grasses as part of field experiments focusing on biomass production and peatland hydrology. A detailed description of the field site is presented by Nielsen et al. [27]. Due to frequent flooding events [28], as well as the local land-use history, soil properties for the plots selected for soil sampling varied depending on the distance to ditches and the river (Table 1). Four samples were extracted from each of the four selected plots, resulting in a total of 16 samples included in the present study. BD for each sample was determined after complete desiccation at the end of the experimental period by dividing the desiccated weight of the peat samples by the volume of the cylindrical soil columns (1570.8 cm3). Following this, the samples were milled using a 2 mm mesh sieve for determination of soil organic matter (SOM) contents by loss on ignition (LOI), where a representative sub-sample of 7 g was ignited in a furnace at 550 °C for a duration of 5 h. A SOM to soil OC conversion factor of 0.58 was applied, based on the predominance of vascular plants in processes of peat formation for this study site [29]. Vegetation composition, pH, and the von Post degree of humification [30] were determined in situ during sampling. Factors of colour and silt were determined after desiccation of the soil samples at the end of the experiment, where simple and non-technical categorisation classifications were applied. For colour, ranges of 1–5 were applied, where 1 is light brown-grey and 5 is dark brown. Regarding silt, the absence (0) or presence (1) of particles was the sole determining factor. A picture of the dried samples is provided in the Supplementary Material (Figure S1).

2.3. Experimental Setup

The 16 samples were placed in boxes with porous ceramic bottom plates for controlled saturation and subsequent desaturation under laboratory conditions at a constant temperature of 20 °C. Following a saturation phase of 30 days, the samples were expected to be fully saturated.
In each sample, two TDR probes, point-sharpened steel rods of 20 cm in length and 4 mm in diameter, were installed at full saturation. The distance between probes was 2 cm, guided by an installation block [26] to ensure that the sampled area was well within the sample diameter [31,32]. The TDR system was set up to measure water content based on the default calibration for mineral soils [11] and probe impedance (Z) inversely correlated with sample electrical conductivity [33]. Water content and electrical conductivity were measured within identical soil volumes [34].
The θ, ε, Z, soil weight, and soil column volume were measured from the 15th of March 2022 to the 2nd of August 2022 on a total of 29 dates with increasing time intervals between measurements, depending on drainage rate. The soil samples were drained to soil water retention curve (pF) potentials of pF 1.3, 2, and 2.4 by applying vacuum desaturation by suctions of −20 cm, −100 cm, or −300 cm, respectively. After reaching pF 2.4, the soil samples were slowly oven dried for 14 days at 60 °C until fully desiccated.

2.4. Calibration and Site-Specific Calibration Model

Firstly, based on all gravimetric measurements of weight losses, the corrected water content (θcor) was derived after oven drying by applying a simple equation (Equation (1)), in which Wwet is the weight of the soil sample (in g) at i, the measurement campaign. Wdry is the desiccated weight (in g), BD is the bulk density of the dry peaty soil (in g−1 cm−3) and WD is the water density at a room temperature of 20 °C (=1 g−1 cm−3). The terms of the equation were multiplied by 100 in order to express θcor in percentage:
θ c o r = ( ( W w e t i W d r y ) /   W d r y ) × BD W D ) × 100
Following the correction of TDR measured θ to θcor, a third-order polynomial model with ε as the dependent variable (Equation (2)) was derived with regression coefficients for (1) the soil samples for each sub-plot of the study site (‘single’ calibration) and (2) across all samples (‘all-in-one’ calibration):
θ c o r = α + β 1 ( ε ) + β 2 ( ε 2 ) + β 3 ( ε 3 ) +
The results from both calibration approaches were compared in terms of accuracy. Further, applied to the dataset derived by this study, both calibration models were compared to previously published empirical calibration equations for organic soil [11,15,35,36] and the commonly applied calibration for mineral soil by Topp et al. [11], which also was applied during laboratory measurements of TDR.

2.5. Prediction of SOM-Derived Organic Carbon Contents from Measurements of ε, Z, and θcor

To assess the potential of TDR-derived measurements of ε, Z, and θ to determine contents of OC in peaty soil, the previously described laboratory-derived calibration equation was applied to a dataset of TDR-derived in situ measurements of ε, Z, and θ. These measurements had been performed in, at the most, biweekly intervals, amounting to a total of 35 occasions, between the 7th of April 2020 and the 4th of May 2021, at the same plots and sub-plots (total n = 16) of the previously described Vejrumbro study site used for the collection of soil samples for the laboratory-experiment regarding the site-specific calibration of θ.
First, measurements with θ > 100% (equivalent to ε > 81) due to inundation of the TDR probes were discarded and θ was corrected to θcor according to equations 1 and 2. This resulted in the inclusion of 496 out of 560 observations of ε, Z, and θcor. Later, this dataset of corrected θcor was used to explore the possibility for determining the OC content in peaty soil using TDR measurements.
In this context, an approach using generalised additive models (GAMs) had been chosen since GAMs allow for the combination of linear and non-linear relationships under variable-specific data-derived penalties [37,38,39]. This led to two different modelling approaches for the prediction of the OC content of peaty soil, based on:
(1)
ε and θcor, as well as a categorical predictor variable (Equation (3)), and
(2)
ε, θcor, and Z, as well as a categorical predictor variable (Equation (4)).
The different categorical predictor variables are described in Table 2.
O C i ~ N ( μ , σ 2 )   O C i = α + f 1 ( θ c o r i , ε i ) + β 1 ( C a t . v a r 1 ) + β 2 ( C a t . v a r 2 )   ,   ϵ i N ( μ ,   σ 2 )
O C i ~ N ( μ , σ 2 ) O C i = α + f 1 ( θ c o r i , ε i , Z i ) + β 1 ( C a t . v a r 1 ) + β 2 ( C a t . v a r 2 ) , ϵ i N ( μ ,   σ 2 )
In which OCi is the non-transformed predicted variable of organic carbon (OC); μ is the overall mean; and σ2 is the experimental error affected by f1, the penalised isotropic product smooth, representing the marginal effects and interaction of the corrected volumetric water content in peat (θcor) and the dielectric permittivity (ε), as well as (in Equation (4)) the probe impedance (Z), at the ith sample. β1 is the main categorical predictor variable (Cat.var1), indicating peat substrate quality, and β2 is the additional categorical predictor variable for peat substrate quality (Cat.var2).
All models were performed using a gaussian distribution and an identity link function in the mgcv package [40] in R [41], using restricted marginal likelihood (REML) for all coefficients and penalties. Model formulas can be found in Table S3. Prior to any model fitting, continuous and categorical variables were tested for collinearity and concurvity.
Firstly, for the modelling approach of OC, each of the GAMs presented in Equations (3) and (4) was fitted and trained based on the laboratory-derived dataset. Subsequently, the in situ-measured and corrected dataset of θcor was read into R. Lastly, the various model fitting functions were applied to this dataset in order to determine OC contents over the range of naturally occurring levels of water saturation in peat using the function “predict”.
All model performances were compared based on R2, the generalised cross-validation (GCV) score, and Akaike’s Information Criteria (AIC). The accuracy of model outputs was compared to laboratory-derived OC values and determined based on means and standard error.

3. Results and Discussion

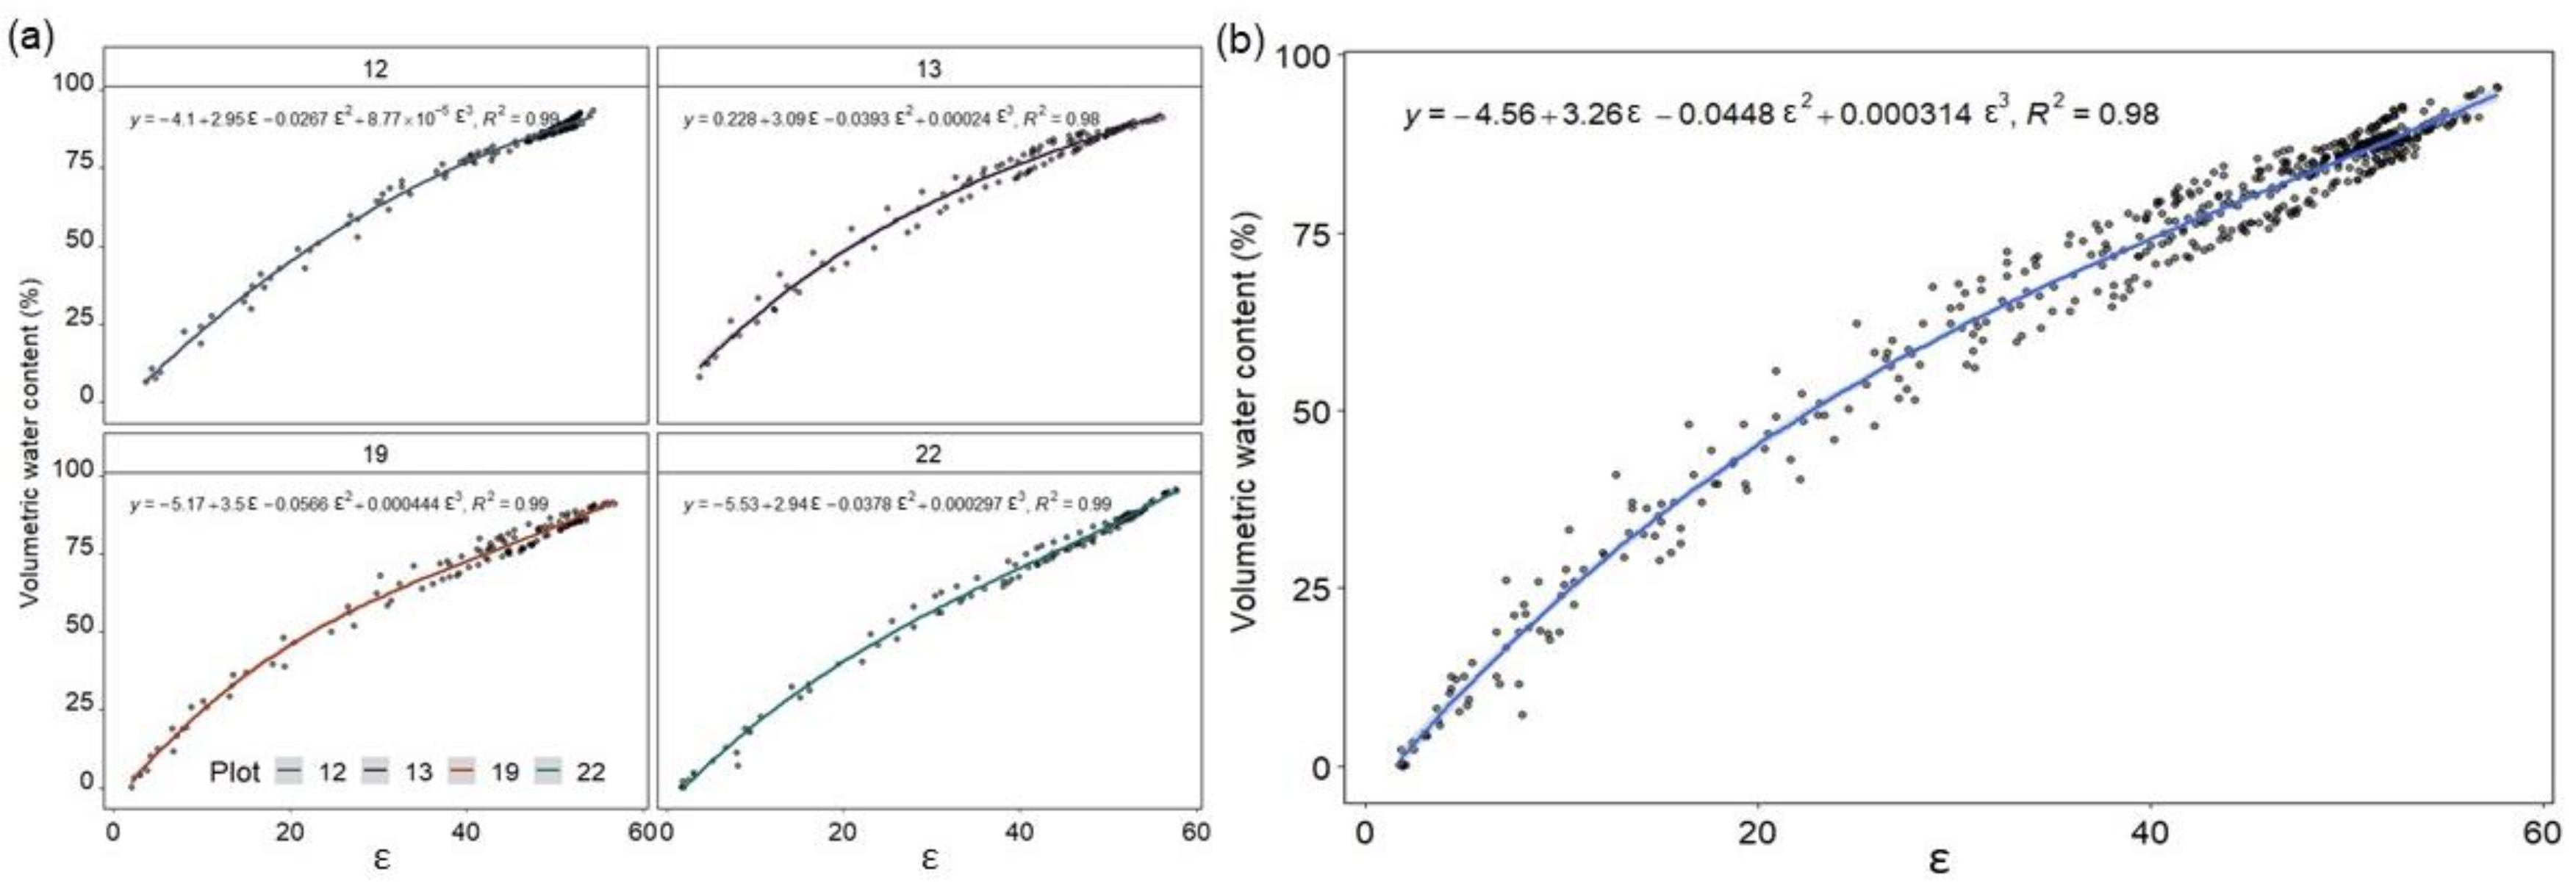
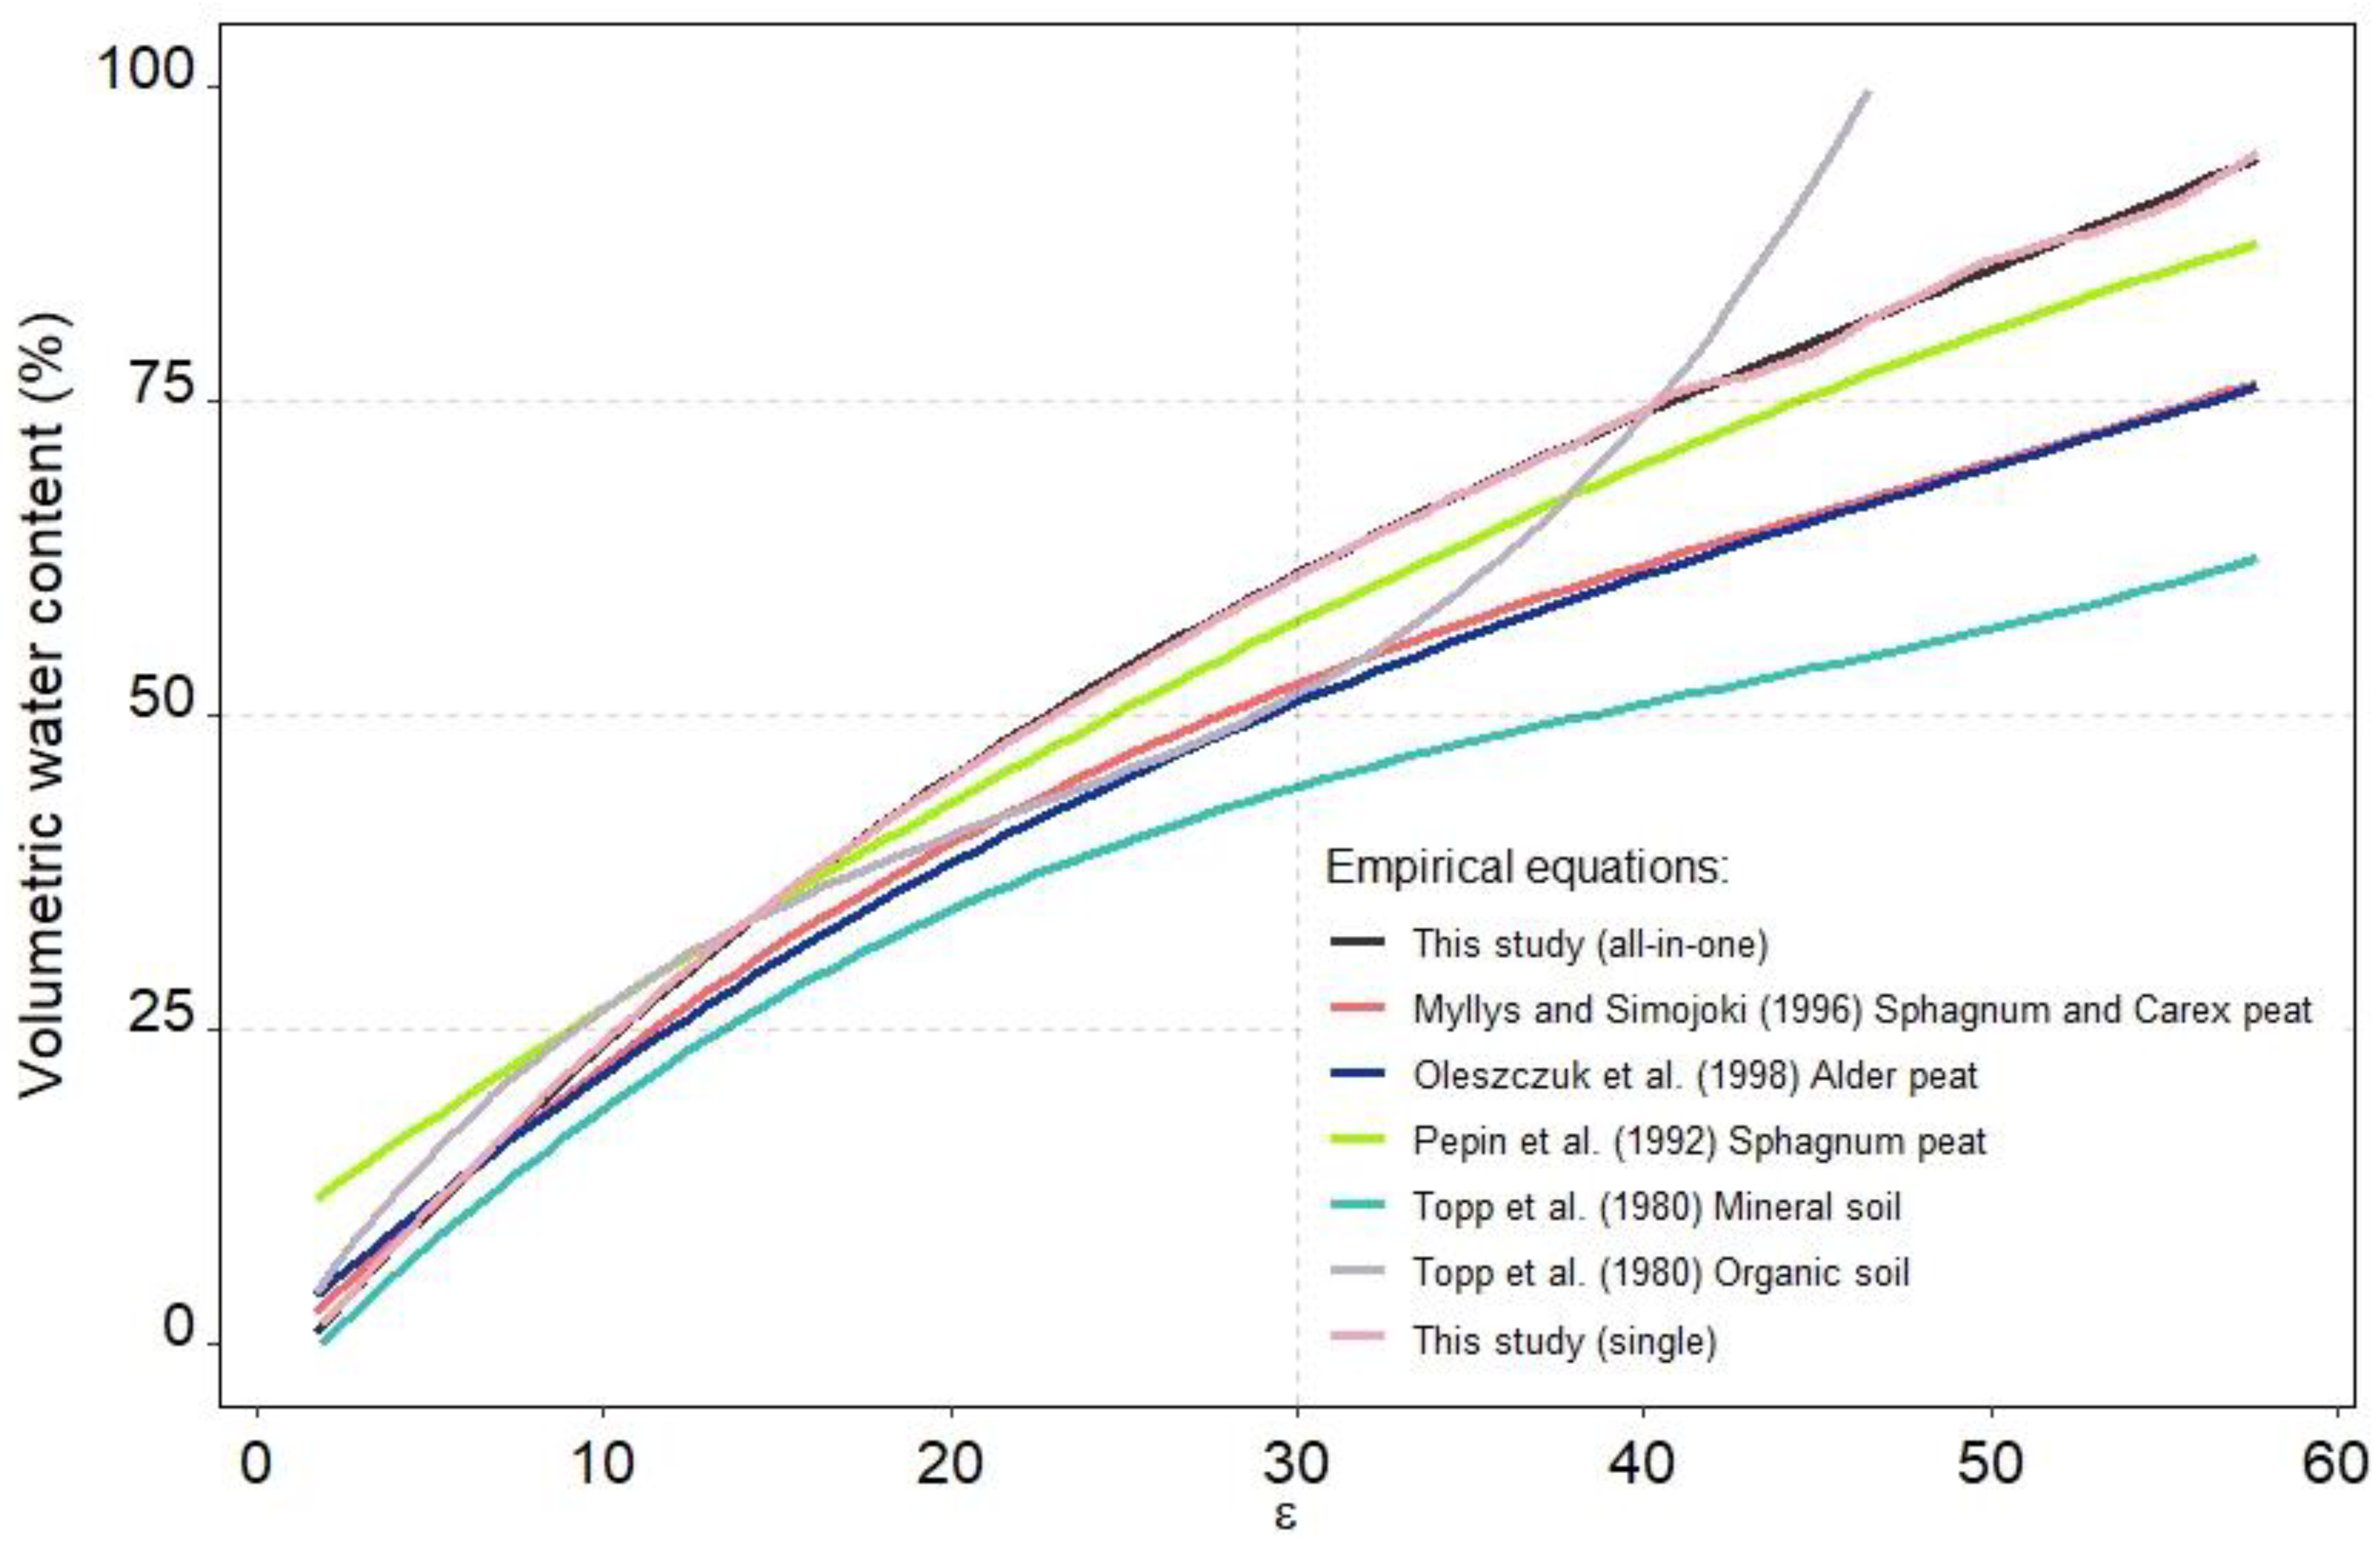
3.1. A Common Calibration Equation across Gradients of Organic Carbon Contents Is Feasible

The constants of the empirical calibration equations for θ differed for the plot-specific ‘single’ calibrations (Figure 1a), as also compared to the ‘all-in-one’ calibration across plots and, thus, peaty soil properties (Figure 1b). Oleszczuk et al. [13], who already compared different polynomial and square-root models for various organic soils, highlighted the observed differences between empirical constants for various calibration curves. However, despite differing constants, the application of both calibration options, ‘single’ and ‘all-in-one’, resulted in similar results. While there were differences between the relationships, especially for plots 13 and 22 (Figure 2a), and particularly at lower values of ε, these differences were not found when applying both calibration options across all plots and peaty soil properties (Figure 2b).
Given the differences in peat quality, as indicated by proxies for peat degradation and the silt content resulting from flooding, the observed results are contrary to the previously found importance of including OC in the calibration. For instance, Szypłowska et al. [18] highlighted the importance of SOM for dielectric calibration models across different soil types. Contrary to this, and in line with the presented results, it was found [42] that a common calibration model across soil properties could be applied if true peaty soils were excluded.
When applying different calibration models to the data derived by this study, it was found that the empirical calibration models from this study resulted in higher contents of θ compared to other published equations (Figure 3). For instance, applying the empirical equation for sphagnum peat by Pepin et al. [15] on this data set resulted in an underestimation of θ from ε > 15, further on deviating parallel to θ derived in this study.
The equations presented by Myllys and Simojoki [35] and Oleszczuk et al. [36], calibrated on sphagnum and carex, and alder peat, respectively, resulted in similar values for θ. However, compared to the results derived in this study, these were underestimating θ by up to 10%. Furthermore, while the calibration model for organic soil by Topp et al. [11] resulted in unrealistic values for ε > 30, the commonly applied mineral soil calibration [11] significantly underestimated θ throughout the range of ε, even at near-dry conditions. While this is not a new finding [16,17], it highlights again the need for applying specific calibration equations for an accurate determination of θ in peaty soils.
Based on the results observed for the heterogeneous fen peatland site at Vejrumbro, the application of a common calibration model (‘all-in-one’) was found to be feasible for the whole range of water saturation. The comparison to other calibration equations showed that conditions of changing soil moisture contents, commonly occurring in peatland environments due to fluctuating water tables, cannot be accurately captured by TDR without local calibration. In this context, in peaty soils with differing peat properties, a large discrepancy between TDR measured and corrected θ was found, confirming the need for a site-specific calibration, particularly compared to the common Topp equations for both mineral and organic soils [11]. Previously, the threshold for the application of standard calibration models for peaty soil was reported to be around ε = 40 [14]. However, for the observed differences between θ and θcor, the threshold for the Vejrumbro field site was significantly lower, starting at ε < 5 for all calibration methods, except for plot 22, where a threshold of ε = 10 was found (Figures S2 and S3). In all cases, the non-calibrated TDR measurements underestimated θ by up to 25%.

3.2. Organic Carbon Contents Can Be Determined Using TDR

There is an increasing need for mapping peatland areas regarding their OC content due to associated greenhouse gas emission factors [43]. Resulting from the above observations, the possibility of determining the OC content of peaty soils based on measurements of ε, Z, and θcor was explored. In this context, various GAM approaches were tested, either including or excluding measurements of Z. Based on solely ε and θ (model WK), predicted values of OC for the various plots were equal (Figure S4), and model performances were low (R2 = 0.19, Table 3). The inclusion of Z (model WKI) resulted in more differentiated model outputs regarding the predicted OC (Figure S5), but the model accuracy remained low (R2 = 0.35, Table 4) with a high deviation to the actual values (Tables S1 and S2). Gnatowski et al. [21] highlighted the importance of bioindices for advancing the understanding of hydro-biogeochemical processes in peaty soils. In line with this observation, it was found that an accurate prediction of the OC of peaty soils was possible when including a categorical variable indicating the peat substrate quality based on simple classifications that can be performed in situ. For instance, including the categorical variables of peat colour (model WKC/WKCI), von Post humification scale (model WKvP/WKvPI), or a combination of peat colour and vegetation (helophyte vs. graminid predominance; model WKCV/WKCVI) performed equally well (R2 = 0.94 at 99.6% deviance explained) for both model approaches, including and excluding Z. However, despite the equally good model performance, the models including Z and based on the categorical predictor variables of von Post (WKvPI), as well as colour and vegetation (WKCVI), resulted in the smallest deviation from actual OC values, corresponding to ±1.2 % across all plots and levels of water saturation. The importance of Z for accurate predictions of OC was shown by comparing models WKvP and WKvPI. While both models resulted in a constant estimation of OC until an approximate threshold of ε = 54 or θ = 90%, independent of water saturation, the WKvPI model resulted in more differentiated OC estimations (Figure 4). Nonetheless, despite the good performance of the WKvPI, WKCI, and WKCVI models, it needs to be considered that the determination of OC was performed indirectly via the conversion of LOI-derived SOM.
Interestingly, the inclusion of BD as a categorical variable, frequently mentioned as a variable of key importance, e.g., [12,44,45], did not result in improved model predictions as compared to in situ assessable bioindices. Considering that laboratory-derived categorical variables are not practical for in situ mapping of OC contents [46], our results highlight the potential for easily field-obtainable variables. Since the models including colour, colour and vegetation, and von Post scales performed equally well, further elaboration of validity for these model approaches, in particular including Z and von Post or colour and vegetation, is advocated. However, while a commonly applied method, the von Post scale is a subjective method, having its drawbacks regarding the consistent interpretation of peat humification across adopters. Nonetheless, its applicability as a tool for in situ grading of peat humification by the same adopter has validity if the intention of usage is not as a definite determination. For accurate validation of the degree of peat humification, other chemical parameters, e.g., the H/C atomic ratio [47], have shown to be more reliable proxies.
Previously, Thomsen et al. [33] introduced a vehicle-mounted mobile TDR system, able to map ε and θ for areas between 15–30 ha within 8 h, depending on the density of measurements. As also highlighted by He et al. [8], it was found in this study that TDR systems are capable of providing additional information regarding soil properties beyond its common application in determining θ. However, to enhance the applicability over a broader range of peaty soil types and grades of decomposition, it is critical to improve both the calibration and models by a larger number of samples. In this context, further elaboration of the potential for TDR-based mapping of OC within organic soils can provide an efficient pathway to map critical soil properties rapidly and accurately over naturally heterogeneous areas. However, a standardisation of approaches for defining peat quality indicators (colour, silt, von Post) is critical to minimising the issue of subjectivity, potentially compromising the general applicability of the OC models.

4. Summary and Conclusions

A site-specific calibration model for ε, measured by TDR, was developed to accurately determine θ for a heterogenous fen peatland in the Nørre Å Valley, Denmark, across differences in peat decomposition and organic carbon content. Comparing plot-specific and whole-site calibrations based on third-order polynomial regression resulted in similar results. The application of other established empirical calibrations for organic soils to this dataset resulted in underestimations of θ, ranging on average between 25% [11] to 3% [15] across ranges of ε above the threshold of ε = 15. Based on the calibration results, the possibility of determining differences in the heterogeneous OC content of peaty soil, as derived by the conversion from SOM by empirical models based on the corrected θ (θcor), ε, electrical impedance (Ζ), and a categorical predictor variable based on bioindices, was explored by applying GAMs. For all models, the inclusion of Z as a categorical predictor variable resulted in more differentiated results regarding the predicted OC content. Of all categorial predictor variables trialled, the models including the von Post scale of humification predicted the content of OC across all plots and levels of water saturation with good performance (R2 = 0.94), resulting in a deviation of ±1.2 % OC for the predicted values compared to measured OC contents over a total of 496 measurements. In conclusion, despite the need for further model development under consideration of additional samples across gradients of peat substrate quality, a strong indication for the possibility of determining OC in peatlands in situ with TDR systems by the application of a site-specific calibration model of θ together with indices of peat degradation was found.

Supplementary Materials

The following supporting information can be downloaded at: https://www.mdpi.com/article/10.3390/soilsystems7010010/s1, Figure S1: Picture of the dried peat samples; Figure S2: Difference between measured and corrected water contents across plots; Figure S3: Difference between measured and corrected water contents for each plot; Figure S4: 3D plot of the WK model; Figure S5: 3D plot of the WKI model; Figures S6–S13: Graphical outputs of the generalised additive models excluding impedance (models WK–WKBD); Table S1: Organic carbon contents as predicted by the models excluding impedance; Table S2: Organic carbon contents as predicted by the models including impedance; Table S3: Code formulas used for the prediction of organic carbon contents.

Author Contributions

C.K.N. developed and performed the study design and experimental work, the data analysis, and the manuscript’s writing. A.G.T. contributed to the study design, the writing and reading of the manuscript, and approved the final manuscript. All authors have read and agreed to the published version of the manuscript.

Funding

CN received funding by the European Union’s Horizon 2020 research and innovation programme under grant agreement no. 696356, the Aarhus University Center for Circular Bioeconomy, and by the European Union’s Horizon Europe programme (WET HORIZONS, grant agreement no. 101056848).

Institutional Review Board Statement

Not applicable.

Informed Consent Statement

Not applicable.

Data Availability Statement

The raw data supporting the conclusions of this article will be made available by the authors without undue reservation.

Acknowledgments

The authors would like to thank Michael Koppelgaard and Jørgen Nielsen for their excellent assistance with soil sampling and lab experimental setup. Further, we’d like to thank Triven Koganti for giving feedback on the manuscript draft.

Conflicts of Interest

The authors declare that the research was conducted without any commercial or financial relationships that could be construed as a potential conflict of interest.

References

  1. Van den Pol-van Dasselaar, A.; Van Beusichem, M.L.; Oenema, O. Effects of soil moisture content and temperature on methane uptake by grasslands on sandy soils. Plant Soil 1998, 204, 213–222. [Google Scholar] [CrossRef]
  2. Panday, D.; Nkongolo, N.V. Effect of Soil Air and Water on Greenhouse Gases Emissions in a Corn-Soybean Rotation. Procedia Environ. Sci. 2015, 29, 293–294. [Google Scholar] [CrossRef]
  3. Evans, C.D.; Peacock, M.; Baird, A.J.; Artz, R.R.E.; Burden, A.; Callaghan, N.; Chapman, P.J.; Cooper, H.M.; Coyle, M.; Craig, E.; et al. Overriding water table control on managed peatland greenhouse gas emissions. Nature 2021, 593, 548–552. [Google Scholar] [CrossRef] [PubMed]
  4. Wessolek, G.; Schwärzel, K.; Renger, M.; Sauerbrey, R.; Siewert, C. Soil hydrology and CO2 release of peat soils. J. Plant Nutr. Soil Sci. 2002, 165, 494–500. [Google Scholar] [CrossRef]
  5. Kluge, B.; Wessolek, G.; Facklam, M.; Lorenz, M.; Schwärzel, K. Long-term carbon loss and CO2-C release of drained peatland soils in northeast Germany. Eur. J. Soil Sci. 2008, 59, 1076–1086. [Google Scholar] [CrossRef]
  6. Topp, G.C.; Ferre, P.A. Measuring Water Content in Soil using TDR: A state-of-the-art in 1998 (1011-4289). International Atomic Energy Agency (IAEA): 2000. Available online: http://inis.iaea.org/search/search.aspx?orig_q=RN:31014390 (accessed on 13 October 2022).
  7. Calamita, G.; Brocca, L.; Perrone, A.; Piscitelli, S.; Lapenna, V.; Melone, F.; Moramarco, T. Electrical resistivity and TDR methods for soil moisture estimation in central Italy test-sites. J. Hydrol. 2012, 454–455, 101–112. [Google Scholar] [CrossRef]
  8. He, H.; Aogu, K.; Li, M.; Xu, J.; Sheng, W.; Jones, S.B.; González-Teruel, J.D.; Robinson, D.A.; Horton, R.; Bristow, K.; et al. A review of time domain reflectometry (TDR) applications in porous media. Adv. Agron. 2021, 168, 83–155. [Google Scholar] [CrossRef]
  9. Malicki, M.A.; Kotliński, J. Dielectric determination of moisture of cereals grain using time domain reflectometry. Int. Agrophysics 1998, 12, 209–215. [Google Scholar]
  10. Platt, I.G.; Woodhead, I.; Richards, S.; Tan, A.; Hagedorn, M.; Herrington, P.; Cook, S. Time Domain Reflectometry Measurements of Road Basecourse Moisture Content. Int. J. Smart Sens. Intell. Syst. 2014, 7, 1–5. [Google Scholar] [CrossRef]
  11. Topp, G.C.; Davis, J.L.; Annan, A.P. Electromagnetic determination of soil water content: Measurements in coaxial transmission lines. Water Resour. Res. 1980, 16, 574–582. [Google Scholar] [CrossRef]
  12. Jacobsen, O.H.; Schjønning, P. A laboratory calibration of time domain reflectometry for soil water measurement including effects of bulk density and texture. J. Hydrol. 1993, 151, 147–157. [Google Scholar] [CrossRef]
  13. Oleszczuk, R.; Brandyk, T.; Gnatowski, T.; Szatyłowicz, J. Calibration of TDR for moisture determination in peat de-posits. Int. Agrophysics 2004, 18, 145–151. [Google Scholar]
  14. Dettmann, U.; Bechtold, M. Evaluating Commercial Moisture Probes in Reference Solutions Covering Mineral to Peat Soil Conditions. Vadose Zone J. 2018, 17, 1–6. [Google Scholar] [CrossRef]
  15. Pepin, S.; Plamondon, A.P.; Stein, J. Peat water content measurement using time domain reflectometry. Can. J. For. Res. 1992, 22, 534–540. [Google Scholar] [CrossRef]
  16. Kritz, G.; Khaled, T. Water Content Determination with TDR in Peat Substrates. Acta Hortic. 2004, 644, 313–317. [Google Scholar] [CrossRef]
  17. Singh, J.; Lo, T.; Rudnick, D.; Irmak, S.; Blanco-Canqui, H. Quantifying and correcting for clay content effects on soil water measurement by reflectometers. Agric. Water Manag. 2019, 216, 390–399. [Google Scholar] [CrossRef]
  18. Szypłowska, A.; Lewandowski, A.; Yagihara, S.; Saito, H.; Furuhata, K.; Szerement, J.; Kafarski, M.; Wilczek, A.; Majcher, J.; Woszczyk, A.; et al. Dielectric models for moisture determination of soils with variable organic matter content. Geoderma 2021, 401, 115288. [Google Scholar] [CrossRef]
  19. Hossain, M.; Chen, W.; Zhang, Y. Bulk density of mineral and organic soils in the Canada’s arctic and sub-arctic. Inf. Process. Agric. 2015, 2, 183–190. [Google Scholar] [CrossRef]
  20. Zaccone, C.; D’Orazio, V.; Shotyk, W.; Miano, T.M. Chemical and spectroscopic investigation of porewater and aqueous extracts of corresponding peat samples throughout a bog core (Jura Mountains, Switzerland). J. Soils Sediments 2009, 9, 443–456. [Google Scholar] [CrossRef]
  21. Gnatowski, T.; Szatyłowicz, J.; Pawluśkiewicz, B.; Oleszczuk, R.; Janicka, M.; Papierowska, E.; Szejba, D. Field Cali-bration of TDR to Assess the Soil Moisture of Drained Peatland Surface Layers. Water 2018, 10, 1842. [Google Scholar] [CrossRef]
  22. Kimmel, K.; Mander, Ü. Ecosystem services of peatlands: Implications for restoration. Prog. Phys. Geogr. Earth Environ. 2010, 34, 491–514. [Google Scholar] [CrossRef]
  23. Zak, D.; McInnes, R.J. A call for refining the peatland restoration strategy in Europe. J. Appl. Ecol. 2022, 59, 2698–2704. [Google Scholar] [CrossRef]
  24. Young, D.M.; Baird, A.J.; Morris, P.J.; Holden, J. Simulating the long-term impacts of drainage and restoration on the ecohydrology of peatlands. Water Resour. Res. 2017, 53, 6510–6522. [Google Scholar] [CrossRef]
  25. Minasny, B.; Berglund, Ö.; Connolly, J.; Hedley, C.; de Vries, F.; Gimona, A.; Kempen, B.; Kidd, D.; Lilja, H.; Malone, B.; et al. Digital mapping of peatlands—A critical review. Earth-Sci. Rev. 2019, 196, 102870. [Google Scholar] [CrossRef]
  26. Thomsen, A. ManTDR Software for Making Manual TDR Measurements. Intern. Rep. Plant Prod. 2006. Available online: https://dcapub.au.dk/djfpdf/intrma3.pdf (accessed on 29 September 2022).
  27. Nielsen, C.K.; Stødkilde, L.; Jørgensen, U.; Lærke, P.E. Effects of Harvest and Fertilization Frequency on Protein Yield and Extractability from Flood-Tolerant Perennial Grasses Cultivated on a fen Peatland. Front. Environ. Sci. 2021, 9, 619258. [Google Scholar] [CrossRef]
  28. Malinowski, R.; Groom, G.; Schwanghart, W.; Heckrath, G. Detection and Delineation of Localized Flooding from WorldView-2 Multispectral Data. Remote Sens. 2015, 7, 14853–14875. [Google Scholar] [CrossRef]
  29. Klingenfuß, C.; Roßkopf, N.; Walter, J.; Heller, C.; Zeitz, J. Soil organic matter to soil organic carbon ratios of peatland soil substrates. Geoderma 2014, 235, 410–417. [Google Scholar] [CrossRef]
  30. von Post, L. Sveriges Geologiska Undersöknings Torvinventering och Några av dess Hittills Vunna Resultat; Svenska Mosskulturföreningens Tidskrift: Jönköping, Sweden, 1992; pp. 1–27. [Google Scholar]
  31. Petersen, L.W.; Thomsen, A.; Moldrup, P.; Jacobsen, O.H.; Rolston, D.E. High-resolution time domain reflectrometry: Sensitivity dependency on probe-design. Soil Sci. 1995, 159, 149–154. [Google Scholar] [CrossRef]
  32. Evett, S. The Tacq Computer Program for Automatic Time Domain Reflectometry Measurements: II. Waveform Interpretation Methods. Trans. ASAE 2000, 43, 1947–1956. [Google Scholar] [CrossRef]
  33. Thomsen, A.; Schelde, K.; Drøscher, P.; Steffensen, F. Mobile TDR for geo-referenced measurement of soil water content and electrical conductivity. Precis. Agric. 2007, 8, 213–223. [Google Scholar] [CrossRef]
  34. Dalton, F.; Van Genuchten, M. The time-domain reflectometry method for measuring soil water content and salinity. Geoderma 1986, 38, 237–250. [Google Scholar] [CrossRef]
  35. Myllys, M.; Simojoki, A.J.S. Calibration of time domain reflectometry (TDR) for soil moisture measurements in cultivated peat soils. Suo 1996, 47, 1–6. [Google Scholar]
  36. Oleszczuk, R.; Brandyk, T.; Szatylowicz, J. Analiza możliwości zastosowania metody TDR do pomiaru uwilgotnienia w glebie torfowo-murszowej. Zesz. Probl. Postępów Nauk. Rol. 1998, 458, 263–274. [Google Scholar]
  37. Marra, G.; Wood, S.N. Practical variable selection for generalized additive models. Comput. Stat. Data Anal. 2011, 55, 2372–2387. [Google Scholar] [CrossRef]
  38. Wood, S.N. Fast stable restricted maximum likelihood and marginal likelihood estimation of semiparametric generalized linear models. J. R. Stat. Soc. Ser. B (Stat. Methodol.) 2010, 73, 3–36. [Google Scholar] [CrossRef]
  39. Wood, S.N.; Pya, N.; Säfken, B. Smoothing Parameter and Model Selection for General Smooth Models. J. Am. Stat. Assoc. 2016, 111, 1548–1563. [Google Scholar] [CrossRef]
  40. Wood, S.N. Mgcv: Mixed Gam Computation Vehicle with Automatic Smoothness Estimation. R Package Version 1.8-41. 2022. Available online: https://cran.r-project.org/web/packages/mgcv/mgcv.pdf (accessed on 11 November 2022).
  41. R Core Team. R: A Language and Environment for Statistical Computing; R Foundation for Statistical Computing: Vienna, Austria, 2019; Available online: https://www.R-project.org/ (accessed on 3 October 2022).
  42. Li, B.; Wang, C.; Gu, X.; Zhou, X.; Ma, M.; Li, L.; Feng, Z.; Ding, T.; Li, X.; Jiang, T.; et al. Accuracy calibration and evaluation of capacitance-based soil moisture sensors for a variety of soil properties. Agric. Water Manag. 2022, 273, 107913. [Google Scholar] [CrossRef]
  43. Qiu, C.; Ciais, P.; Zhu, D.; Guenet, B.; Peng, S.; Petrescu, A.M.R.; Lauerwald, R.; Makowski, D.; Gallego-Sala, A.V.; Charman, D.J.; et al. Large historical carbon emissions from cultivated northern peatlands. Sci. Adv. 2021, 7, eabf1332. [Google Scholar] [CrossRef]
  44. Ju, Z.; Liu, X.; Liu, X. An Improved Calibration Determining Soil Bulk Density with Time Domain Reflectometry. Commun. Soil Sci. Plant Anal. 2013, 44, 1072–1079. [Google Scholar] [CrossRef]
  45. Thring, L.; Boddice, D.; Metje, N.; Curioni, G.; Chapman, D.; Pring, L. Factors affecting soil permittivity and proposals to obtain gravimetric water content from time domain reflectometry measurements. Can. Geotech. J. 2014, 51, 1303–1317. [Google Scholar] [CrossRef]
  46. Greenberg, I.; Seidel, M.; Vohland, M.; Koch, H.-J.; Ludwig, B. Performance of in situ vs laboratory mid-infrared soil spectroscopy using local and regional calibration strategies. Geoderma 2022, 409, 115614. [Google Scholar] [CrossRef]
  47. Zaccone, C.; Plaza, C.; Ciavatta, C.; Miano, T.M.; Shotyk, W. Advances in the determination of humification degree in peat since: Applications in geochemical and paleoenvironmental studies. Earth-Sci. Rev. 2018, 185, 163–178. [Google Scholar] [CrossRef]
Figure 1. (a) Plot-based (‘single) and (b) whole-site (‘all-in-one’) calibration curves for the volumetric water content (%) and the electric permittivity (ε), including regression coefficients for the various third-order polynomial models.
Soilsystems 07 00010 g001
Figure 2. Plot-based (‘single’, brown) vs. whole-site (‘all-in-one’, blue) calibration outcomes and performance as compared to the corrected and measured values for (a) individual plot and (b) across plots.
Soilsystems 07 00010 g002
Figure 3. Comparison of previously published third-order polynomial equations for calibration of TDR measured volumetric water content (%), of organic soils. All equations (and their constants) were applied to the dataset derived in this study, with this study’s calibrations as reference. Faded red dashed lines indicate θ of 25, 50, and 75 %. ε is the dielectric permittivity. The faded blue dashed line indicates ε = 30 [11,15,35,36].
Soilsystems 07 00010 g003
Figure 4. 3D plot of the organic carbon (OC) model outputs from (a) the water content and von Post (WKvP) model, and (b) the water content with von Post under inclusion of impedance (WKvPI) model. The y-axes indicate the modelled OC contents, while the x-axes show the corrected volumetric water content in %. The z-axes show the dielectric permittivity (ε). Coloured dots indicate different plots, each comprising the four replicates per plot. All 3D plots are available as an interactive version online (link in Supplementary Material).
Soilsystems 07 00010 g004
Table 1. Plot-specific and site-averaged soil properties, showing bulk density (BD), the organic carbon content (OC), pH, the von Post degree of humification, and the dominating vegetation type.
PlotDistance to River (m)Distance to Ditch (m)BD
(g cm−3)
OC (%)pHColourSiltVon PostVegetation (Dominating)
12136120.32344.74.9403Holcus lanatus
1399720.35626.85.7215Phalaris arundinacea
1980450.34423.96.0215Phalaris arundinacea
2252590.31636.86.2314Phalaris arundinacea
Site average: 0.33633.15.72.80.84.2Varying
Table 2. Generalised additive models (GAM) tested for the prediction of organic carbon content. The model names are a combination of the continuous and categorical variables included, as indicated by abbreviations in brackets in the model equations. θcor (W) is the, by Equations (1) and (2), corrected volumetric water content in peaty soil, ε (K) is the dielectric permittivity, and Z (I) is the probe impedance.
Model NameContinuous Variables Included
(Smooth Terms)
Categorical Variables Included
(Parametric Coefficients)
WKθcor (W), ε (K)-
WKVθcor (W), ε (K)Vegetation (V)
WKDθcor (W), ε (K)Distance to river and ditch (D)
WKSθcor (W), ε (K)Silt content (S)
WKCθcor (W), ε (K)Peat colour (C)
WKCVθcor (W), ε (K)Peat colour + Vegetation (CV)
WKvPθcor (W), ε (K)Von Post scale of humification (vP)
WKBDθcor (W), ε (K)Bulk density (BD)
WKIθcor (W), ε (K), Z (I)-
WKVIθcor (W), ε (K), Z (I)Vegetation (V)
WKDIθcor (W), ε (K), Z (I)Distance to river and ditch (D)
WKSIθcor (W), ε (K), Z (I)Silt content (S)
WKCIθcor (W), ε (K), Z (I)Peat colour (C)
WKCVIθcor (W), ε (K), Z (I)Peat colour + Vegetation (CV)
WKvPIθcor (W), ε (K), Z (I)Von Post scale of humification (vP)
WKBDIθcor (W), ε (K), Z (I)Bulk density (BD)
Table 3. Generalised additive models explored to predict the content of organic carbon at Vejrumbro based on in situ measurements of dielectric permittivity (ε = K) and the corrected volumetric water content (θcor = W) as interacting smooth terms and different categorical (parametric) variables. Bold letters denote components in model names. Full model performances are provided in the Figure material.
WKWKVWKDWKSWKCWKCVWKvPWKBD
Smooth terms:
ε * θcor p < 0.001p < 0.001p < 0.001p < 0.001p < 0.001p < 0.001p < 0.001p < 0.001
Parametric coefficients:
Vegetation (V) p < 0.001
Distance (D) p < 0.001
Silt (S) p < 0.001
Colour (C) p < 0.001
Colour * Vegetation (CV) p < 0.001
von Post (vP) p < 0.001
Bulk density (BD) p < 0.001
R2 0.1920.7330.5260.7330.9390.9390.9390.544
Deviance explained (%)95.498.597.498.599.699.699.697.5
GCV 63.021.738.521.74.64.64.636.7
AIC 3350.52835.13109.32835.12096.82096.82096.83088.5
Table 4. Generalised additive models explored to predict the content of organic carbon at Vejrumbro based on in situ measurements of dielectric permittivity (ε = K) and the corrected volumetric water content (θcor = W) as interacting smooth terms, measured impedance (Z = I), and different categorical (parametric) variables. Bold letters denote components in model names. Full model performances are provided in the Supplementary Material (Figures S6–S13).
WKIWKVIWKDIWKSIWKCIWKCVIWKvPIWKBDI
Smooth terms:
ε * θcor p < 0.001p < 0.001p < 0.001p < 0.001p < 0.001p < 0.001p < 0.001p < 0.001
Parametric coefficients:
Impedance (I) p < 0.001p < 0.01p < 0.001p < 0.01p < 0.05p < 0.05p < 0.05p < 0.001
Vegetation (V) p < 0.001
Distance (D) p < 0.001
Silt (S) p < 0.001
Colour (C) p < 0.001
Colour * Vegetation (CV) p < 0.001
von Post (vP) p < 0.001
Bulk density (BD) p < 0.001
R2 0.3490.7290.5640.7290.9390.9390.9390.625
Deviance explained (%)96.398.597.598.599.699.699.697.9
GCV 50.821.4134.421.44.64.64.630.3
AIC 3247.12831.23058.42831.22096.12096.12096.12995.7
Disclaimer/Publisher’s Note: The statements, opinions and data contained in all publications are solely those of the individual author(s) and contributor(s) and not of MDPI and/or the editor(s). MDPI and/or the editor(s) disclaim responsibility for any injury to people or property resulting from any ideas, methods, instructions or products referred to in the content.

