Article

Challenges in the Management of Environmentally Fragile Sandy Soils in Southern Brazil

by
Luis Eduardo Akiyoshi Sanches Suzuki
1,*,
Fabrício de Araújo Pedron
2,
Rodrigo Bomicieli de Oliveira
3 and
Ana Paula Moreira Rovedder
2
1
Center of Technological Development, Federal University of Pelotas, Pelotas 96010-610, RS, Brazil
2
Rural Sciences Center, Federal University of Santa Maria, Santa Maria 97105-9000, RS, Brazil
3
EMATER/RS-ASCAR, Restinga Seca 97200-000, RS, Brazil
*
Author to whom correspondence should be addressed.
Soil Syst. 2023, 7(1), 9; https://doi.org/10.3390/soilsystems7010009
Submission received: 14 December 2022 / Revised: 26 January 2023 / Accepted: 30 January 2023 / Published: 2 February 2023
(This article belongs to the Special Issue Research on Soil Management and Conservation)

Abstract

:
Quartzipsamments are environmentally fragile soils, being highly susceptible to water and wind erosion. Despite this, it seems that political and economic issues favor the advancement of agriculture in these soils. Therefore, studies are necessary for a better understanding of these soils and to minimize the impacts of land use. This work aims to characterize the morphological, physical–hydric, and chemical properties of Quartzipsamments under sandyzation in southwest Rio Grande do Sul State, Brazil. Soil morphology was evaluated in six profiles in areas under native field with the presence of gullies, and soil samples with preserved and non-preserved structures were collected to evaluate the physical–hydric and chemical properties. We verified that these soils have high macroporosity (0.253 to 0.373 m3 m−3) and saturated hydraulic conductivity (127.85 to 672.26 mm h−1), and predominantly low organic matter (0.05 to 2.36%) and clay (23.03 to 126.29 g kg−1) content, but correlation analysis showed that increasing pH and organic matter can improve the fertility of these soils. Quartzipsamments have a low volume of available water to plants (0.006 to 0.038 m3 m−3) and have a potential risk of leaching and aquifer contamination. The use of these soils demands the adoption of conservation practices.

1. Introduction

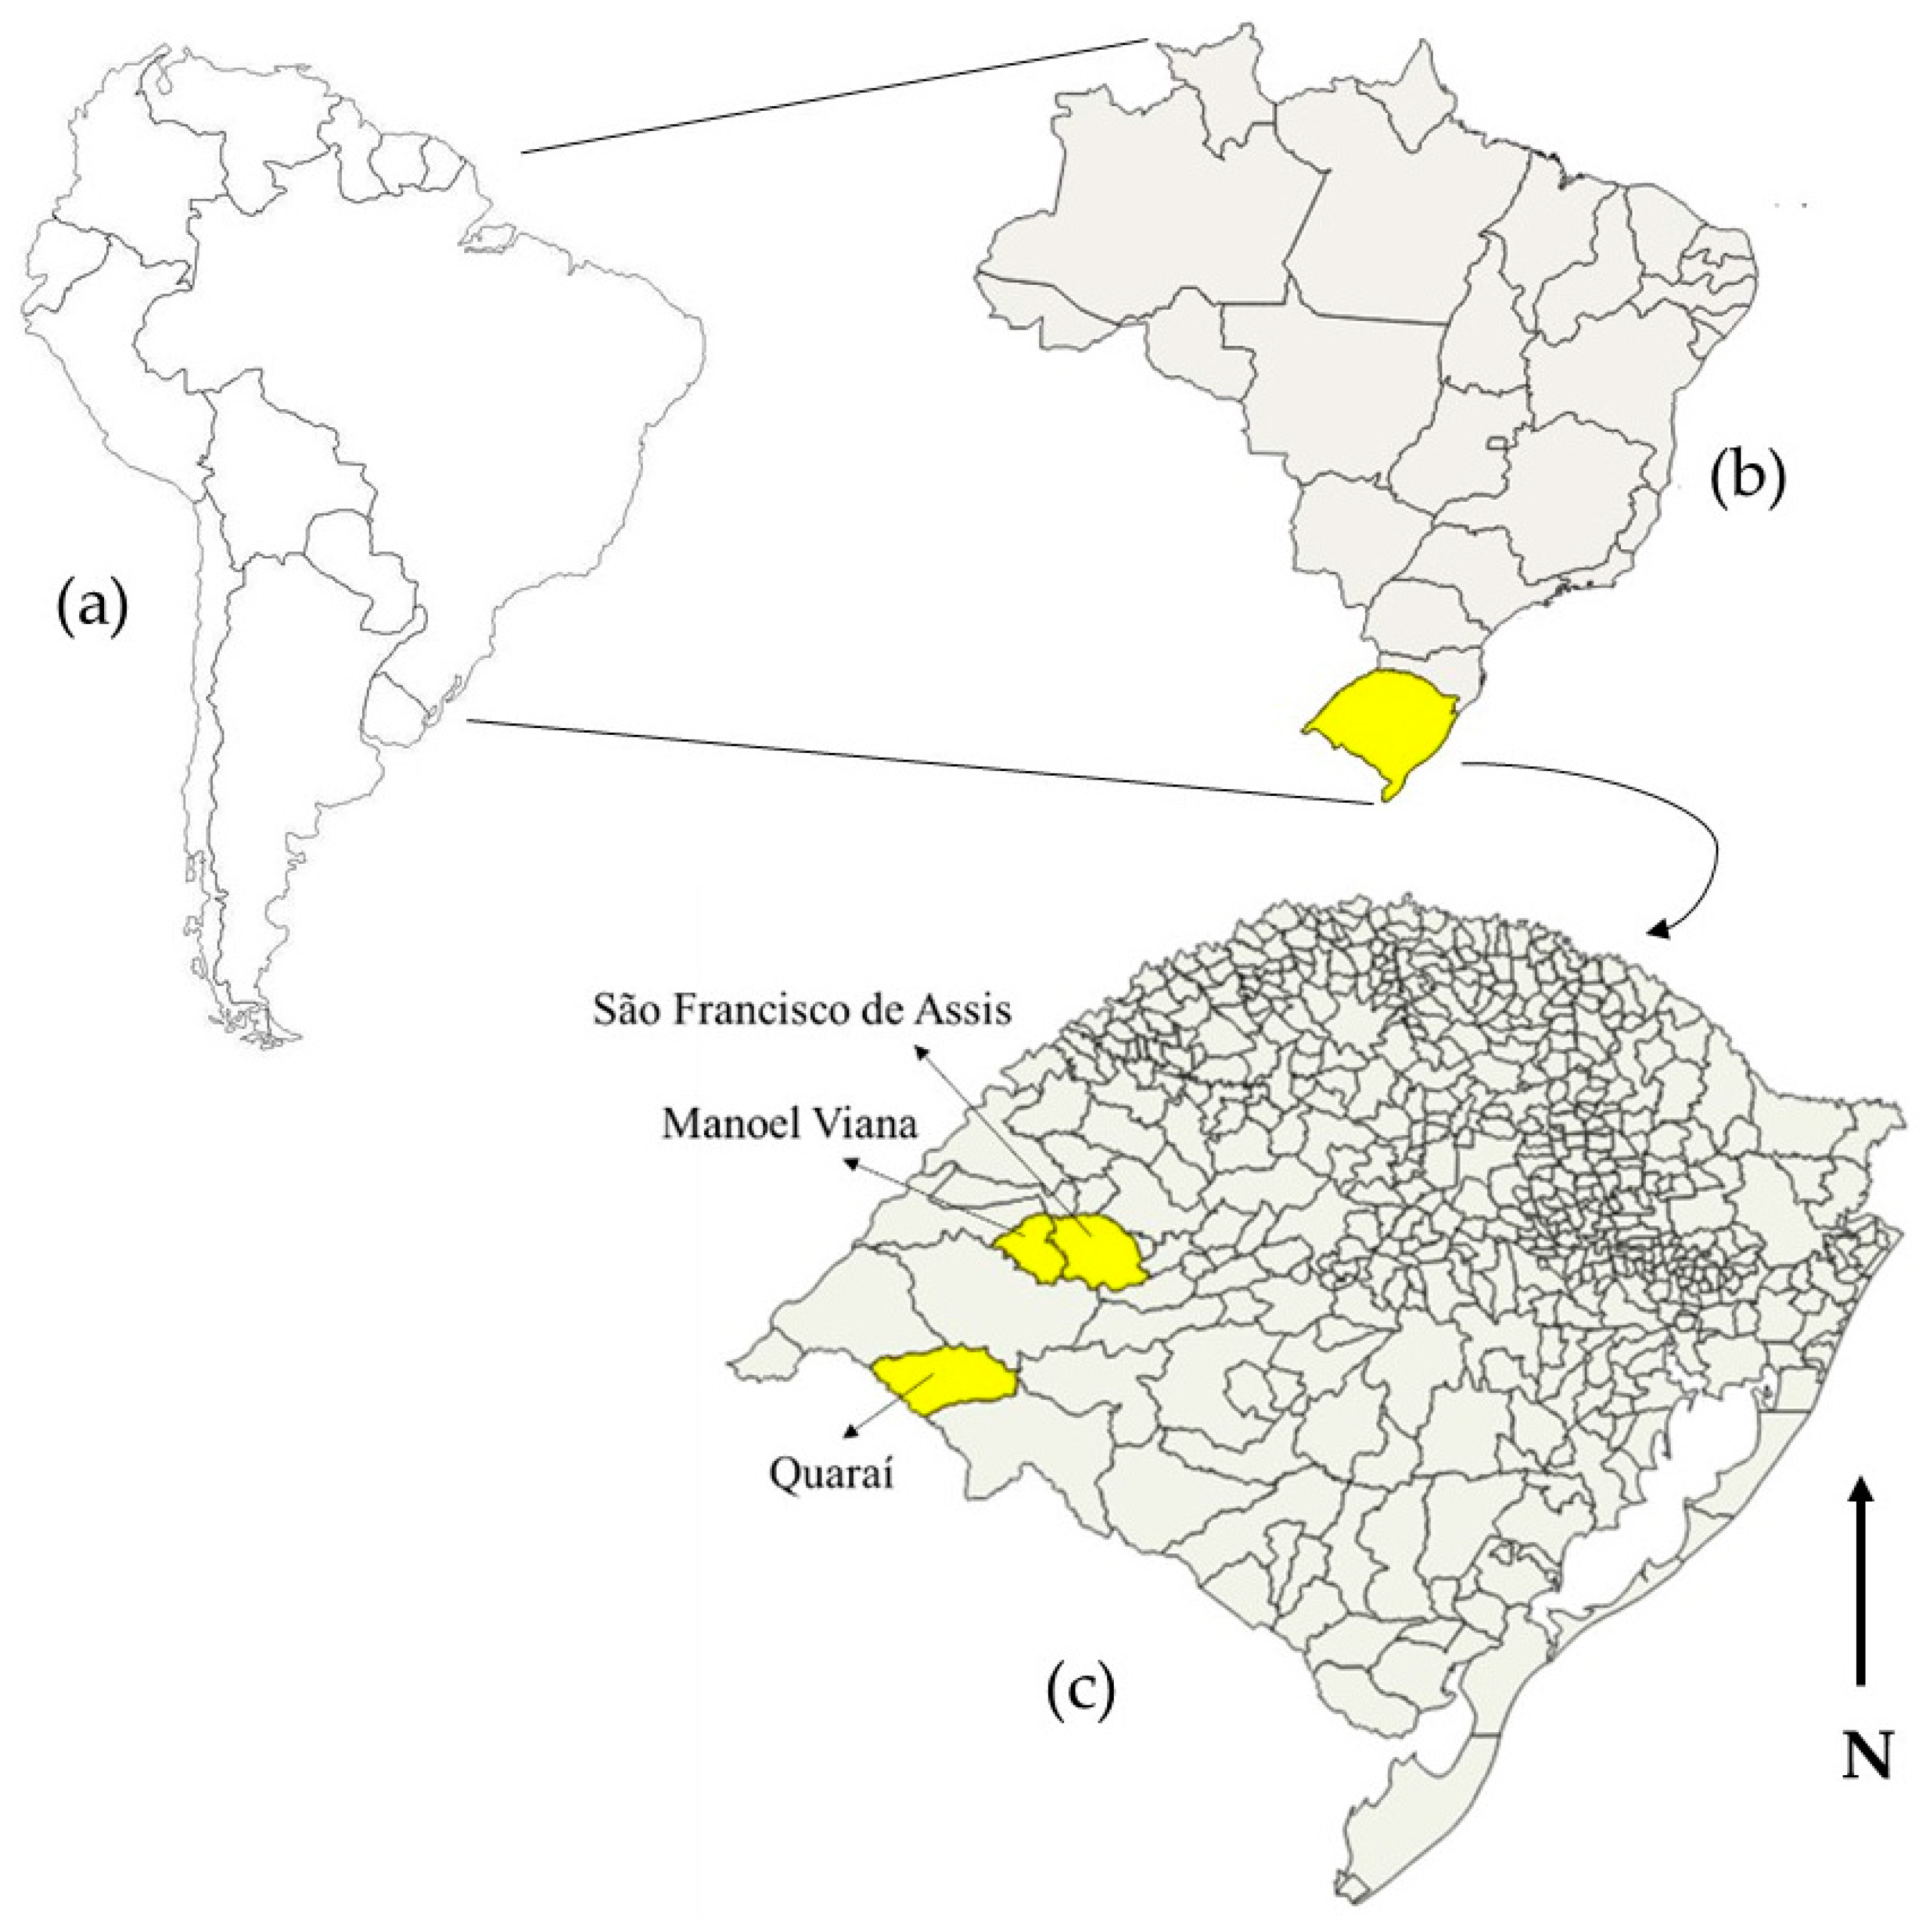
The southwestern region of Rio Grande do Sul State, Southern Brazil, is part of the Pampa Biome, a natural ecosystem rich in biological and pedological diversity with environmental, economic, and socio-cultural importance for Brazil, Uruguay, and Argentina [1], but the fragility of the soil, flora, and fauna makes the Pampa Biome vulnerable to agriculture conversion and degradation [2]. In this region, there are extensive areas in the process of sandyzation [3]. According to Bellanca and Suertegaray [4], such conditions have been interpreted in various ways, from natural origin and resulting from water processes acting on the lithology and specific soils, to anthropic causes associated with overgrazing and land use without conservation practices. In addition to these, Caneppele [5] also refers to the introduction of wheat and soybean crops and eucalyptus monocultures in the region as conditioning factors of erosion processes in these areas, as well as the use of heavy machinery and non-conservationist soil practices since 1970, causing soil compaction, the creation of preferential paths for drainage, and soil exposure through plowing or suppression of vegetation.
Quartzipsamments are predominantly in areas of the sandyzation process, and they have a sandy texture and a fragile structure, and are not very resistant to wind and water erosion [2], besides having low water availability, low natural fertility, and low cation exchange capacity [1,6,7].
Agricultural expansion in Quartzipsamments has been taking place [5], and few studies have been carried out on this soil and its use and management. In this sense, a better understanding of these environments is necessary so that the impacts of land use are minimized, since the intensive non-sustainable use of the land has taken negative consequences in this biome [2], at levels that are difficult to control.
In Brazil, Quartzipsamments together with other sandy and sandy loam soils represent 8% of the territory [8]. The authors state that in the past, these soils were of little agricultural relevance due to their limitations, even in areas favorable to mechanization, but currently, agriculture is establishing itself in these areas due to advances in production systems and agricultural practices. FAO [9] considers these soils as part of the group of Arenosols, covering about 900 million hectares or 7% of the earth’s surface. In this sense, the study and understanding of the behavior and processes involved in sandy soils become relevant, either for its representative area in terms of Brazil and the world, or the advance of agricultural exploitation of these soils of low agricultural land suitability and high environmental fragility.
The fragility of the sandy areas, due to the morphogenetic soil characteristics where the ravine and gully processes are present, conditions a high risk of landscape degradation through the occupation of the soil by crops and forestation [10,11]. In a review of recent studies of sandy soils (considered by the authors those with sand > 50% and clay < 20%), Huang and Hartemink [12] consider these soils as more sensitive to climate change and anthropic activities when compared to others, and due to population growth and urbanization, they have been widely used in the supply of food and other products and services for society.
Although Quartzipsamments are environmentally fragile, they have been widely used for agricultural purposes. Despite their low agricultural land suitability, it seems that political and economic issues favor the advance of the agricultural use of Quartzipsamments in southern Brazil, but little information is available about these soils, especially their morphology, fertility, and physical–hydric properties, as well as practices for better agricultural use. Thus, this work aims to characterize the morphological, chemical, and physical–hydric properties of Quartzipsamments; point out some difficulties and challenges in the use and management of these soils; and propose strategies for better soil use. Our hypothesis is that Quartzipsamments are soils of low suitability for agricultural use due to their low fertility and available water to plants, besides being unstructured due to the low content of organic matter and clay, demanding conservation practices to improve their properties.

2. Materials and Methods

2.1. Sampling Sites

The study was conducted in areas under sandyzation in southwest Rio Grande do Sul State, southern Brazil, specifically in the cities of Quaraí, Manoel Viana, and São Francisco de Assis (Figure 1).
The annual average temperature and precipitation in the region are, respectively, around 17.8 °C and 1388 mm; torrential rains larger than 160 mm may occur in 24 h and frosts from April to November [13], and the mean monthly rainfall and temperature to the period 1981–2010 are presented in Figure 2.
Six sites with Neossolos Quartzarênicos (NQ) (Brazilian Soil Classification System [15]), or Quartzipsamments, for “US Soil Taxonomy” [16], were chosen.
The sampling sites occur in undulating to slightly undulating relief, and the soils were sampled in areas under native field with the presence of gullies. Quartzipsamments NQ1 (Datum: UTM—WGS-84, Zone 21J, longitude 571,558 m E; latitude 6,629,425 m S; 146 m altitude) and NQ2 were sampled in Quaraí city, NQ3 (Datum: UTM—WGS-84, Zone 21J, longitude 657,414 m E; latitude 6,725,226 m S; 117 m altitude) and NQ4 (Datum: UTM—WGS-84, Zone 21J, longitude 655,845 m E; latitude 6,717,142 m S; 114 m altitude) in Manoel Viana city, and NQ5 (Datum: UTM—WGS-84, Zone 21J, longitude 678,086 m E; latitude 6,725,002 m S; 140 m altitude) and NQ6 (Datum: UTM—WGS-84, Zone 21J, longitude 682,571 m E; latitude 6,724,585 m S; 109 m altitude) in São Francisco de Assis city (Figure 3).

2.2. Morphological Analysis

The six soil profiles were described in the field according to Santos et al. [17] and Schoeneberger et al. [18], considering morphological procedures such as horizon sequence and depth, its boundary, texture, structure, consistency, and soil Munsell color.

2.3. Physical–Hydric Analysis

In each sampling site, the horizons of the profile were separated, and in the middle of the horizon, three samples with preserved structure by horizon were collected in cylinders with 0.047 m diameter and 0.030 m height, and one sample by horizon with a non-preserved structure.
The samples with a preserved structure were saturated for capillarity under 48 h. The saturated hydraulic conductivity of soil was determined after saturation in the laboratory using a permeameter of constant load [19].
Next, the samples were submitted and equilibrated in the tensions of 1 kPa and 6 kPa in the tension table and in the tensions of 10, 100, 500, and 1500 kPa in the Richards’ pressure chamber [20]. Finally, the samples were oven-dried at a temperature of 105 °C. Using this information, the macroporosity (pores of diameter larger than 50 µm) to the tension of 6 kPa, the microporosity (pores of diameter smaller than 50 µm), the total porosity, the bulk density [21], and the volume of available water using the volumetric moisture between the field capacity (tension = 10 kPa) and the permanent wilt point (tension = 1500 kPa) were calculated.
The volumetric moisture was obtained by the ratio between the water retained in a determined tension and the volume of the cylinder used for sampling.
In the laboratory, the soil samples with a non-preserved structure were air-dried, broken individually and manually, and passed through a sieve of 2 mm mesh, the soil that passed through the sieve being used to determine the particle density by the volumetric balloon method [22], and the particle size distribution analysis using the pipette method [23]. The soil particles were separated in the fraction sand (2–0.053 mm) by sieving, silt (0.053–0.002 mm) by calculus between the difference of the sum of sand, and clay (<0.002 mm), which was determined by a pipette. The sand was sieved in very coarse sand (2–1 mm), coarse sand (1–0.5 mm), medium sand (0.5–0.25 mm), fine sand (0.25–0.125 mm), and very fine sand (0.125–0.053 mm).
The results of the particle size distribution analysis were used to determine textural classification, using the soil texture triangle available from the USDA-NRCS [24] and according to Santos et al. [15].
Dispersible clay in water was quantified following the same procedure used for total clay evaluation but without using the chemical dispersant.
The degree of flocculation (DF, %) was calculated using the following equation:
DF = [(total clay − clay disperse in water)/total clay] × 100

2.4. Chemical Analysis

The soil samples with a non-preserved structure were also used for chemical characterization using the analytical procedures presented in Tedesco et al. [25] to determine: pH in water 1:1 (soil/water) (pH water) and KCl (pH KCl), calcium (Ca), magnesium (Mg), sodium (Na), potassium (K), aluminum (Al), potential acidity (cations H + Al), and organic carbon. Through these determinations were calculated the effective cation exchange capacity at pH 7.0 (respectively, CECeffective and CECpH7.0), base saturation, and aluminum saturation.
H + Al was determined for SMP index, while Ca, Mg, and Al were extracted with KCl 1 mol L−1 and measured with an atomic absorption spectrophotometer, and the extractant Mehlich I solution (0.05 mol L−1 HCl + 0.0125 mol L−1 H2SO4) was used for K and Na and measured by flame photometry.
Soil organic carbon was analyzed by the wet combustion method [25], and then soil organic matter was calculated according to Tedesco et al. [26]:
Soil organic matter = 1.724 × soil organic carbon

2.5. Data Analysis

The statistical analysis was realized by Pearson’s correlation considering 10% significance, and coefficient of variation and mean values were determined using the statistical program SAS [27].

3. Results

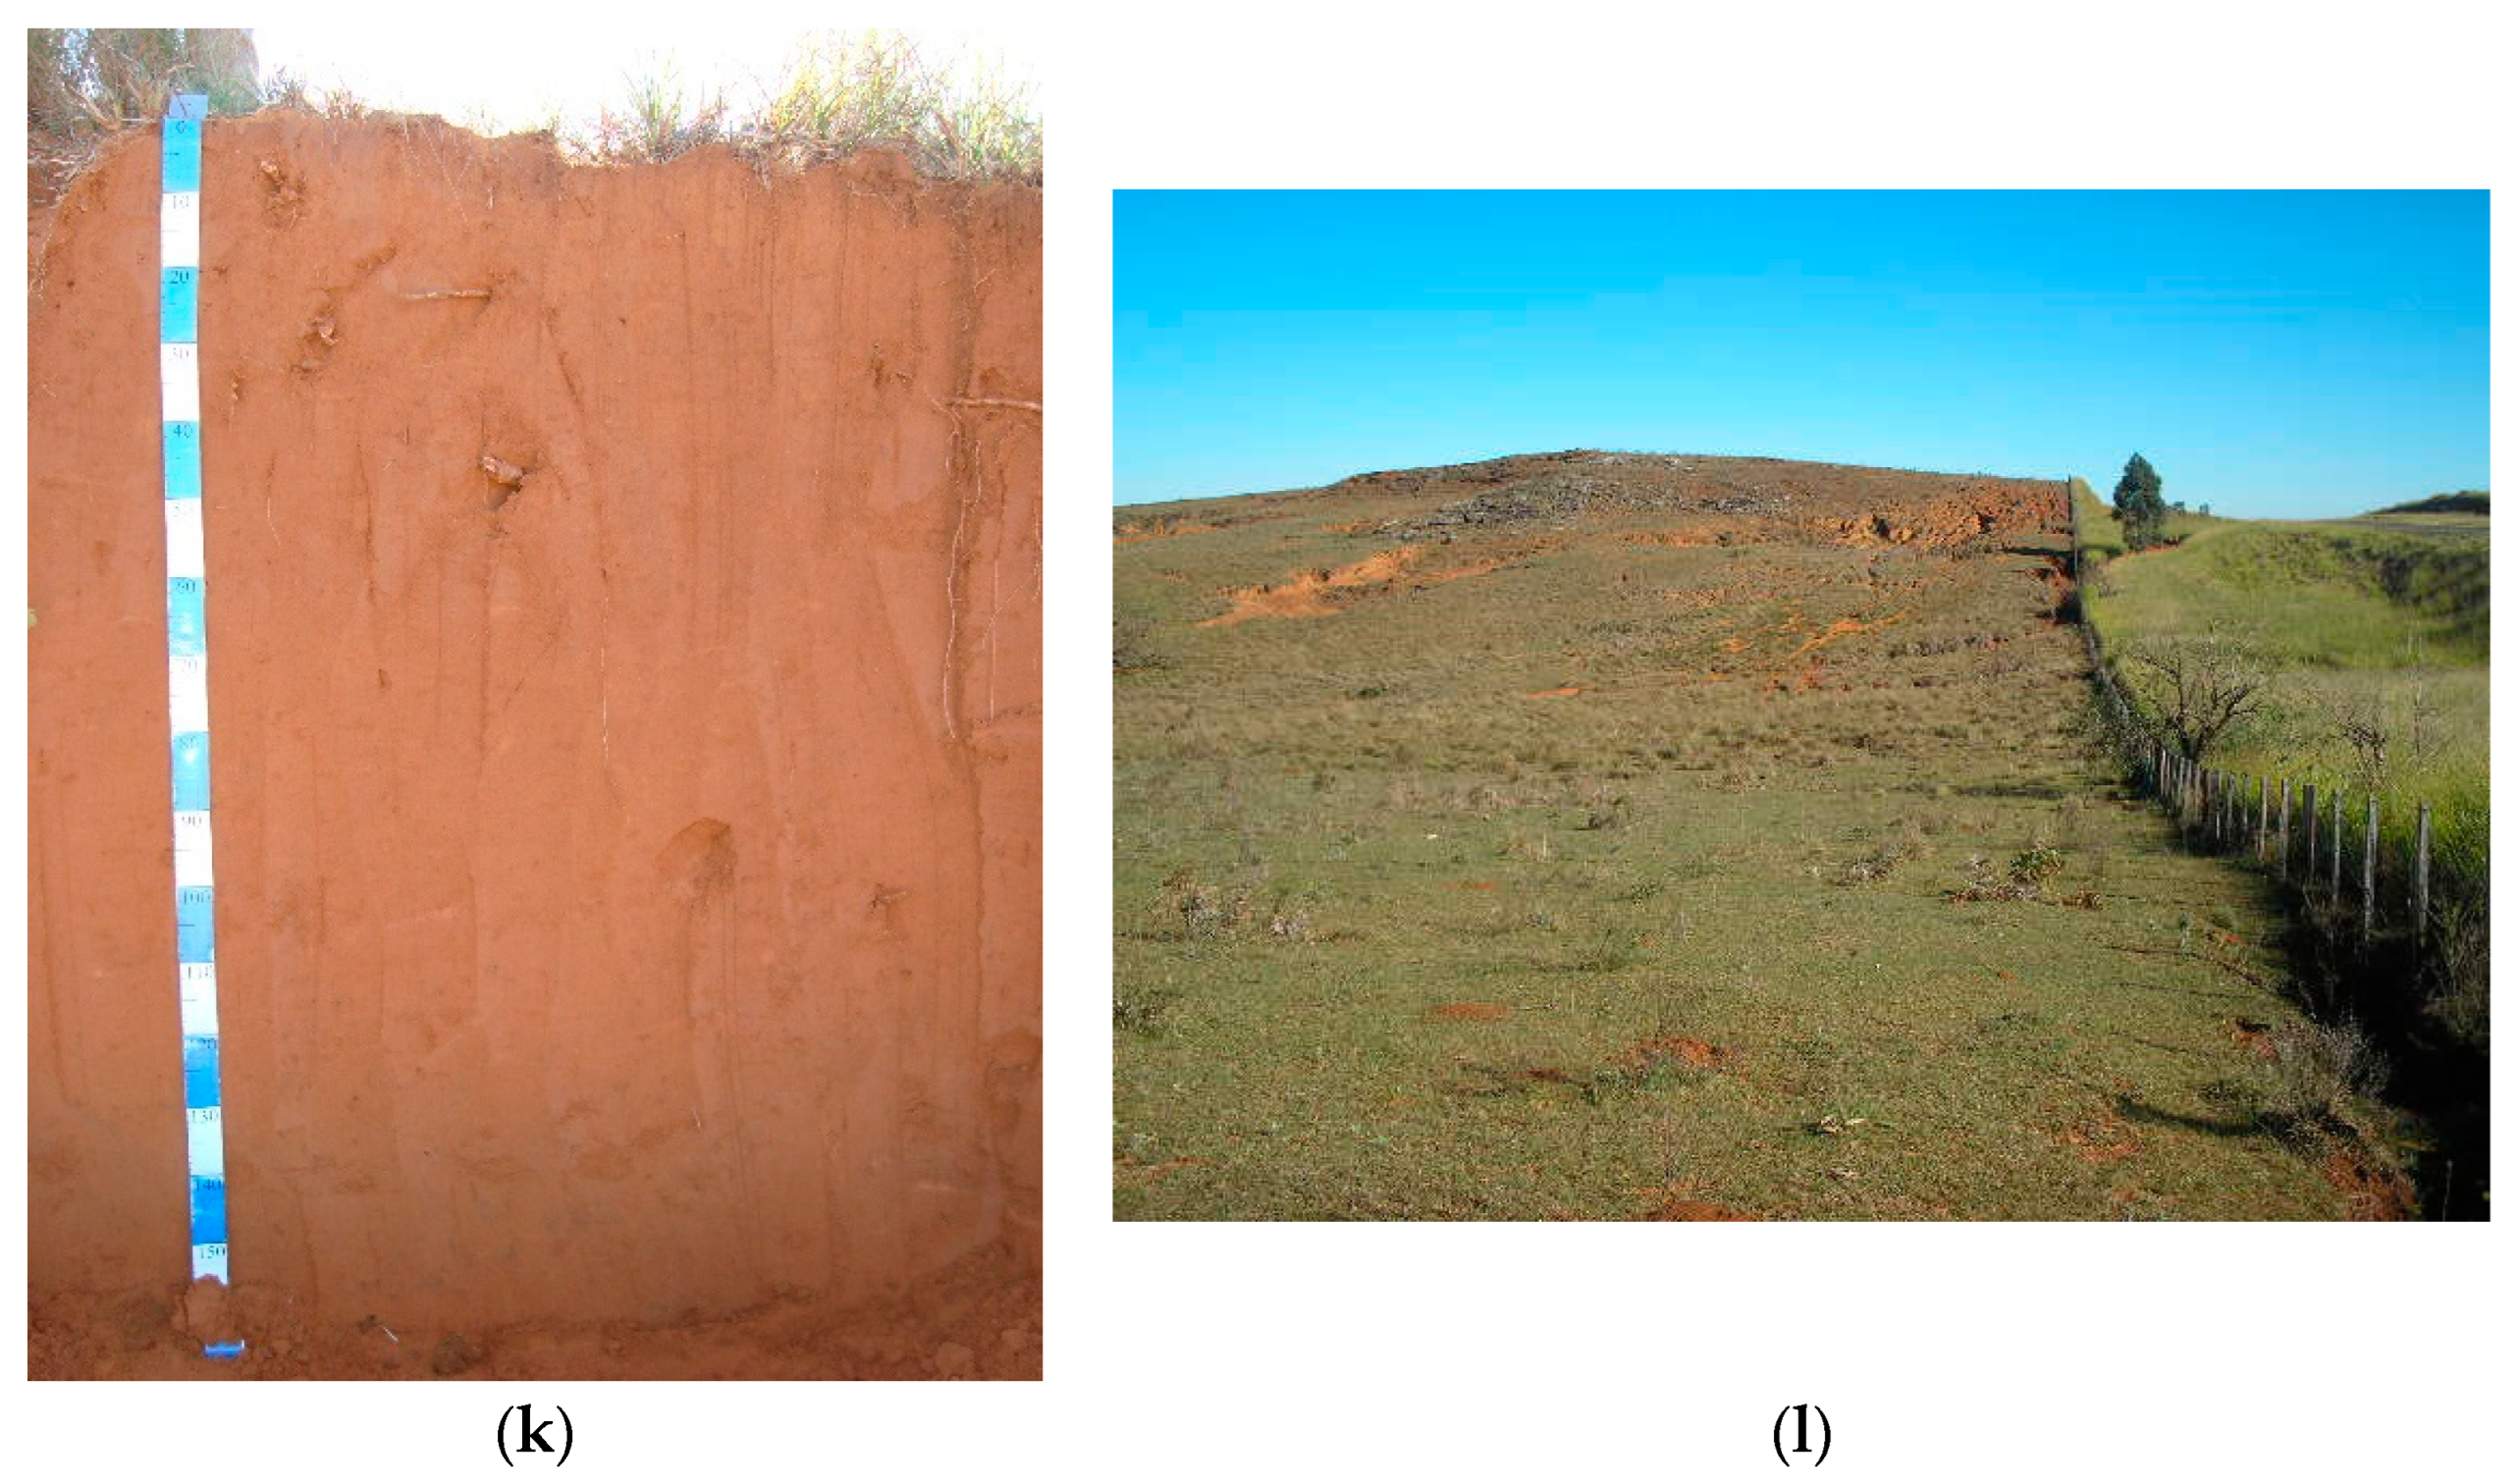
The morphological data (Table 1) show that all Quartzipsamments profiles have a weak structure in subangular blocks that break down into single grains. They are very deep soils (>100 cm), with colors ranging from reddish (2.5 YR) to yellowish (10YR), always with high values and chromas (≥4). The color indicates the good drainage of the analyzed profiles. The consistency verified was loose and non-plastic and non-sticky for virtually all profiles. The horizon boundary distinctness varied predominantly between clear and gradual.
The particle size distribution is shown in Table 2 and Table 3. There is a predominance of medium and fine sand fractions, with mean values in the horizons ranging from, respectively, 218.13 to 756.38 g kg−1 and 178.66 to 577.04 g kg−1. In the sand fraction, quartz mineralogical composition predominates. The silt and clay contents were extremely low, the mean values in the horizons ranging from, respectively, 4.53 to 57.35 g kg−1 and 23.03 to 126.29 g kg−1. The textural class of horizons, according to Santos et al. [15], is sandy, and according to the USDA-NRCS [24], it is sand and loamy sand only for horizons with more than 100 g kg−1 of clay, such as C1 of NQ1 and NQ6, and C3 of NQ2.
The flocculation degree, which represents the resistance of the soil structure to disintegration, presented a wide range of values (8.78 to 80.79%) (Table 3).
The Quartzipsamments profiles showed high values of macroporosity and saturated hydraulic conductivity and low values of microporosity and available water (Table 4). These results are consistent with the characteristics of these sandy soils. The high conductivity was associated with macropores, the main responsible for the flow of air and water, and the low availability of water due to lower microporosity, pores responsible for retention and availability of water.
In general, the surface horizon showed higher total porosity and macroporosity (Table 4). Generally, the bulk density was higher with increasing depth.
The evaluated Quartzipsamments are acidic and, in general, with low fertility, with predominantly low Ca and Mg contents and very low K [28] (Table 5). The cation exchange capacity at pH 7.0 and the organic matter are predominantly low [28] (Table 6), reflecting a high risk of leaching and impact on the environment due to smaller adsorption sites and high hydraulic conductivity (Table 4) and, in terms of agricultural use, requiring an application in installments of fertilizers. These results corroborate the single-grain soil structure (Table 1 and Table 4), since electrical charges and organic matter contribute to soil aggregation. The chemical results are consistent with the low clay content of these soils (Table 3) because, in this particle size, soil reactivity occurs [29].
According to Pearson’s correlation analysis, the increment in macroporosity increases the total porosity (r = 0.80) and decreases the microporosity (r = −0.50), with a consequent increase in the saturated hydraulic conductivity (r = 0.45) and a decrease in available water (r = −0.41) (Table 7). The increase in bulk density decreases its total porosity (r = −0.19), although with no effect on macroporosity and microporosity, which suggests that there is a decrease in the size of the macropore with increasing bulk density, but no increase in microporosity. Because the vertical flow of water in the soil occurs mainly in macropores, while the water available to plants is in the micropores, increasing microporosity decreases hydraulic conductivity (r = −0.75) and increases available water (r = 0.47). Particle density showed an inversely proportional relationship with microporosity (r = −0.45) and a positive relationship with hydraulic conductivity (r = 0.40); that is, with an increase in particle density, there is a decrease in microporosity and an increase in hydraulic conductivity.
Soil bulk density showed a positive and significant correlation with clay (r = 0.45) (Table 8), indicating that clay, even in small proportion in these soils, can occupy the spaces between larger particles (silt and sand), decreasing the size of the macropore, with a consequent decrease in total porosity and an increase in bulk density, but with no influence on microporosity, as seen in Table 7. At 10% probability, the degree of flocculation was positively correlated with total porosity (r = 0.30) and bulk density (r = 0.33).
Increasing pH water and pH KCl, there is an increase in the availability of Ca (r = 0.47 and 0.44, respectively), Mg (r = 0.38 and 0.35), and K (r = 0.37 and 0.37), and an increase in CECeffective (r = 0.46 and 0.43), CECpH7.0 (r = 0.44 and 0.42), and base saturation (r = 0.45 and 0.43) and a decrease in Al saturation for pH KCL (r = −0.34) (Table 9). Increasing organic matter, there is an increase in CECeffective (r = 0.57) and CECpH7.0 (r = 0.66), with a consequent increase in the availability of Ca, Mg, and K and base saturation, and a decrease in Al saturation, evidencing the effect of organic matter in the chemical improvement of these soils where the clay content is low, and the adjustment of pH improves soil fertility.
The Na (r = 0.47) and K (r = 0.42) showed a positive and significant correlation with very fine sand, while Ca had a negative correlation with coarse sand, as well as CECeffective and CECpH7.0 (Table 10). The increase in pH water decreases the degree of flocculation of the soil (r = −0.34).
Increasing organic matter, there is an increase in total porosity (r = 0.53) and a decrease in bulk density (r = −0.47) (Table 11). The effect of some chemical variables on soil physics may be associated with electrical charges and aggregate formation. In these soils, the increase in microporosity has a positive effect on increasing the availability of Ca (r = 0.74), Mg (r = 0.67), K (r = 0.38), and on CECeffective (r = 0.74), CECpH7.0 (r = 0.72) and base saturation (r = 0.58), and decreasing Al saturation (r = −0.37).

4. Discussion

The low clay contents in these soils are highlighted because practically all the reactivity of the soil, such as the cation exchange capacity, is available in this particle size [29]. The availability of nutrients to the soil in the medium and long term from weathering is not significant due to the predominantly quartz mineralogical composition. The flocculation degree resulted in a wide range of values (8.78 to 80.79%), and this soil property is especially important in terms of soil water erosion resistance because it represents the resistance of the soil structure to disintegration.
Although the bulk density values showed a wide range of variation (1.32 to 1.64 Mg m−3), the mean value of the profiles did not show significant variation (1.41 to 1.47 Mg m−3) (Table 4). According to FAO [9], Arenosols have high bulk density values, ranging from 1.5 to 1.7 Mg m−3, and considering the quartz density of around 2.65 Mg m−3, the total porosity is around 0.36 to 0.46 m3 m−3. Although the total porosity was obtained directly by weighing, the values (0.380 to 0.522 m3 m−3) are close to those indicated by FAO [9].
The range of macroporosity and microporosity values found are, respectively, 0.253 to 0.373 m3 m−3 and 0.083 to 0.182 m3 m−3. Working with different uses of Quartzipsamment in Rio Grande do Sul State, Reichert et al. [30] found microporosity values similar to this study (0.073 to 0.169 m3 m−3) but higher to macroporosity (0.398 to 0.570 m3 m−3). The values found in the present study and by the aforementioned authors are completely opposite to what is usually found for clayey soils. For example, in comparative terms, Suzuki et al. [31], studying different land use and management systems, verified for an Oxisol (clay between 640 and 664 g kg−1) macroporosity and microporosity values of, respectively, 0.219 to 0.017 m3 m−3 and 0.476 to 0.354 m3 m−3, and total porosity of 0.573 to 0.460 m3 m−3, which refers to a lower agricultural and environmental suitability of Quartzipsamments when compared to other soils. Variations in bulk density according to its clay content are well documented [32,33,34,35]. The higher total porosity and macroporosity verified in most of the profiles in the superficial horizon can be associated with the action of the few roots in this superficial soil layer, while the greater values of bulk density with an increase in the depth can probably be related to the smaller action of roots and by the weight of the upper soil layers causing pressure on the subsurface layers.
The saturated hydraulic conductivity is extremely high in the Quartzipsamments evaluated, ranging from 127.85 to 672.26 mm h−1, associated with the large volume of macropores (water-flow pores), as also observed by Reichert et al. [30]. According to Mesquita and Moraes [36], the flow of water in saturated soil occurs preferentially in macropores (pores with diameter >50 μm). FAO [9] points out Arenosols as water-permeable soils, with the saturated hydraulic conductivity varying between 300 and 30,000 cm day−1 (125 and 12,500 mm h−1), and depending on the particle size distribution and the organic matter content, the available water capacity can be less than 3 to 4% or greater than 15 to 17%. FAO [9] also mentions that because most pores are relatively large, much of the retained water is drained at a tension of only 100 kPa.
Suertegaray [7] even mentions that the water dynamics in Quartzipsamments from Southwest of Rio Grande do Sul State, with regard to erosion, are associated with concentrated superficial processes, which originate furrows, ravines, and gullies. According to the author, laminar flow is not characteristic of these areas due to the high infiltration capacity of these soils.
A fact that draws attention is the low coefficient of variation of the saturated hydraulic conductivity (8.88 to 19.71%) (Table 4). Generally, this property presents great spatial variability, generating a high coefficient of variation and requiring a greater number of samples to reduce this variability [36]. Coefficient of variation values can be greater than 200% for hydraulic conductivity [37]. According to the same authors, this variability is associated with types and land use, position in the landscape, depth, instruments and measurement methods, and experimental errors. The lower variability in Quartzipsamments allows the minimum number of soil samples in spatial variability studies. The low coefficient of variation of the saturated hydraulic conductivity in our study may be associated with the single-grain structure and high sand content in the soil profiles.
The volume of available water is extremely low (0.006 to 0.038 m3 m−3) (Table 4), associated with the sandy texture and low volume of micropores (pores responsible for water retention and availability). Reichert et al. [38] found for soils from Rio Grande do Sul State that field capacity and permanent wilting point increased in a similar proportion with increasing clay content of the soils. The authors also verified an average volume of available water to plants of 0.089 m3 m−3 for sandy soils and 0.124 m3 m−3 for very clayey soils, reaching 0.191 m3 m−3 for silty clay soils.
Compaction, so harmful in soils with higher clay content, can increase microporosity in sandy soils and the volume of available water to plants. However, studies are needed to indicate the appropriate level of compaction to improve water retention and availability for plants without preventing their root growth by increasing soil bulk density.
Working with four profiles of sandy soils from the Brazilian semiarid region, Santos et al. [39] recommend lower irrigation rates and more frequent application, due to the lower water-holding capacity of these soils and greater risk of nutrient leaching.
In sandy soil (89% sand), the incorporation of clay together with organic matter increased aggregate stability, total soil porosity, and available water content and decreased soil bulk density. Moreover, increasing plant height and number of shoots of physic nut (Jatropha curcas L.) were observed [40]. While the biochar added to sandy soil (93.2% sand) increased water-holding capacity, decreased drainage, and increased available water for crop use [41].
The high acidity and low fertility of these soils require an adjustment of pH and mineral reserve, which would demand high costs with fertilizer. Due to high sand and low clay contents, these soils require split fertilization to reduce leaching rates and increase the efficiency of nutrient uptake by plants. According to the “Manual de adubação e de calagem para os Estados do Rio Grande do Sul e Santa Catarina/Manual of fertilization and liming to the Rio Grande do Sul and Santa Catarina States” [28], for these sandy soils (<20% clay) or with CEC < 7.5 cmolc dm−3, it is recommended to avoid total corrective fertilization of K or P due to the possibility of leaching these nutrients or salinity problems, as well as the splitting of nitrogen fertilization.
Due to the smaller adsorption sites (low cation exchange capacity at pH 7.0 and organic matter) and the high hydraulic conductivity, there is a high risk of leaching and environmental damage, requiring an installment of fertilizer application in the agricultural use of these soils. In order to improve the chemical efficiency of these soils, it is recommended to increase their levels of organic matter, something that should occur gradually, with consequent improvement of the physical structure and biological activity of these soils. Meanwhile, due to the low levels of clay and organic matter, these soils need, at each crop, to be corrected through high doses of limestone and fertilizers, which can become financially unfeasible in the short and medium term.
Considering the very low K contents, for its total correction, the amount of 120 kg of K2O per hectare is recommended [28]. To correct the pH, raising it to a value of 6.0, the equation indicated by the SBCS-NRS/CQFS [28] was used:
NC= −0.516 + 0.805OM + 2.435Al
where NC is the limestone requirement in t ha−1 (with relative power of total neutralization—PRNT 100%), OM is the organic matter content (in %), and Al is the exchangeable aluminum content of the soil (in cmolc dm−3).
From the calculations, considering the variation in Al and organic matter contents in the topsoil horizon, the limestone requirement ranged from 1.46 to 3.63 Mg ha−1. This calculus of K2O fertilizer and limestone reflects the high costs for fertility adjustment.
As reported by Donagemma et al. [8], a common practice adopted by technicians and farmers in sandy soils is the application of limestone doses above 6 Mg ha−1, and may even exceed 10 Mg ha−1 because, according to farmers, when applying the dose of 2 Mg ha−1, as recommended in corrective and fertilizer handbooks, crop yield will be very low. The authors explain this due to the low reactivity of limestone in these soils, associated with the low aluminum content and low buffering power of the soil, and possible losses of cations in depth, by leaching.
Hartemink and Huting [42], Bezabih et al. [43], Reichert et al. [30], and Olorunfemi et al. [44] also found in sandy soil a correlation between organic matter and CEC, and Bezabih et al. [43] also observed a correlation between pH and CEC, and porosity and bulk density with organic carbon and CEC. The results of Olorunfemi et al. [44] agree with the observations of this study on the negative correlation between base and aluminum saturation.
According to Reichert et al. [30], for most sandy soils, a large part of the CEC comes from organic matter. From the collection of published data from tropical sandy soils in western and eastern Africa, Blanchart et al. [45] showed that organic matter is the main determinant of soil fertility, nutrient storage, aggregate stability, and microbiological and enzymatic activities. According to the authors, although cultural practices or land use have a lower impact on the increase of organic matter when compared to clayey soils, this is the way to increase them and improve soil biofunction, which determines the agronomic and environmental potential of the sandy soils.
Reichert et al. [30] verified changes in the physical properties of a Quartzipsamment related to organic carbon, which lead to a resistance of this soil to degradation. According to the authors, the accumulation of organic matter in sandy soils is more important than in clayey soils due to their fragility and difficulty in increasing their organic matter content. In sandy soils, the soil aggregation is mainly controlled by carbon dynamics [46], and our study corroborates considering the low organic matter content and the single-grain soil structure.
The increase in organic matter can lead to a decrease in the use of mineral fertilizers [28] and, as a consequence, less leaching and risks of contamination of water resources (surface due to erosion and subsurface due to leaching). In addition, its sandy texture requires split fertilization to decrease nutrient leaching and increase plant uptake [28].
Alternatives are being studied to improve soil structure and fertility of sandy soils. For example, the use of clay and natural polymers increased the CEC and the number of available cations, and decreased the leached cations of coastal sandy soil (98% sand) [47]. While long-term application of organic amendments improved physical (bulk density was decreased, available water-holding capacity was increased), biological (enhanced the overall soil microbial activity, such as species number and diversity, especially of the desirable groups such as heterotrophic aerobes, actinomycetes, and pseudomonads), and chemical properties (increasing soil organic matter, carbon, pH, Mehlich 1-extractable P, K, Ca, Mg, Mn, Cu, Fe, and Zn concentrations, CEC) of a sandy soil [48].
The application of sewage sludge in sandy soil (87.69% sand) increased the organic matter content of soil; improved the infiltration rate, decreasing the water erosion under simulated high-intensity rainfall; decreased bulk density and increased the tendential air permeability of soil; and the soil compaction level was reduced in the first year after compost re-treatment. However, all the beneficial effects of sewage sludge last only for two years [49]. While the use of liming and catch crops alone did not influence cereal yield and straw and plant height, in the fourth year of study, all yield trait components significantly increased with the use of farmyard manure, liming, and catch crops together in a Podzol sandy soil (62.9% sand) [50].
It is known that current production techniques and technologies have evolved and improved and are accessible; however, it is worth highlighting the high cost of agricultural production of these soils, requiring a careful analysis in terms of production costs and sales value of the products.
Table 12 presents the difficulties and challenges specific to or associated with Quartzipsamments.
Due to the sandy texture (Table 2) and low organic matter content of these soils (Table 6), reflected in poorly structured soils (Table 1 and Table 4), they are very susceptible to erosion and the sandyzation process, requiring complex and permanent techniques and practices for the conservation of the soil, such as terracing and maintenance of permanent vegetation cover on the soil surface. Associated with this, there is still little vegetation cover, usually native pasture, although soybean cultivation is expanding in these soils and the use of the land with agriculture and livestock without grazing control and no adoption of conservation practices. Suertegaray et al. [10] highlight that the dynamics of land use, without prior recognition of its agricultural land suitability, is capable of intensifying the morphogenetic processes, weakening the landscape in a relatively shorter time than the dynamics of nature itself. Therefore, sustainable land use in Biome Pampa is just possible if the economical activities consider the soil suitability and the adaptations of its plant and animal communities [2].
In this sense, studying a toposequence with three sandy soils (sand between 89 and 95% and clay between 9 and 3%), Thomaz and Fidalski [51] observed that the soil position in the toposequence and the total sand content were the variables that best explained the erodibility interrill, in an experiment under simulated rainfall, and emphasized the need for differentiated management systems along the toposequence.
Furthermore, the low volume of available water (Table 4), considering these soils of low agricultural land suitability, and the high hydraulic conductivity and low water-holding capacity (Table 4), associated with the minimum contents of clay, silt (Table 3), and organic matter (Table 6), characterize these soils as very fragile environmentally [2], and should be used very carefully, especially due to the risks of leaching; transport of metals, pesticides, and other agrochemicals; and contamination of surface and subsurface water resources, besides the high susceptibility to erosion and sandyzation.
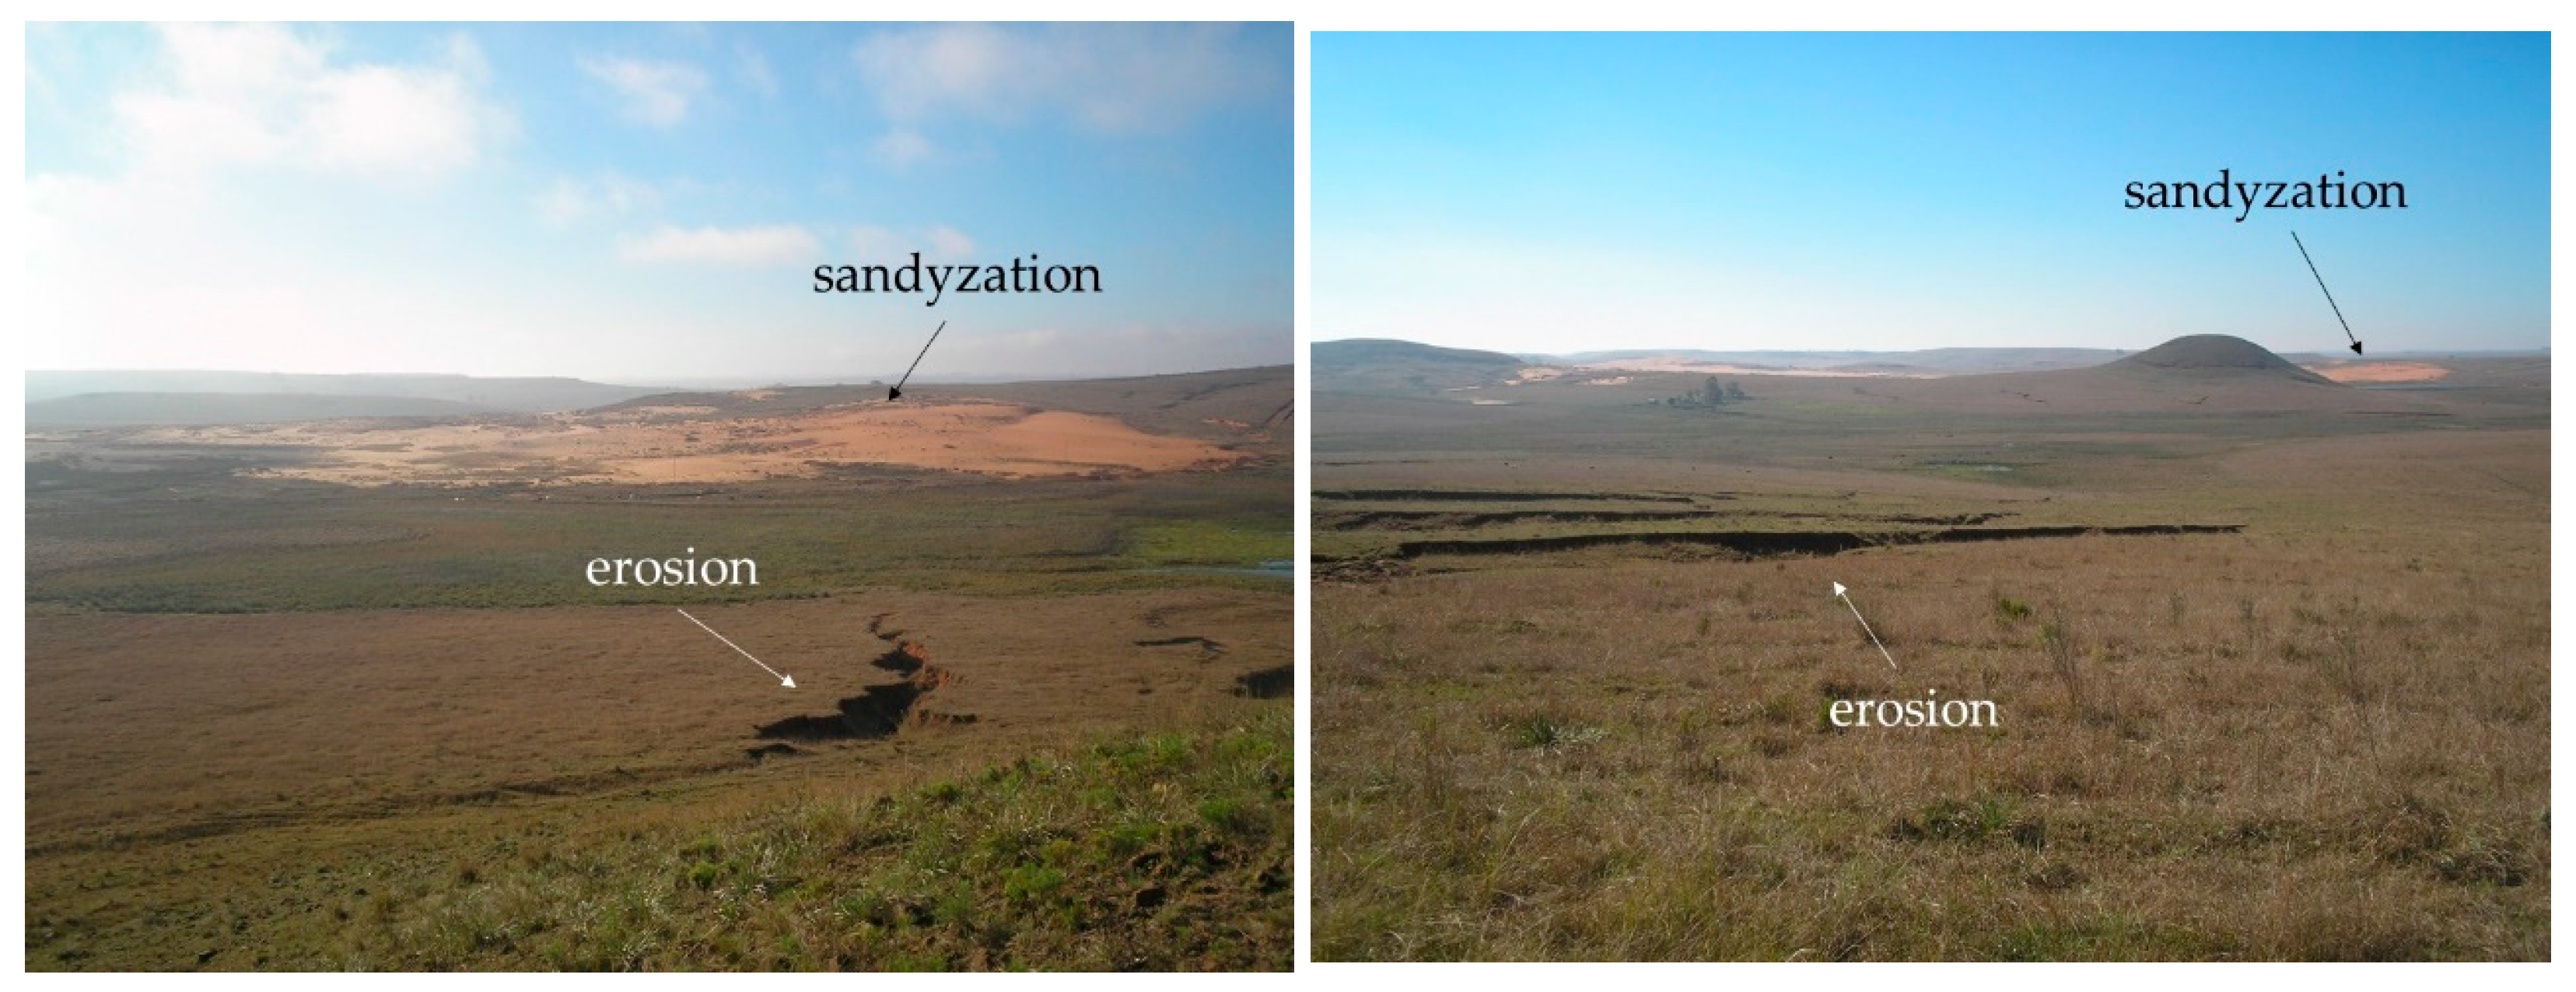
Suertegaray [7] reported that, due to the fragility of the soils where the sands occur, they are highly susceptible to erosion when their agricultural management occurs through heavy machinery, which forms rills that can evolve into the formation of ravines and gullies. According to the author, intensive pastoral activity, with animal overcrowding is indicated as a cause of erosion, linked to the formation of rills by the trampling of cattle through trails.
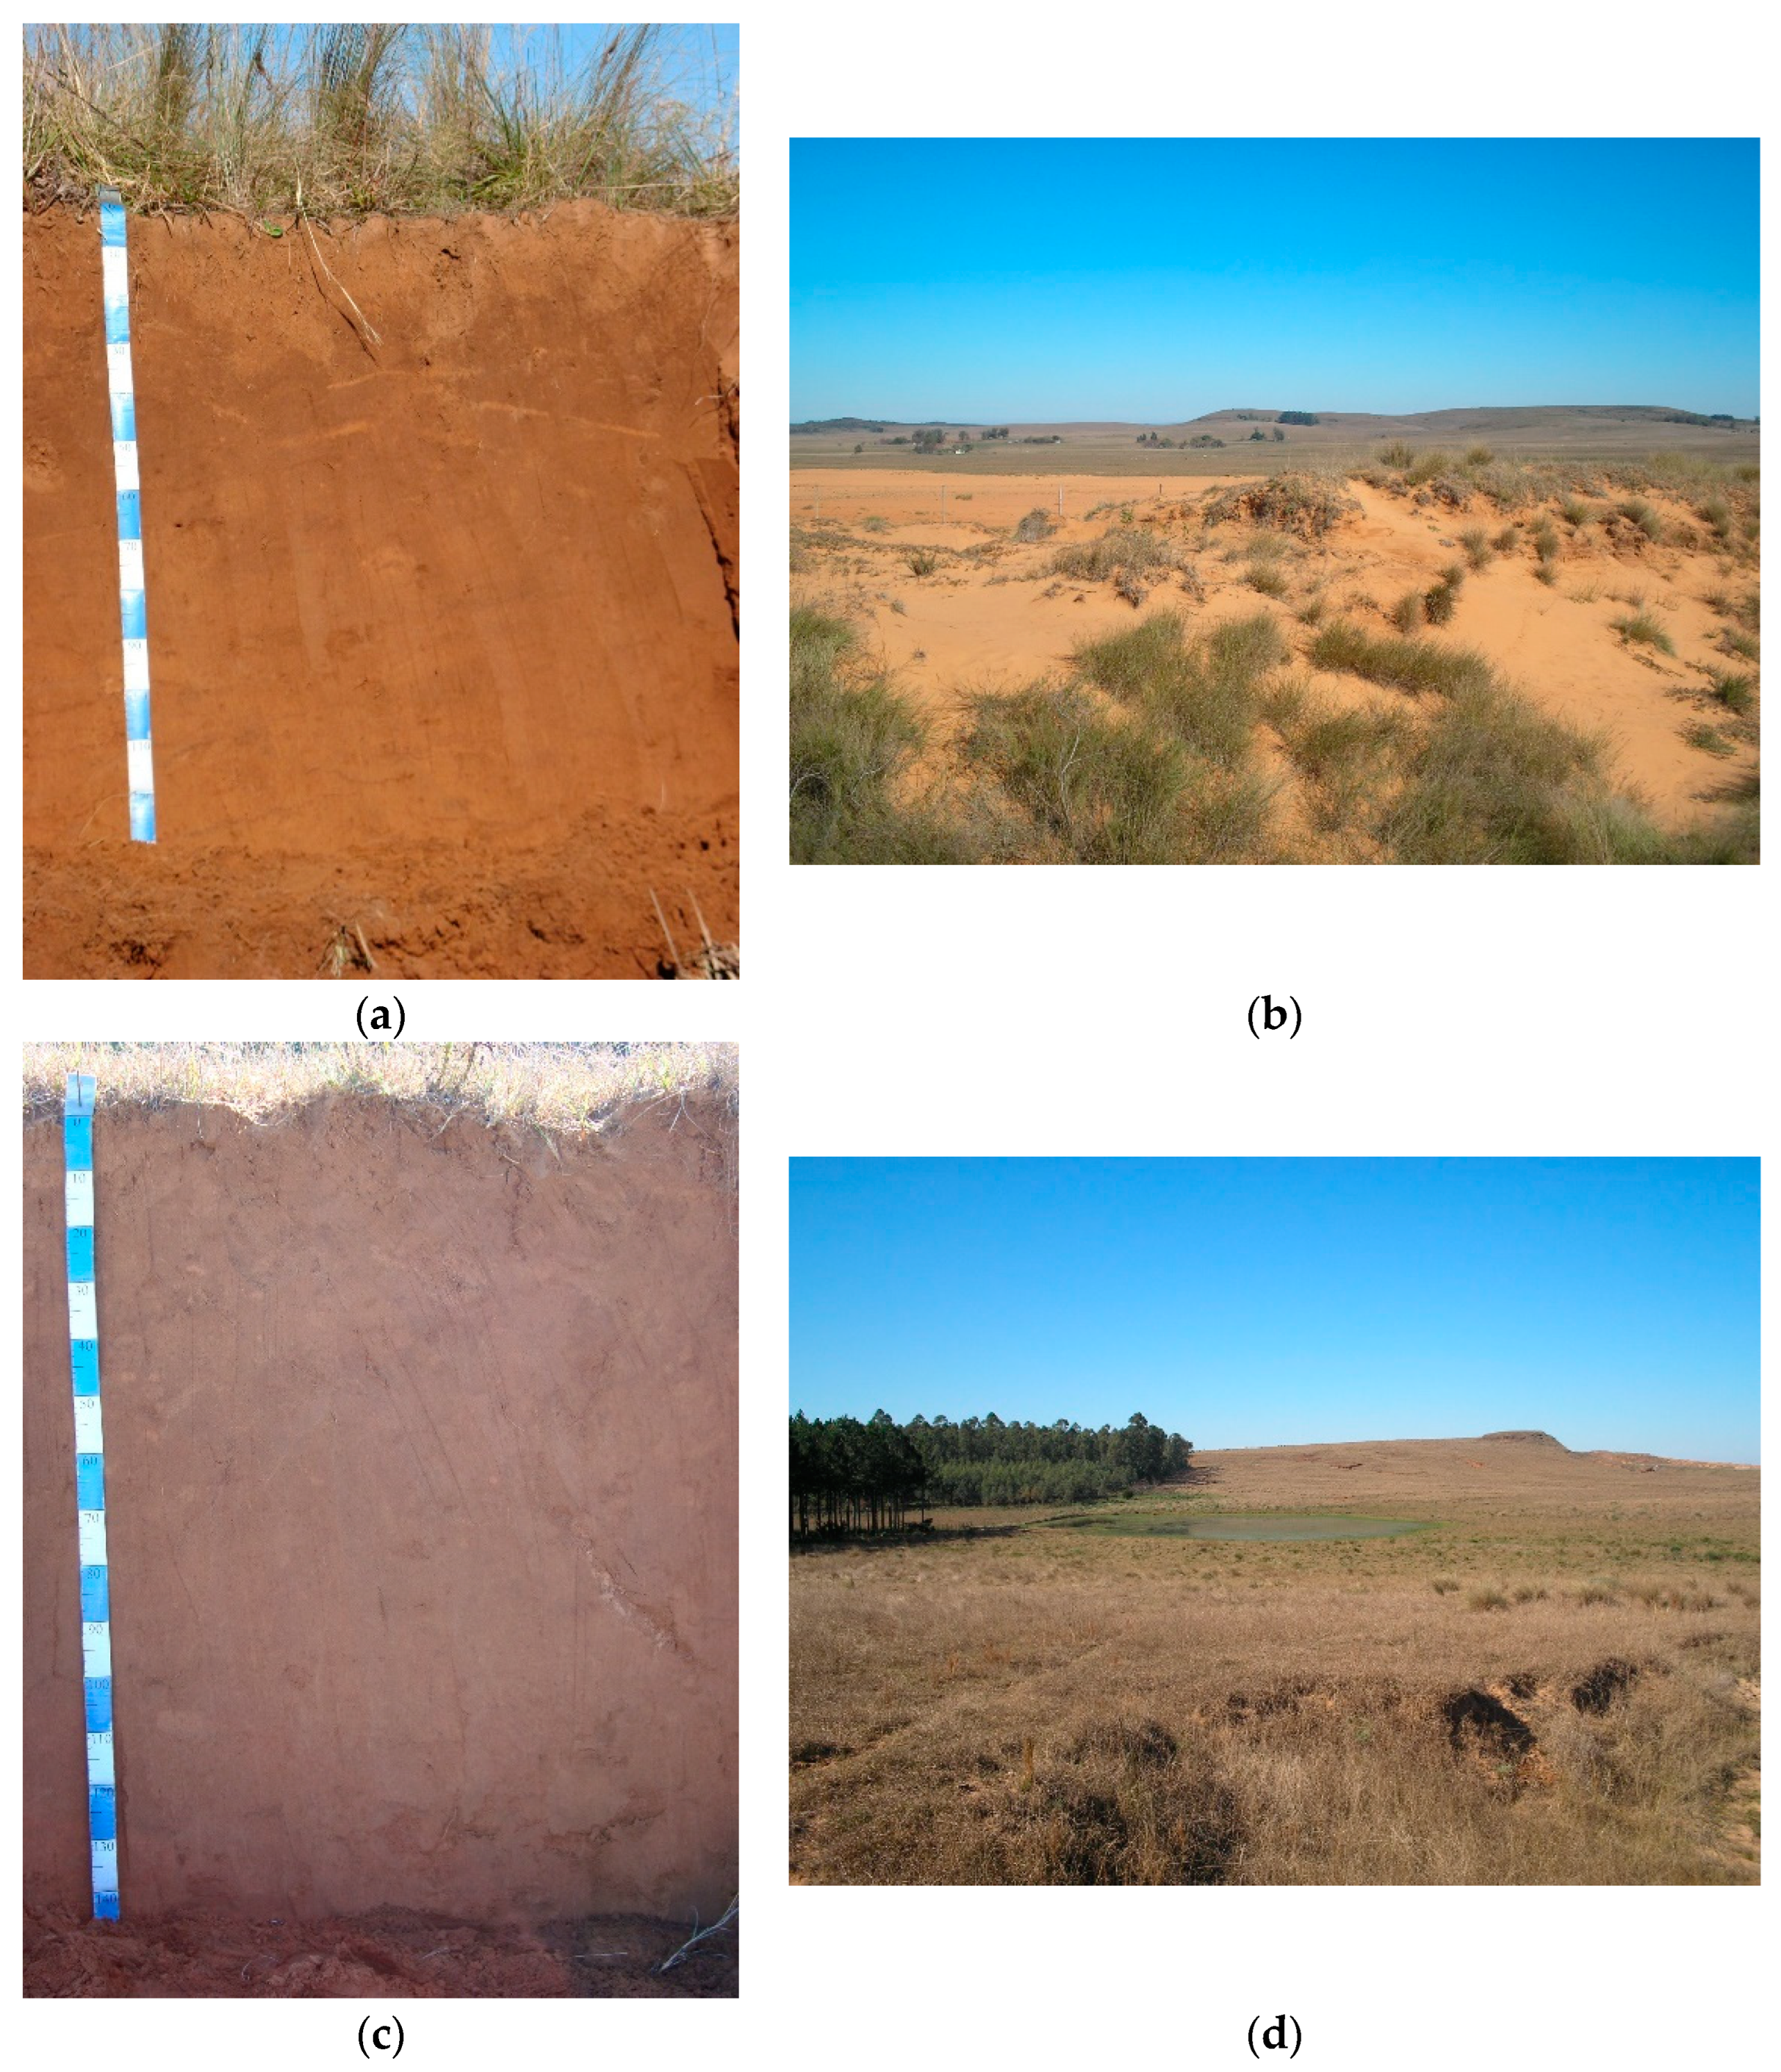
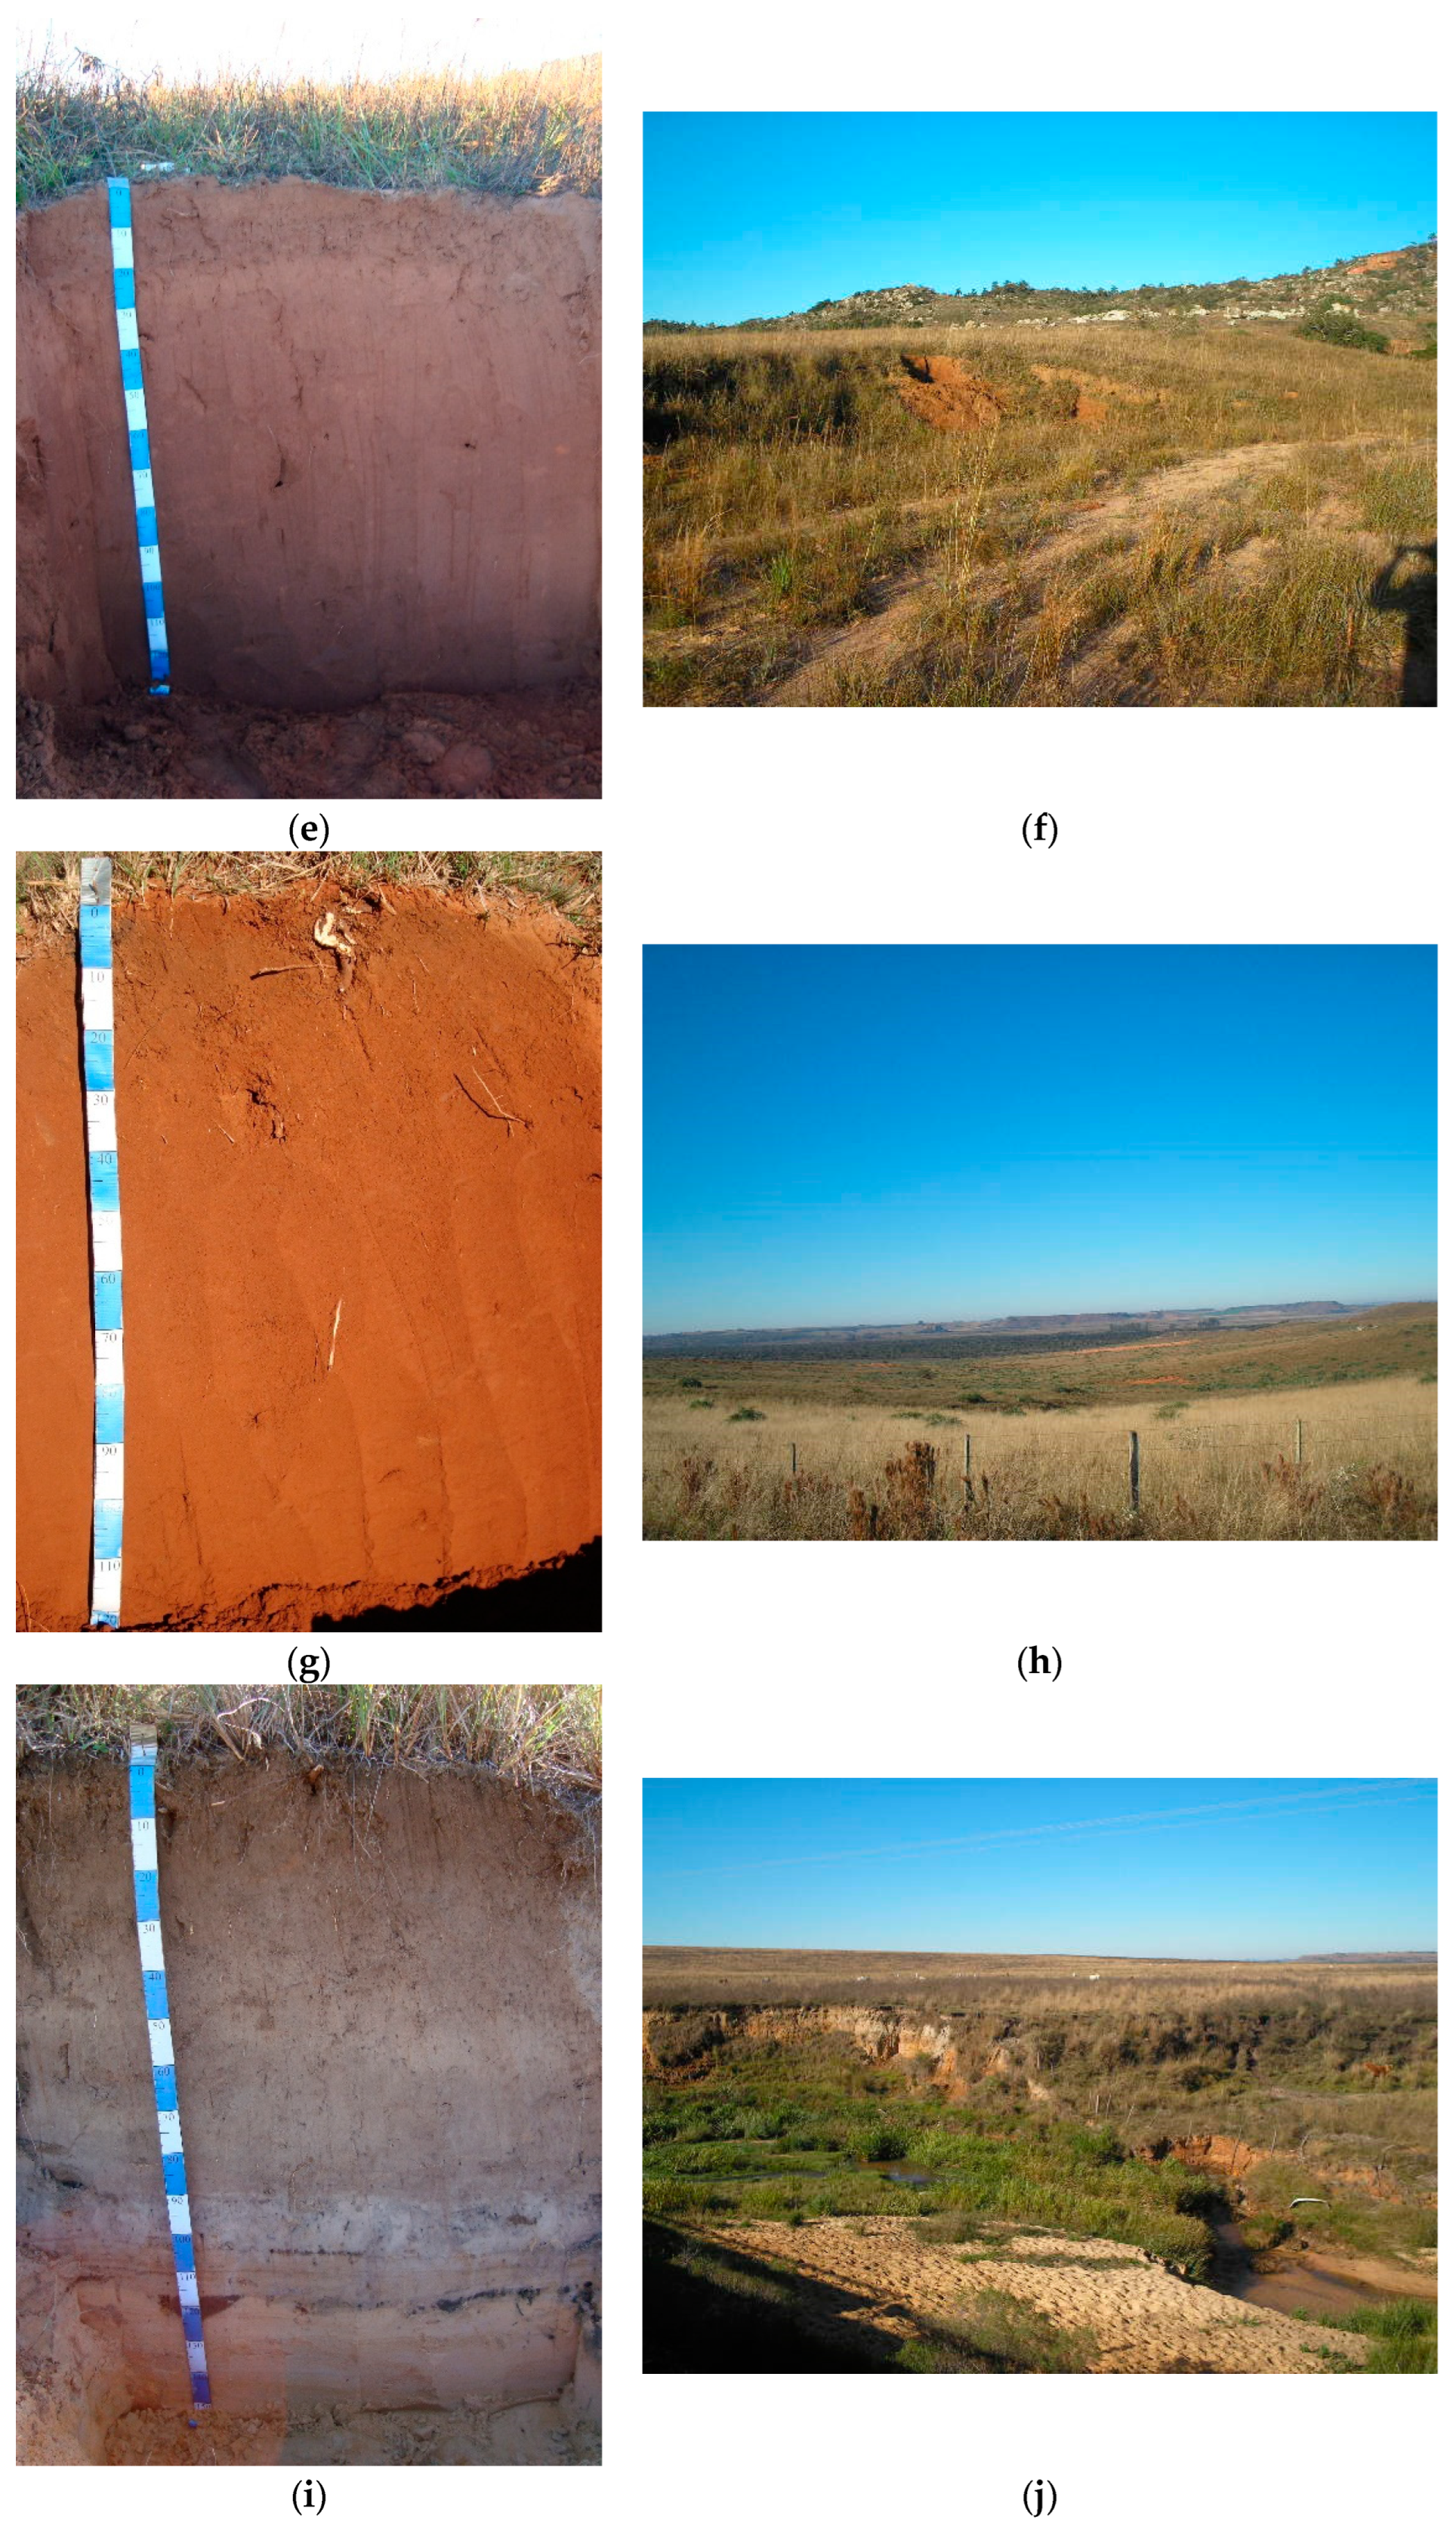
Figure 4 shows water and wind erosion and the extensive areas of bare and exposed Quartzipsamments to sandyzation.
The use of cover plants is efficient in reducing the transport of sand by the wind in these soils, being an effective alternative to contain the expansion of the sandyzation process [52].
In recent years, the return of soybean cultivation in Quartzipsamments has been observed; however, for their agricultural use, planning is essential to improve the structure of these soil, with the use of cover plants with a significant contribution of biomass to increase organic matter, soil physical structuring, and increase biological activity, and the use of soil and water conservation techniques. Moreover, cover crops can reduce evapotranspiration, a factor that can be limiting in these soils with low water-holding capacity. For example, Eltz and Rovedder [53] observed temperatures above 40 °C at 3 cm depth in exposed soil in a sandyzation area, but when this area was replanted with cover crops, the soil temperature was reduced by around 18.6%.
Among alternatives for cover crops, Rovedder [54] cites Lupinus albescens (lupine) as a potential specie for the recovery of sandy soils, while Reichert et al. (2016) found that eucalyptus was more efficient in increasing soil organic carbon after conversion from native field to conventional planting, eucalyptus and unvegetated area.
Silva [55] cites the dwarf butia tree (Butia lalemanti), a common palm in the sandy top relief and deep soil, mainly in the cities of São Francisco de Assis and Manoel Viana, as a contributor to the minimization of laminar erosion caused by floods, besides being a specie adapted to water stress.
Gass et al. [56] cite that the advance of monocrops on the sands of Rio Grande do Sul State have occurred without the knowledge of the potential use of native plant species endemic to the region, most of which are unknown in their food, medicinal, ornamental, aromatic properties, condiments, and for use in projects for the recovery of degraded areas.
From our study, we verify the low agricultural suitability and the high environmental fragility of Quartzipsamments in Rio Grande do Sul State. The agricultural use of these soils will be intensified, especially due to political and economic issues; therefore, studies are needed to guide farmers, extensionists, and stakeholders on the best way to use and manage them. Any incentive to use these sandy soils and the availability of technologies (e.g., irrigation, fertilizers, and machinery, among others) requires technical monitoring, specific recommendations for these soils, and monitoring of the soil and the environment. Specific recommendations include lower irrigation rates and more frequent application, due to the lower water-holding capacity of these soils and greater risk of nutrient leaching; split fertilization to reduce leaching and increase the efficiency of nutrient uptake by plants; include plant species adapted to this soil and climatic conditions in a rotation crop system, to produce enough volume of biomass to increase organic matter content, with consequent improvement of the soil physical structure and biological activity; maintenance of permanent vegetation cover on the soil surface to reduce water evaporation and erosion; and use of techniques and practices for soil and water conservation, such as terracing and keyline arrangement.

5. Conclusions

Quartzipsamments are soils with high macroporosity and saturated hydraulic conductivity, and these soils play an important role in aquifer recharge. On the other hand, their low content of clay and organic matter hinders the soil’s physical structuring and biological activity, making these soils susceptible to water and wind erosion and the sandyzation process, besides a high possibility of leaching.
Their sandy texture, extremely low volume of available water to plants, low fertility, and cation exchange capacity, besides wind erosion, hinder the development of vegetation in these soils and, given these characteristics, make these soils of low suitability for agricultural use and with a high risk of leaching and aquifer contamination. However, we verified that the increase in pH and organic matter can improve the fertility of these soils (especially Ca, Mg, K, cation exchange activity), and for organic matter, an improvement in the physical structure of the soil (increase in total porosity and decrease in bulk density) can occur also.
Some difficulties and challenges in the use and management of Quartzipsamments were pointed out in our study, and specific recommendations for better use and management of these soils were indicated.

Author Contributions

Conceptualization, L.E.A.S.S. and F.d.A.P.; methodology, L.E.A.S.S., F.d.A.P., R.B.d.O. and A.P.M.R.; formal analysis, L.E.A.S.S., F.d.A.P. and R.B.d.O.; investigation, L.E.A.S.S., F.d.A.P. and R.B.d.O.; resources, F.d.A.P.; data curation, L.E.A.S.S. and F.d.A.P.; writing—original draft preparation, L.E.A.S.S. and F.d.A.P.; writing—review and editing, L.E.A.S.S., F.d.A.P., R.B.d.O. and A.P.M.R. All authors have read and agreed to the published version of the manuscript.

Funding

This research received no external funding.

Institutional Review Board Statement

Not applicable.

Informed Consent Statement

Not applicable.

Data Availability Statement

Data available on request from the authors.

Conflicts of Interest

The authors declare no conflict of interest.

References

  1. Pedron, F.A.; Dalmolin, R.S.D. Solos Arenosos do Bioma Pampa Brasileiro; UFSM: Santa Maria, Brazil, 2019; 280p. [Google Scholar]
  2. Roesch, L.F.W.; Vieira, F.C.B.; Pereira, V.A.; Schünemann, A.L.; Teixeira, I.F.; Senna, A.J.T.; Stefenon, V.M. The Brazilian Pampa: A fragile biome. Diversity 2009, 1, 182–198. [Google Scholar] [CrossRef]
  3. Suertegaray, D.M.A.; Guasseli, L.A.; Verdum, R.; Basso, L.A.; Medeiros, R.M.V.; Bellanca, E.T.; Bertê, A.M.A. Projeto Arenização no Rio Grande do Sul, Brasil: Gênese, Dinâmica e Espacialização. In Anais do X Simpósio Brasileiro de Sensoriamento Remoto; INPE: Foz do Iguaçu, Brazil, 2001; pp. 349–356. Available online: http://marte.sid.inpe.br/col/dpi.inpe.br/lise/2001/09.14.12.00/doc/0349.356.234.pdf (accessed on 7 August 2022).
  4. Bellanca, E.T.; Suertegaray, D.M.A. Sítios Arqueológicos e Areias no Sudoeste do Rio Grande do Sul. Mercator–Rev. De Geogr. Da UFC 2003, 4, 99–114. Available online: http://www.mercator.ufc.br/mercator/article/view/155 (accessed on 7 August 2022).
  5. Caneppele, J.C.G. Espacialização da Arenização a Partir da Ecodinâmica e da Cartografia Ambiental. Master’s Thesis, Universidade Federal do Rio Grande do Sul, Instituto de Geociências, Porto Alegre, Brazil, 2017; 129p. Available online: http://hdl.handle.net/10183/171442 (accessed on 7 August 2022).
  6. Azevedo, A.C.; Kaminski, J. Considerações sobre os solos dos campos de areia no Rio Grande do Sul. Ciência Ambiente 1995, 11, 65–70. [Google Scholar]
  7. Suertegaray, D.M.A. Erosão nos campos sulinos: Arenização no sudoeste do Rio Grande do Sul. Rev. Bras. Geomorfologia 2011, 12, 61–74. [Google Scholar] [CrossRef]
  8. Donagemma, G.K.; de Freitas, P.L.; Balieiro, F.C.; Fontana, A.; Spera, S.T.; Lumbreras, J.F.; Viana, J.H.M.; Araújo Filho, J.C.; Santos, F.C.; de Albuquerque, M.R.; et al. Characterization, agricultural potential, and perspectives for the management of light soils in Brazil. Pesqui. Agropecu. Bras. 2016, 51, 1003–1020. [Google Scholar] [CrossRef]
  9. FAO-Food and Agriculture Organization of the United Nations. Lecture Notes on the Major Soils of the World; FAO-Food and Agriculture Organization of the United Nations: Rome, Italy, 2001; 300p, Available online: https://www.fao.org/publications/card/es/c/3aa8d214-f539-5c44-a603-9e4031c7fadd/ (accessed on 7 August 2022).
  10. Suertegaray, D.M.A.; Verdum, R.; Medeiros, R.M.; Guasselli, L.; Frank, M.W. Caracterização Hidrogeomorfológica e Uso do Solo em Áreas de Ocorrência de Areais: São Francisco de Assis/Manuel Viana. In Anais do VIII Simpósio Brasileiro de Sensoriamento Remoto; MCT/INPE: Salvador, Brazil, 1996; pp. 663–669. Available online: https://docplayer.com.br/41367129-Caracterizacao-hidrogeomorfologica-e-uso-do-solo-em-areas-de-ocorrencia-de-areais-sao-francisco-de-assis-manuel-viana.html (accessed on 7 August 2022).
  11. Da Costa, B.S.C.; Sluter, C.R.; Lescheck, A.L.; Rodrigues, E.L.S. Large-scale cartographic representation of relief features from sandyzation process. Bull. Geod. Sci. 2020, 26, e2020019. [Google Scholar] [CrossRef]
  12. Huang, J.; Hartemink, A.E. Soil and environmental issues in sandy soils. Earth Sci. Rev. 2020, 208, 103295. [Google Scholar] [CrossRef]
  13. Maluf, J.R.T. Nova classificação climática do Estado do Rio Grande do Sul. Rev. Bras. Agrometeorol. 2000, 8, 141–150. [Google Scholar]
  14. Instituto Rio Grandense do Arroz–IRGA. Médias Climatológicas; Instituto Rio Grandense do Arroz–IRGA: Porto Alegre, Brazil. Available online: https://irga.rs.gov.br/medias-climatologicas (accessed on 23 January 2023).
  15. Santos, H.G.; Jacomine, P.K.T.; Anjos, L.H.; Oliveira, V.A.; Lumbreras, J.F.; Coelho, M.R.; Almeida, J.A.; Araujo Filho, J.C.; Oliveira, J.B.; Cunha, T.J.F. Sistema Brasileiro de Classificação de Solos; Embrapa: Brasília, Brasil, 2018; Available online: https://ainfo.cnptia.embrapa.br/digital/bitstream/item/199517/1/SiBCS‐2018‐ISBN‐9788570358004.pdf (accessed on 29 November 2021).
  16. Soil Survey Staff. Keys to Soil Taxonomy, 12th ed.; USDA-Natural Resources Conservation Service: Washington, DC, USA, 2014. Available online: https://www.nrcs.usda.gov/wps/portal/nrcs/detail/soils/survey/class/taxonomy/?cid=nrcs142p2_053580 (accessed on 8 December 2021).
  17. Santos, R.D.; Santos, H.G.; Ker, J.C.; Anjos, L.H.C.; Shimizu, S.H. Manual de Descrição e Coleta de Solo no Campo, 7th ed.; Revisada e Ampliada; Sociedade Brasileira de Ciência do Solo: Viçosa, Brazil, 2015; 102p. [Google Scholar]
  18. Schoeneberger, P.J.; Wysocki, D.A.; Benham, E.C.; Soil Survey Staff. Field Book for Describing and Sampling Soils; Natural Resources Conservation Service, National Soil Survey Center: Lincoln, NE, USA, 2012. [Google Scholar]
  19. Klute, A.; Dirksen, C. Hydraulic conductivity and diffusivity: Laboratory methods. In Methods of Soil Analysis, Part 1: Physical and Mineralogical Methods; Klute, A., Ed.; American Society of Agronomy, Soil Science Society of America: Madison, WI, USA, 1986; pp. 687–734. [Google Scholar]
  20. Klute, A. Water retention: Laboratory methods. In Methods of Soil Analysis: Physical and Mineralogical Methods; Klute, A., Ed.; American Society of Agronomy, Soil Science Society of America: Madison, WI, USA, 1986; pp. 635–660. [Google Scholar]
  21. Blake, G.R.; Hartge, K.H. Bulk density. In Methods of Soil Analysis, Part 1: Physical and Mineralogical Methods, 2nd ed.; Klute, A., Ed.; American Society of Agronomy, Soil Science Society of America: Madison, WI, USA, 1986; pp. 363–375. [Google Scholar] [CrossRef]
  22. Viana, J.H.M.; Teixeira, W.G.; Donagemma, G.K. Densidade de partículas. In Manual de Métodos de Análise de Solo, 3rd ed.; Teixeira, P.C., Donagemma, G.K., Fontana, A., Teixeira, W.G., Eds.; Embrapa: Brasília, Brazil, 2017; pp. 76–81. Available online: https://www.embrapa.br/busca-de-publicacoes/-/publicacao/1085209/manual-de-metodos-de-analise-de-solo (accessed on 1 February 2023).
  23. Gee, G.W.; Or, D. Particle-size analysis. In Methods of Soil Analysis, Part 4: Physical Methods, 5th ed.; Dane, J.H., Topp, C., Eds.; Soil Science Society of America: Madison, WI, USA, 2002; pp. 255–293. [Google Scholar]
  24. United States Department of Agriculture (USDA)-National Resource Conservation Service (NRCS). Soil Texture Calculator. 2022. Available online: https://www.nrcs.usda.gov/wps/portal/nrcs/detail/?cid=nrcs142p2_054167 (accessed on 14 October 2022).
  25. Tedesco, M.J.; Gianello, C.; Bissani, C.A.; Volkweiss, S.J. Análises de Solo, Plantas e Outros Materiais, 2nd ed.; Departamento de Solos; UFRGS: Porto Alegre, Brazil, 1995; 174p. [Google Scholar]
  26. Nelson, E.W.; Sommers, L.E. Total carbon, organic carbon and organic matter. In Methods of Soil Analysis: Chemical and Microbiological Properties, Part 2; Page, A.L., Miller, R.H., Keeney, D.R., Eds.; Agronomy Monograph 9; ASA and Soil Science Society of America: Madison, WI, USA, 1982; pp. 539–579. [Google Scholar]
  27. SAS Institute Inc. SAS/STAT User’s Guide; SAS Institute Inc.: Cary, NC, USA, 1999. [Google Scholar]
  28. Sociedade Brasileira de Ciência do Solo-SBCS. Núcleo Regional Sul-NRS. Comissão de Química e Fertilidade do Solo. Manual de Adubação e Calagem para os Estados do Rio Grande do Sul e Santa Catarina; Sociedade Brasileira de Ciência do Solo-SBCS. Núcleo Regional Sul-NRS. Comissão de Química e Fertilidade do Solo: Viçosa, Brazil, 2016; 376p, Available online: http://www.sbcs-nrs.org.br/docs/Manual_de_Calagem_e_Adubacao_para_os_Estados_do_RS_e_de_SC-2016.pdf (accessed on 7 August 2022).
  29. Ernani, P.R. Química do Solo e Disponibilidade de Nutrientes; O Autor: Lages, Brazil, 2008; 230p. [Google Scholar]
  30. Reichert, J.M.; Amado, T.J.C.; Reinert, D.J.; Rodrigues, M.F.; Suzuki, L.E.A.S. Land use effects on subtropical, sandy soil under sandyzation/desertification processes. Agric. Ecosyst. Environ. 2016, 233, 370–380. [Google Scholar] [CrossRef]
  31. Suzuki, L.E.A.S.; Reinert, D.J.; Alves, M.C.; Reichert, J.M. Medium-term no-tillage, additional compaction, and chiseling as affecting clayey subtropical soil physical properties and yield of corn, soybean and wheat crops. Sustainability 2022, 14, 9717. [Google Scholar] [CrossRef]
  32. Reichert, J.M.; Suzuki, L.E.A.S.; Reinert, D.J.; Horn, R.; Håkansson, I. Reference bulk density and critical degree-of-compactness for no-till crop production in subtropical highly weathered soils. Soil Tillage Res. 2009, 102, 242–254. [Google Scholar] [CrossRef]
  33. Suzuki, L.E.A.S.; Reichert, J.M.; Reinert, D.J. Degree of compactness, soil physical properties and yield of soybean in six soils under no-tillage. Soil Res. 2013, 51, 311–321. [Google Scholar] [CrossRef]
  34. Suzuki, L.E.A.S.; Reichert, J.M.; Reinert, D.J.; de Lima, C.L.R. Degree of compactness and mechanical properties of a subtropical Alfisol with eucalyptus, native forest, and grazed pasture. For. Sci. 2015, 61, 716–722. [Google Scholar] [CrossRef]
  35. Suzuki, L.E.A.S.; Reinert, D.J.; Alves, M.C.; Reichert, J.M. Critical limits for soybean and black bean root growth, based on macroporosity and penetrability, for soils with distinct texture and management systems. Sustainability 2022, 14, 2958. [Google Scholar] [CrossRef]
  36. Mesquita, M.G.B.F.; Moraes, S.O. A dependência entre a condutividade hidráulica saturada e atributos físicos do solo. Ciênc. Rural 2004, 34, 963–969. [Google Scholar] [CrossRef]
  37. Deb, S.K.; Shukla, M.K. Variability of hydraulic conductivity due to multiple factors. Am. J. Environ. Sci. 2012, 8, 489–502. [Google Scholar] [CrossRef]
  38. Reichert, J.M.; Albuquerque, J.A.; Kaiser, D.R.; Reinert, D.J.; Urach, F.L.; Carlesso, R. Estimation of water retention and availability in soils of Rio Grande do Sul. Rev. Bras. Ciênc. Solo 2009, 33, 1547–1560. [Google Scholar] [CrossRef]
  39. Dos Santos, N.G.N.; Olszevski, N.; Salviano, A.M.; Cunha, T.J.F.; Giongo, V.; Pereira, J.S. Granulometric fractions and physical-hydric behavior of sandy soils. Rev. Agrar. 2019, 12, 318–327. [Google Scholar] [CrossRef]
  40. Djajadi, D.; Heliyanto, B.; Hidayah, N. Changes of physical properties of sandy soil and growth of physic nut (Jatropha curcas L.) due to addition of clay and organic matter. Agrivita 2011, 33, 245–250. [Google Scholar] [CrossRef]
  41. Radwan, N.M.; Marzouk, E.R.; El-Melegy, A.M.; Hassan, M.A. Improving sandy soil properties by using biochar. SINAI J. Appl. Sci. 2020, 9, 157–168. [Google Scholar] [CrossRef]
  42. Hartemink, A.E.; Huting, J. Sandy soils in Southern and Eastern Africa: Extent, properties and management. In Proceedings of the Management of Tropical Sandy Soils for Sustainable Agriculture, Khon Khaen, Thailand, 27 November–2 December 2005; pp. 54–59. Available online: https://www.fao.org/3/ag125e/AG125E08.htm (accessed on 7 August 2022).
  43. Bezabih, B.; Aticho, A.; Mossisa, T.; Dume, B. The effect of land management practices on soil physical and chemical properties in Gojeb Sub-river Basin of Dedo District, Southwest Ethiopia. J. Soil Sci. Environ. Manag. 2016, 7, 154–165. [Google Scholar] [CrossRef]
  44. Olorunfemi, I.E.; Fasinmirina, J.T.; Akinola, F.F. Soil physico-chemical properties and fertility status of longterm land use and cover changes: A case study in forest vegetative zone of Nigeria. Eurasian J. Soil Sci. 2018, 7, 133–150. [Google Scholar] [CrossRef] [Green Version]
  45. Blanchart, E.; Albrecht, A.; Bernoux, M.; Brauman, A.; Chotte, J.L.; Feller, C.; Ganry, F.; Hien, E.; Manlay, R.; Masse, D.; et al. Organic matter and biofunctioning in tropical sandy soils and implications for its management. In Proceedings of the Management of Tropical Sandy Soils for Sustainable Agriculture, Khon Khaen, Thailand, 27 November–2 December 2005; pp. 224–241. Available online: https://cupdf.com/document/organic-matter-and-biofunctioning-in-tropical-sandy-soils-of-organic-matter.html?page=1 (accessed on 7 August 2022).
  46. Tisdall, J.M.; Oades, J.M. Organic matter and water stable aggregates in soils. J. Soil Sci. 1982, 33, 141–163. [Google Scholar] [CrossRef]
  47. Minhal, F.; Ma’as, A.; Hanudin, E.; Sudira, P. Improvement of the chemical properties and buffering capacity of coastal sandy soil as affected by clay and organic by-product application. Soil Water Res. 2020, 15, 93–100. [Google Scholar] [CrossRef]
  48. Ozores-Hampton, M.; Stansly, P.A.; Salame, T.P. Soil chemical, physical, and biological properties of a sandy soil subjected to long-term organic amendments. J. Sustain. Agric. 2011, 35, 243–259. [Google Scholar] [CrossRef]
  49. Aranyos, J.T.; Tomócsik, A.; Makádi, M.; Mészáros, J.; Blaskó, L. Changes in physical properties of sandy soil after long-term compost treatment. Int. Agrophys. 2016, 30, 269–274. [Google Scholar] [CrossRef]
  50. Lipiec, J.; Usowicz, B. Quantifying cereal productivity on sandy soil in response to some soil-improving cropping systems. Land 2021, 10, 1199. [Google Scholar] [CrossRef]
  51. Thomaz, E.L.; Fidalski, J. Interrill erodibility of different sandy soils increases along a catena in the Caiuá Sandstone Formation. Rev. Bras. Ciênc. Solo 2020, 44, e0190064. [Google Scholar] [CrossRef]
  52. Rovedder, A.P.M.; Eltz, F.L.F. Revegetação com plantas de cobertura em solos arenizados sob erosão eólica no Rio Grande do Sul. Rev. Bras. Ciênc. Solo 2008, 32, 315–321. [Google Scholar] [CrossRef]
  53. Eltz, F.L.F.; Rovedder, A.P.M. Revegetação e temperatura do solo em áreas degradadas no sudoeste do Rio Grande do Sul. Rev. Bras. Agrociência 2005, 11, 193–200. Available online: https://periodicos.ufpel.edu.br/ojs2/index.php/CAST/article/view/1211 (accessed on 1 February 2023).
  54. Rovedder, A.P.M. Potencial do Lupinus Albescens Hook. & Arn. Para Recuperação de Solos Arenizados do Bioma Pampa. Ph.D. Thesis, Universidade Federal de Santa Maria, Santa Maria, Brazil, 2007; 126p. Available online: https://repositorio.ufsm.br/handle/1/3384 (accessed on 7 August 2022).
  55. da Silva, L.A.P. Narrativas das Percepções e Conectividade de Caminhantes nas Paisagens dos Areais Pampeanos: Perspectivas Ambientais para Geração de Ambiências. Master’s Thesis, Universidade Federal do Rio Grande do Sul, Instituto de Geociências, Porto Alegre, Brazil, 2008; 154p. Available online: https://lume.ufrgs.br/handle/10183/15719 (accessed on 7 August 2022).
  56. Gass, S.L.B.; Verdum, R.; Vieira, L.F.S.; Caneppele, J.C.G.; Laurent, F. Os areais do sudoeste do Rio Grande do Sul, Brasil, como patrimônio geomorfológico. Physis Terrae Rev. Ibero-Afro-Am. Geogr. Física Ambiente 2019, 1, 101–119. [Google Scholar] [CrossRef]
Figure 1. Map without scale from South America (a) Brazil and Rio Grande do Sul State highlighted (yellow) (b) and the cities of Quaraí (latitude 30°23′17″ S; longitude 56°29′56″ W; 112 m mean altitude; area ≅ 3238 km2), Manoel Viana (latitude 29°35′07″ S; longitude 55°29′13″ W; 113 m mean altitude; area ≅ 1391 km2), and São Francisco de Assis (latitude 29°33′01” S; longitude 55°07′52″ W; 125 m mean altitude; area ≅ 2507 km2), Rio Grande do Sul State (c).
Soilsystems 07 00009 g001
Figure 2. Mean monthly rainfall and temperature for the period 1981–2010. Climatological mean based on 30 years of data (1981–2010), using official INMET stations, and later interpolating for locations that do not have a meteorological data measurement station. Source: [14].
Soilsystems 07 00009 g002
Figure 3. Quartzipsamments profiles NQ1 and NQ2 from Quaraí city (respectively, (a,c)), NQ3 and NQ4 from Manoel Viana city (respectively, (e,g)), NQ5 and NQ6 from São Francisco de Assis city (respectively, (i,k)), Rio Grande do Sul State, and their respective landscape (respectively, (b,d,f,h,j,l)). Each color on the measuring tape represents 10 cm in the profile pictures. Source: pictures taken by F.d.A. Pedron and L.E.A.S. Suzuki.
Soilsystems 07 00009 g003aSoilsystems 07 00009 g003bSoilsystems 07 00009 g003c
Figure 4. Pictures showing the native field. Soil exposing the sandyzation and erosion in the Quartzipsamments of the Southwest of Rio Grande do Sul State, southern Brazil. Source: pictures taken by L.E.A.S. Suzuki.
Soilsystems 07 00009 g004
Table 1. Morphological data of the Quartzipsamments profiles of the Southwest of Rio Grande do Sul State, southern Brazil.
HorizonDepth (cm)Moist Color1 Moist ConsistencyWet ConsistencyHorizon BoundaryStructure
NQ1
Ap0–2010YR 6/4LNP/NSI-CSB-SG
A20–6510YR 4/4VFNP/NSS-GSB-SG
C165–9410YR 5/6L-VFNP/NSS-GSB-SG
C294–15010YR 6/6L-VFNP/NSS-GSB-SG
NQ2
A0–1210YR 4.5/5LNP/NSI-ASB-SG
C112–4210YR 4/5LNP/NSS-CSB-SG
C242–8510YR 4/5LNP/NSS-GSB-SG
C385–14510YR 5/8LNP/NSS-GSB-SG
NQ3
A0–227.5YR 5/7LNP/NSS-CSB-SG
C122–537.5YR 5/6LNP/NSS-CSB-SG
C253–937.5YR 4.5/6LNP/NSS-GSB-SG
C393–1507.5YR 7/4LNP/NSS-GSB-SG
NQ4
A0–152.5YR 3.5/4LNP/NSS-CSB-SG
C115–402.5YR 4/4LNP/NSS-CSB-SG
C240–722.5YR 4/6LNP/NSS-CSB-SG
C372–1402.5YR 4/7LNP/NSS-CSB-SG
NQ5
A0–205YR 5/8LNP/NSS-CSB-SG
C120–665YR 5/8LNP/NSS-GSB-SG
C266–1005YR 5/8LNP/NSS-CSB-SG
C3100–1705YR 5/8LNP/NSS-CSB-SG
NQ6
A10–185YR 5/4LNP/NSS-CSB-SG
A218–435YR 5/6LNP/NSS-GSB-SG
C143–605YR 5/8LNP/NSS-GSB-SG
C260–935YR 4/8LNP/NSS-ASB-SG
C393–1255YR 4.5/8LNP/NSS-CSB-SG
C4125–1705YR 4/8LNP/NSS-CSB-SG
1 Consistency: L—Loose, VF—Very Friable, NP—Non-plastic, NS—Non-sticky; Horizon boundary: A—Abrupt, C—Clear. G—Gradual, D—Diffuse, S—Smooth, I—Irregular; Structure: SB—Subangular Blocky, SG—Single Grain. NQ1 and NQ2: Quartzipsamments from Quaraí city; NQ3 and NQ4: Quartzipsamments from Manoel Viana city; NQ5 and NQ6: Quartzipsamments from São Francisco de Assis city.
Table 2. Sand size distribution of the Quartzipsamments profiles of the Southwest of Rio Grande do Sul State, southern Brazil.
Sand
HorizonDepthTotalVery CoarseCoarseMediumFineVery Fine
(cm)(g kg−1)
NQ1
Ap0–20954.941.5412.94633.33287.5119.62
A20–65947.570.3312.42477.15393.5764.10
C165–94843.692.4216.78498.24297.2129.04
C294–150904.973.2616.65414.45422.1248.49
Mean 912.791.8914.70505.79350.1040.31
CV, % 5.1970.9121.8317.3619.5446.80
NQ2
A0–12941.920.0027.75420.95243.49249.73
C112–42947.260.0030.51431.11419.4866.16
C242–85923.140.0021.91261.84538.37101.02
C385–145846.044.7727.41543.40248.7221.74
Mean 914.591.1926.90414.33362.52109.66
CV, % 4.76188.2216.3826.1444.87115.91
NQ3
A0–22948.510.0029.29402.02445.9371.27
C122–53912.023.0625.55480.54364.9437.93
C253–93897.232.7211.71348.15458.6875.97
C393–150916.991.3810.97466.44362.8775.33
Mean 918.691.7919.38424.29408.1165.13
CV, % 2.1876.3645.8113.3812.1426.52
NQ4
A0–15925.401.0015.54508.97337.4062.49
C115–40874.731.7614.72473.65349.8934.71
C240–72970.861.417.14542.24389.5530.52
C372–140957.402.0416.06577.46333.7928.05
Mean 932.101.5513.37525.58352.6638.94
CV, % 4.2526.7034.778.207.8439.06
NQ5
A0–20949.143.4829.33615.37278.9122.05
C120–66930.600.0029.84302.17515.2583.34
C266–100914.610.0733.18350.22484.3046.84
C3100–170947.890.0038.13389.14448.7471.88
Mean 935.560.8932.62414.23431.8056.03
CV, % 1.62185.1615.4031.0322.5945.43
NQ6
A10–18914.352.7318.22443.06406.1044.24
A218–43929.860.0515.96218.13577.04118.68
C143–60834.044.5422.59541.46243.4422.01
C260–93967.481.9323.08756.38178.667.43
C393–125955.043.3114.53505.03393.0539.12
C4125–170923.811.2015.36531.54311.2264.49
Mean 920.762.2918.29499.27351.5949.33
CV, % 4.8669.7923.8733.7338.8476.22
Very coarse sand: 2–1 mm; Coarse sand: 1–0.5 mm; Medium sand: 0.5–0.25 mm; Fine sand: 0.5–0.25 mm; Very fine sand: 0.25–0.05 mm. CV: coefficient of variation. NQ1 and NQ 2: Quartzipsamments from Quaraí city; NQ3 and NQ4: Quartzipsamments from Manoel Viana city; NQ5 and NQ6: Quartzipsamments from São Francisco de Assis city.
Table 3. Silt and clay content, degree of flocculation (DF), and textural class [24] of the Quartzipsamments profiles of the Southwest of Rio Grande do Sul State, southern Brazil.
HorizonDepthSiltClayDFTextural
(cm) (g kg−1)(%)Class
NQ1
Ap0–2018.3226.7373.49Sand
A20–6514.9337.5078.70Sand
C165–9434.43121.8731.47Loamy sand
C294–15028.9366.1056.08Sand
Mean 24.1563.0559.94
CV, % 36.6562.5433.16
NQ2
A0–1228.0530.0338.46Sand
C112–4229.7123.038.78Sand
C242–8531.2945.5728.59Sand
C385–14542.10111.8546.85Loamy sand
Mean 32.7952.6230.67
CV, % 21.5371.4349.66
NQ3
A0–2220.4831.0130.53Sand
C122–5335.2652.7232.44Sand
C253–9357.3545.4236.21Sand
C393–15028.4254.5947.74Sand
Mean 35.3845.9436.73
CV, % 41.8921.6322.34
NQ4
A0–1520.6453.9730.33Sand
C115–4031.8693.4254.18Sand
C240–724.5324.6259.00Sand
C372–1409.4433.1772.69Sand
Mean 16.6251.3054.05
CV, % 68.8455.3631.71
NQ5
A0–2013.8337.0371.61Sand
C120–6638.7930.6239.46Sand
C266–10037.4247.9625.82Sand
C3100–17021.6030.5077.03Sand
Mean 27.9136.5353.48
CV, % 40.7820.8843.27
NQ6
A10–1837.5548.1045.88Sand
A218–4336.5733.5743.35Sand
C143–6039.66126.2956.84Loamy sand
C260–937.5125.0153.99Sand
C393–12513.9031.0649.94Sand
C4125–17016.2759.9280.79Sand
Mean 25.2453.9955.13
CV, % 53.9066.458.24
Silt: 0.05–0.002 mm; Clay: <0.002 mm. CV: coefficient of variation. NQ1 and NQ2: Quartzipsamments from Quaraí city; NQ3 and NQ4: Quartzipsamments from Manoel Viana city; NQ5 and NQ6: Quartzipsamments from São Francisco de Assis city.
Table 4. Mean values of physical–hydric properties of Quartzipsamments profiles of the Southwest of Rio Grande do Sul State, southern Brazil.
HorizonDepth (cm)TP (m3 m−3)Macro (m3 m−3)Micro (m3 m−3)BD (Mg m−3)PD (Mg m−3)KS (mm h−1)AW (m3 m−3)
NQ1
Ap0–200.5220.3730.1501.322.63223.510.013
A20–650.4430.2820.1611.482.67170.370.028
C165–940.4290.2720.1571.482.63244.220.021
C294–1500.4320.2790.1531.472.67293.760.027
Mean 0.4570.3020.1551.442.65233.830.022
CV, % 2.183.264.172.800.0013.1935.03
NQ2
A0–120.4580.3230.1351.442.70398.190.015
C112–420.3980.2750.1241.422.67447.970.022
C242–850.3850.2530.1321.412.70430.580.019
C385–1450.3800.2540.1271.452.70346.730.025
Mean 0.4070.2780.1301.432.69407.570.020
CV, % 4.937.506.804.700.008.8832.81
NQ3
A0–220.4660.3480.1181.332.70478.130.014
C122–530.4190.3000.1201.432.67367.270.021
C253–930.4110.2840.1271.462.74339.200.029
C393–1500.4010.2600.1411.462.70342.980.022
Mean 0.4240.3000.1271.422.70377.150.022
CV, % 4.346.324.803.100.0015.3033.09
NQ4
A0–150.4800.3080.1711.432.67220.830.023
C115–400.4460.2630.1821.492.70127.850.034
C240–720.4490.2940.1551.422.70262.800.032
C372–1400.4530.3050.1471.432.74414.660.038
Mean 0.4570.2930.1641.442.70268.230.032
CV, % 4.997.994.493.600.0019.7140.12
NQ5
A0–200.4840.3460.1381.392.70313.930.017
C120–660.4520.3160.1361.392.74347.010.027
C266–1000.4380.3100.1281.382.74475.600.019
C3100–1700.4360.3130.1231.472.74458.280.022
Mean 0.4520.3220.1311.412.73399.490.021
CV, % 2.684.283.222.100.0012.9330.77
NQ6
A10–180.4910.3820.1091.362.74672.260.018
A218–430.4640.3590.1051.392.70671.870.022
C143–600.4420.3510.0911.512.70473.610.006
C260–930.4090.2950.1141.422.70402.510.017
C393–1250.4190.3120.1071.472.78237.200.007
C4125–1700.4610.3780.0831.642.74645.440.007
Mean 0.4480.3460.1021.472.73513.800.013
CV, % 4.335.9110.874.960.0014.0764.04
TP: total porosity; Macro: macroporosity; Micro: microporosity; BD: bulk density; PD: particle density; KS: saturated hydraulic conductivity; AW: available water (water volume between 10 kPa and 1500 kPa-tension). CV: coefficient of variation. NQ1 and NQ 2: Quartzipsamments from Quaraí city; NQ3 and NQ4: Quartzipsamments from Manoel Viana city; NQ5 and NQ6: Quartzipsamments from São Francisco de Assis city.
Table 5. Mean values of chemical parameters and interpretation * of Quartzipsamments profiles of the Southwest of Rio Grande do Sul State, southern Brazil.
HorizonDepth (cm)pH WaterpH KClCaMgNaK
cmolc kg−1
NQ1
Ap0–205.14.74.5 (High)0.99 (Medium)0.270.44 (Very low)
A20–655.34.83.75 (Medium)0.73 (Medium)0.270.26 (Very low)
C165–945.44.94.00 (Medium)0.82 (Medium)0.270.20 (Very low)
C294–1505.44.94.42 (High)0.94 (Medium)0.400.20 (Very low)
Mean 5.34.84.19 (High)0.87 (Medium)0.300.28 (Very low)
CV, % 1.821.6512.9216.2339.4240.39
NQ2
A0–125.44.92.97 (Medium)0.54 (Medium)0.480.52 (Very low)
C112–425.44.90.84 (Low)0.14 (Low)0.350.29 (Very low)
C242–855.34.70.29 (Low)0.08 (Low)0.300.20 (Very low)
C385–1455.34.81.36 (Low)0.21 (Low)0.270.17 (Very low)
Mean 5.44.81.37 (Low)0.24 (Low)0.350.30 (Very low)
CV, % 2.112.5583.3753.6530.3150.86
NQ3
A0–225.04.52.16 (Medium)0.35 (Low)0.220.38 (Very low)
C122–535.14.50.90 (Low)0.15 (Low)0.140.13 (Very low)
C253–935.24.70.85 (Low)0.11 (Low)0.050.05 (Very low)
C393–1505.24.70.13 (Low)0.06 (Low)0.110.04 (Very low)
Mean 5.14.61.01 (Low)0.17 (Low)0.130.15 (Very low)
CV, % 3.175.6079.5838.4465.45101.51
NQ4
A0–155.34.810.16 (High)3.71 (High)0.190.32 (Very low)
C115–405.44.87.75 (High)2.11 (High)0.290.23 (Very low)
C240–725.24.83.08 (Medium)0.55 (Medium)0.150.14 (Very low)
C372–1405.24.71.78 (Low)0.28 (Low)0.160.13 (Very low)
Mean 5.34.85.69 (High)1.66 (High)0.200.21 (Very low)
CV, % 0.870.6764.4182.5831.4140.48
NQ5
A0–204.84.10.05 (Low)0.05 (Low)0.320.13 (Very low)
C120–665.04.30.31 (Low)0.08 (Low)0.220.08 (Very low)
C266–1005.34.80.03 (Low)0.03 (Low)0.160.03 (Very low)
C3100–1705.24.81.05 (Low)0.12 (Low)0.180.05 (Very low)
Mean 5.14.50.36 (Low)0.07 (Low)0.220.07 (Very low)
CV, % 0.891.61124.6721.8538.8757.46
NQ6
A10–185.14.51.49 (Low)0.23 (Low)0.100.19 (Very low)
A218–435.04.50.04 (Low)0.05 (Low)0.350.11 (Very low)
C143–605.14.70.35 (Low)0.08 (Low)0.250.08 (Very low)
C260–935.14.50.05 (Low)0.04 (Low)0.080.07 (Very low)
C393–1254.84.20.49 (Low)0.07 (Low)0.150.04 (Very low)
C4125–1704.94.20.81 (Low)0.13 (Low)0.400.07 (Very low)
Mean 5.04.40.54 (Low)0.10 (Low)0.220.09 (Very low)
CV, % 4.965.7899.3627.8963.3651.40
pH water: pH determined in water 1:1 (soil:water); pH KCl: pH determined in KCl; Ca: calcium; Mg: magnesium; Na: sodium; K: potassium; CV: coefficient of variation. * Interpretation: in parentheses is the interpretation of levels according to the “Manual de adubação e de calagem para os Estados do Rio Grande do Sul e Santa Catarina/Manual of fertilization and liming to the Rio Grande do Sul and Santa Catarina States” [28], while some chemical parameters do not have available the interpretation in the handbook. NQ1 and NQ 2: Quartzipsamments from Quaraí city; NQ3 and NQ4: Quartzipsamments from Manoel Viana city; NQ5 and NQ6: Quartzipsamments from São Francisco de Assis city.
Table 6. Mean values of chemical parameters and interpretation * of Quartzipsamments profiles of the Southwest of Rio Grande do Sul State, Brazil.
CECSaturation
HorizonDepthAl3+H + AlEffectivepH7.0BasesAlOM
(cm)(cmolc kg−1)(%)
NQ1
Ap0–200.291.36.67.5(Low)83.34.361.58 (Low)
A20–650.291.15.36.1(Low)82.75.400.51 (Low)
C165–940.171.55.56.7(Low)78.43.151.14 (Low)
C294–1500.231.16.27.0(Low)85.03.700.40 (Low)
Mean 0.251.35.96.8(Low)82.44.150.91 (Low)
CV, % 35.5617.6314.1412.503.8333.03
NQ2
A0–120.231.94.76.4(Low)70.74.832.02 (Low)
C112–420.522.32.13.9(Low)41.524.172.18 (Low)
C242–850.402.11.32.9(Low)29.331.870.77 (Low)
C385–1450.401.72.43.7(Low)54.816.600.42 (Low)
Mean 0.392.02.64.2(Low)49.119.371.35 (Low)
CV, % 29.6714.7052.7133.7830.4853.73
NQ3
A0–220.171.93.35.0(Low)62.55.233.37 (Medium)
C122–530.401.91.73.2(Low)41.323.371.16 (Low)
C253–930.522.31.63.3(Low)31.832.731.07 (Low)
C393–1500.522.50.92.8(Low)12.259.980.32 (Low)
Mean 0.402.21.93.6(Low)37.030.331.48 (Low)
CV, % 40.7914.3548.5624.7246.7065.81
NQ4
A0–150.232.514.616.9 (High)85.31.574.38 (Medium)
C115–400.573.310.913.7 (Medium)75.95.232.94 (Medium)
C240–720.693.54.67.4 (Low)52.814.921.93 (Low)
C372–1400.753.13.15.4 (Low)43.124.081.32 (Low)
Mean 0.563.18.310.9 (Medium)64.311.452.64 (Medium)
CV, % 39.5414.0359.7645.2027.5682.95
NQ5
A0–200.522.71.13.2 (Low)17.248.051.56 (Low)
C120–660.572.51.33.2 (Low)21.845.361.33 (Low)
C266–1000.402.70.62.9 (Low)8.362.200.84 (Low)
C3100–1700.402.31.83.7 (Low)38.022.320.46 (Low)
Mean 0.472.61.23.3 (Low)21.344.481.05 (Low)
CV, % 26.198.3735.1510.0643.4231.00
NQ6
A10–180.523.32.55.3 (Low)37.820.483.57 (Medium)
A218–430.523.31.13.9 (Low)14.448.082.36 (Low)
C143–600.403.11.23.9 (Low)19.634.670.91 (Low)
C260–930.342.30.62.5 (Low)9.459.250.53 (Low)
C393–1250.171.50.92.2 (Low)34.018.580.43 (Low)
C4125–1700.231.31.62.7 (Low)53.113.890.05 (Low)
Mean 0.362.51.33.4 (Low)28.132.491.31 (Low)
CV, % 43.4737.3247.0532.4749.7952.99
Al3+: aluminum; H + Al: potential acidity; CEC effective: effective cation exchange capacity; CECpH7.0: cation exchange capacity at pH 7.0; OM: organic matter; CV: coefficient of variation. * Interpretation: in parentheses is the interpretation of levels according to the “Manual de adubação e de calagem para os Estados do Rio Grande do Sul e Santa Catarina/Manual of fertilization and liming to the Rio Grande do Sul and Santa Catarina States” [28], while some chemical parameters do not have available the interpretation in the handbook. NQ1 and NQ 2: Quartzipsamments from Quaraí city; NQ3 and NQ4: Quartzipsamments from Manoel Viana city; NQ5 and NQ6: Quartzipsamments from São Francisco de Assis city.
Table 7. Pearson’s correlation between the soil physical–hydric properties of Quartzipsamments of the Southwest of Rio Grande do Sul State, southern Brazil.
TPMacroMicroBDPDKS
Macro0.80 **
Microns−0.50 **
BD−0.19 ***nsns
PDnsns−0.45 **ns
KSns0.45 **−0.75 **ns0.40 **
AWns−0.41 **0.47 **nsnsns
TP: total porosity; Macro: macroporosity; Micro: microporosity; BD: bulk density; PD: particle density; KS: saturated hydraulic conductivity; AW: available water (water volume between 10 kPa and 1500 kPa-tension). ns: not significant; ** p < 0.01; *** p < 0.10.
Table 8. Pearson’s correlation between the soil physical–hydric properties and the particle size and degree of flocculation of Quartzipsamments of the Southwest of Rio Grande do Sul State, southern Brazil.
Sand
Very CoarseCoarseMediumFineVery FineSiltClayDF
TPnsnsnsnsnsnsns0.30 ***
Macronsnsnsnsnsnsnsns
Micronsnsnsnsnsnsnsns
BDnsnsnsnsnsns0.45 *0.33 ***
PDnsnsnsnsnsnsnsns
KSnsnsnsnsnsnsnsns
AWnsnsnsnsnsnsnsns
TP: total porosity; Macro: macroporosity; Micro: microporosity; BD: bulk density; PD: particle density; KS: saturated hydraulic conductivity; AW: available water (water volume between 10 kPa and 1500 kPa-tension); DF: degree of flocculation. ns: not significant; * p < 0.05; *** p < 0.10.
Table 9. Pearson’s correlation between the soil chemical variables of Quartzipsamments of the Southwest of Rio Grande do Sul State, southern Brazil.
pH WaterpH KClCaMgNaKAl3+H + AlCEC EffectiveCECpH7.0Base Sat.Al Sat.
pH KCl0.94 **
Ca0.47 *0.44 *
Mg0.38 ***0.35 ***0.96 **
Nansnsnsns
K0.37 ***0.37 ***0.56 **0.45 *0.50 **
Al3+nsnsnsnsns−0.35 ***
H + Alnsnsnsnsnsns0.77 **
CECeffective0.46 *0.43 *0.99 **0.97 **ns0.56 **nsns
CECpH7.00.44 *0.42 *0.97 **0.97 **ns0.51 **nsns0.98 **
Base sat.0.45 *0.44 *0.82 **0.67 **−0.37 *0.70 **0.44 *−0.48 *0.79 **0.70 **
Al sat.ns−0.34 ***−0.70 **−0.55 **−0.37 ***−0.65 **0.43 *0.42 *−0.67 **−0.59 **− 0.94 **
OMnsns0.54 **0.58 **ns0.53 **ns0.45 *0.57 **0.66 **nsns
pH water: pH determined in water 1:1 (soil:water); pH KCl: pH determined in KCl; Ca: calcium; Mg: magnesium; Na: sodium; K: potassium. Al3+: aluminum; H+Al: potential acidity; CECeffective: effective cation exchange capacity; CECpH7.0: cation exchange capacity at pH 7.0; Base sat.: base saturation; Al sat.: aluminum saturation; OM: organic matter. ns: not significant; ** p < 0.01; * p < 0.05; *** p < 0.10.
Table 10. Pearson’s correlation between the soil chemical variables and the particle size and degree of flocculation of Quartzipsamments of the Southwest of Rio Grande do Sul State, southern Brazil.
Sand
Very CoarseCoarseMediumFineVery FineSiltClayDF
pH waternsnsnsnsnsnsns−0.34***
pH KClnsnsnsnsnsnsnsns
Cans−0.36 ***nsnsnsnsnsns
Mgnsnsnsnsnsnsnsns
Nansnsnsns0.47 *nsnsns
Knsnsnsns0.42 *nsnsns
Al3+nsnsnsnsnsnsnsns
H + Al3+nsnsnsnsnsnsnsns
CECeffectivens−0.35 ***nsnsnsnsnsns
CECpH7.0ns−0.33 ***nsnsnsnsnsns
Base sat.nsnsnsnsnsnsnsns
Al sat.nsnsnsnsnsnsnsns
OMnsnsnsnsnsnsns−0.36 ***
pH water: pH determined in water 1:1 (soil:water); pH KCl: pH determined in KCl; Ca: calcium; Mg: magnesium; Na: sodium; K: potassium; Al3+: aluminum; H + Al: potential acidity; CECeffective: effective cation exchange capacity; CECpH7.0: cation exchange capacity at pH 7.0; Base sat.: base saturation; Al sat.: aluminum saturation; OM: organic matter; DF: degree of flocculation. ns: not significant; * p < 0.05; *** p < 0.10.
Table 11. Pearson’s correlation between the soil chemical and physical–hydric properties of Quartzipsamments of the Southwest of Rio Grande do Sul State, southern Brazil.
TPMacroMicroBDPDKSAW
pH water−0.33 ***0.64 **0.58 **ns−0.45 *ns0.50 **
pH KClns−0.53 **0.51 **ns−0.47 *ns0.44 *
Ca0.36 ***ns0.74 **ns−0.47 *−0.58 **ns
Mg0.33 ***ns0.67 **ns−0.40*−0.51 **ns
Nansnsnsns−0.33 ***nsns
K0.39 *ns0.38 ***−0.34 ***−0.57 *nsns
Al3+nsnsnsnsnsns0.62 **
H+ Al3+nsnsnsnsnsnsns
CECeffective0.37 ***ns0.74 **ns−0.47 *−0.56 **ns
CECpH7.00.40 *ns0.72 **ns−0.41 *−0.49 *0.35 ***
Base sat.nsns0.58 **ns−0.54 **−0.50 **ns
Al sat.nsns−0.37 ***ns0.37 ***0.36 ***ns
OM0.53 **nsns−0.47 *nsnsns
pH water: pH determined in water 1:1 (soil:water); pH KCl: pH determined in KCl; Ca: calcium; Mg: magnesium; Na: sodium; K: potassium. Al3+: aluminum; H+Al: potential acidity; CECeffective: effective cation exchange capacity; CECpH7.0: cation exchange capacity at pH 7.0; Base sat.: base saturation; Al sat.: aluminum saturation; OM: organic matter; TP: total porosity; Macro: macroporosity; Micro: microporosity; BD: bulk density; PD: particle density; KS: saturated hydraulic conductivity; AW: available water (water volume between 10 kPa and 1500 kPa-tension). ns: not significant; ** p < 0.01; * p < 0.05; *** p < 0.10.
Table 12. Difficulties and challenges associated with the Quartzipsamments of the Southwest of Rio Grande do Sul State, southern Brazil.
Difficulties
Sandy texture;
Low water-holding capacity;
Low volume of available water;
Low aggregation;
Low content of organic matter;
Low fertility;
High leaching;
High susceptibility to erosion;
Little vegetation cover;
Difficulty of plant species to develop;
Low agricultural land suitability;
Agricultural expansion;
High environmental fragility.
Challenges
Identify plant species adapted to this soil and that produce a large volume of biomass to increase organic matter and physical structure of the soil;
Increase biological activity;
Due to agricultural expansion, identify the most appropriate uses and management for this soil;
From the use of this soil, what level of compaction it can reach, and what level is harmful to the development of plants;
The recommendation of fertilization (doses and splitting) that best suits this soil, considering the risks of contamination of surface water by erosion and subsurface water by leaching;
Soil and water conservation techniques best suited for these soils;
Quantity and frequency of irrigation;
For livestock use of these native pastures, what are the recommendations for better soil, animal, and pasture management;
Monitor the soil (physical, chemical, and biological variables), erosion processes, surface and subsurface water quality, and nutrient leaching and contaminant flow;
Evaluate the performance of growth and yield of crops managed in these soils;
Evaluate the economic viability of agricultural use of these soils.
Disclaimer/Publisher’s Note: The statements, opinions and data contained in all publications are solely those of the individual author(s) and contributor(s) and not of MDPI and/or the editor(s). MDPI and/or the editor(s) disclaim responsibility for any injury to people or property resulting from any ideas, methods, instructions or products referred to in the content.

