
The Extent of Insulin Resistance in Patients That Cleared Viral Hepatitis C Infection and the Role of Pre-Existent Type 2 Diabetes Mellitus: A Meta-Analysis

 , ,
, , 
 , and
, and
Abstract
:1. Introduction
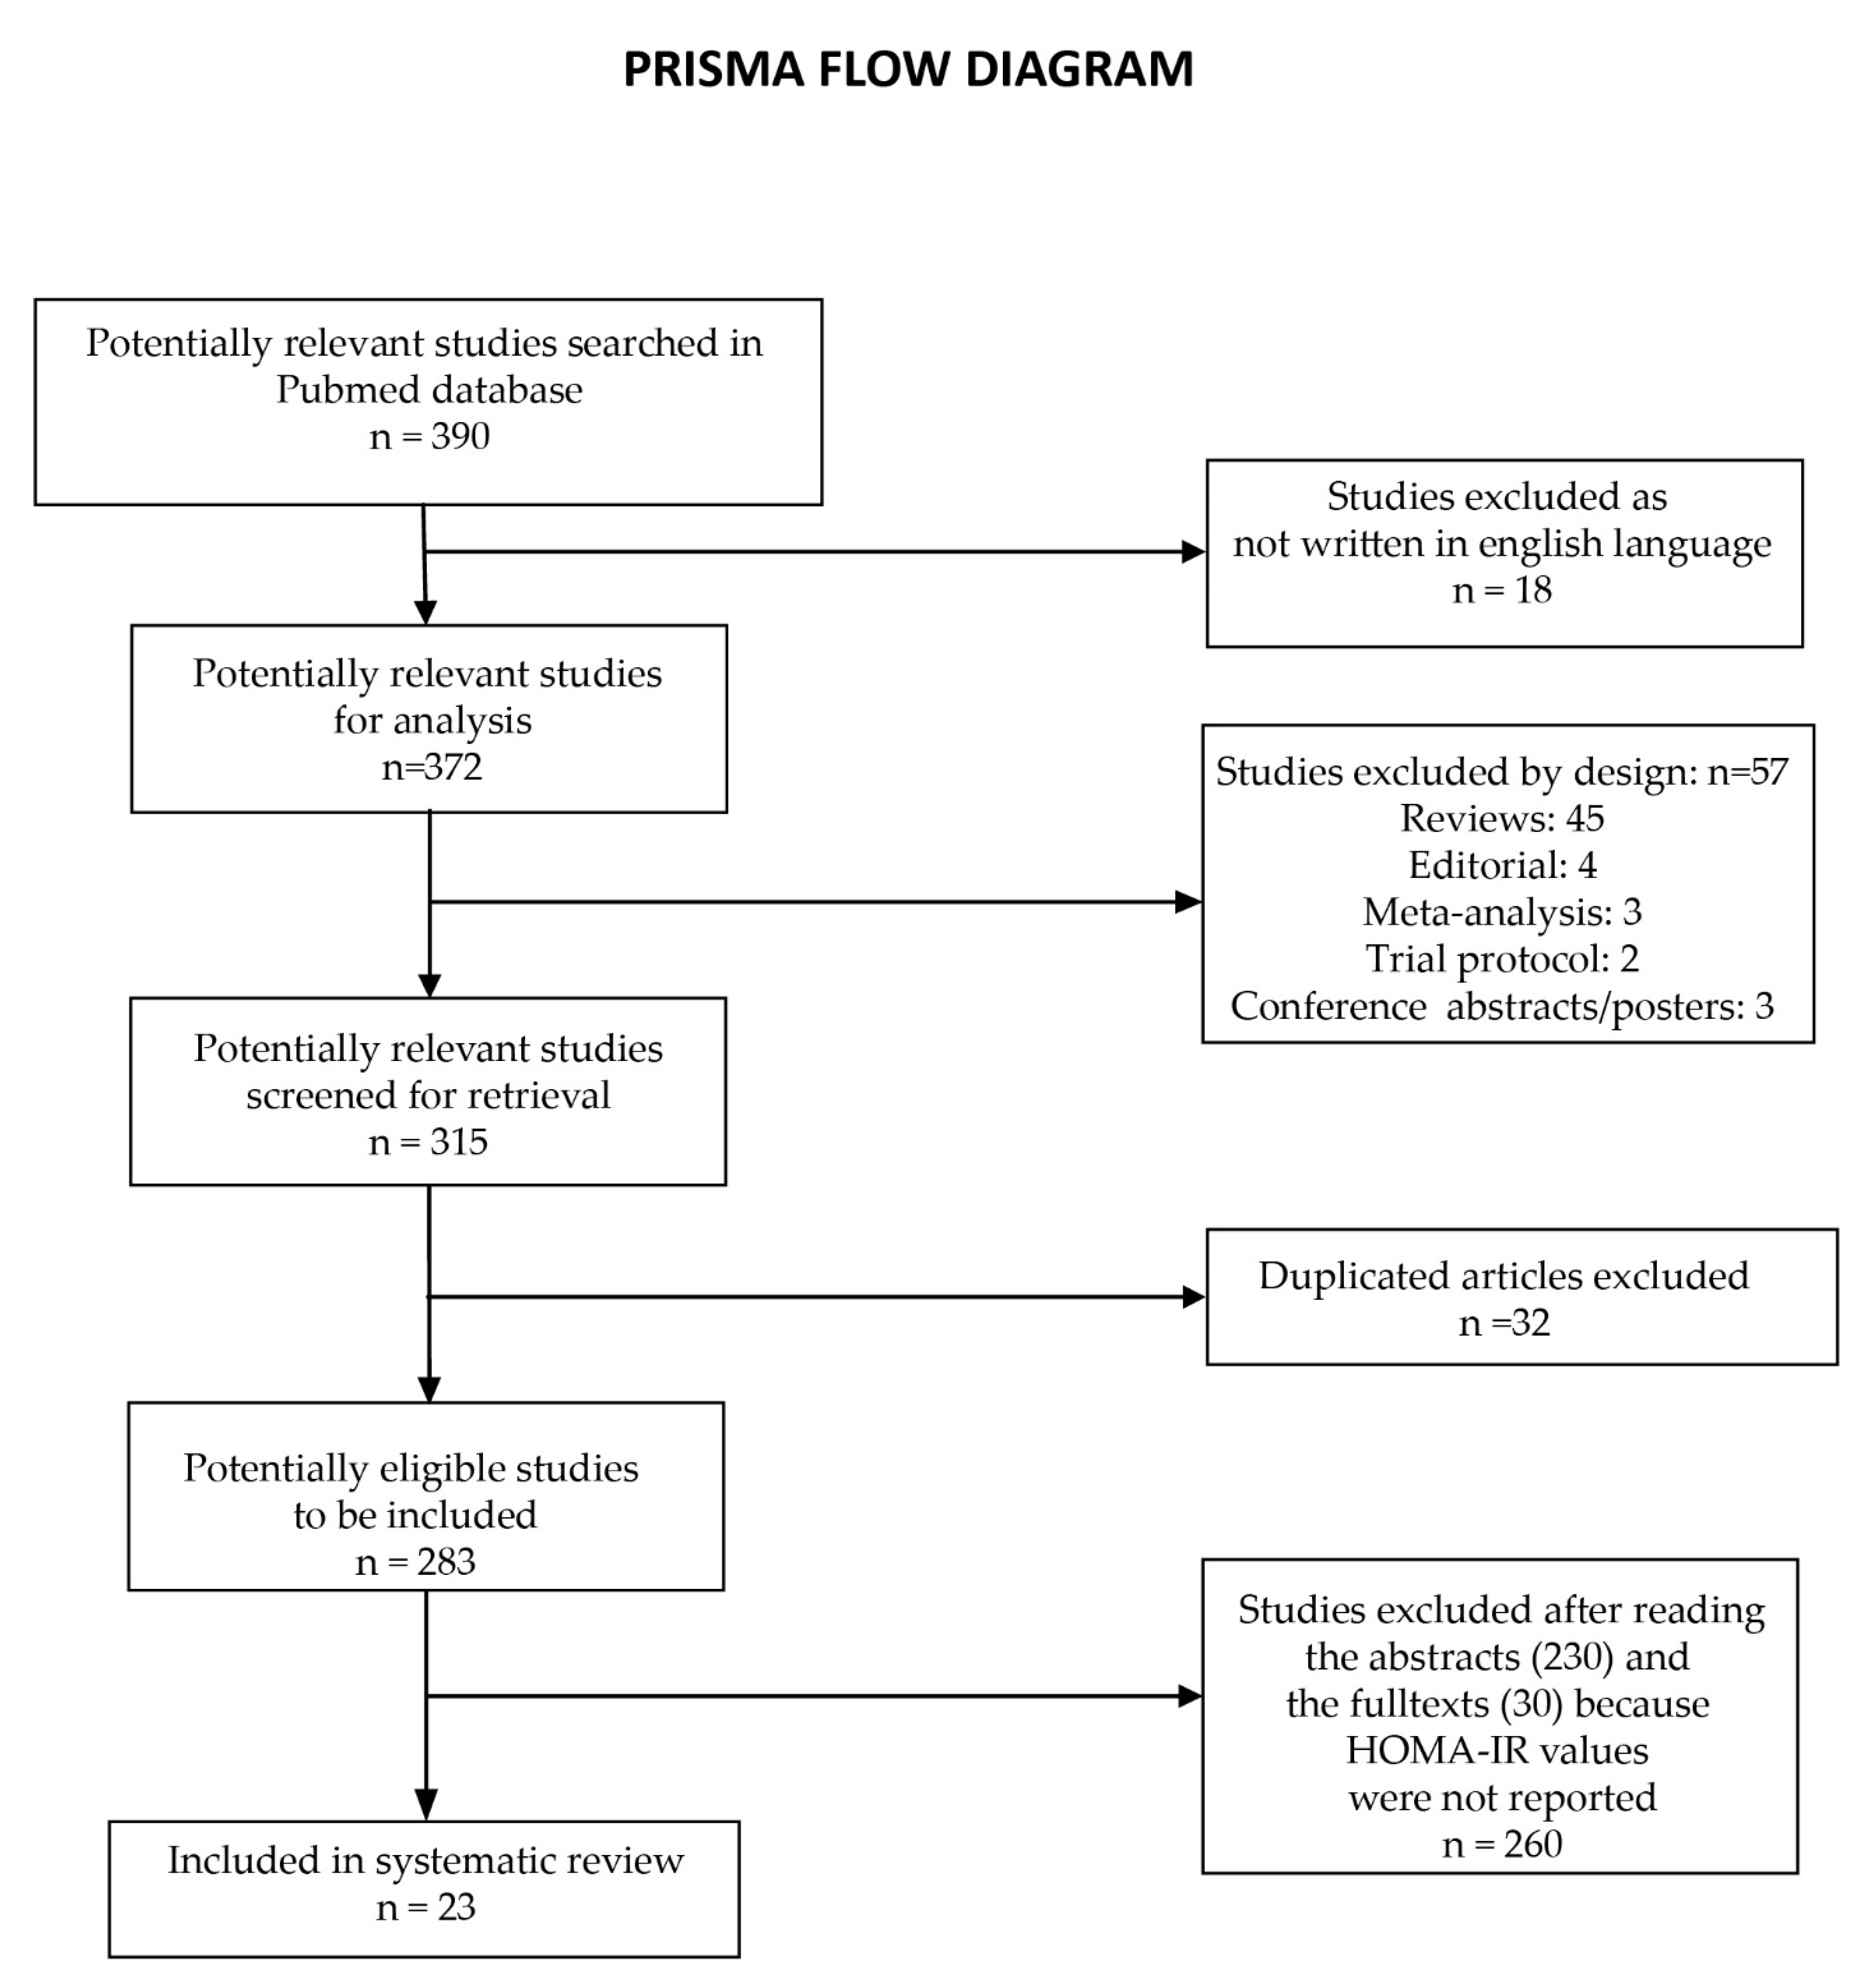
2. Materials and Methods
2.1. Quality Assessment
2.2. Data Extraction
3. Results
4. Discussion
5. Conclusions
Author Contributions
Funding
Data Availability Statement
Acknowledgments
Conflicts of Interest
References
- Lemieux, I.; Després, J.P. Metabolic Syndrome: Past, Present and Future. Nutrients 2020, 12, 3507. [Google Scholar] [CrossRef] [PubMed]
- Bence, K.K.; Birnbaum, M.J. Metabolic drivers of non-alcoholic fatty liver disease. Mol. Metab. 2021, 50, 101143. [Google Scholar] [CrossRef] [PubMed]
- Ibrahim, M.; Parveen, B.; Zahiruddin, S.; Parveen, R.; Khan, M.A.; Gupta, A.; Ahmad, S. Uplc/Ms Based Phytochemical Screening and Antidiabetic Properties of Picrorhiza Kurroa in Mitigating Glucose-Induced Metabolic Dysregulation and Oxidative Stress. Farmacia 2021, 69, 749–755. [Google Scholar] [CrossRef]
- Santoleri, D.; Titchenell, P.M. Resolving the Paradox of Hepatic Insulin Resistance. Cell Mol. Gastroenterol. Hepatol. 2019, 7, 447–456. [Google Scholar] [CrossRef] [Green Version]
- Katz, A.; Nambi, S.S.; Mather, K.; Baron, A.D.; Follmann, D.A.; Sullivan, G.; Quon, M.J. Quantitative insulin sensitivity check index: A simple, accurate method for assessing insulin sensitivity in humans. J. Clin. Endocrinol. Metab. 2000, 85, 2402–2410. [Google Scholar] [CrossRef] [PubMed]
- Farshadpour, F.; Taherkhani, R.; Ravanbod, M.R.; Eghbali, S.S. Prevalence and Genotype Distribution of Hepatitis C Virus Infection among Patients with Type 2 Diabetes Mellitus. Med. Princ. Pract. 2018, 27, 308–316. [Google Scholar] [CrossRef] [PubMed]
- Kralj, D.; Virović Jukić, L.; Stojsavljević, S.; Duvnjak, M.; Smolić, M.; Čurčić, I.B. Hepatitis C Virus, Insulin Resistance, and Steatosis. J. Clin. Transl. Hepatol. 2016, 4, 66–75. [Google Scholar] [CrossRef] [PubMed] [Green Version]
- Ansaldi, F.; Orsi, A.; Sticchi, L.; Bruzzone, B.; Icardi, G. Hepatitis C virus in the new era: Perspectives in epidemiology, prevention, diagnostics and predictors of response to therapy. World J. Gastroenterol. 2014, 20, 9633–9652. [Google Scholar] [CrossRef]
- Narne, P. Impaired insulin exocytosis in chronic hepatitis C infection: Contributory role of p38δ MAPK-protein kinase D-golgi complex axis. Clin. Sci. 2020, 134, 1449–1456. [Google Scholar] [CrossRef]
- Himoto, T.; Nomura, T.; Tani, J.; Miyoshi, H.; Morishita, A.; Yoneyama, H.; Haba, R.; Masugata, H.; Masaki, T. Exacerbation of insulin resistance and hepatic steatosis deriving from zinc deficiency in patients with HCV-related chronic liver disease. Biol. Trace Elem. Res. 2015, 163, 81–88. [Google Scholar] [CrossRef]
- Abenavoli, L.; Masarone, M.; Peta, V.; Milic, N.; Kobyliak, N.; Rouabhia, S.; Persico, M. Insulin resistance and liver steatosis in chronic hepatitis C infection genotype 3. World J. Gastroenterol. 2014, 20, 15233–15240. [Google Scholar] [CrossRef] [PubMed]
- Wójcik, K.; Jabłonowska, E.; Omulecka, A.; Piekarska, A. Insulin resistance, adipokine profile and hepatic expression of SOCS-3 gene in chronic hepatitis C. World J. Gastroenterol. 2014, 20, 10449–10456. [Google Scholar] [CrossRef]
- Chien, C.H.; Lin, C.L.; Hu, C.C.; Chang, J.J.; Chien, R.N. Clearance of Hepatitis C Virus Improves Insulin Resistance During and After Peginterferon and Ribavirin Therapy. J. Interferon. Cytokine Res. 2015, 35, 981–989. [Google Scholar] [CrossRef] [PubMed]
- Adinolfi, L.E.; Nevola, R.; Guerrera, B.; D’Alterio, G.; Marrone, A.; Giordano, M.; Rinaldi, L. Hepatitis C virus clearance by direct-acting antiviral treatments and impact on insulin resistance in chronic hepatitis C patients. J. Gastroenterol. Hepatol. 2018, 33, 1379–1382. [Google Scholar] [CrossRef] [PubMed]
- Wallace, T.M.; Levy, J.C.; Matthews, D.R. Use and abuse of HOMA modeling. Diabetes Care 2004, 27, 1487–1495. [Google Scholar] [CrossRef] [Green Version]
- Stasi, C.; Sadalla, S.; Carradori, E.; Monti, M.; Petraccia, L.; Madia, F.; Gragnani, L.; Zignego, A.L. Longitudinal evaluation of liver stiffness and outcomes in patients with chronic hepatitis C before and after short- and long-term IFN-free antiviral treatment. Curr. Med. Res. Opin. 2020, 36, 245–249. [Google Scholar] [CrossRef]
- Stasi, C.; Triboli, E.; Arena, U.; Urraro, T.; Petrarca, A.; Gragnani, L.; Laffi, G.; Zignego, A.L. Assessment of liver stiffness in patients with HCV and mixed cryoglobulinemia undergoing rituximab treatment. J. Transl. Med. 2014, 12, 21. [Google Scholar] [CrossRef] [Green Version]
- Adinolfi, L.E.; Petta, S.; Fracanzani, A.L.; Nevola, R.; Coppola, C.; Narciso, V.; Rinaldi, L.; Calvaruso, V.; Pafundi, P.C.; Lombardi, R.; et al. Reduced incidence of type 2 diabetes in patients with chronic hepatitis C virus infection cleared by direct-acting antiviral therapy: A prospective study. Diabetes Obes. Metab. 2020, 22, 2408–2416. [Google Scholar] [CrossRef]
- Cheng, P.N.; Chen, J.Y.; Chiu, Y.C.; Chiu, H.C.; Tsai, L.M. Augmenting central arterial stiffness following eradication of HCV by direct acting antivirals in advanced fibrosis patients. Sci. Rep. 2019, 9, 1426. [Google Scholar] [CrossRef] [Green Version]
- Ichikawa, T.; Miyaaki, H.; Miuma, S.; Motoyoshi, Y.; Narita, S.; Toda, S.; Takahashi, Y.; Honda, T.; Yajima, H.; Uehara, R.; et al. Carotid Intima-media Thickness and Small Dense Low-density Lipoprotein Cholesterol Increase after One Year of Treatment with Direct-acting Antivirals in Patients with Hepatitis C Virus Infection. Intern. Med. 2019, 58, 1209–1215. [Google Scholar] [CrossRef]
- Strauhs-Nitsch, L.; Campiolo, M.F.; Morsoletto, D.B.G.; Pissaia Junior, A.; Ivantes, C.A.P. Curing hepatitis c with the new direct acting antivirals did not improve insulin resistance after one year. Arq. Gastroenterol. 2020, 57, 267–271. [Google Scholar] [CrossRef] [PubMed]
- Elhelbawy, M.; Abdel-Razek, W.; Alsebaey, A.; Hashim, M.; Elshenawy, H.; Waked, I. Insulin resistance does not impair response of chronic hepatitis C virus to direct-acting antivirals, and improves with the treatment. Eur. J. Gastroenterol. Hepatol. 2019, 31, 16–23. [Google Scholar] [CrossRef]
- Özdoğan, O.; Yaraş, S.; Ateş, F.; Üçbilek, E.; Sezgin, O.; Altıntaş, E. The impact of direct-acting antiviral treatment on lipid metabolism and insulin resistance in chronic hepatitis C patients: Temporary? Permanent? Turk. J. Gastroenterol. 2020, 31, 384–392. [Google Scholar] [CrossRef] [PubMed]
- Graf, C.; Welzel, T.; Bogdanou, D.; Vermehren, J.; Beckel, A.; Bojunga, J.; Friedrich-Rust, M.; Dietz, J.; Kubesch, A.; Mondorf, A.; et al. Hepatitis C Clearance by Direct-Acting Antivirals Impacts Glucose and Lipid Homeostasis. J. Clin. Med. 2020, 9, 2702. [Google Scholar] [CrossRef]
- Gitto, S.; Cicero, A.F.G.; Loggi, E.; Giovannini, M.; Conti, F.; Grandini, E.; Guarneri, V.; Scuteri, A.; Vitale, G.; Cursaro, C.; et al. Worsening of Serum Lipid Profile after Direct Acting Antiviral Treatment. Ann. Hepatol. 2018, 17, 64–75. [Google Scholar] [CrossRef]
- Doyle, M.-A.; Galanakis, C.; Mulvihill, E.; Crawley, A.; Cooper, C.L. Hepatitis C Direct Acting Antivirals and Ribavirin Modify Lipid but not Glucose Parameters. Cells 2019, 8, 252. [Google Scholar] [CrossRef] [PubMed] [Green Version]
- Chang, M.-L.; Hu, J.-H.; Pao, L.-H.; Lin, M.-S.; Kuo, C.-J.; Chen, S.-C.; Fan, C.-M.; Chang, M.-Y.; Chien, R.-N. Critical role of triglycerides for adiponectin levels in hepatitis C: A joint study of human and HCV core transgenic mice. BMC Immunol. 2021, 22, 54. [Google Scholar] [CrossRef]
- Lee, H.; Chien, R.N.; Pao, L.H.; Kuo, C.J.; Huang, P.H.; Chang, M.L. Decoupled Glucose and Lipid Metabolic Recovery after Viral Clearance in Direct-Acting Antiviral-Treated HCV Patients: A 3-Year Prospective Cohort Study. Cells 2021, 10, 2934. [Google Scholar] [CrossRef]
- Alsebaey, A.; Elhelbawy, M.; Abdel-Razek, W.; Hashim, M.; Elshenawy, H.; Waked, I. HCV treatment with direct acting antivirals improves the insulin sensitivity. Expert Rev. Anti. Infect. Ther. 2019, 17, 749–754. [Google Scholar] [CrossRef]
- Abdel Moneim, A.; Suleiman, H.A.; Mahmoud, B.; Mabrouk, D.; Zaky, M.Y.; Mahmoud, B. Viral clearance ameliorates hematological and inflammatory markers among diabetic patients infected with hepatitis C genotype 4. Clin. Exp. Med. 2020, 20, 231–240. [Google Scholar] [CrossRef]
- Cheng, P.-N.; Sun, H.-Y.; Feng, I.C.; Chiu, Y.-C.; Wang, S.-T.; Tan, D.C.; Chiu, H.-C.; Chien, S.-C.; Young, K.-C. Interdependence of glycemic and lipid modulation in cured chronic hepatitis C patients by direct-acting antiviral agents. J. Microbiol. Immunol. Infect. 2022. [Google Scholar] [CrossRef] [PubMed]
- Ciancio, A.; Bosio, R.; Bo, S.; Pellegrini, M.; Sacco, M.; Vogliotti, E.; Fassio, G.; Bianco Mauthe Degerfeld, A.G.F.; Gallo, M.; Giordanino, C.; et al. Significant improvement of glycemic control in diabetic patients with HCV infection responding to direct-acting antiviral agents. J. Med. Virol. 2018, 90, 320–327. [Google Scholar] [CrossRef] [Green Version]
- Russo, F.P.; Zanetto, A.; Gambato, M.; Bortoluzzi, I.; Al Zoairy, R.; Franceschet, E.; De Marchi, F.; Marzi, L.; Lynch, E.N.; Floreani, A.; et al. Hepatitis C virus eradication with direct-acting antiviral improves insulin resistance. J. Viral. Hepat. 2020, 27, 188–194. [Google Scholar] [CrossRef] [PubMed]
- Lin, C.H.; Chen, J.J.; Lee, P.L.; Tung, H.D.; Cheng, C.T.; Kao, H.J.; Wu, Y.H.; Pang, M.G.; Chuang, T.W. Lipid profile changes after direct acting antiviral treatment in different genotypes of chronic hepatitis C virus-infected patients. Adv. Dig. Med. 2021, 8, 139–145. [Google Scholar] [CrossRef] [Green Version]
- Alzahaby, A.A.A.E.-H.; Abdel-Halim, M.M.; Hussien, A.A.E.-s. Effect of direct acting anti-viral agents on insulin resistance in chronic HCV patients. Egypt. J. Hosp. Med. 2018, 72, 4413–4419. [Google Scholar] [CrossRef]
- Nevola, R.; Rinaldi, L.; Zeni, L.; Sasso, F.C.; Pafundi, P.C.; Guerrera, B.; Marrone, A.; Giordano, M.; Adinolfi, L.E. Metabolic and renal changes in patients with chronic hepatitis C infection after hepatitis C virus clearance by direct-acting antivirals. JGH Open 2020, 4, 713–721. [Google Scholar] [CrossRef] [PubMed]
- Gualerzi, A.; Bellan, M.; Smirne, C.; Tran Minh, M.; Rigamonti, C.; Burlone, M.E.; Bonometti, R.; Bianco, S.; Re, A.; Favretto, S. Improvement of insulin sensitivity in diabetic and non diabetic patients with chronic hepatitis C treated with direct antiviral agents. PLoS ONE 2018, 13, e0209216. [Google Scholar] [CrossRef] [PubMed] [Green Version]
- Hashim, A.E.; Kandeel, H.T.; Hendy, O.M.; El-Mola, K.; El-Raey, F.M.; Attia, M.S. Effect of new direct-acting antiviral drugs on insulin resistance and glycemic control after treatment of chronic hepatitis C virus infection in type 2 diabetic patients. Al-Azhar Assiut Med. J. 2017, 15, 187. [Google Scholar]
- Salomone, F.; Catania, M.; Montineri, A.; Bertino, G.; Godos, J.; Rizzo, L.; Magrì, G.; Li Volti, G. Hepatitis C virus eradication by direct antiviral agents improves glucose tolerance and reduces post-load insulin resistance in nondiabetic patients with genotype 1. Liver Int. 2018, 38, 1206–1211. [Google Scholar] [CrossRef]
- Yosef, T.; Ibrahim, W.A.; El-Ghandour, A.; Attia, S.; El-Nakeep, S. Effect of different direct-acting antiviral regimens for treatment of nondiabetic hepatitis C virus–infected Egyptian patients on insulin resistance and sensitivity. Egypt. J. Intern. Med. 2021, 33, 45. [Google Scholar] [CrossRef]
- Lonardo, A.; Ballestri, S.; Guaraldi, G.; Nascimbeni, F.; Romagnoli, D.; Zona, S.; Targher, G. Fatty liver is associated with an increased risk of diabetes and cardiovascular disease - Evidence from three different disease models: NAFLD, HCV and HIV. World J. Gastroenterol. 2016, 22, 9674–9693. [Google Scholar] [CrossRef] [PubMed]
- Dawood, A.A.; Nooh, M.Z.; Elgamal, A.A. Factors Associated with Improved Glycemic Control by Direct-Acting Antiviral Agent Treatment in Egyptian Type 2 Diabetes Mellitus Patients with Chronic Hepatitis C Genotype 4. Diabetes Metab. J. 2017, 41, 316–321. [Google Scholar] [CrossRef] [PubMed]
- Chang, M.-L.; Kuo, C.-J.; Pao, L.-H.; Hsu, C.-M.; Chiu, C.-T. The evolving relationship between adiponectin and insulin sensitivity in hepatitis C patients during viral clearance. Virulence 2017, 8, 1255–1264. [Google Scholar] [CrossRef] [PubMed] [Green Version]
- Chang, M.-L. Metabolic alterations and hepatitis C: From bench to bedside. World J. Gastroenterol. 2016, 22, 1461. [Google Scholar] [CrossRef]
- Knobler, H.; Malnick, S. Hepatitis C and insulin action: An intimate relationship. World J. Hepatol. 2016, 8, 131–138. [Google Scholar] [CrossRef] [PubMed]
- Brenachot, X.; Ramadori, G.; Ioris, R.M.; Veyrat-Durebex, C.; Altirriba, J.; Aras, E.; Ljubicic, S.; Kohno, D.; Fabbiano, S.; Clement, S.; et al. Hepatic protein tyrosine phosphatase receptor gamma links obesity-induced inflammation to insulin resistance. Nat. Commun. 2017, 8, 1820. [Google Scholar] [CrossRef] [Green Version]
- Pasc, P.; Berdea, D.E.; Dobjanschi, L.; Judea-Pusta, C.T.; Popescu, M.I. Descriptive Analysis of Real-World Medication Patterns and One-Year Outcomes of Acute Coronary Syndrome Patients with Metabolic Syndrome in a Tertiary Care Hospital. Farmacia 2021, 69, 498–508. [Google Scholar] [CrossRef]
- Yaribeygi, H.; Atkin, S.L.; Simental-Mendía, L.E.; Sahebkar, A. Molecular mechanisms by which aerobic exercise induces insulin sensitivity. J. Cell Physiol. 2019, 234, 12385–12392. [Google Scholar] [CrossRef]
- He, X.; Wu, D.; Hu, C.; Xu, T.; Liu, Y.; Liu, C.; Xu, B.; Tang, W. Role of Metformin in the Treatment of Patients with Thyroid Nodules and Insulin Resistance: A Systematic Review and Meta-Analysis. Thyroid 2019, 29, 359–367. [Google Scholar] [CrossRef]
- Kujawska-Luczak, M.; Szulinska, M.; Skrypnik, D.; Musialik, K.; Swora-Cwynar, E.; Kregielska-Narozna, M.; Markuszewski, L.; Grzymislawska, M.; Bogdanski, P. The influence of orlistat, metformin and diet on serum levels of insulin-like growth factor-1 in obeses women with and without insulin resistance. J. Physiol. Pharmacol. 2018, 69, 737–745. [Google Scholar] [CrossRef]
- Gower, B.A.; Fernández, J.R.; Beasley, T.M.; Shriver, M.D.; Goran, M.I. Using genetic admixture to explain racial differences in insulin-related phenotypes. Diabetes 2003, 52, 1047–1051. [Google Scholar] [CrossRef] [PubMed]


| No. | Name | Year | No. of Patients | Weeks | Diabetes | HOMA-IR Pre-Treatment | HOMA-IR Post-Treatment |
|---|---|---|---|---|---|---|---|
| 1. | Adinolfi et al. [18] | 2020 | 1303 | 24 | No | 4.38 ± 0.82 | 2.42 ± 0.58 |
| 2. | Cheng et al. [19] | 2019 | 102 | 12 | Mixed | 0.20 ± 0.09 | 0.19 ± 0.10 |
| 3. | Ichikawa et al. [20] | 2019 | 48 | 52 | No | 2.76 ± 1.72 | 3.22 ± 2.8 |
| 4. | Strauhs Nitsch et al. [21] | 2020 | 54 | 52 | Mixed | 3.12 ± 2.29 | 3.22 ± 2.04 |
| 5. | Elhelbawy et al. [22] | 2018 | 511 | 12 | Mixed | 3.21 ± 2.36 | 1.90 ± 1.58 |
| 6. | Ozdogan et al. [23] | 2020 | 121 | 24 | No | 3.13 ± 1.83 | 3.36 ± 2.20 |
| 7. | Ozdogan et al. [23] | 2020 | 121 | 52 | No | 3.13 ± 1.83 | 2.85 ± 1.420 |
| 8. | Graf et al. [24] | 2020 | 46 | 12 | No | 5.30 ± 6.10 | 3.90 ± 5.00 |
| 9. | Graf et al. [24] | 2020 | 44 | 24 | No | 5.30 ± 6.10 | 3.90 ± 5.00 |
| 10. | Graf et al. [24] | 2020 | 41 | 52 | No | 5.30 ± 6.10 | 2.50 ± 1.90 |
| 11. | Gitto et al. [25] | 2018 | 93 | 24 | Mixed | 3.80 ± 1.90 | 2.70 ± 1.50 |
| 12. | Doyle et al. [26] | 2019 | 24 | 12 | No | 2.70 ± 0.60 | 3.50 ± 0.80 |
| 13. | Doyle et al. [26] | 2019 | 24 | 24 | No | 3.20 ± 0.70 | 3.50 ± 0.80 |
| 14. | Chang et al. [27] | 2021 | 353 | 24 | Mixed | 3.25 ± 5.37 | 2.97 ± 3.09 |
| 15. | Lee et al. [28] | 2021 | 248 | 12 | Mixed | 3.21 ± 4.96 | 3.32 ± 5.23 |
| 16. | Lee et al. [28] | 2021 | 248 | 24 | Mixed | 3.21 ± 4.96 | 2.99 ± 2.72 |
| 17. | Lee et al. [28] | 2021 | 248 | 52 | Mixed | 3.21 ± 4.96 | 2.44 ± 2.61 |
| 18. | Alsebaey et al. [29] | 2019 | 385 | 12 | No | 2.78 ± 1.8 | 1.82 ± 1.46 |
| 19. | Alsebaey et al. [29] | 2019 | 126 | 12 | Yes | 5.16 ± 3.28 | 2.88 ± 2.68 |
| 20. | Moneim et al. [30] | 2019 | 30 | 12 | Yes | 2.89 ± 0.25 | 2.51 ± 12.00 |
| 21. | Cheng et al. [31] | 2022 | 95 | 24 | Mixed | 3.8 ± 0.2 | 2.6 ± 0.1 |
| 22. | Cheng et al. [31] | 2022 | 95 | 52 | Mixed | 3.8 ± 0.2 | 2.8 ± 0.2 |
| 23. | Ciancio et al. [32] | 2017 | 101 | 12 | Yes | 5.2 ± 2.5 | 3.1 ± 1.6 |
| 24. | Russo et al. [33] | 2019 | 135 | 12 | No | 3.0 ± 0.7 | 2.4 ± 0.5 |
| 25. | Russo et al. [33] | 2019 | 128 | 24 | No | 3.0 ± 0.7 | 1.9 ± 0.3 |
| 26. | Russo et al. [33] | 2019 | 124 | 52 | No | 3.0 ± 0.7 | 1.8 ± 0.4 |
| 27. | Lin et al. [34] | 2020 | 394 | 12 | Mixed | 2.05 ± 1.28 | 1.92 ± 1.18 |
| 28. | Alzahaby et al. [35] | 2018 | 20 | 12 | No | 3.20 ± 0.70 | 2.50 ± 0.80 |
| 29. | Alzahaby et al. [35] | 2018 | 20 | 12 | Yes | 6.80 ± 2.60 | 4.90 ± 2.0 |
| 30. | Nevola et al. [36] | 2020 | 343 | 12 | Mixed | 2.85 ± 0.74 | 2.15 ± 0.52 |
| 31. | Gualerzi et al. [37] | 2018 | 82 | 24 | Mixed | 3.42 ± 1.96 | 2.80 ± 1.02 |
| 32. | Hashim et al. [38] | 2022 | 25 | 12 | No | 5.33 ± 0.91 | 4.65 ± 0.97 |
| 33. | Hashim et al. [38] | 2022 | 25 | 12 | Yes | 7.14 ± 1.43 | 6.12 ± 1.47 |
| 34. | Salomone et al. [39] | 2017 | 32 | 12 | Mixed | 3.72 ± 0.81 | 2.32 ± 0.73 |
| 35. | Yosef et al. (treatment A) [40] | 2021 | 25 | 12 | Mixed | 3.19 ± 1.35 | 2.17 ± 0.96 |
| 36. | Yosef et al. (treatment B) [40] | 2021 | 25 | 12 | Mixed | 3.33 ± 1.31 | 2.38 ± 0.9 |
| 37. | Yosef et al. (treatment C) [40] | 2021 | 25 | 12 | Mixed | 2.9 ± 1.22 | 2.04 ± 0.76 |
| 38. | Yosef et al. (treatment D) [40] | 2021 | 25 | 12 | Mixed | 3.55 ± 1.48 | 2.38 ± 1.09 |
| Group | No. of Studies | Hedges’s g | p-Value |
|---|---|---|---|
| Duration | |||
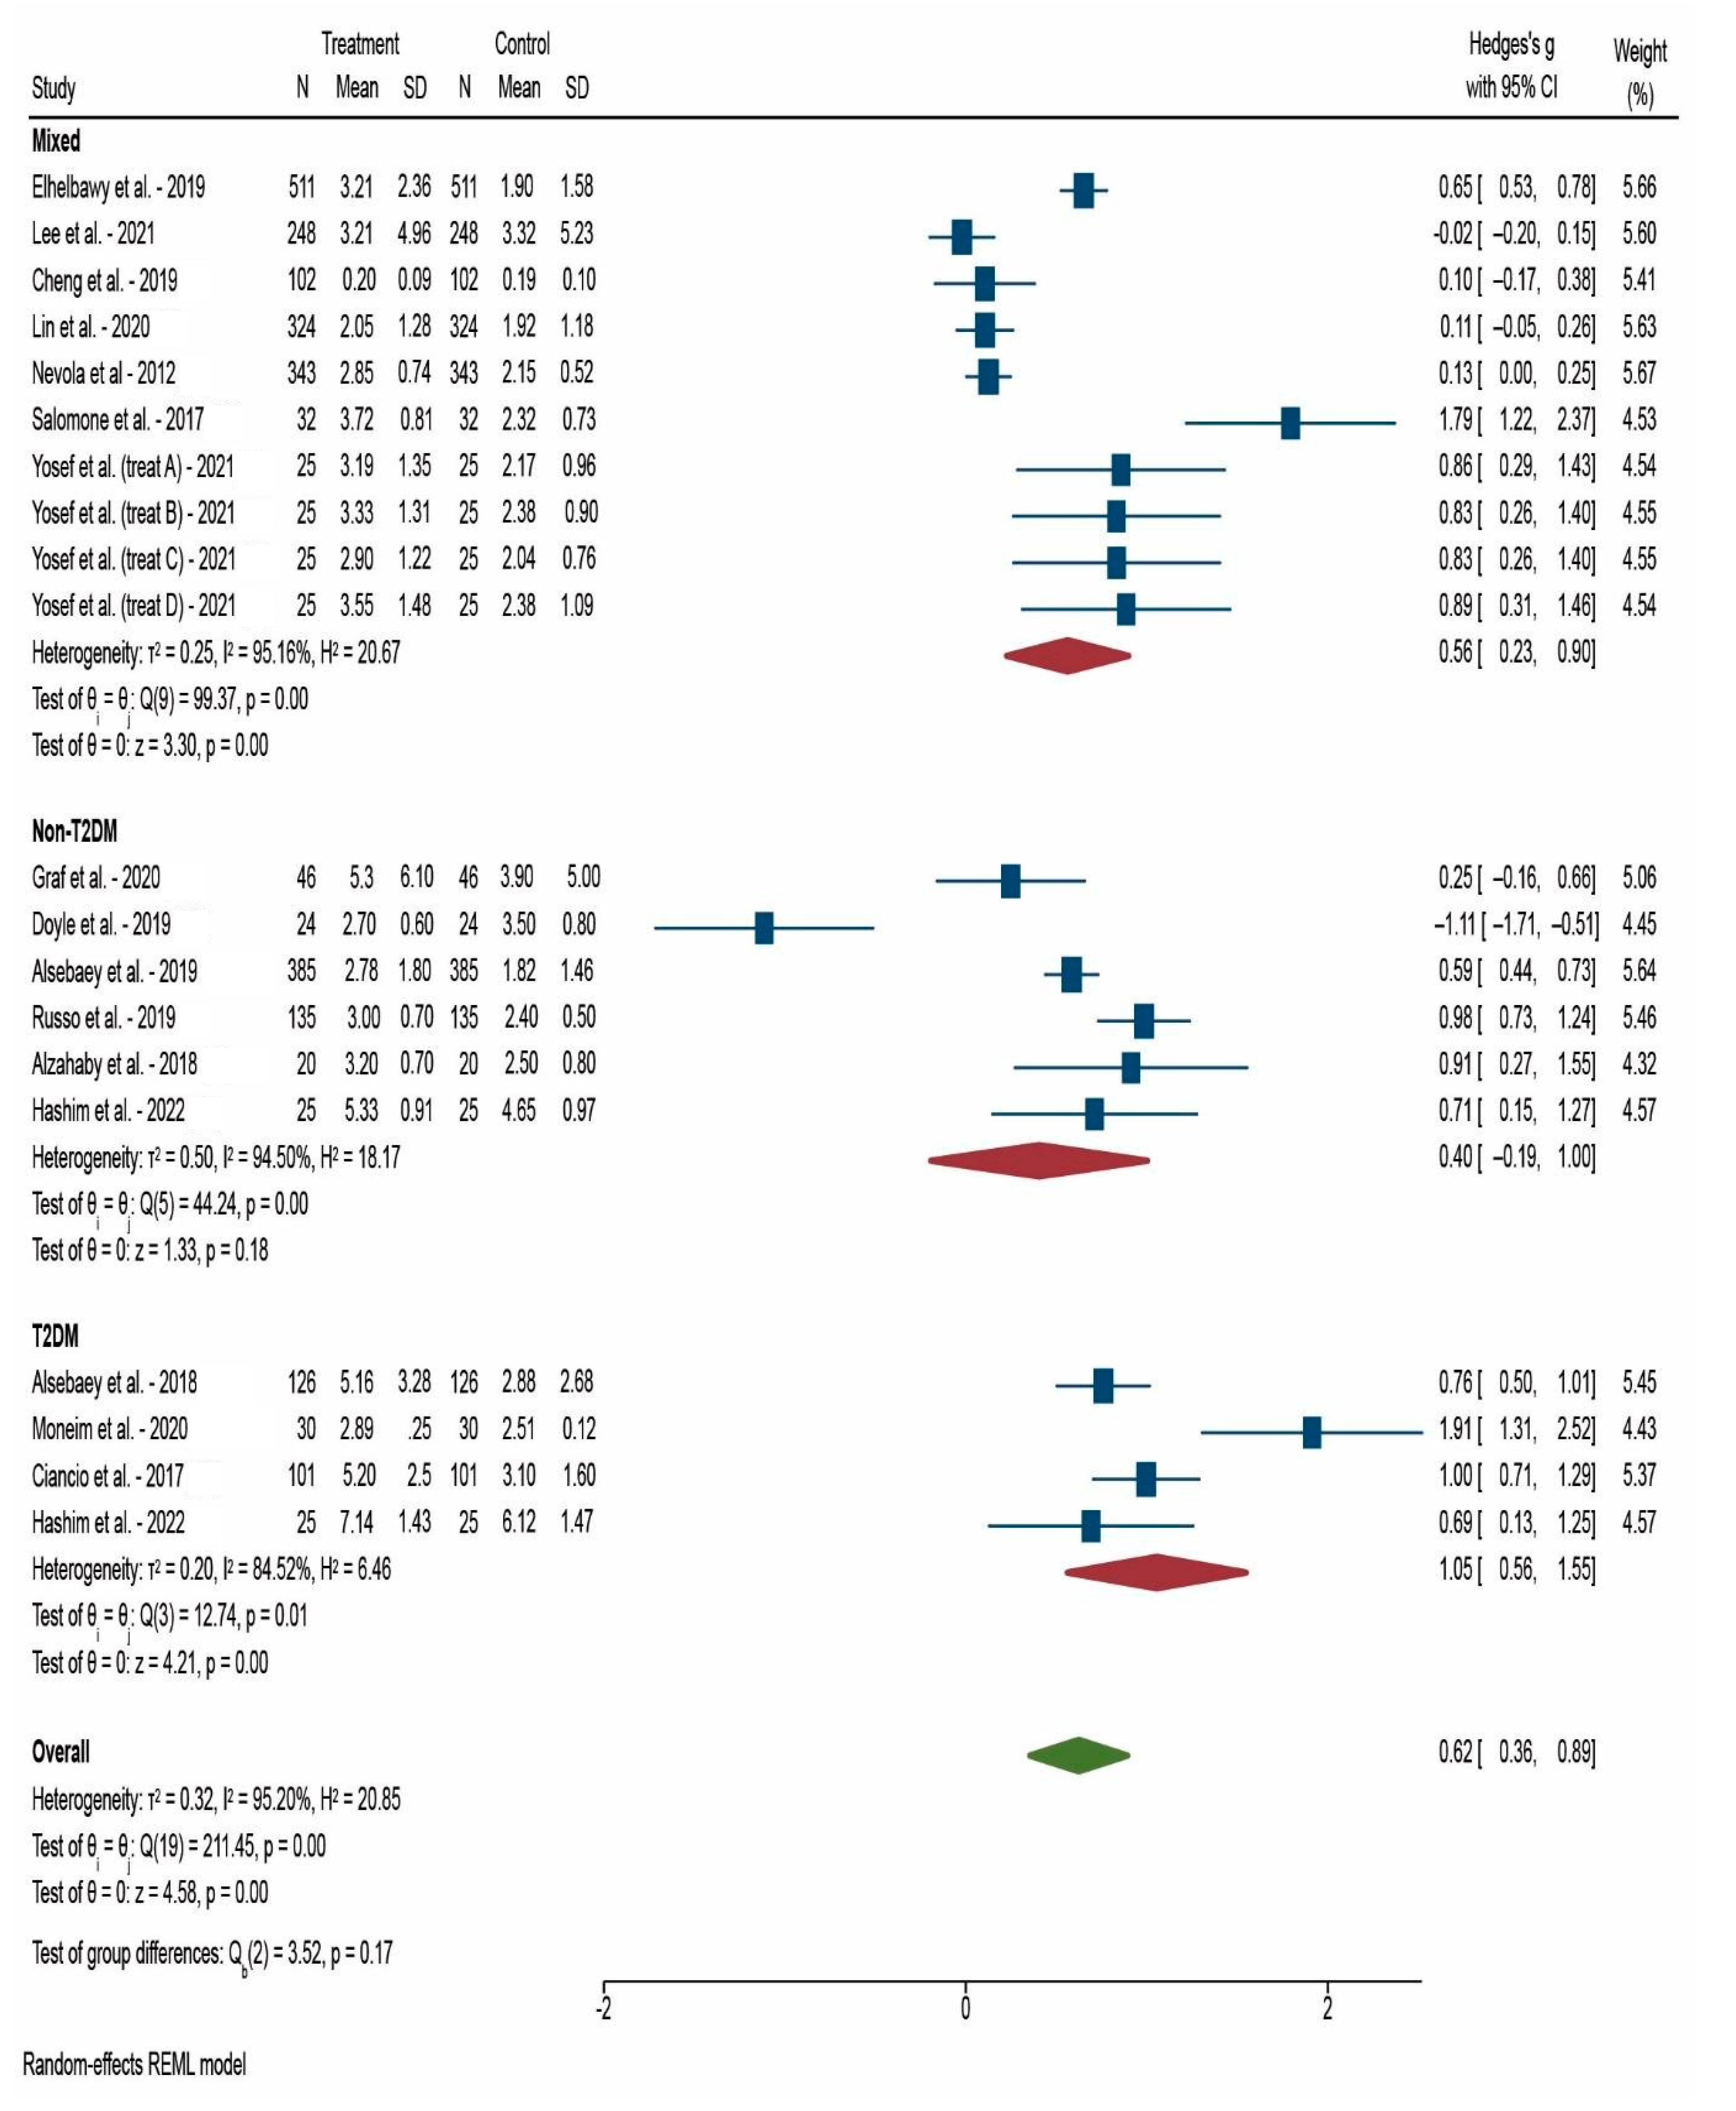
| After 12 weeks | 20 | 0.624 | <0.001 * |
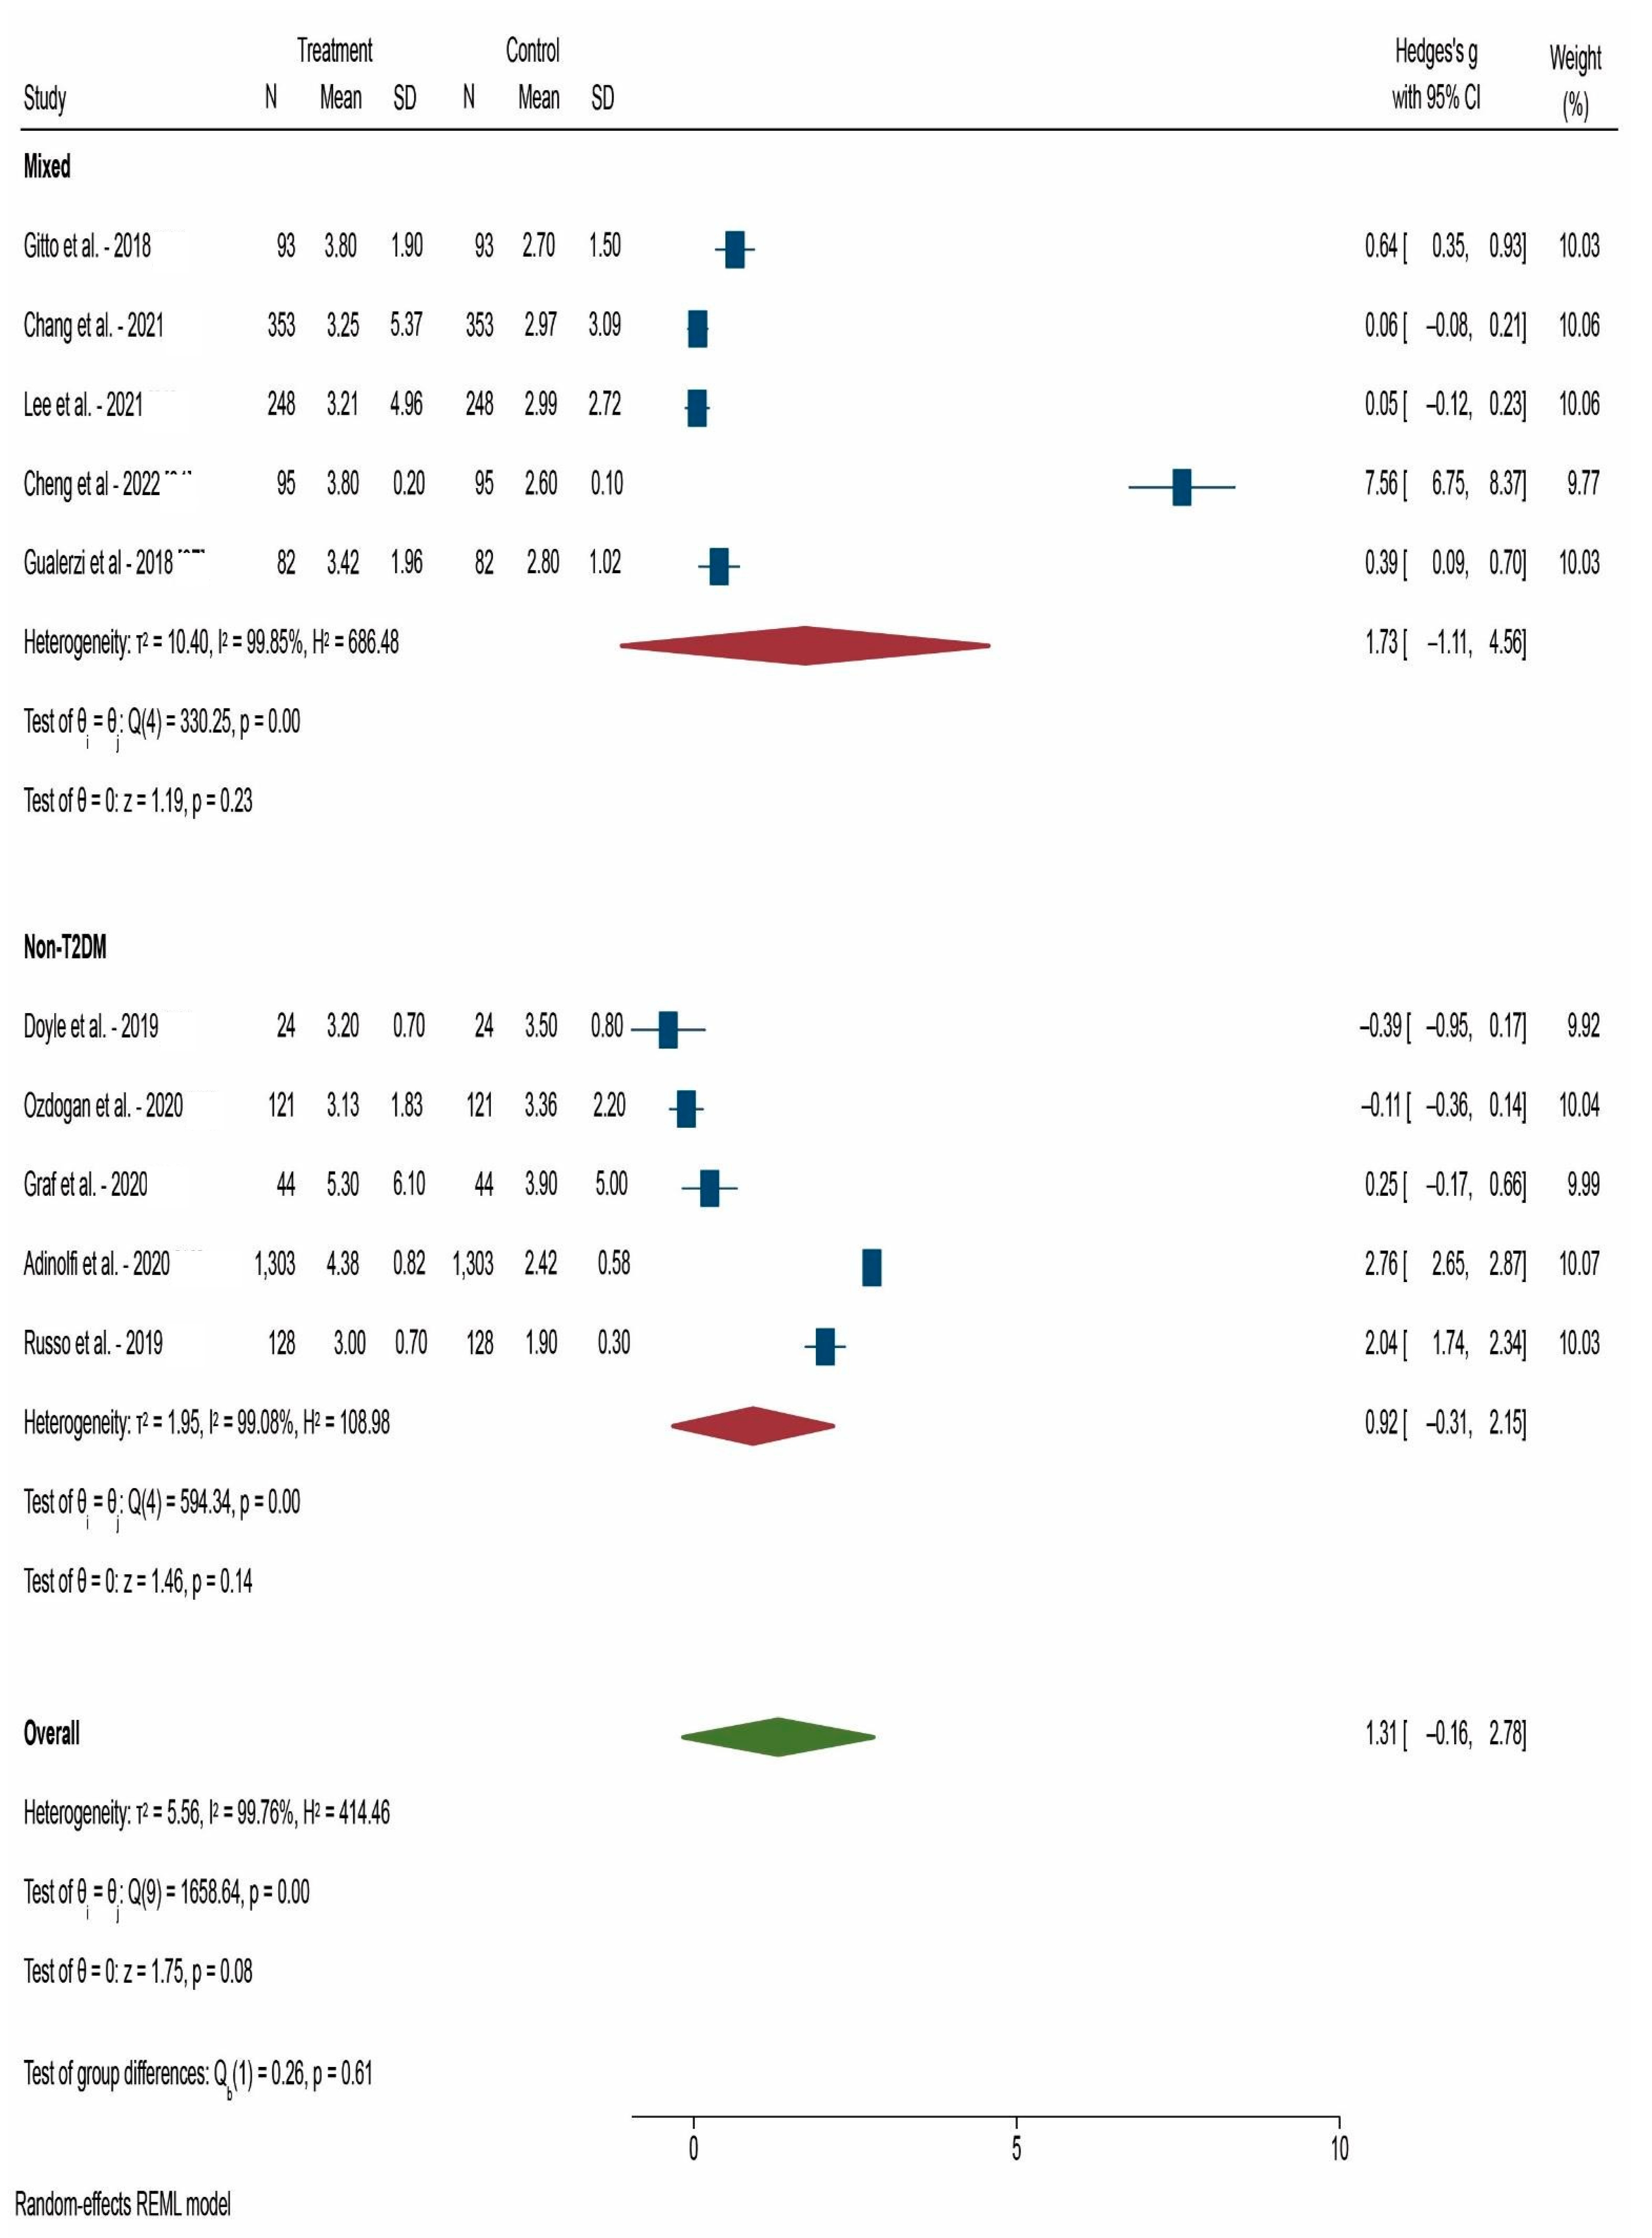
| After 24 weeks | 10 | 1.311 | 0.080 |
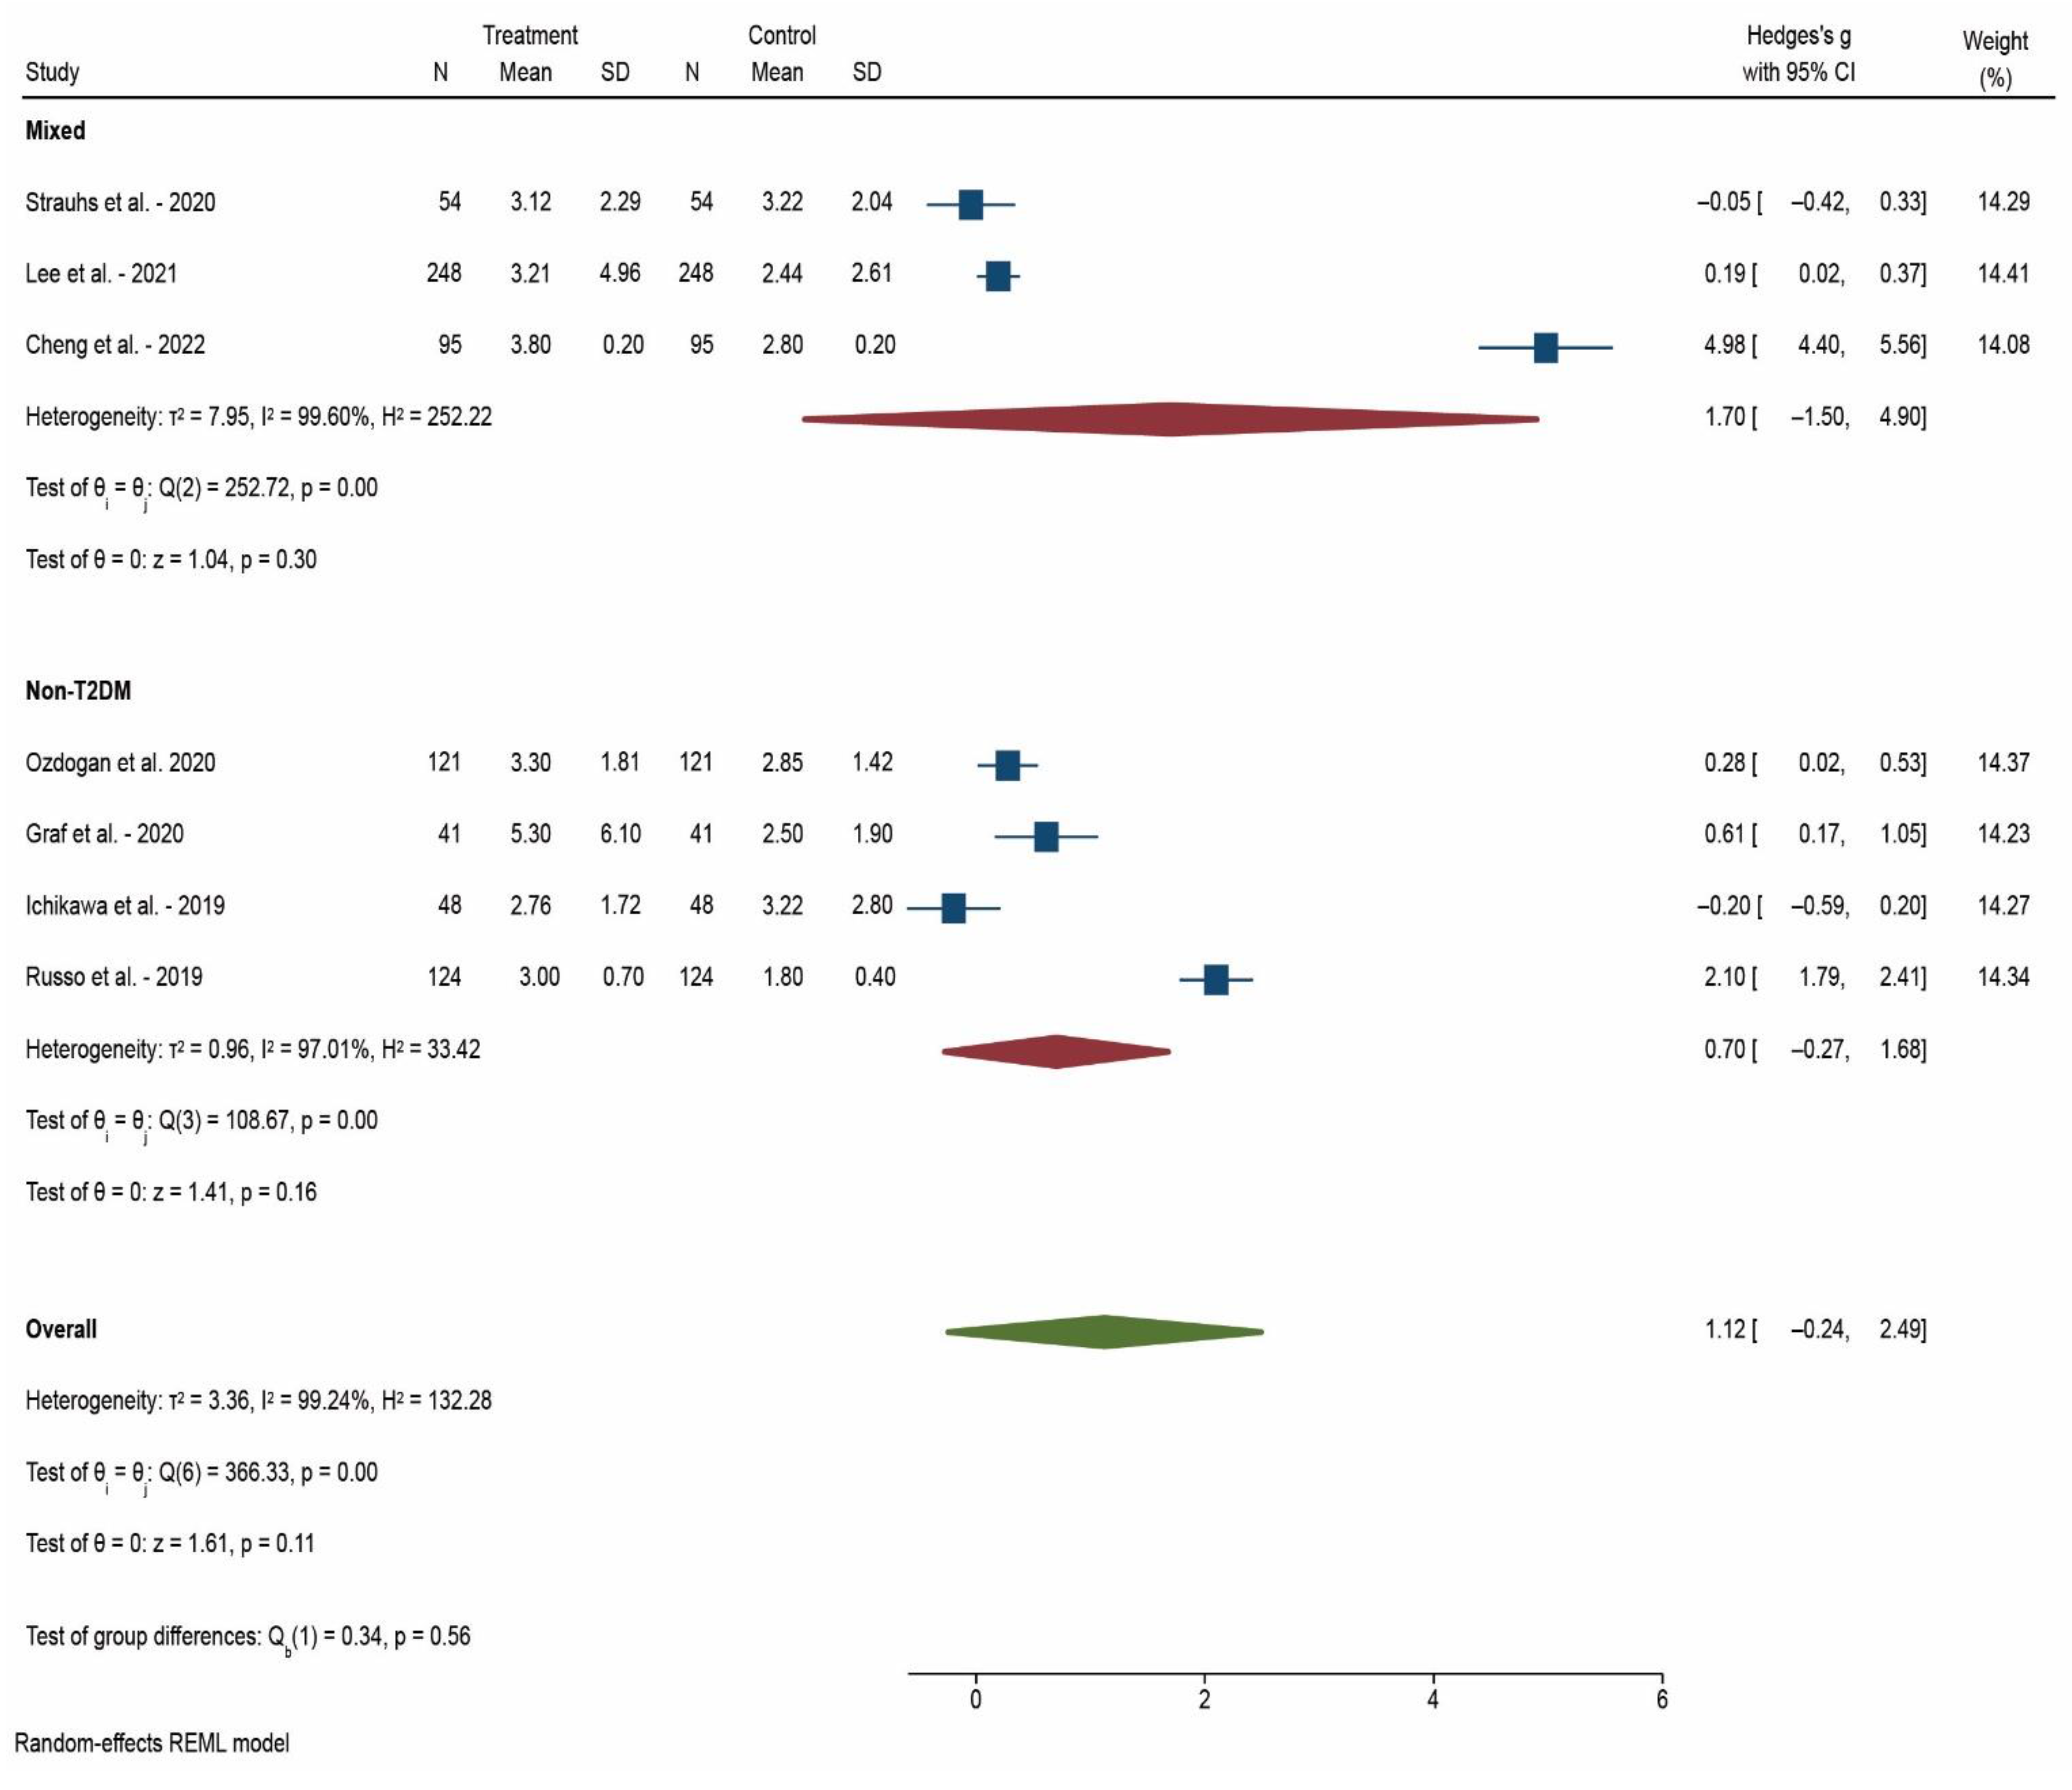
| After 52 weeks | 7 | 1.123 | 0.107 |
| Diabetic status | |||
| Mixed patients | 18 | 1.093 | 0.017 * |
| Non-T2DM | 15 | 0.658 | 0.013 * |
| T2DM | 4 | 1.055 | <0.001 * |
| TOTAL | 37 | 0.907 | <0.001 * |
Publisher’s Note: MDPI stays neutral with regard to jurisdictional claims in published maps and institutional affiliations. |
© 2022 by the authors. Licensee MDPI, Basel, Switzerland. This article is an open access article distributed under the terms and conditions of the Creative Commons Attribution (CC BY) license (https://creativecommons.org/licenses/by/4.0/).
Share and Cite
Popescu, M.-S.; Drocas, A.I.; Osman, A.; Firu, D.-M.; Pădureanu, V.; Mărginean, C.M.; Pîrvu, D.-C.; Mitruț, R.; Mărgăritescu, D.N.; Radu, A.; et al. The Extent of Insulin Resistance in Patients That Cleared Viral Hepatitis C Infection and the Role of Pre-Existent Type 2 Diabetes Mellitus: A Meta-Analysis. Reports 2022, 5, 42. https://doi.org/10.3390/reports5040042
Popescu M-S, Drocas AI, Osman A, Firu D-M, Pădureanu V, Mărginean CM, Pîrvu D-C, Mitruț R, Mărgăritescu DN, Radu A, et al. The Extent of Insulin Resistance in Patients That Cleared Viral Hepatitis C Infection and the Role of Pre-Existent Type 2 Diabetes Mellitus: A Meta-Analysis. Reports. 2022; 5(4):42. https://doi.org/10.3390/reports5040042
Chicago/Turabian StylePopescu, Marian-Sorin, Andrei Ioan Drocas, Andrei Osman, Dan-Mihai Firu, Vlad Pădureanu, Cristina Maria Mărginean, Daniel-Cristian Pîrvu, Radu Mitruț, Dragoș Nicolae Mărgăritescu, Antonia Radu, and et al. 2022. "The Extent of Insulin Resistance in Patients That Cleared Viral Hepatitis C Infection and the Role of Pre-Existent Type 2 Diabetes Mellitus: A Meta-Analysis" Reports 5, no. 4: 42. https://doi.org/10.3390/reports5040042