All articles published by MDPI are made immediately available worldwide under an open access license. No special
permission is required to reuse all or part of the article published by MDPI, including figures and tables. For
articles published under an open access Creative Common CC BY license, any part of the article may be reused without
permission provided that the original article is clearly cited. For more information, please refer to
https://www.mdpi.com/openaccess.
Feature papers represent the most advanced research with significant potential for high impact in the field. A Feature
Paper should be a substantial original Article that involves several techniques or approaches, provides an outlook for
future research directions and describes possible research applications.
Feature papers are submitted upon individual invitation or recommendation by the scientific editors and must receive
positive feedback from the reviewers.
Editor’s Choice articles are based on recommendations by the scientific editors of MDPI journals from around the world.
Editors select a small number of articles recently published in the journal that they believe will be particularly
interesting to readers, or important in the respective research area. The aim is to provide a snapshot of some of the
most exciting work published in the various research areas of the journal.
The anisotropic flow is one of the important observables sensitive to the equation of state (EOS) and transport properties of the strongly interacting matter created in relativistic heavy-ion collisions. In this work, we report a detailed multi-differential study of the directed (), elliptic (), triangular (), and quadrangular () flow coefficients of protons in relativistic heavy-ion collisions at = 2.2–4.5 GeV using several hadronic transport models. Recent published results for Au + Au collisions at = 2.4 GeV from HADES experiment and at = 3.0 GeV from the STAR experiment have been used for comparison. The study motivates further experimental investigations of the anisotropic collective flow of protons and neutrons in a high baryon density region.
The exploration of the properties of strongly interacting QCD matter for a wide range of temperatures and densities is the main goal of the present and future Beam Energy Scan (BES) programs with relativistic heavy-ions [1]. The existing BES programs include: programs BES-I and BES-II of the STAR experiment at RHIC for Au + Au collisions at = 3–200 GeV (collider + fixed target) [2], program of the NA61/SHINE fixed target experiment at SPS for different colliding systems (Be + Be, Ar + Sc Xe + La, Pb + Pb) at = 5.1–17.3 GeV [3], program of the BM@N fixed target experiment at Nuclotron for different colliding systems (Ar + Sc, Xe + CsI, Ar + Pb, Bi + Bi) at = 2.4–3.5 GeV [4] and program of the HADES fixed target experiment at SIS-18 for (Au + Au, Ag + Ag) at = 2.4–2.55 GeV [5]. The main goal is to study the the high-density equation of state (EOS) and search for a possible phase transition in dense baryonic matter [6]. In the near future, the MPD experiment at NICA ( = 4–11 GeV) [7] and the CBM experiment at FAIR ( = 2.7–4.9 GeV) [8] will further explore the phase diagram at a high baryon density region with high statistics data. The anisotropic flow, as manifested by the anisotropic collective emission of particles in the plane transverse to the beam direction, is one of the important observables sensitive to the equation of state (EOS) and transport properties of the strongly interacting matter created in relativistic heavy-ion collisions [9]. Moreover, the neutron-proton elliptic flow ratio and the difference have been demonstrated to be a sensitive probe of the EoS of asymmetric matter [10,11]. The anisotropic flow can be quantified by Fourier coefficients [9] in the expansion of the particle azimuthal distribution as:
where n is the order of the harmonic, is the azimuthal angle of particle of the given type, and is the azimuthal angle of the reaction plane. The flow coefficients can be calculated as , where the brackets denote the average over the particles and events. The directed () and elliptic () flows are dominant flow signals in the energy range of 2 < < 11 GeV [9,12,13,14,15,16,17]. The most stringent currently available constraints on the high-density EOS of symmetric nuclear matter come from the measurements of and flow signals of protons in Au + Au collisions at GeV by the E895 experiment at the AGS in Brookhaven [9,12,13,14,18]. Compared to the relativistic transport model calculations, the results from E895 can be well reproduced by a soft EOS with the incompressibility = 210 MeV, while reproducing the measurements required larger values of = 300 MeV (and therefore a harder EOS) [18]. The same conclusion can be drawn from the recent work, where an attempt was made to describe the and results from the E895 experiment using a different hadronic transport code [19]. Such a large spread of values may come from a substantial disagreement between the E895 [12,13] and the recent STAR results for and of protons [15,16]. Therefore, high precision measurements of both the directed and elliptic flows from 2 < < 5 GeV are required, in order to reduce the existing discrepancy between the present results and to further constrain the EOS for the symmetric matter. Recently, the HADES experiment has reported the first measurements of the higher order ( and ) flow coefficients of protons in Au + Au collisions at = 2.4 GeV [17]. The higher order flow coefficients are expected to be more sensitive to the EOS and may provide additional constraints. The ratio of the elliptic flow signals observed for neutrons and protons proposed to study the EoS of asymmetric matter [10]. However, an effective constraint for the EoS of asymmetric matter would require experimental values for the elliptic flow of both protons and neutrons of an accuracy of 1% or better [11]. At present, in spite of the rather rich experimental data on proton flow in the considering energy range of colliding nuclei, rather scarce data on neutron flow are available only at energies below 1 AGeV for Au + Au collisions [10]. The BM@N experiment opens an opportunity to measure the flow of protons by the existing magnetic spectrometer and neutrons by the neutron detector, which is now under development at the Nuclotron energy range, where no experimental data on neutron flow exist.
In this work, we present a detailed multi-differential study of flow coefficients of protons in relativistic heavy-ion collisions at = 2.2–4.5 GeV using several hadronic transport models: UrQMD [20,21], PHQMD [22], DCM-QGSM-SMM [23] and JAM [24,25,26]. The recently published results for Au + Au collisions at = 2.4 GeV from the HADES experiment [17] and at = 3.0 GeV from the STAR experiment [15] have been used for comparison. We seek to establish whether the selected transport models can reproduce the distinctive features of of protons. We predict the energy and system size (Au + Au, Xe + Cs, Ag + Ag) dependence of of protons in relativistic heavy-ion collisions at = 2.2–4.5 GeV. The results would be useful as predictions for the upcoming beam energy scan experiments: BM@N at Nuclotron and MPD at NICA Collider.
2. Short Description of the Transport Models
In this section, we shortly summarise the main features of the selected hadronic transport models.
The Ultrarelativistic Quantum Molecular Dynamics (UrQMD) model [20,21] is a microscopic transport approach based on the binary elastic and inelastic scattering of hadrons, resonance excitations and decays as well as string dynamics and strangeness exchange reactions. We have used the version 3.4 of the UrQMD with the default set of parameters in the cascade mode (no potentials, EoS = 0) and mean-field with a hard Skyrme equation of the state (EoS = 1) with = 380 MeV.
The Parton-Hadron-Quantum-Molecular Dynamics (PHQMD) [22] is a n-body dynamical transport approach designed to provide a microscopic dynamical description for the formation of light and heavy clusters and hypernuclei as well as for hadrons in relativistic heavy-ion collisions. The propagation of baryons is based on the n-body QMD dynamics while the description of mesons was taken from the PHSD model. The PHQMD includes mutual 2-body density-dependent Skyrme type potentials for interactions among baryons. Two sets of parameters for the nuclear equation of the state have been used; see Table I from Ref. [22]. The parameters for the “soft EOS” lead to a nuclear incompressibility of = 200 MeV and for the “hard EOS” to a = 380 MeV [22].
DCM-QGSM-SMM is a hybrid heavy-ion event generator based on the Dubna Cascade Model (DCM), the Quark-Gluon String Model (QGSM) and the Statistical Multifragmentation Model (SMM) [23]. JET AA Microscopic Transportation Model (JAM) has been developed to simulate high energy nuclear collisions [24,25,26]. We have used the version JAM 1.9 [26] with five different EOS implementations: soft momentum independent NS2 ( = 210 MeV), hard momentum independent NS1 ( = 380 MeV), soft momentum dependent MD4 ( = 210 MeV) and hard momentum dependent MD2 and MD3 ( = 380 MeV) with different values of the optical potential; see Table I from Ref. [26] for the detailed description of the EOS implementations. The JAM approach has been found to reproduce the directed and integral elliptic flow data at 2.3 < < 8 GeV simultaneously with the parameter set MD2 [26].
For each model and set of EOS parameters, a Monte Carlo event sample of 20 to 40 million minimum bias Au + Au collisions has been generated for collision energies = 2.2, 2.4, 2.5, 2.7, 3.0, 3.3, 3.5, 3.8, 4.0, and 4.5 GeV.
3. Results
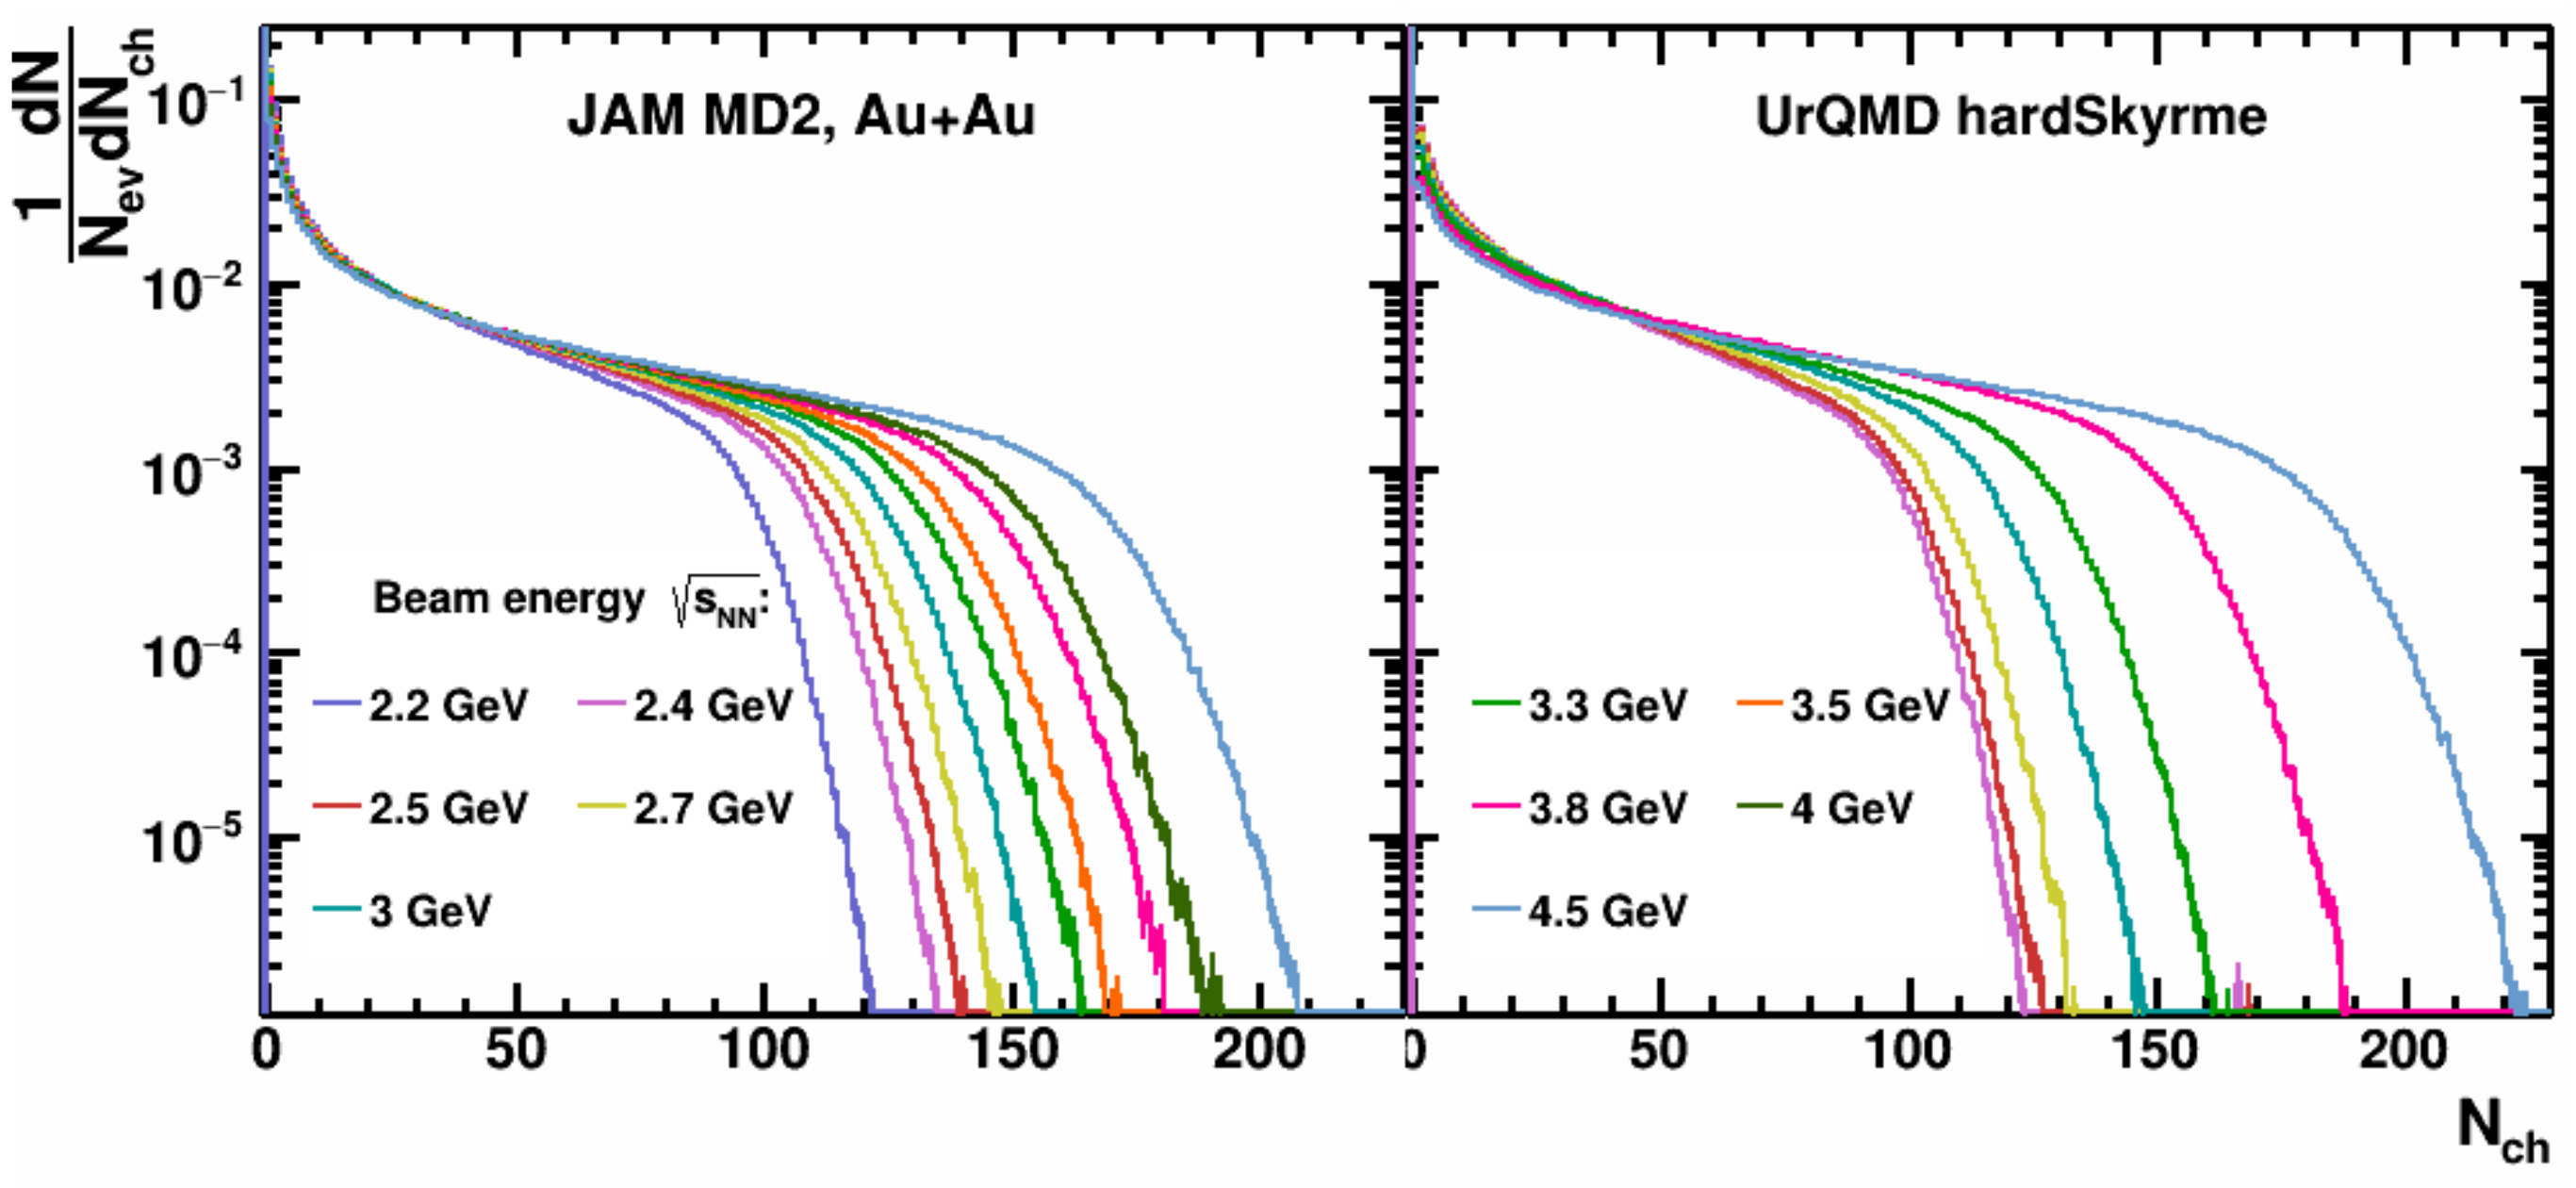
We need to define the centrality of the collision to make the proper comparison with the published experimental results. In both STAR [27] and HADES [28] experiments, the measured multiplicity distribution of the produced particles is divided into percentile centrality classes, with the most central class defined by X% of events with the highest value of , which corresponds to small values of the impact parameter b. The correlation between measured and b of the collision is then inferred from the comparison of with the Monte-Carlo Glauber (MC-Glauber) simulations [27,28,29]. Following the analysis procedure of the STAR experiment [27], the centrality has been determined by the reference multiplicity of the produced charged particles, which is the number of charged particles within the pseudorapidity range 0.5. As an example, Figure 1 shows the reference multiplicity distribution for Au + Au collisions at = 2.4–4.5 GeV for the mean-field mode of JAM (left panel) and UrQMD (right panel) models. The selection of centrality classes is based on MC-Glauber approach [29].
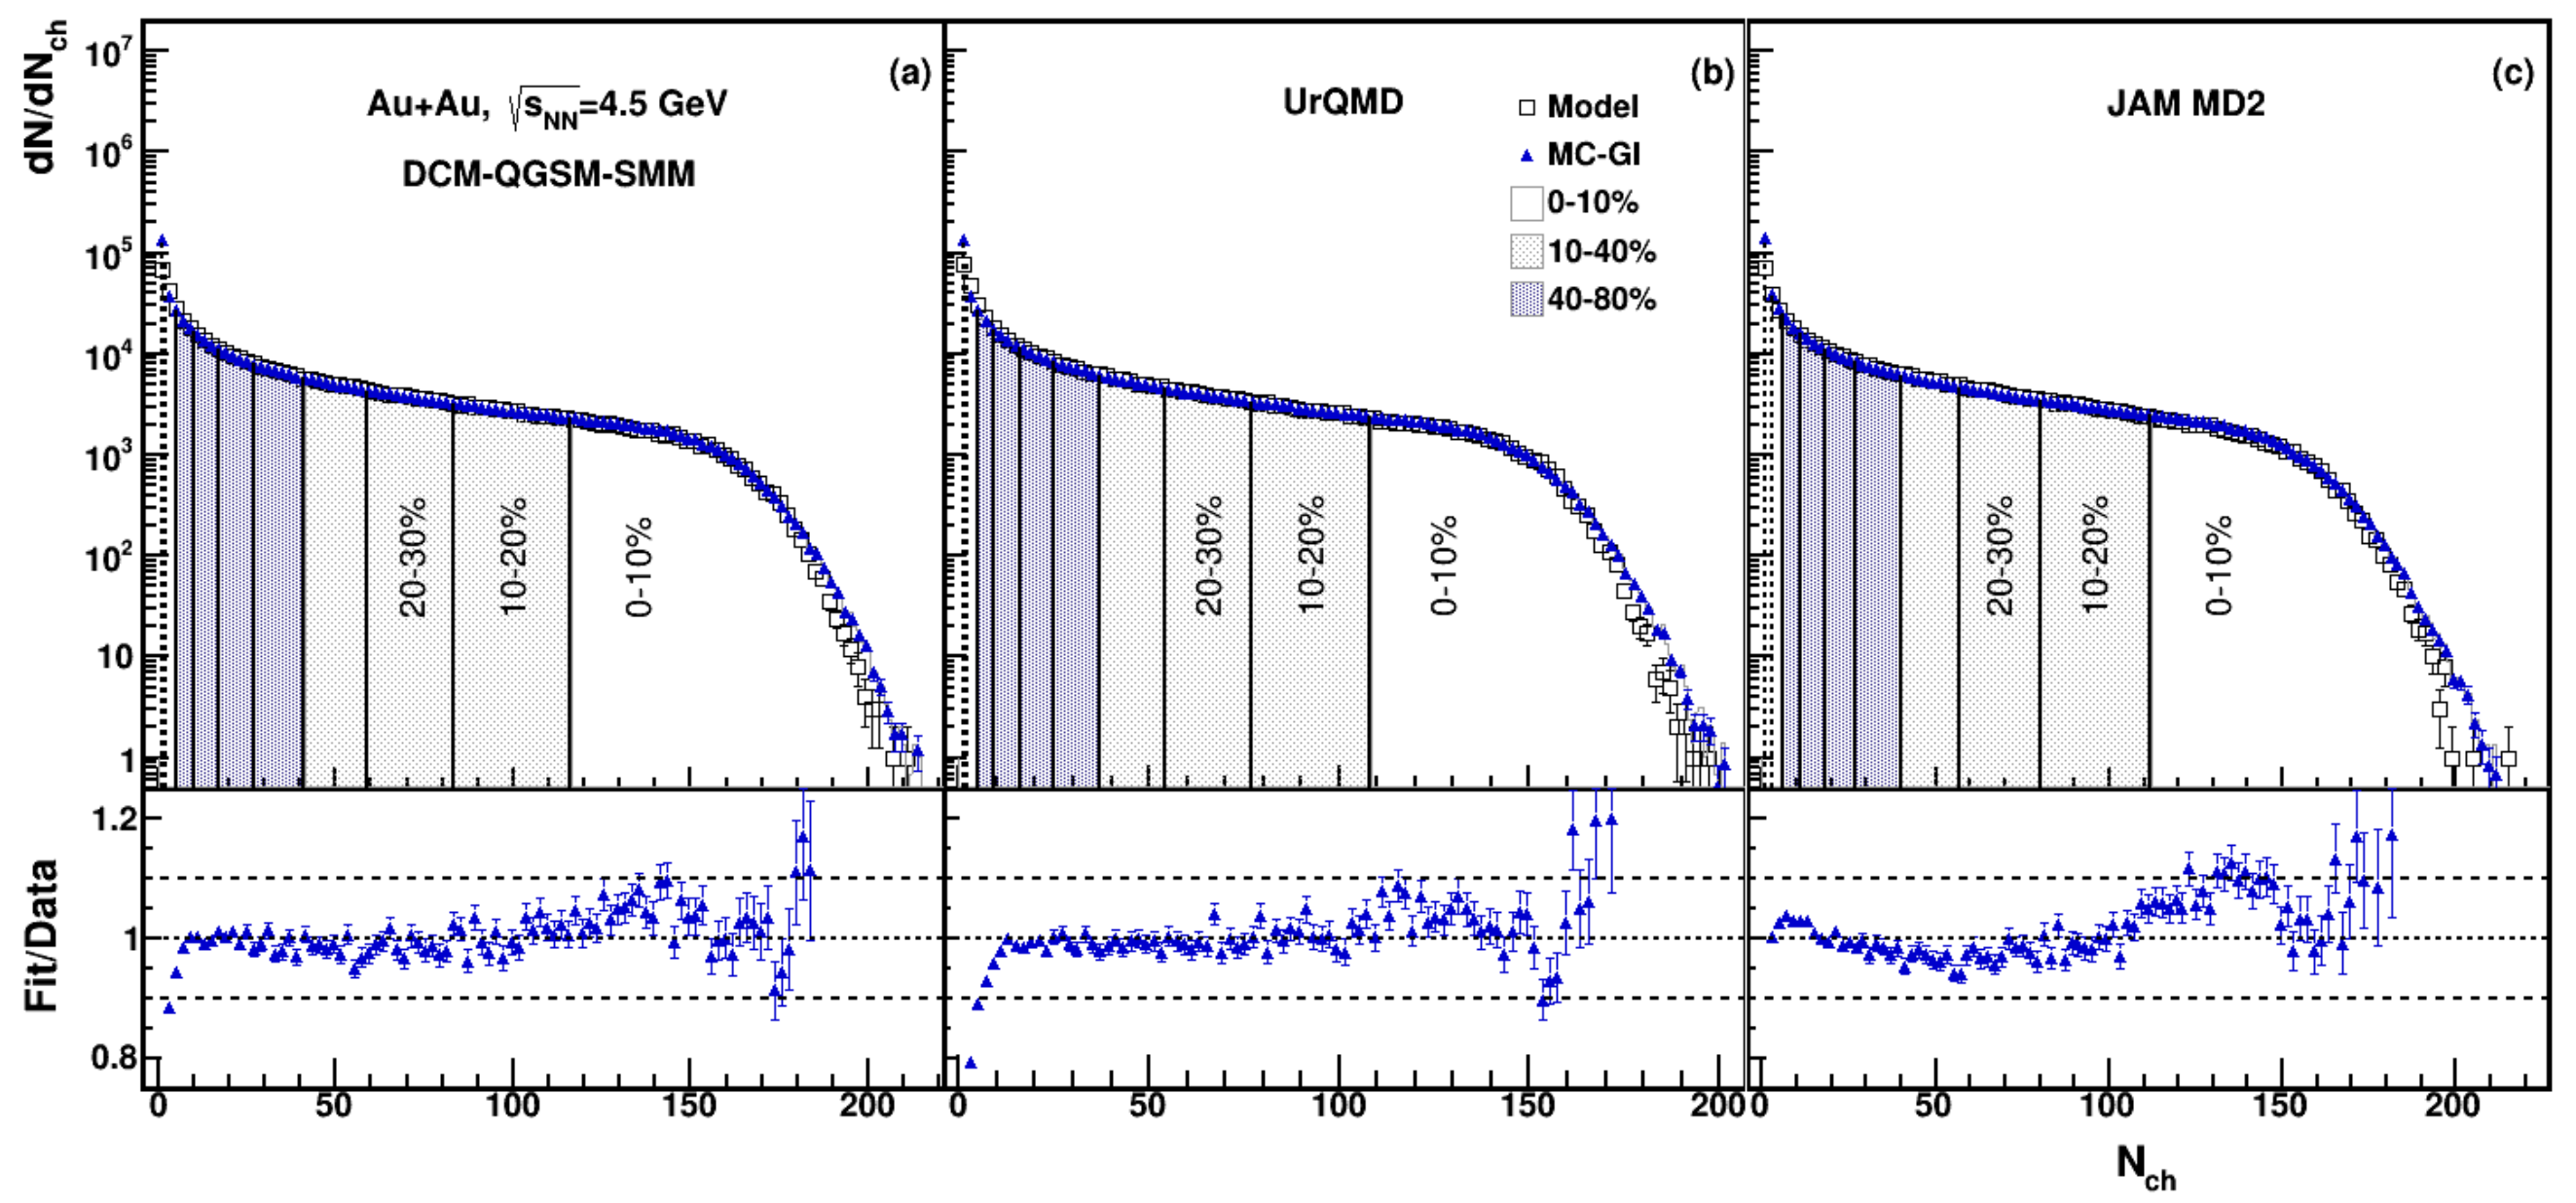
As an example, Figure 2 shows the reference multiplicity distributions of charged particles for Au + Au collisions at GeV for the DCM-QGSM-SMM (left panel), UrQMD (central panel) and JAM MD2 (right panel) models compared to those from Monte Carlo (MC) Glauber simulations (blue line) [29]. A total of 10% centrality classes are indicated with black vertical lines in Figure 2.
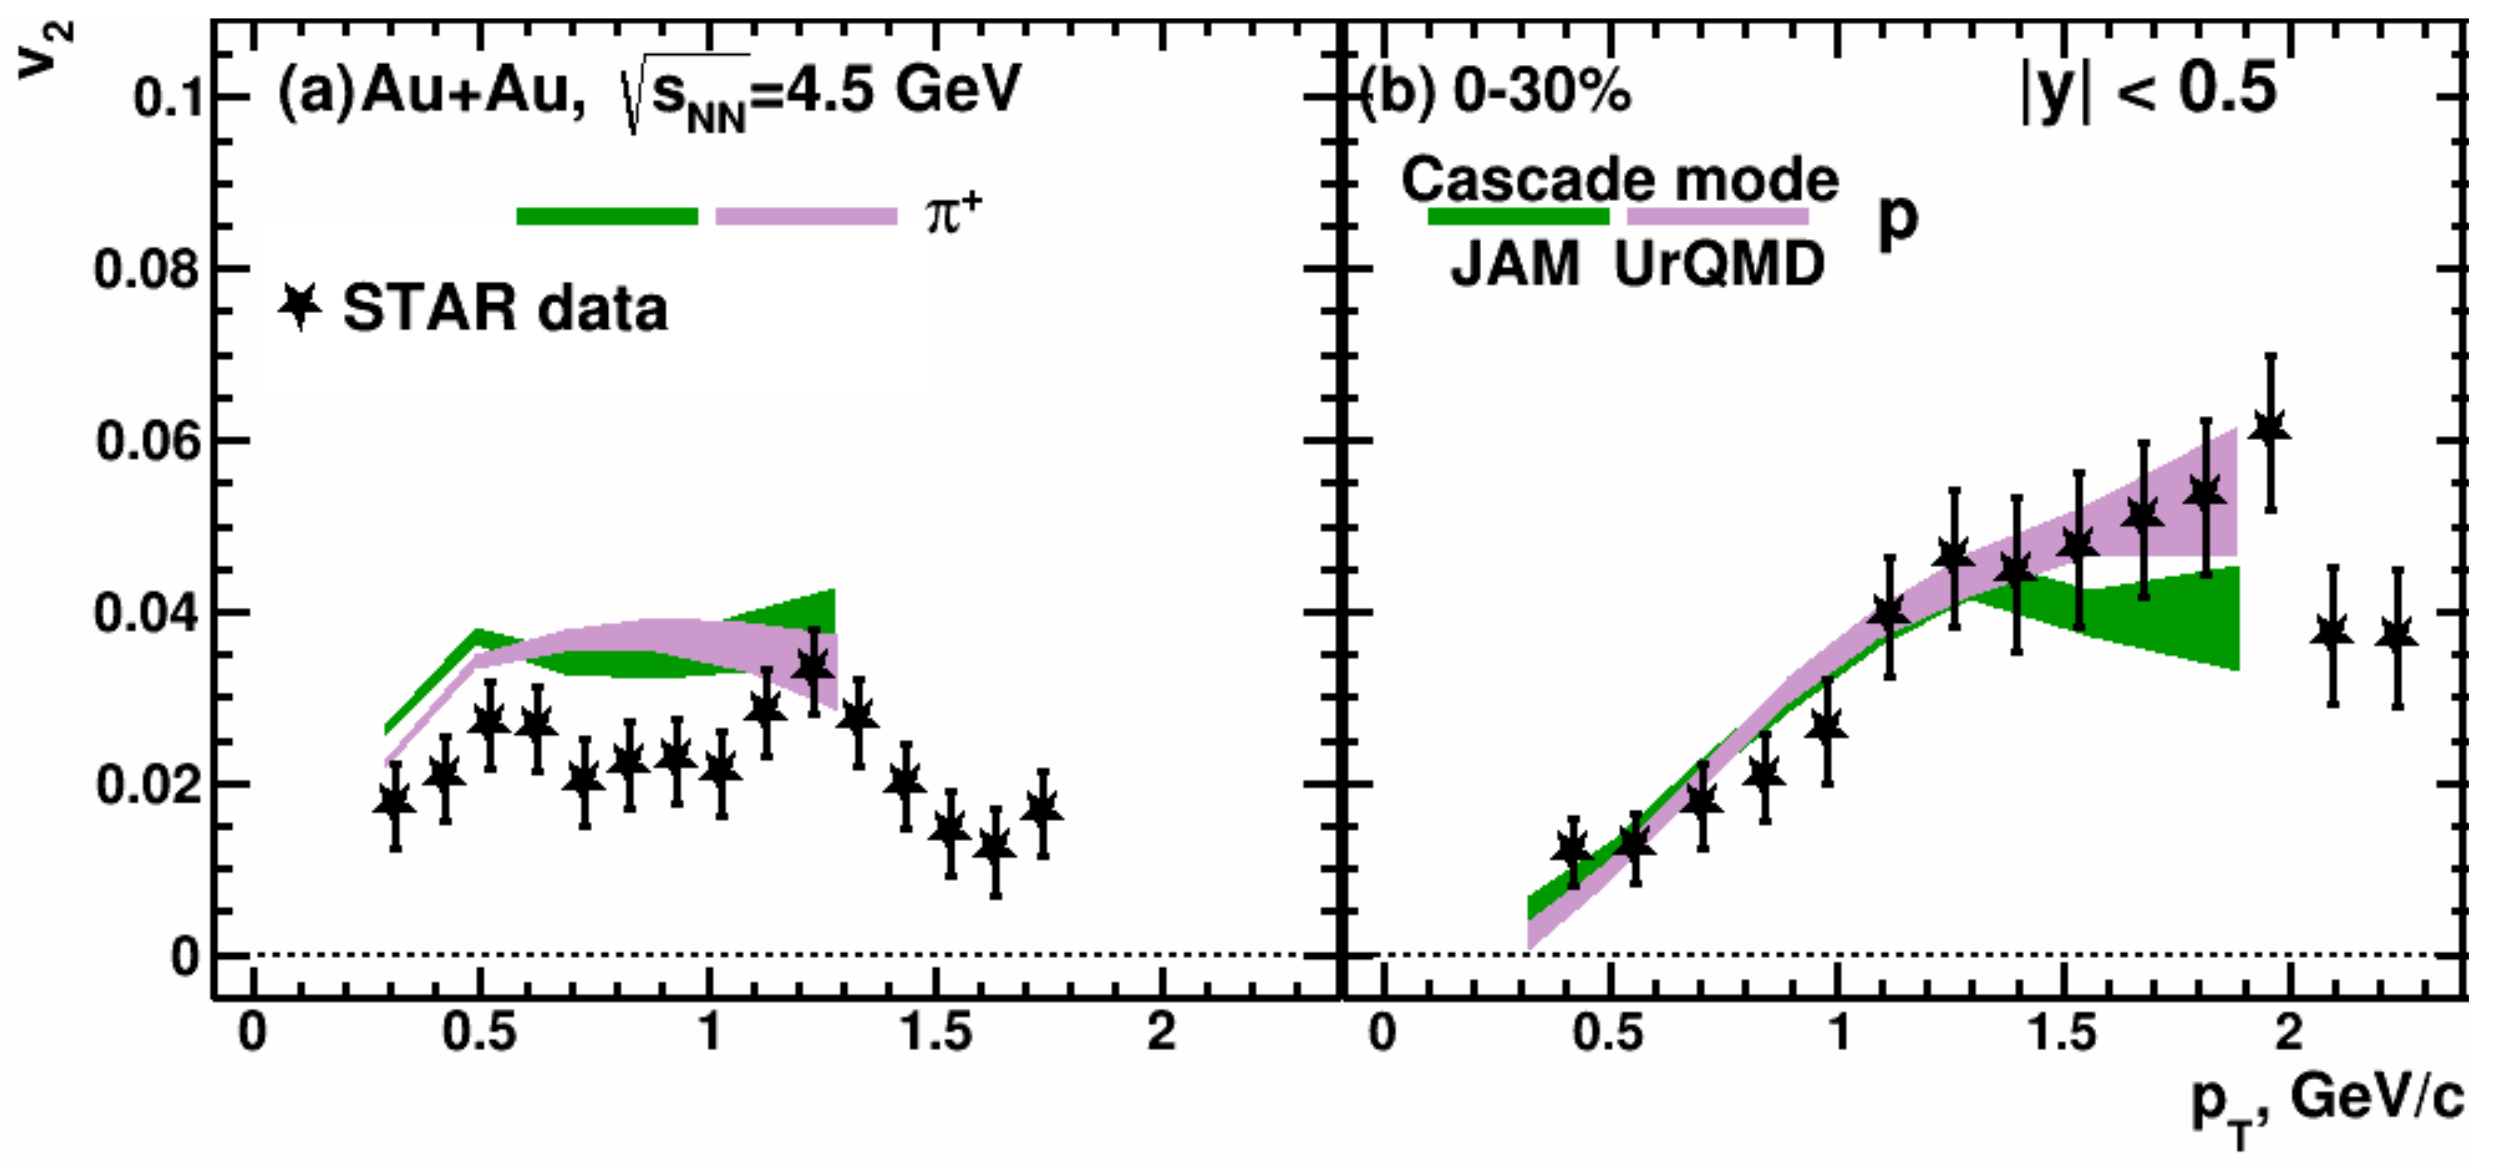
Let us start the comparison with published results from the cascade version of the selected hadronic transport models. From the previous studies, we know that cascade models can roughly capture the overall magnitude and trends of the measured directed () and elliptic () flow signals of protons in Au + Au collisions at = 4.5–7.7 GeV [30,31,32]. Figure 3 presents the transverse momentum () dependence of of pions (left panel) and protons (right panel) in the 0–30% central Au + Au collisions at GeV. The symbols denote the published STAR data [16]. The purple and green bands represent the results from the cascade mode of UrQMD and JAM models, respectively.
The directed flow () can probe the very early stages of the collision, as it is generated during the passage time of the two colliding nuclei , where R is the radius of the nucleus at rest, is the spectator velocity in c.m. and is the corresponding Lorentz factor, respectively. is expected to increase with increasing the passage time (decreasing collision energy). At lower beam energies GeV, shadowing effects by the spectator matter play an important role in the generation of elliptic flow. For a broad range of energies ( GeV), the results can be understood in terms of a delicate balance between (i) the ability of pressure developed early in the compressed overlap zone, to effect a rapid transverse expansion of nuclear matter, and (ii) the passage time at which the accelerated nuclei interpenetrate each other [12,14,18]. In the energy range GeV, the passage time increases from 7 fm/c to 30 fm/c. If the passage time is long compared to the expansion time, spectator nucleons serve to block the path of participant hadrons emitted toward the reaction plane, and nuclear matter is squeezed-out perpendicular to this plane, giving rise to negative elliptic flow ( < 0). The nuclear mean-field effects will significantly contribute to the observed azimuthal anisotropies in this energy range [12,14,15,18].
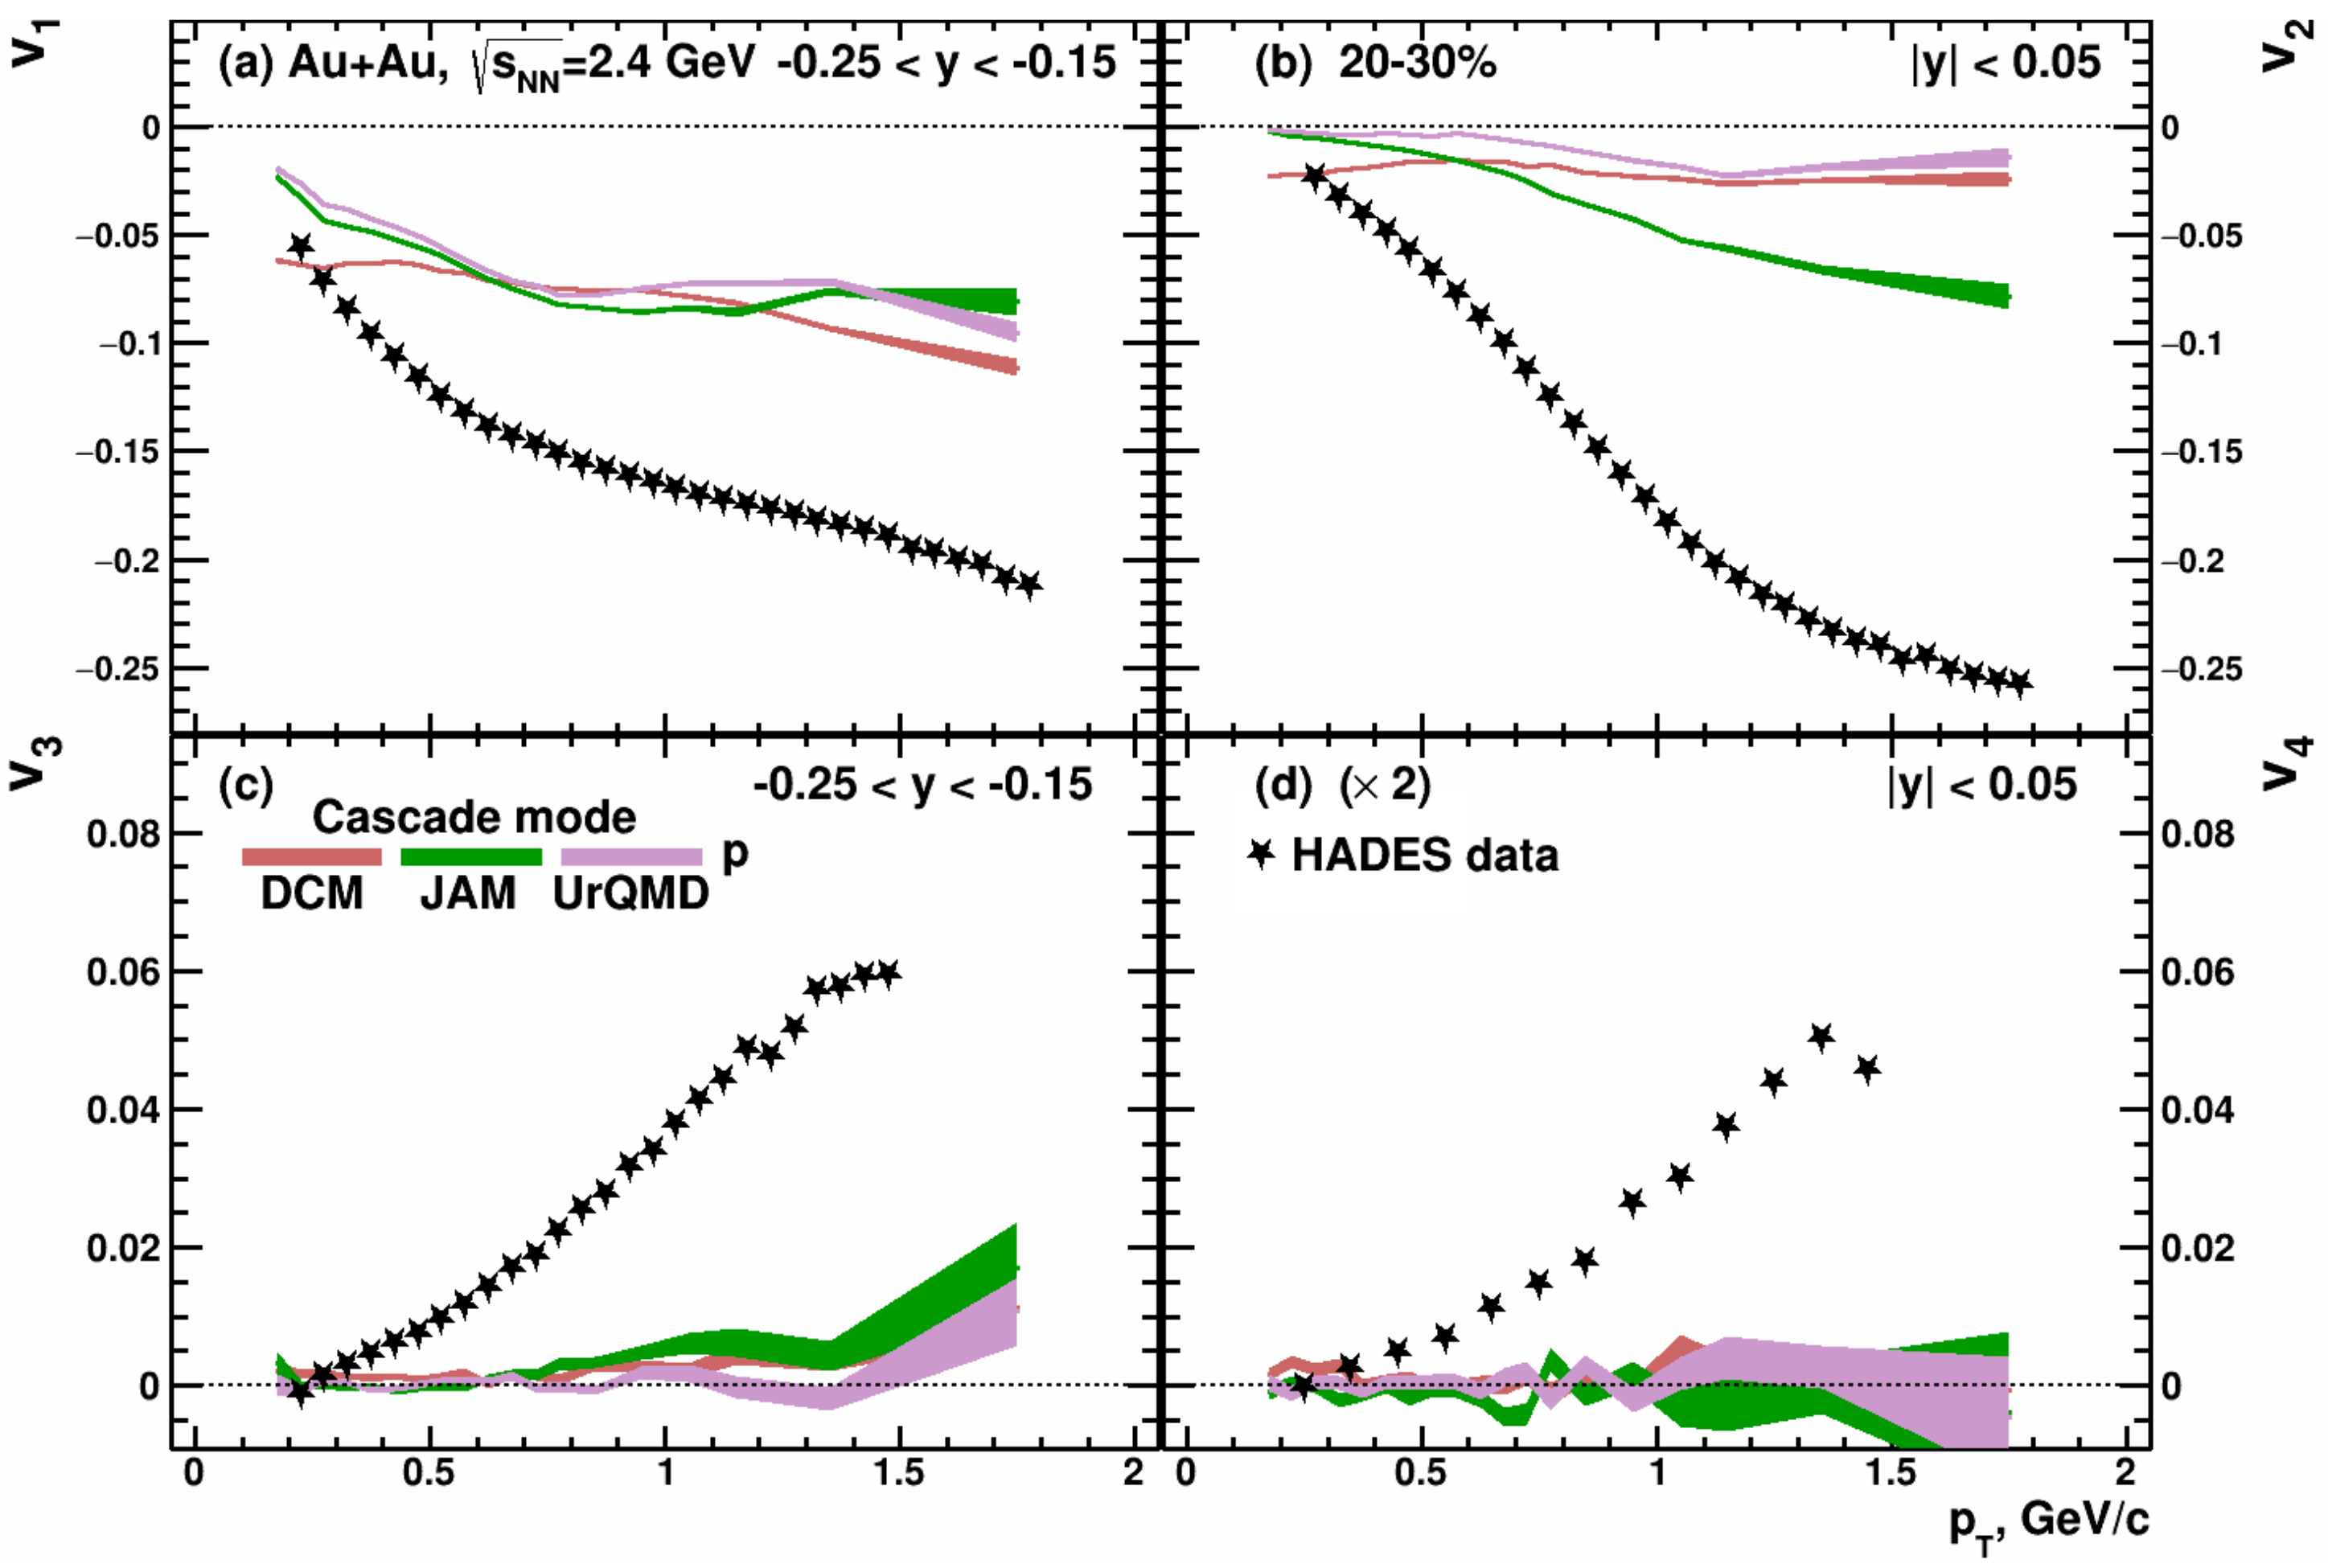
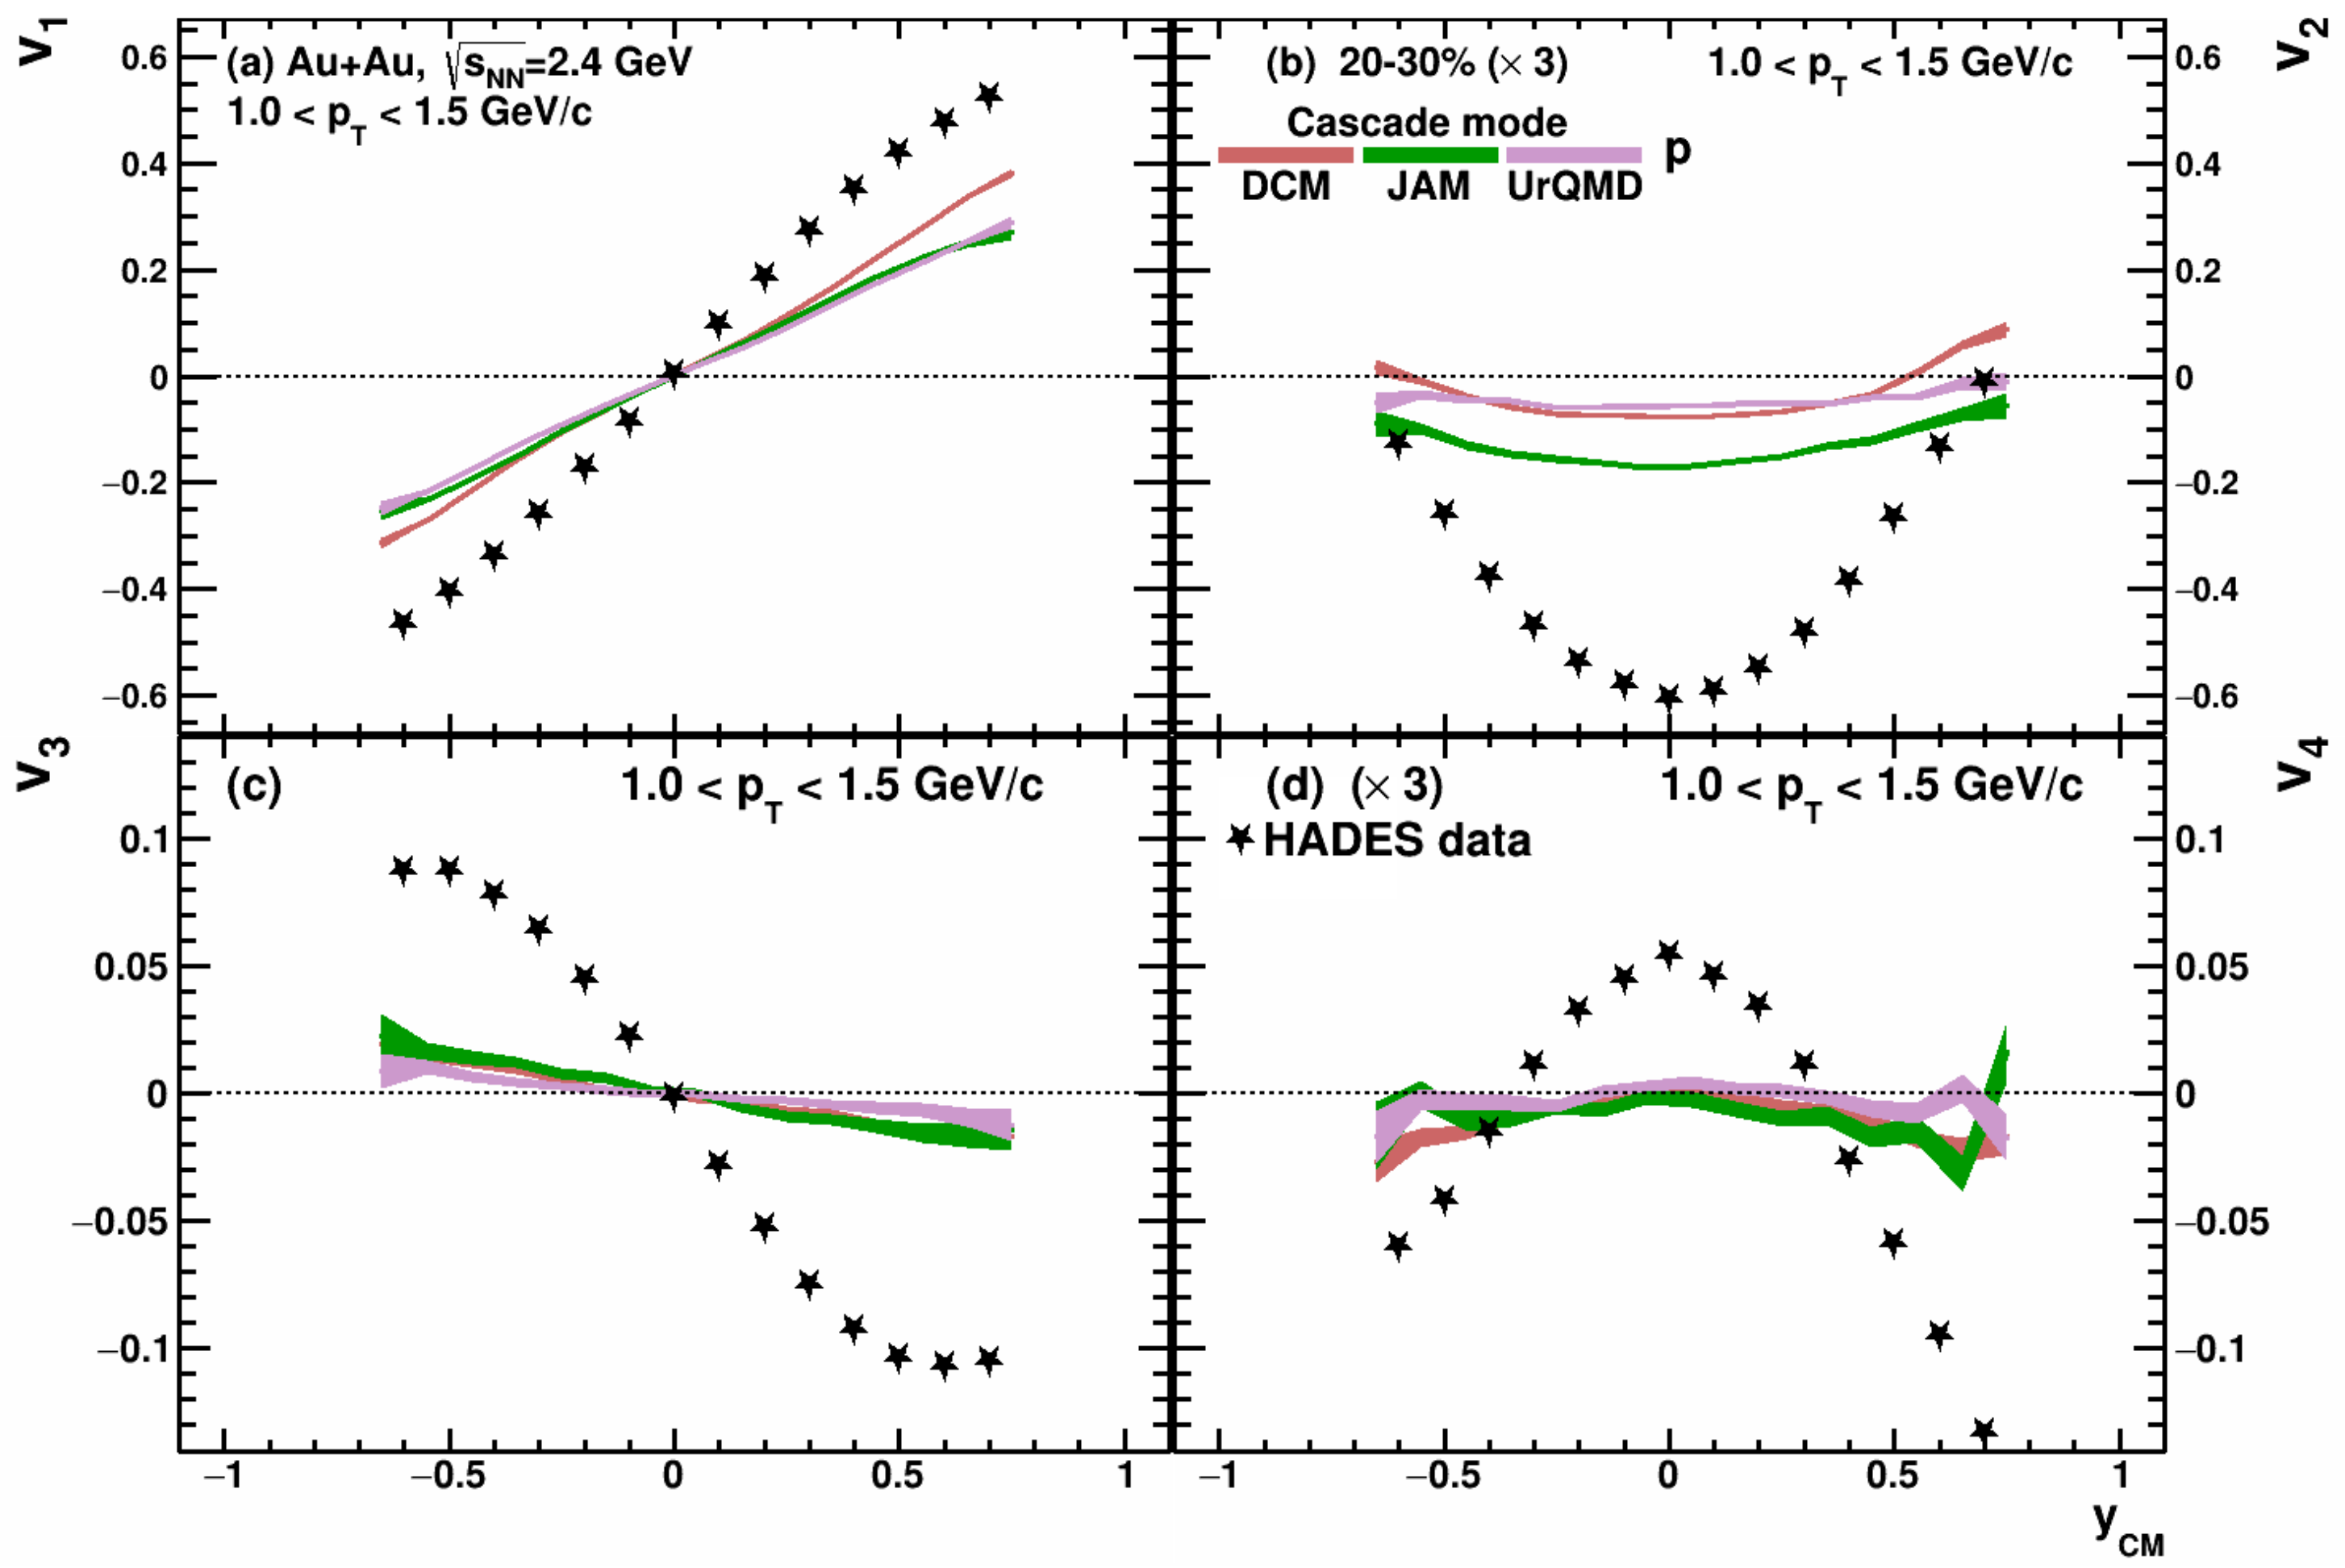
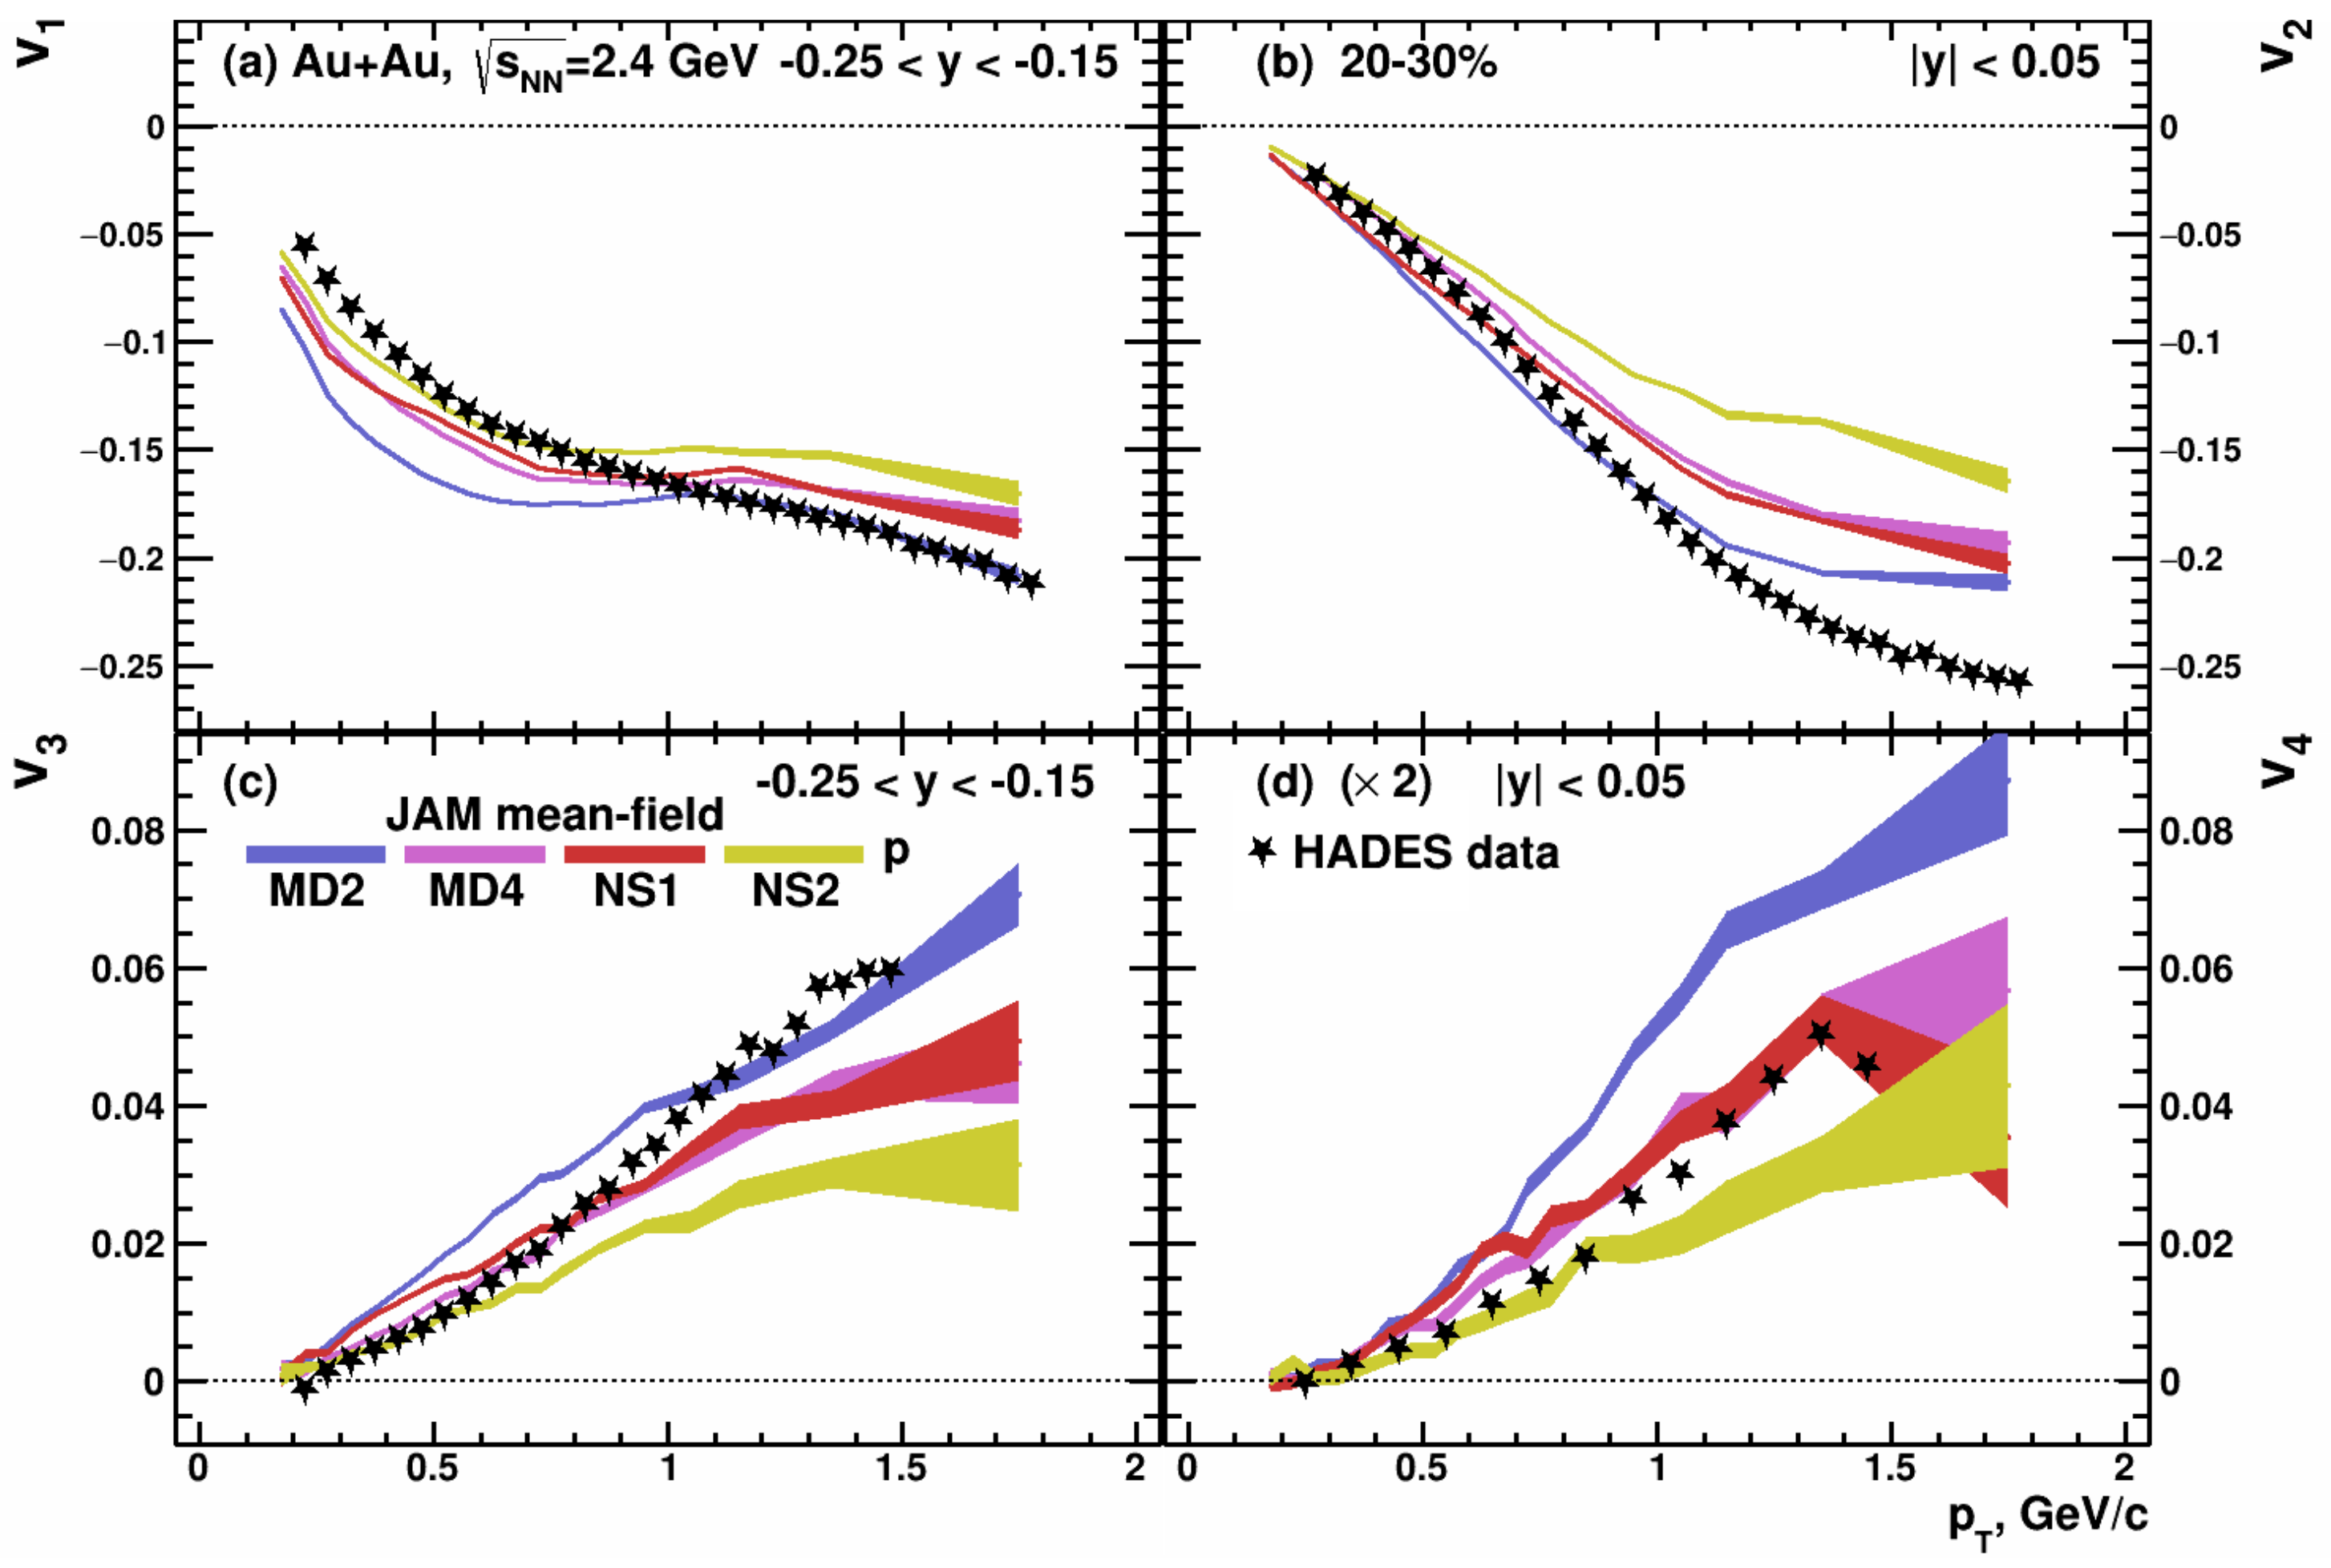
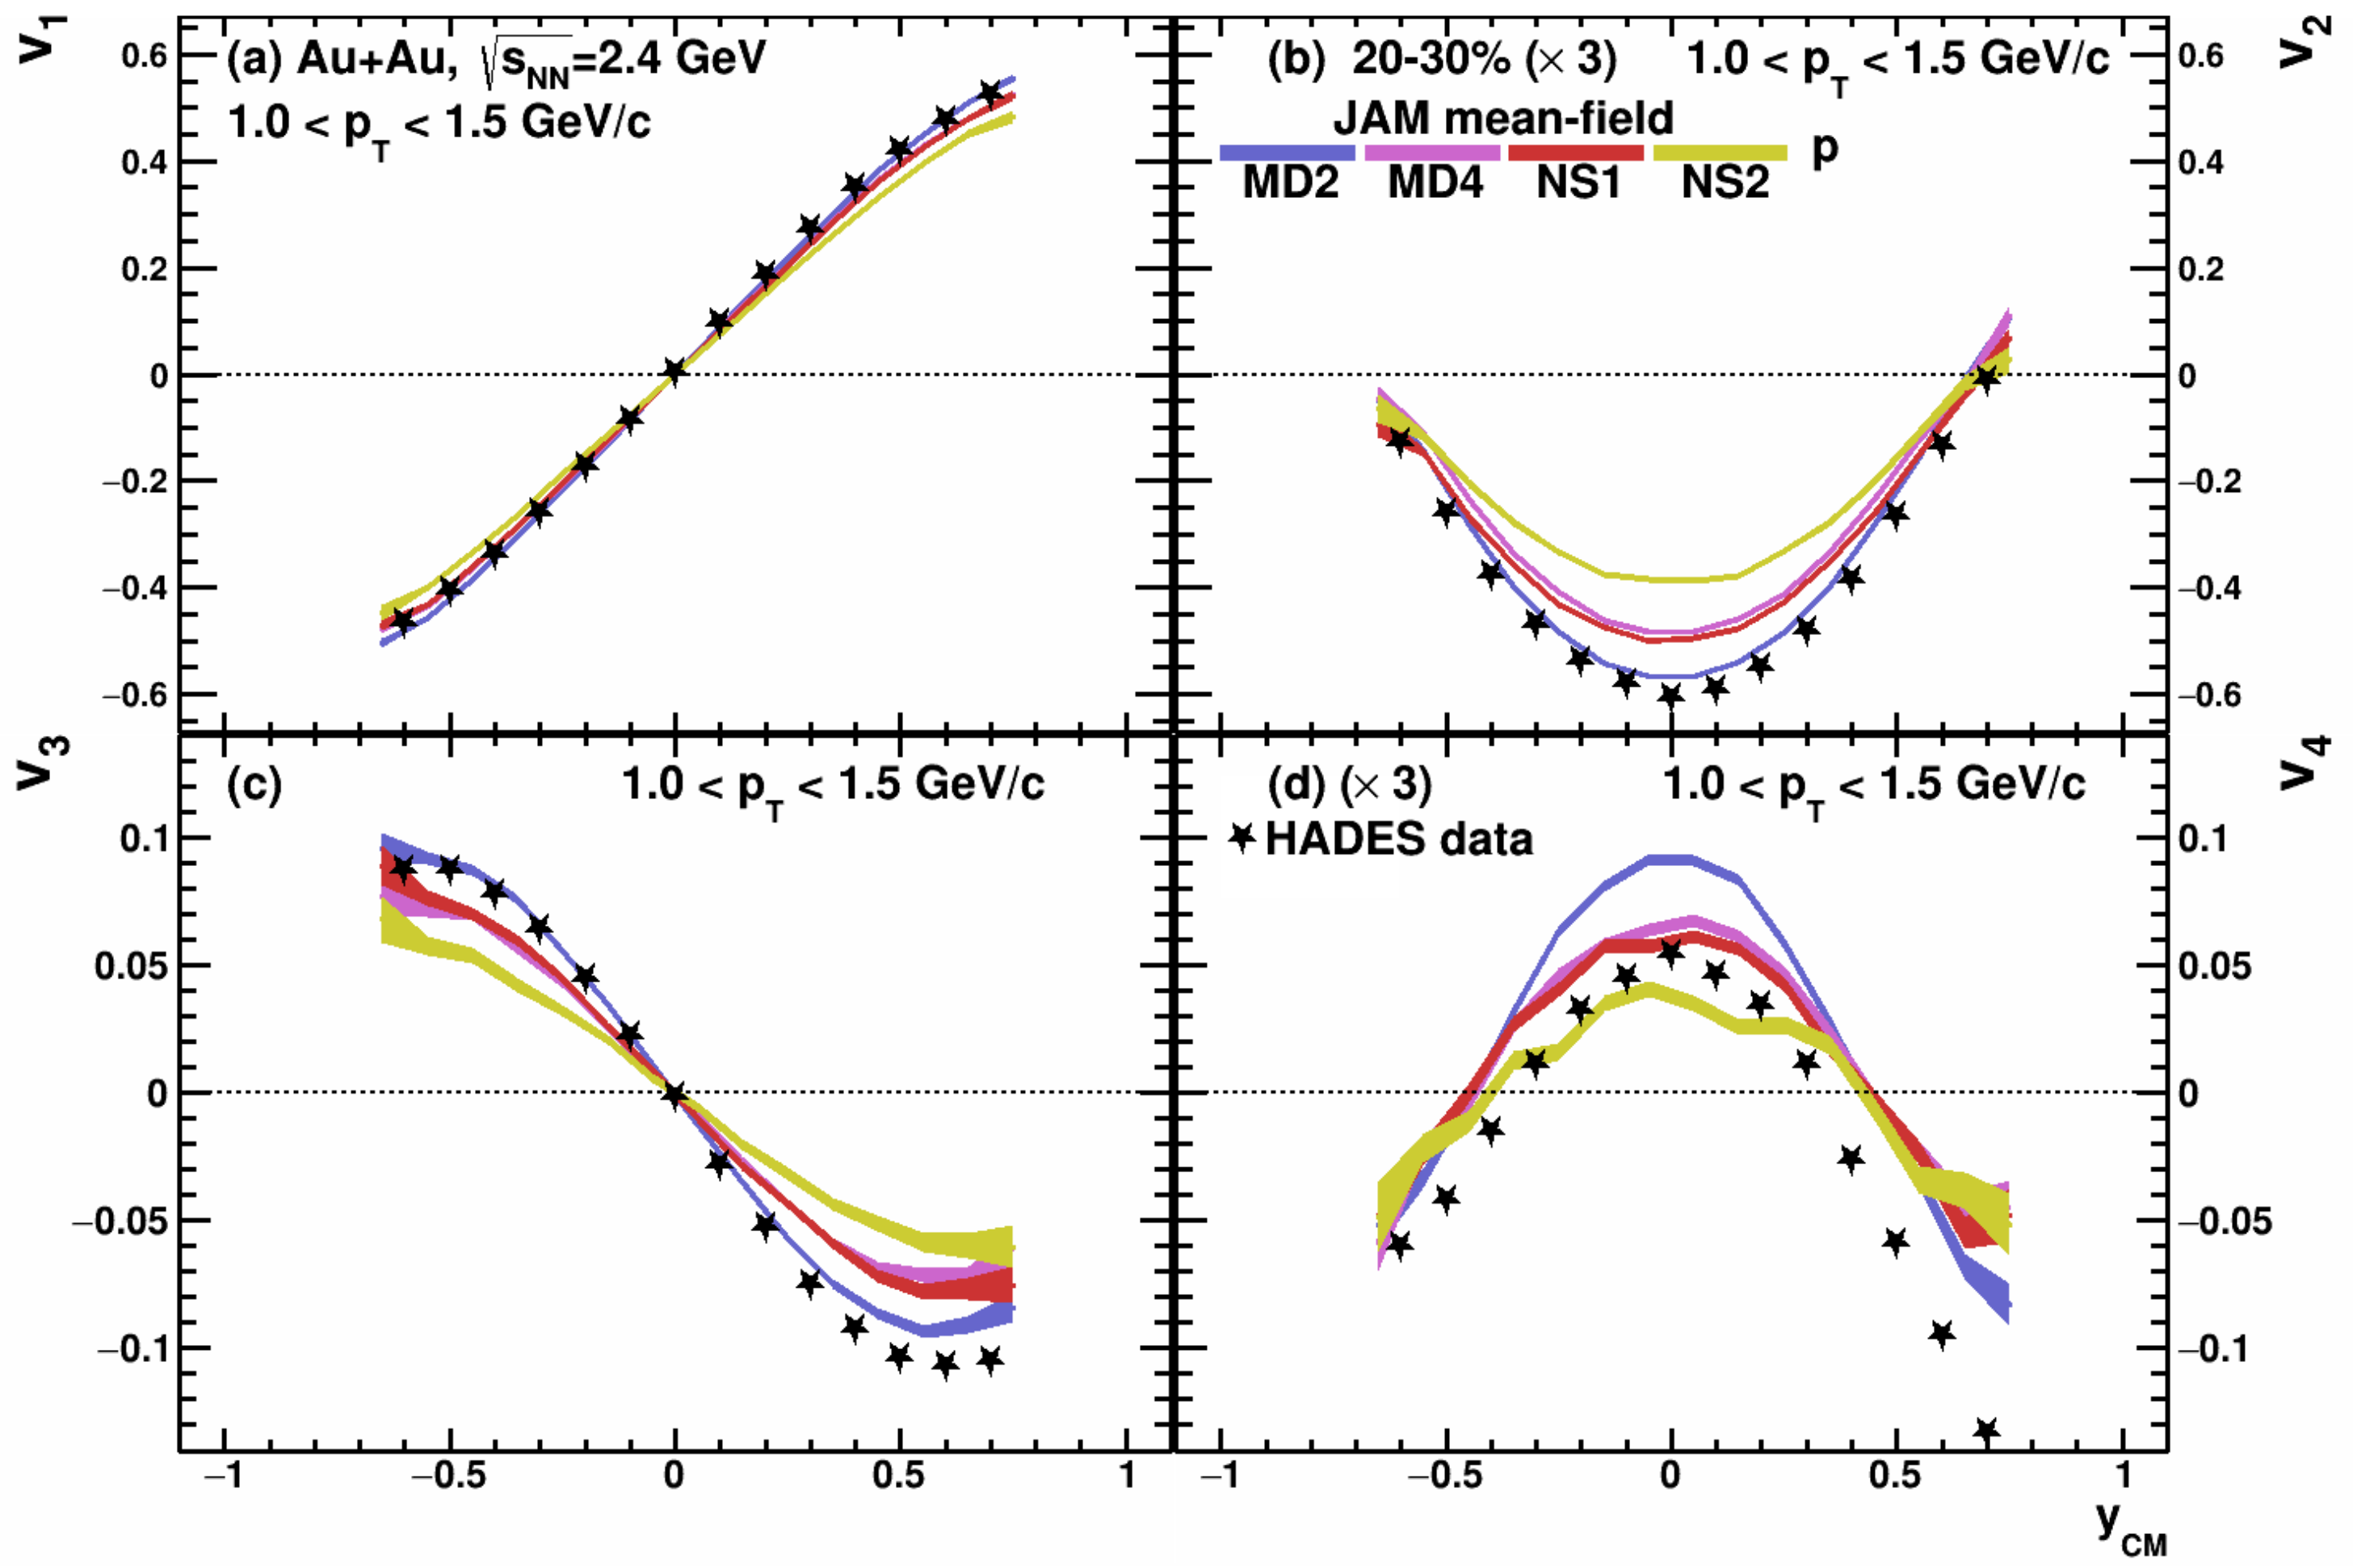
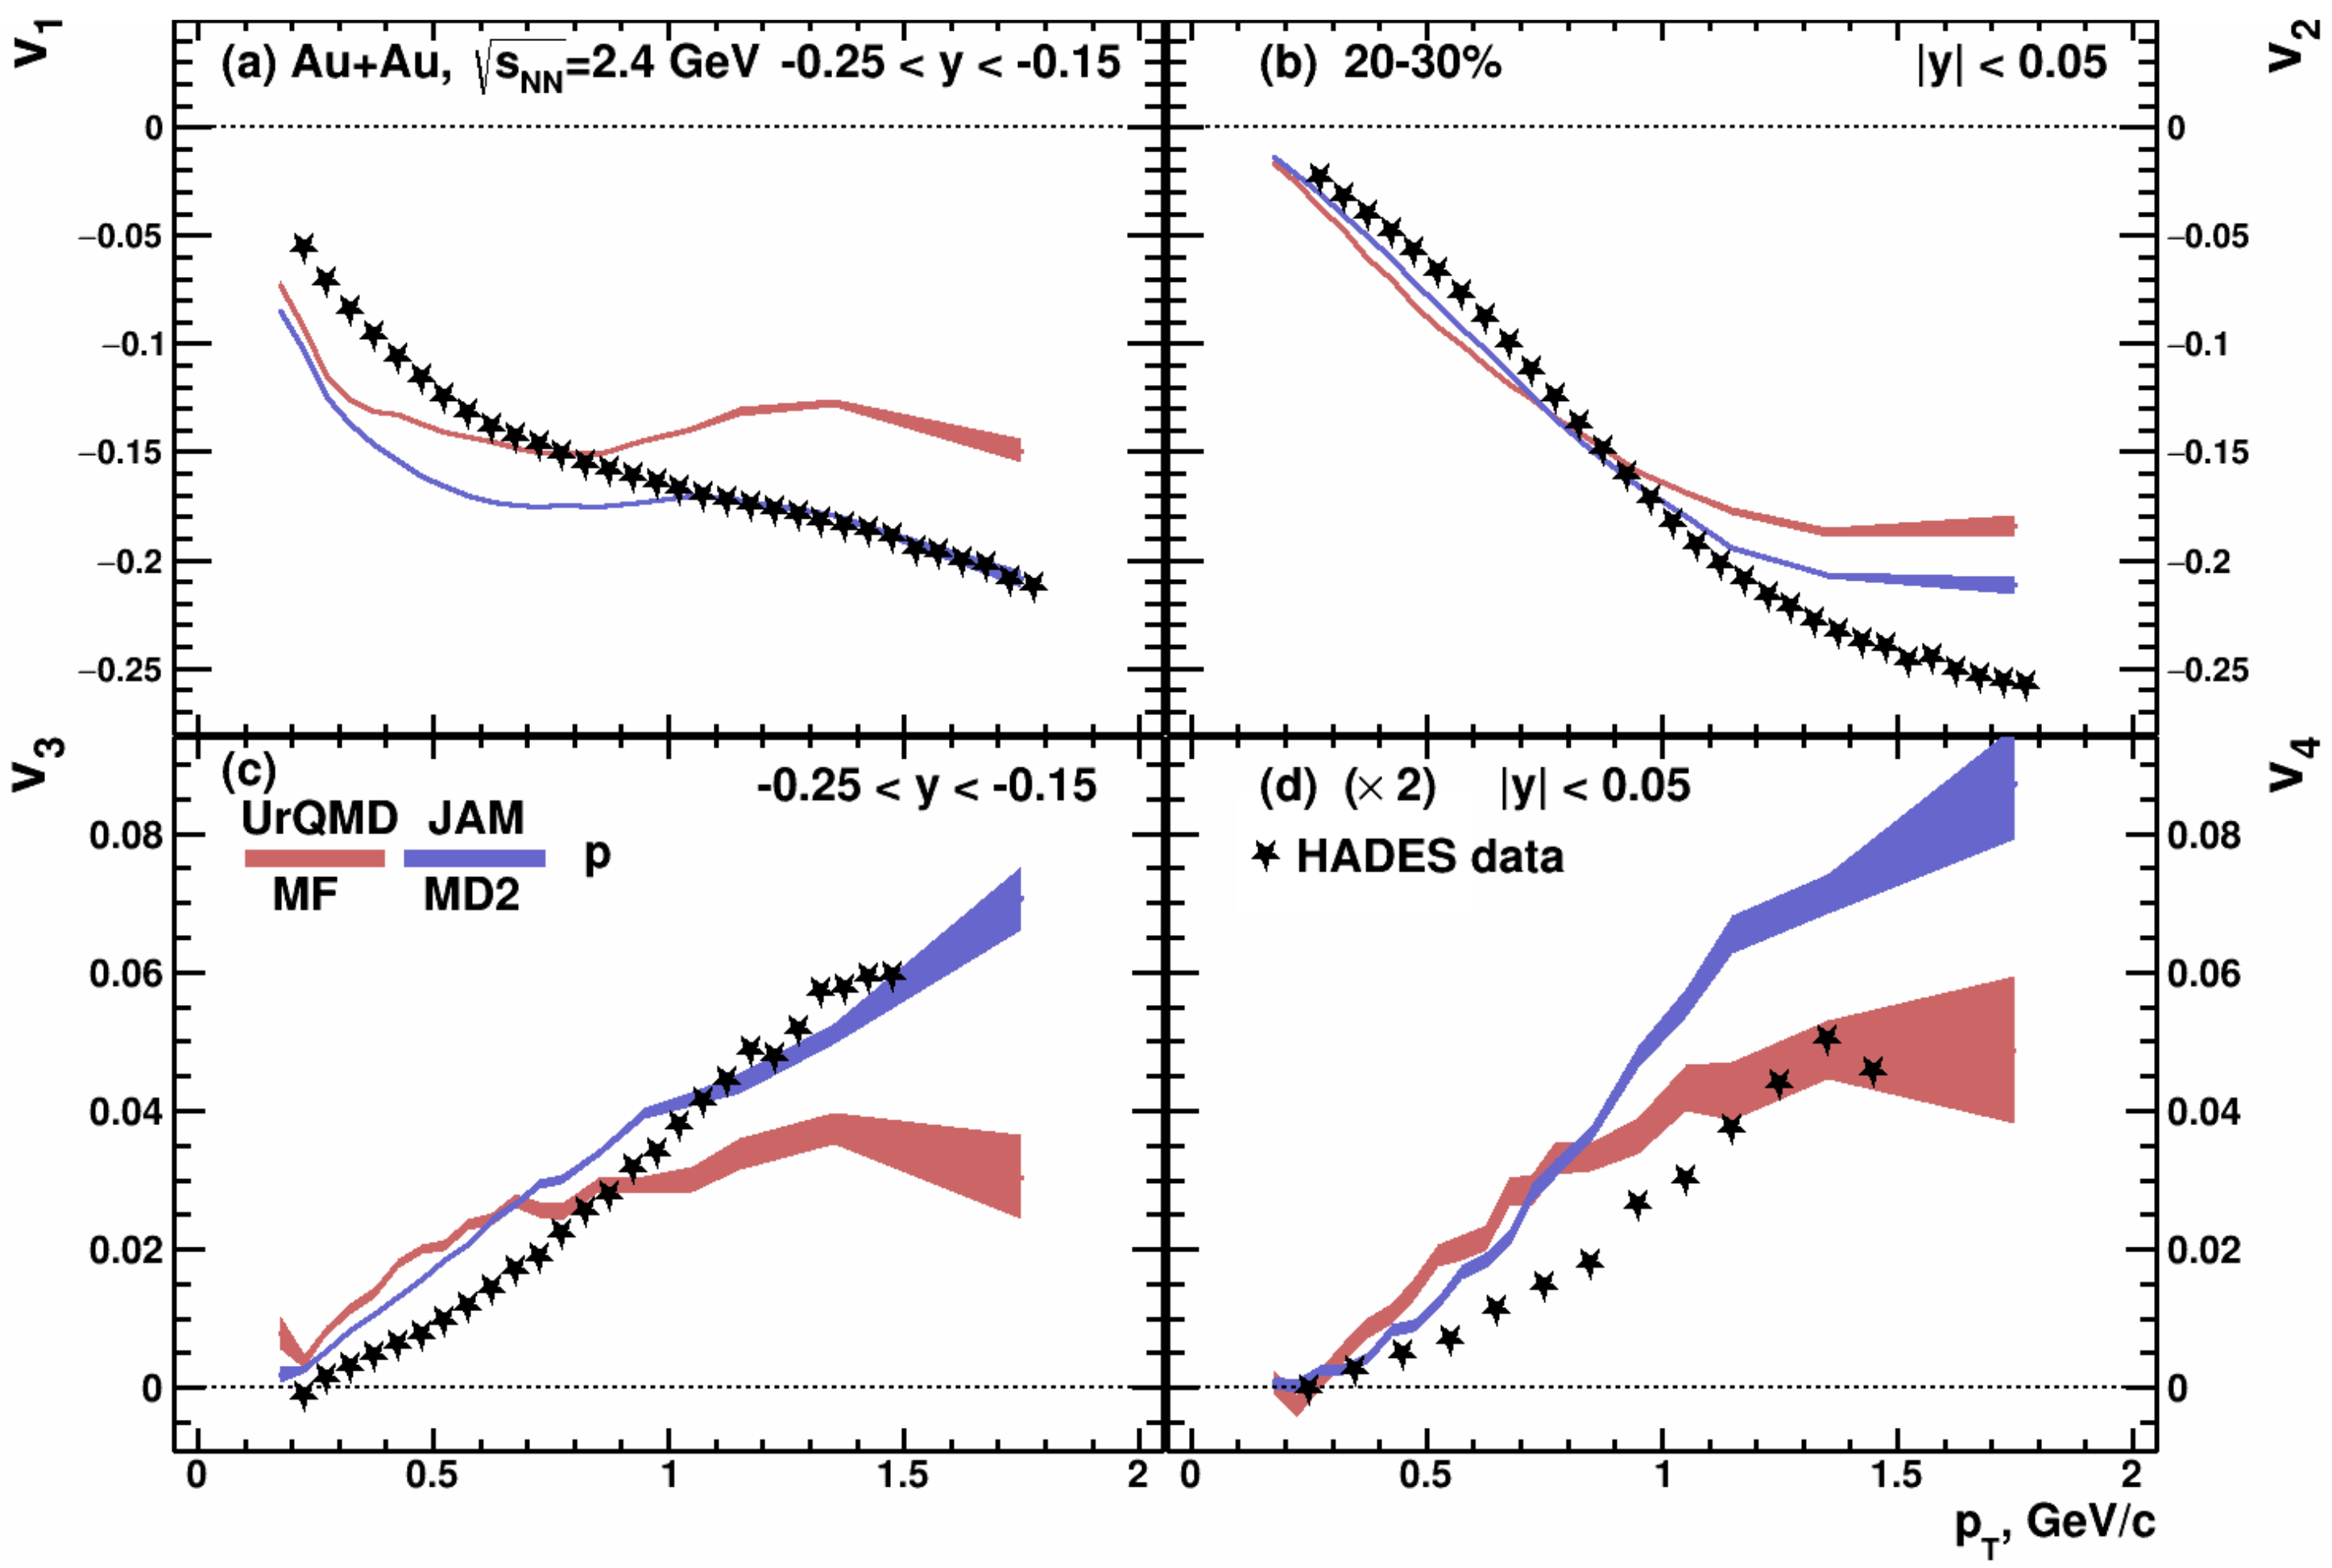
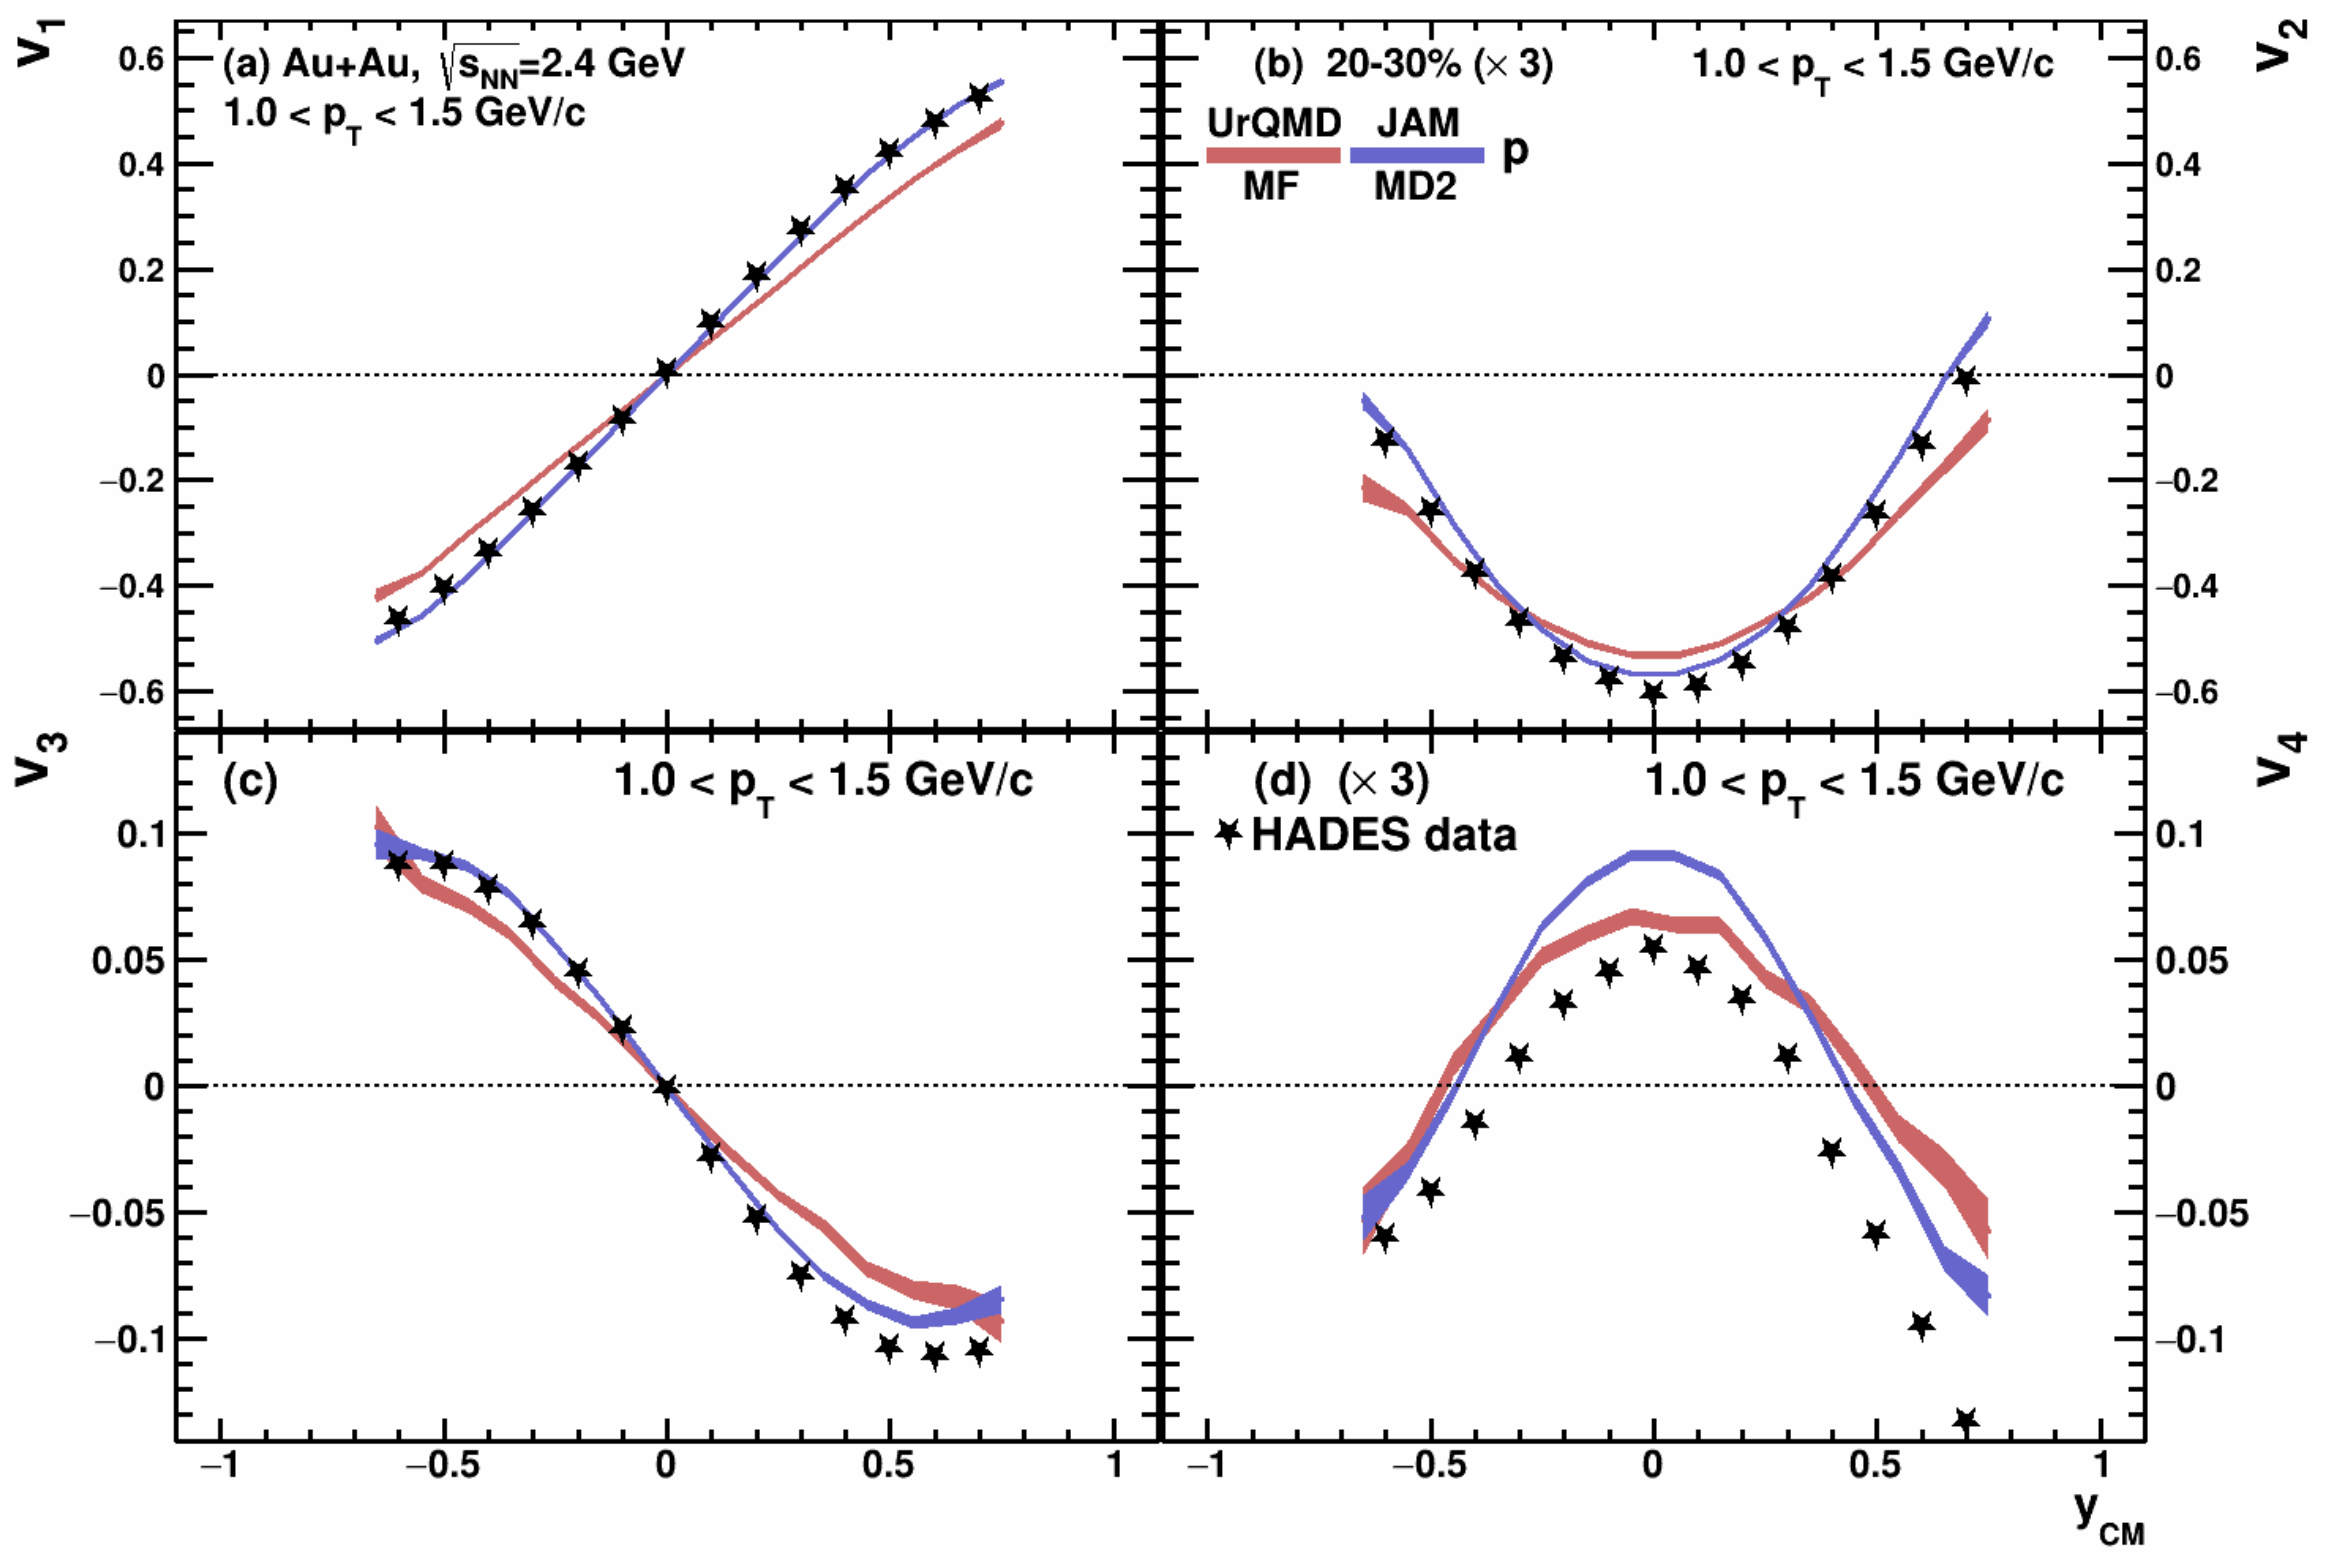
Recently, the HADES experiment at SIS-18 has reported the first detailed differential measurements of anisotropic flow coefficients , , and of protons in Au + Au collisions at = 2.4 GeV [17]. Figure 4 shows the dependence of anisotropic flow coefficients , , and of protons (from top to bottom panels) in the 20–30% central Au + Au collisions at GeV. The black closed symbols denote the published data from the HADES experiment [17]. The red, green and purple bands represent the results from the cascade mode of DCM-QGSM-SMM, JAM, and UrQMD models. All cascade models failed to describe the experimental data. The absence of a repulsive potential significantly reduces the and signals and results in essentially zero signals for the higher order ( and ) flow coefficients. The same conclusions can be drawn from the comparison with rapidity () dependence of anisotropic flow coefficients , , and of protons, see Figure 5. However, by including the mean-field potential, the JAM model can qualitatively reproduce the HADES data for and rapidity () dependence of anisotropic flow coefficients , , and of protons in the 20–30% central Au + Au collisions at GeV, see Figure 6 and Figure 7. JAM with a hard momentum dependent MD2 EOS provides the overall good reproduction of the and data points. JAM with a soft momentum dependent MD4 EOS is closer to and data. Figure 8 and Figure 9 provide the comparison between the HADES data and mean-field modes of UrQMD and JAM MD2 models with hard EOS. Again, both models roughly capture the overall magnitude and trend of the measured HADES data.
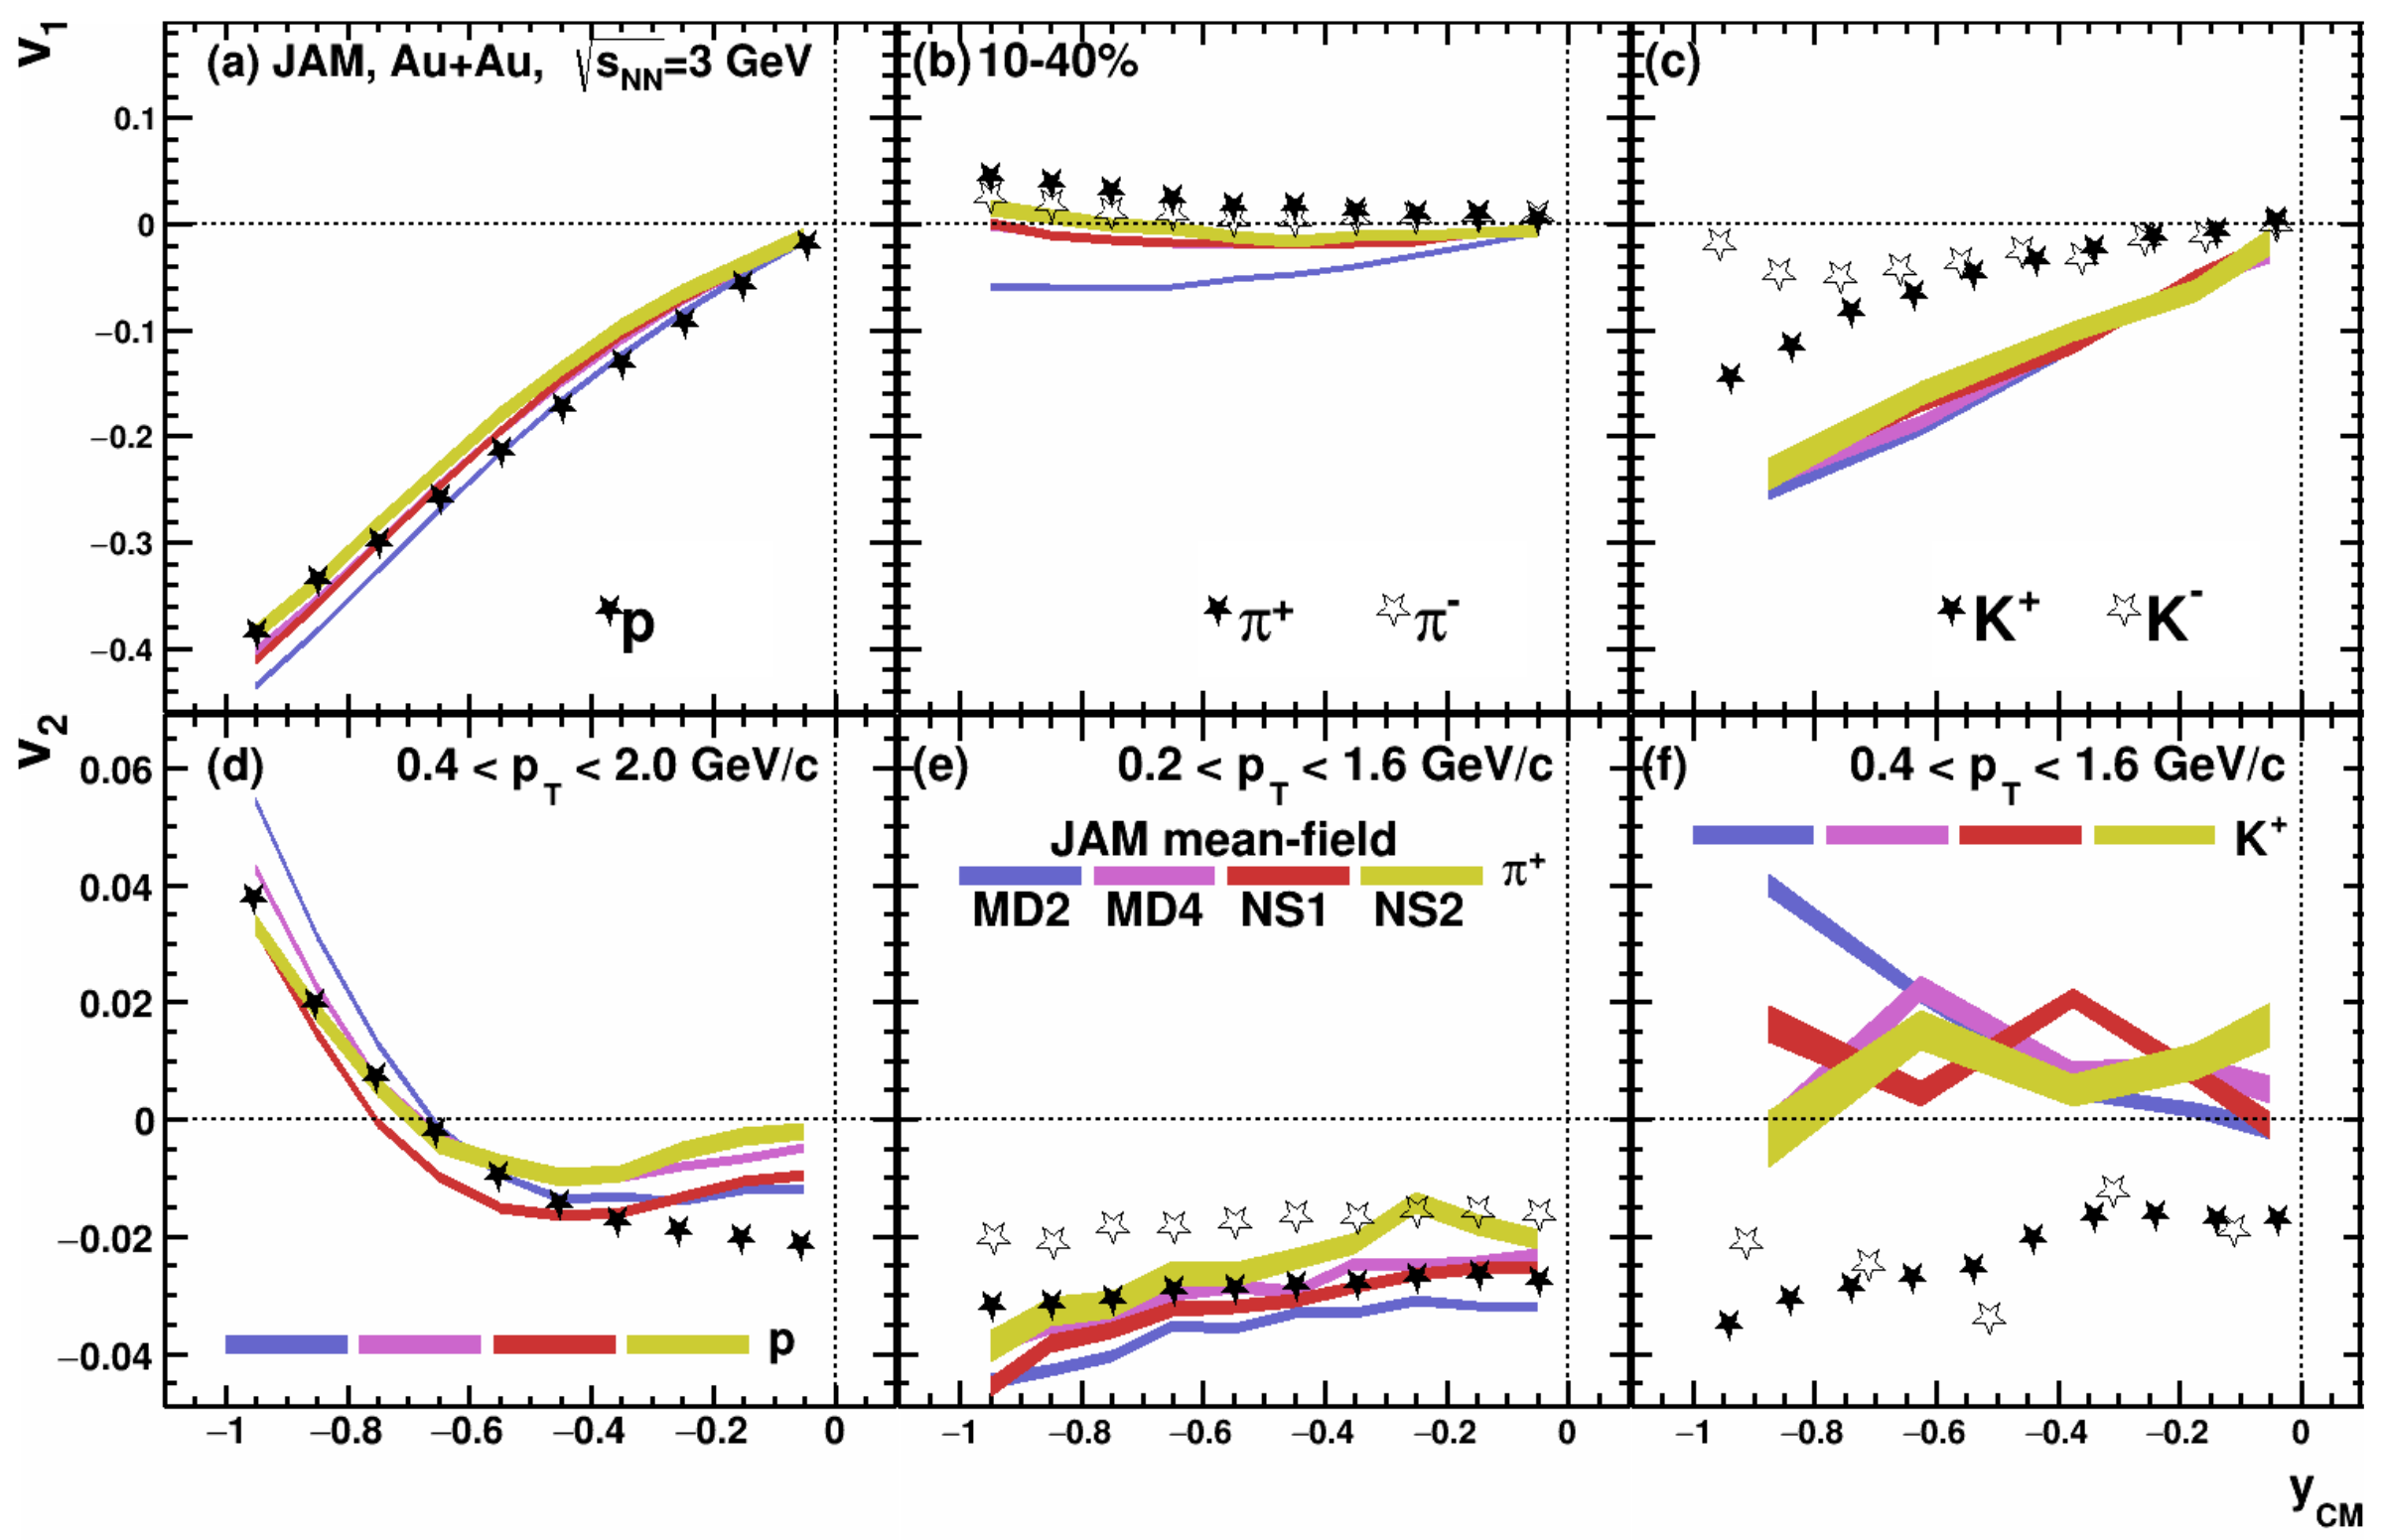
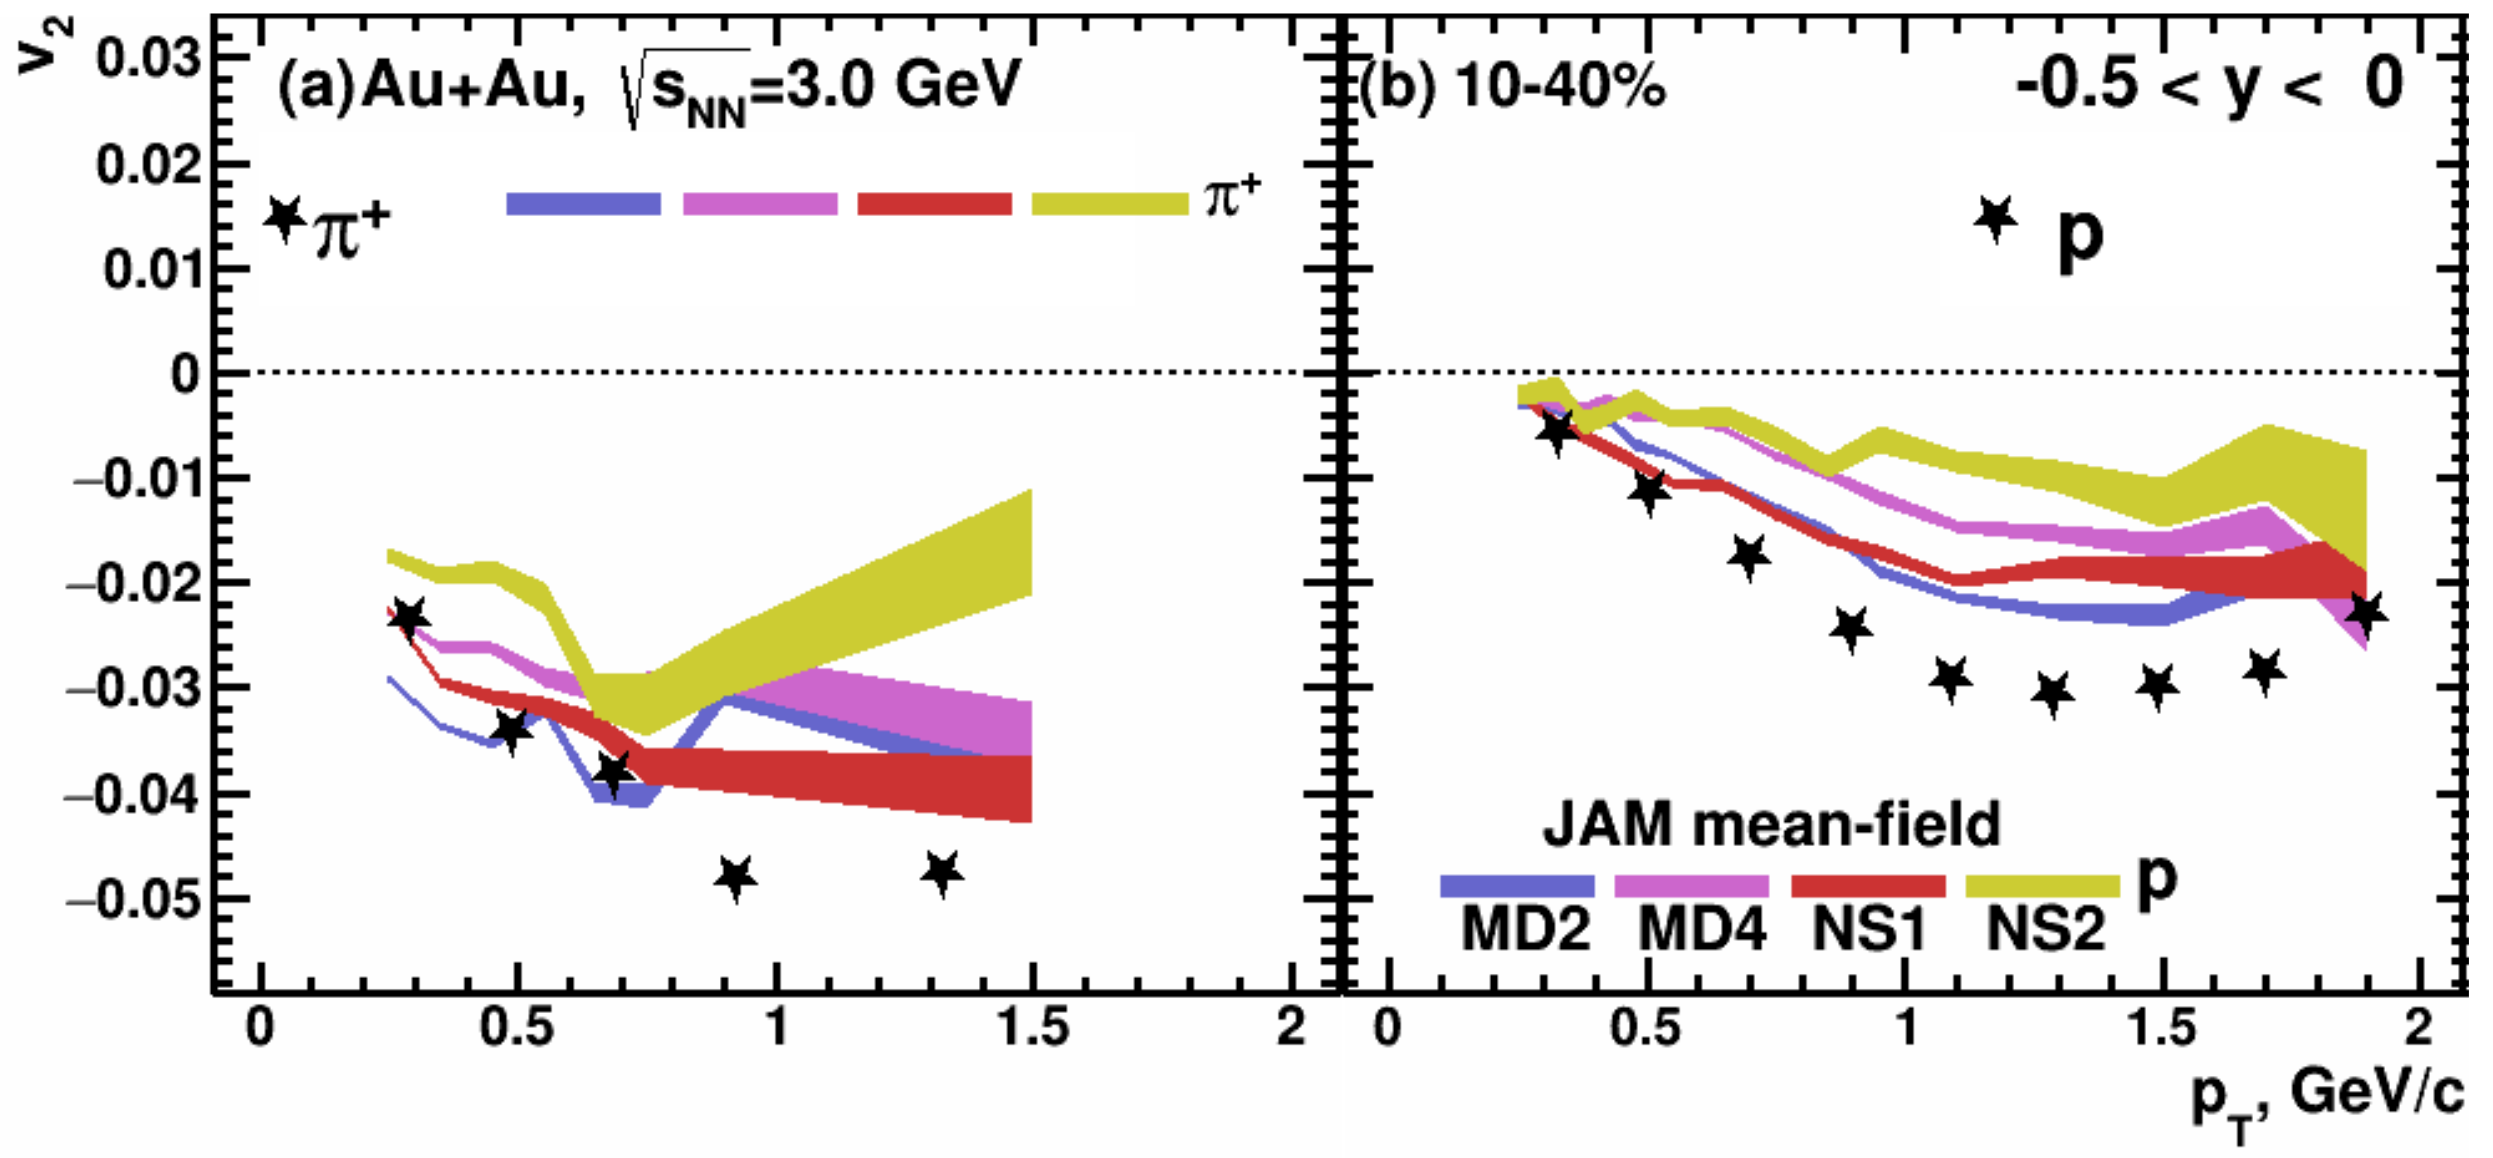
Recent and results from the STAR experiment were used to test the model calculations for Au + Au collisions at GeV [15]. Figure 10 shows the rapidity () dependence of (top panels) and (bottom panels) of proton (left panels), charged pions (middle panels) and charged kaons (right panels) in 10-40% central Au + Au collisions at GeV. The symbols denote the published data from the STAR experiment [15]. The blue (MD2), purple (MD4), red (NS1) and yellow (NS2) bands represent the results from the mean-field mode of the JAM model with different EOS, as indicated. Again, with the mean-field, the JAM model qualitatively reproduces the rapidity dependence of and for protons and pions. However, the JAM model fails to reproduce the rapidity dependence of and for kaons. Figure 11 shows the dependence of elliptic flow of pions (left panel) and protons (right panel) in 10–40% central Au + Au collisions at GeV. Here, the deviations between the JAM model and STAR results are a bit larger.
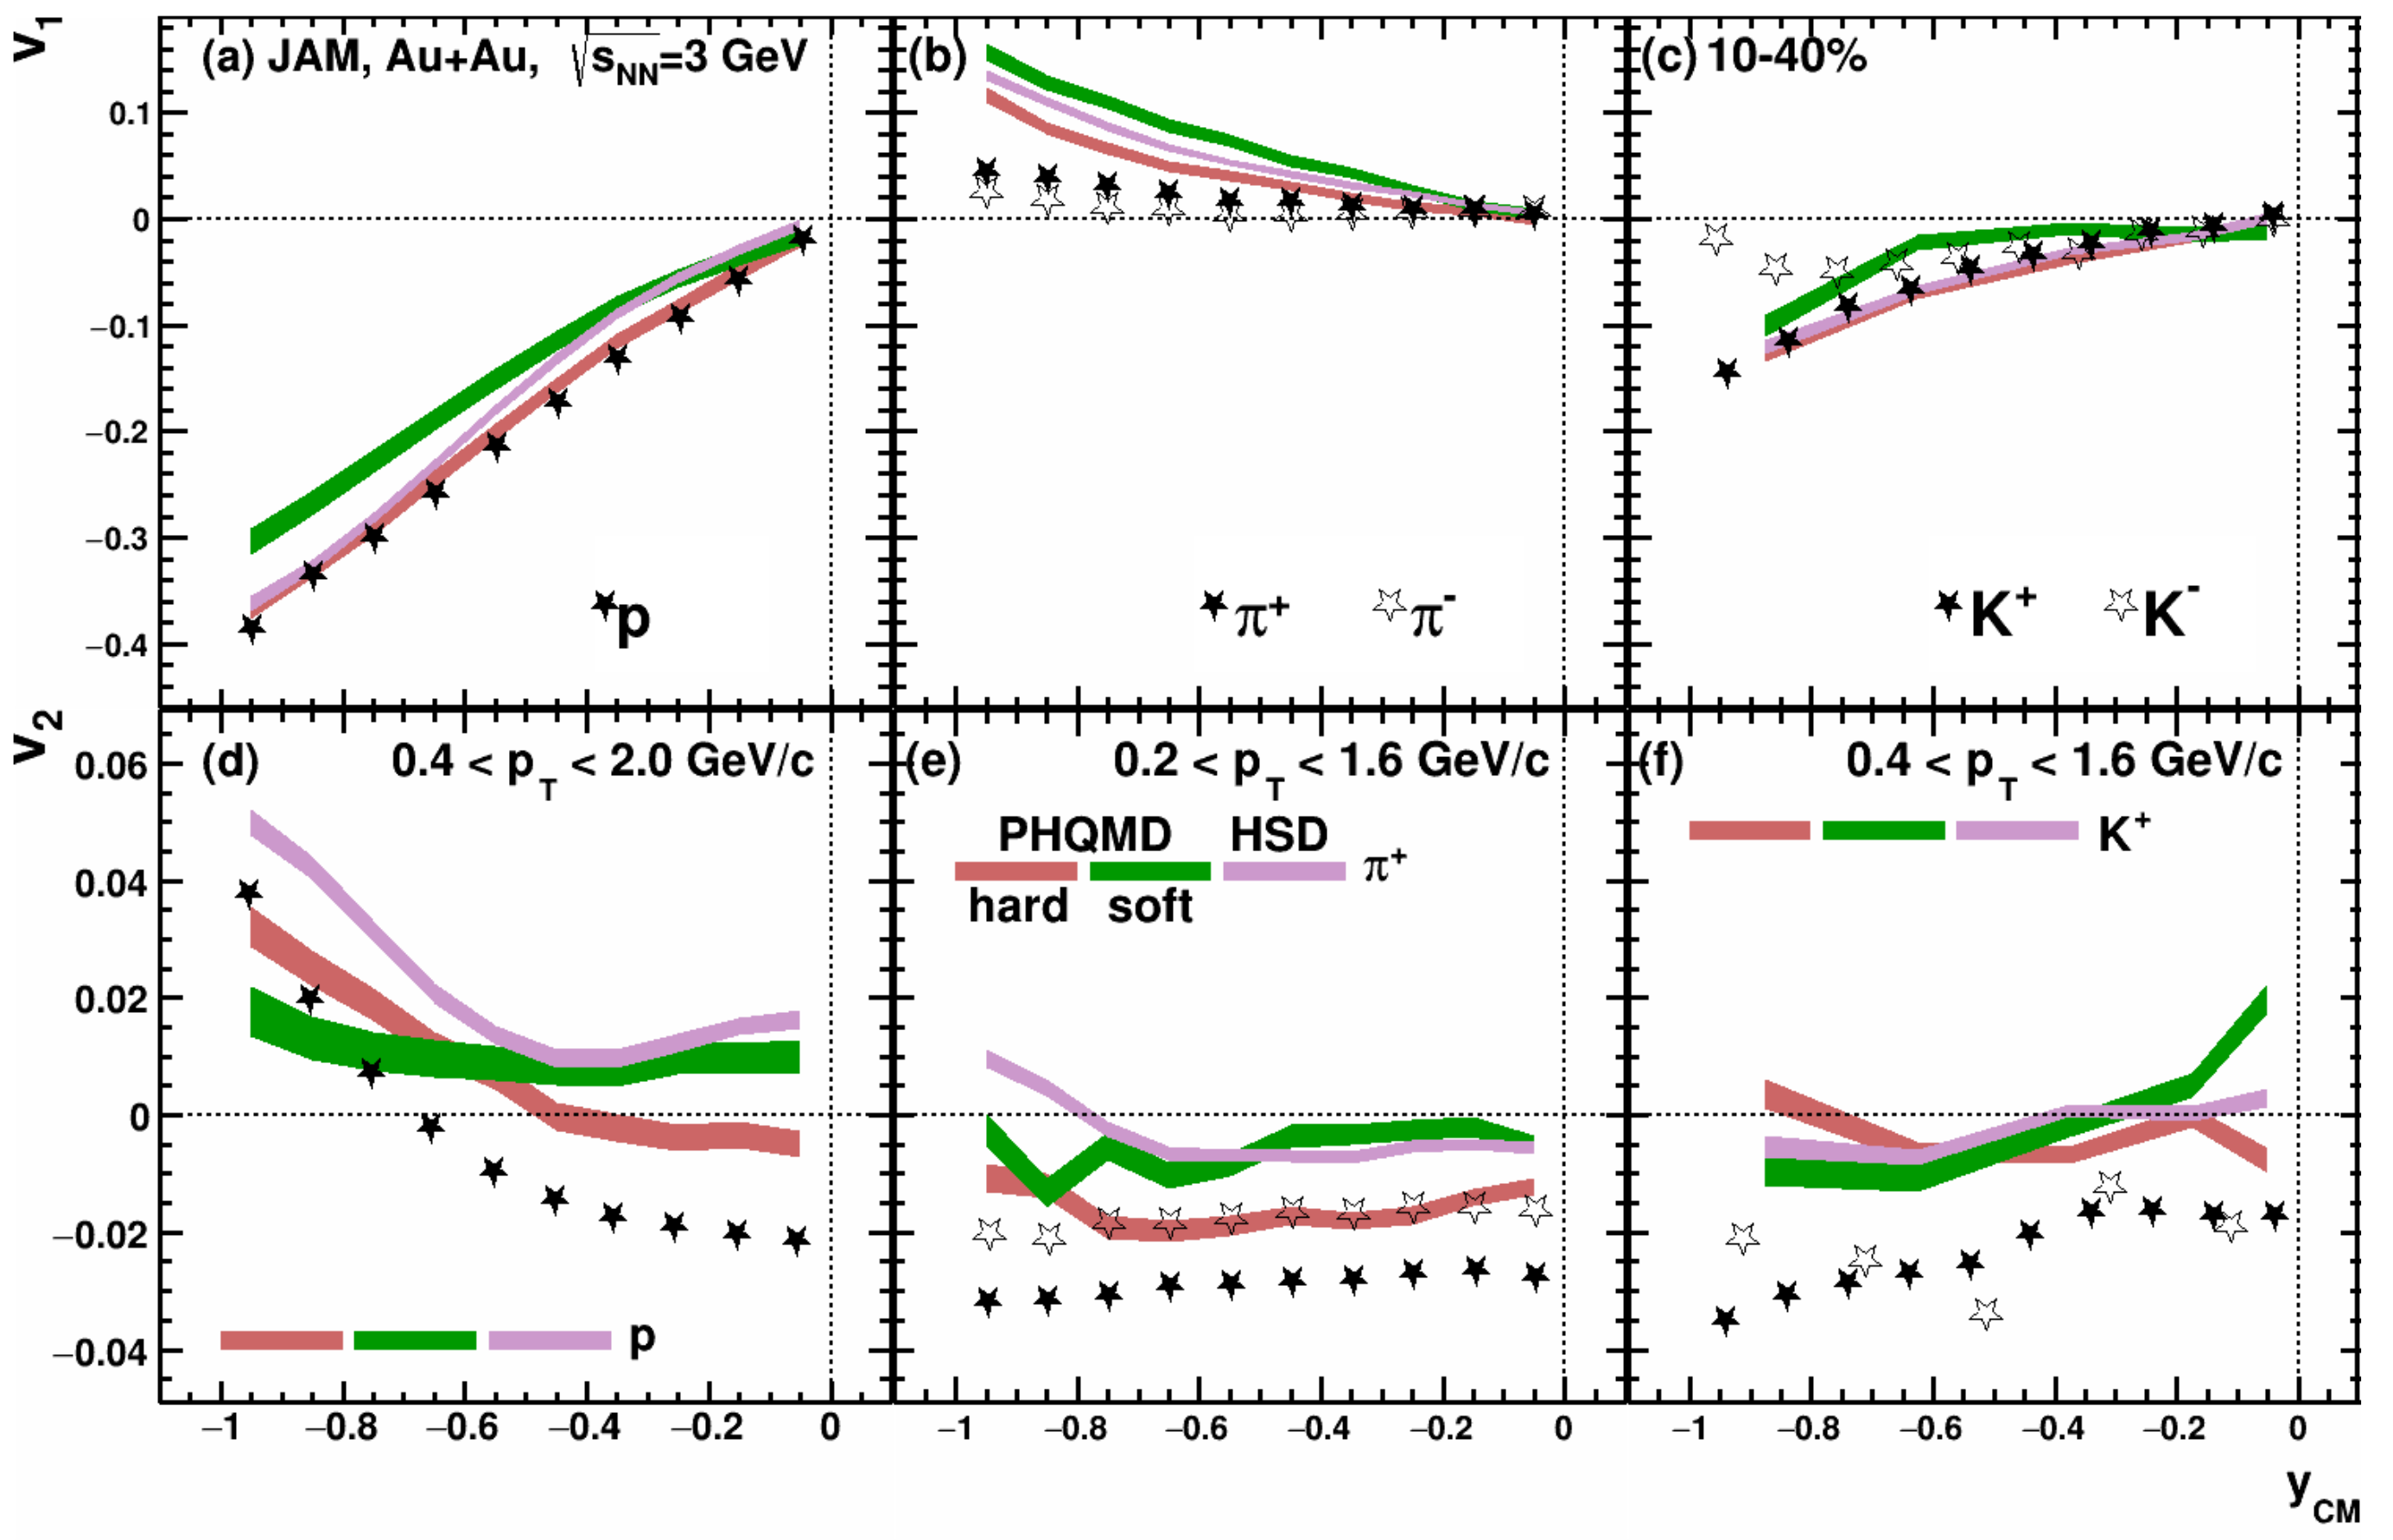
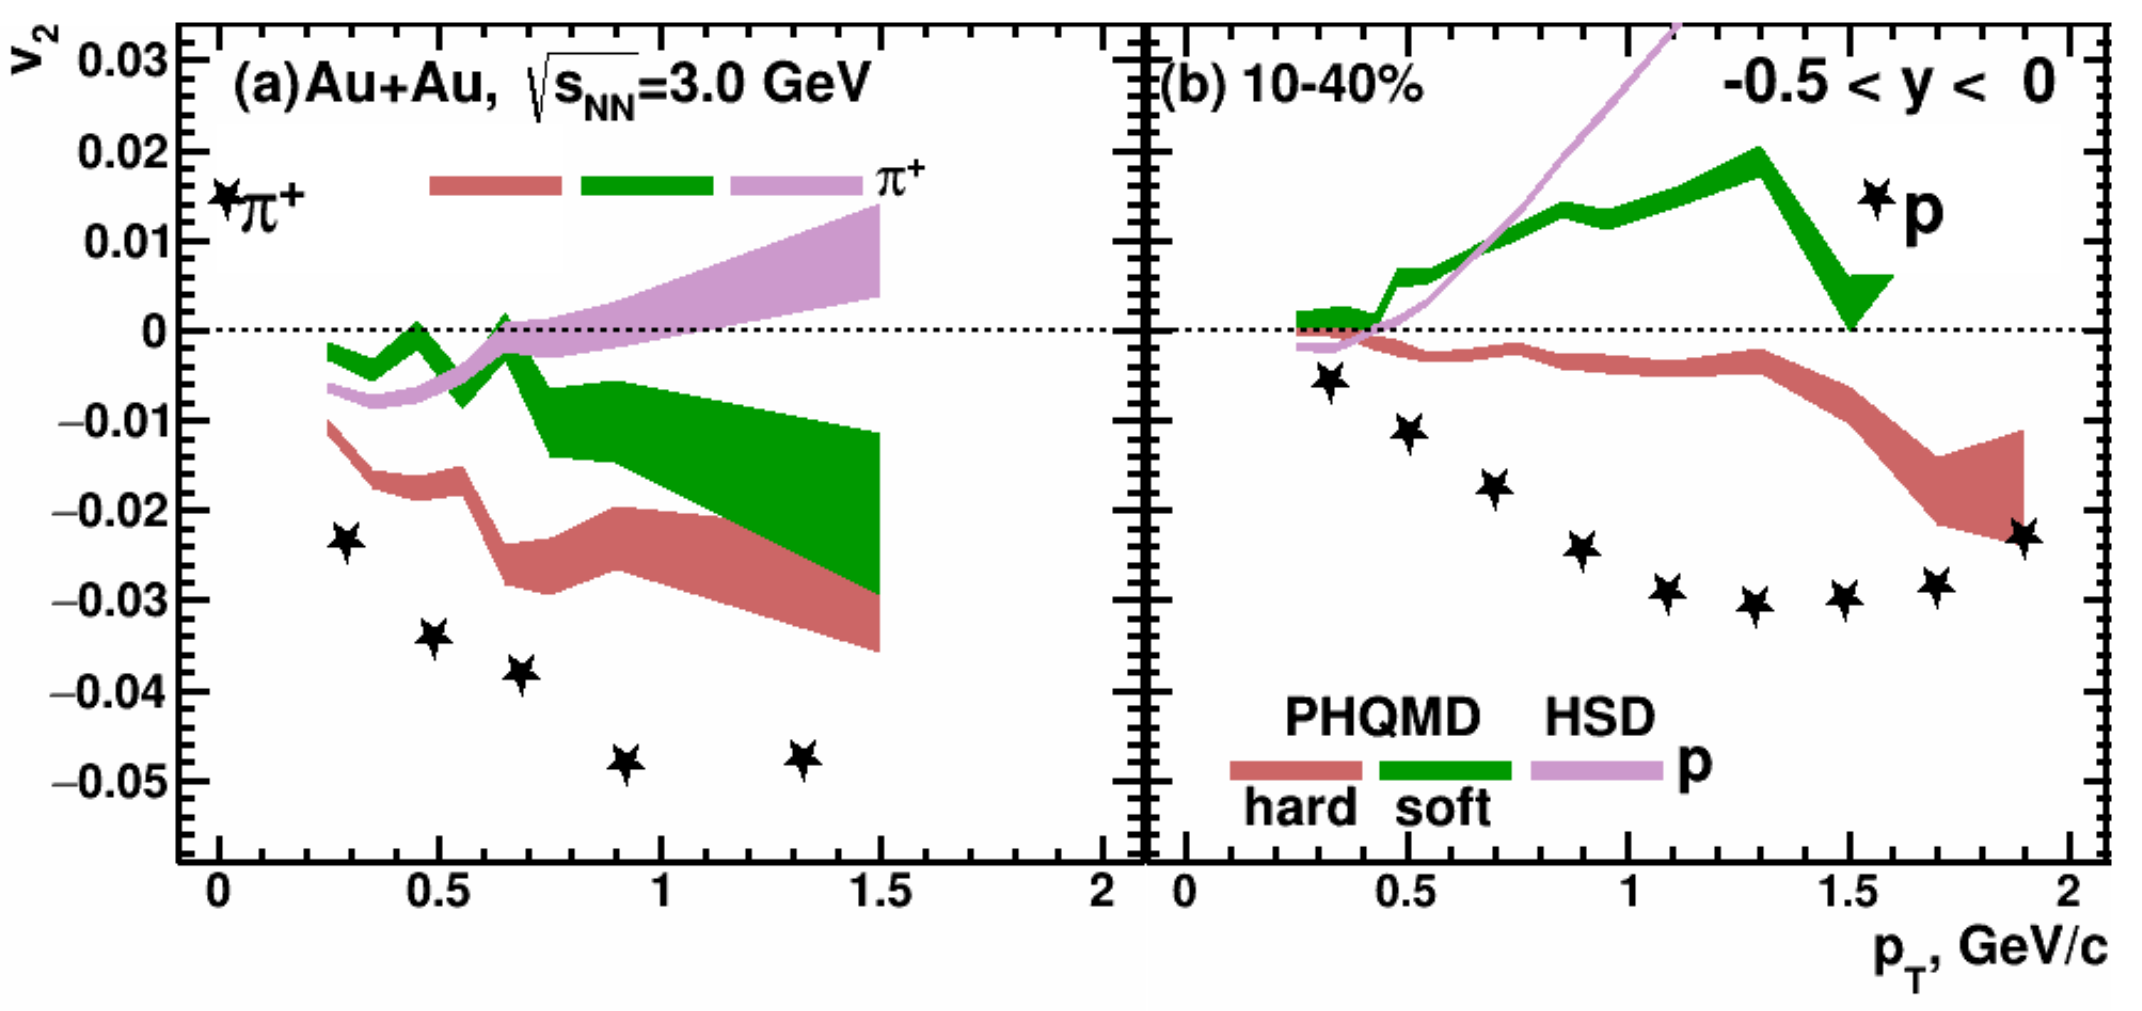
Figure 12 and Figure 13 show the comparison between the PHQMD model calculations and the STAR results. Again, the symbols denote the published data from the STAR experiment [15]. The red and green bands represent the results from PHQMD model with hard ( = 380 MeV) and soft ( = 200 MeV) EOS, respectively. The purple bands represent the results from the Hadron-String-Dynamics (HSD) model [33]. PHQMD is close to the and data for kaons, but deviates for protons and pions. Considering only scattering and neglecting the kaon-nuclear potential does not allow the models to describe the kaon flow data [34] The detailed differential measurements from the STAR experiment may help to constrain the kaon–nuclear potential.
One can conclude that the general features of the data on the differential flow of protons in Au + Au collisions at GeV [17] and GeV [15] are qualitatively captured by the mean-field mode of JAM and UrQMD transport models.
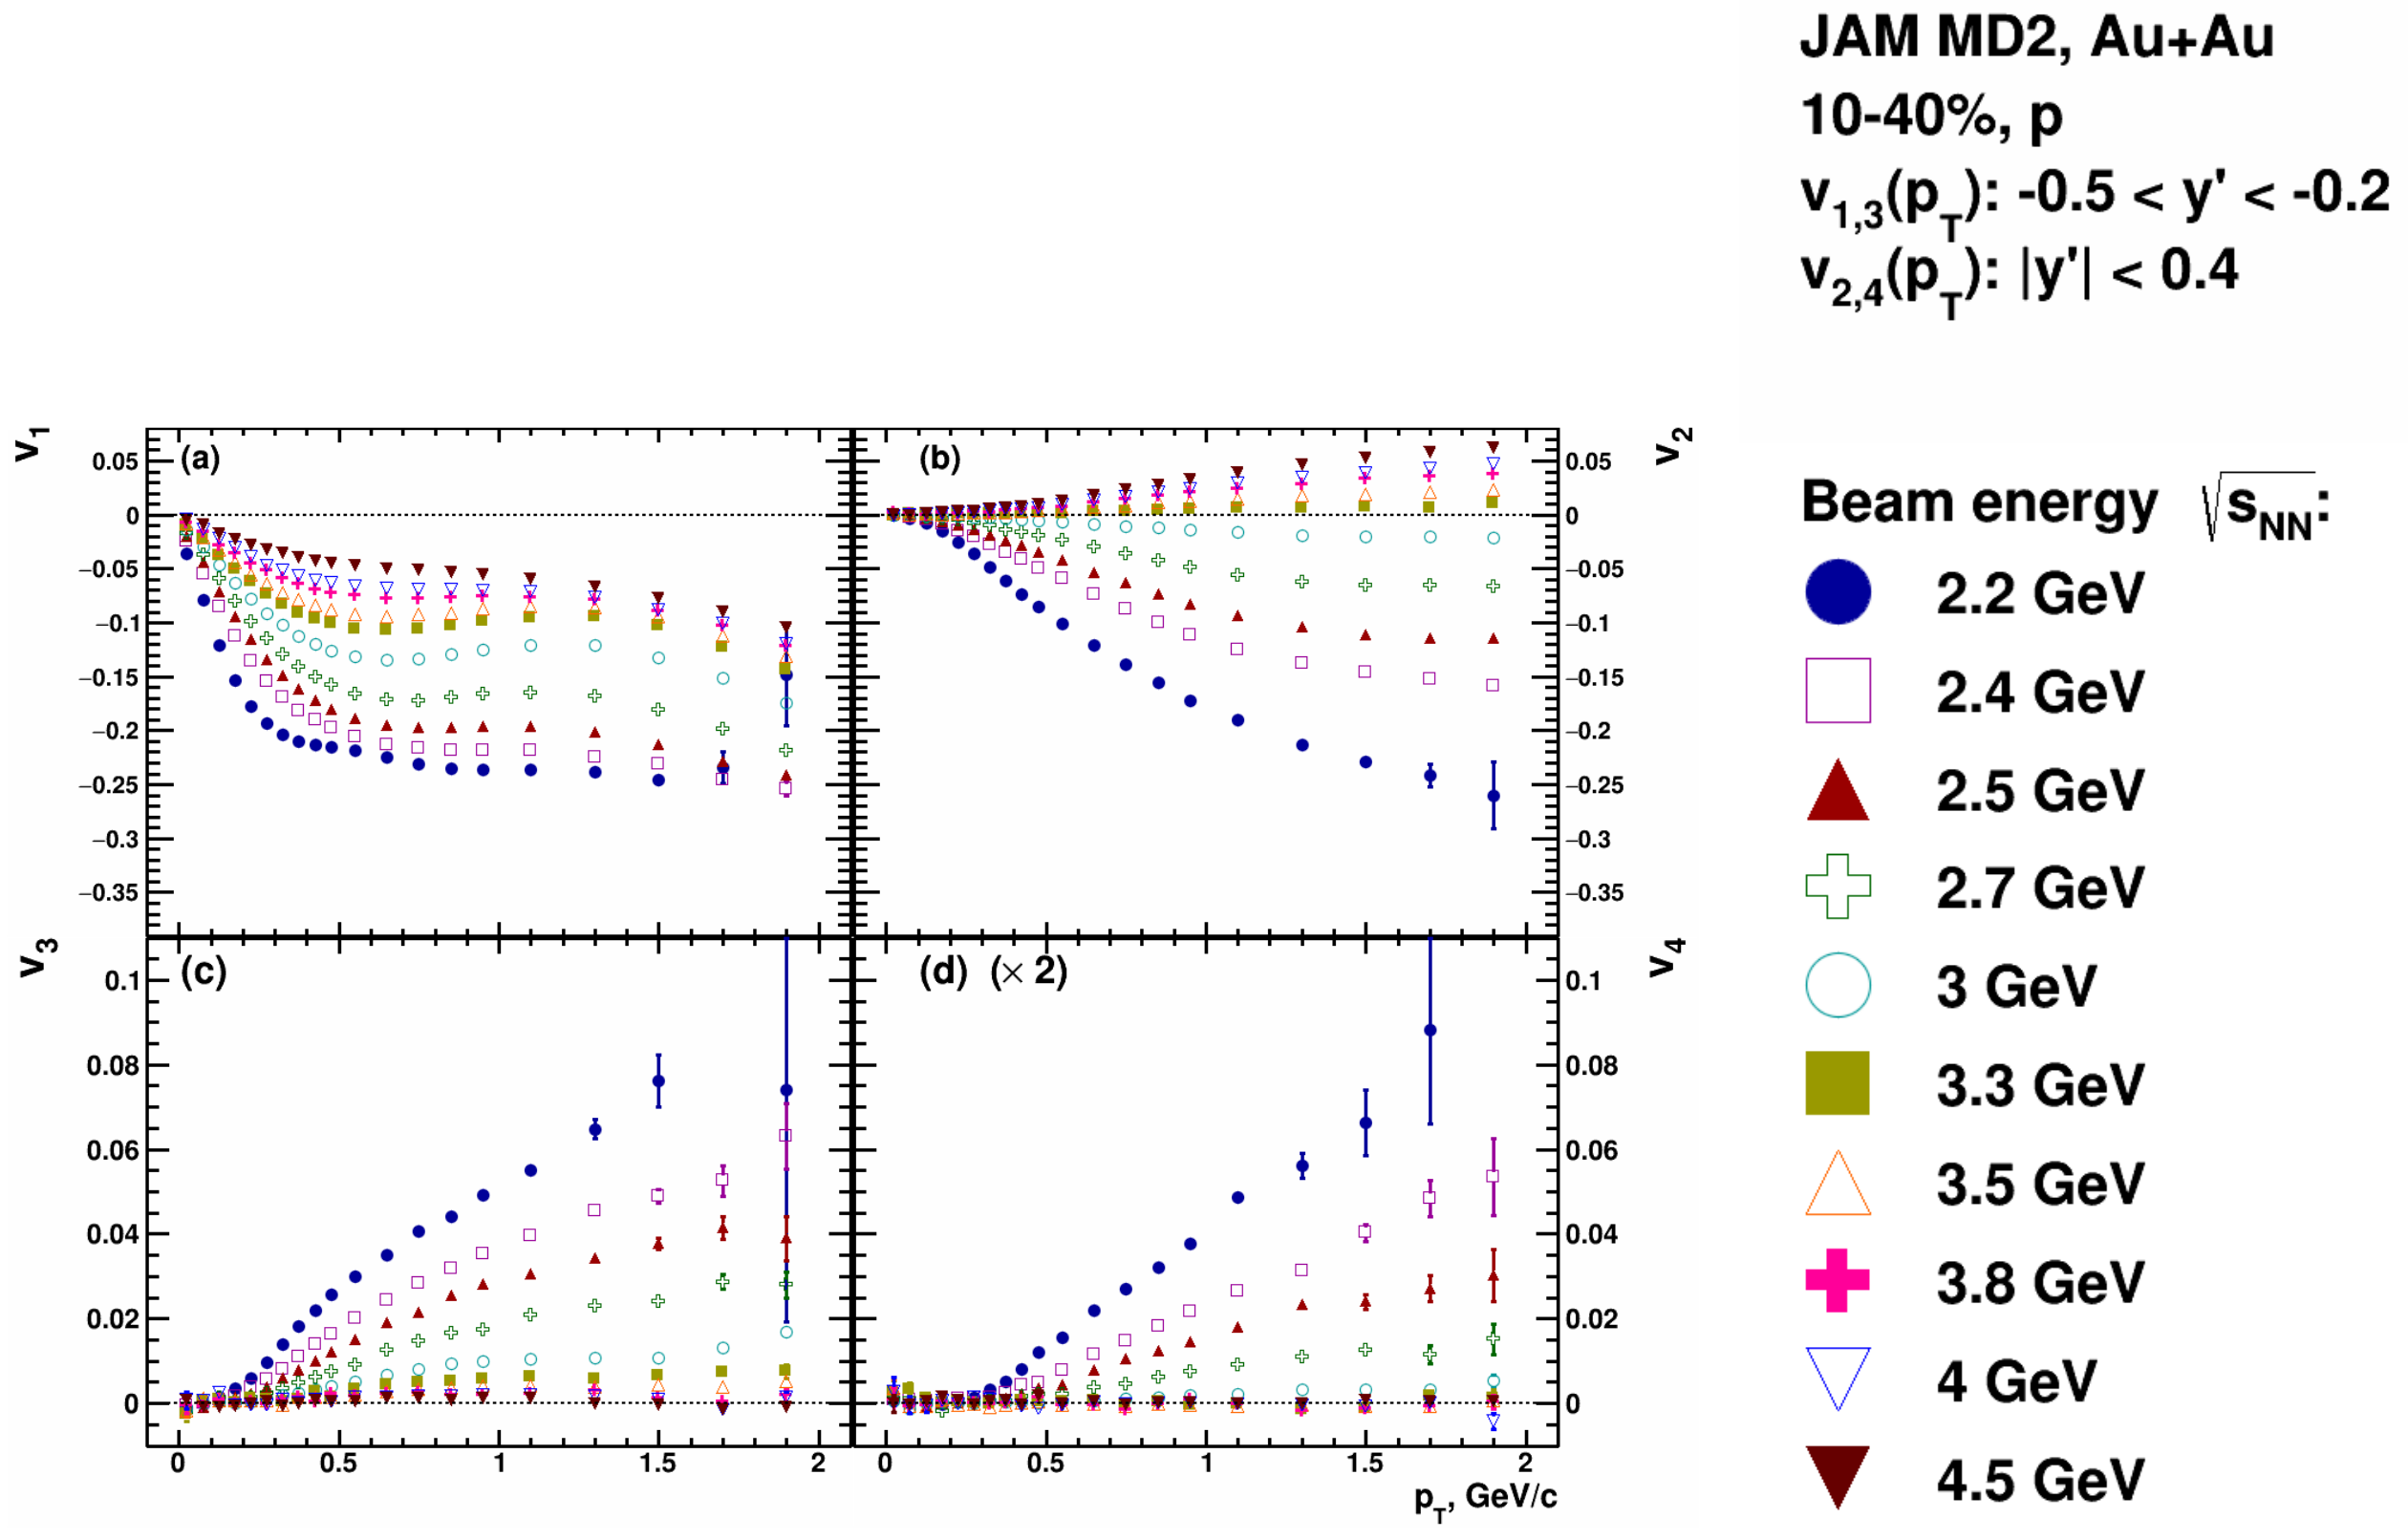
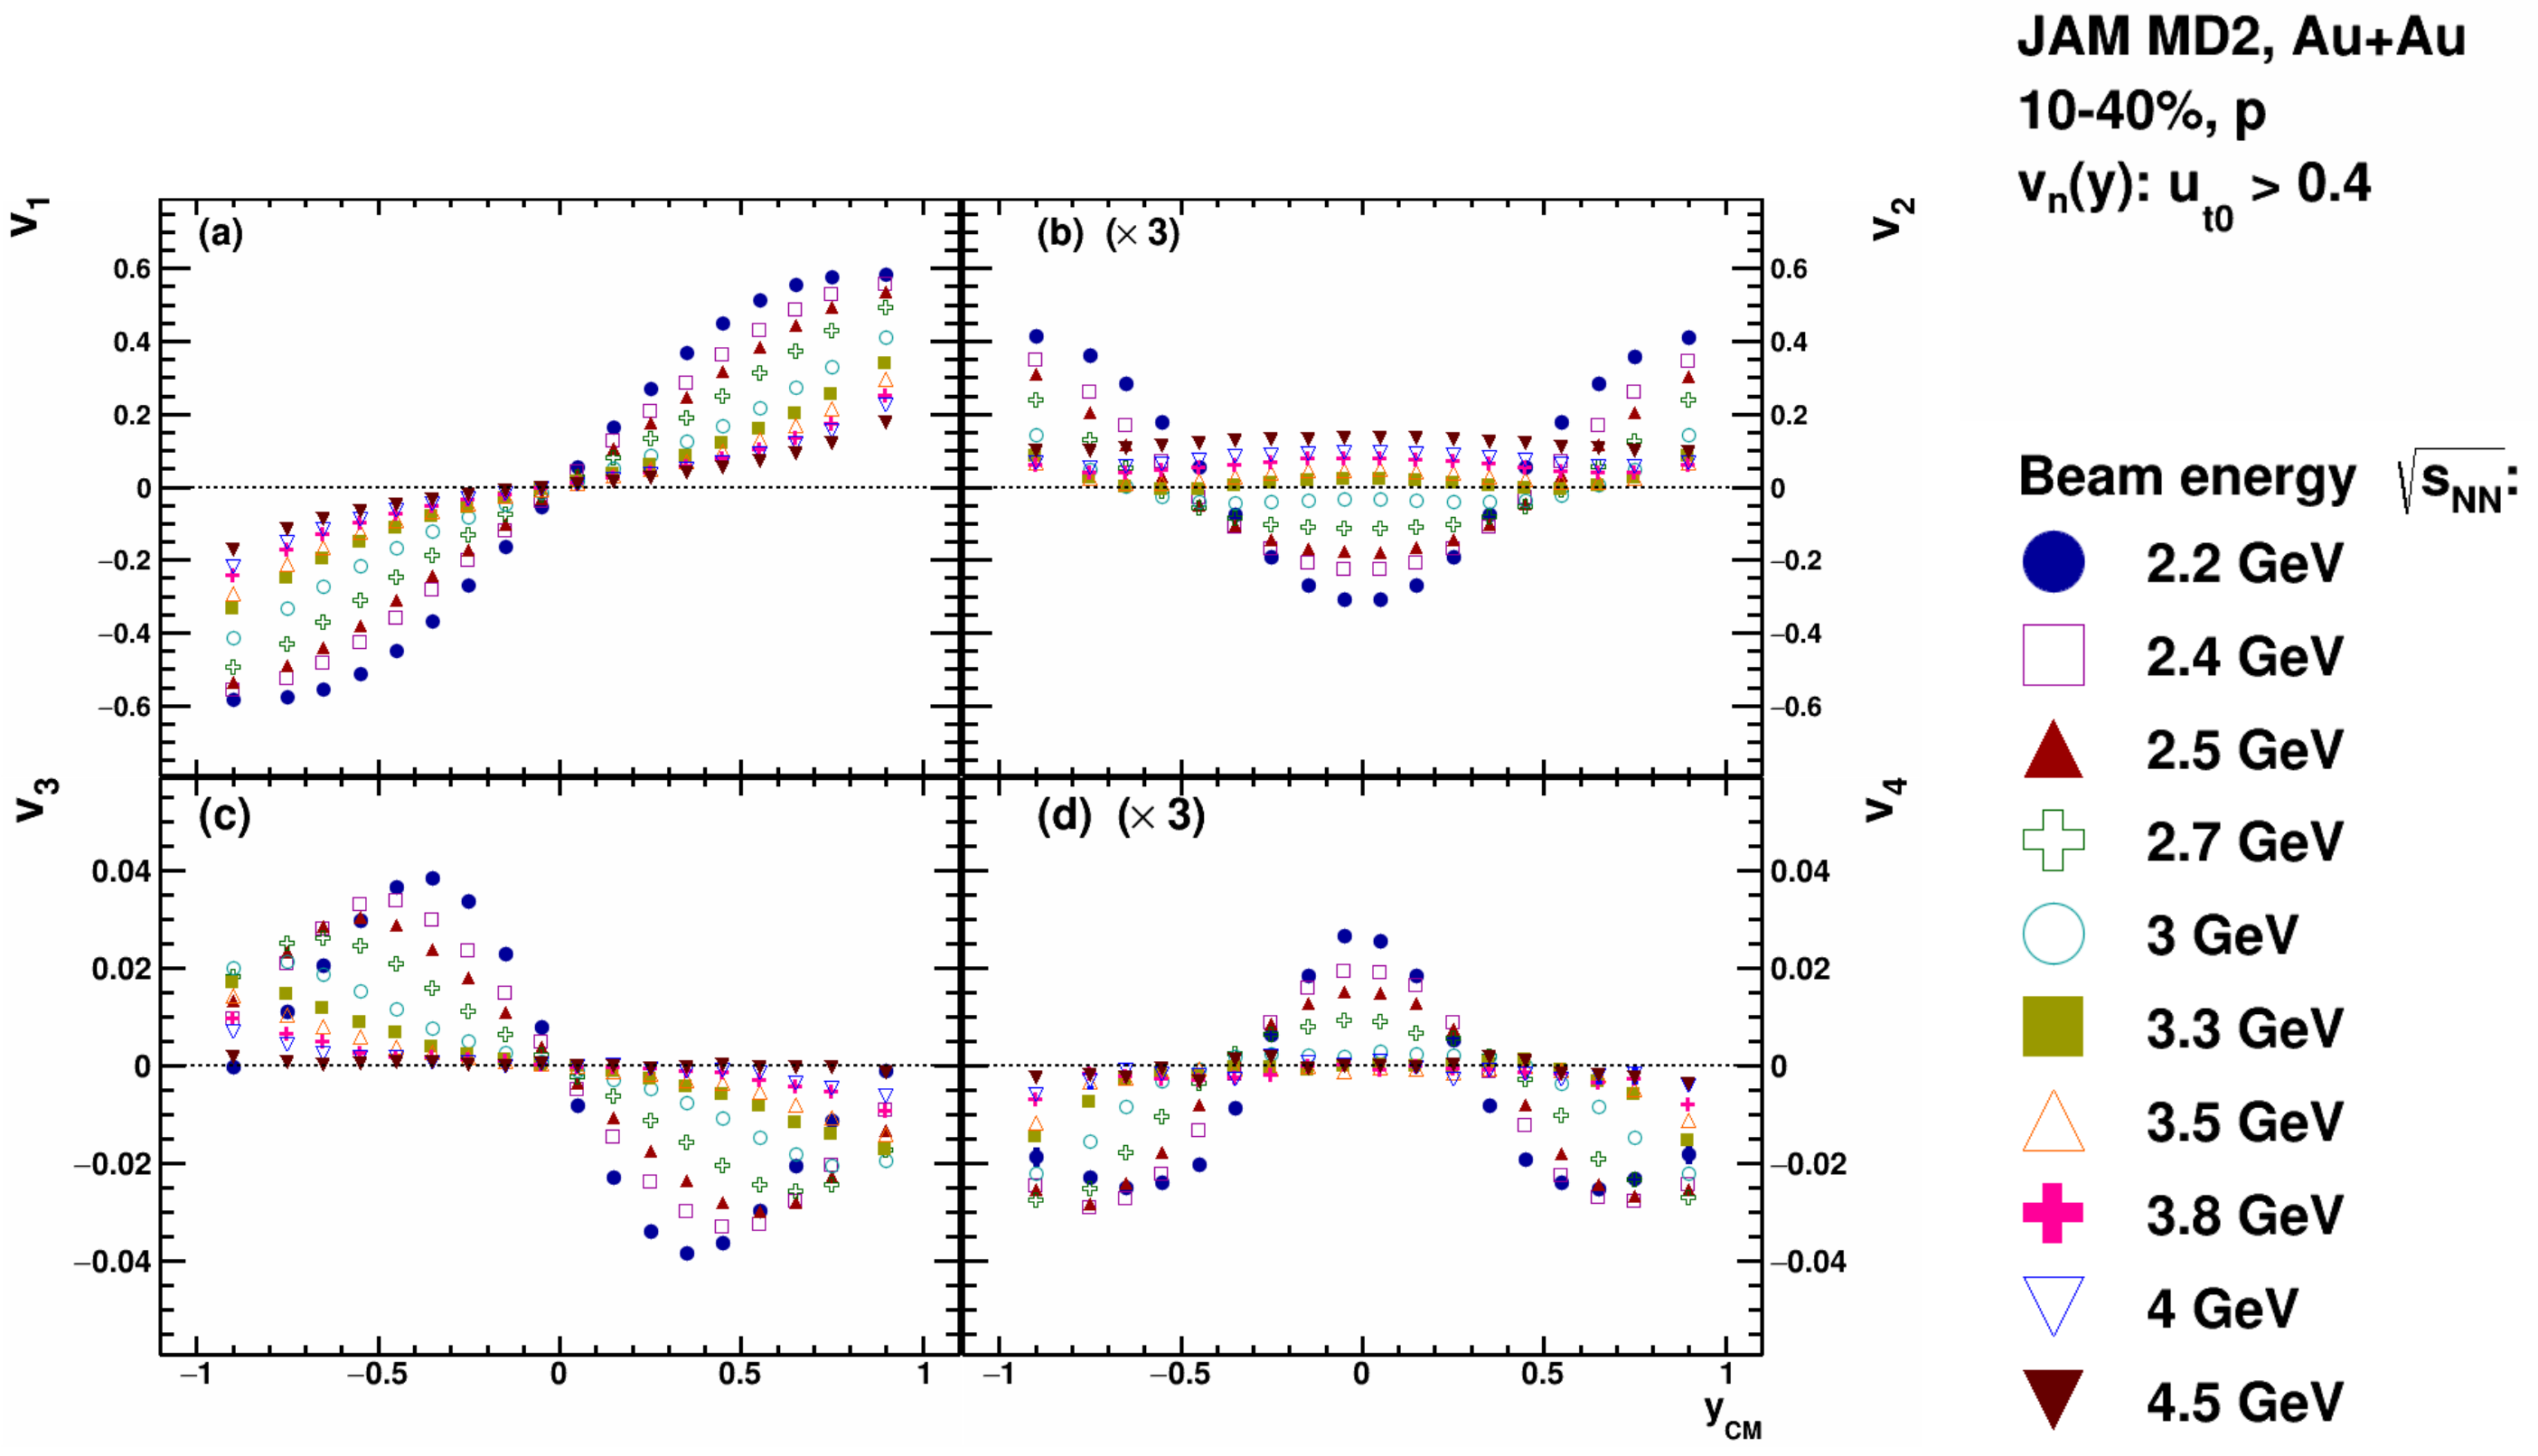
Now our purpose is to discuss the energy dependence of anisotropic flow coefficients , , and of protons in Au + Au collisions at 2.2–4.5 GeV. The results were obtained using the JAM model with hard momentum dependent mean-field MD2 ( = 380 MeV) EOS. Figure 14 shows the dependence of anisotropic flow coefficients , , and of protons (from top to bottom panels) in the 10–40% central Au + Au collisions at GeV. All coefficients have a strong dependence. All proton values decrease with increasing the collision energy. The passage time decreases with the increasing collision energy. This will reduce the shadowing effects by the spectator matter [12,14,18]. Figure 14 shows that of protons at midrapidity 0.2 transits from out-of-plane () to in-plane () in the collision energy around GeV. This is in a good agreement with the results of the E895 experiment at AGS [12,14]. The model predicts that the higher order ( and ) flow coefficients will be close to zero at GeV. One can observe the similar trends in the rapidity dependence () dependence of anisotropic flow coefficients , , and of protons; see Figure 15.
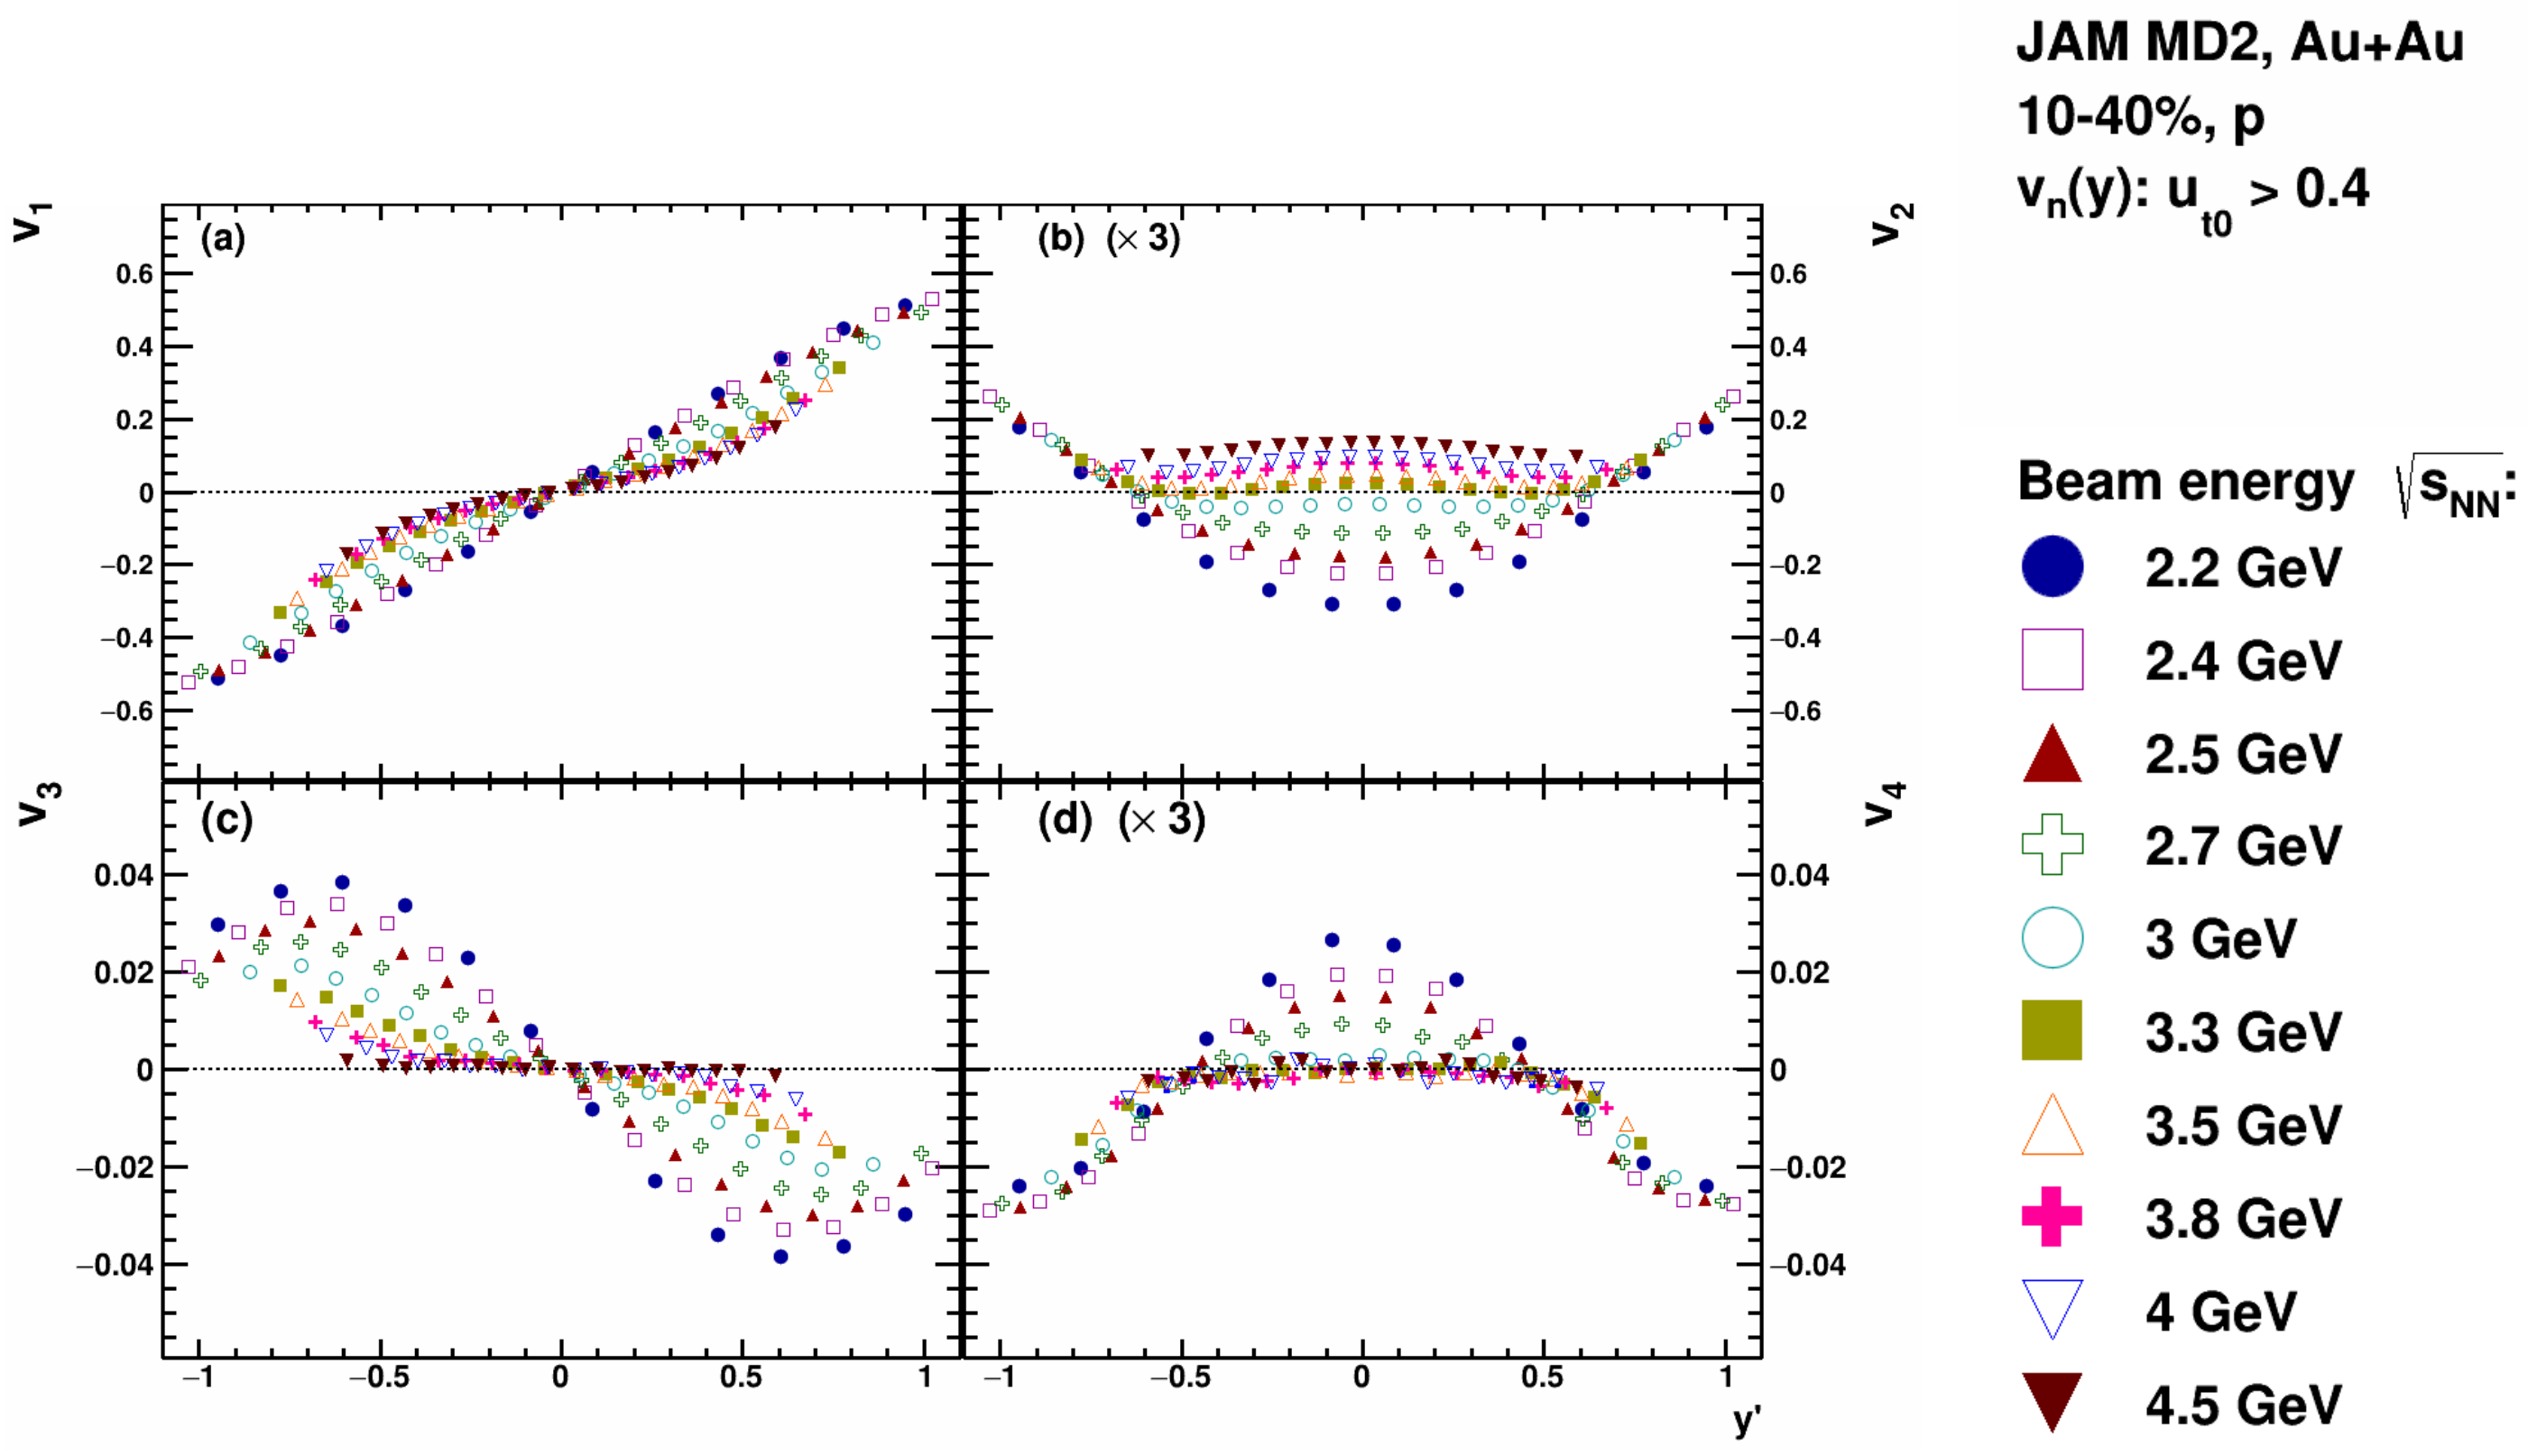
The rapidity dependence of anisotropic flow coefficients , , and of protons for different energies becomes less complicated if one uses the scaled rapidity , since for the colliding beams one then always has 1 in the center-of-mass frame. The passage time can be estimated as , where R is the radius of the nucleus. The scaled rapidity () dependence of anisotropic flow coefficients may reflect the partial scaling of with in this energy range, see Figure 16.
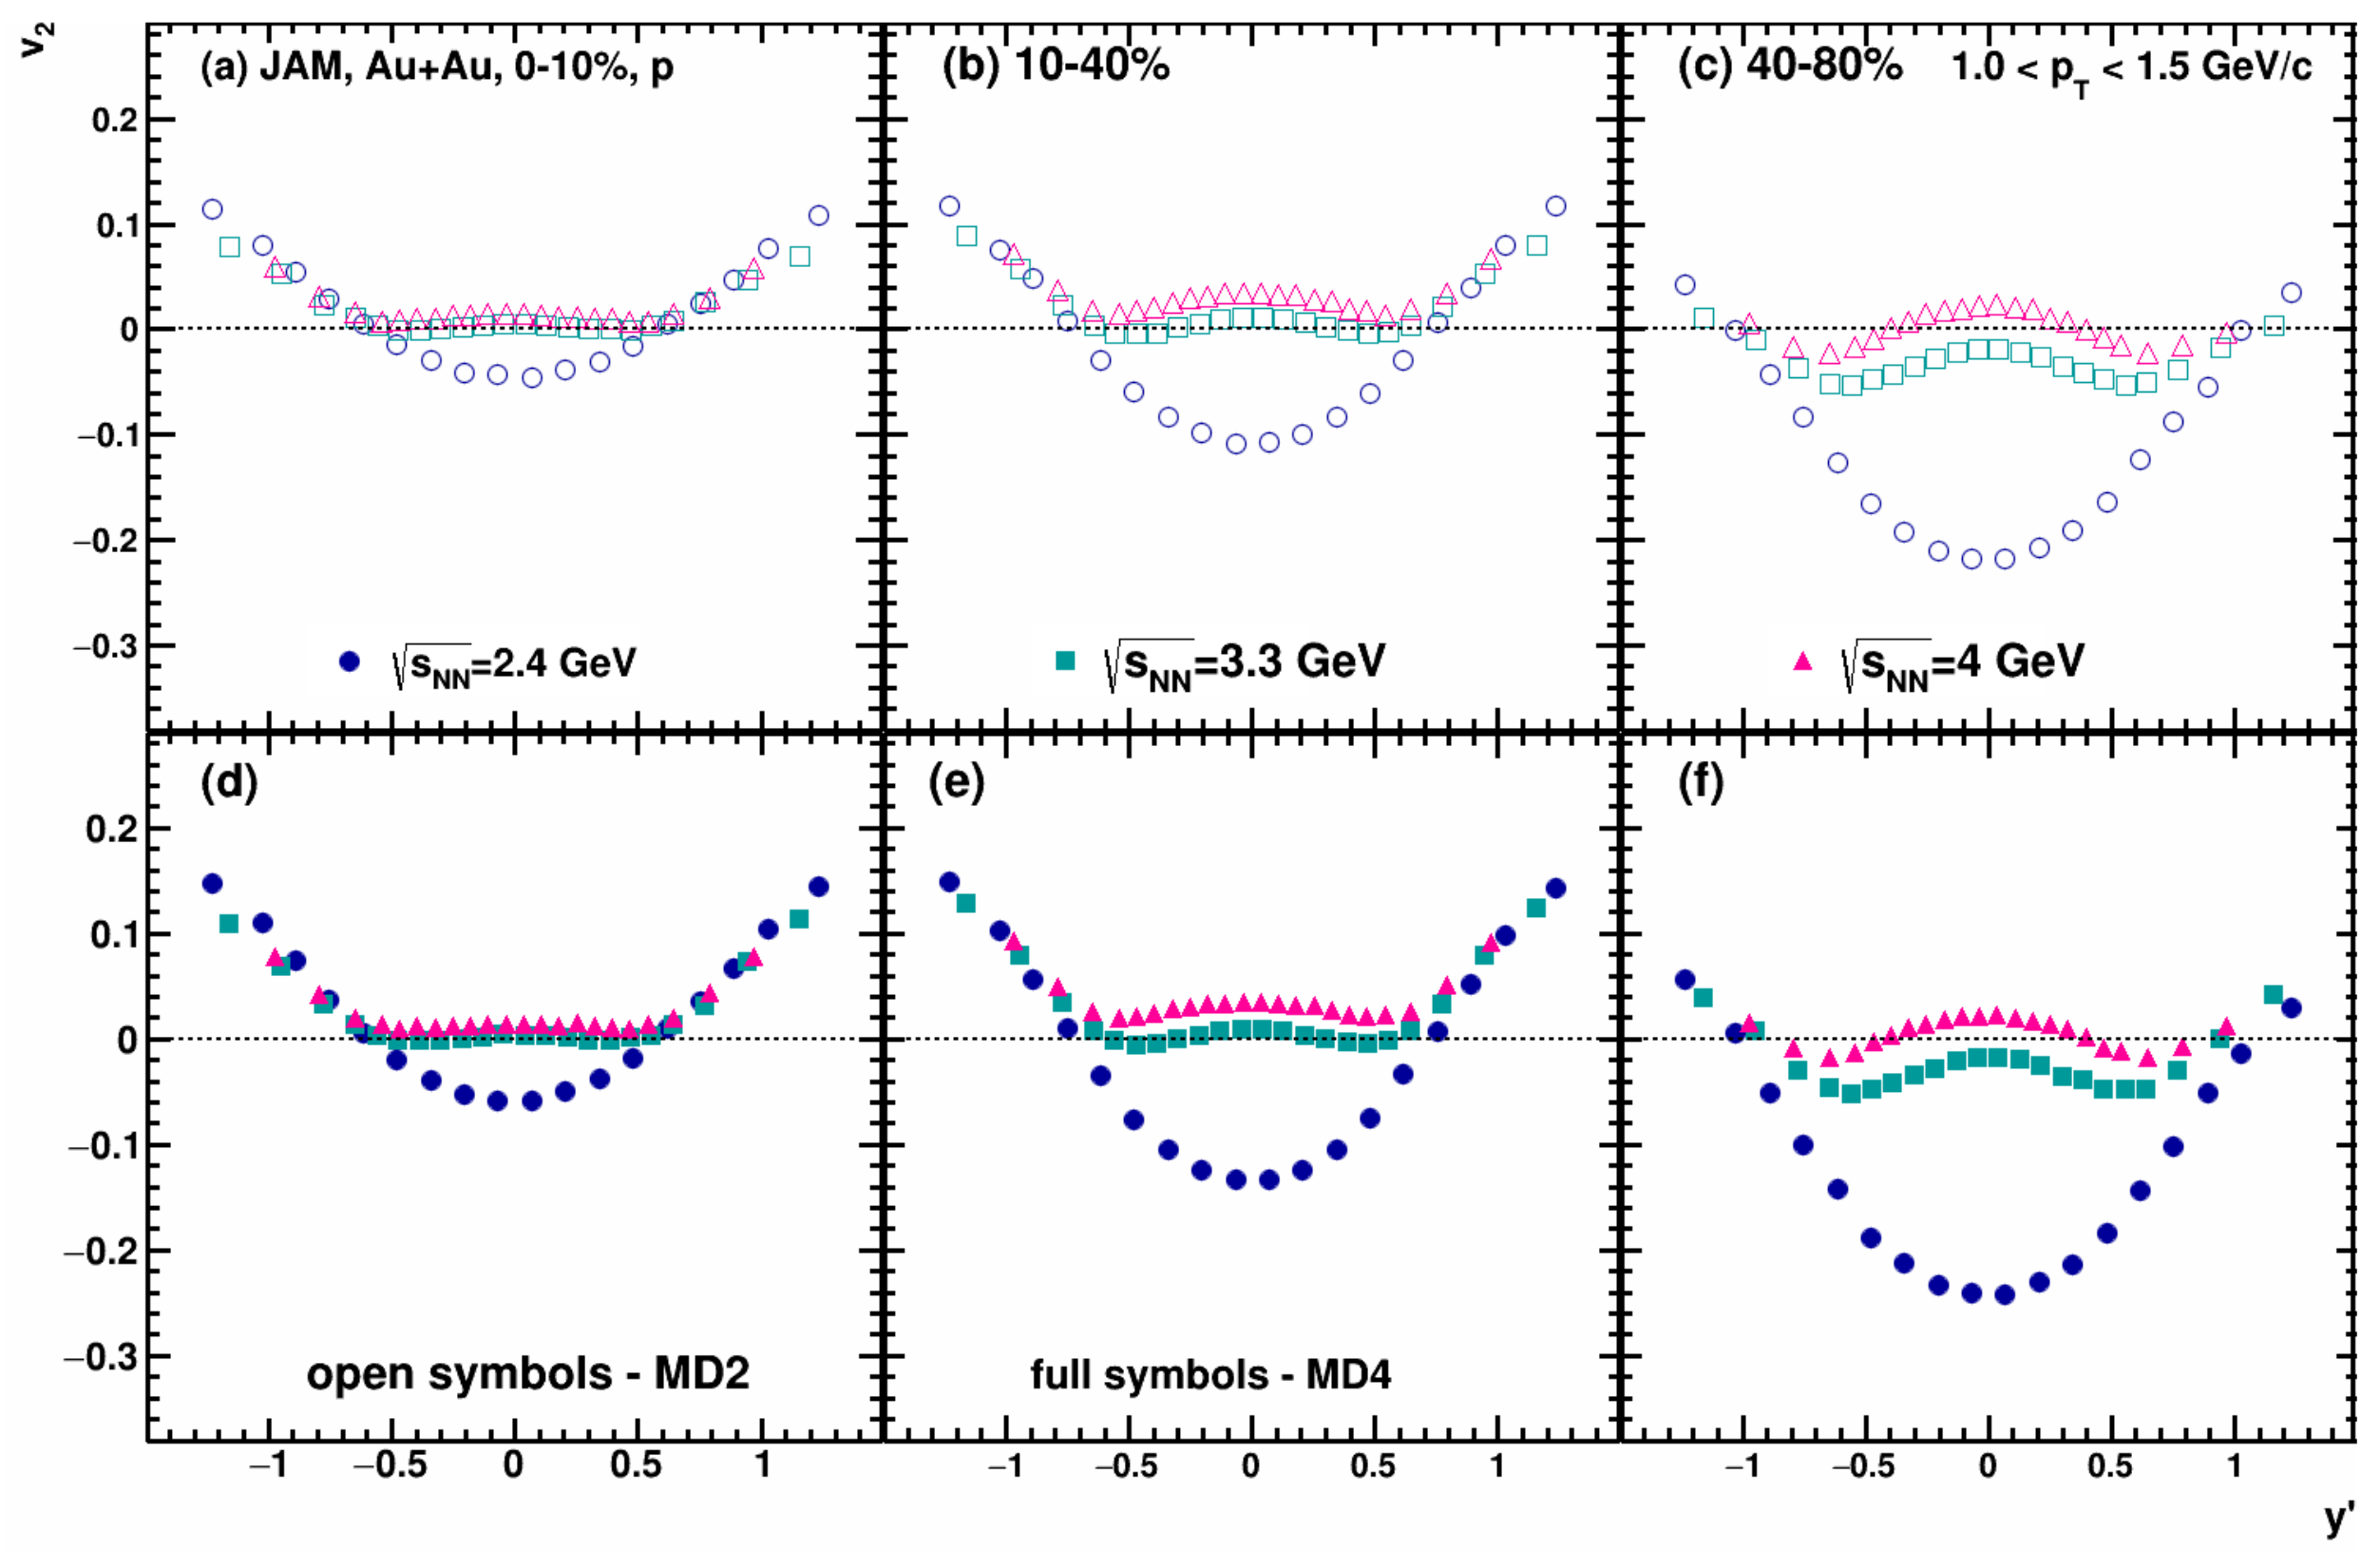
Figure 17 shows the scaled rapidity () dependence of of protons in the central 0–10% (left panels), midcentral 10–40% (central panels) and peripheral 40–80% (right panels) Au + Au collisions at GeV. One can clearly observe that the transition of from out-of-plane () to in-plane () has a strong centrality dependence. This is in a qualitative agreement with the results of the E895 experiment at AGS [14].
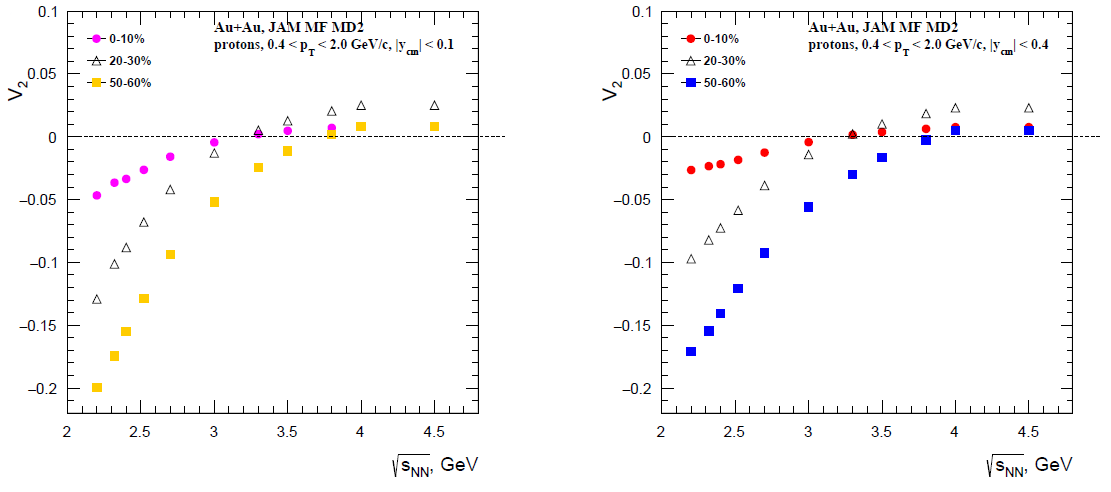
Figure 18 shows the collision energy dependence of of protons in the transverse momentum interval 0.4 < < 2.0 GeV/c for different intervals in collision centrality of Au + Au collisions, as indicated. Again, we observe the a strong centrality dependence for the transition of from out-of-plane () to in-plane ().
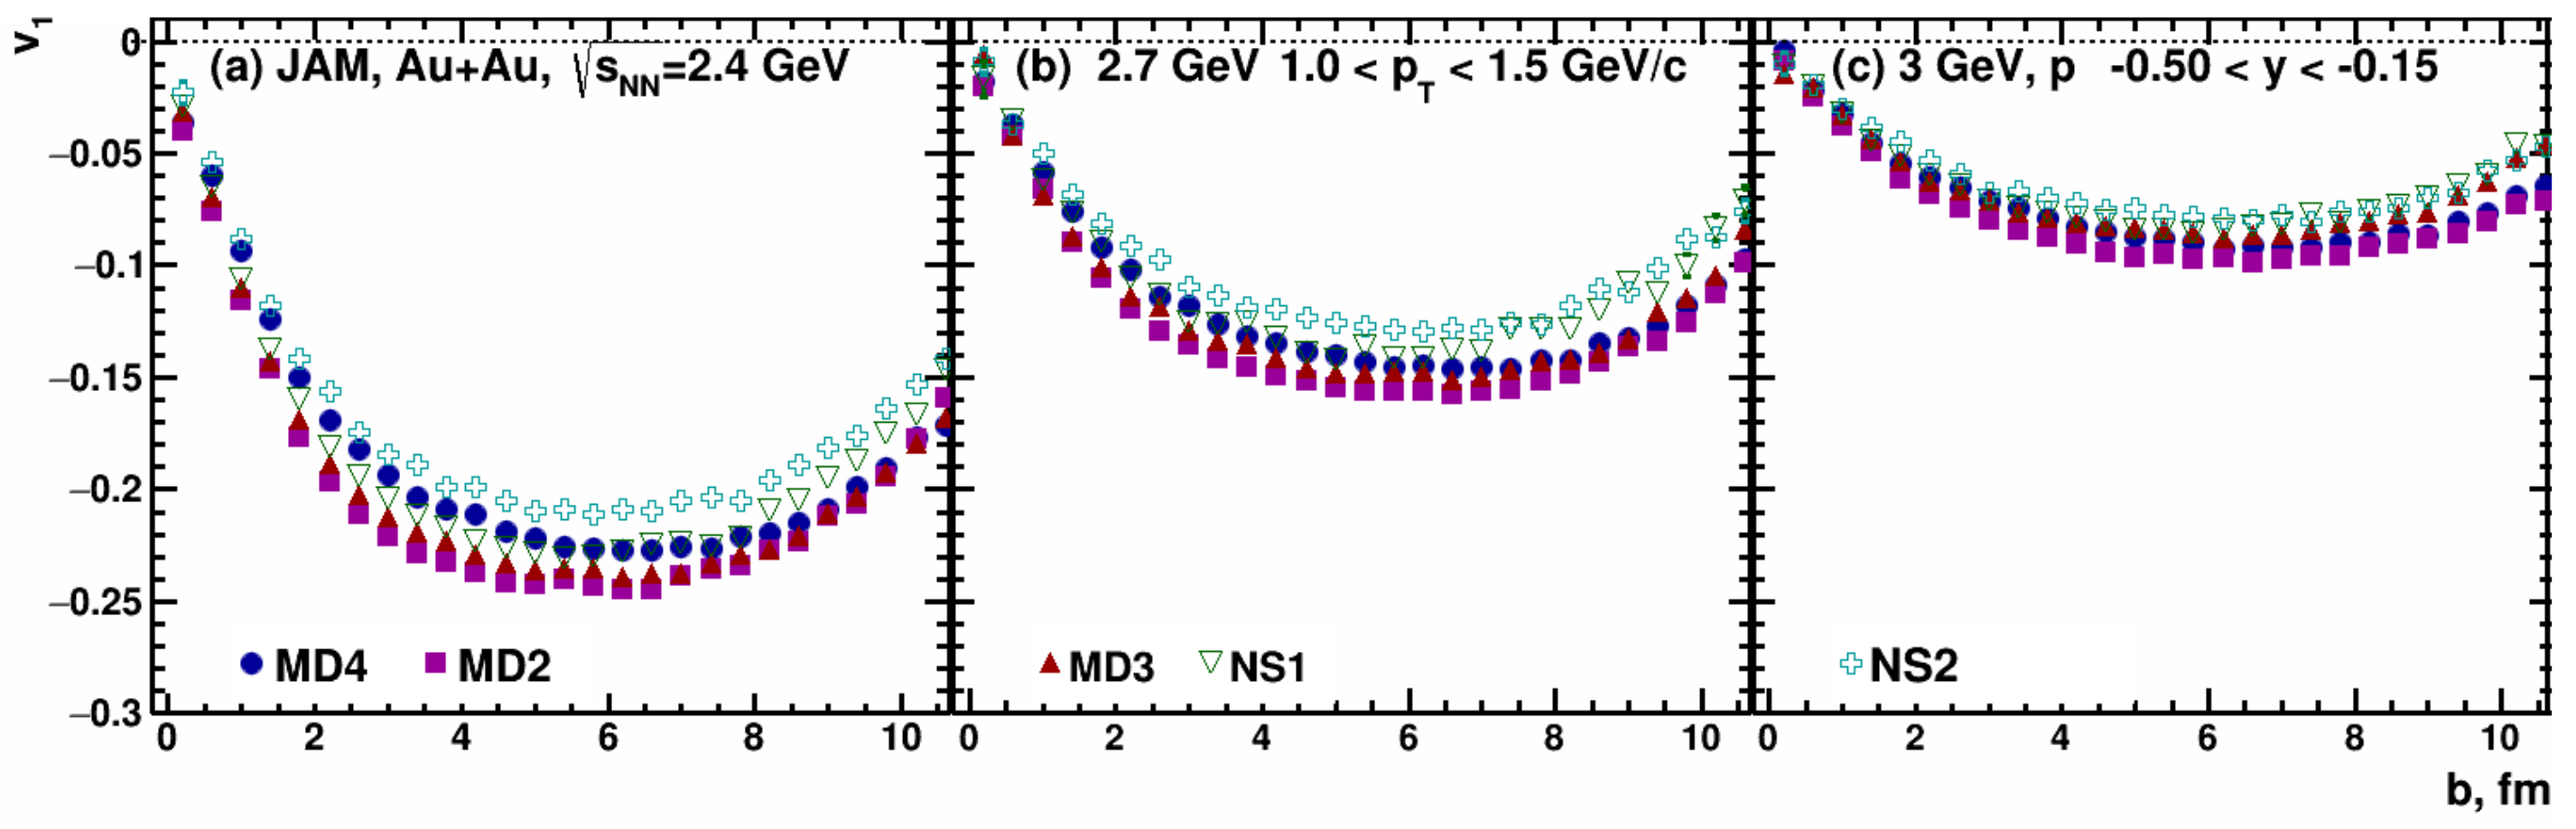
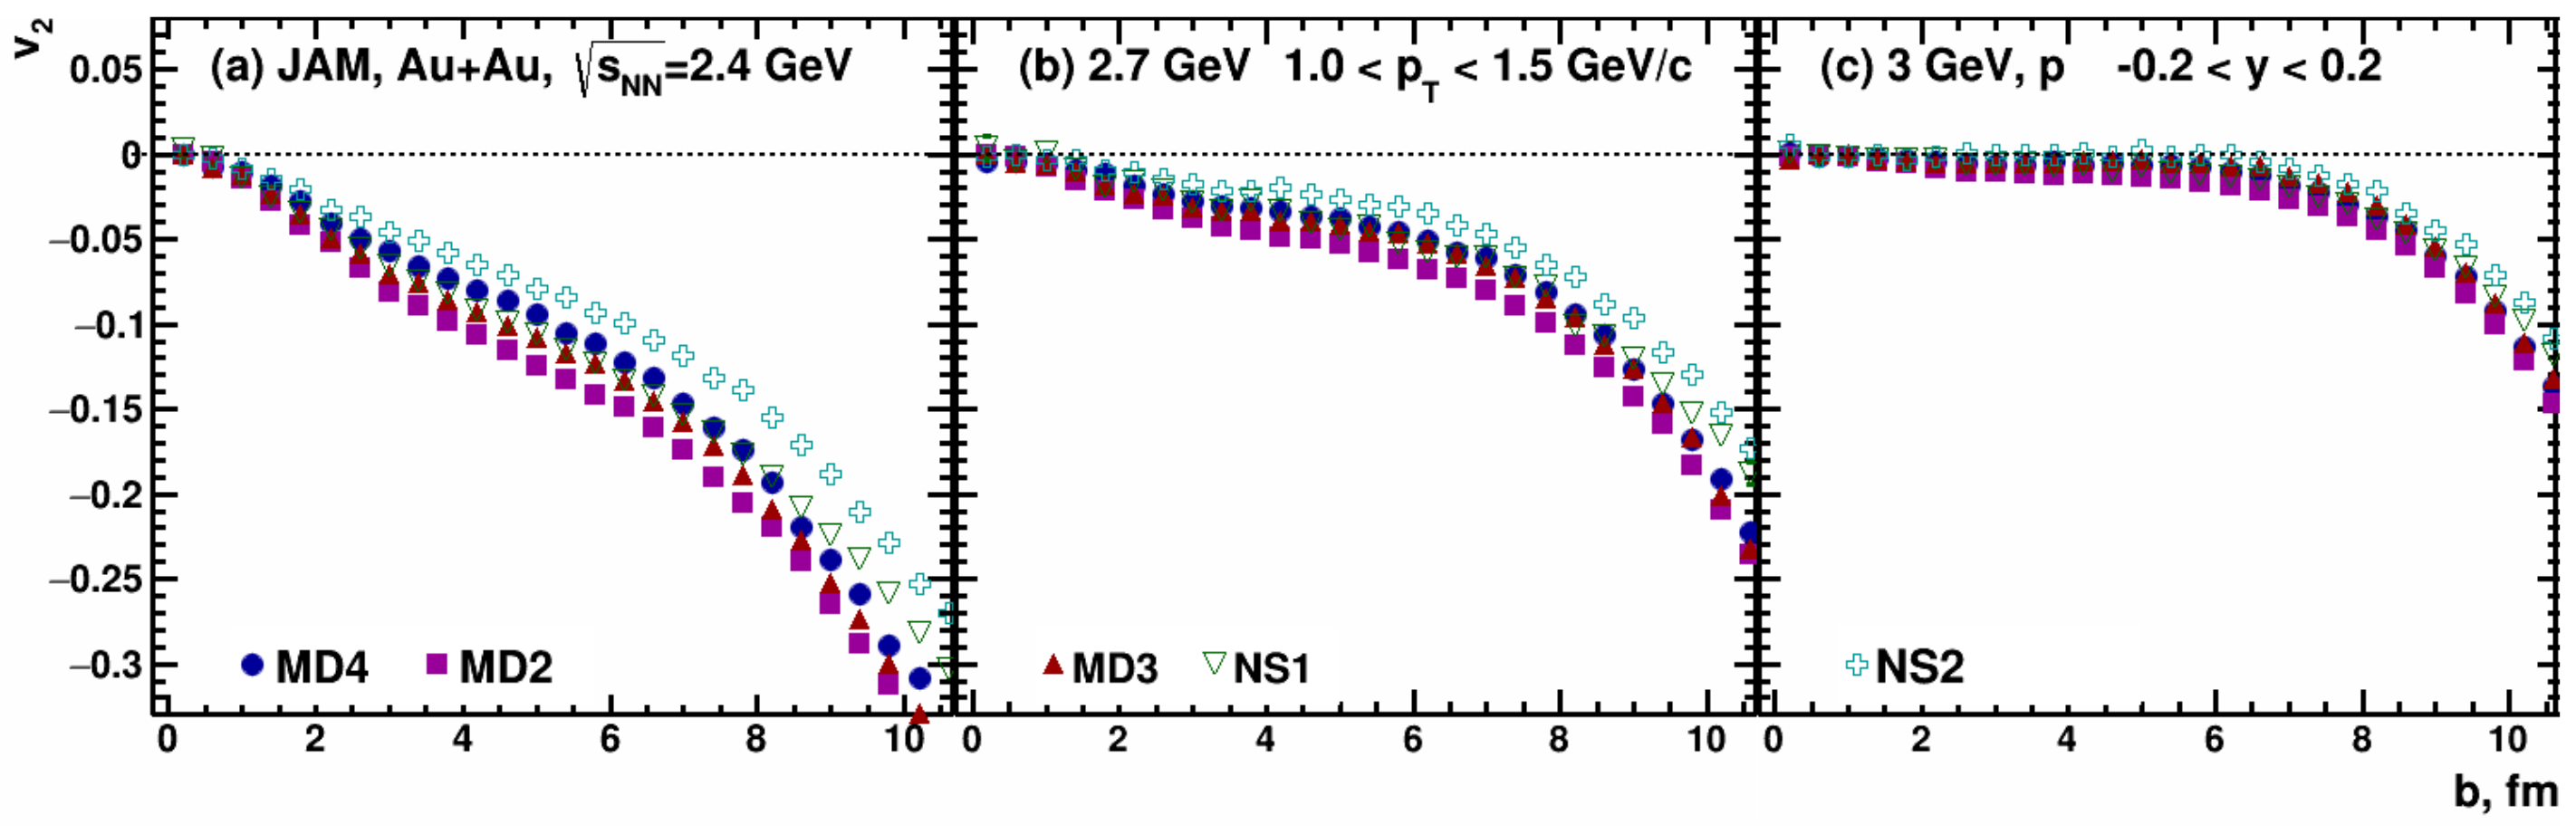
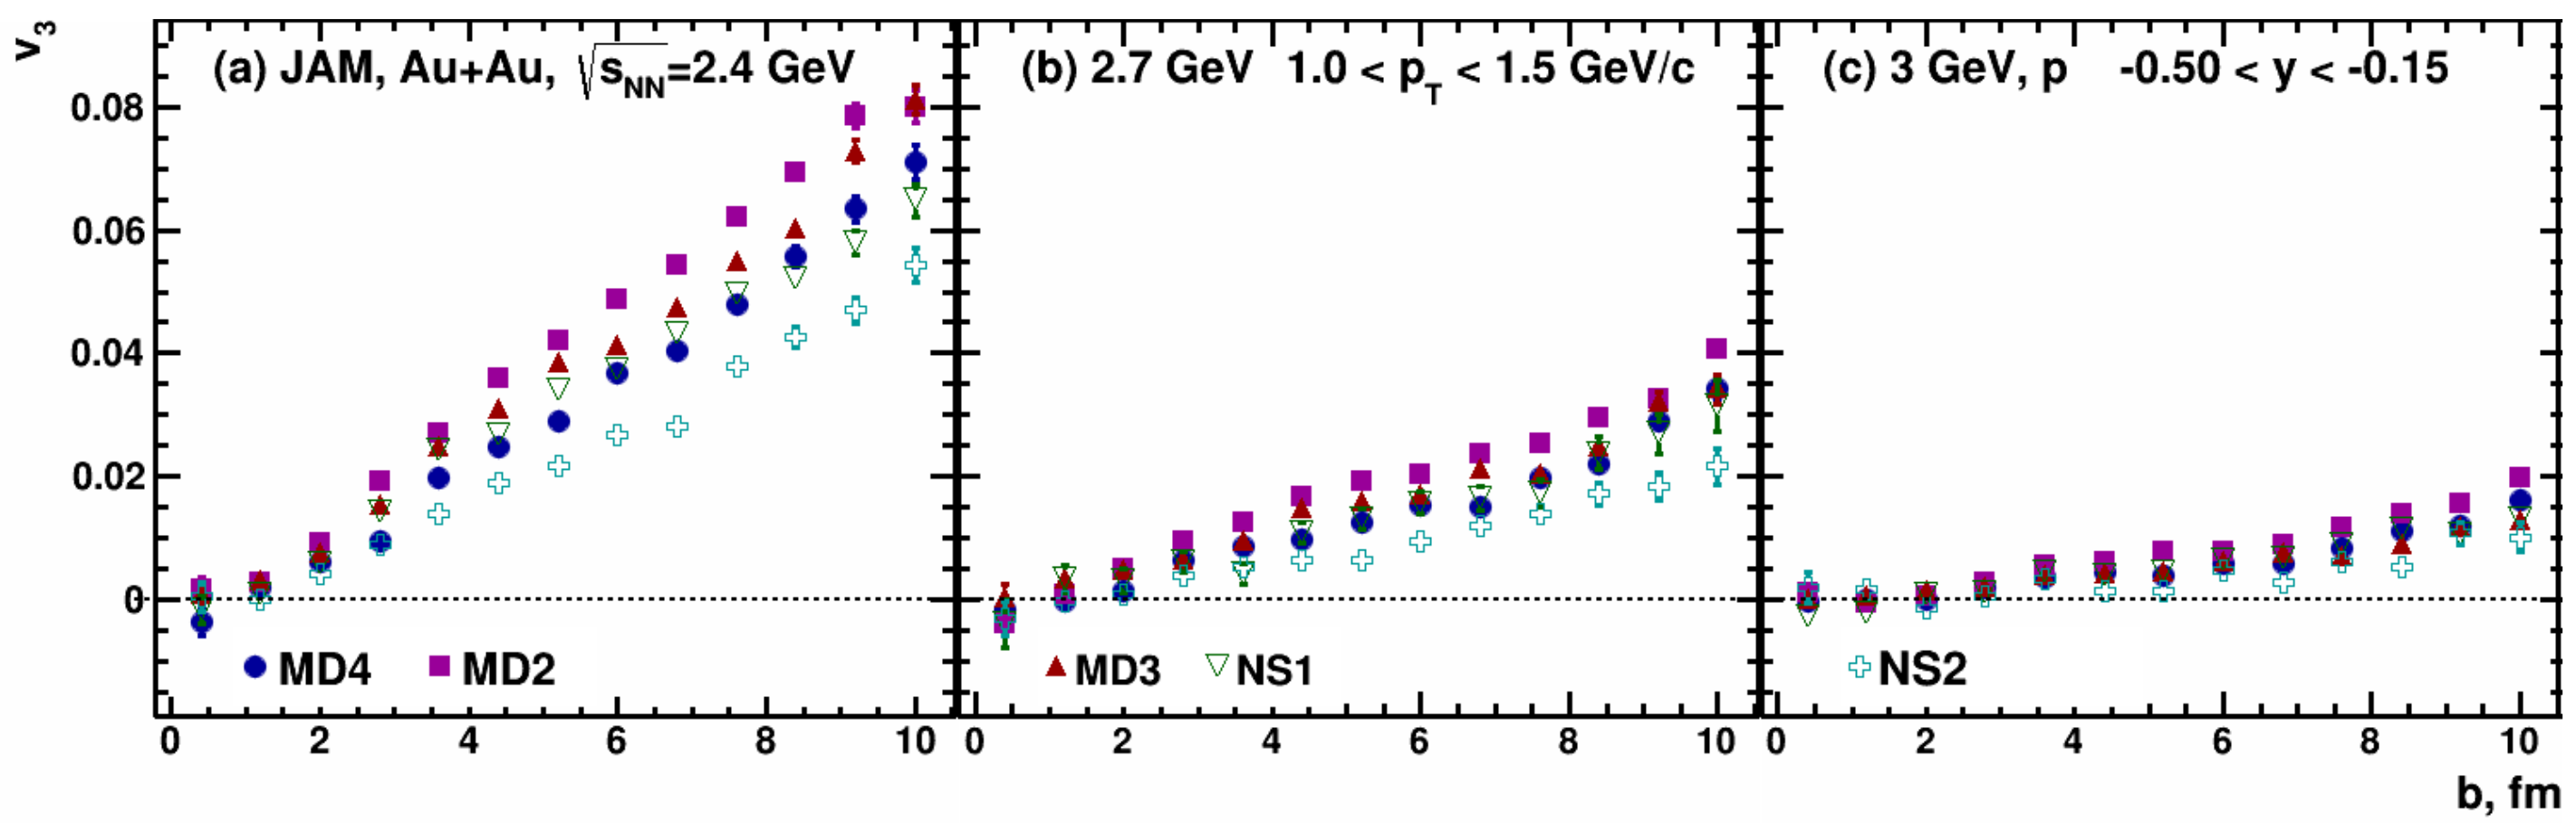
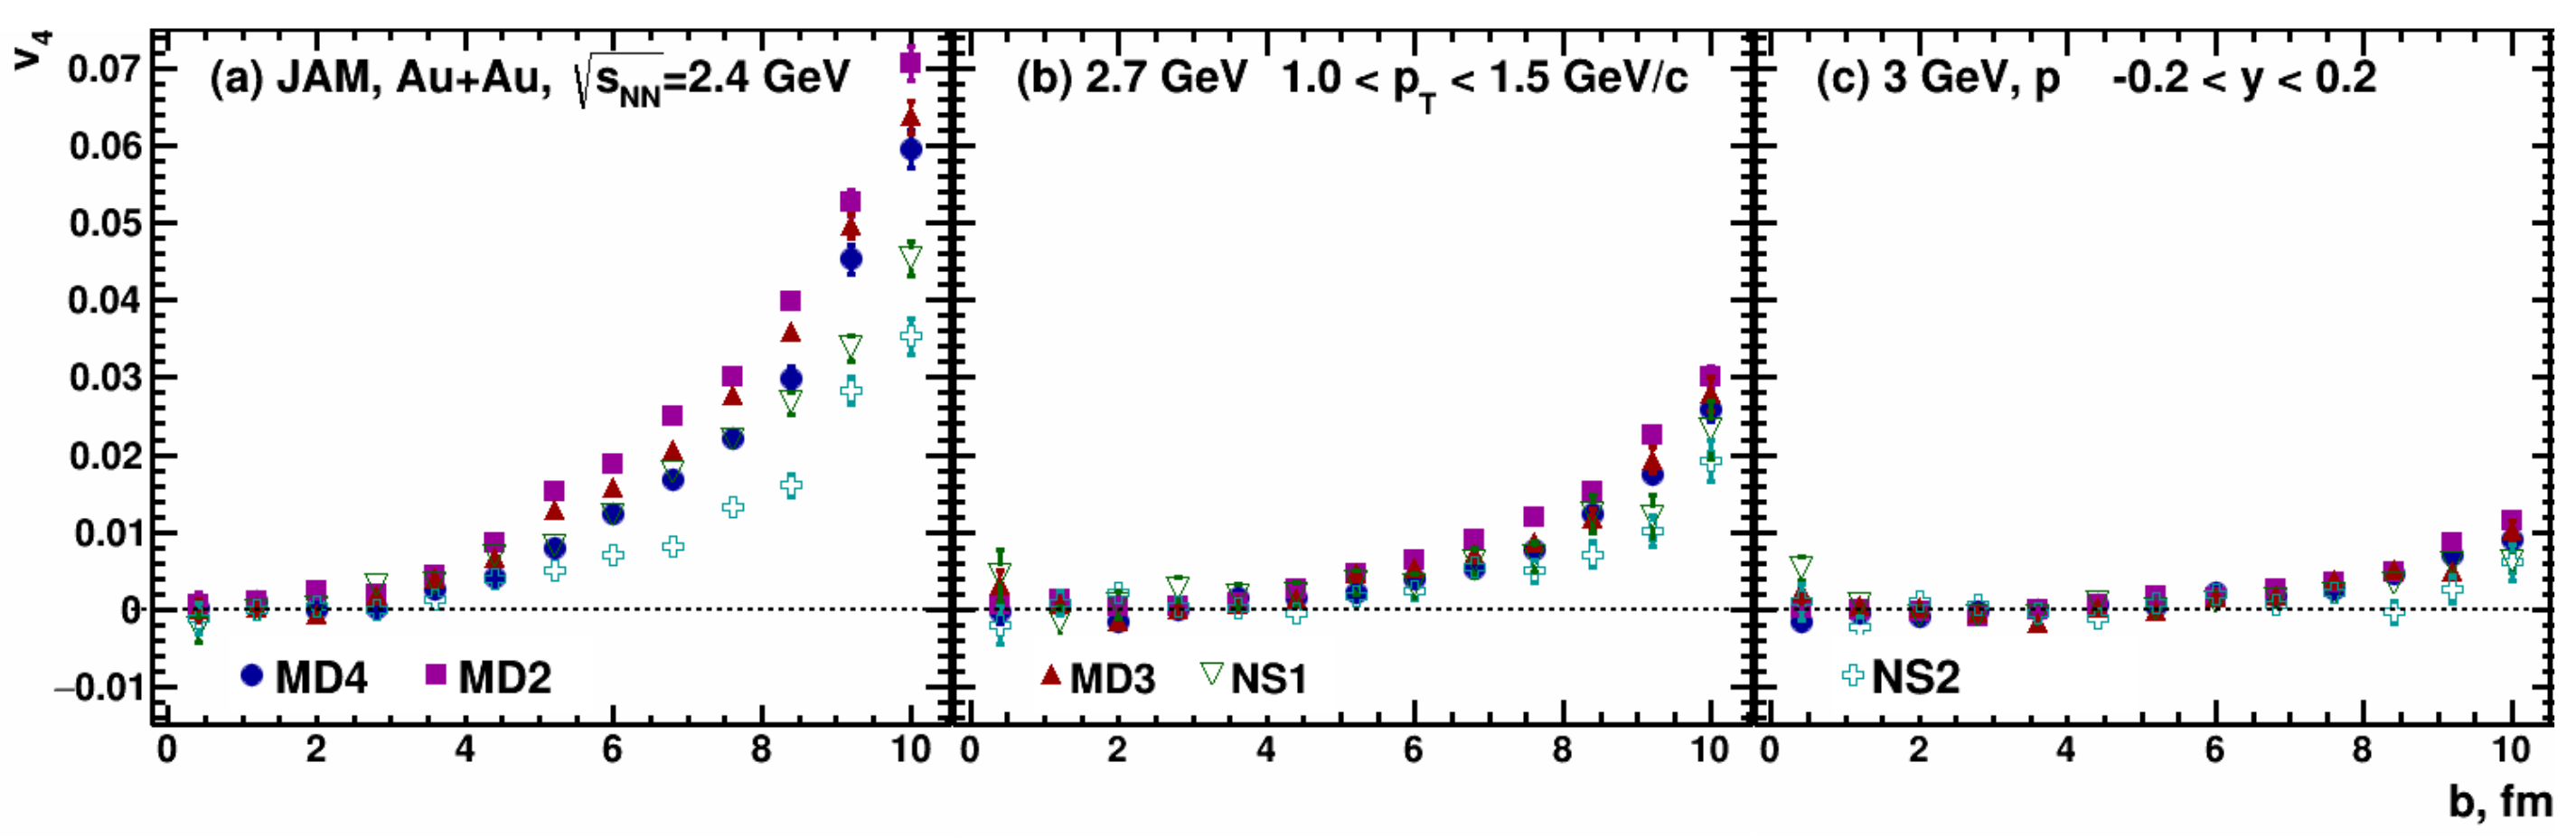
Figure 19, Figure 20, Figure 21 and Figure 22 show the impact parameter dependence of anisotropic flow coefficients , , and of protons in the transverse momentum interval 1.0 < < 1.5 GeV/c from Au + Au collisions at beam energies GeV (panel a), GeV (panel b), GeV (panel c). Different symbols correspond to the different EOS implementations in JAM model: soft momentum independent NS2 ( = 210 MeV), hard momentum independent NS1 ( = 380 MeV), soft momentum dependent MD4 ( = 210 MeV) and hard momentum dependent MD2 and MD3 ( = 380 MeV), as indicated. They demonstrate that the dependence of on the EOS implementations in JAM model decreases with increasing the collision energy from GeV to GeV.
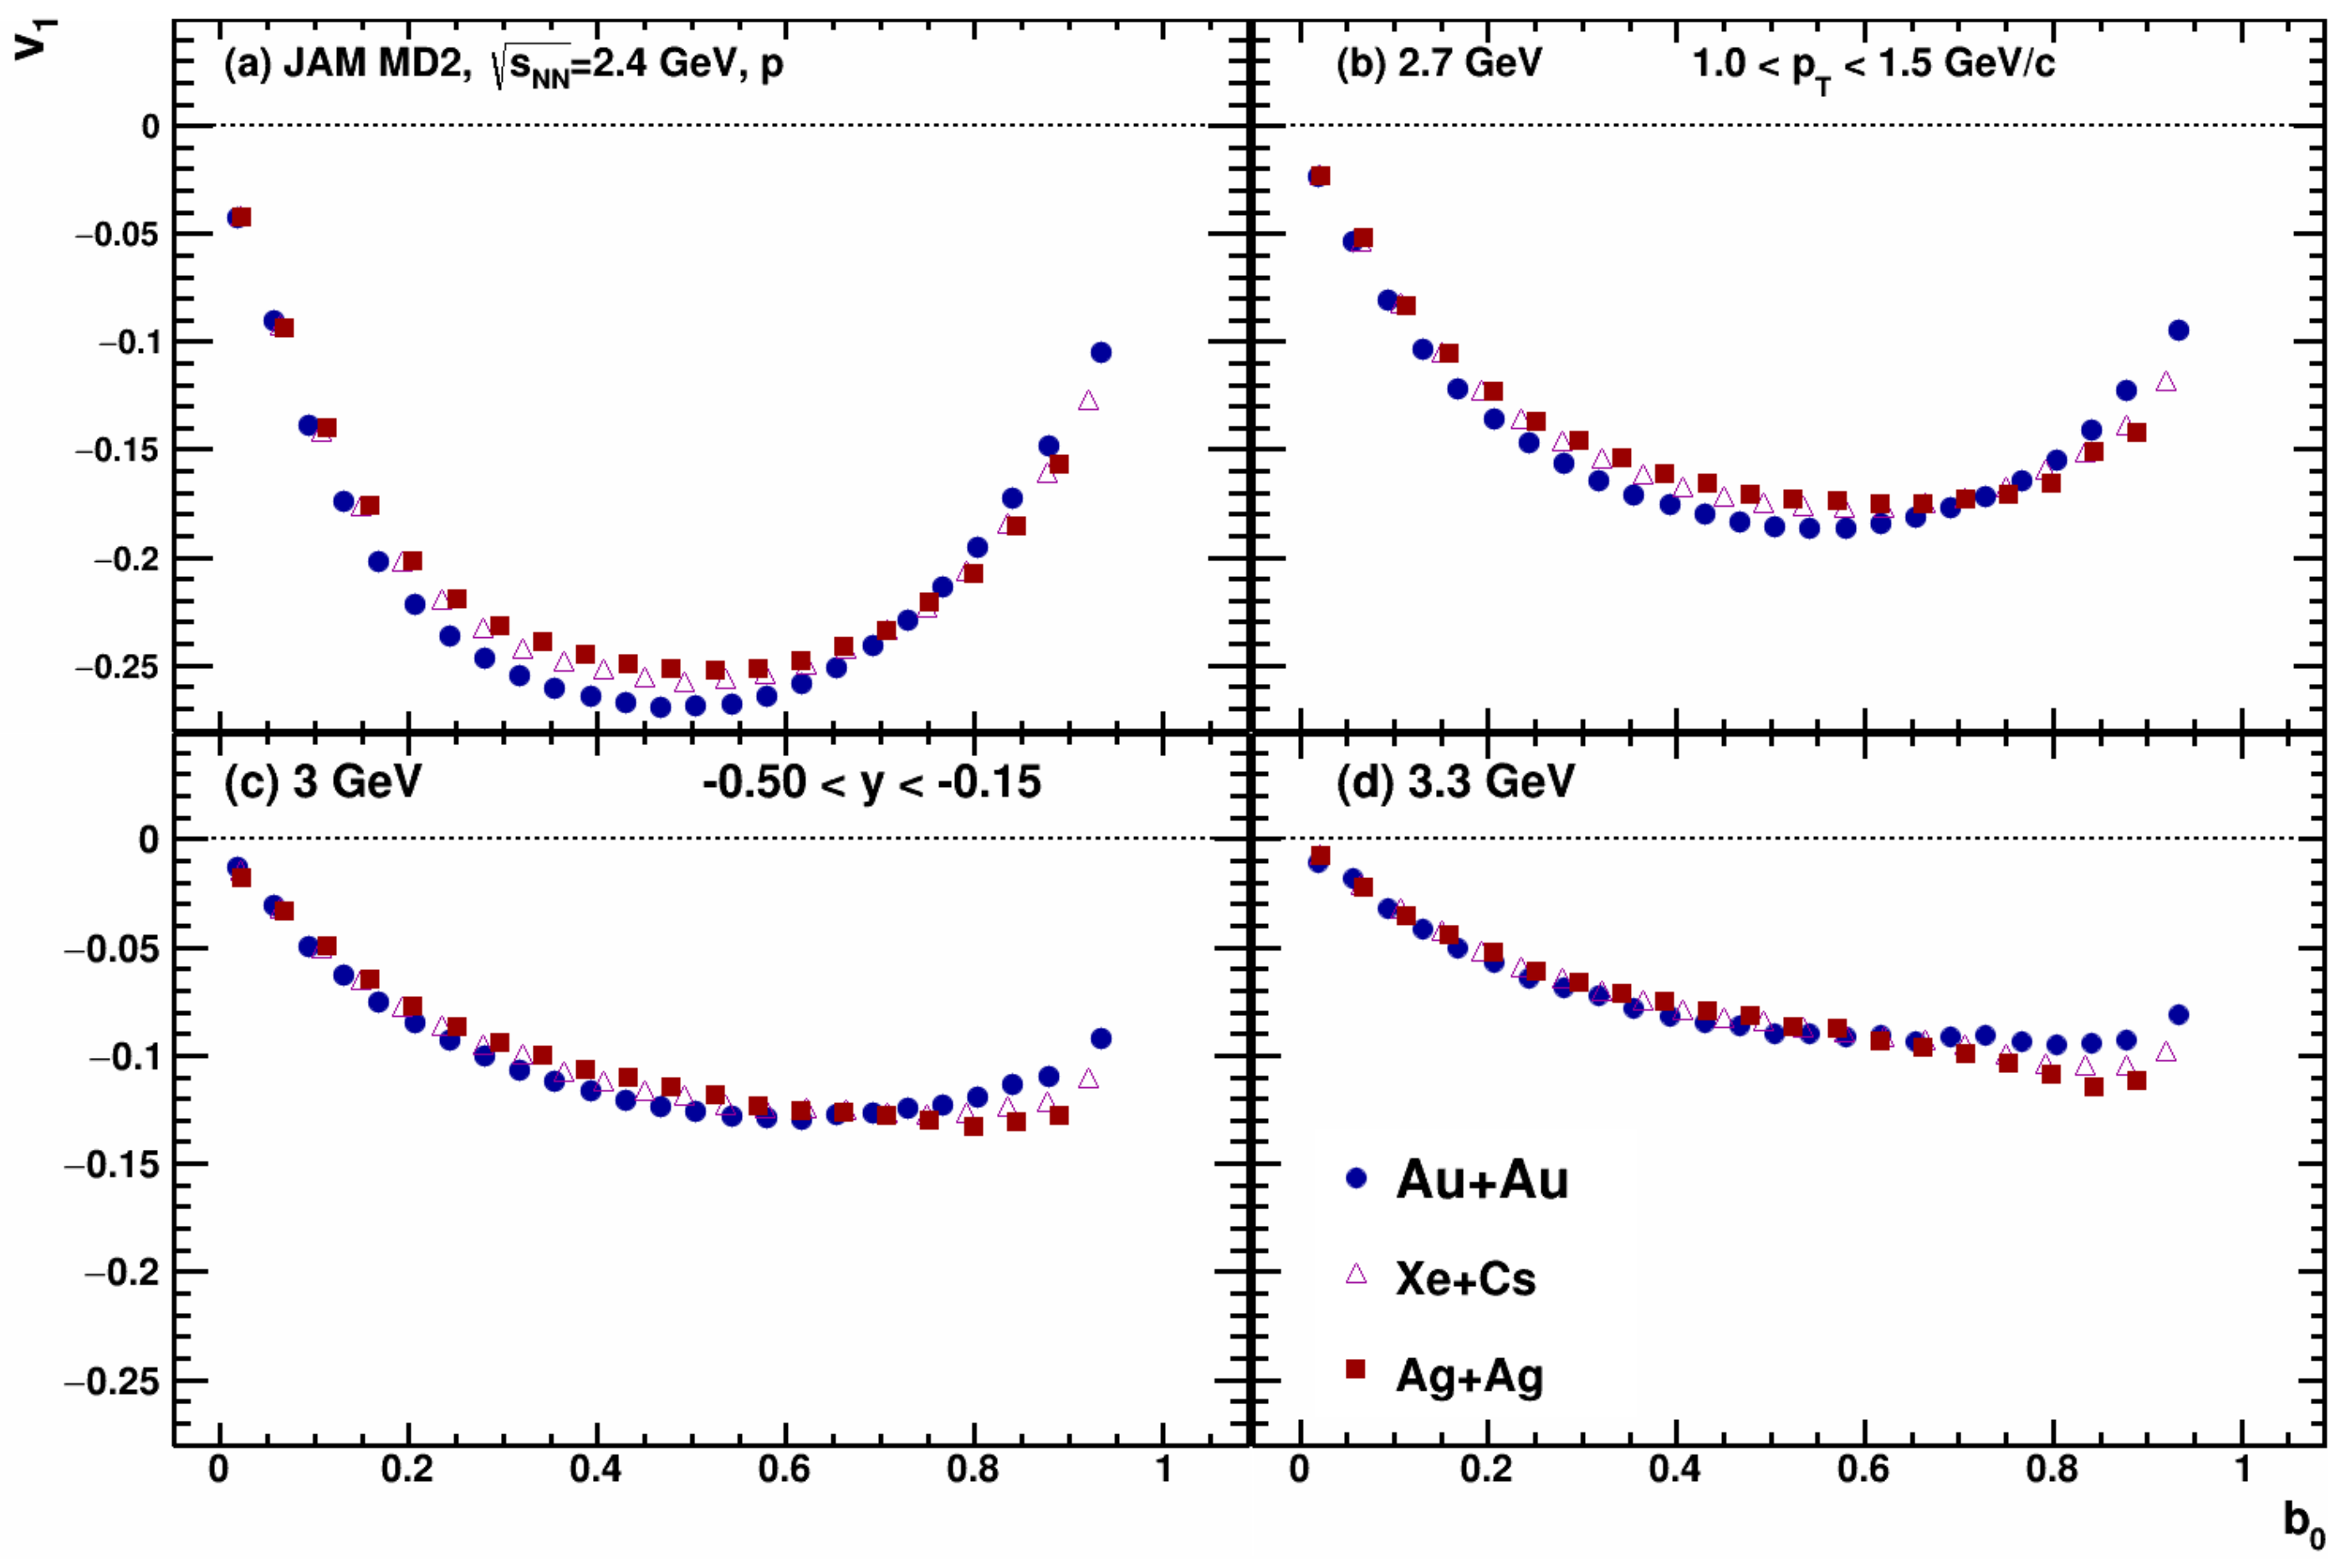
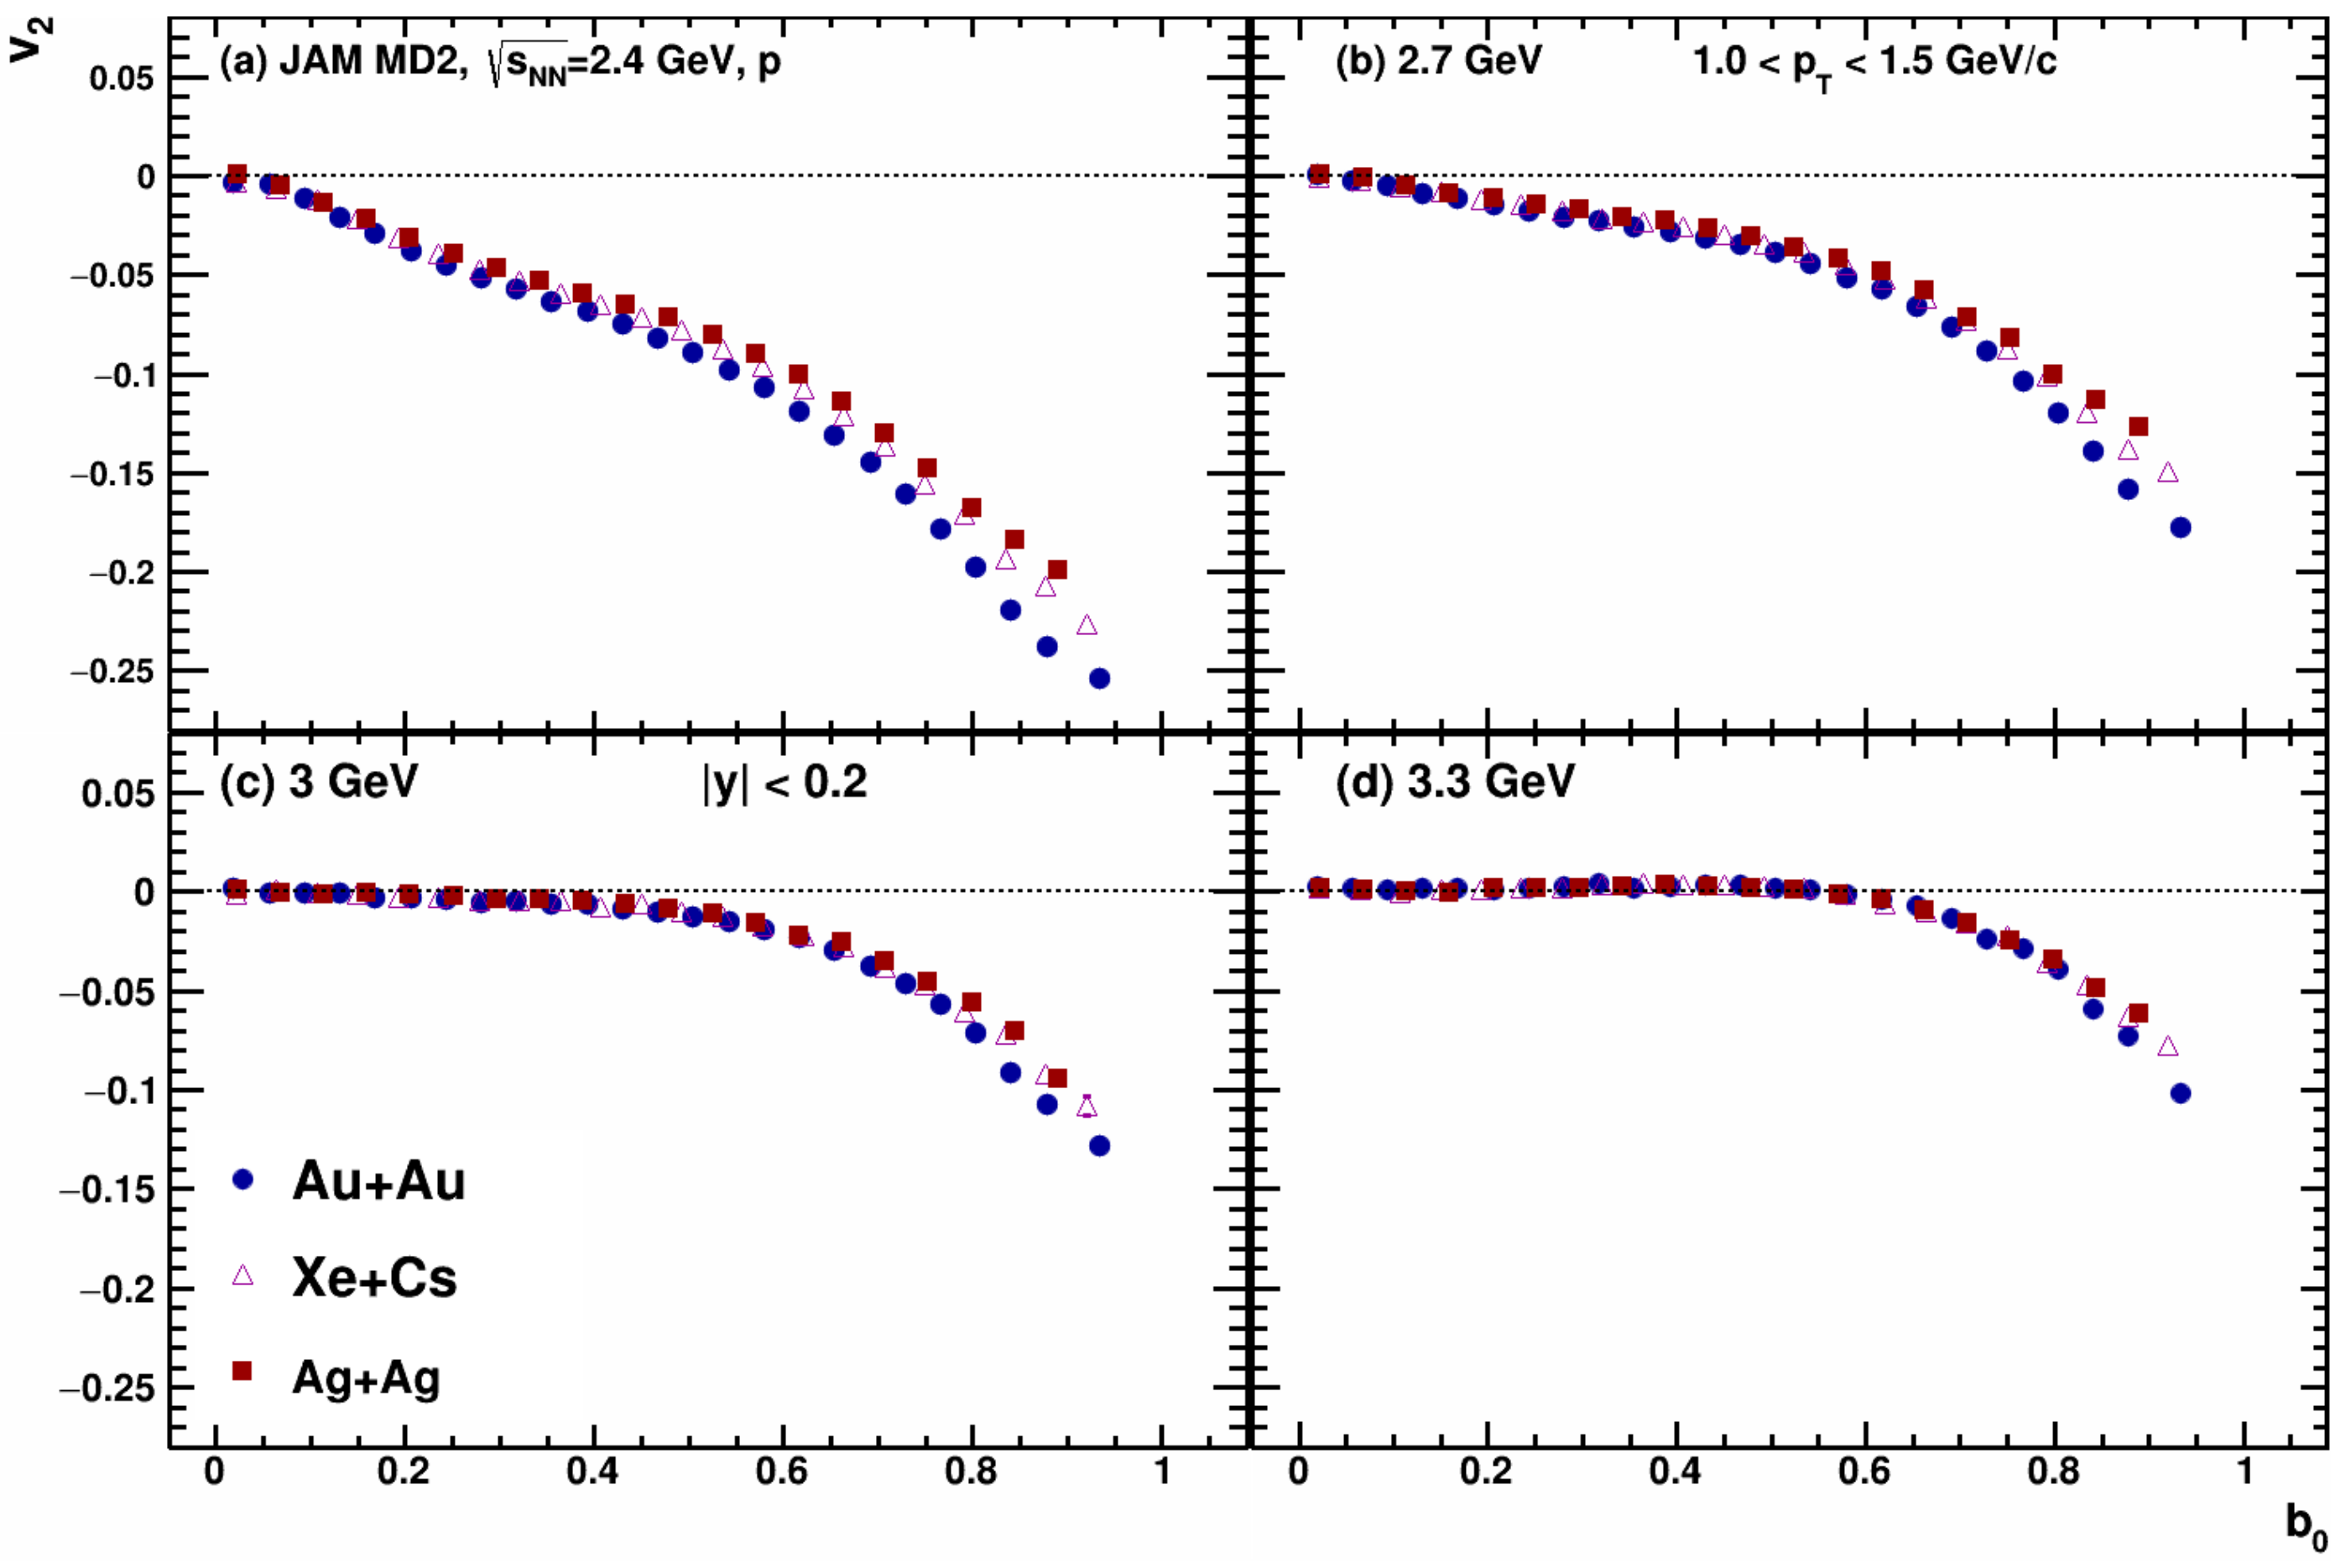
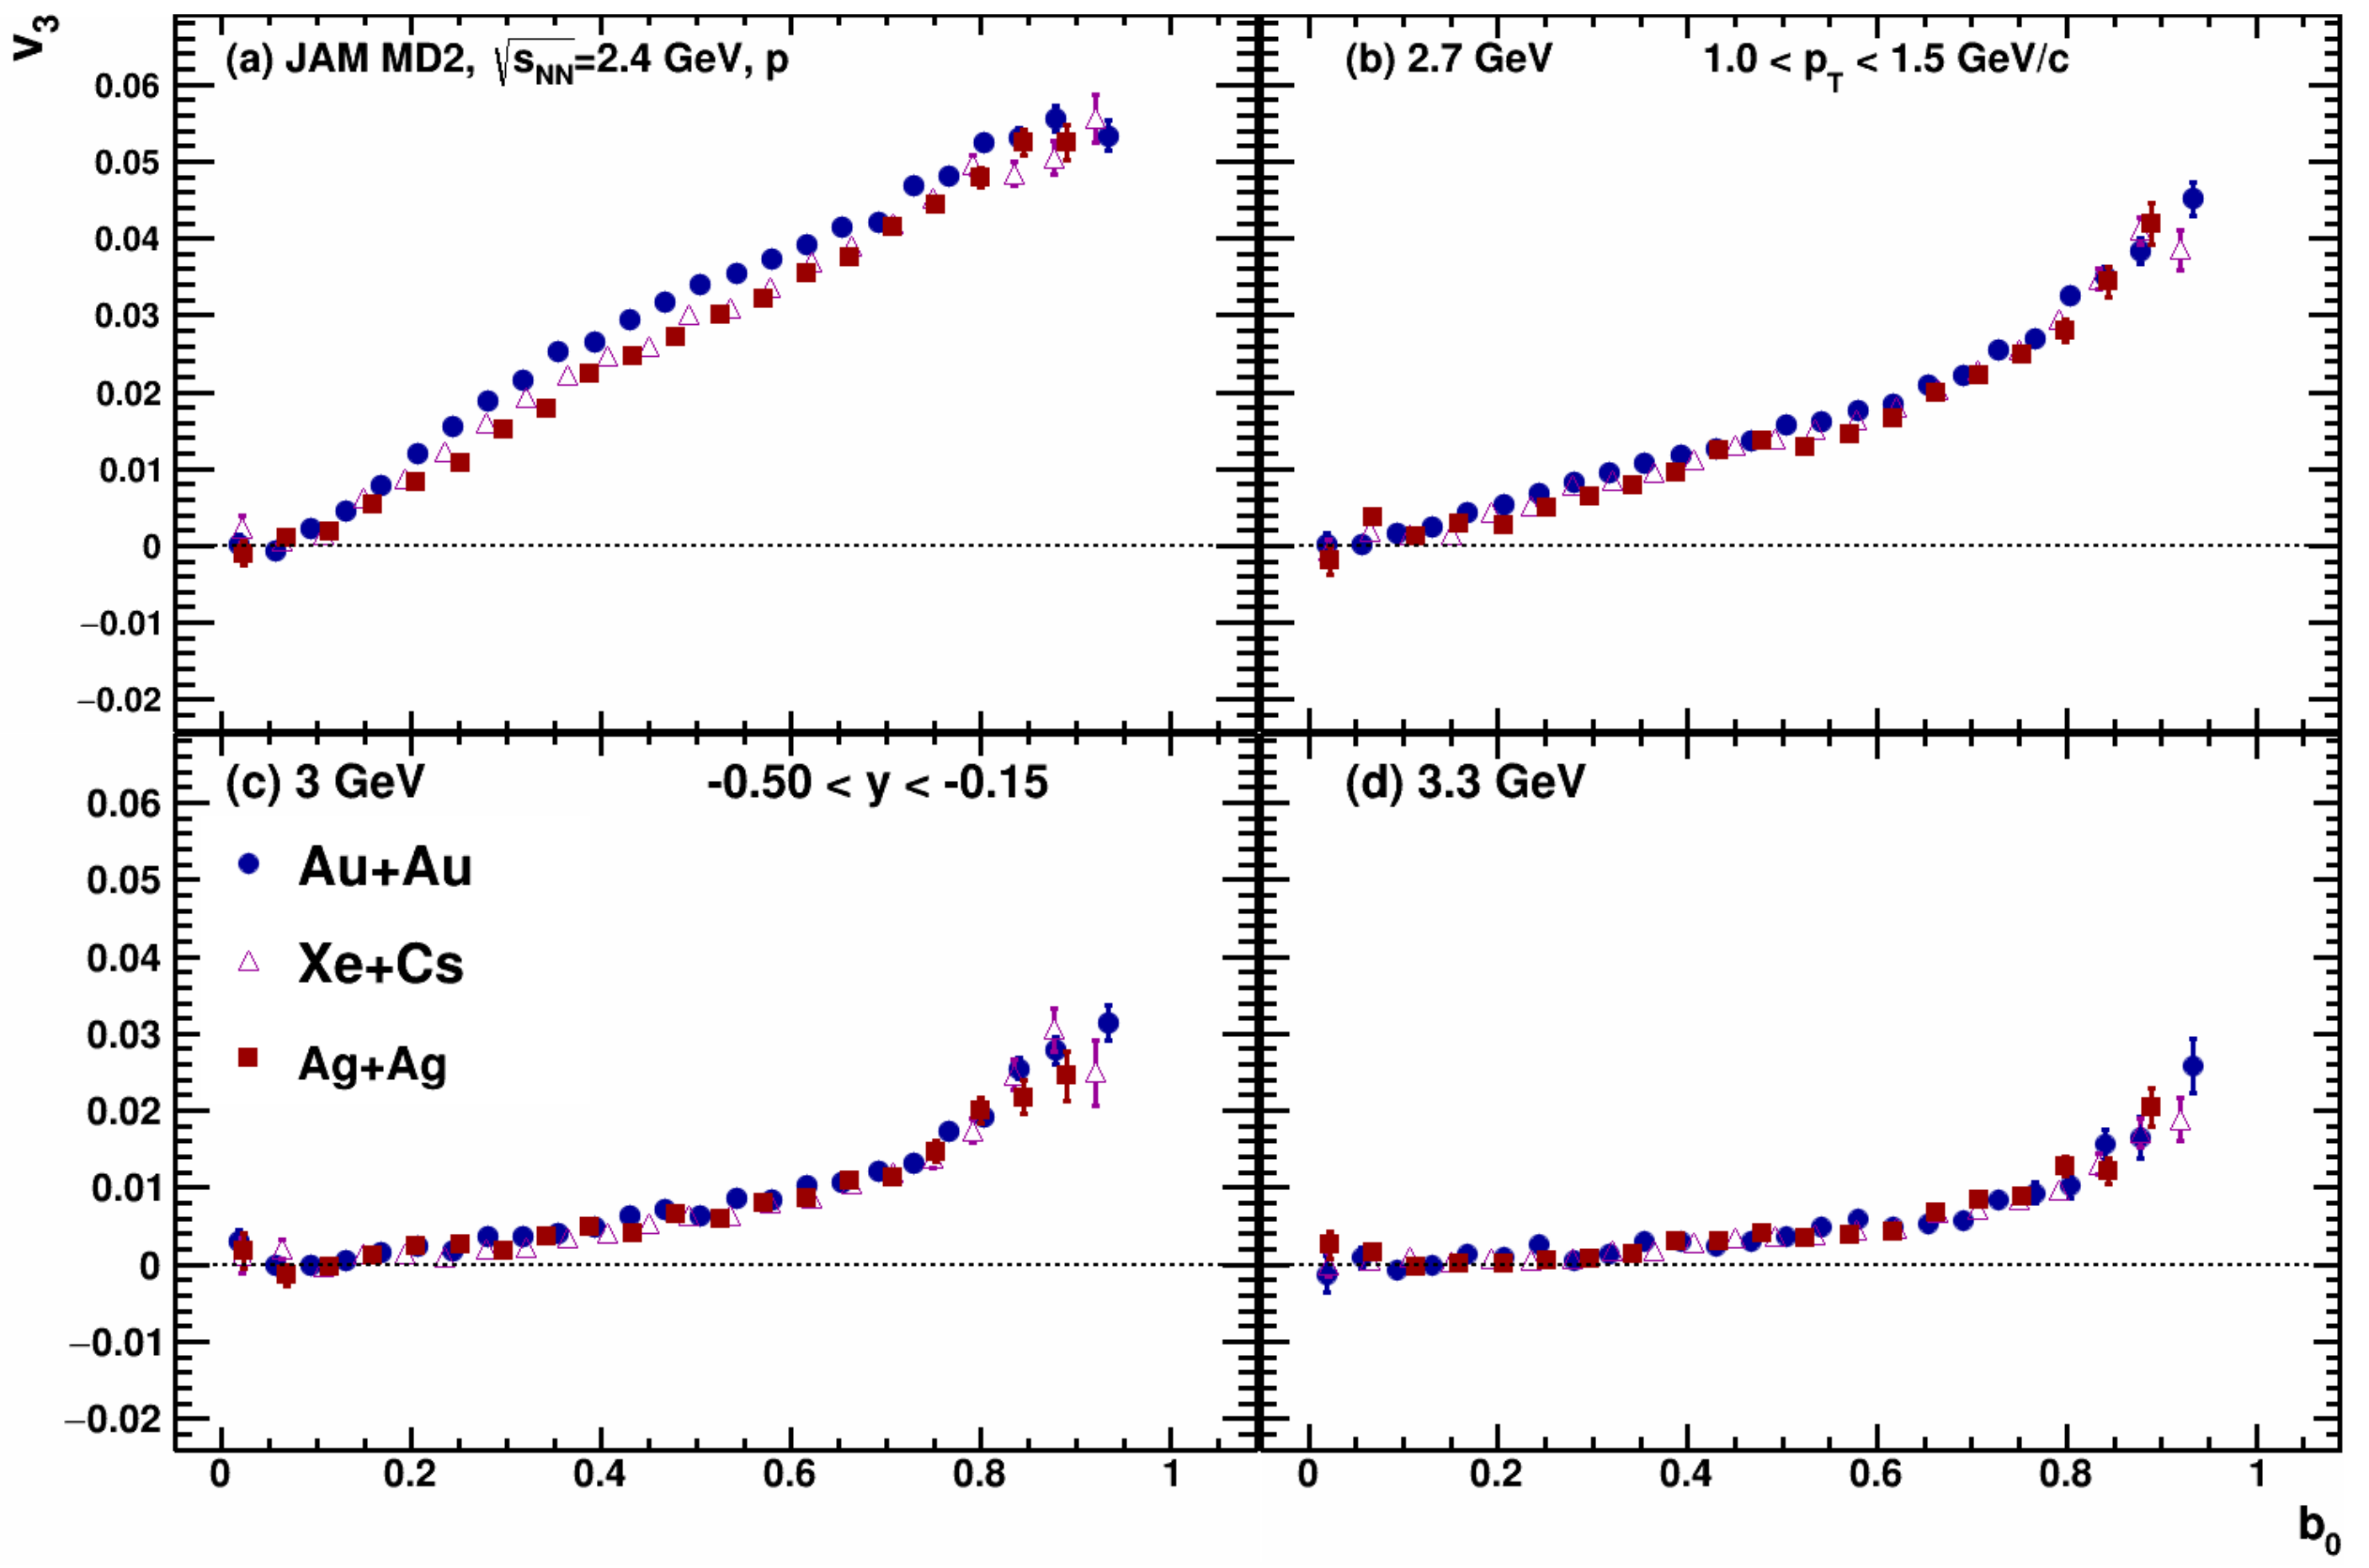
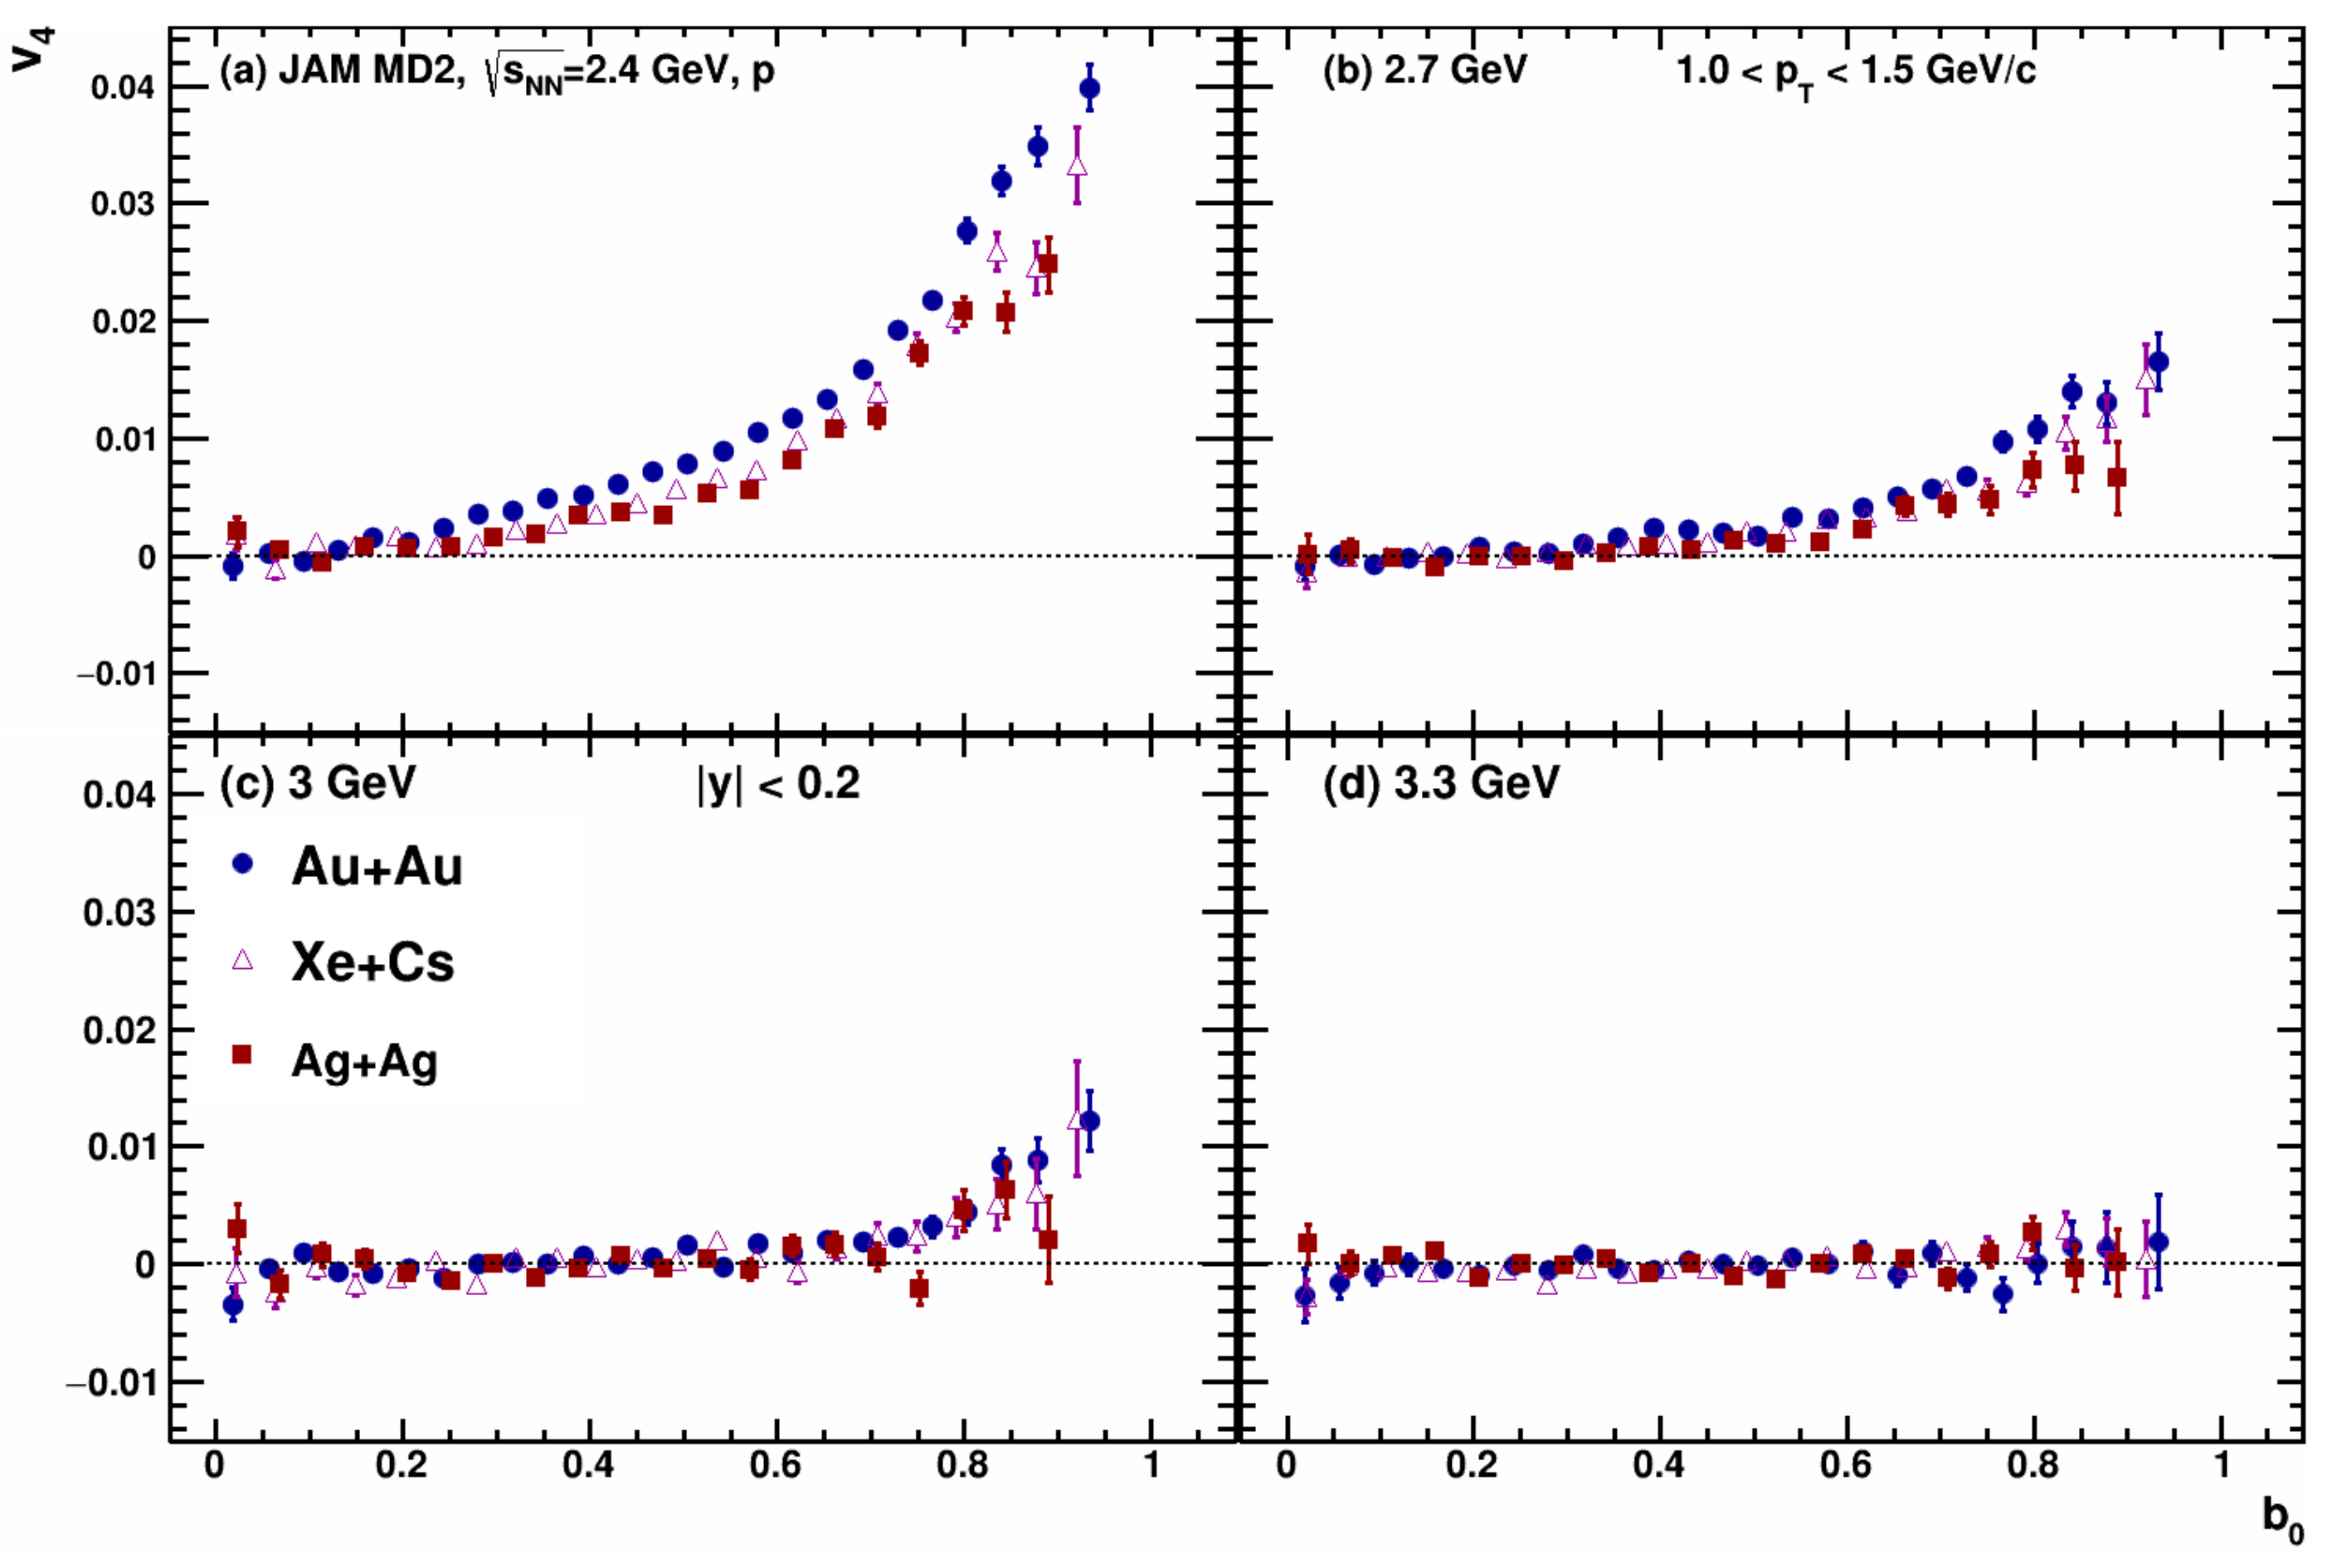
To compare the results for different colliding systems, it was suggested to use the scaled impact parameter , defined by = , taking = 1.15( + ) fm. Figure 23, Figure 24, Figure 25 and Figure 26 show the scaled impact parameter dependence of anisotropic flow coefficients , , and of protons in the transverse momentum interval 1.0 < < 1.5 GeV/c from Au + Au (closed circles), Xe + Cs (open triangles), Ag + Ag (closed boxes) collisions at energies: GeV (panel a), GeV (panel b), 3 GeV (panel c) and GeV (panel d). They show that the difference in for various colliding systems decreases with increasing the collision energy from GeV to GeV.
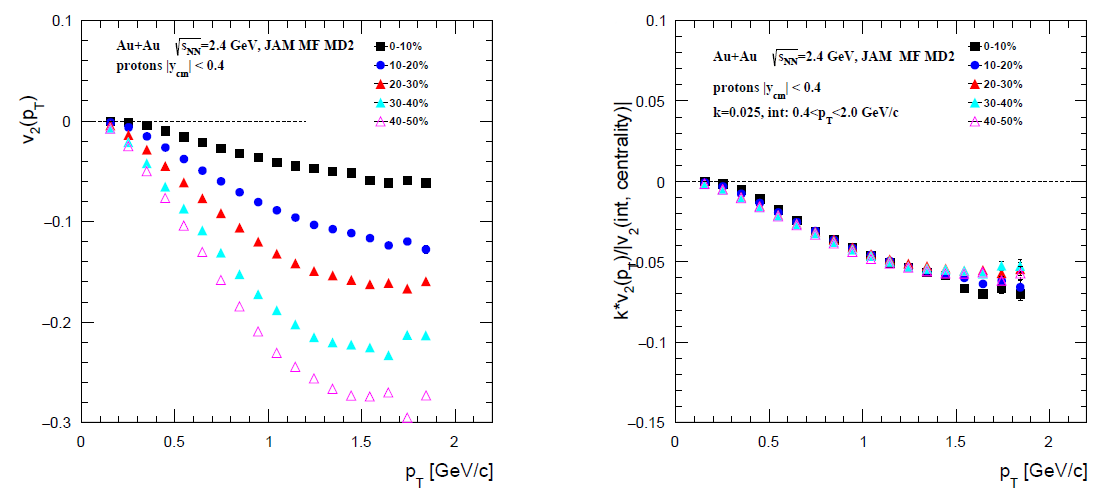
The left panel of Figure 27 shows the differential of protons in Au + Au collisions at GeV for different bins in the collision centrality. The results have been obtained using the JAM model with hard momentum dependent mean-field MD2. The results exhibit the familiar increase, as collisions become more peripheral and the increase [12,14,15,17]. A specifically produced particle moving with the transverse velocity will be shadowed by the spectator matter during the passage time . The simple geometrical estimate then leads to the condition [35]: , where R is the radius of the nucleus and b is the impact parameter. it is easier to fulfill this condition for the particle with high and for peripheral collisions [35].
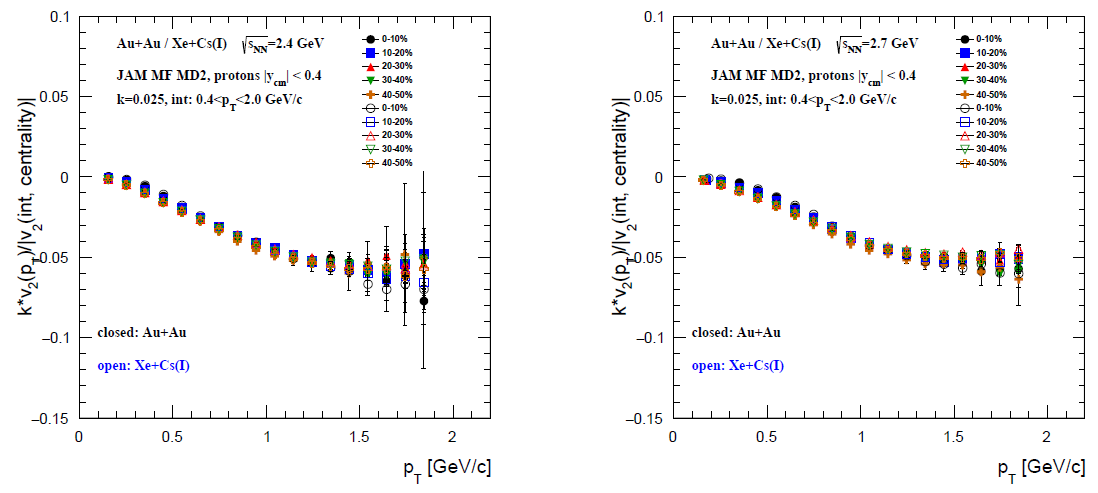
We have tested these data for the “integral flow scaling”, observed for in heavy-ion collisions at RHIC [36,37,38], by dividing the differential values (centrality, ) shown in the left panel Figure 27 by the of protons integrated over the range 0.4–2.0 GeV/c for each of the indicated centrality selections (|(int,centrality)|). The right panel of Figure 27 shows that the “integral flow scaling” can be a general feature of anisotropic flow and can be observed at different colliding energies. Figure 28 shows the resulting scaled values for Xe + Cs and Au + Au collisions at GeV (left panel) and GeV (right panel). These scaled values are clearly independent of the colliding system size and show essentially perfect scaling for the full range of centralities. The recent measurements for Au + Au and Ag + Ag collisions from HADES experiment at SIS-18 and measurements from the upcoming Xe + Cs(I) run of the BM@N experiment at Nuclotron will be used to test these scaling relations for .
4. Conclusions
In summary, we have presented a detailed multi-differential study of collective flow coefficients of protons in relativistic heavy-ion collisions at = 2.2–4.5 GeV using several hadronic transport models. The directed (), elliptic () and higher order ( and ) flow coefficients of protons have been studied as a function of transverse momentum , rapidity () for several intervals in collision centrality. We have found that transport models JAM and UrQMD in the mean-field mode can qualitatively reproduce the recently published measurements of protons from Au + Au collisions at = 2.4 GeV (HADES experiment) and = 3.0 GeV (STAR experiment). In case of the cascade mode calculations, the absence of a repulsive potential significantly reduces the and signals and results in essentially zero signals for the higher order ( and ) flow coefficients. The results for different colliding systems (Au + Au, Xe + Cs, Ag + Ag) and collision energies has been compared using different scaling variables. A similar approach and models will be used for neutron flow simulation nucleus–nucleus collisions at the energy range of the BM@N experiment. The results would be useful as predictions for the upcoming beam energy scan experiments: BM@N at Nuclotron and MPD at NICA Collider.
Funding
This research was conducted in INR RAS and is supported by the RSF grant No. 22-12-00132.
Institutional Review Board Statement
Not applicable.
Informed Consent Statement
Not applicable.
Data Availability Statement
Not applicable.
Acknowledgments
We thank Andrey Moshkin from the MPD collaboration (NICA) for the help with production of the reconstructed data used in the analysis. Computational resources were provided by the NRNU MEPhI high-performance computing center and NICA high-performance cluster of LHEP JINR.
Conflicts of Interest
The authors declare no conflict of interest. The funders had no role in the design of the study; in the collection, analyses, or interpretation of data; in the writing of the manuscript, or in the decision to publish the results.
References
Bzdak, A.; Esumi, S.; Koch, V.; Liao, J.; Stephanov, M.; Xu, N. Mapping the phases of quantum chromodynamics with beam energy scan. Phys. Rep.2020, 853, 1–87. [Google Scholar] [CrossRef] [Green Version]
Esumi, S. Results from beam energy scan program at RHIC-STAR. In Proceedings of the International Conference on Critical Point and Onset of Deconfinement, Berlin, Germany, 15–19 March 2021; p. 1. [Google Scholar] [CrossRef]
Kowalski, S. Highlights from NA61/SHINE. In Proceedings of the International Conference on Critical Point and Onset of Deconfinement, Berlin, Germany, 15–19 March 2022; p. 2. [Google Scholar] [CrossRef]
Senger, P. The heavy-ion program at the upgraded BM@N Experiment at NICA. In Proceedings of the International Conference on Critical Point and Onset of Deconfinement, Berlin, Germany, 15–19 March 2022; p. 33. [Google Scholar] [CrossRef]
Adamczewski-Musch, J.; Asal, C.; Belyaev, A.; Blanco, A.; Blume, C.; Chlad, L.; Chudob, P.; Ciepal, I.; Dittert, D.; Dreyer, J.; et al. HADES and the QCD phase diagram. In Proceedings of the International Conference on Critical Point and Onset of Deconfinement, Berlin, Germany, 15–19 March 2022; p. 3. [Google Scholar] [CrossRef]
Senger, P. Astrophysics with heavy-ion beams. Phys. Scripta2021, 96, 054002. [Google Scholar] [CrossRef]
Abgaryan, V.; Acevedo Kado, R.; Afanasyev, S.V.; Agakishiev, G.N.; Alpatov, E.; Altsybeev, G.; Alvarado Hernández, M.; Andreeva, S.V.; Andreeva, T.V.; Andronov, E.V.; et al. Status and initial physics performance studies of the MPD experiment at NICA. Eur. Phys. J. A2022, 58, 140. [Google Scholar] [CrossRef]
Ablyazimov, T.; Abuhoza, A.; Adak, R.P.; Adamczyk, M.; Agarwal, K.; Aggarwal, M.M.; Ahammed, Z.; Ahmad, F.; Ahmad, N.; Ahmad, S.; et al. Challenges in QCD matter physics - The scientific programme of the Compressed Baryonic Matter experiment at FAIR. Eur. Phys. J. A.2017, 53, 60. [Google Scholar] [CrossRef] [Green Version]
Voloshin, S.A.; Poskanzer, A.M.; Snellings, R. Collective phenomena in non-central nuclear collisions. Landolt-Bornstein2010, 23, 293. [Google Scholar] [CrossRef] [Green Version]
Russotto, P.; Wu P., Z.; Zoric, M.; Chartier, M.; Leifels, Y.; Lemmon, R.C. Symmetry energy from elliptic flow in 197Au +197Au. Phys. Lett. B2011, 697, 471–476. [Google Scholar] [CrossRef]
Cozma, M.D. Neutron-proton elliptic flow difference as a probe for the high density dependence of the symmetry energy. Phys. Lett. B2011, 700, 139–144. [Google Scholar] [CrossRef] [Green Version]
Pinkenburg, C.; Ajitan, N.N.; Alexander, J.M.; Anderson, M.; Best, D.; Brady, F.P.; Case, T.; Caskey, W.; Cebra, D.; Chance, J.L.; et al. Elliptic flow: Transition from out-of-plane to in-plane emission in Au + Au collisions. Phys. Rev. Lett.1999, 83, 1295–1298. [Google Scholar] [CrossRef] [Green Version]
Liu, H.; Ajitan, N.N.; Alex, J.M.; Anderson, M.; Best, D.; Brady, F.P.; Case, T.; Caskey, W.; Cebra, D.; Chance, J.; et al. Sideward flow in Au + Au collisions between 2-A-GeV and 8-A-GeV. Phys. Rev. Lett.2000, 84, 5488–5492. [Google Scholar] [CrossRef]
Chung, P. Differential elliptic flow in 2-A-GeV - 6-A-GeV Au + Au collisions: A New constraint for the nuclear equation of state. Phys. Rev. C2002, 66, 021901. [Google Scholar] [CrossRef] [Green Version]
Abdallah, M.S. Disappearance of partonic collectivity in = 3 GeV Au + Au collisions at RHIC. Phys. Lett. B2022, 827, 137003. [Google Scholar] [CrossRef]
Adam, J. Flow and interferometry results from Au + Au collisions at = 4.5 GeV. Phys. Rev. C2021, 103, 034908. [Google Scholar] [CrossRef]
Adamczewski-Musch, J. Directed, Elliptic, and Higher Order Flow Harmonics of Protons, Deuterons, and Tritons in Au+Au Collisions at = 2.4 GeV. Phys. Rev. Lett.2020, 125, 262301. [Google Scholar] [CrossRef] [PubMed]
Danielewicz, P.; Lacey, R.; Lynch W., G. Determination of the equation of state of dense matter, 2002, 298, 1592–1596. Science2002, 298, 1592–1596. [Google Scholar] [CrossRef] [Green Version]
Oliinychenko, D.; Sorensen, A.; Koch, V.; McLerran, L. Sensitivity of Au + Au collisions to the symmetric nuclear matter equation of state at 2–5 nuclear saturation densities. arXiv arXiv:2208.11996, 2022.
Bleicher, M.; Zabrodin, E.; Spieles, C.; Bass, S.A.; Ernst, C.; Soff, S.; Bravina, L.; Belkacem, M.; Weber, H.; Stoecker, H.; et al. Relativistic hadron hadron collisions in the ultrarelativistic quantum molecular dynamics model. J. Phys. G1999, 25, 1859–1896. [Google Scholar] [CrossRef] [Green Version]
Bass, S.A.; Belkacem, M.; Bleicher, M.; Brandstetter, M.; Bravina, L.; Ernst, C.; Gerland, L.; Hofmann, M.; Hofmann, S.; Konopka, J.; et al. Microscopic models for ultrarelativistic heavy ion collisions. Prog. Part. Nucl. Phys.1998, 41, 255–369. [Google Scholar] [CrossRef]
Aichelin, J.; Bratkovskaya, E.; Le Fèvre, A.; Kireyeu, V.; Kolesnikov, V.; Leifels, Y.; Voronyuk, V.; Coci, G. Parton-hadron-quantum-molecular dynamics: A novel microscopic n-body transport approach for heavy-ion collisions, dynamical cluster formation, and hypernuclei production. Phys. Rev. C2020, 101, 044905. [Google Scholar] [CrossRef]
Baznat, A.; Botvina, A.; Musulmanbekov, G.; Toneev, V.; Zhezher, V. Monte-Carlo Generator of Heavy Ion Collisions DCM-SMM. Phys. Part. Nucl. Lett.2020, 17, 303–324. [Google Scholar] [CrossRef]
Nara, Y. JAM: An event generator for high energy nuclear collisions. EPJ Web Conf.2019, 208, 11004. [Google Scholar] [CrossRef] [Green Version]
Nara, Y.; Stoecker, H. Sensitivity of the excitation functions of collective flow to relativistic scalar and vector meson interactions in the relativistic quantum molecular dynamics model RQMD.RMF. Phys. Rev. C2019, 100, 054902. [Google Scholar] [CrossRef] [Green Version]
Nara, Y.; Maruyama, T.; Stoecker, H. Momentum-dependent potential and collective flows within the relativistic quantum molecular dynamics approach based on relativistic mean-field theory. Phys. Rev. C2020, 102, 024913. [Google Scholar] [CrossRef]
Adamczyk, L. Elliptic flow of identified hadrons in Au + Au collisions at = 7.7–62.4 GeV. Phys. Rev. C2013, 88, 014902. [Google Scholar] [CrossRef]
Adamczewski-Musch, J. Centrality determination of Au + Au collisions at 1.23 A GeV with HADES. Eur. Phys. J. A2018, 54, 85. [Google Scholar] [CrossRef] [Green Version]
Parfenov, P.; Idrisov, D.; Luong, V.B.; Taranenko, A. Relating Charged Particle Multiplicity to Impact Parameter in Heavy-Ion Collisions at NICA Energies. Particles2021, 4, 275–287. [Google Scholar] [CrossRef]
Parfenov, P. Performance for Directed Flow Measurements of the MPD Experiment at NICA Collider. Phys. Part. Nucl.2021, 52, 618–623. [Google Scholar] [CrossRef]
Demanov, A.; Parfenov, P.; Taranenko, A. Evolution of elliptic flow of produced particles from Au + Au collisions at = 4.5–200 Gev in a hybrid model. AIP Conf. Proc.2021, 2377, 030003. [Google Scholar] [CrossRef]
Lan, S.W.; Shi, S.S. Anisotropic flow in high baryon density region, Nucl. Sci. Tech.2022, 33, 21. [Google Scholar] [CrossRef]
Cassing, W.; Bratkovskaya, E. Hadronic and electromagnetic probes of hot and dense nuclear matter. Phys. Rept.1999, 308, 65–233. [Google Scholar] [CrossRef]
Song, T.; Tolos, L.; Wirth, J.; Aichelin, J.; Bratkovskaya, E. In-medium effects in strangeness production in heavy-ion collisions at (sub)threshold energies. Phys. Rev. C2021, 103, 044901. [Google Scholar] [CrossRef]
Larionov, A.B.; Cassing, W.; Greiner, C.; Mosel, U. Squeezeout of nuclear matter in peripheral heavy ion collisions and momentum dependent effective interactions. Phys. Rev. C2000, 62, 064611. [Google Scholar] [CrossRef] [Green Version]
Taranenko, A. Scaling properties of azimuthal anisotropy of mesons and baryons at RHIC. Acta Phys. Hung. A2006, 25, 371–379. [Google Scholar] [CrossRef] [Green Version]
Taranenko, A. PHENIX studies of the scaling properties of elliptic flow at RHIC. J. Phys. G2007, 34, S1069–S1072. [Google Scholar] [CrossRef] [Green Version]
Zhang, C.; Chen, J.; Luo, X.; Liu, F.; Nara, Y. Beam energy dependence of the squeeze-out effect on the directed and elliptic flow in Au + Au collisions in the high baryon density region. Phys. Rev. C2018, 97, 064913. [Google Scholar] [CrossRef]
Figure 1.
The reference multiplicity distributions of charged particles for Au + Au collisions at energies GeV for the mean-field mode JAM (left) and UrQMD (right) models.
Figure 1.
The reference multiplicity distributions of charged particles for Au + Au collisions at energies GeV for the mean-field mode JAM (left) and UrQMD (right) models.
Figure 2.
The reference multiplicity distributions of charged particles for Au + Au collisions at GeV from the DCM-QGSM-SMM (a), UrQMD (b) and JAM MD2 (c) models compared to the fitted distributions using MC-Glauber approach (blue line). The 10% centrality classes defined with MC-Glauber normalization are indicated with black vertical lines. Bottom plots show the ratio of the resulted MC-Glauber fit functions to the charged particle multiplicity distribution.
Figure 3.
Transverse momentum () dependence of elliptic flow of pions (a) and protons (b) in the 0–30% central Au + Au collisions at GeV. The black closed symbols denote the published data from the STAR experiment [16]. The purple and green bands represent the results from the cascade mode of UrQMD and JAM models, respectively. The uncertainties of the simulated model data are statistical.
Figure 4.
dependence of anisotropic flow coefficients , , and of protons (a–d) in the 20–30% central Au + Au collisions at GeV. The black-closed symbols denote the published data from the HADES experiment [17]. The red, green and purple bands represent the results from the cascade mode of DCM-QGSM-SMM, JAM, and UrQMD models, respectively. The uncertainties of the simulated model data are statistical.
Figure 5.
Rapidity () dependence of anisotropic flow coefficients , , and of protons (a–d) in the 20–30% central Au + Au collisions at GeV. The black-closed symbols denote the published data from the HADES experiment [17]. The red, green and purple bands represent the results from the cascade mode of DCM-QGSM-SMM, JAM, and UrQMD models, respectively. The uncertainties of the simulated model data are statistical.
Figure 6.
dependence of anisotropic flow coefficients , , and of protons (a–d) in the 20–30% central Au + Au collisions at GeV. The black closed symbols denote the published data from the HADES experiment [17]. The blue (MD2), purple (MD4), red (NS1) and yellow (NS2) bands represent the results from the mean-field mode of the JAM model with different EOS, as indicated. The uncertainties of the simulated model data are statistical.
Figure 7.
Rapidity () dependence of anisotropic flow coefficients , , and of protons (a–d) in the 20–30% central Au + Au collisions at GeV. The black closed symbols denote the published data from the HADES experiment [17]. The blue (MD2), purple (MD4), red (NS1) and yellow (NS2) bands represent the results from the mean-field mode of the JAM model with different EOS, as indicated. The uncertainties of the simulated model data are statistical.
Figure 8.
dependence of anisotropic flow coefficients , , and of protons (a–d) in the 20–30% central Au + Au collisions at GeV. The black closed symbols denote the published data from the HADES experiment [17]. The red and blue bands represent the results from the mean-field mode of UrQMD and JAM MD2 models, respectively. The uncertainties of the simulated model data are statistical.
Figure 9.
Rapidity () dependence of anisotropic flow coefficients , , and of protons (a–d) in the 20–30% central Au + Au collisions at GeV. The black closed symbols denote the published data from the HADES experiment [17]. The red and blue bands represent the results from the mean-field mode of UrQMD and JAM MD2 models, respectively. The uncertainties of the simulated model data are statistical.
Figure 10.
Rapidity () dependence of (a–c) and (d–f) of proton (a,d), charged pions (b,e) and charged kaons (c,f) in 10–40% central Au + Au collisions at GeV. The symbols denote the published data from the STAR experiment [15]. The blue (MD2), purple (MD4), red (NS1) and yellow (NS2) bands represent the results from the mean-field mode of the JAM model with different EOS, as indicated. The uncertainties of the simulated model data are statistical.
Figure 11.
dependence of elliptic flow of pions (a) and protons (b) in 10–40% central Au + Au collisions at GeV. The symbols denote the published data from the STAR experiment [15]. The blue (MD2), purple (MD4), red (NS1) and yellow (NS2) bands represent the results from the mean-field mode of the JAM model with different EOS, as indicated. The uncertainties of the simulated model data are statistical.
Figure 12.
Rapidity () dependence of (a–c) and (d–f) of proton (a,d), charged pions (b,e) and charged kaons (c,f) in 10–40% central Au + Au collisions at GeV. The symbols denote the published data from the STAR experiment [15]. The red and green bands represent the results from PHQMD model with hard ( = 380 MeV) and soft ( = 200 MeV) EOS, respectively. The purple bands represent the results from the HSD model. The uncertainties of the simulated model data are statistical.
Figure 13.
dependence of elliptic flow of pions (a) and protons (b) in 10–40% central Au + Au collisions at GeV. The symbols denote the published data from the STAR experiment [15]. The red and green bands represent the results from PHQMD model with hard ( = 380 MeV) and soft ( = 200 MeV) EOS, respectively. The purple bands represent the results from the HSD model. The uncertainties of the simulated model data are statistical.
Figure 14.
dependence of anisotropic flow coefficients , , and of protons (a–d) in the 10–40% central Au + Au collisions at GeV. Different symbols correspond to the results obtained for different beam energies from GeV (blue closed circles) to GeV (brown down-pointing triangles) using the JAM model with hard momentum dependent mean-field MD2 ( = 380 MeV) EOS.
Figure 15.
Rapidity () dependence of anisotropic flow coefficients , , and of protons (a–d) in the 10–40% central Au + Au collisions at GeV. Different symbols correspond to the results obtained for different beam energies from GeV (blue closed circles) to GeV (brown down-pointing triangles) using the JAM model with hard momentum dependent mean-field MD2 ( = 380 MeV) EOS.
Figure 16.
Scaled rapidity () dependence of anisotropic flow coefficients , , and of protons (a–d) in the 10–40% central Au + Au collisions at GeV. Different symbols correspond to the results obtained for different beam energies from GeV (blue closed circles) to GeV (brown down-pointing triangles) using the JAM model with hard momentum dependent mean-field MD2 ( = 380 MeV) EOS.
Figure 17.
Scaled rapidity () dependence of of protons in the central 0–10% (a,d), midcentral 10–40% (b,e) and peripheral 40–80% (c,f) Au + Au collisions at GeV. The full symbols correspond to the JAM model with soft momentum dependent mean-field MD4 ( = 220 MeV) EOS and open symbols to the hard MD2 ( = 380 MeV) EOS.
Figure 18.
Collision energy dependence of of protons in the transverse momentum interval 0.4 < < 2.0 GeV/c and rapidity interval 0.1 (left panel) and 0.4 (right panel). Different symbols represent the intervals in collision centrality of Au + Au collisions, as indicated. The results for JAM model with hard momentum dependent mean-field MD2 ( = 380 MeV) EOS.
Figure 19.
Impact parameter dependence of directed flow of protons in the transverse momentum interval 1.0 < < 1.5 GeV/c and rapidity interval -0.5-0.15 from Au + Au collisions at beam energies GeV (panel (a)), GeV (panel (b)), and GeV (panel (c)). Different symbols correspond to the different EOS implementations in the JAM model: soft momentum independent NS2 ( = 210 MeV), hard momentum independent NS1 ( = 380 MeV), soft momentum dependent MD4 ( = 210 MeV) and hard momentum dependent MD2 and MD3 ( = 380 MeV).
Figure 20.
Impact parameter dependence of elliptic flow of protons in the transverse momentum interval 1.0 < < 1.5 GeV/c at mid-rapidity 0.2 from Au + Au collisions at beam energies GeV (panel (a)), GeV (panel (b)), and GeV (panel (c)). Different symbols correspond to the different EOS implementations in the JAM model: soft momentum independent NS2 ( = 210 MeV), hard momentum independent NS1 ( = 380 MeV), soft momentum dependent MD4 ( = 210 MeV) and hard momentum dependent MD2 and MD3 ( = 380 MeV).
Figure 21.
Impact parameter dependence of triangular flow of protons in the transverse momentum interval 1.0 < < 1.5 GeV/c and rapidity interval −0.5-0.15 from Au + Au collisions at beam energies GeV (panel (a)), GeV (panel (b)), and GeV (panel (c)). Different symbols correspond to the different EOS implementations in the JAM model: soft momentum independent NS2 ( = 210 MeV), hard momentum independent NS1 ( = 380 MeV), soft momentum dependent MD4 ( = 210 MeV) and hard momentum dependent MD2 and MD3 ( = 380 MeV).
Figure 22.
Impact parameter dependence of quadrangular flow of protons in the transverse momentum interval 1.0 < < 1.5 GeV/c at mid-rapidity 0.2 from Au + Au collisions at beam energies GeV (panel (a)), GeV (panel (b)), and GeV (panel (c)). Different symbols correspond to the different EOS implementations in the JAM model: soft momentum independent NS2 ( = 210 MeV), hard momentum independent NS1 ( = 380 MeV), soft momentum dependent MD4 ( = 210 MeV) and hard momentum dependent MD2 and MD3 ( = 380 MeV).
Figure 23.
Scaled impact parameter dependence of directed flow of protons in the transverse momentum interval 1.0 < < 1.5 GeV/c and rapidity interval −0.5−0.15 from Au + Au (closed circles), Xe + Cs (open triangles), Ag + Ag (closed boxes) collisions at energies GeV (panel (a)), GeV (panel (b)), 3 GeV (panel (c)) and GeV (panel (d)). The results for JAM model with hard momentum dependent mean-field MD2 ( = 380 MeV) EOS.
Figure 24.
Scaled impact parameter dependence of elliptic flow of protons in the transverse momentum interval 1.0 < < 1.5 GeV/c at mid-rapidity 0.2 from Au + Au (closed circles), Xe + Cs (open triangles), Ag + Ag (closed boxes) collisions at energies GeV (panel (a)), GeV (panel (b)), 3 GeV (panel (c)) and GeV (panel (d)). The results for JAM model with hard momentum dependent mean-field MD2 ( = 380 MeV) EOS.
Figure 25.
Scaled impact parameter dependence of triangular flow of protons in the transverse momentum interval 1.0 < < 1.5 GeV/c and rapidity interval −0.5−0.15 from Au + Au (closed circles), Xe + Cs (open triangles), Ag + Ag (closed boxes) collisions at energies GeV (panel (a)), GeV (panel (b)), 3 GeV (panel (c)) and GeV (panel (d). The results for JAM model with hard momentum dependent mean-field MD2 ( = 380 MeV) EOS.
Figure 26.
Scaled impact parameter dependence of quadrangular flow of protons in the transverse momentum interval 1.0 < < 1.5 GeV/c at mid-rapidity 0.2 from Au + Au (closed circles), Xe + Cs (open triangles), Ag + Ag (closed boxes) collisions at energies GeV (panel (a)), GeV (panel (b)), 3 GeV (panel (c)) and GeV (panel (d). The results for JAM model with hard momentum dependent mean-field MD2 ( = 380 MeV) EOS.
Figure 27.
(Left panel): dependence of of protons from Au + Au collisions at GeV for different bins in collision centrality. (Right panel): (centrality, ) divided by k = 0.25 times the integrated value |(int,centrality)| for an each bin in centrality. The results for JAM model with hard momentum dependent mean-field MD2 ( = 380 MeV) EOS.
Figure 28.
(centrality, ) divided by k = 0.25 times the integrated value |(int,centrality)| for protons from Au + Au and Xe + Cs collisions at GeV (left panel) and GeV (right panel). The results for JAM model with hard momentum dependent mean-field MD2 ( = 380 MeV) EOS.
Figure 28.
(centrality, ) divided by k = 0.25 times the integrated value |(int,centrality)| for protons from Au + Au and Xe + Cs collisions at GeV (left panel) and GeV (right panel). The results for JAM model with hard momentum dependent mean-field MD2 ( = 380 MeV) EOS.
Publisher’s Note: MDPI stays neutral with regard to jurisdictional claims in published maps and institutional affiliations.
Parfenov, P.
Model Study of the Energy Dependence of Anisotropic Flow in Heavy-Ion Collisions at = 2–4.5 GeV. Particles2022, 5, 561-579.
https://doi.org/10.3390/particles5040040
AMA Style
Parfenov P.
Model Study of the Energy Dependence of Anisotropic Flow in Heavy-Ion Collisions at = 2–4.5 GeV. Particles. 2022; 5(4):561-579.
https://doi.org/10.3390/particles5040040
Chicago/Turabian Style
Parfenov, Petr.
2022. "Model Study of the Energy Dependence of Anisotropic Flow in Heavy-Ion Collisions at = 2–4.5 GeV" Particles 5, no. 4: 561-579.
https://doi.org/10.3390/particles5040040
Article Metrics
No
No
Article Access Statistics
For more information on the journal statistics, click here.
Multiple requests from the same IP address are counted as one view.
Parfenov, P.
Model Study of the Energy Dependence of Anisotropic Flow in Heavy-Ion Collisions at = 2–4.5 GeV. Particles2022, 5, 561-579.
https://doi.org/10.3390/particles5040040
AMA Style
Parfenov P.
Model Study of the Energy Dependence of Anisotropic Flow in Heavy-Ion Collisions at = 2–4.5 GeV. Particles. 2022; 5(4):561-579.
https://doi.org/10.3390/particles5040040
Chicago/Turabian Style
Parfenov, Petr.
2022. "Model Study of the Energy Dependence of Anisotropic Flow in Heavy-Ion Collisions at = 2–4.5 GeV" Particles 5, no. 4: 561-579.
https://doi.org/10.3390/particles5040040


