1. Introduction
The brain utilizes an outsized proportion of total body energy to maintain normal neurological function, and depends upon continuous provision of its principal substrate fuel glucose. Sensory cues for brain cell metabolic stability are generated in select neural structures, including the hypothalamus, and appear to play an important role in modulating brain-glucose-regulatory mechanisms. Multiple metabolic sensor mechanisms operate in the brain, such as glucose monitoring at the key junctures of cellular uptake and entry into the glycolytic pathway. The facilitative glucose transporter, glucose transporter-2 (GLUT2), is an integral SLC2-gene-encoded membrane protein belonging to the major facilitator superfamily of membrane transporters [
1,
2,
3]. GLUT2 is unique compared to other GLUT family proteins as it exhibits relatively low affinity for glucose (Km = 17 mM); this feature is believed to enable transport of glucose corresponding to extracellular glucose levels typical of the broad physiological range and to not impede glucose uptake [
4]. GLUT2 is expressed in several brain cell types, including astrocytes and neurons [
5,
6]; GLUT2 activity within the former cell compartment is necessary for corrective systemic counter-regulatory responses to neuro-glucopenia [
7]. Astrocytes promote neuro-metabolic homeostasis by transferring glucose from the circulation to accumulate this energy substrate in the form of glycogen or to convert it to L-lactate for trafficking to neighboring neurons to support mitochondrial energy production [
8,
9,
10,
11,
12]. Astrocyte-derived lactate signaling controls hypothalamic neurotransmission affecting glucose contra-regulatory hormone release [
13,
14].
GLUT2 regulates multiple metabolic functions within hypothalamic astrocytes, including glycolytic pathway volume, glycogen mass and turnover, and cellular energy status, via as-yet-unknown mechanisms [
15]. Although the large cytoplasmic loop domain of GLUT2 monitors glucose after its transport across the plasma membrane [
16], the exact mechanism(s) mediating how this information regulates astrocyte activities is(are) currently unknown. Signal transduction pathways operate within a cell’s interior to link external or internal receptors to distinctive target substrates that effect an appropriate biological response [
17]. These signaling networks typically feature ordered protein cascades or modules. For example, there are multiple MAPK cascades, which operate within vital pathways that govern a wide range of cell functions, including cell proliferation, differentiation, and death [
18,
19,
20]. Extracellular cues activate upstream MAPK kinase (MAPKKK) that in turn activates and MAPK kinase (MAPKK), which subsequently activates MAPK. MAPK docking sites ensure activation by a specific MAPKK as well as recognition of particular protein targets. Three MAPK pathways are (1) extracellular-signal-regulated kinases (ERKs), (2) stress-activated protein kinases/Jun amino-terminal kinases (SAPK/JNKs), and (3) p38. In general, ERKs are involved in mediating mitogenic responses, whereas JNK and p38 MAPK cascades respond to environmental and cellular stresses. Previous studies have shown that kidney mesangial cells exposed to elevated glucose show elevated p38 MAPK activation [
21]. However, the role of MAPK in regulating astrocyte reactivity to glucose imbalance is unknown.
The project described herein made use of a validated primary cell culture model to investigate the hypothesis that GLUT2 imposes control of one or more of these critical protein cascades under conditions of glucose sufficiency and/or deficiency. Incorporation of a plan to investigate potential sex differences in GLUT2 regulation of hypothalamic astrocyte MAPK family protein expression and phosphorylation aligns with the current U.S. National Institutes of Health policy emphasis on consideration of sex as a critical biological variable. This focus is supported by reports that the MAPK profile is sex-dimorphic in several organs [
22,
23,
24,
25,
26] and is sensitive to estradiol [
27], and by recent findings that GLUT2 imposes sex-specific control of astrocyte glucose and glycogen metabolism [
15]. The work performed herein used siRNA gene silencing tools along with immunoblotting to determine if and how GLUT2 gene knockdown may affect total versus phosphorylated protein expression profiles for p44/21 MAPK (ERK1/2), p38 MAPK, and SAPK/JNK molecular-weight isoforms in glucose-supplied versus glucose-deprived hypothalamic astrocytes from each sex.
2. Materials and Methods
Primary astrocyte cell cultures: Primary astrocyte cultures of characterized high-purity were generated from hypothalami acquired via dissection of adult male or female rats 2–3 months of age, as previously stated [
28,
29,
30]. Protocols for animal use were in accordance with the NIH
Guide for the Care and Use of Laboratory Animals, 8th Edition, under approval by the ULM Institutional Animal Care and Use Committee. Briefly, trypsin-digested tissue blocks consisting of whole-hypothalamus were pipet-dissociated into a single-cell suspension in DMEM high-glucose media (prod. no. 12800-017; ThermoFisherScientific (ThermoFisherSci), Waltham, MA, USA) supplemented with 10.0% heat-inactivated fetal bovine serum (FBS; GE Healthcare Bio-Sciences, Pittsburgh, PA, USA) and 1.0% penicillin–streptomycin (prod. no. 15140-122, ThermoFisherSci.). Suspended dissociated cells were incubated (37 °C; 5% CO
2) in plating media in Poly-D-lysine (prod. no. A-003-E, MilliporeSigma, Burlington, MA, USA)-coated T75 culture flasks for two weeks before removal of microglia and oligodendrocytes [
28]. After further incubation, purified astrocytes were plated (1 × 10
6 cells/100 mm
2) in poly-D-lysine-coated culture in advance of experimentation. Routine Western blot and immunofluorescence cytochemical detection of the astrocyte marker protein glial fibrillary acidic protein (GFAP) showed that culture purity exceeded 95% [
28,
29,
30].
Experimental Design: Cultures reaching confluency of approximately 70% were incubated for 18 h in DMEM high-glucose media supplemented with 5.0% charcoal-stripped FBS (prod. no. 12676029; ThermoFisherSci.). Astrocytes from each sex were pretreated with incubation for 72 h in high-glucose DMEM media containing Accell™ control non-targeting pool (scramble; SCR) siRNA (prod. no. D-001910-10-20, 5.0 nM; Horizon Discovery, Waterbeach, UK) or Accell™ rat GLUT2 siRNA (prod. no. A-099803-14-0010, 5.0 mM, Horizon Disc.) dissolved in siRNA buffer (prod. no. B-002000-UB-100; Horizon Discovery), using reported methods [
15]. This knockdown paradigm results in approximate 50% reductions in gene product expression across all treatment groups [
15]. SCR or GLUT2-siRNA-pretreated astrocytes were incubated for 8 h with 10 nM 17β-estradiol [
28]-supplemented HBSS media containing 5.5 mM (G
5.5) or 0 mM (G
0) glucose. Cells were detached for suspension in lysis buffer, e.g., 2.0% sodium dodecyl sulfate, 10.0% glycerol, 5% β-mercaptoethanol, 1 mM sodium orthovanadate, 60 mM Tris-HCl, pH 6.8.
Western Blot Analysis: Astrocyte cell pellets were heat-denatured for 10 min, at 95 °C, prior to sonication, centrifugation, and dilution with 2x Laemmli buffer. NanoDrop spectrophotometric (prod. no. ND-ONE-W, ThermoFisherSci.) measurement of lysate protein concentrations was performed. For each protein of interest, sample aliquots of equivalent protein mass for each treatment group were separated via electrophoresis in Bio-Rad Stain Free 10% acrylamide gels (prod. no 161-0183, Bio-Rad, Hercules, CA, USA); analyses were performed in triplicate. Bio-Rad Stain-Free imaging technology for total protein measurement was used as the loading control, as previously described [
31]. After electrophoresis, gels were activated (1 min) in a Bio-Rad ChemiDoc™ Touch Imaging System; proteins were then transferred to 0.45 µm PVDF-Plus membranes (prod. no. 1212639; Data Support Co., Panorama City, CA, USA). Triplicate independent experiments, each involving a minimum of three separate astrocyte collections, were carried out, as previously described [
28,
29,
30]. Freedom Rocker™ Blotbot
® automation (Next Advance, Inc., Troy, NY, USA) was used to perform membrane buffer washes and antibody incubations. Membranes were blocked for 2 hr with Tris-buffered saline (TBS), pH 7.4, supplemented with 0.2 % Tween-20 (prod. no. 9005-64-5; VWR, Radnor, PA, USA) and 2% bovine serum albumin (BSA) (prod. no. 9048-46-8; VWR), and then incubated for 24–48 h, at 4 °C, with a primary antiserum produced in rabbit against p44/42 MAPK (ERK1/2) (137F5 (prod. no. 4609; 1:1000; Cell Signaling Technol., Danvers, MA, USA; RRID: AB_390779; phospho-p44/42 MAPK (ERK1/2) (Thr202/Tyr204) (D13.14.4E) (prod. no. 4370: 1:1000; Cell Signal.; RRID: AB_2315112); p38 MAPK (D13E1) (prod. no. 8690; 1:1000; Cell Signal.; RRID: AB_10999090); phospho-p38 MAPK (Thr180/Tyr182) (D3F9) (prod. no. 4511; 1:1000; Cell Signal., RRID: AB_2139682); SAPK/JNK (prod. no. 9252; 1:1000; Cell Signal., RRID: AB_2250373); or phospho-SAPK/JNK (Thr183/Tyr185 (81E11) (prod. no. 4668; 1:1000; Cell Signal., RRID: AB_823588). Membranes were next incubated with goat anti-rabbit horseradish peroxidase-conjugated secondary antibodies (prod. no. NEF812001EA; 1:4000; PerkinElmer, Waltham, MA, USA; 1 h), followed by SuperSignal West Femto maximum sensitivity chemiluminescent substrate (prod. no. 34096; ThermoFisherSci.). Target protein optical density (O.D.) signals were quantified in the ChemiDoc™ Touch Imaging System described above. Bio-Rad Stain-Free gels contain a proprietary trihalo compound that is directly incorporated into the gel chemistry; this compound lacks inherent fluorescence, but renders in-gel proteins fluorescent upon UV photoactivation that is measurable by O.D. Software sums all individual protein optical densities in a single lane, and relates that total protein O.D. value to target protein O.D. in the same lane, thereby deriving a normalized O.D. value. The Y-axis label of each Western blot figure depicts this as mean normalized O.D. measures. This superior method for Western blot normalization markedly reduces data variability through improved measurement accuracy and precision [
32,
33]. Bio-Rad precision plus protein molecular-weight dual-color standards (prod. no. 161-0374) were included in each Western blot analysis.
Statistics: Mean normalized protein O.D. measures were analyzed among experimental groups using three-way analysis of variance and Student–Newman–Keuls post hoc test. An observed difference of p < 0.05 between treatment groups was considered significant. In each figure, statistical differences between two specific treatment groups are indicated by the following symbols: * p < 0.05; ** p < 0.01; *** p < 0.001.
3. Results
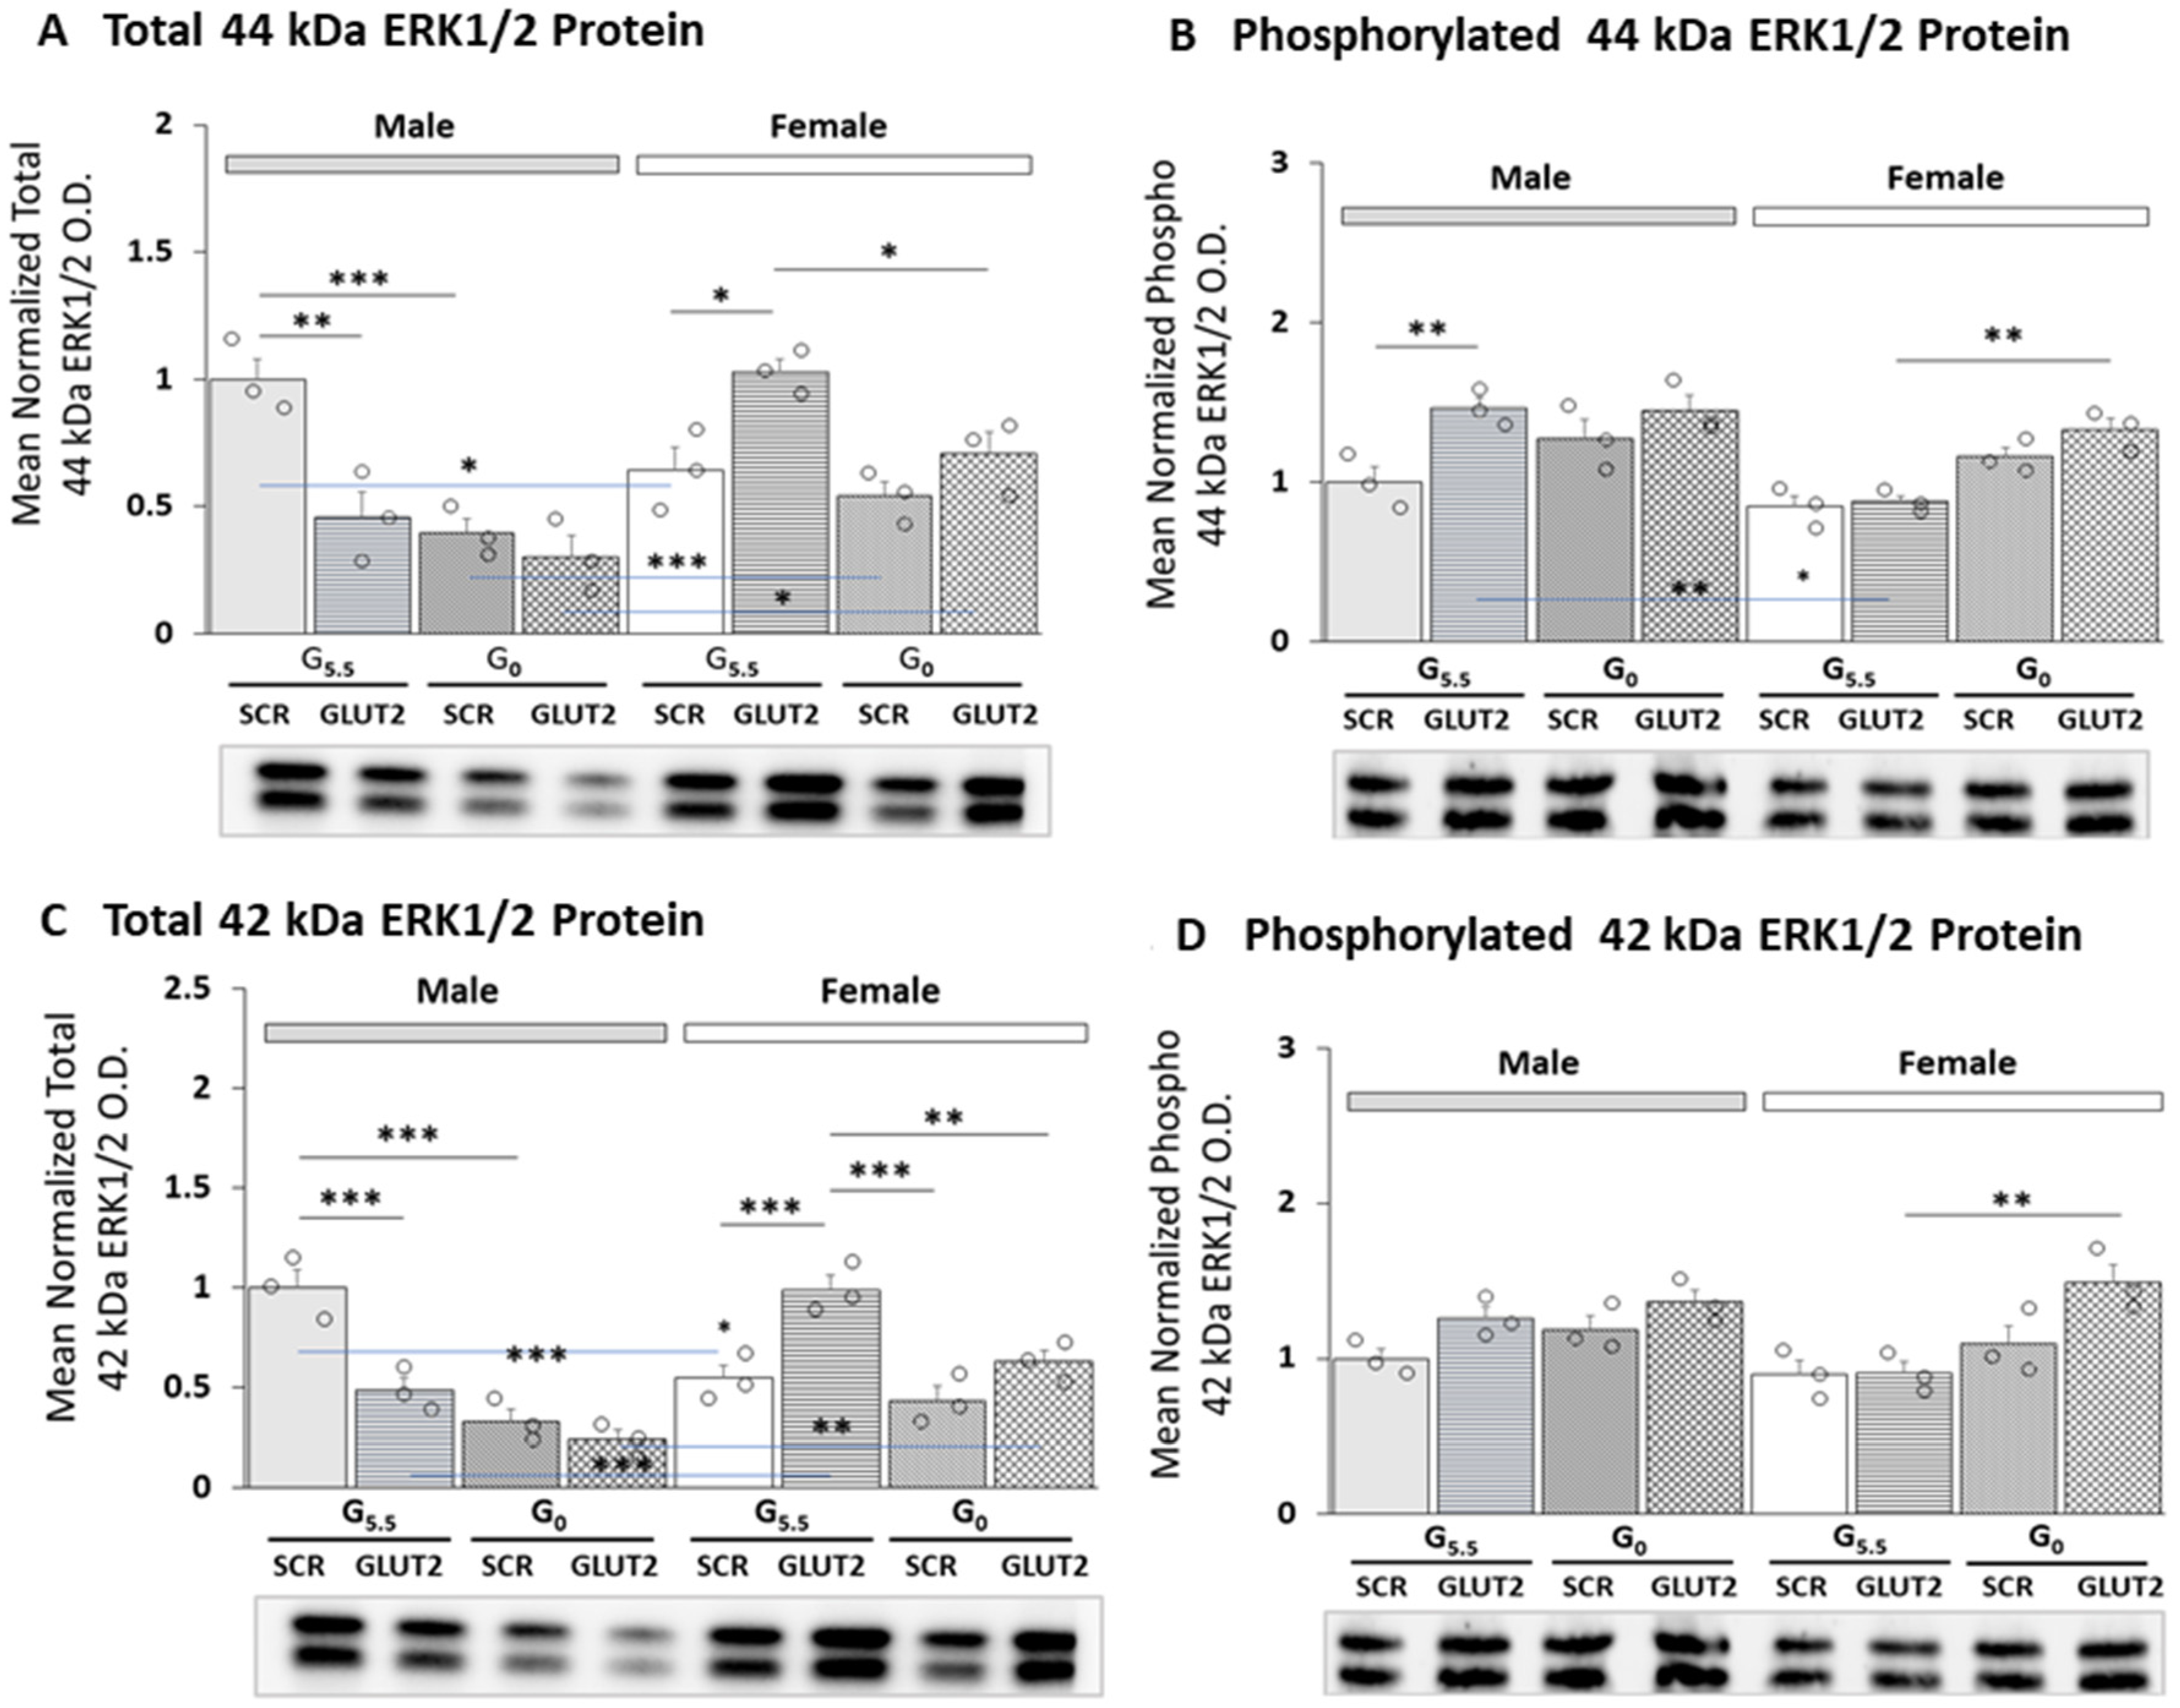
Current research utilized gene silencing tools and a validated hypothalamic primary astrocyte culture model to investigate the premise that GLUT2, a unique membrane glucose transporter and sensor, may regulate expression and/or phosphorylation of 44 and 42 kDa MAPK (ERK1/2) proteins in these glial cells according to sex. The results were evaluated via three-way ANOVA and Student–Newman–Keuls test using GraphPad Prism, Volume 8; statistical outcomes are shown in
Supplementary Table S1. The data presented in
Figure 1A,B depict GLUT2 siRNA pretreatment effects on total or phosphorylated 44 kDa ERK1/2 protein, respectively, in male (left; gray bars) or female (right; white bars) rat primary cultures. Baseline total protein expression was significantly higher in male versus female cultures (G
5.5/SCR siRNA—gray bar/male versus G
5.5/SCR siRNA—white bar/female). GLUT2 knockdown correspondingly decreased or increased total protein profiles in glucose-supplied male or female astrocytes (G
5.5/GLUT2 siRNA (horizontal-striped bars; M: gray, F: white) versus G
5.5/SCR siRNA (solid bars; M: gray, F: white)). The 44 kDa ERK1/2 protein levels were reduced in response to glucose withdrawal in males, but were unaffected by the absence of glucose in females (G
0/GLUT2 siRNA (diagonal-striped bars; M: gray, F: white) versus G
5.5/SCR siRNA (solid bars; M: gray, F: white)). Glucose withdrawal did not alter this profile protein in GLUT-siRNA-pretreated astrocytes of either sex (G
0/GLUT2 siRNA (cross-hatched bars; M: gray, F: white) versus G
0/SCR siRNA (diagonal-striped bars; M: gray, F: white)). The data in
Figure 1B show that phospho-44 kDa ERK1/2 protein was stimulated by (male) or refractory to (female) GLUT2 gene silencing in the presence of glucose. SCR- or GLUT2-siRNA-pretreated astrocytes of either sex exhibited no change in this protein profile due to glucose withdrawal.
Figure 1C,D illustrate GLUT2 gene knockdown on expression patterns of total or phosphorylated 42 kDa ERK1/2 protein, respectively, in male (left; gray bars) versus female (right; white bars) astrocytes. The outcomes of three-ANOVA and Student–Newman–Keuls statistical analyses of the data are presented in
Supplementary Table S1. The data show that similar to results described for the 44 kDa protein variant, total 42 kDa ERK1/2 enzyme isoform expression was elevated in glucose-supplied male versus female astrocytes, and GLUT2 siRNA caused opposite adjustments in this protein profile. Moreover, glucose withdrawal altered expression of this protein in males, but not females; GLUT2 gene silencing abolished this glucoprivic inhibitory effect in the former sex.
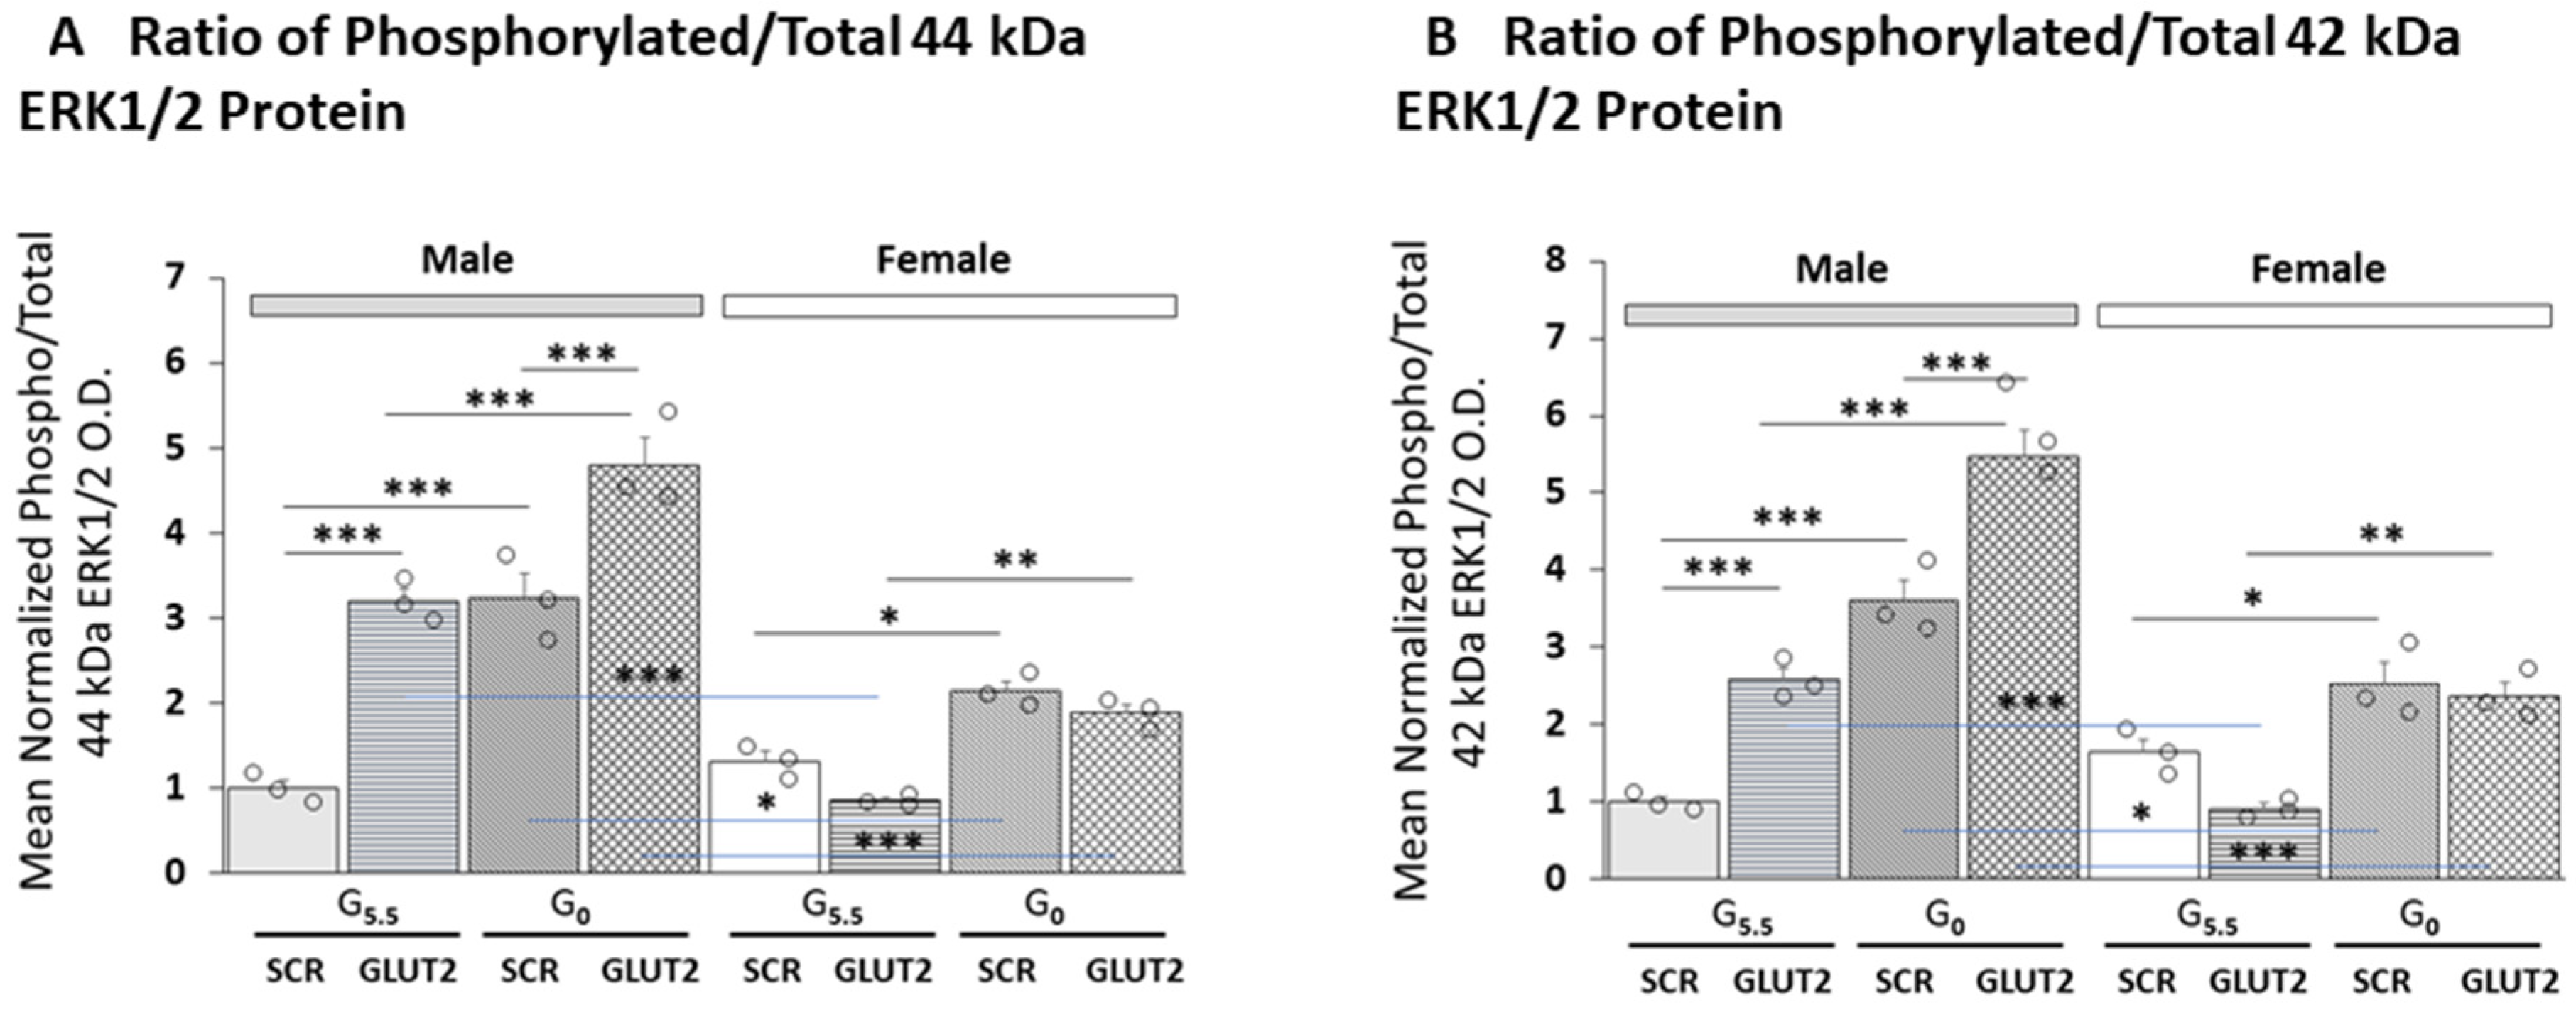
Effects of GLUT2 knockdown on mean ratios of phosphorylated/total 44 kDa and 42 kDa ERK1/2 protein expression in astrocytes of each sex are presented in
Figure 2A,B, respectively. The outcomes of statistical analyses are shown in
Supplementary Table S1. The data show that GLUT siRNA significantly increased (male astrocytes) or decreased (female astrocytes) the mean ratio value for the 44 kDa enzyme variant. Glucose-deprived astrocytes of each sex exhibited augmentation of the mean phospho/total 44 kDa ERK1/2 protein ratio; the magnitude of this increase was greater in males than females. GLUT siRNA pretreatment prior to glucoprivation resulted in significant exacerbation of this stimulatory response in males, but no change in this ratio was seen in females. The mean ratio of phosphorylated/total 42 kDa ERK1/2 protein was similarly inversed affected by GLUT2 gene silencing in glucose-supplied male versus female rat astrocytes; in the former sex, this ratio was significantly increased by GLUT siRNA in both G
5.5 and G
0 male astrocyte cultures.
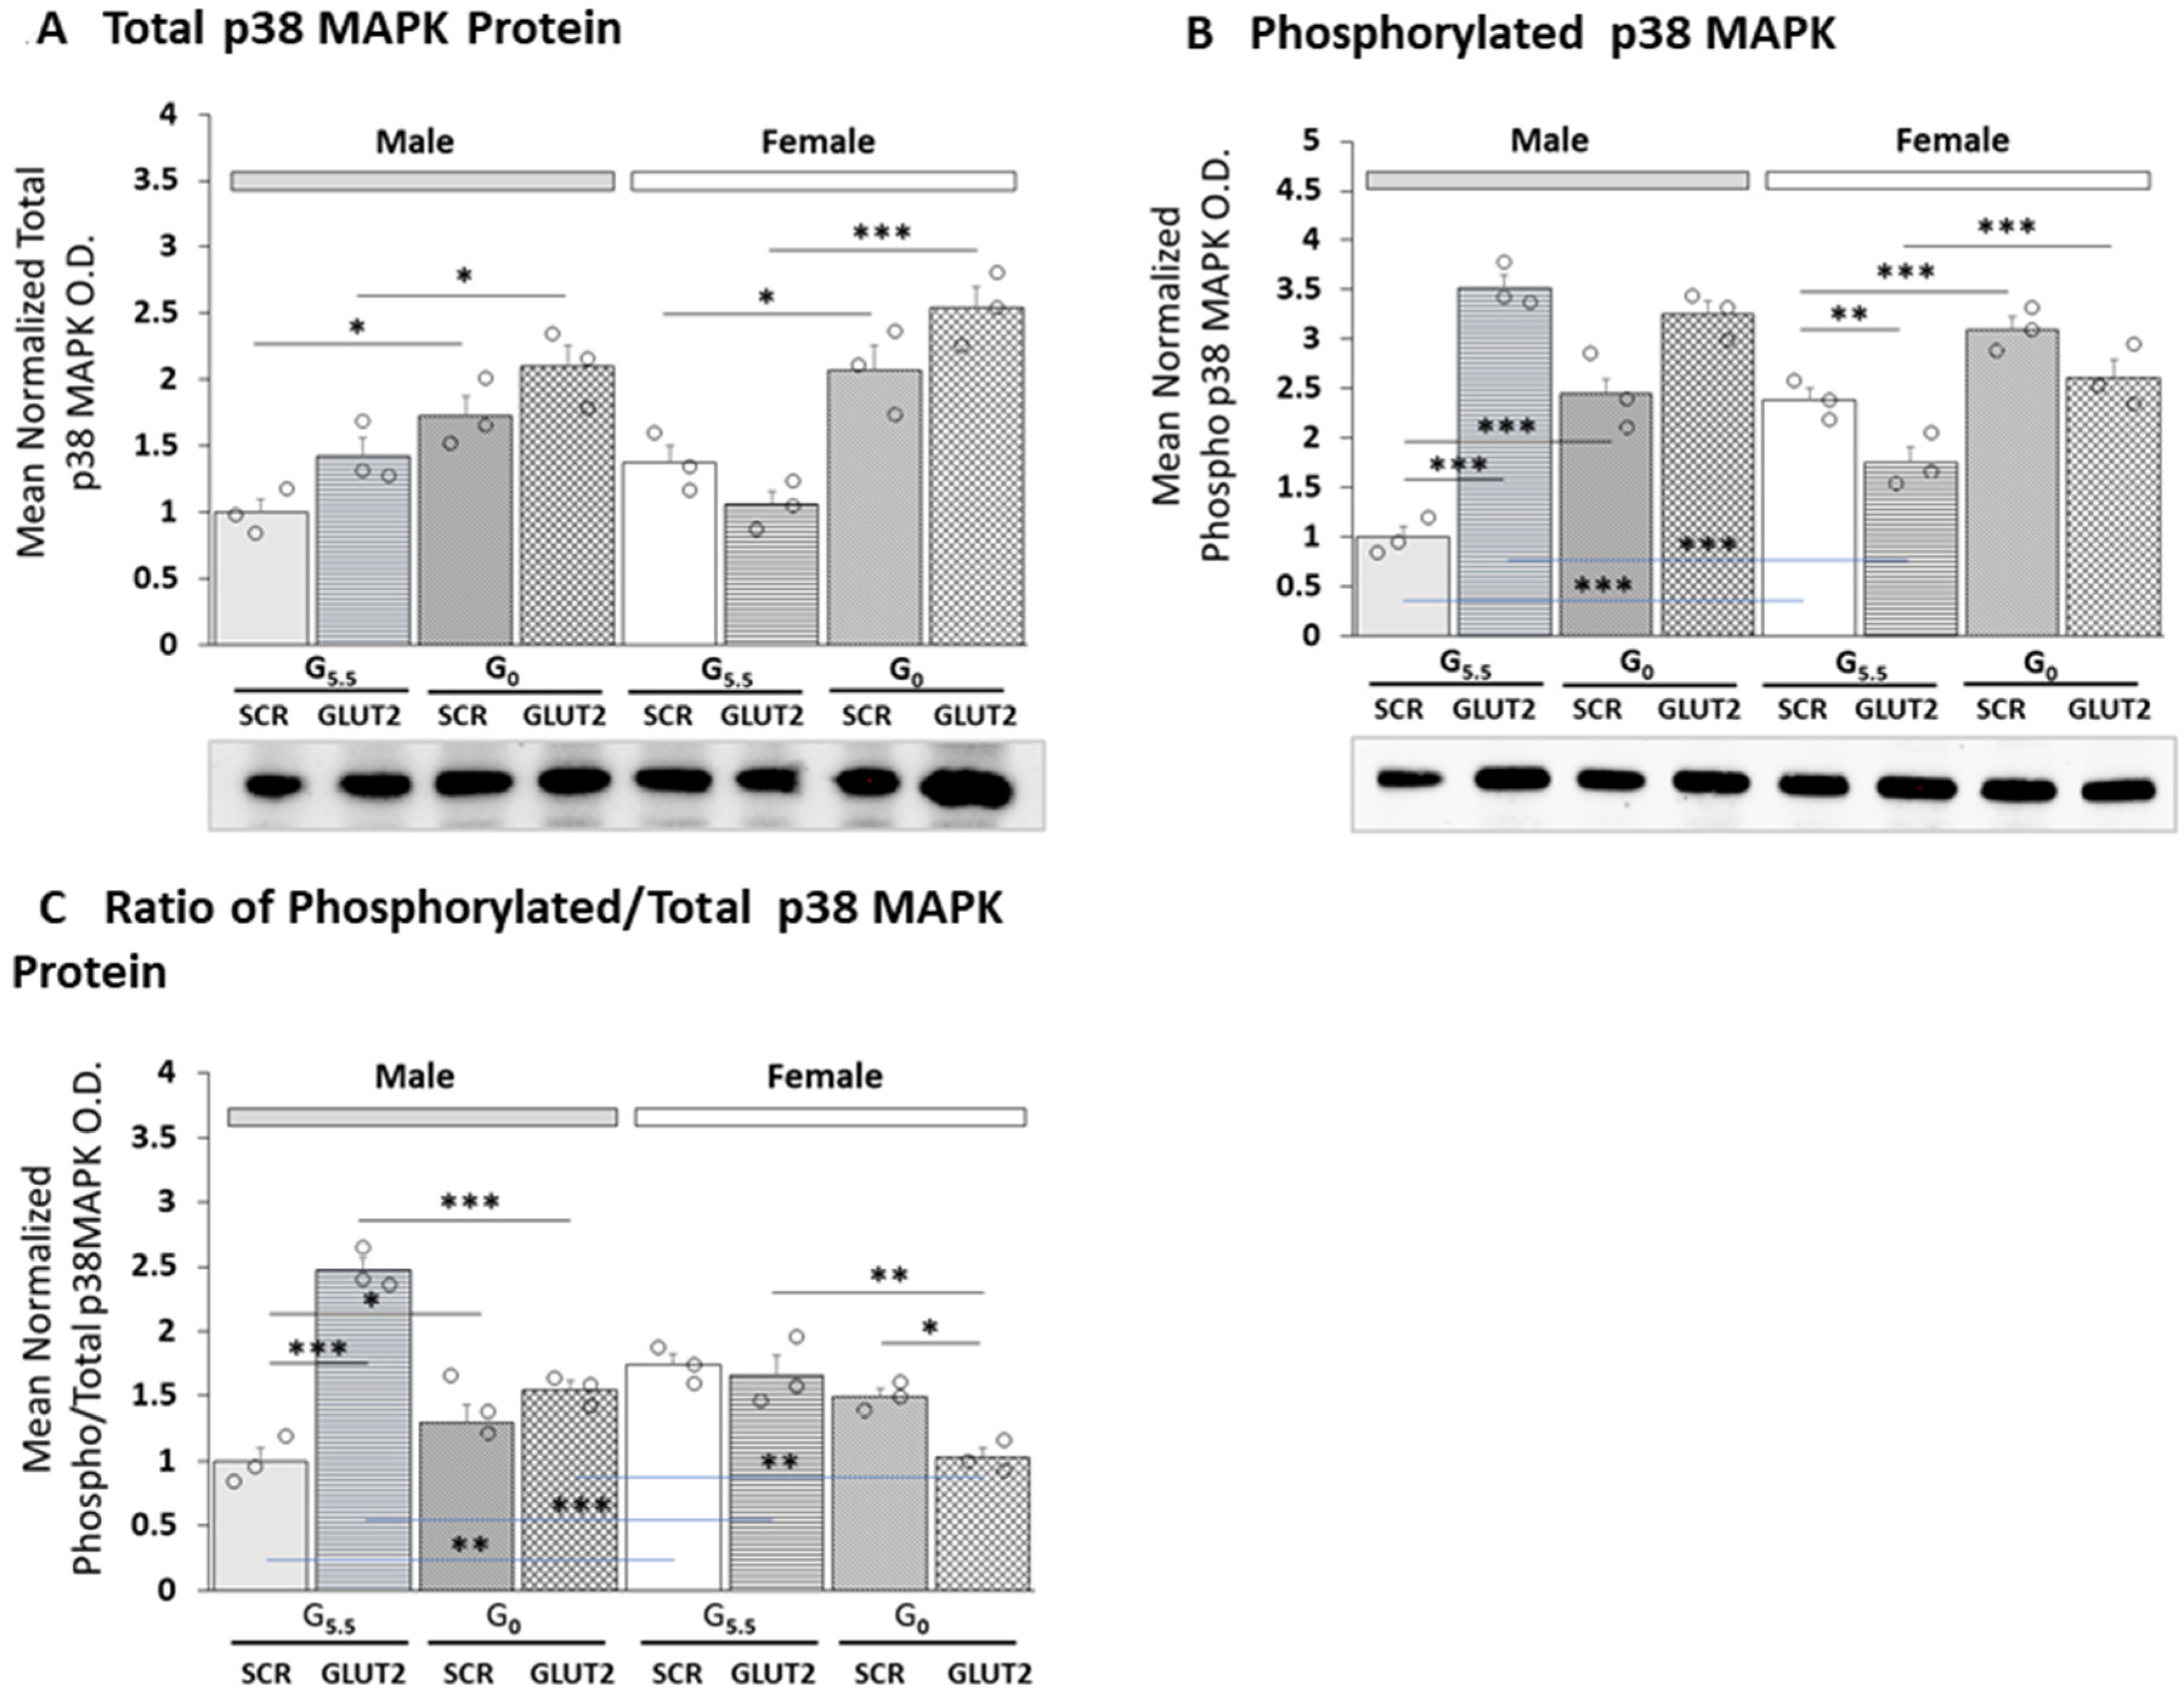
GLUT2 siRNA pretreatment effects on total and phosphorylated p38 MAPK protein expression in male versus female hypothalamic primary astrocyte culture are shown in
Figure 3A,B, respectively. The outcomes of three-way ANOVA and Student–Newman–Keuls statistical analyses of the data are presented in
Supplementary Table S1. Baseline levels of phosphorylated p38 MAPK, but not total protein, differed between the two sexes. The results show that total p38 MAPK protein levels were refractory to GLUT2 knockdown (
Figure 3A), yet this pretreatment significantly up- or down-regulated phospho-p38 MAPK protein profiles in male versus female cultures (
Figure 3B). Removal of media glucose stimulated total p38 MAPK protein expression in each sex; GLUT2 siRNA further amplified this stimulatory response in males, but not females. Effects of GLUT2 gene knockdown on the mean ratio of phosphorylated/total p38 MAPK protein expression in the astrocytes of each sex are shown in
Figure 3C. The results indicate that GLUT2 siRNA significantly augmented mean ratio values in males, but had no effect on this ratio in females. Glucoprivation caused a slight, but significant increase in the mean ratio in males but did not modify this ratio in the other sex. However, GLUT siRNA pretreatment prior to glucose withdrawal decreased the mean ratio of phospho/total p38 MAPK in female rats, without affecting this ratio in males.
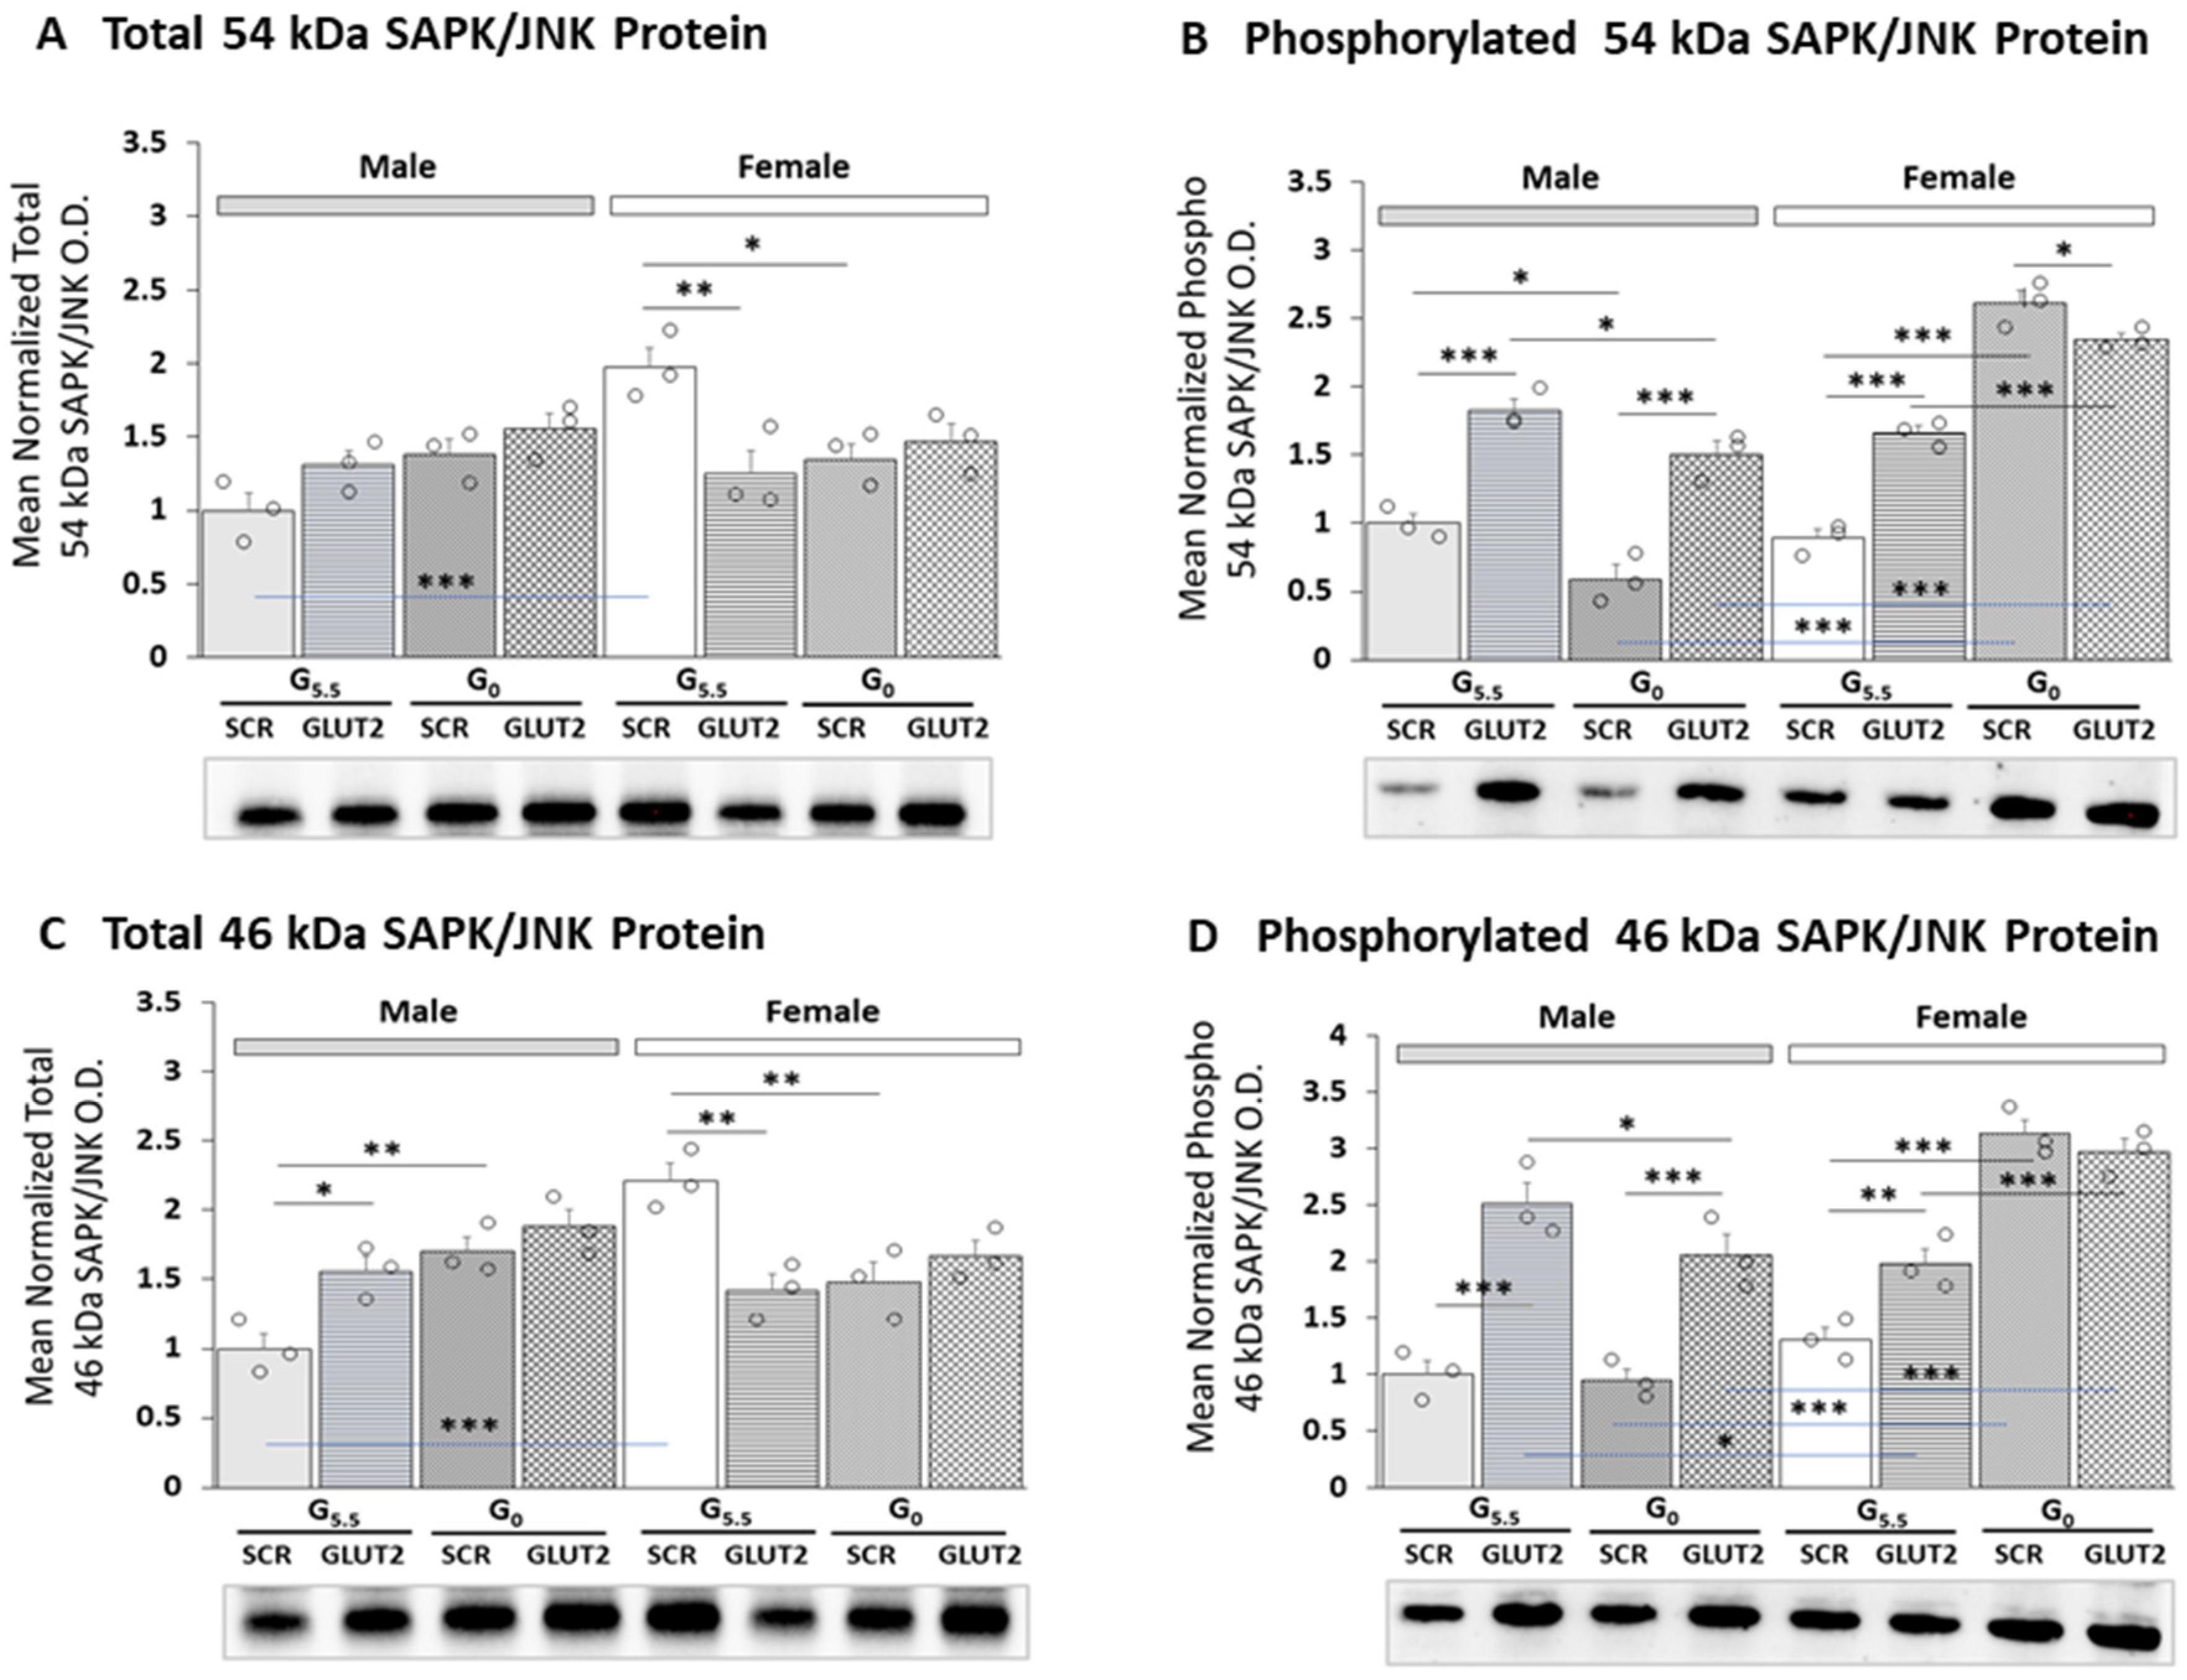
Figure 4 illustrates patterns of total versus phosphorylated 54 (
Figure 4A,B) and 46 (
Figure 4C,D) kDa SAPK/JNK protein isoform expression in male and female rat astrocytes. The data were analyzed via three-way ANOVA and the Student–Newman–Keuls test; statistical outcomes are presented in
Supplementary Table S1. As shown in
Figure 4A,C, total expression levels of 54 and 46 kDa SAPK/JNK protein levels were elevated in females versus males. GLUT2 gene silencing increased total 46 kDa variant profiles in males, but decreased both molecular-weight isoforms in females. In males, glucoprivation did not alter expression of the 54 kDa SAPK/JNK protein, but increased levels of the 46 kDa protein levels; neither protein profile was responsive to glucose withdrawal in females. GLUT2 siRNA pretreatment did not modify this stimulatory response.
Figure 4B,D illustrate how GLUT2 gene silencing affects expression patterns of phosphorylated 54 and 46 kDa SAPK/JNK proteins in each sex. The results indicate that in male and female astrocytes, GLUT2 siRNA significantly up-regulated phospho-54 and phospho-46 kDa SAPK/JNK profiles. Glucoprivation had divergent sex-specific effects on these proteins, as glucose-starved male astrocytes showed a decline (54 kDa) or no change (46 kDa) in SAPK/JNK protein levels, whereas female cultures exhibited significant up-regulation of both enzyme isoforms. GLUT2 siRNA pretreatment averted glucoprivic suppression (male) or augmentation (female) of phospho/54 kDa SAPK/JNK protein expression.
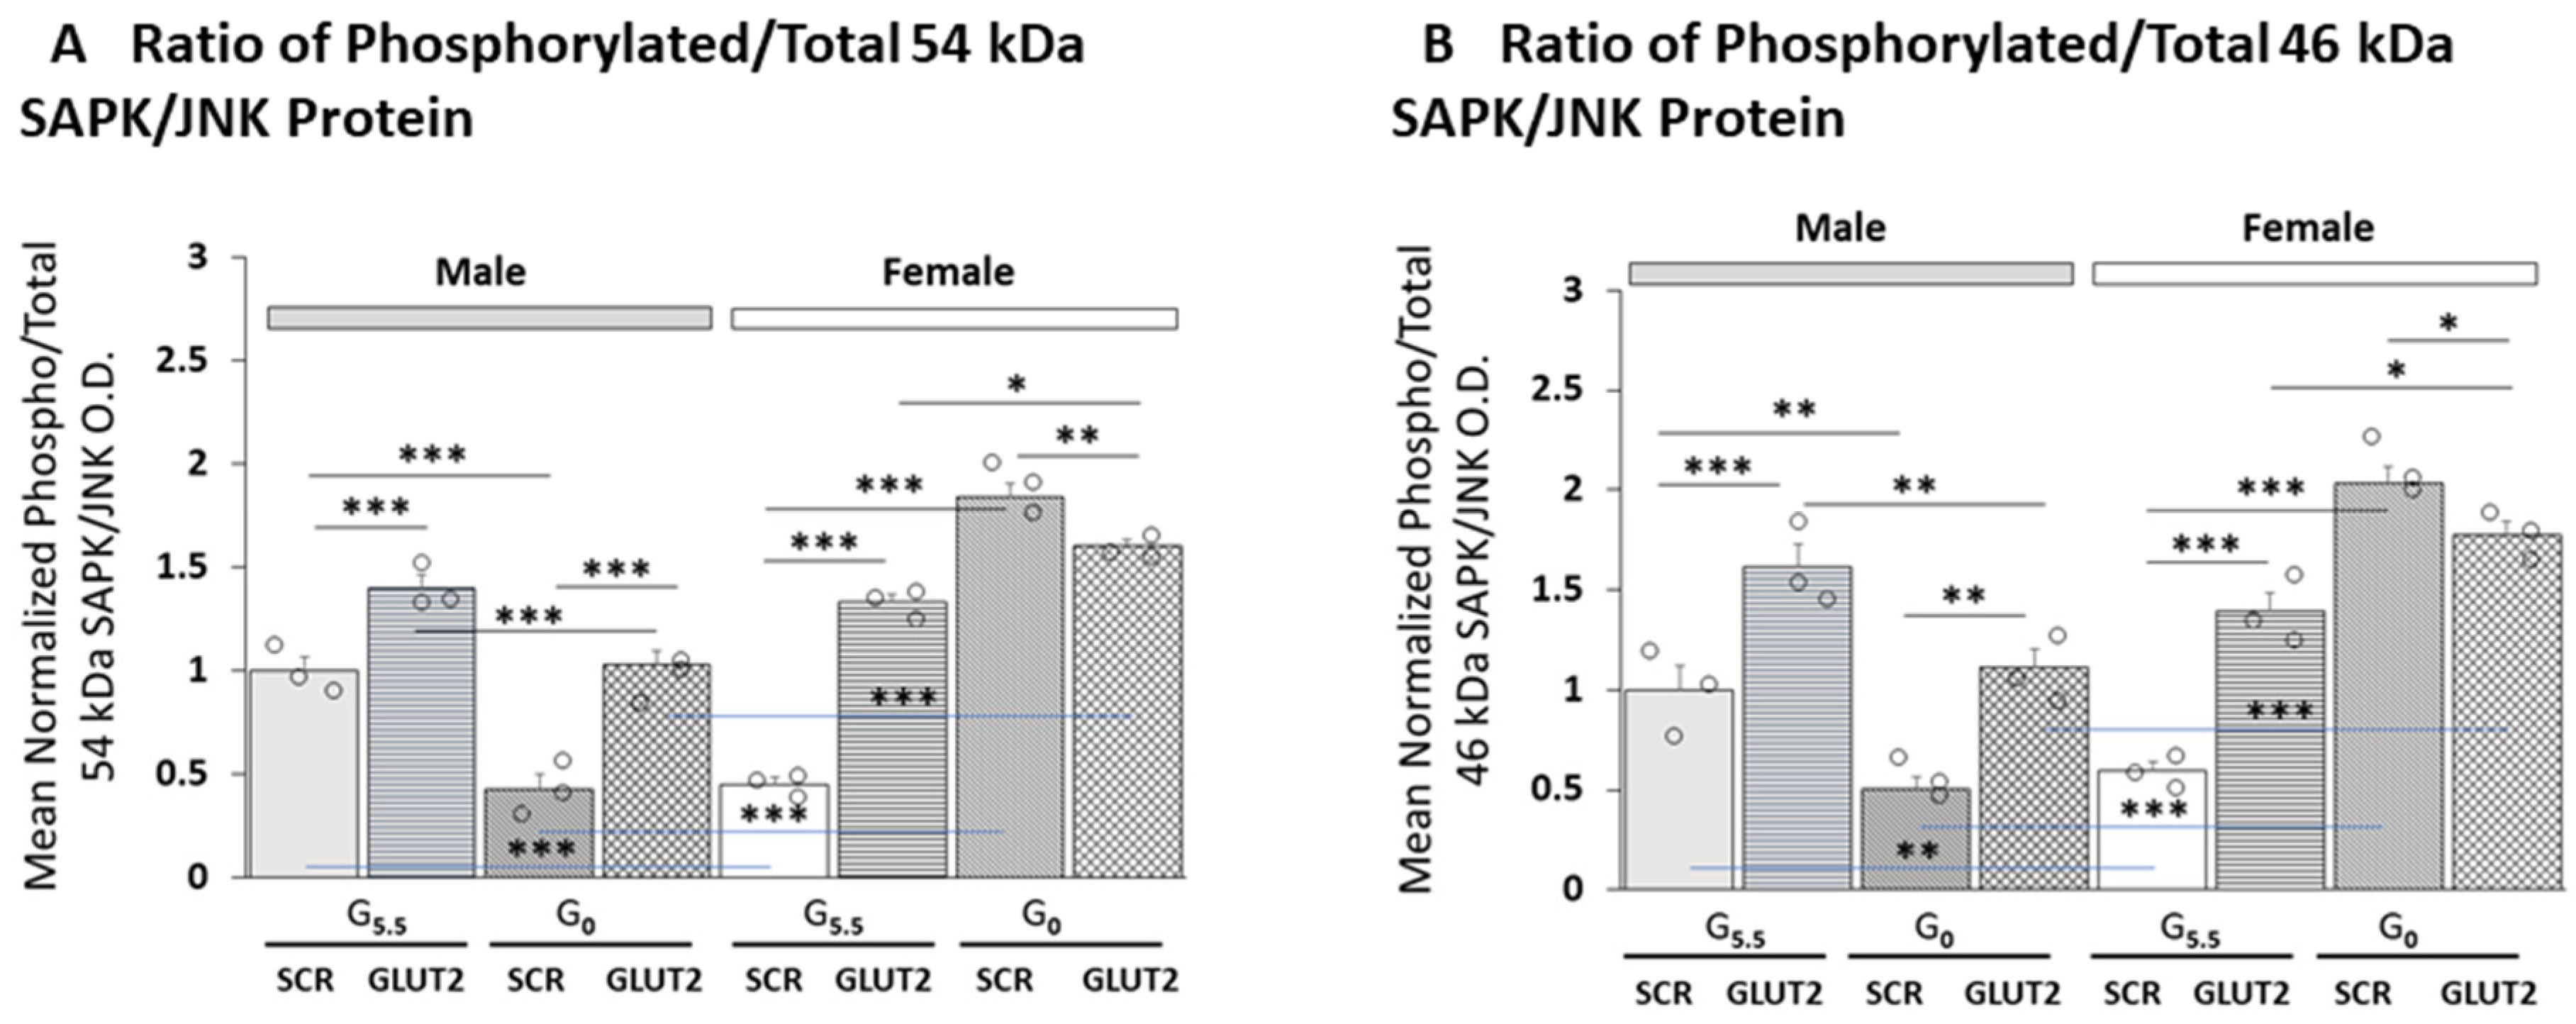
Figure 5 shows how GLUT2 gene knockdown affects the mean ratio of phosphorylated versus total 54 (
Figure 5A) and 46 (
Figure 5B) kDa SAPK/JNK protein isoform expression in glucose-supplied versus -deprived hypothalamic astrocyte cultures of each sex. Statistical analyses of data using three-way ANOVA and the Student–Newman–Keuls test are listed in
Supplementary Table S1. The results indicate that in each sex, GLUT2 knockdown significantly increased the mean value of this ratio for each molecular-weight variant. Glucoprivation caused divergent adjustments in mean phospho-/total 54 and 46 kDa isoform ratios in the two sexes, as mean values were diminished in males, yet increased in females. siRNA pretreatment reversed this inhibitory response in males, yet blunted the magnitude of increase in mean ratios in females.
4. Discussion
Presently, it is not known how GLUT2 employs information gained from monitoring transported glucose to exert sex-dimorphic control of hypothalamic astrocyte glucose and glycogen metabolism. The present study utilized gene knockdown tools and a validated primary culture cell model to address the premise that GLUT2 regulates patterns of expression and activation of distinctive cellular stress-sensitive MAPK signaling cascades in a sex-contingent manner in this glial cell type. Western blot analysis of total and phosphorylated 44/42 kDa ERK1/2, p38 MAPK, and 54/46 SAPK/JNK protein profiles showed that GLUT2 input promotes divergent down- (male) or up-regulated/unaffected (female) mean baseline phospho/total protein ratios for ERK1/2 isoforms and p38 MAPK, while enhancing SAPK/JNK variant activity in each sex. Glucoprivation was seen to cause sex-monomorphic augmentation of mean phospho/total protein ratios for ERK1/2 protein molecular-weight isoforms, but induced sex-specific changes in p38 MAPK and SAPK/JNK mean phospho/total protein ratios. In females, glucoprivation caused a loss (ERK1/2) or gain (p38 MAPK) of GLUT2 stimulation of distinct MAPK protein activity, along with a switch from inhibitory to stimulatory regulation of the SAPK/JNK protein activation state. In males, GLUT2 inhibition of ERK1/2 and SAPK/JNK mean phospho/total protein ratios was operative during either glucose supply or deprivation, yet inhibition of p38 MAPK was lost in this sex after glucose withdrawal. The outcomes show that glucose status is a critical determinant of GLUT2 regulation of ERK1/2, p38 MAPK, and SAPK/JNK protein variant activity in females, and of GLUT2 control of p38 MAPK in males. Further studies are needed to determine if and how GLUT2-sensitive MAPK enzyme proteins may regulate glucose storage and catabolism in the hypothalamic astrocytes of each sex.
The documented contribution of GLUT2′s distinctive intra-cytoplasmic loop to glucose monitoring provided the impetus to examine herein whether this sensor may control, in hypothalamic astrocytes, the activation status of one or more of the three primary recognized MAPK cascade families that operate within cytoplasmic signal transduction pathways. Reports that this loop is rapidly translocated between the cytoplasm and nucleus in response to changes in intracellular glucose levels, ultimately resulting in increasing nuclear accumulation with rising glucose concentrations, raised speculation that the GLUT2 loop segment may physically carry glucose signals from the plasma membrane to the nucleus [
16]. However, confirmatory proof of this novel concept is not available. The working premise of the present research asserts, alternatively, that stress-sensitive cytoplasmic MAPK signal cascades may convey cues derived from GLUT2-glucose-sensing activity to downstream effectors, with the unique caveat that several MAPK families may be in some or all instances sex-dimorphic.
Data for p38 MAPK show that GLUT2 does not manage total protein profiles, but regulates p38 MAPK phosphorylation (inhibitory in male; stimulatory in female) irrespective of glucose status. The mechanisms that underlie this sex-dimorphic control of p38 activity are unclear, but evidence that MAPK signaling is estradiol-sensitive supports the prospect that estrogen receptor signaling may be involved. Glucoprivation up-regulated total and phosphorylated p38 MAPK levels in each sex; GLUT2 signaling is evidently not involved in the former stimulatory response, but evidently limits (male) or drives (female) glucoprivic amplification of phospho-p38 MAPK protein content. As GLUT2 knockdown restored phospho-p38 MAPK protein levels to the control range, it could be argued that this sensor is the primary stimulus driving this stimulatory response. There remains a need to identify the non-GLUT2 cues that control glucoprivic patterns of p38 MAPK gene expression. MAPKK (MKK3/6) and MAPKKK (TAO1/2, MEKK1-4, MLK2/3, DLK, ASK1/2, TAK1) proteins that regulate p38 MAPK activity have been identified [
19,
20]. It remains to be determined if and how GLUT2 may interact with these upstream kinases to control p38 MAPK phosphorylation, including whether GTP-binding proteins are involved. The transcription factors ATF-2, Max, and MEF2 are phosphorylated in response to p38 MAPK activation. Current outcomes raise the need to determine if one or more of these factors, or rather other transcription factors, function as a downstream target of activated astrocyte p38 MAPK.
In contrast to p38 MAPK, baseline 44 and 42 kDa ERK1/2 total protein profiles are subject to GLUT2 control, albeit in divergent directions in the two sexes (stimulatory in male; inhibitory in female). These findings were unanticipated as we predicted that GLUT2 gene silencing would likely affect phosphorylation of MAPK proteins under baseline and/or glucoprivic conditions, but did not envision that this manipulation could affect astrocyte total ERK1/2 protein levels, let alone cause divergent sex-dimorphic effects. Glucoprivation caused sex-specific changes in 44 and 42 kDa ERK1/2 total protein expression, as levels of both isoforms were decreased in males, but resistant to loss of glucose in females. In each sex, glucose status is an evident determinant of GLUT2 regulation of total ERK1/2 protein, as this control was lacking in glucose-deprived male and female astrocytes. Interestingly, other than GLUT2 regulation of phosphorylated 44 kDa ERK1/2 protein content in glucose-supplied male cultures, phospho-44/42 ERK1/2 protein profiles were generally unaffected by GLUT2 knockdown. Operating upstream of ERK1/2 proteins are the MAPKKKs A- and B-Raf, Raf1, Mos, and Tpl2 and the MAPKK MEK1/2 [
19,
20]. It is imperative to learn whether GLUT2 imposes transcriptional control of these MAPK proteins by mechanisms involving one or more of these upstream signaling molecules.
While ERK1/2 molecular-weight variants exhibit uniform responses to GLUT2 gene silencing, 54 and 46 kDa SAPK/JNK isoforms are apparently subject to dissimilar regulation by GLUT2. In males, total 54 kDa variant protein profiles were refractory to GLUT2 input, yet the lower-molecular-weight protein variant was inhibited by this sensor. In females, however, total levels of both SAPK/JNK proteins were suppressed by GLUT2. Glucoprivation up-regulated the 46 kDa size variant in males, but diminished levels of both variants in females; GLUT2 knockdown did not modify either SAPK/KNK protein response to glucose starvation in males or females. Glucose status evidently establishes GLUT2 regulation of total 46 kDa SAPK/JNK protein expression in each sex, as control of this size variant is lost during glucoprivation. The exact identity of stimuli that impose opposite effects of glucose withdraw on the expression of total 46 kDa SAPK/JNK protein remains to be discovered. In each sex, GLUT2 imposes similar control of phosphorylated 54 and 46 kDa SAPK/JNK protein expression, as gene knockdown elevated both isoform profiles in male and female astrocyte cultures. Similar to the effects on total SAPK/JNK proteins, glucoprivation selectively altered the expression of phospho-54 kDa SAPK/JNK protein in males, yet augmented both phospho-54 and phospho-46 kDa SAPK/JNK profiles in females. GLUT2 may contribute to glucoprivic suppression of the larger size variant in males, as gene silencing prevented this inhibitory response. GLUT2 is also implicated in glucoprivic enhancement of this same SAPK/JNK variant in females; this stimulatory effect represents an evident shift in the direction of control from negative to positive. The MAPKKKs MEKK1/4, MLK2/3, BLK, Tpl2, ASK1, and TAK1 and the MAPKK MKK4/7 regulate SAPK/JNK MAPK activation [
19,
20]. Further research seeks to identify which of these aforementioned upstream signaling molecules may mediate sex-contingent GLUT2 regulatory effects on 54 and 46 kDa SAPK/JNK isoform total protein expression and phosphorylation, and to characterize the mechanisms that may govern their responsiveness to GLUT2.
Data on mean phospho/total MAPK protein ratios are interpreted here as a valid indicator of activation state, specifically enzyme specific activity. Mean phospho/total p38 MAPK ratio values infer that GLUT2 inhibits p38 MAPK activation in males, but lacks control of this kinase activity in females. Glucoprivation evidently eliminates this male-specific inhibitory tone, yet promotes a gain of stimulatory control in females. Male astrocytes also exhibit GLUT2-mediated diminution of ERK1/2 phospho/total protein ratios, whereas these mean ratios are stimulated by GLUT2 in female primary cultures. In contrast to p38 MAPK, this inhibitory control occurs in males irrespective of glucose availability, but stimulation of this ratio disappears in females when glucose is withdrawn. Male astrocytes moreover show GLUT2 suppression of mean phospho/total SAPK/JNK protein ratios in males, an inhibitory tone that persists during glucoprivation. Unlike other target MAPK proteins, female astrocytes exhibit a switch from inhibition to stimulation of this ratio when glucose is present versus absent, respectively. These findings support the need to investigate how down-regulated GLUT2 function can elicit disparate patterns of distinctive MAPK protein activation in astrocytes from the two sexes. As discussed above, post-translational and/or translational mechanisms are likely involved, depending on the target MAPK protein. A question of similar importance is how glucose status can determine whether and how GLUT2 may regulate MAPK protein activation state.
A highly logical and potentially fruitful avenue of future research concerns the role of estradiol in sex-dimorphic hypothalamic astrocyte MAPK protein responses to glucoprivation. Estradiol acts by several cellular and molecular mechanisms, including oxidative stress reduction, to protect the brain against diverse in vivo bio-energetic insults [
34,
35,
36,
37,
38]. Our studies show that hypothalamic astrocytes express aromatase, and thus evidently synthesize neuroestradiol [
39]; we also reported that these primary cell cultures exhibit intrinsic sex differences in response to estradiol [
28], and that distinctive estrogen receptor (ER) variants mediate sex-specific glycogen metabolic protein and AMPK activation responses to glucoprivation [
29]. Estradiol imprints the brain during development [
40] through mechanisms that include epigenetic modifications [
41,
42,
43]. Neurons have been identified as substrates for early estrogenic reprogramming, yet the possibility that astrocytes, by virtue of ER expression, may also be a target for sex differentiation has not been examined. We theorize that hypothalamic astrocytes may indeed be programmed via estrogenization, and that these glia may exhibit sex-dimorphic GLUT2 regulation of signal transduction pathway protein expression as a result of dissimilar ER sensitivity to estradiol. It is additionally thought-provoking to speculate whether potential disparities in glucoprivic patterns of neuroestradiol production in male versus female astrocytes may, alongside sex differences in receptivity to this hormone, underlie GLUT2 control of MAPK signaling during glucose deficiency.
GLUT2 is reportedly expressed in multiple brain cell populations [
5,
6] but functions within astrocytes, in an unknown neural location, to control glucose counter-regulation [
7]. The present study thus used a pure hypothalamic astrocyte cell culture model to investigate the role of glucose status in GLUT2 regulation of MAPK protein expression and activation in each sex because of the advantage of the absence of other brain cell types. Indeed, adult rats of each sex were used to generate the primary cultures utilized in the experimental paradigm. It should be noted, however, that since this approach involves disruption of the in situ astrocyte microenvironment, it precludes consideration of possible as-yet-to-be-determined nerve cell influence on GLUT2 glucose sensory function and MAPK protein responsiveness to this nutrient signal. Thus, the prospect that in vivo GLUT2 control of the MAPK proteins studied herein may not partially or fully align with results obtained in vitro cannot be overlooked.
In summary, the present study addressed the unresolved issue of how GLUT2 glucose sensing may be transformed into intra-cellular regulatory signals. This project utilized gene knockdown tools to investigate the prospect that MAPK signaling cascades may be subject to GLUT2 influence in one or both sexes, and that glucose status may determine whether such control is imposed. The results disclose notable differences between the three primary MAPK families regarding GLUT2 regulation of total versus phosphorylated MAPK protein expression in glucose-supplied or -deprived male compared to female hypothalamic astrocyte primary cultures. The data show that GLUT2 siRNA promoted divergent changes in baseline ERK1/2 total protein expression in male versus female astrocytes, while increasing or decreasing the mean phosphorylated/total protein ratio for both ERK1/2 molecular-weight variants in corresponding sexes. This regulatory influence persisted during glucoprivation in males, but not females. Phospho/total p38 MAPK protein ratios were up-regulated by GLUT2 knockdown in male astrocytes alone, yet this ratio was unaffected (male) or decreased (female) by GLUT2 gene silencing. GLUT2 siRNA augmented 54 and 46 kDa SAPK/JNK baseline phospho/total protein ratios in each sex, but increased or decreased these ratios in glucose-deprived male or female astrocytes. The outcomes show that GLUT-2 inhibits ERK1/2, p38, and SAPK/JNK MAPK activity in male hypothalamic astrocytes, yet stimulates and inhibits activity of the former or latter MAPK family in females. Additional research is needed to determine if these MAPK cascades effect GLUT2-dependent changes in hypothalamic astrocyte glucose and glycogen metabolism.


