Article

FEM Investigation of the Air Resonance in a Cretan Lyra

by
Nikolaos M. Papadakis
1,2,*,
Nikolaos Nikolidakis
1 and
Georgios E. Stavroulakis
1
1
Institute of Computational Mechanics and Optimization (Co.Mec.O), School of Production Engineering and Management, Technical University of Crete, 73100 Chania, Greece
2
Department of Music Technology and Acoustics, Hellenic Mediterranean University, 74100 Rethymno, Greece
*
Author to whom correspondence should be addressed.
Vibration 2023, 6(4), 945-959; https://doi.org/10.3390/vibration6040056
Submission received: 20 August 2023 / Revised: 5 October 2023 / Accepted: 16 October 2023 / Published: 18 October 2023

Abstract

:
Cretan lyra is a stringed instrument very popular on the island of Crete, Greece, and an important part of its musical tradition. For stringed musical instruments, the air mode resonance plays a vital part in their sound, especially in the low frequency range. For this study, the air mode resonance of a Cretan lyra is investigated with the use of finite element method (FEM). Two different FEM acoustic models were utilized: First, a pressure acoustics model with the Cretan lyra body treated as rigid was used to provide an approximate result. Secondly, an acoustic–structure interaction model was applied for a more accurate representation. In addition, acoustic measurements were performed to identify the air mode resonance frequency. The results of this study reveal that the acoustic–structure interaction model has a 3.7% difference regarding the actual measurements of the resonance frequency. In contrast, the pressure acoustics solution is approximately 13.8% too high compared with the actual measurements. Taken together, the findings of this study support the idea that utilizing the FEM acoustic–structure interaction models could possibly predict the vibroacoustic behavior of musical instruments more accurately, which in turn can enable the determination of key aspects that can be used to control the instrument’s tone and sound quality.

1. Introduction

Cretan lyra is considered the most representative musical instrument of the island of Crete, Greece. It is a symbol of the island’s music tradition [1] and is acknowledged among the emblems of Cretan identity [2]. The instrument was chosen as the origin and symbol of uncontaminated music folklore and reconnects present reality to a remote past [3]. The lyra occupies a central place in the Cretan music landscape and also in that other Aegean and Dodecanese islands [4]. Cretan music is generally performed by a duo that consists of the lyra player (lyrist, lyraris) accompanied by the lute player (lutis, la(g)oytieris). Commonly, the lyra player also acts as the vocalist, singing the traditional 15-syllable rhyming couplets of mantinades, a wide-spread musical and poetical dialogical practice in Crete [5]. More on the subject of ethnomusicology and the Cretan lyra can be found in [6].
The Cretan lyra is a pear-shapped, bowed chordophone (typically with three strings) which is played on the knee, held upright, and with a violin-like bow. The cover of the lyra’s soundboard contains the sound holes, which affect the particular timbre of the instrument. Due to the high tension exerted by the strings, a semi-circular bar is usually carved along the soundboard, on the inside of the body of the Cretan lyra. The soundboard and the bar are carved from a single piece of wood. Another essential part of the lyra is the ‘soul’; this is the soundpost, a small dowel that functions mainly to introduce asymmetry to the vibration in order to increase the monopole radiation from the vibration modes of the body, and to allow them to be excited efficiently by bowing [7]. The soundpost critically affects the instrument’s quality of sound [5]. One of the interesting aspects of the lyra involves the fingering technique of the left hand. In contrast to the violin and other instruments, the strings are not pressed by the fingertips of the left hand; rather, they are merely touched from the side by the back of the lyrist’s nails [1]. The strings of a lyra are tuned in fifths (G3-D4-A4). The instrument’s fingerboard has no frets at all.
In the field of musical acoustics, physical modeling techniques are increasingly important and essential for understanding the complex behavior of musical instruments. Physical modeling has become one of the major fields in research concentrating on properties that are important for instrument building and musical performance [8]. Some of the most prominent methods are the boundary element method (BEM) [9], Finite Difference Method (FDM) [10] and finite element method (FEM), with the latter two being the most used. Collectively, more information about physical modeling of musical instruments can be found in [11].
The FEM is probably the most widespread method in numerous fields of acoustics [12,13]. For musical acoustics, the FEM is commonly used for eigenproblems, in fluid dynamics, and with contact and moving mesh applications, while the FDM is more used in time-dependent problems [11]. The finite element formulation has the advantage of the definition of elements being very sophisticated; elements can be defined as being very small or cover small sections for the geometry, which is more difficult in the finite difference formulation [11]. The strength of finite element models lies in their ability to treat inhomogeneous media and difficult boundary conditions that may arise in real life problems. In the FDM, instead of describing the surface with a mesh (as with the FEM and BEM), a grid is used, and the algebraic equations [14] are solved at the points of the grid. In addition, the general purpose applicability, robustness, mathematical structure, and overall flexibility of the FEM highlight its attractiveness and justify its applicability. Of all the methods mentioned above, the FEM has become sufficiently inexpensive and simplified in commercial software for practical applications. The FEM has also been used to model the acoustic behavior of the soundboard of the Cretan lyra [15].
An important aspect of modeling musical instruments is the modeling of the air cavity resonance. The resonance is commonly called A0 resonance, and the mode, A0 mode. It is sometimes called the “Helmholtz air resonance”; however, this is debated since the A0 resonance has been found to not follow the typical formula of Helmholtz resonators [7]. The reader can find more in [16,17]. In the majority of stringed instruments from the violin and the guitar family, air resonance is a vital part of the instruments sound. Air cavity resonance is also very important in many other instruments, such as the harp [18,19,20], the ocarina, and instruments such as jaw harp, which exploit the air cavity of the human mouth. The body of these instruments usually includes an opening or openings in connection with the air cavity. The air inside the enclosed volume of the shell vibrates in and out through these openings. This resonance of the instruments is used to boost the sound of their lowest notes, which are often well below the frequencies of the lowest strongly excited, acoustically efficient, structural resonances.
The shape of the opening of the air cavity varies by instrument. For instruments of the guitar family, usually, a relatively large circular hole is cut into the front plate, while for instruments of the violin family, two symmetrically facing f-holes are cut into the front plate. However, the sound holes in violins evolved from a circular shape to an elongated f-shape, and it is suggested that this has the effect of increasing airflow, making the bass notes louder [21]. There is extensive research on the air resonance of violins [22]. Some of the most important findings are that modes of the enclosed air interact with plate modes that have the same shape [23], that the excitation of the air resonance significantly boosts the radiated sound at frequencies over most of the first two octaves of the violin and other instruments of the violin family [24], and also that high A0 cavity mode radiativity is a characteristic of excellent violins [25]. In the case of the Cretan lyra, the cover of the soundboard has two similar semicircular sound holes that define the particular timbre of the instrument.
Our study will focus on the fundamental air-mode resonance of the Cretan lyra. For this reason, the air resonance will be modeled with the use of the FEM. An acoustic–structure interaction model and a model with rigid walls will be utilized. Results will be verified with acoustic measurements.
This paper has been structured as follows: The methodology used in this study is described in Section 2. The results of this study are presented in Section 3. In Section 4, the data are analyzed and areas for future research are noted. The conclusion provides a concise overview and places the work in context.

2. Materials and Methods
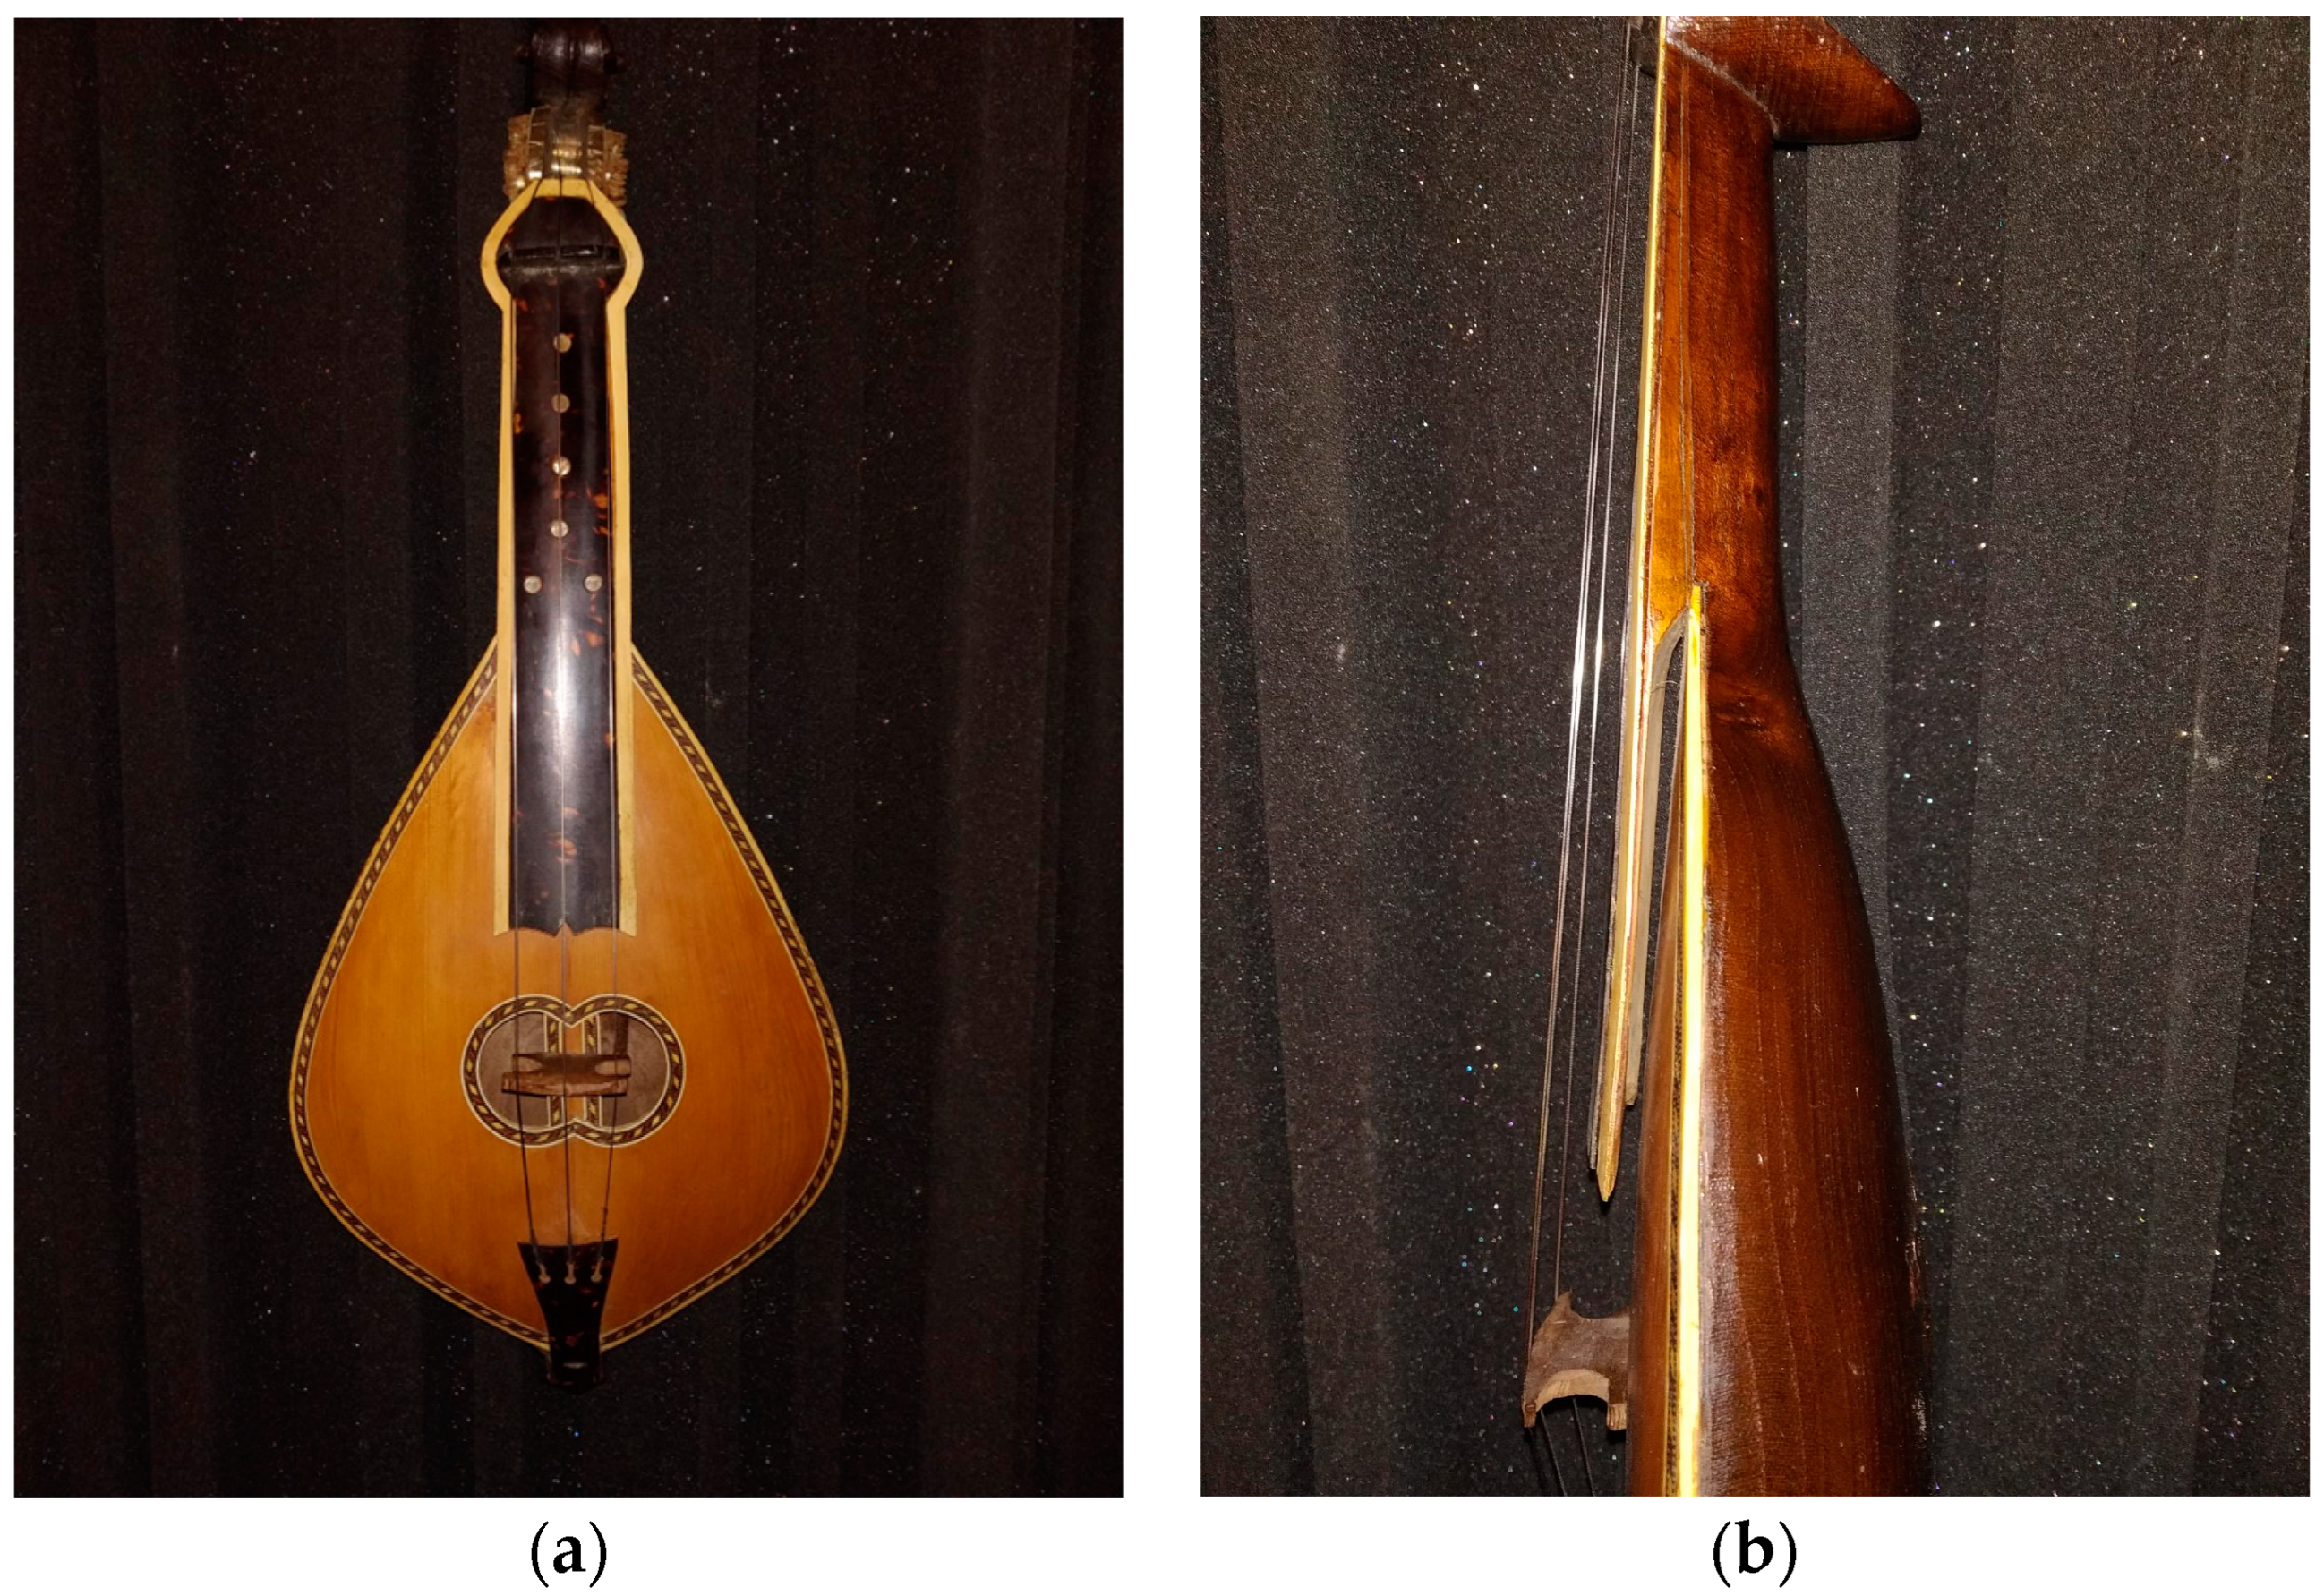
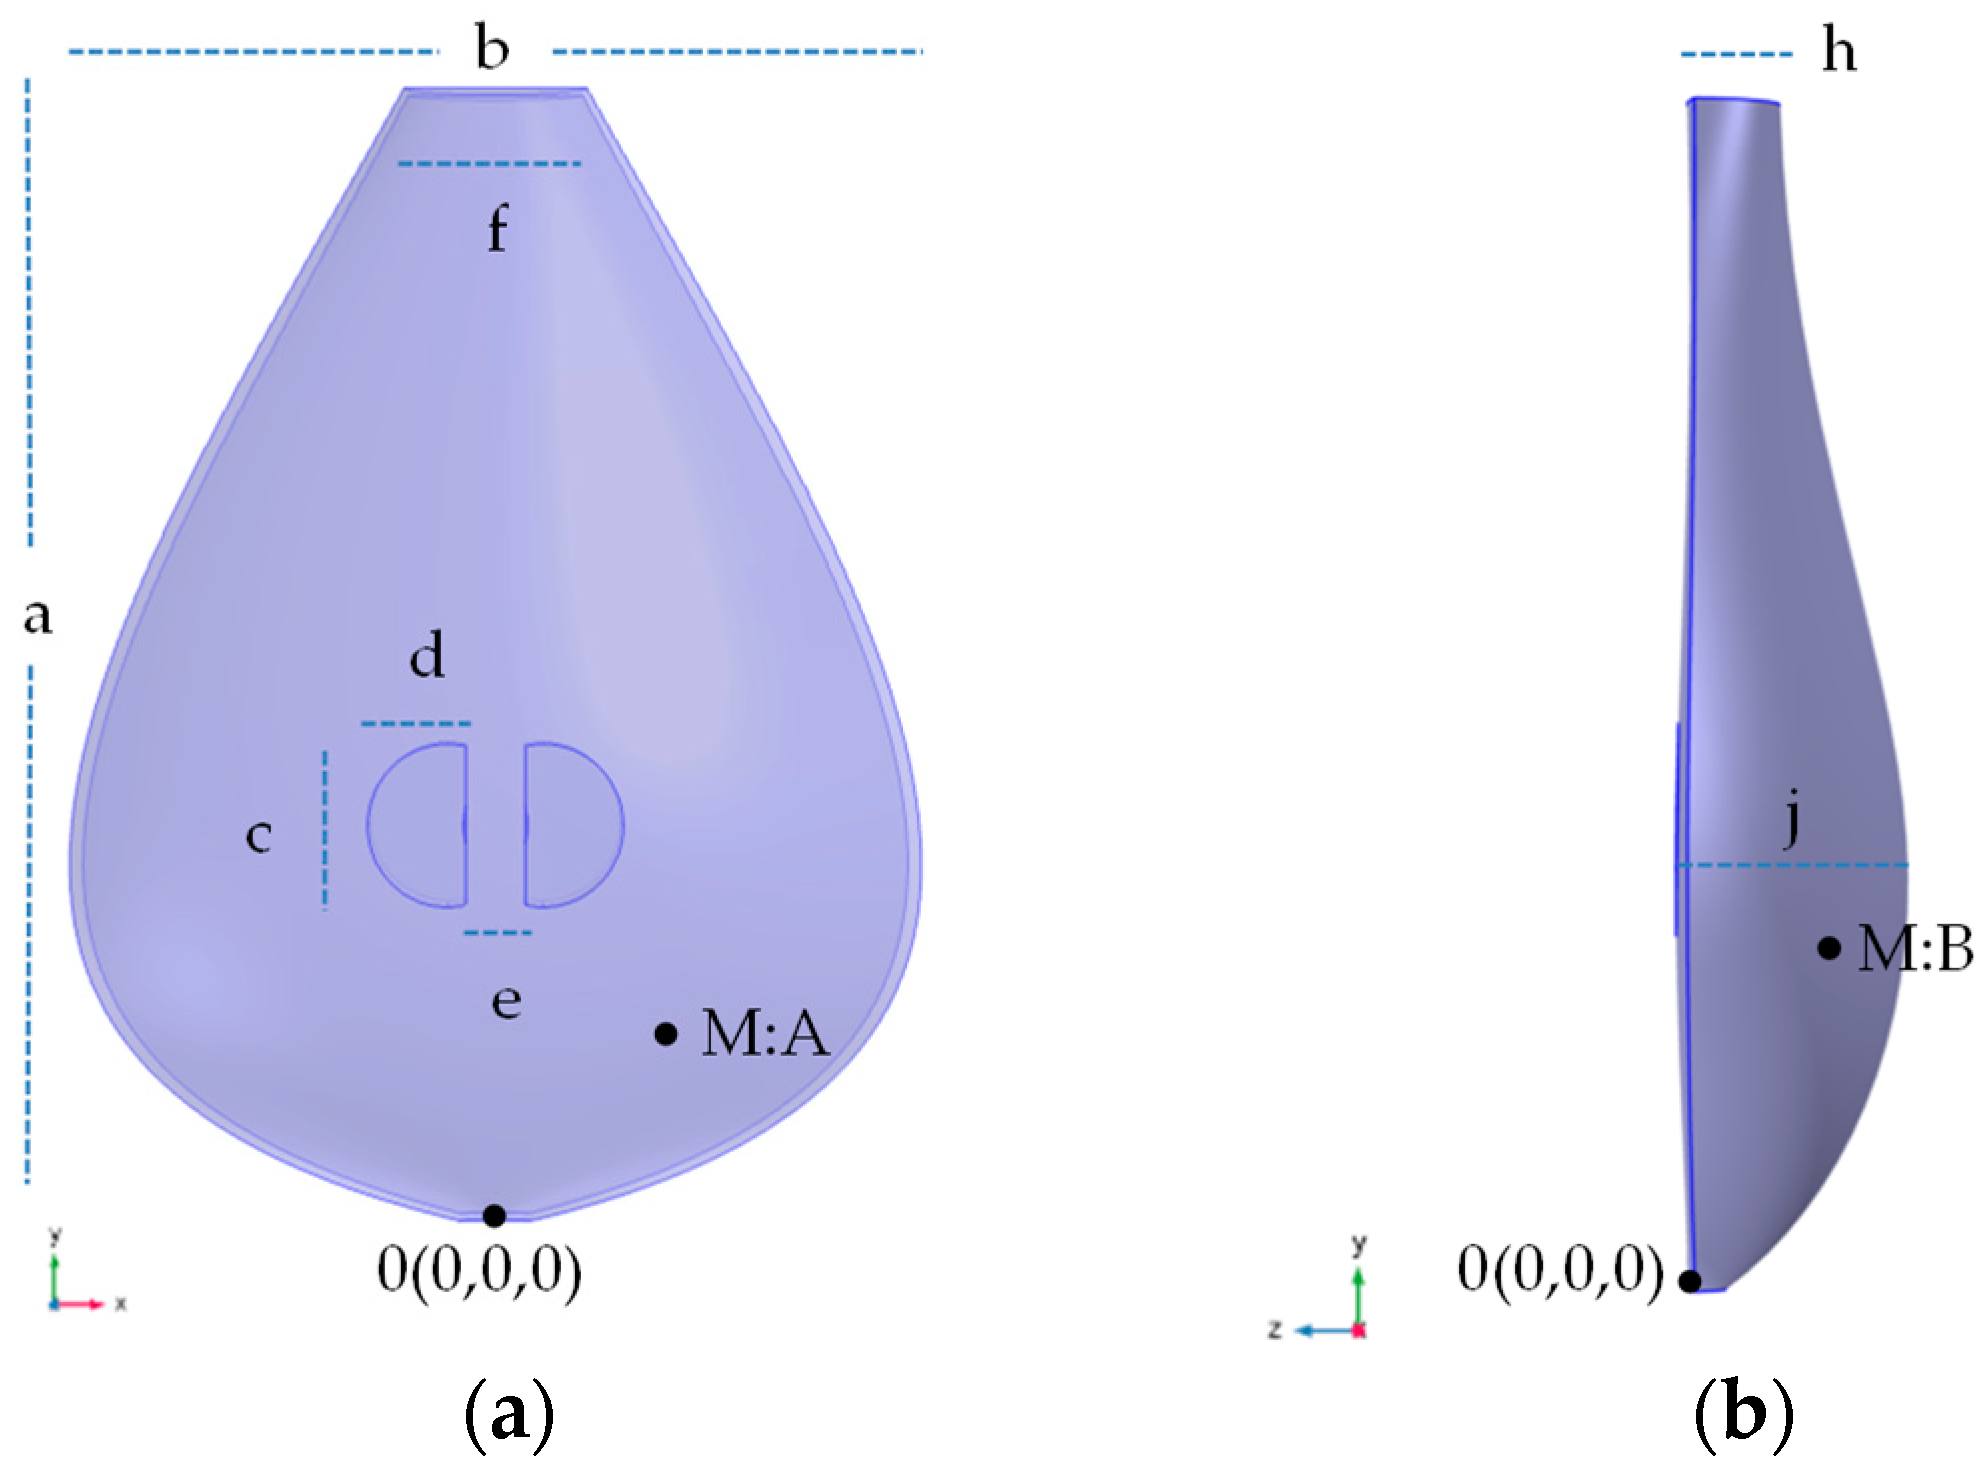
2.1. Materials

The Cretan lyra modeled and used for measurements in this study is constructively intact, and it is being used in musical activities by its owners. Therefore, the techniques of analyzing the constructive parts were chosen such that they did not harm or alter the instrument in any manner. The soundboard of the Cretan lyra is made out of cedarwood. Since the bar is carved along the soundboard, it is from the same material (cedarwood). The sound post is made of walnut. Also, the body, neck and headstock are all one solid piece of mulberry. The above choices of woods are typical for the construction of the Cretan lyra [5]. For cedarwood, the physical properties used for modeling in this study have been found in [26], and for mulberry, in [27]. All the physical properties have been included in Appendix B. In Figure 1a, a picture of the Cretan lyra used in this study is included. In Figure 1b it can be seen that the main body of the lyra is not in contact with the fingerboard, just like a violin, allowing it to vibrate freely. This element is very important for the modeling of the lyra, which will be presented in Section 2.2.2.

2.2. Methods

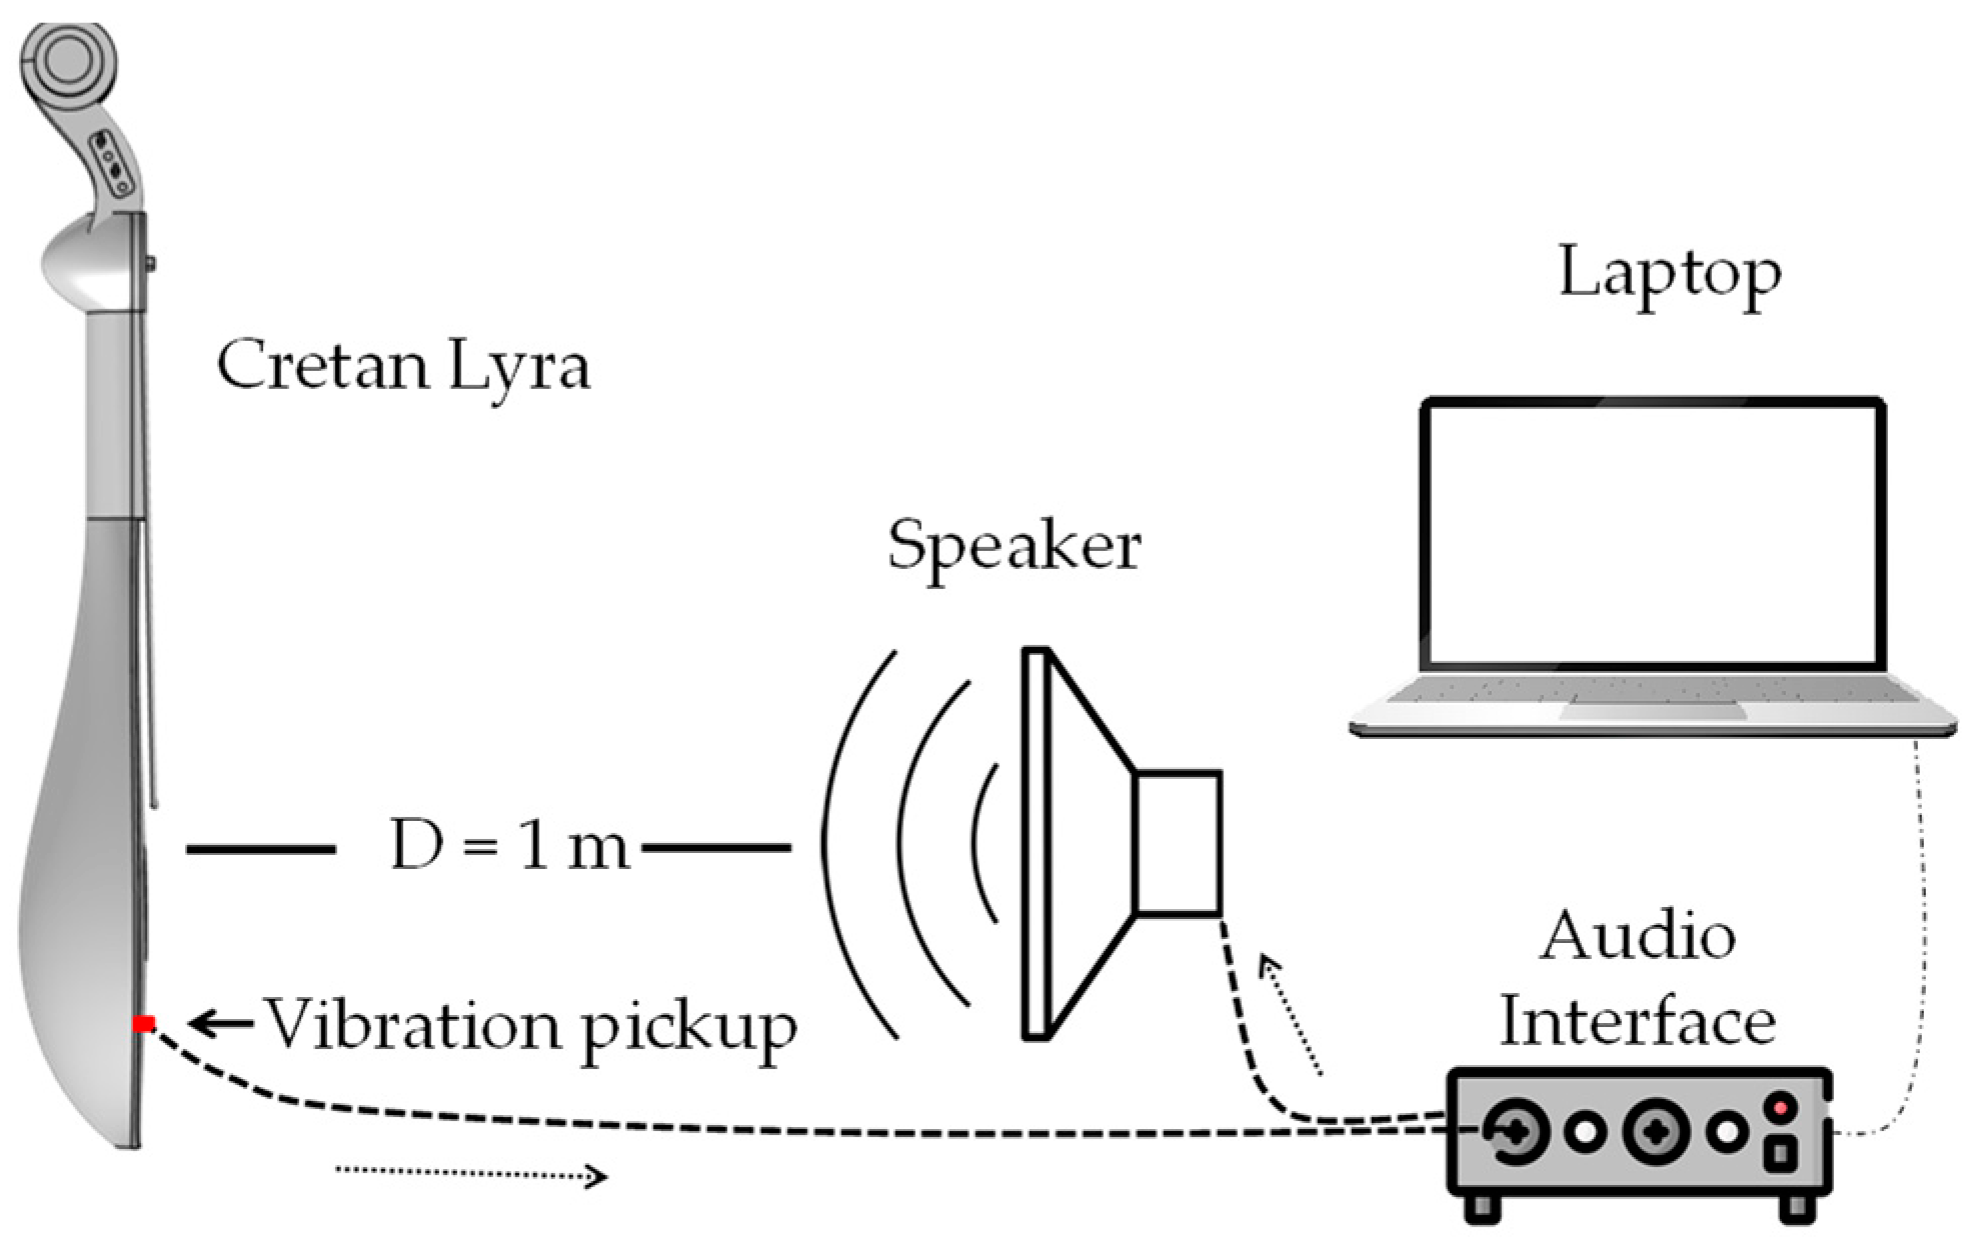
2.2.1. Acoustic Measurements

For the measurements of the air resonance frequency of the Cretan lyra, a methodology similar with [28] was followed. In this study, a way to explore the effect of the sound holes was applied by comparing the frequency response differences with the holes closed and the holes open. The rationale of this approach is that the closed holes will reduce the amplitude of the air resonance in the frequency response of the instrument. Therefore, by comparing the frequency response of the instrument with the sound holes open and closed, the air resonance frequency will be revealed. Results showed a good agreement for the prediction of the air resonance. A similar approach is followed in other studies involved a removable plug that is tightly fitted in the sound hole [29], or holes were plugged with corks and foam for the same reason [30]. For this study, similar to the aforementioned research [28], corrugated cardboard was used to seal the sound holes due to its light weight and stiffness. The edges were sealed with heavy paper tape. Acoustic measurements were performed with the sound holes open and the sound holes closed. Acoustic measurements were performed with the lyra not including the bridge, soundpost, nor strings. The reason for this was for the simplification of the FEM model, as will be discussed in Section 2.2.2. Collectively, different methods for acoustic measurement in the similar case of violin cavity modes can be found in [16].
For the acoustic measurements, Exponential Sound Sweep (ESS) was used as an excitation signal, again similar to [28]. ESS was used for the initial measurement of the impulse response and consequently the frequency response of the Cretan lyra by applying Fourier analysis. Also, a Maximum Length Sequence (MLS) signal was used [31,32], or white noise [21] for the same reason. A comparison of ESS and MLS signals can be found in [33]. The ESS method [34] uses an exponential time-growing frequency sweep as an excitation signal. This approach enables a selective separation of impulse responses corresponding to the harmonic distortion orders that are taken into account. In other words, the method is measuring the impulse response for each frequency (at different points in time) and then combines them into a single impulse response (for the whole frequency range), changing the onset times of the individual impulse responses appropriately. Consequently, the actual calculations are performed in the time domain. After this process, the frequency response can be obtained by applying fast Fourier transform (FFT). All measurements were made at a controlled constant ambient of 50% relative humidity and a temperature of 21 °C. During the measurements the instrument was suspended vertically with the use of elastic bands at a distance of 1 m from the speaker. The measurements of the impulse response had a sampling frequency of 44.1 kHz. Three iterations were performed for each of the measurement points. Measurements were performed at various positions on the body of the lyra. Measurement positions that are used in this study are presented in Figure 2. It can be seen in Figure A1 that the differences in the frequency responses between the measurements are negligible, so it can be assumed that the method has a very good repeatability. In Appendix C, the results for different measurements for the same source and receiver location are presented. A high-performance, ultra-light, miniature condenser vibration pickup, C411 PP (AKG Acoustics, Vienna, Austria), was used for the measurements. As an excitation source, a TB2S AII (PMC, Biggleswade, United Kingdom) speaker was used. The audio interface that was used was ONYX 400F (Mackie, Washington, DC, USA). Alternative sources are also available [35] and applied for a variety of reasons [36,37,38]. Matlab R2021a (Mathworks, Massachusetts, USA) software was used for the measurements and also for the analysis of the results (the extraction of impulse responses via fast Fourier transforms). The setup of the acoustic measurements is presented in Figure 2.

2.2.2. FEM Acoustic Modeling

For the FEM modeling, a 3D model was created, which will be also used in future studies and modeling of the Cretan lyra. For this stage, the geometry and the model have been simplified while still including the relevant parts for the modeling of the acoustic behavior of the body of the Cretan lyra (Figure 3). As also mentioned in Section 2.2.1 (acoustic measurements), the bridge, soundpost, and acoustic strings were not modeled. The soundpost, bridge, and acoustic strings were also removed from the actual Cretan lyra for the acoustic measurements. However, it has to be mentioned that in the similar case of a violin, measurements are usually performed with the soundpost in place since the soundpost is part of the body system, and it will have an influence on the air resonance (and on all the other resonances) by stiffening the top plate and reducing the additional compliance that the top plate provides. The reason the measurements and modeling were performed without the soundpost is due to the different construction of the lyra compared to the violin. In violins, the soundpost is attached to the top and the back plate. However, in the lyra the soundpost is attached to the bridge and the back of the instrument. Therefore, if the measurements are performed without the strings, the bridge is not held in place, and therefore, neither is the soundpost. However, as this research is the first in a series of studies, it is our intention in the immediate future to proceed with measuring and modeling the instrument including the strings, the bridge, and the soundpost. Figure 2 presents the modeling of the body of the lyre, the dimensions, as well as the points where the acoustic measurements were taken. For the application of the FEM, Comsol v.6 (Comsol, Burlington, VT, USA) software was used. The domain was discretized with an unstructured mesh of 84,648 quadratic Lagrange triangular elements.

FEM Acoustic Modeling: Acoustic–Structure Interaction

The acoustic–structure interaction approach connects the acoustics pressure variations in the fluid domain with the structural deformation in the solid domain. It can be used to solve the coupled vibroacoustic phenomena present in musical instruments, such as the structure–cavity interaction [39]. In general, acoustic–structure interaction approach can provide accurate results, as it has been found in a study about the estimation of the air resonance in a violin [21].
A brief mathematical formulation of the acoustic–structure interaction, based on [40], is presented. For a more complete approach to the subject, one can refer to [41]. For an elastic solid, the dynamic behavior can be expressed as follows:
σ i j , j + f i = ρ s u ¨ i
where σ i j is the stress tensor, f i is the body forces vector, ρ s is the solid density, u i is the displacement, and i and j = x, y, z. The effect of the acoustic pressure over the solid in the intersection of the domains can be expressed as follows:
σ i j n i = n i p
where n i is the intersection normal vector, and p is the acoustic pressure. The acoustic wave equation is expressed as follows:
2 p + 1 c O 2 p ¨ = g
where c O is the sound speed, and g is the source field. The influence of the solid over the acoustic domain is also taken into account in the domain σ intersections. The kinematic compatibility of the solid in contact with the acoustic domain can be expressed as follows:
p n = ρ O u ¨ n
where ρ O is the fluid density, and u n is the displacement component normal to the interface. Using the above equations, the weighted residual method [42] can be applied. The mass matrix, stiffness matrix, volumetric stiffness matrix, compressibility matrix, and interface matrix can be obtained as follows:
M e = Ω ρ s N s T N s d Ω , K e = Ω B s T D B s d Ω , E e = 1 c O 2 Ψ ρ O N f T N f d Ψ H e = Ψ B f T B f d Ψ , L e T = Γ i N f T N s d Γ i
In the above, N is the element shape function matrix, B is the nodal strain–displacement matrix, and D is the constitutive law matrix. The indexes S and f refer to solid and fluid domains, respectively. The Greek letters Ω , Ψ , and Γ refer to the geometry of the structural, fluid, and interface domain, respectively. Combining the above into a global matrix, we obtain the following:
K L 0 H Λ α M 0 ρ O L T E d p = 0 0
where Λ α is a diagonal matrix of the square of the natural frequency of a coupled domain, and d   p T is the displacement–acoustic pressure nodal vectors of the corresponding vibration mode shapes.

FEM Acoustic Modeling: Rigid Body

In addition to the more complex acoustic–structure interaction model, a simple rigid body model was also utilized. Unlike the previous model, all boundary conditions in the body of the Cretan lyra were defined as a hard surface. This model was used for comparison reasons of the results for the air mode resonance with that of the acoustic–structure interaction model. The simulation is based on the resolution of Helmholtz equations in air, which is considered a linear elastic fluid. The corresponding speed of sound and density are supposed to be constant, taking the values of c = 340 m/s and ρ = 1.225 kg/m3, respectively. A perfectly matched layer (PML) is applied spherically all around the model to mimic an open infinite medium.

3. Results

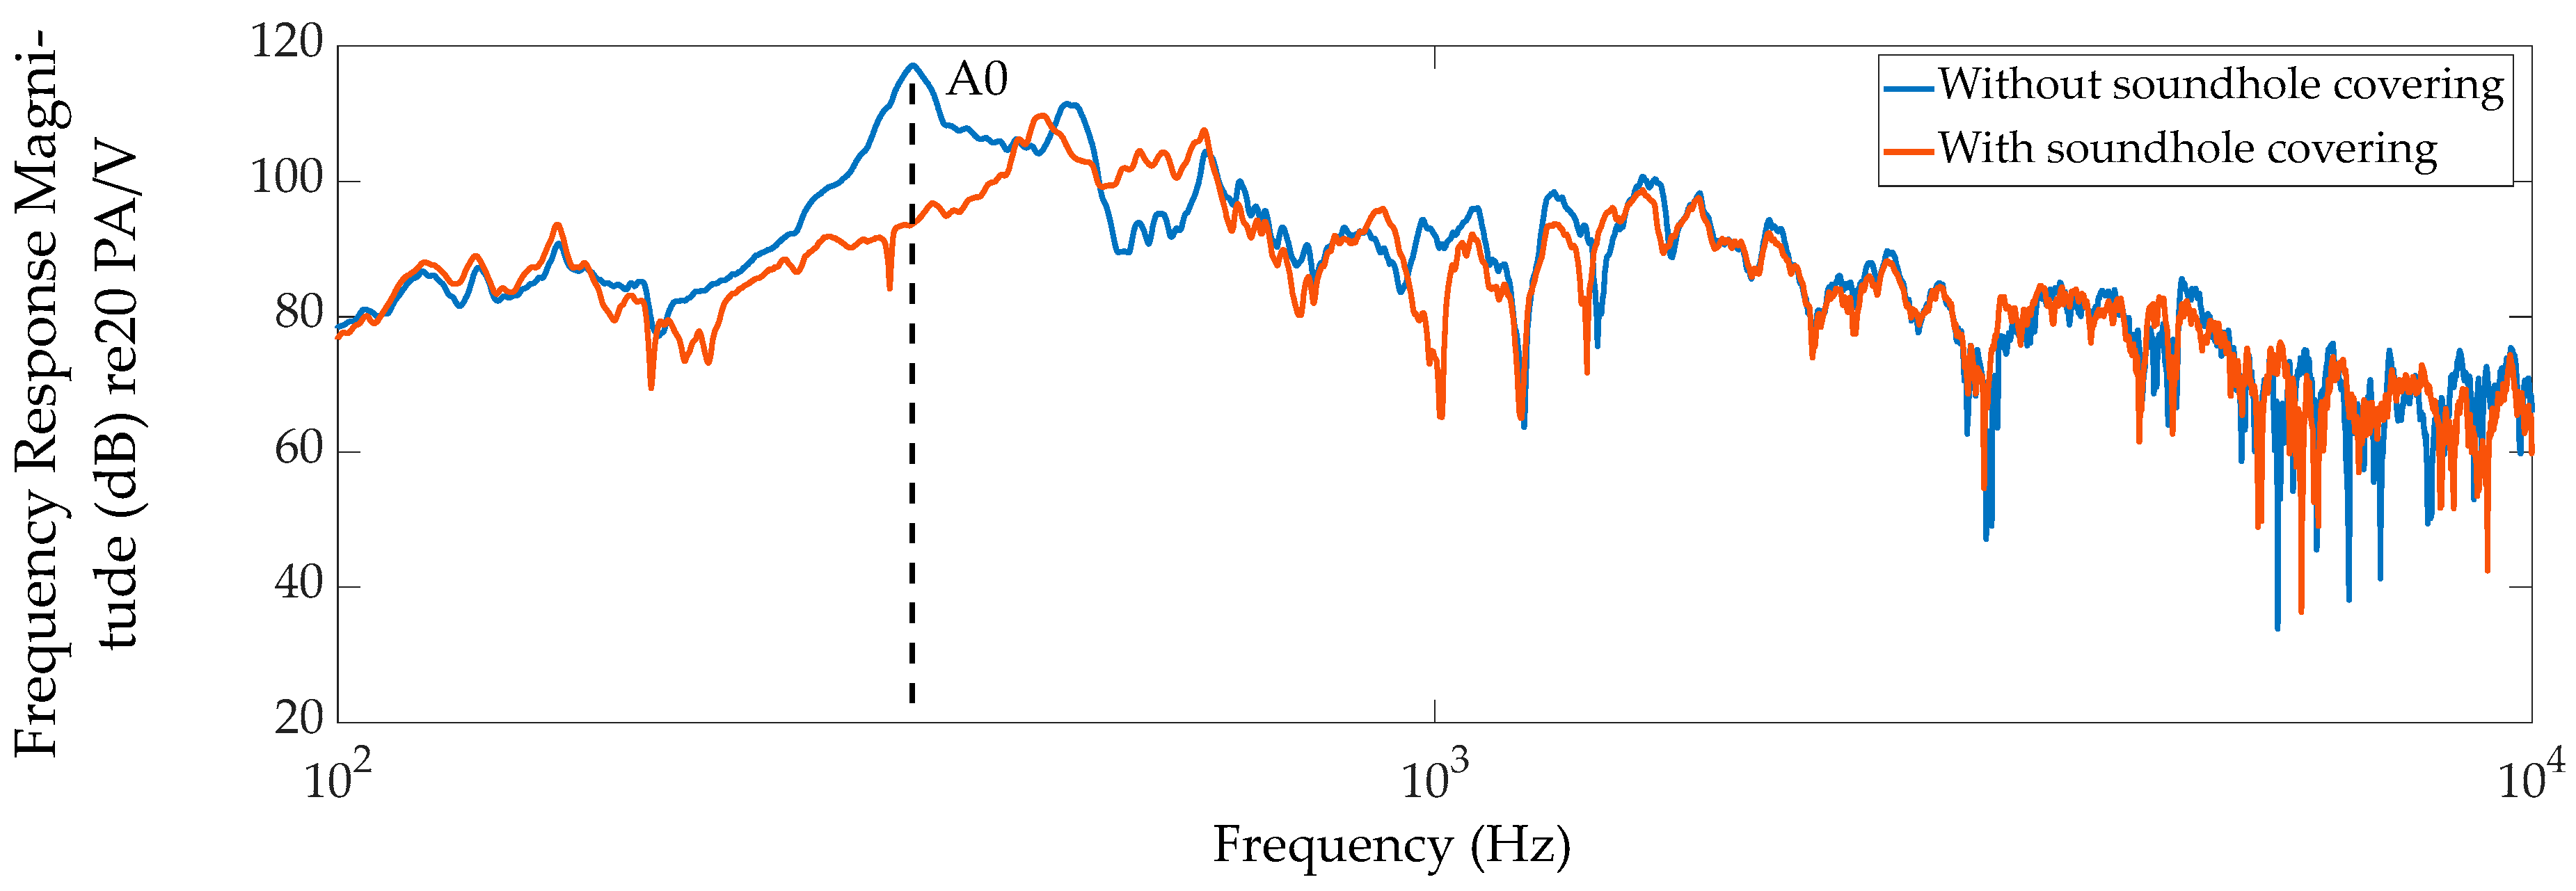
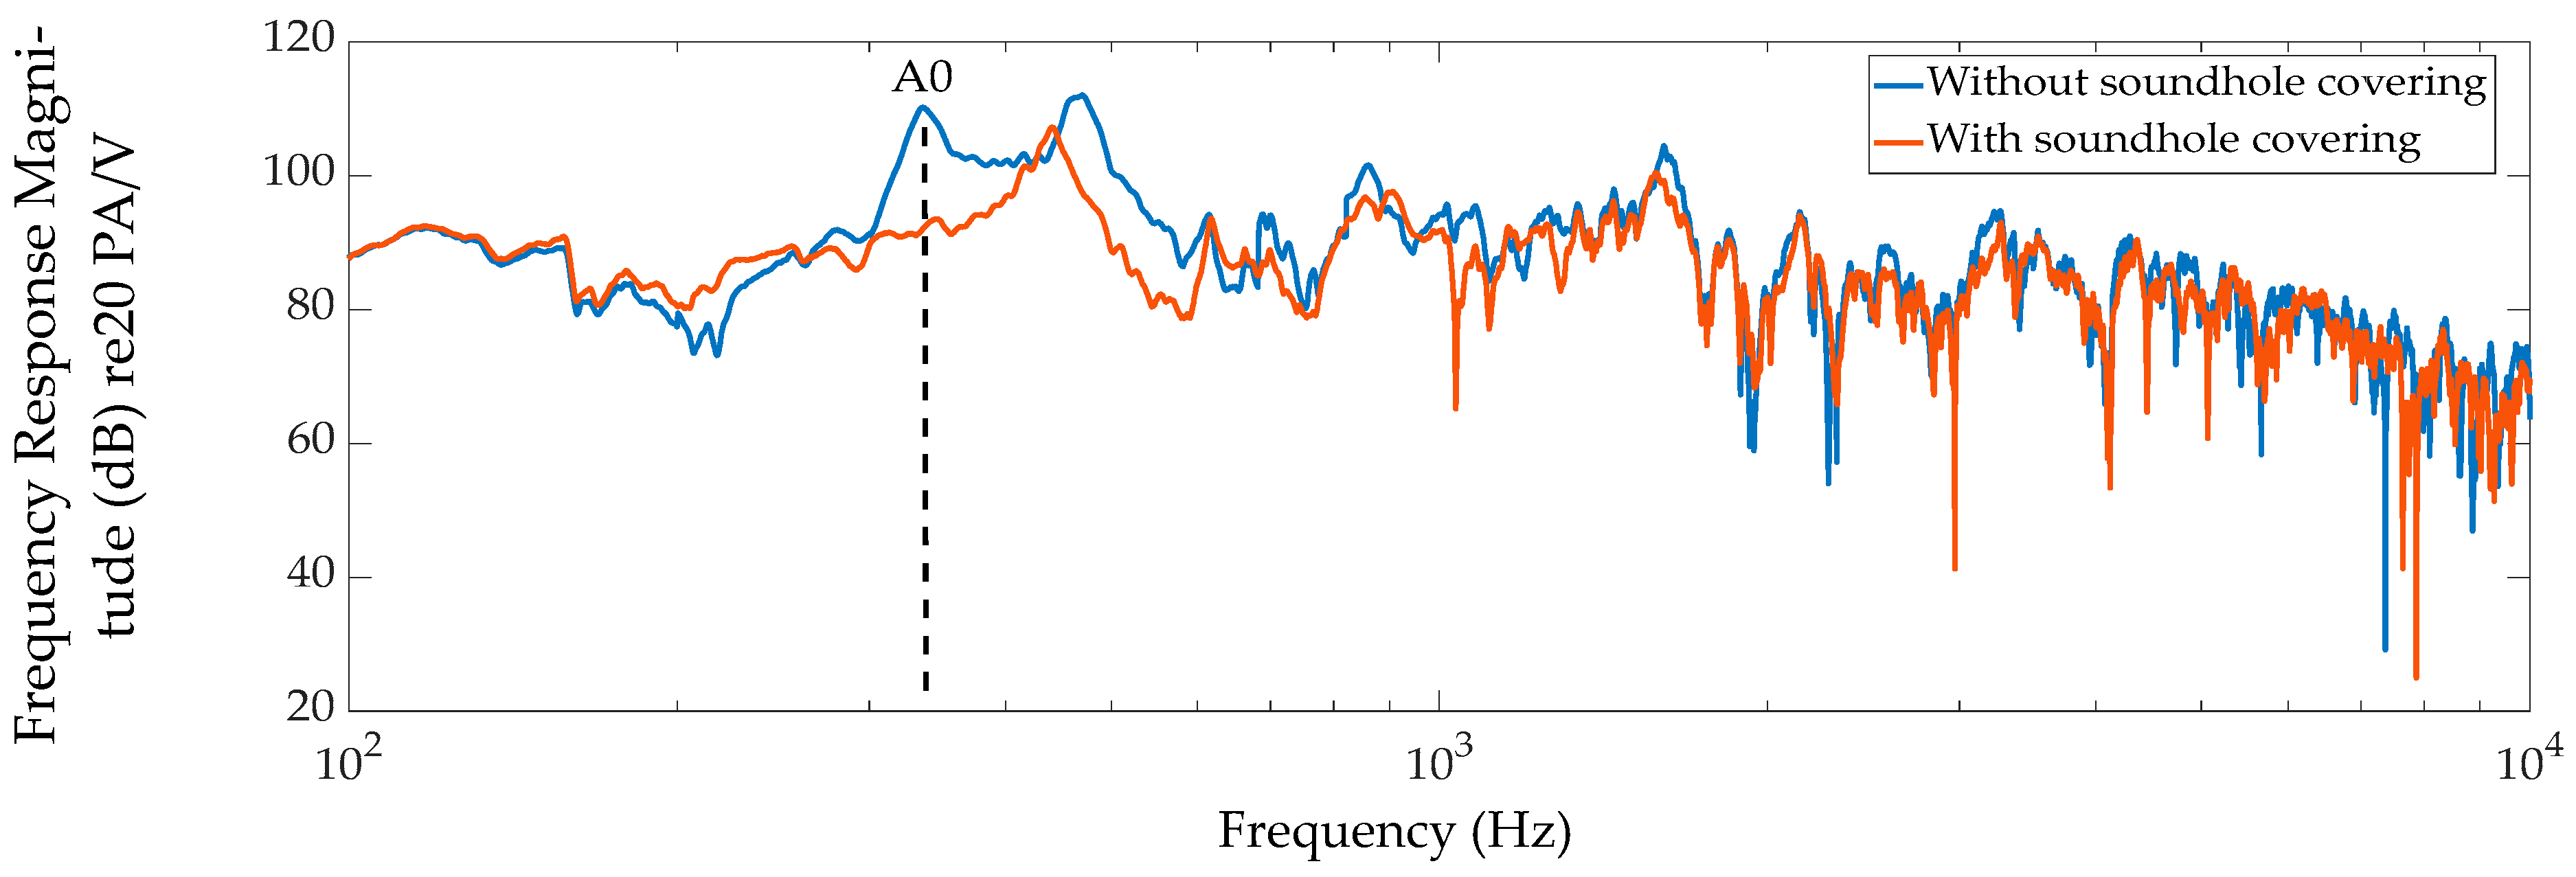
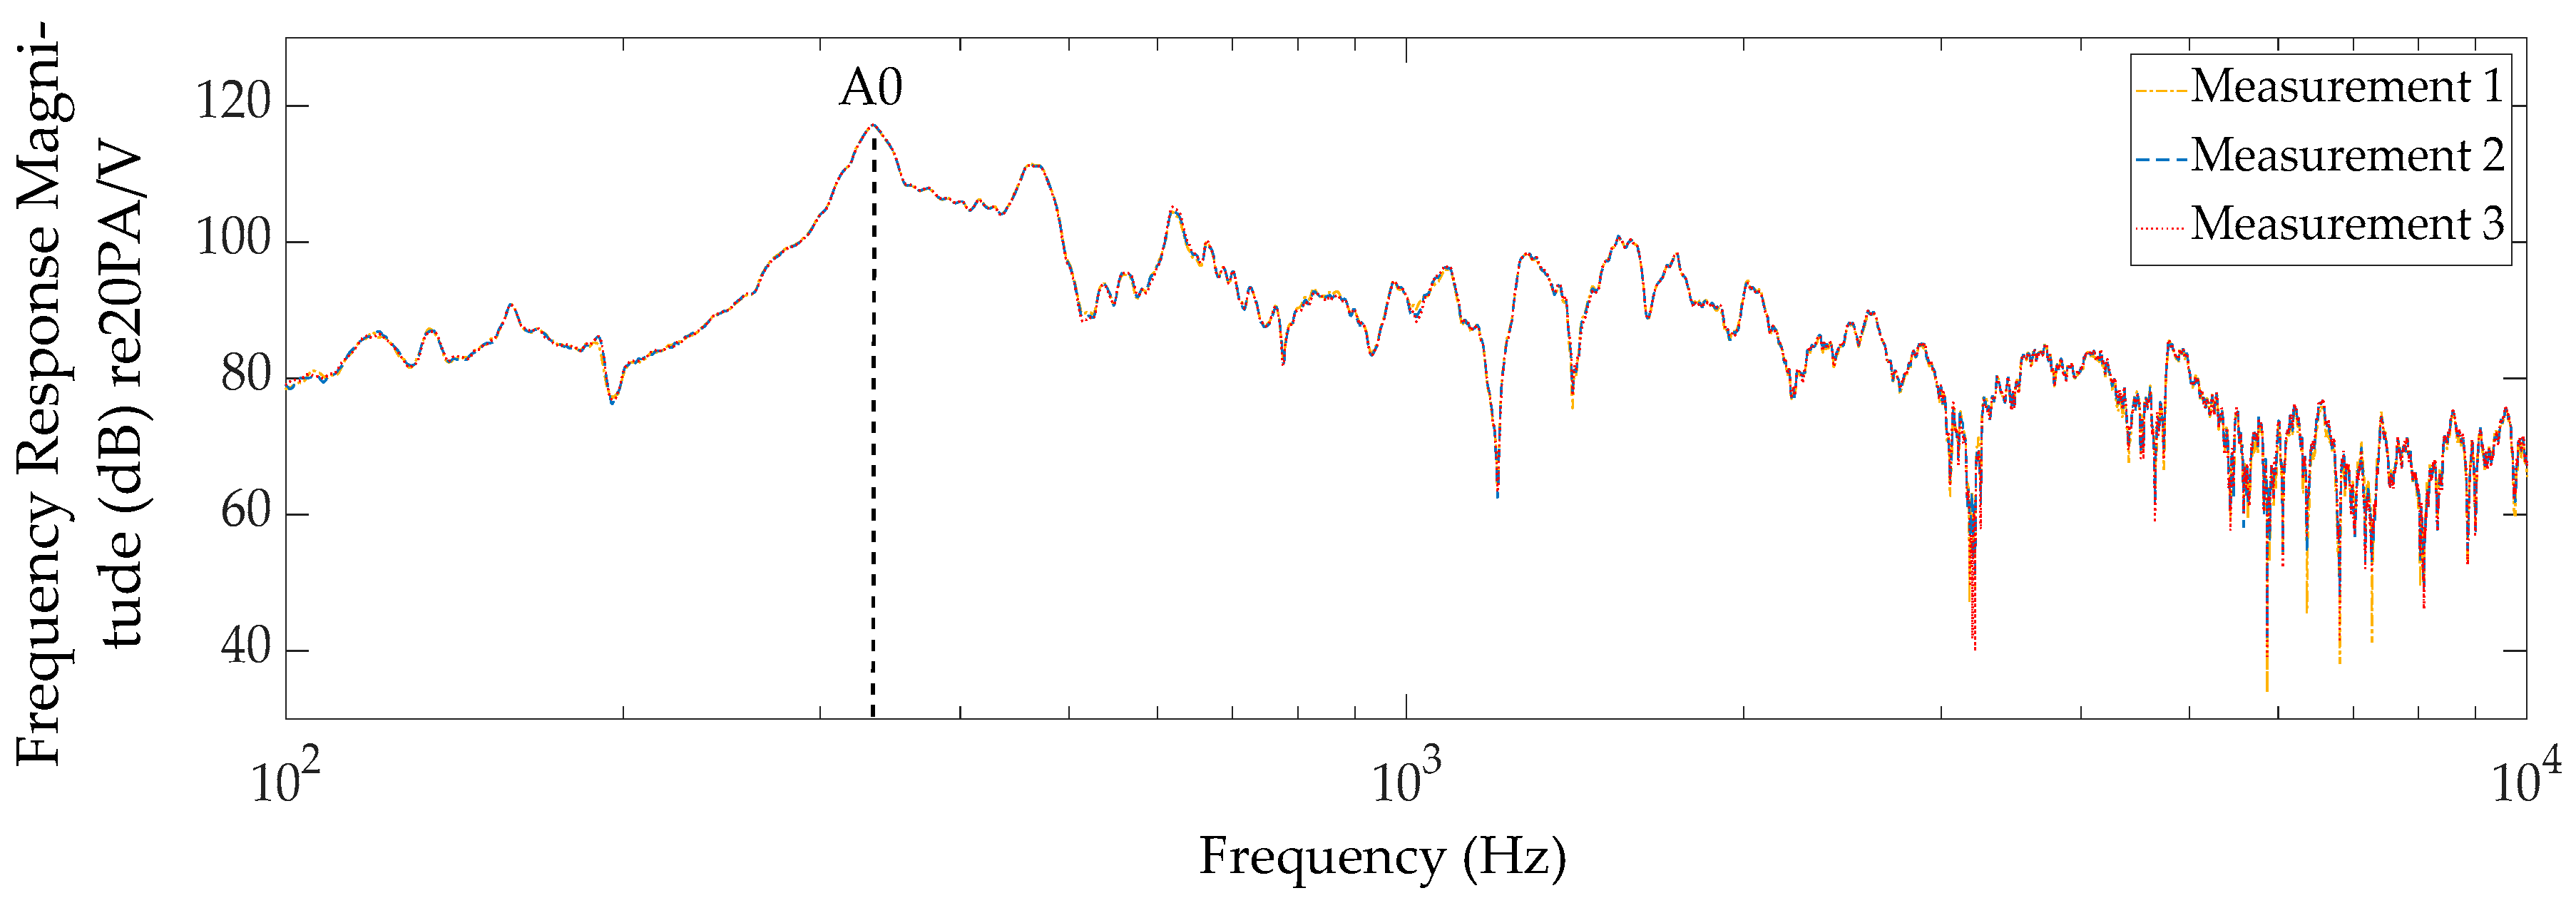
3.1. Acoustic Measurements

Figure 4 and Figure 5 show the frequency responses for measurement locations A and B, respectively, with sound holes open and sound holes closed. It is apparent that the largest difference in frequency response magnitude is for the A0 air frequency. The air resonance frequency measured in both locations is the same, at 336.2 Hz.

3.2. Acoustic Modeling

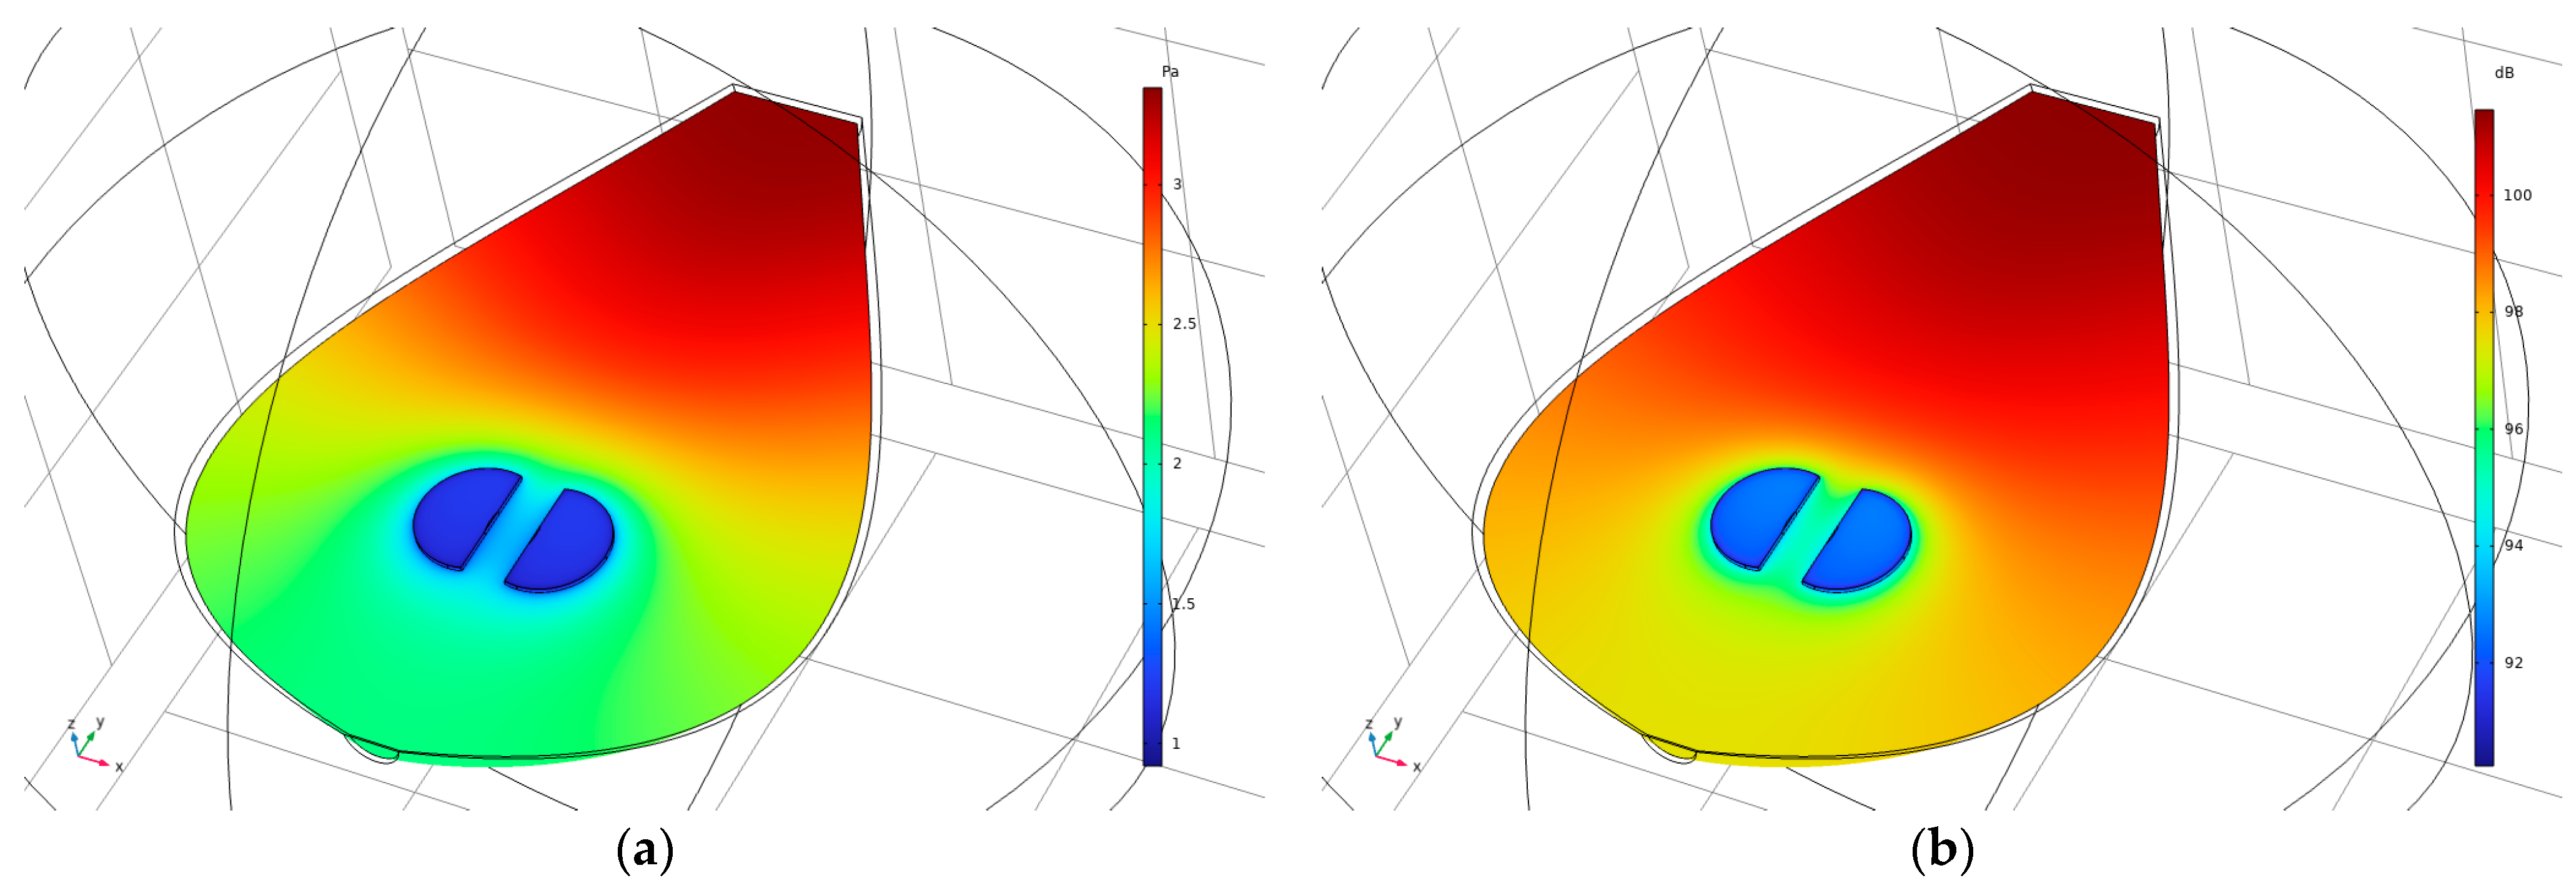
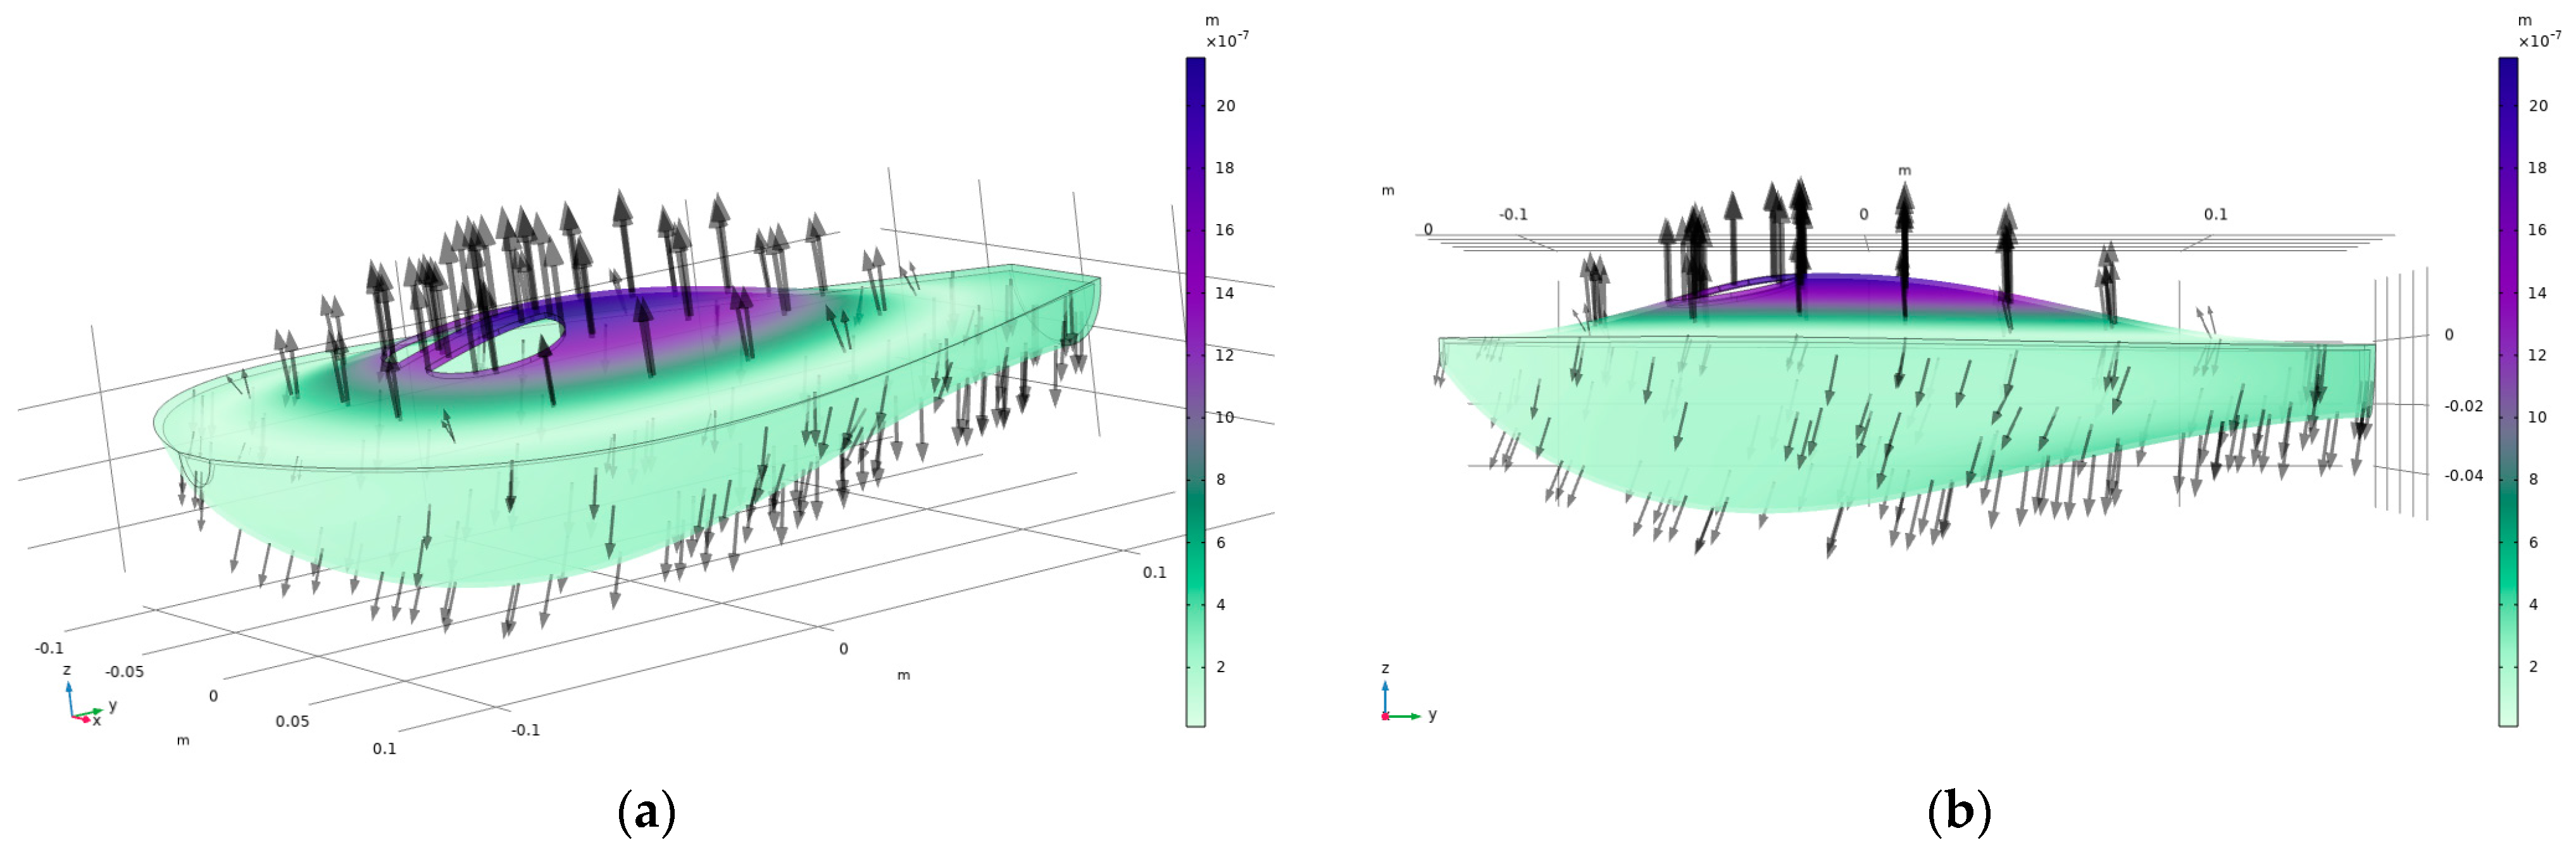
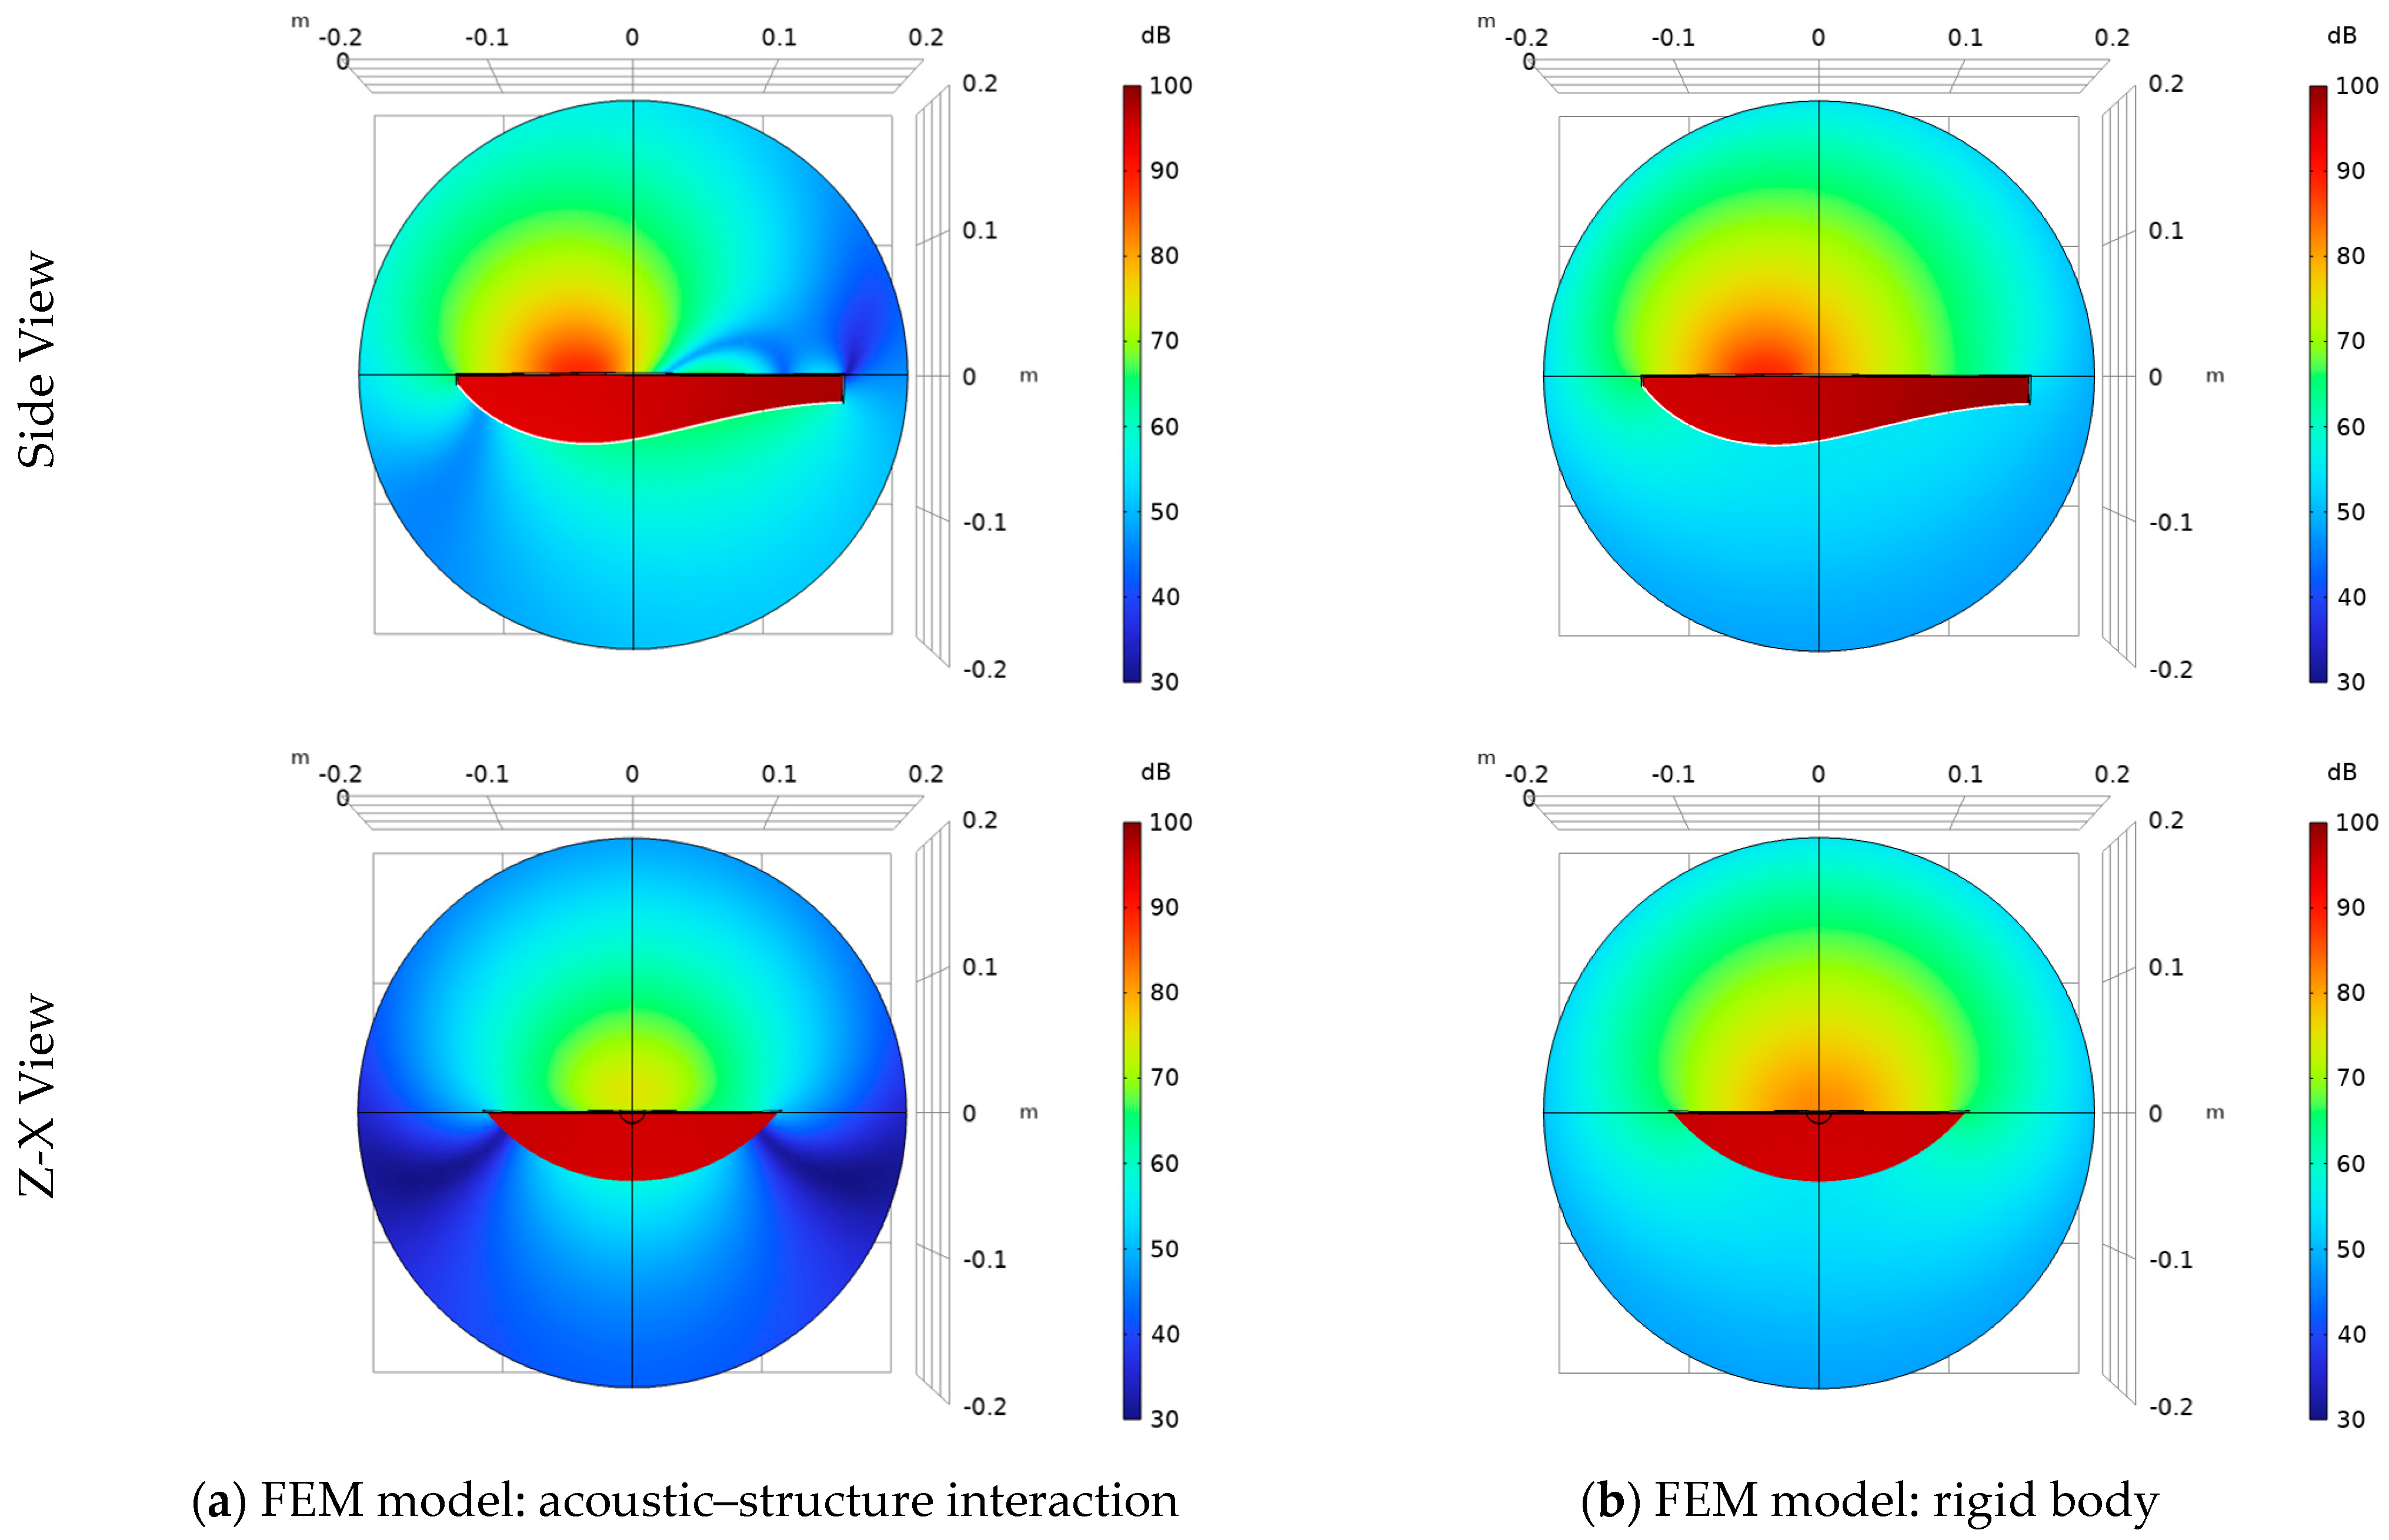
3.2.1. Acoustic–Structure Interaction
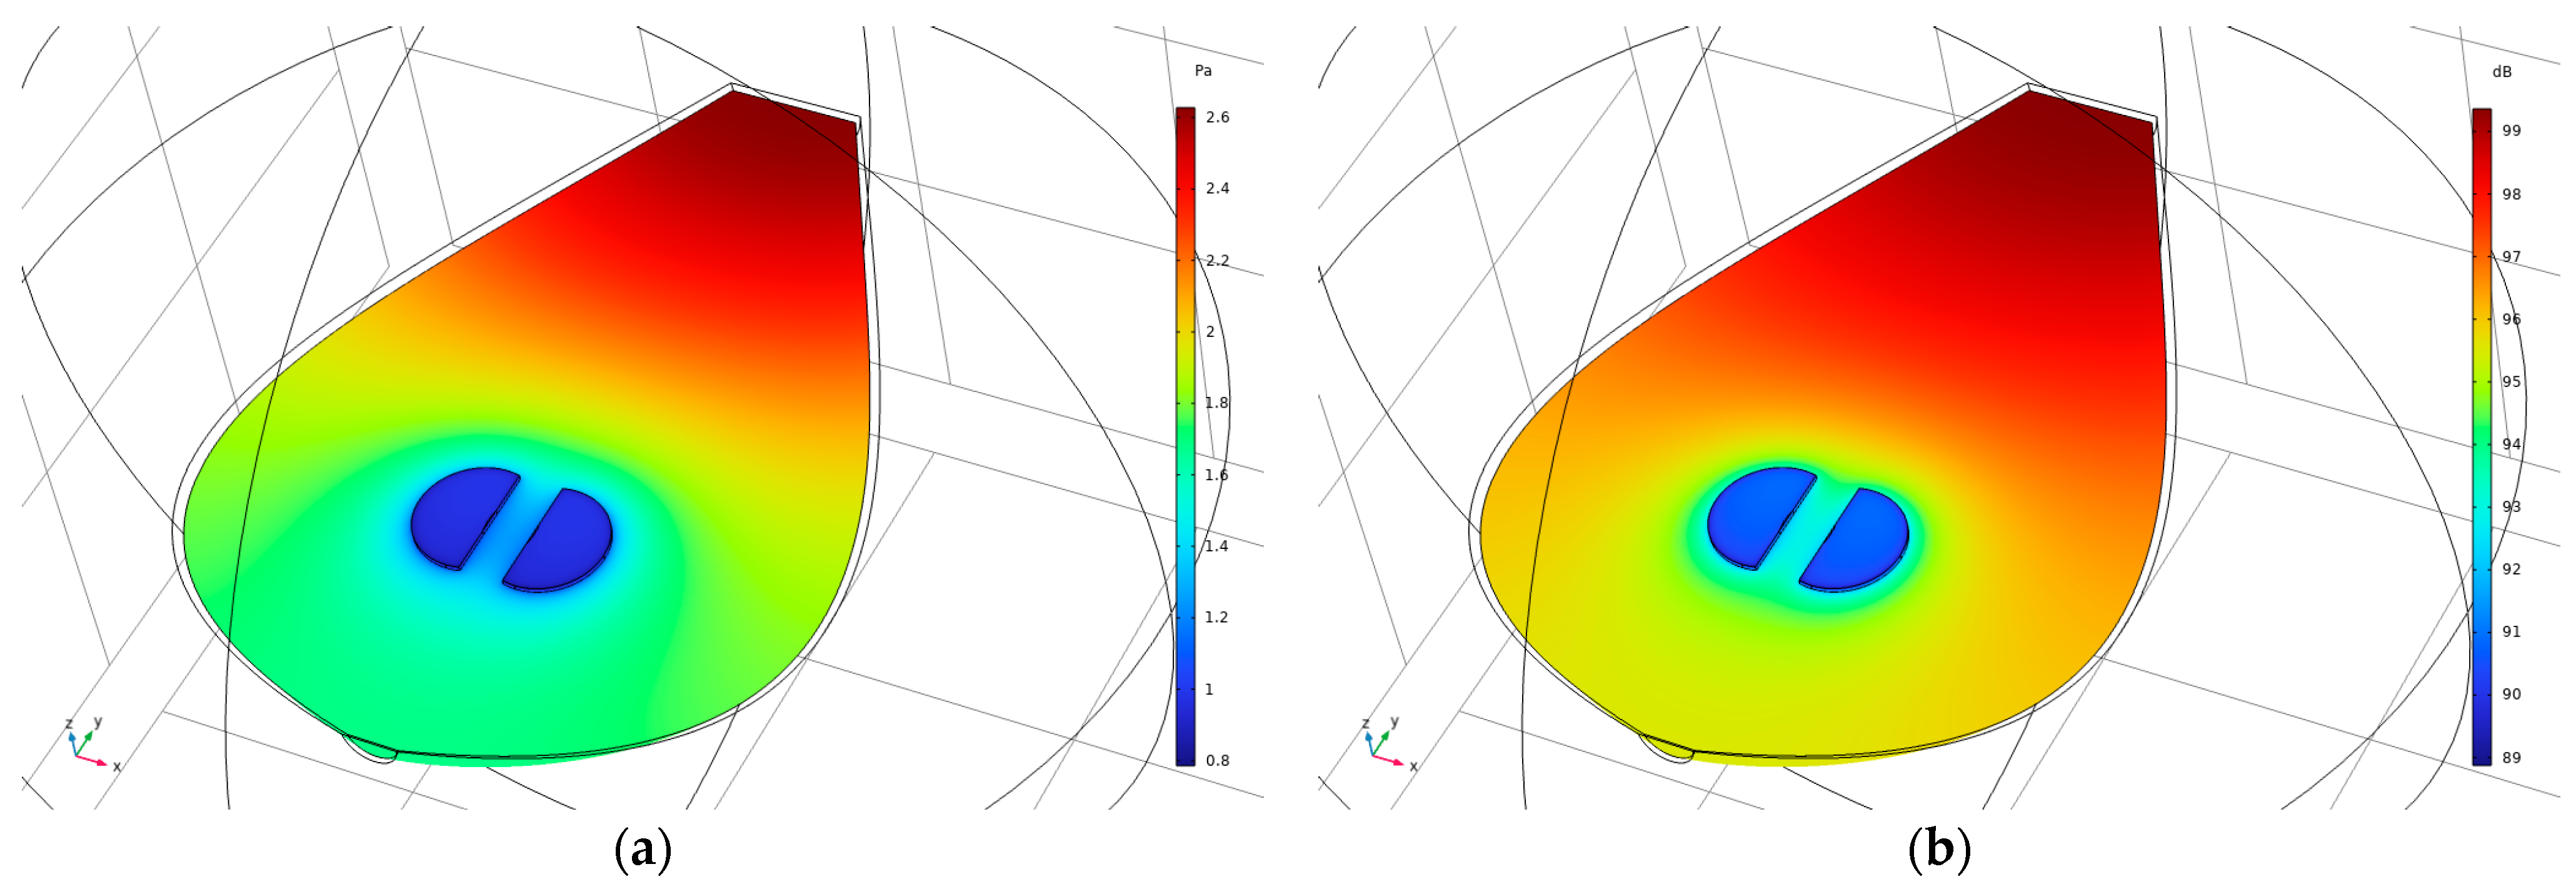
In the initial FEM modeling, an acoustic–structure interaction was utilized as presented in the methodology section. Results of the first eigenmode and the first eigenfrequency of 348.8 Hz are presented in the following figures. In Figure 6, the acoustic pressure distribution (a) and the sound pressure level distribution (b) found at 348.8 Hz are presented. The scale ranges from blue (low) to red (high). The acoustic pressure level and sound pressure level is computed everywhere but not shown in the outside air. Figure 7 presents three-quarter and side views of the Cretan lyra body displacements at the phase of maximum pressure in the cavity. It can be seen that the top and bottom of the Cretan lyra join in and act as springs, increasing the compliance of the system. They both bend outwards to accommodate for the pressure inside the cavity.

3.2.2. Rigid Body

In addition to the more complex acoustic–structure interaction model, a simple FEM rigid body model was also utilized. Unlike the previous model, all boundary conditions in the body of the Cretan lyra were defined as a hard surface. Therefore, no structural deformation of the lyra body was modeled. This model was used for comparison reasons of the results for the air mode resonance with that of the acoustic–structure interaction model. Results of the first eigenmode and the first eigenfrequency of 382.6 Hz are presented in Figure 8. More specifically, the acoustic pressure distribution and the sound pressure level distribution in the acoustic modeling (rigid walls) solution of the air mode resonance found at 382.6 Hz are presented. The scale ranges from blue (low) to red (high). The acoustic pressure level and the sound pressure level are computed everywhere but not shown in the outside air. While the basic shape of the acoustic pressure level and sound pressure level distribution remains almost identical with the acoustic–structure interaction model (Figure 6), the top and bottom plates now do not join in nor act as springs. This is going to affect the acoustic pressure levels and sound pressure levels outside the body of the Cretan lyra that is going to be presented in the next section (Section 3.2.3).

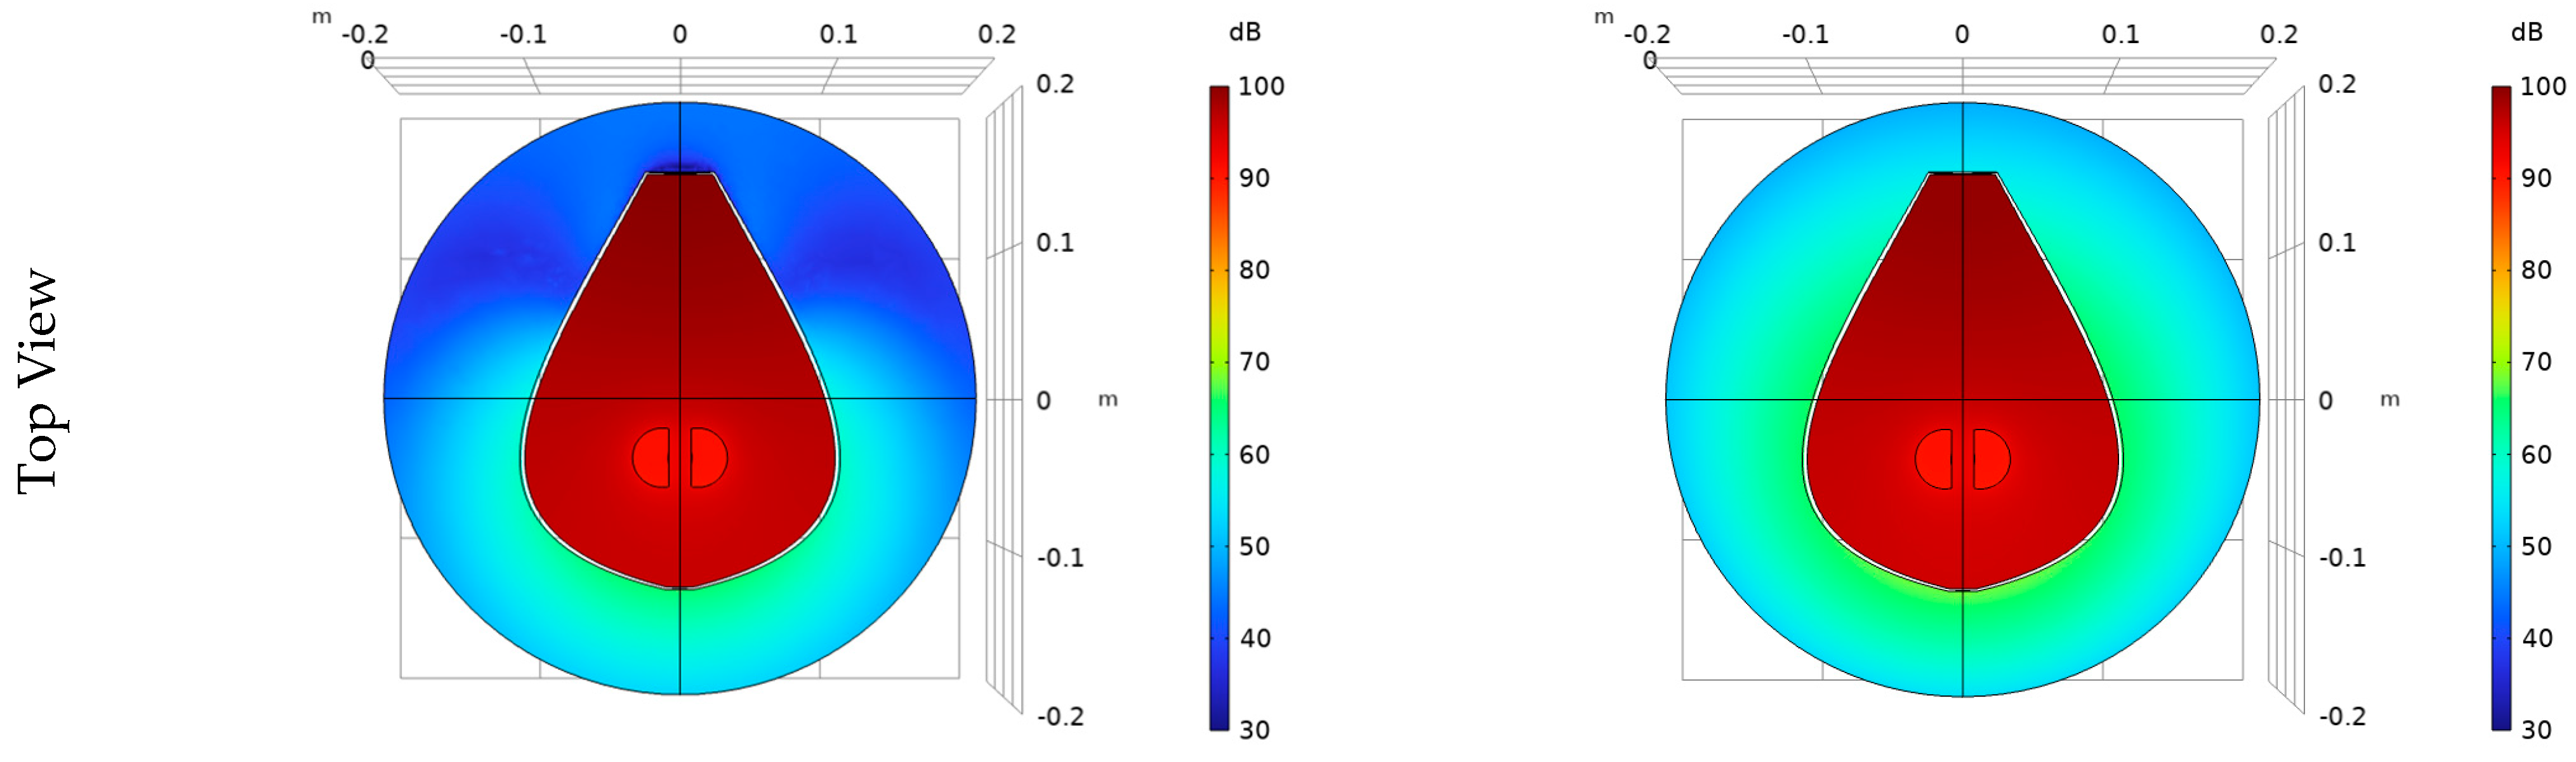
3.2.3. Comparison of SPL Distribution around the Cretan Lyra (Acoustic–Structure Interaction and Rigid Body)

As presented in Section 3.2.1 and also in Figure 7, the top and bottom of the body of the Cretan lyra act as springs, increasing the compliance of the system. They both bend outwards (and inwards in phase) to accommodate for the pressure inside the cavity. For the rigid model, the top and bottom plates do not join in nor act as springs. This is going to affect the acoustic pressure levels and sound pressure levels outside the body of the Cretan lyra. In Figure 9, the outlined air half-sphere outside of the Cretan lyra is included in order to let the mode freely decay rather than be artificially cut off just above the holes. A comparison of sound pressure level distribution for acoustic–structure interaction (a) and rigid body (b) for the FEM modeling around the Cretan lyra is presented in a slice from a top-view, side-view, and z-x view.

4. Discussion

The measurement results of the Cretan lyra with and without covered sound holes, as presented in Figure 4 and Figure 5, show that the air resonance frequency is 336.2 Hz. It can be seen that the effect of covered sound holes is more profound on the air resonance frequency than any other frequency in the whole frequency range. By changing the position of the vibration pickup, the frequency response changes, as expected, since different position of the vibration pickup may correspond to positions with different nodes and antinodes on the body of the Cretan lyra. However, the resonance frequency remains constant regardless of the position of the vibration pickup, as shown in Figure 4 and Figure 5.
The results for FEM modeling, in the cases of acoustic–structure interaction and rigid body, are presented in Section 3.2 and in Figure 6, Figure 7, Figure 8 and Figure 9. The air resonance frequency for the acoustic–structure interaction FEM model was found to be 348.8 Hz, and for the FEM model with rigid walls, 382.6 Hz. Collectively, the results of the air frequency for measurements and modeling are presented in Table 1. The distribution of the acoustic pressure and the sound pressure levels for the air resonances (Figure 6 and Figure 8) is typical in the case of the ‘air resonances’ of musical instruments [43,44] or the Helmholtz resonance for typical resonators [45,46]. For example, the acoustic pressure and the sound pressure levels have the lowest values in the sound holes of the lyra (similar to the values in the neck of the resonators). The differences in the distributions along the body of the instrument, however, have been observed in other publications for guitars [43,44]. This distribution is to be expected since the position of the neck and the body of the instrument is not of a typical Helmholtz resonator. Another point of the eigenmode analysis was that the air resonance frequency was the lowest resonance frequency, which is typical for these cases.
A comparison of the results between the measurements of the air resonance frequency and the FEM modeling in the case of acoustic–structure interaction shows a difference of 3.7%, while a comparison between the measurements and the FEM model with rigid walls has a larger difference of 13.8%. These results are similar to a study regarding the air frequency resonance in the case of the violin [21]. In this research, differences between the measurements and modeling of the air resonance frequency applying acoustic–structure interaction were in the order of 1%, while differences between measurements and rigid wall modeling were 6%. Similar results have been observed in a study [23] (violins) where, in the case of measurements with the walls fixed (rigid), the air frequency is higher than the air frequency when the walls are free to vibrate. An earlier study for acoustic guitars has also shown the necessity of acoustic–structure interaction analysis for the prediction of air resonance frequency [47]. The accuracy of results (e.g., compared to the aforementioned study [21]) is likely to be caused by several reasons. The precise knowledge of the characteristics of wood, essential for acoustic modeling, is not always possible, as these are likely to be affected by various factors (e.g., moisture content [48]). However, improving the quality of the acoustic modeling, and by extension its results, is very important, and research into solving this problem is already underway. Conclusively, the acoustic–structure interaction approach seems to provide more accurate results for the representation of the air resonance frequency, modes, and the acoustic behavior of musical instruments in general, while modeling with a rigid structure appears to be inadequate for complex problems.
Regarding some of the modeling results, it can be seen in Figure 6 (acoustic–structure interaction modeling) that the acoustic pressure distribution inside the Cretan lyra is not uniform. This is an indication that the resonance for this frequency is not a pure Helmholtz resonance, as these usually have a constant distribution. The same has been observed in similar studies that investigated the A0 resonance of the acoustic guitar [43,44]. In these studies it can be seen that the acoustic pressure distribution of the A0 resonance in the body of the acoustic guitar is non-uniform and very similar to the one found in this study regarding the A0 air resonance of the Cretan lyra (Figure 6).
In Figure 8, the outlined air half-sphere outside of the Cretan lyra has been included in order to let the mode freely decay rather than be artificially cut off just above the holes. With this approach, i.e., with the structure included, flexibility was added to the model in order to accurately represent the acoustic behavior of the instrument. While the basic shape of the acoustic mode remains almost identical in comparison to the rigid model (Figure 6 and Figure 8, respectively), the top and bottom of the Cretan lyra now join in and act as springs, increasing the compliance of the system. As can be seen in Figure 7, they both bend to accommodate the pressure inside the cavity. The form of the displacement of the Cretan lyra body for the A0 frequency is similar to the one observed for a violin [49] and a guitar body [16]. From this kind of analysis, sound propagation can be observed in different layouts of the Cretan lyra (and any instrument). Therefore, using this approach, possible changes can be predicted that will result from variations in the shape and dimensions of the sound holes.
Additionally, this research may have a musical impact on the evolution of the instrument. As mentioned before, the air resonance critically affects the instrument’s quality of sound. In a relevant study on 17 “bad-to-excellent” quality-rated violins [25], it was found that the only “robust” quality differentiator was the A0 cavity mode radiativity, in which excellent violins were rated significantly higher. This research could serve as a solid foundation for studying and improving the air resonance radiativity for the Cretan lyra. For example, initially, a possible direction for research could be to subjectively assess whether the same conclusion for violins (increased air resonance radiativity corresponds to increased quality rating) applies to Cretan lyras. If this is the case, the present research could evolve by seeking to increase the radiativity of lyras using different approaches. These approaches could involve different materials, different thicknesses, different shapes of the sound holes, as well as combinations thereof.
Finally, while perception of the sound of a musical instrument can be affected by various factors [50,51,52], the results of this study show that the FEM and the acoustic–structure interaction modeling approach can be useful for the accurate prediction of the acoustic behavior of the Cretan lyra. This approach can be used for other directions for the modeling and improvement of the instrument that could also have a musical impact. Some of these directions may be the improvement of the shape of the bridge; the study of the effect and the function of the soundbar, both structurally and acoustically; as well as the overall modeling of the instrument, which will include the interactions of the soundpost, strings, and body of the instrument. We hope that this study will serve as a starting point for future research on the Cretan lyra.

5. Conclusions

For this study, the air resonance in a Cretan lyra is investigated with the use of the finite element method (FEM) and acoustic measurements. Two different FEM acoustic models were applied in this investigation. First, a pressure acoustics model with the Cretan lyra body treated as rigid was used to provide an approximate result. Secondly, an acoustic–structure interaction model with the Cretan lyra was applied for a more accurate representation. In addition, measurements using an Exponential Sine Sweep (ESS) signal were performed to identify the air resonance frequency of the Cretan lyra. Results of this study showed that the acoustic–structure interaction model had a 3.7% difference compared to the actual measurements of the resonance frequency. In contrast, the pressure acoustics solution with rigid walls is approximately 13.8% too high compared to the actual measurements.
The evidence from this study supports the idea that the acoustic–structure interaction modeling provides superior results, verified by acoustic measurements. Rigid analysis is inadequate for an accurate modeling in the case of a Cretan lyra. In addition, our study presented the sound level pressure distribution outside the Cretan lyra, which is useful for the representation of the radiativity of the instrument. Therefore, this research could serve as a solid foundation for studying and improving the air resonance radiativity of the Cretan lyra, with approaches including different materials, different thicknesses, different shapes of the sound holes, as well as combinations of the above. Finally, the acoustic–structure interaction approach that was applied in this study can be used for other directions for the modeling and improvement of the instrument, such as the improvement of the shape of the bridge, the study of the effect of the soundbar as well as the overall modeling of the instrument, which will include the interactions of the soundpost, strings, and body of the instrument.

Author Contributions

Conceptualization, N.M.P.; methodology, N.M.P.; software, N.M.P. and N.N.; formal analysis, N.M.P. and G.E.S.; investigation, N.M.P.; resources, N.M.P.; data curation, N.M.P. and G.E.S.; writing—original draft preparation, N.M.P.; writing—review and editing, N.M.P. and G.E.S.; visualization, N.M.P.; supervision, N.M.P. and G.E.S.; project administration, N.M.P. All authors have read and agreed to the published version of the manuscript.

Funding

This research received no external funding.

Data Availability Statement

The data presented in this study are available upon request from the corresponding author.

Acknowledgments

We gratefully acknowledge the contribution of Emmanuel Nikakis in the construction stage of the 3D model of the Cretan lyra. We would like to thank the following people for their support, as without their help, this work would never have been possible: Konstantinos Papadakis, Konstantinos Plevrakis, Antonis Plevrakis, and Nikolaos Perakis. We would also like to thank the reviewers of this study for their constructive comments that made us see this study and its future potential from a different perspective.

Conflicts of Interest

The authors declare no conflict of interest.

Appendix A

Table A1. Dimensions of the modeled Cretan lyra body (Figure 2).
Dimensionsabcdefhj
mm279208462319461956
Table A2. Acoustic measurement positions (Figure 2).
Measurement PositionsAB
(x, y, z) (mm, mm, mm)(50, 57, 6)(41, 51, −46)

Appendix B

Table A3. Physical material properties for cedarwood (L: longitudinal, R: radical, T: tangential. Three principal axes of wood with respect to grain direction and growth rings. L: parallel to fiber direction).
Speed of Sound (m/s)Density
(kg/m3)
DirectionYoung’s Modulus
(N/mm2)
PlaneShear Modulus (N/mm2)Poisson’s Ratio
4458550L7920LR10360.55
T677LT8880.59
R1069RT2860.59
Table A4. Physical material properties for mulberry.
Speed of Sound (m/s)Density
(kg/m3)
Young’s Modulus
(N/mm2)
Shear Modulus (N/mm2)Poisson’s Ratio
3130647630017850.37

Appendix C

In Figure A1, three consecutive measurements made at position A using an Exponential Sine Sweep are presented. It appears that the repeatability of the measurements in terms of frequency response is high, as there are very small differences between the measurements.
Figure A1. Measured frequency response of a Cretan lyra with and without sound hole covering for frequency range 100 Hz–10,000 Hz (microphone position: A) The line thickness of the frequency responses of the measurements was chosen to be small so that the differences could be distinguished.
Vibration 06 00056 g0a1

References

  1. Pavlopoulou, A. Musical Tradition and Change on the Island of Crete; Goldsmiths, University of London: London, UK, 2012. [Google Scholar]
  2. Dawe, K. Symbolic and social transformation in the lute cultures of Crete: Music, technology and the body in a Mediterranean society. Yearb. Tradit. Music 2005, 37, 58–68. [Google Scholar] [CrossRef]
  3. Hnaraki, M. Cretan Music: Unraveling Ariadne’s Thread; Kerkyra Publications: Attica, Greece, 2007. [Google Scholar]
  4. Dawe, K. Lyres and the body politic: Studying musical instruments in the Cretan musical landscape. Pop. Music. Soc. 2003, 26, 263–283. [Google Scholar] [CrossRef]
  5. Martin, A.R.; Mihalka, M. Music around the World: A Global Encyclopedia [3 volumes]: A Global Encyclopedia; ABC-CLIO: Santa Barbara, CA, USA, 2020. [Google Scholar]
  6. Fay, R. Ways of Understanding: Ethnomusicology and the Cretan Lyra; The University of Manchester: Manchester, UK, 2011. [Google Scholar]
  7. Cremer, L. The Physics of Violin. MA. 1984. Available online: https://philpapers.org/rec/CRETPO-11 (accessed on 1 August 2023).
  8. Bader, R.; Hansen, U. Acoustical analysis and modeling of musical instruments using modern signal processing methods. In Handbook of Signal Processing in Acoustics; Springer: New York, NY, USA, 2008; pp. 219–247. [Google Scholar]
  9. Sakai, S.; Samejima, T. Vibro-acoustic analysis of cellos using the finite and boundary element methods and its application to studies on the effects of endpin properties. Acoust. Sci. Technol. 2023, 44, 259–268. [Google Scholar] [CrossRef]
  10. Bilbao, S.; Hamilton, B.; Harrison, R.; Torin, A. Finite-difference schemes in musical acoustics: A tutorial. In Springer Handbook of Systematic Musicology; Springer: Berlin/Heidelberg, Germany, 2018; pp. 349–384. [Google Scholar] [CrossRef]
  11. Bader, R. Nonlinearities and Synchronization in Musical Acoustics and Music Psychology; Springer Science & Business Media: Berlin/Heidelberg, Germany, 2013; Volume 2. [Google Scholar]
  12. Papadakis, N.M.; Stavroulakis, G.E. Time domain finite element method for the calculation of impulse response of enclosed spaces. Room acoustics application. Mech. Hear. Protein Percept. 12th Int. Workshop Mech. Hear. 2015, 1703, 100002. [Google Scholar] [CrossRef]
  13. Papadakis, N.M.; Stavroulakis, G.E. Finite Element Method for the Estimation of Insertion Loss of Noise Barriers: Comparison with Various Formulae (2D). Urban Sci. 2020, 4, 77. [Google Scholar] [CrossRef]
  14. Ballou, G. Handbook for Sound Engineers; Taylor & Francis: Abingdon, UK, 2013; p. 228. [Google Scholar]
  15. Bakarezos, M.; Gymnopoulos, S.; Brezas, S.; Orfanos, Y.; Maravelakis, E.; Papadopoulos, C.; Tatarakis, M.; Antoniadis, A.; Papadogiannis, N. Vibration analysis of the top plates of traditional greek string musical instruments. In Proceedings of the 13th International Congress on Sound and Vibration, Vienna, Austria, 2–6 July 2006; pp. 4939–4946. [Google Scholar]
  16. Fletcher, N.H.; Rossing, T.D. The Physics of Musical Instruments; Springer Science & Business Media: Berlin/Heidelberg, Germany, 2012. [Google Scholar]
  17. Wolfe, J. Helmholtz Resonance. Available online: https://newt.phys.unsw.edu.au/jw/Helmholtz.html (accessed on 22 July 2023).
  18. Le Carrou, J.-L.; Gautier, F.; Foltête, E. Experimental study of A0 and T1 modes of the concert harp. J. Acoust. Soc. Am. 2007, 121, 559–567. [Google Scholar] [CrossRef]
  19. Woodhouse, J. The acoustics of a plucked harp string. J. Sound Vib. 2022, 523, 116669. [Google Scholar] [CrossRef]
  20. Bucur, V.; Bucur, V. Material Properties and the Modes of Vibration of the Concert Harp Soundboard. In Handbook of Materials for String Musical Instruments; Springer: Berlin/Heidelberg, Germany, 2016; pp. 249–282. [Google Scholar]
  21. Nia, H.T.; Jain, A.D.; Liu, Y.; Alam, M.-R.; Barnas, R.; Makris, N.C. The evolution of air resonance power efficiency in the violin and its ancestors. Proc. R. Soc. A Math. Phys. Eng. Sci. 2015, 471, 20140905. [Google Scholar] [CrossRef]
  22. Gonzalez, S.; Salvi, D.; Baeza, D.; Antonacci, F.; Sarti, A. A data-driven approach to violin making. Sci. Rep. 2021, 11, 9455. [Google Scholar] [CrossRef]
  23. Rossing, T.D. The Science of String Instruments; Springer: Berlin/Heidelberg, Germany, 2010. [Google Scholar]
  24. Gough, C.E. A violin shell model: Vibrational modes and acoustics. J. Acoust. Soc. Am. 2015, 137, 1210–1225. [Google Scholar] [CrossRef]
  25. Bissinger, G. Structural acoustics of good and bad violins. J. Acoust. Soc. Am. 2008, 124, 1764–1773. [Google Scholar] [CrossRef] [PubMed]
  26. Güntekin, E.; Yılmaz Aydın, T.; Aydın, M. Elastic constants of Calabrian pine and cedar. In Proceedings of the International Forestry Symposium, Kastamonu, Türkiye, 7–10 December 2016; pp. 645–649. [Google Scholar]
  27. Yoshikawa, S. Acoustical classification of woods for string instruments. J. Acoust. Soc. Am. 2007, 122, 568–573. [Google Scholar] [CrossRef] [PubMed]
  28. French, R.M. Acoustic Guitar Design; Springer: Berlin/Heidelberg, Germany, 2022. [Google Scholar]
  29. Jansson, E.V. Acoustical properties of complex cavities. Prediction and measurements of resonance properties of violin-shaped and guitar-shaped cavities. Acta Acust. United Acust. 1977, 37, 211–221. [Google Scholar]
  30. Hutchins, C.M. A study of the cavity resonances of a violin and their effects on its tone and playing qualities. J. Acoust. Soc. Am. 1990, 87, 392–397. [Google Scholar] [CrossRef]
  31. Farina, A.; Langhoff, A.; Tronchin, L. Acoustic characterisation of “virtual” musical instruments: Using MLS technique on ancient violins. J. New Music Res. 1998, 27, 359–379. [Google Scholar] [CrossRef]
  32. Morset, L.H. A low-cost PC-based tool for violin acoustics measurements. Catgut Acoust. Soc. (CAS) J. 2001, 4, 45. [Google Scholar]
  33. Papadakis, N.M.; Antoniadou, S.; Stavroulakis, G.E. Effects of Varying Levels of Background Noise on Room Acoustic Parameters, Measured with ESS and MLS Methods. Acoustics 2023, 5, 563–574. [Google Scholar] [CrossRef]
  34. Farina, A. Simultaneous measurement of impulse response and distortion with a swept-sine technique. In Proceedings of the 108th Audio Engineering Society Convention, Paris, France, 21–24 October 2000. [Google Scholar]
  35. Papadakis, N.M.; Stavroulakis, G.E. Review of Acoustic Sources Alternatives to a Dodecahedron Speaker. Appl. Sci. 2019, 9, 3705. [Google Scholar] [CrossRef]
  36. Papadakis, N.M.; Stavroulakis, G.E. Low Cost Omnidirectional Sound Source Utilizing a Common Directional Loudspeaker for Impulse Response Measurements. Appl. Sci. 2018, 8, 1703. [Google Scholar] [CrossRef]
  37. Papadakis, N.M.; Stavroulakis, G.E. Handclap for Acoustic Measurements: Optimal Application and Limitations. Acoustics 2020, 2, 224–245. [Google Scholar] [CrossRef]
  38. de Vos, R.; Papadakis, N.M.; Stavroulakis, G.E. Improved Source Characteristics of a Handclap for Acoustic Measurements: Utilization of a Leather Glove. Acoustics 2020, 2, 803–811. [Google Scholar] [CrossRef]
  39. Chaigne, A.; Kergomard, J. Acoustics of Musical Instruments; Springer: Berlin/Heidelberg, Germany, 2016. [Google Scholar]
  40. Zienkiewicz, O. Coupled Vibrations of a Structure Submerged in a Compressible Fluid. In Proceedings of the Symposium on Finite Element Techniques Held at the University of Stuttgart. 1969. Available online: https://cir.nii.ac.jp/crid/1570291224816730880 (accessed on 1 August 2023).
  41. Sigrist, J.-F. Fluid-Structure Interaction: An Introduction to Finite Element Coupling; John Wiley & Sons: Hoboken, NJ, USA, 2015. [Google Scholar]
  42. Hatami, M. Weighted Residual Methods: Principles, Modifications and Applications; Academic Press: Cambridge, MA, USA, 2017. [Google Scholar]
  43. Elejabarrieta, M.; Santamaria, C.; Ezcurra, A. Air cavity modes in the resonance box of the guitar: The effect of the sound hole. J. Sound Vib. 2002, 252, 584. [Google Scholar] [CrossRef]
  44. Ezcurra, A.; Elejabarrieta, M.; Santamaria, C. Fluid–structure coupling in the guitar box: Numerical and experimental comparative study. Appl. Acoust. 2005, 66, 411–425. [Google Scholar] [CrossRef]
  45. Papadakis, N.M.; Stavroulakis, G.E. FEM Investigation of a Multi-Neck Helmholtz Resonator. Appl. Sci. 2023, 13, 10610. [Google Scholar] [CrossRef]
  46. Li, L.; Liu, Y.; Zhang, F.; Sun, Z. Several explanations on the theoretical formula of Helmholtz resonator. Adv. Eng. Softw. 2017, 114, 361–371. [Google Scholar] [CrossRef]
  47. Christensen, O.; Vistisen, B.B. Simple model for low-frequency guitar function. J. Acoust. Soc. Am. 1980, 68, 758–766. [Google Scholar] [CrossRef]
  48. Güntekin, E.; Niemz, P. Prediction of Young’s Modulus in Three Orthotropic Directions for Some Important Turkish Wood Species Using Ultrasound. In Proceedings of the 19th International Nondestructive Testing and Evaluation of Wood Symposium, Rio de Janeiro, Brazil, 22–25 September 2015. [Google Scholar]
  49. Rossing, T.D.; Rossing, T.D. Springer Handbook of Acoustics; Springer: Berlin/Heidelberg, Germany, 2014. [Google Scholar]
  50. Bishop, L.; Goebl, W. Music and movement: Musical instruments and performers. The Routledge Companion to Music Cognition; Routledge: New York, NY, USA, 2017. [Google Scholar]
  51. Papadakis, N.M.; Zantzas, A.; Lafazanis, K.; Stavroulakis, G.E. Influence of Color on Loudness Perception of Household Appliances: Case of a coffee maker. Designs 2022, 6, 101. [Google Scholar] [CrossRef]
  52. Thoret, E.; Caramiaux, B.; Depalle, P.; Mcadams, S. Learning metrics on spectrotemporal modulations reveals the perception of musical instrument timbre. Nat. Hum. Behav. 2021, 5, 369–377. [Google Scholar] [CrossRef]
Figure 1. (a) Top view of a Cretan lyra (b) Side view of a Cretan lyra. It can be seen that the fingerboard is not in contact with the main body of the lyra, allowing it to vibrate freely.
Vibration 06 00056 g001
Figure 2. Diagram of the setup of the acoustic measurements, including the Cretan lyra, the speaker, the vibration pickup, and the audio interface.
Vibration 06 00056 g002
Figure 3. Top (a) and side (b) view of the modeled Cretan lyra body. Dimensions and measurement positions (M:A, M:B) are presented. Full dimensions and measurement positions are included in Appendix A (Table A1 and Table A2).
Vibration 06 00056 g003
Figure 4. Measured frequency response of a Cretan lyra with and without sound hole covering for frequency range 100 Hz–10,000 Hz (microphone position: A). Differences in magnitude with and without sound hole covering were found to be 26.1 dB.
Vibration 06 00056 g004
Figure 5. Measured frequency response of a Cretan lyra with and without sound hole covering for frequency range 100 Hz–10,000 Hz (microphone position: B). Differences in magnitude with and without sound hole covering were found to be 20.3 dB.
Vibration 06 00056 g005
Figure 6. The acoustic pressure distribution (a) and the sound pressure level distribution (b) in the acoustic–structure interaction solution of the air mode resonance found at 348.8 Hz. The scale ranges from blue (low) to red (high). The acoustic pressure level and the sound pressure level is computed everywhere but not shown in the outside air.
Vibration 06 00056 g006
Figure 7. Three-quarter (a) and side views (b) of the Cretan lyra body displacements at the phase of maximum pressure in the cavity. The eigenfrequency is now lowered to 348.8 Hz.
Vibration 06 00056 g007
Figure 8. The acoustic pressure distribution (a) and the sound pressure level distribution (b) in the acoustic modeling (rigid walls) solution of the air mode resonance found at 382.6 Hz. The scale ranges from blue (low) to red (high). The acoustic pressure level and the sound pressure level is computed everywhere but not shown in the outside air.
Vibration 06 00056 g008
Figure 9. Comparison of sound pressure level distribution results of FEM modeling in the cases of acoustic–structure interaction (a) and rigid body (b). Results are presented in a slice around the Cretan Lyra from a top-view, side-view, and z-x view.
Vibration 06 00056 g009aVibration 06 00056 g009b
Table 1. Measured and modeled air resonance frequency of the Cretan lyra.
FEM Modeling
Acoustic MeasurementsAcoustic–structure
Interaction
Rigid Body
A0 (Hz)336.2348.8382.6
Disclaimer/Publisher’s Note: The statements, opinions and data contained in all publications are solely those of the individual author(s) and contributor(s) and not of MDPI and/or the editor(s). MDPI and/or the editor(s) disclaim responsibility for any injury to people or property resulting from any ideas, methods, instructions or products referred to in the content.

