
Detection of Water Leaks in Suburban Distribution Mains with Lift and Shift Vibro-Acoustic Sensors


Abstract
:1. Introduction
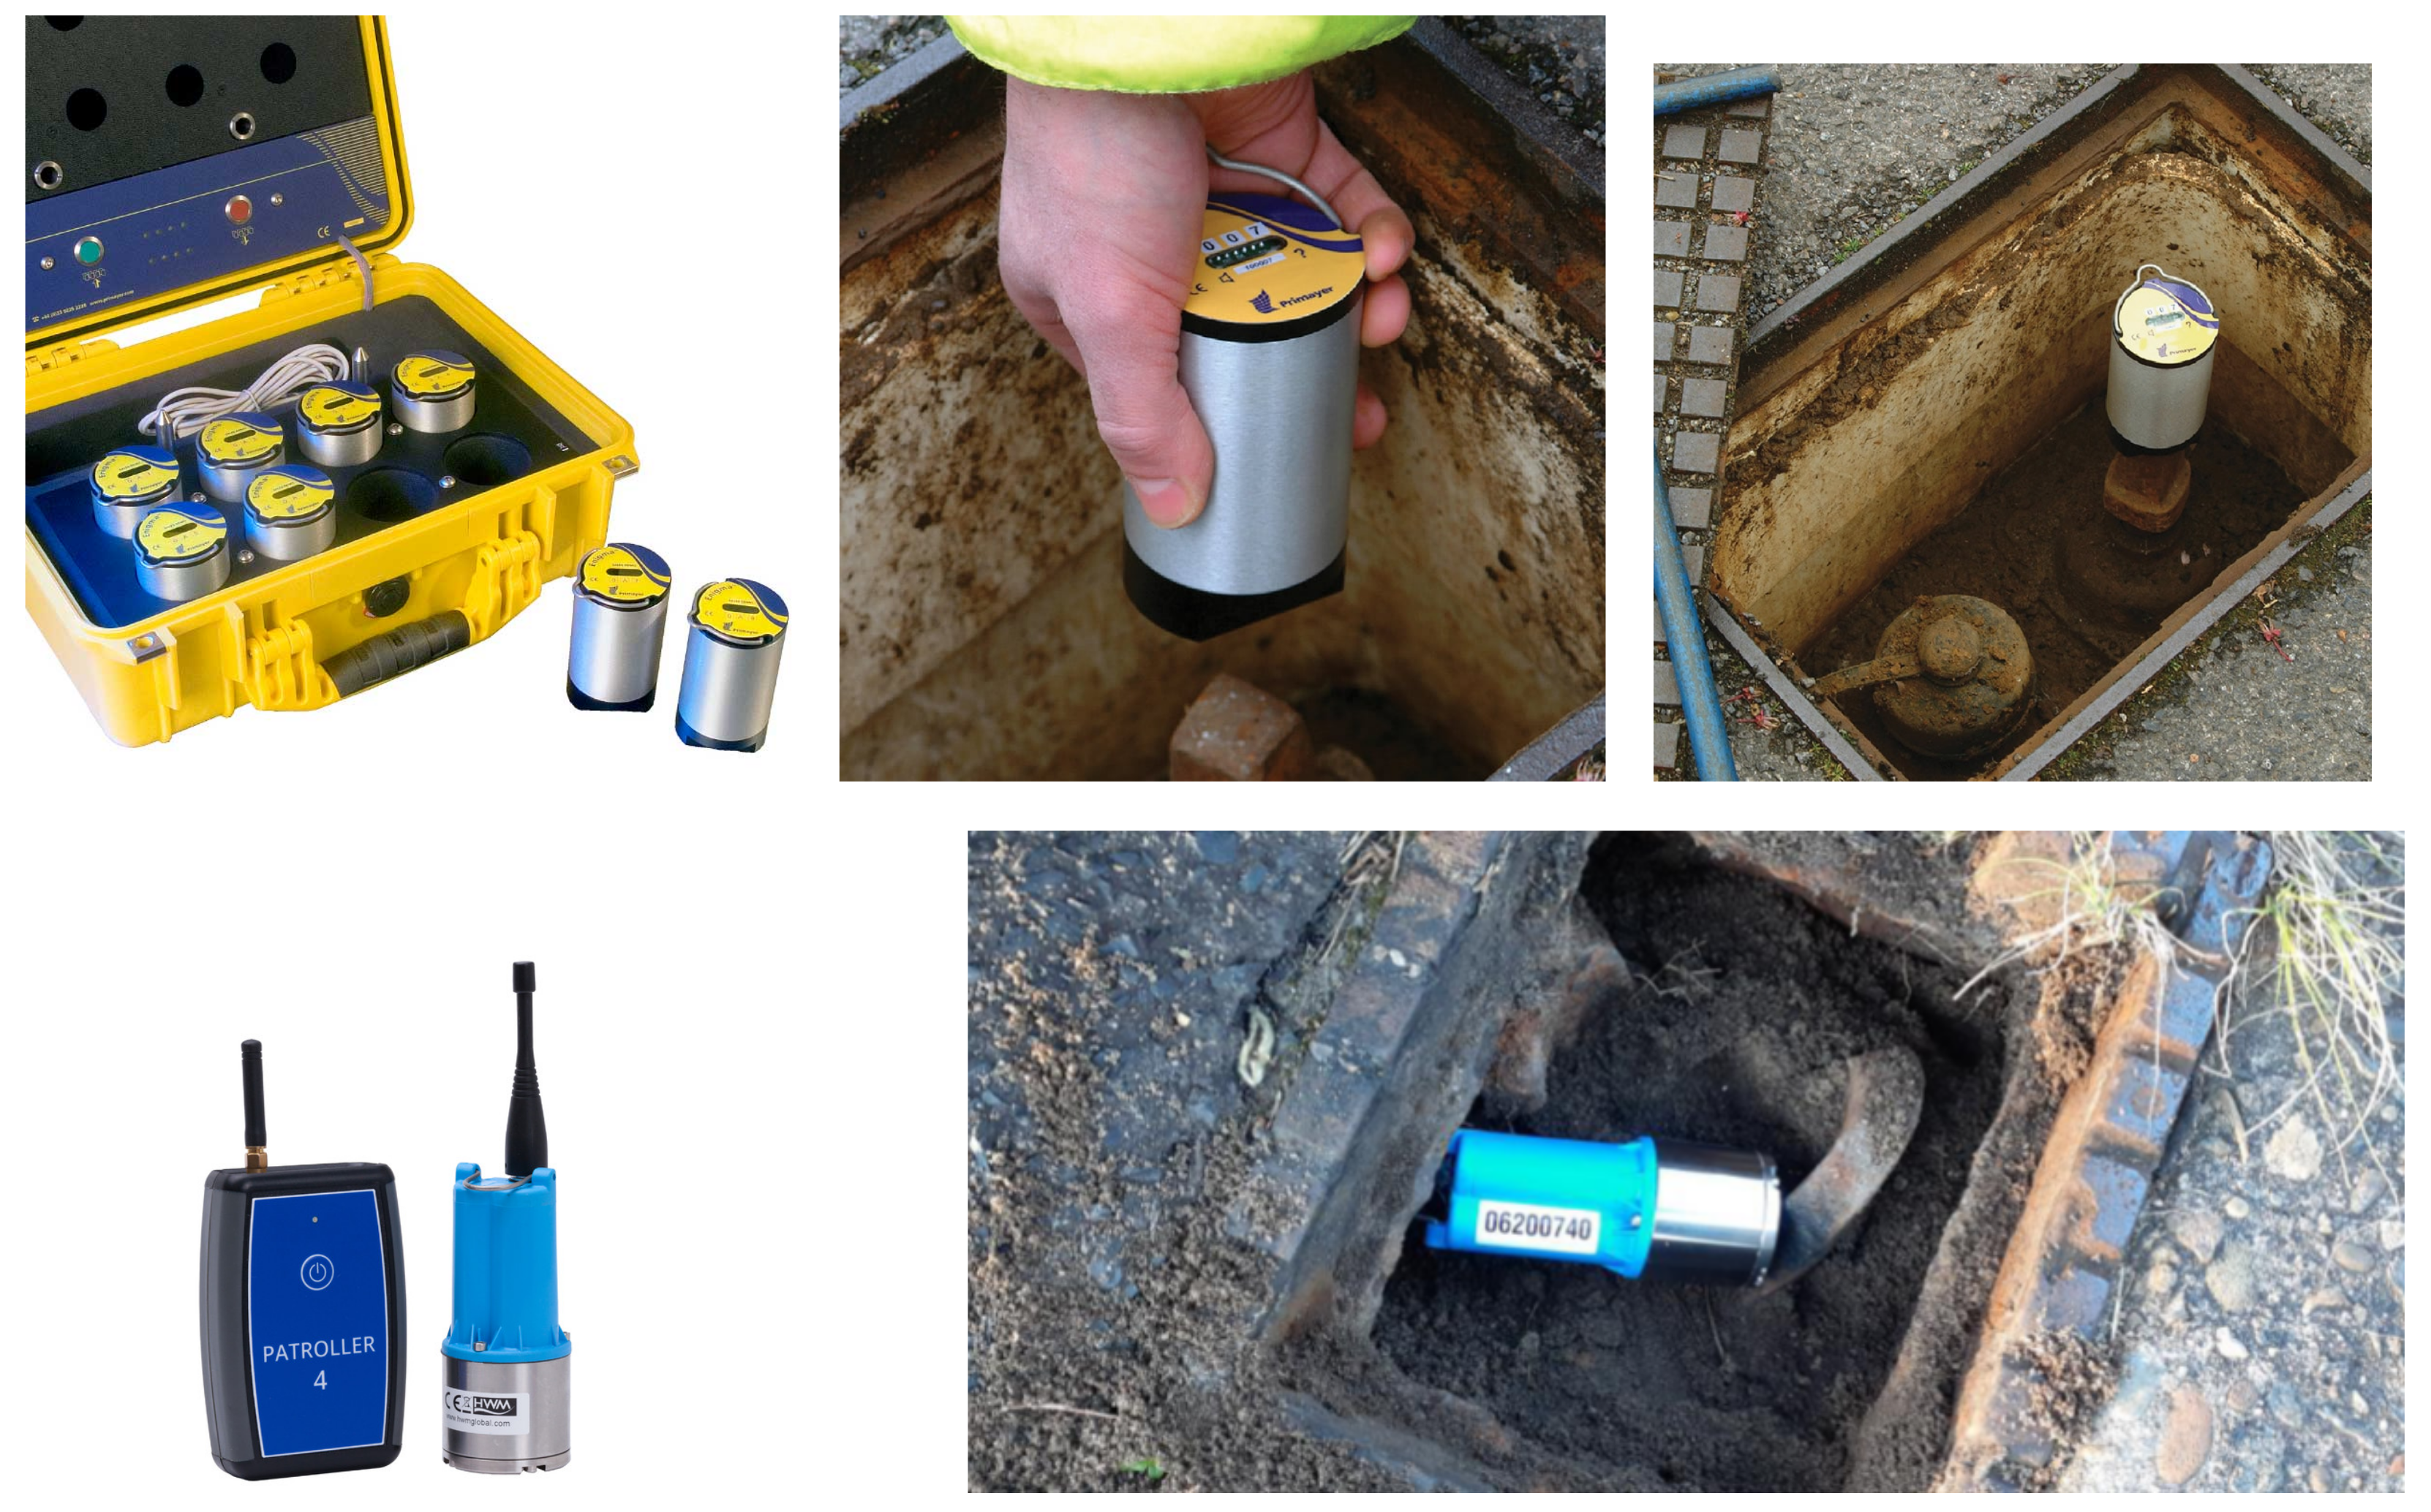
2. Vibro-Acoustic Sensors and Data Loggers
3. Methodology
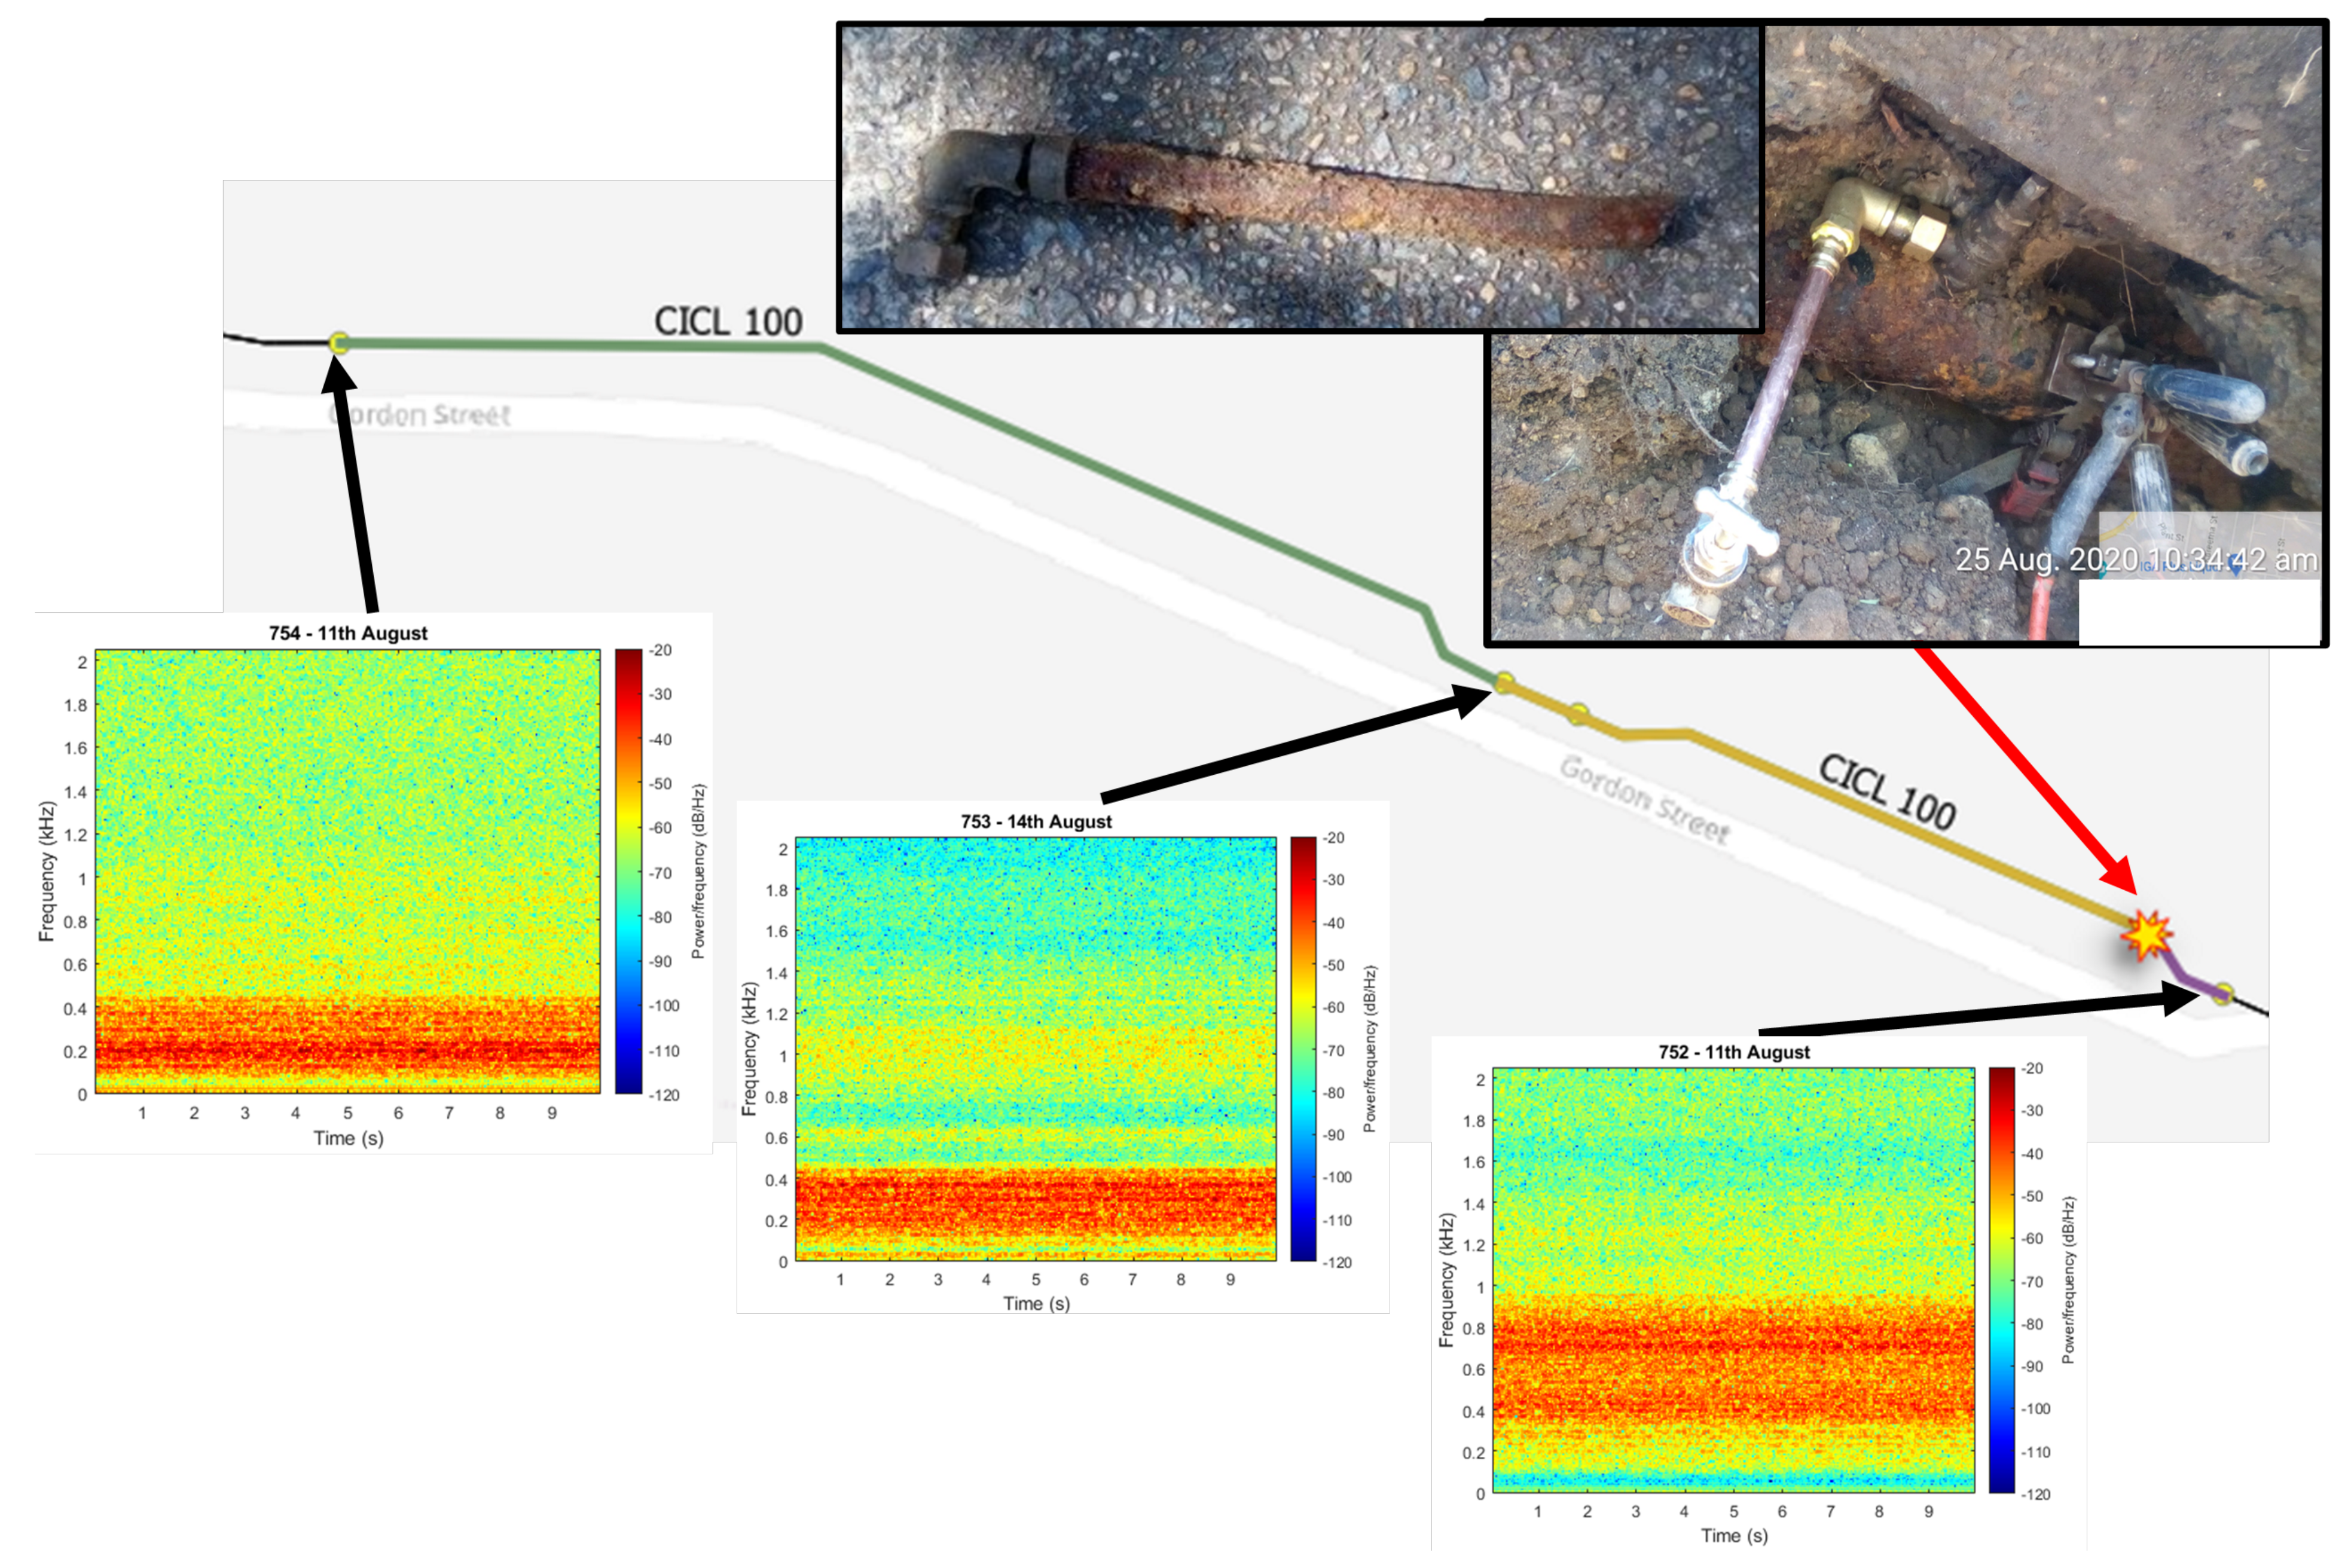
3.1. Data Collection
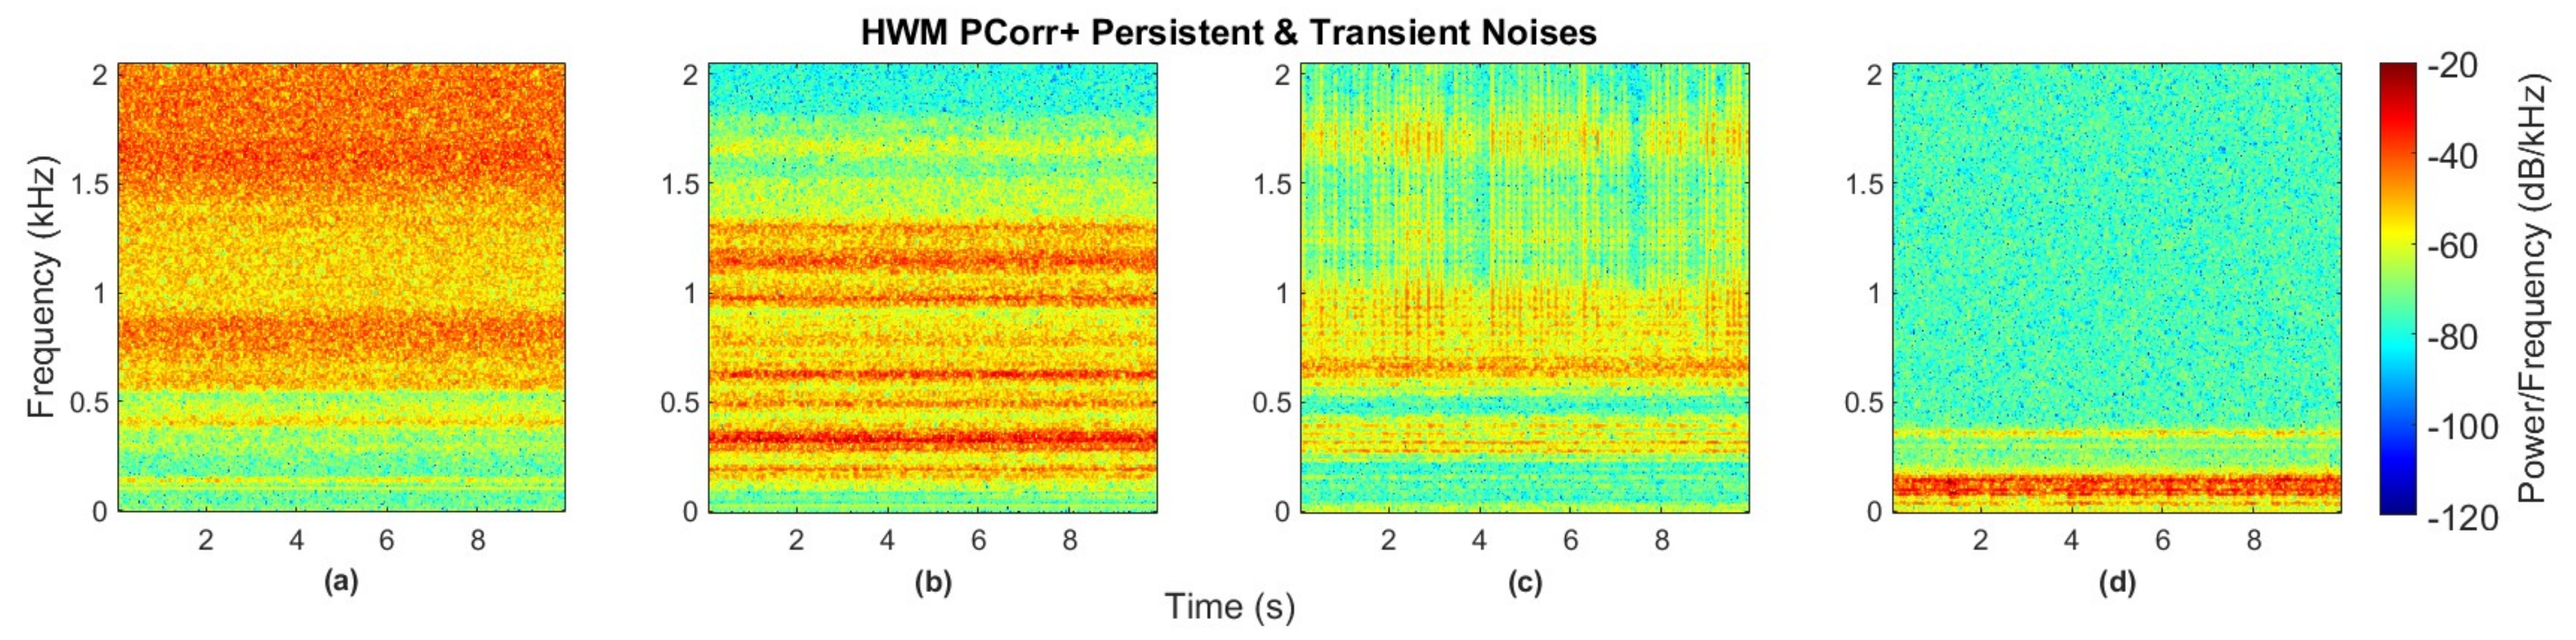
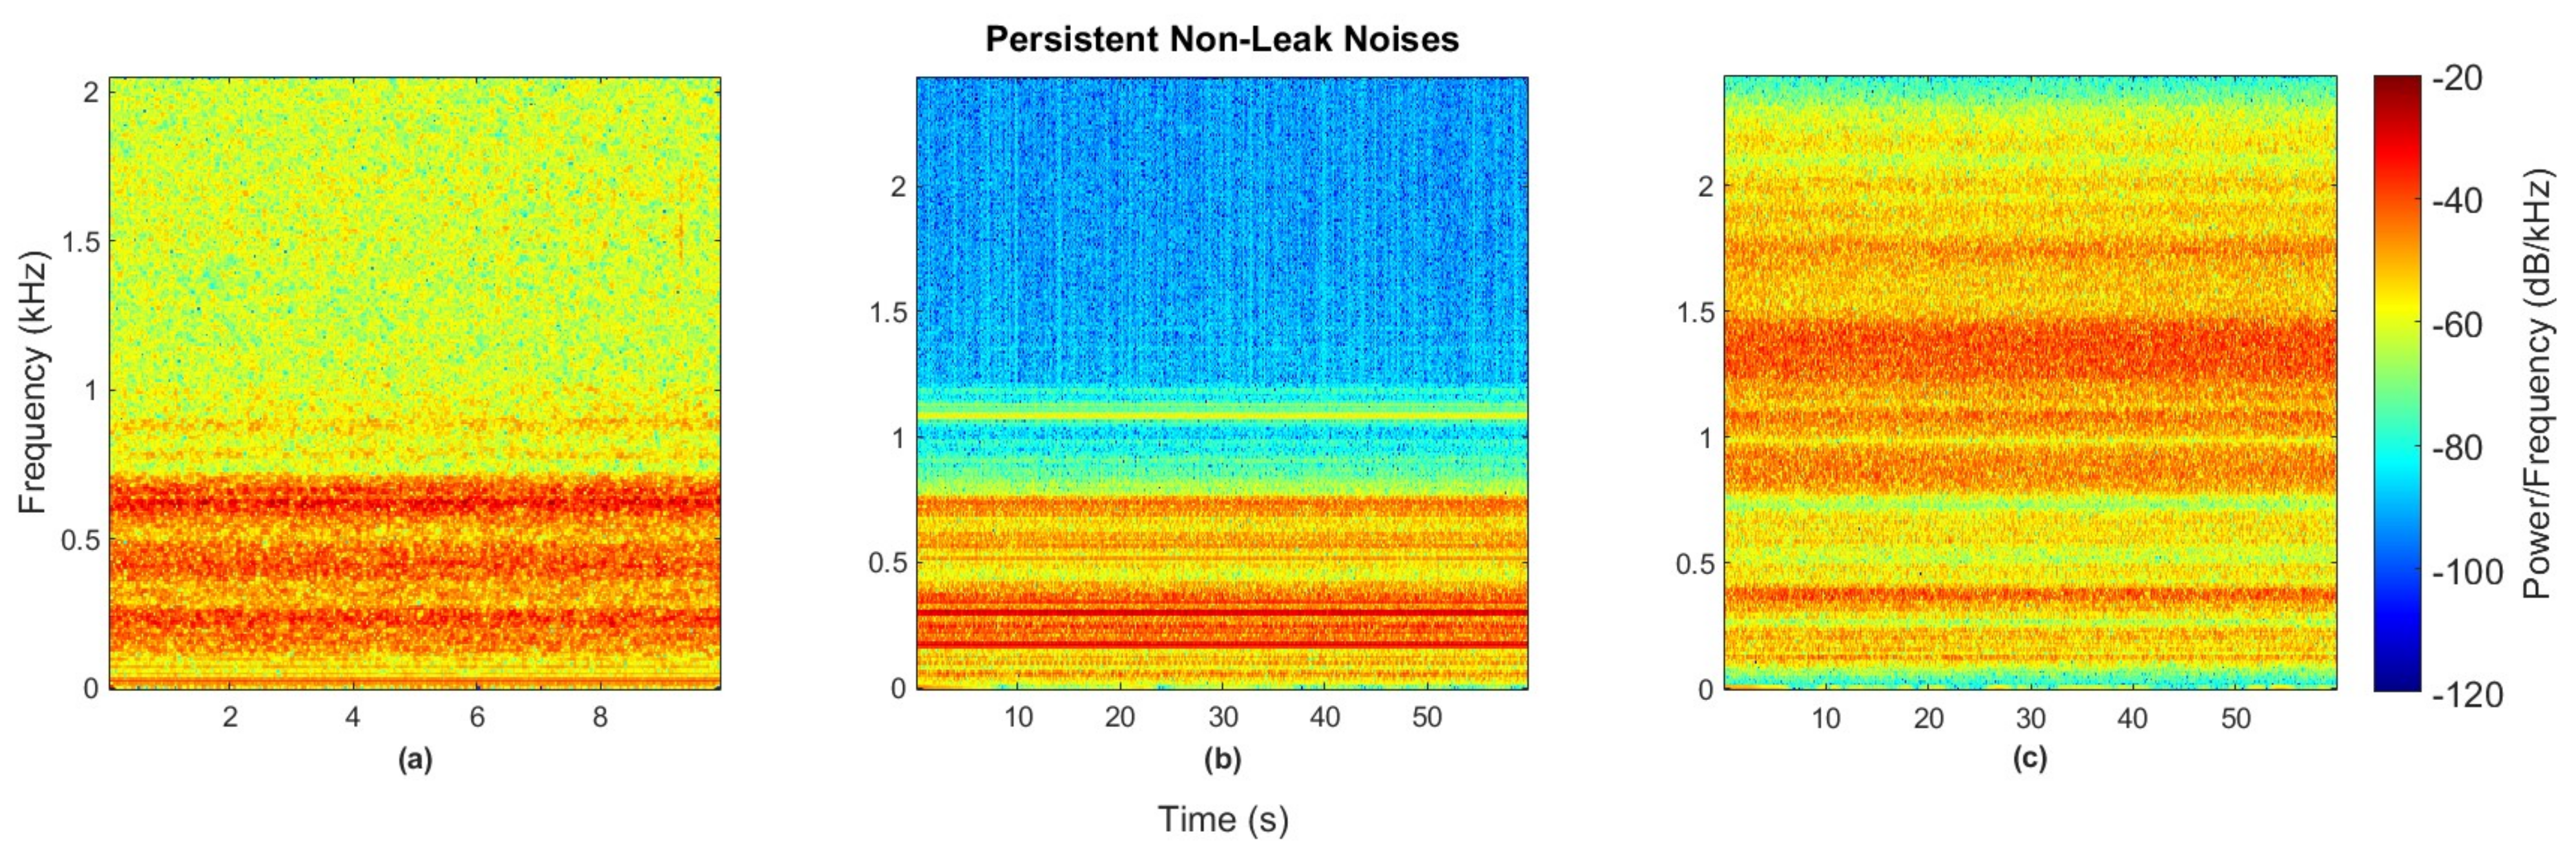
3.2. Data Analysis—Signal Processing
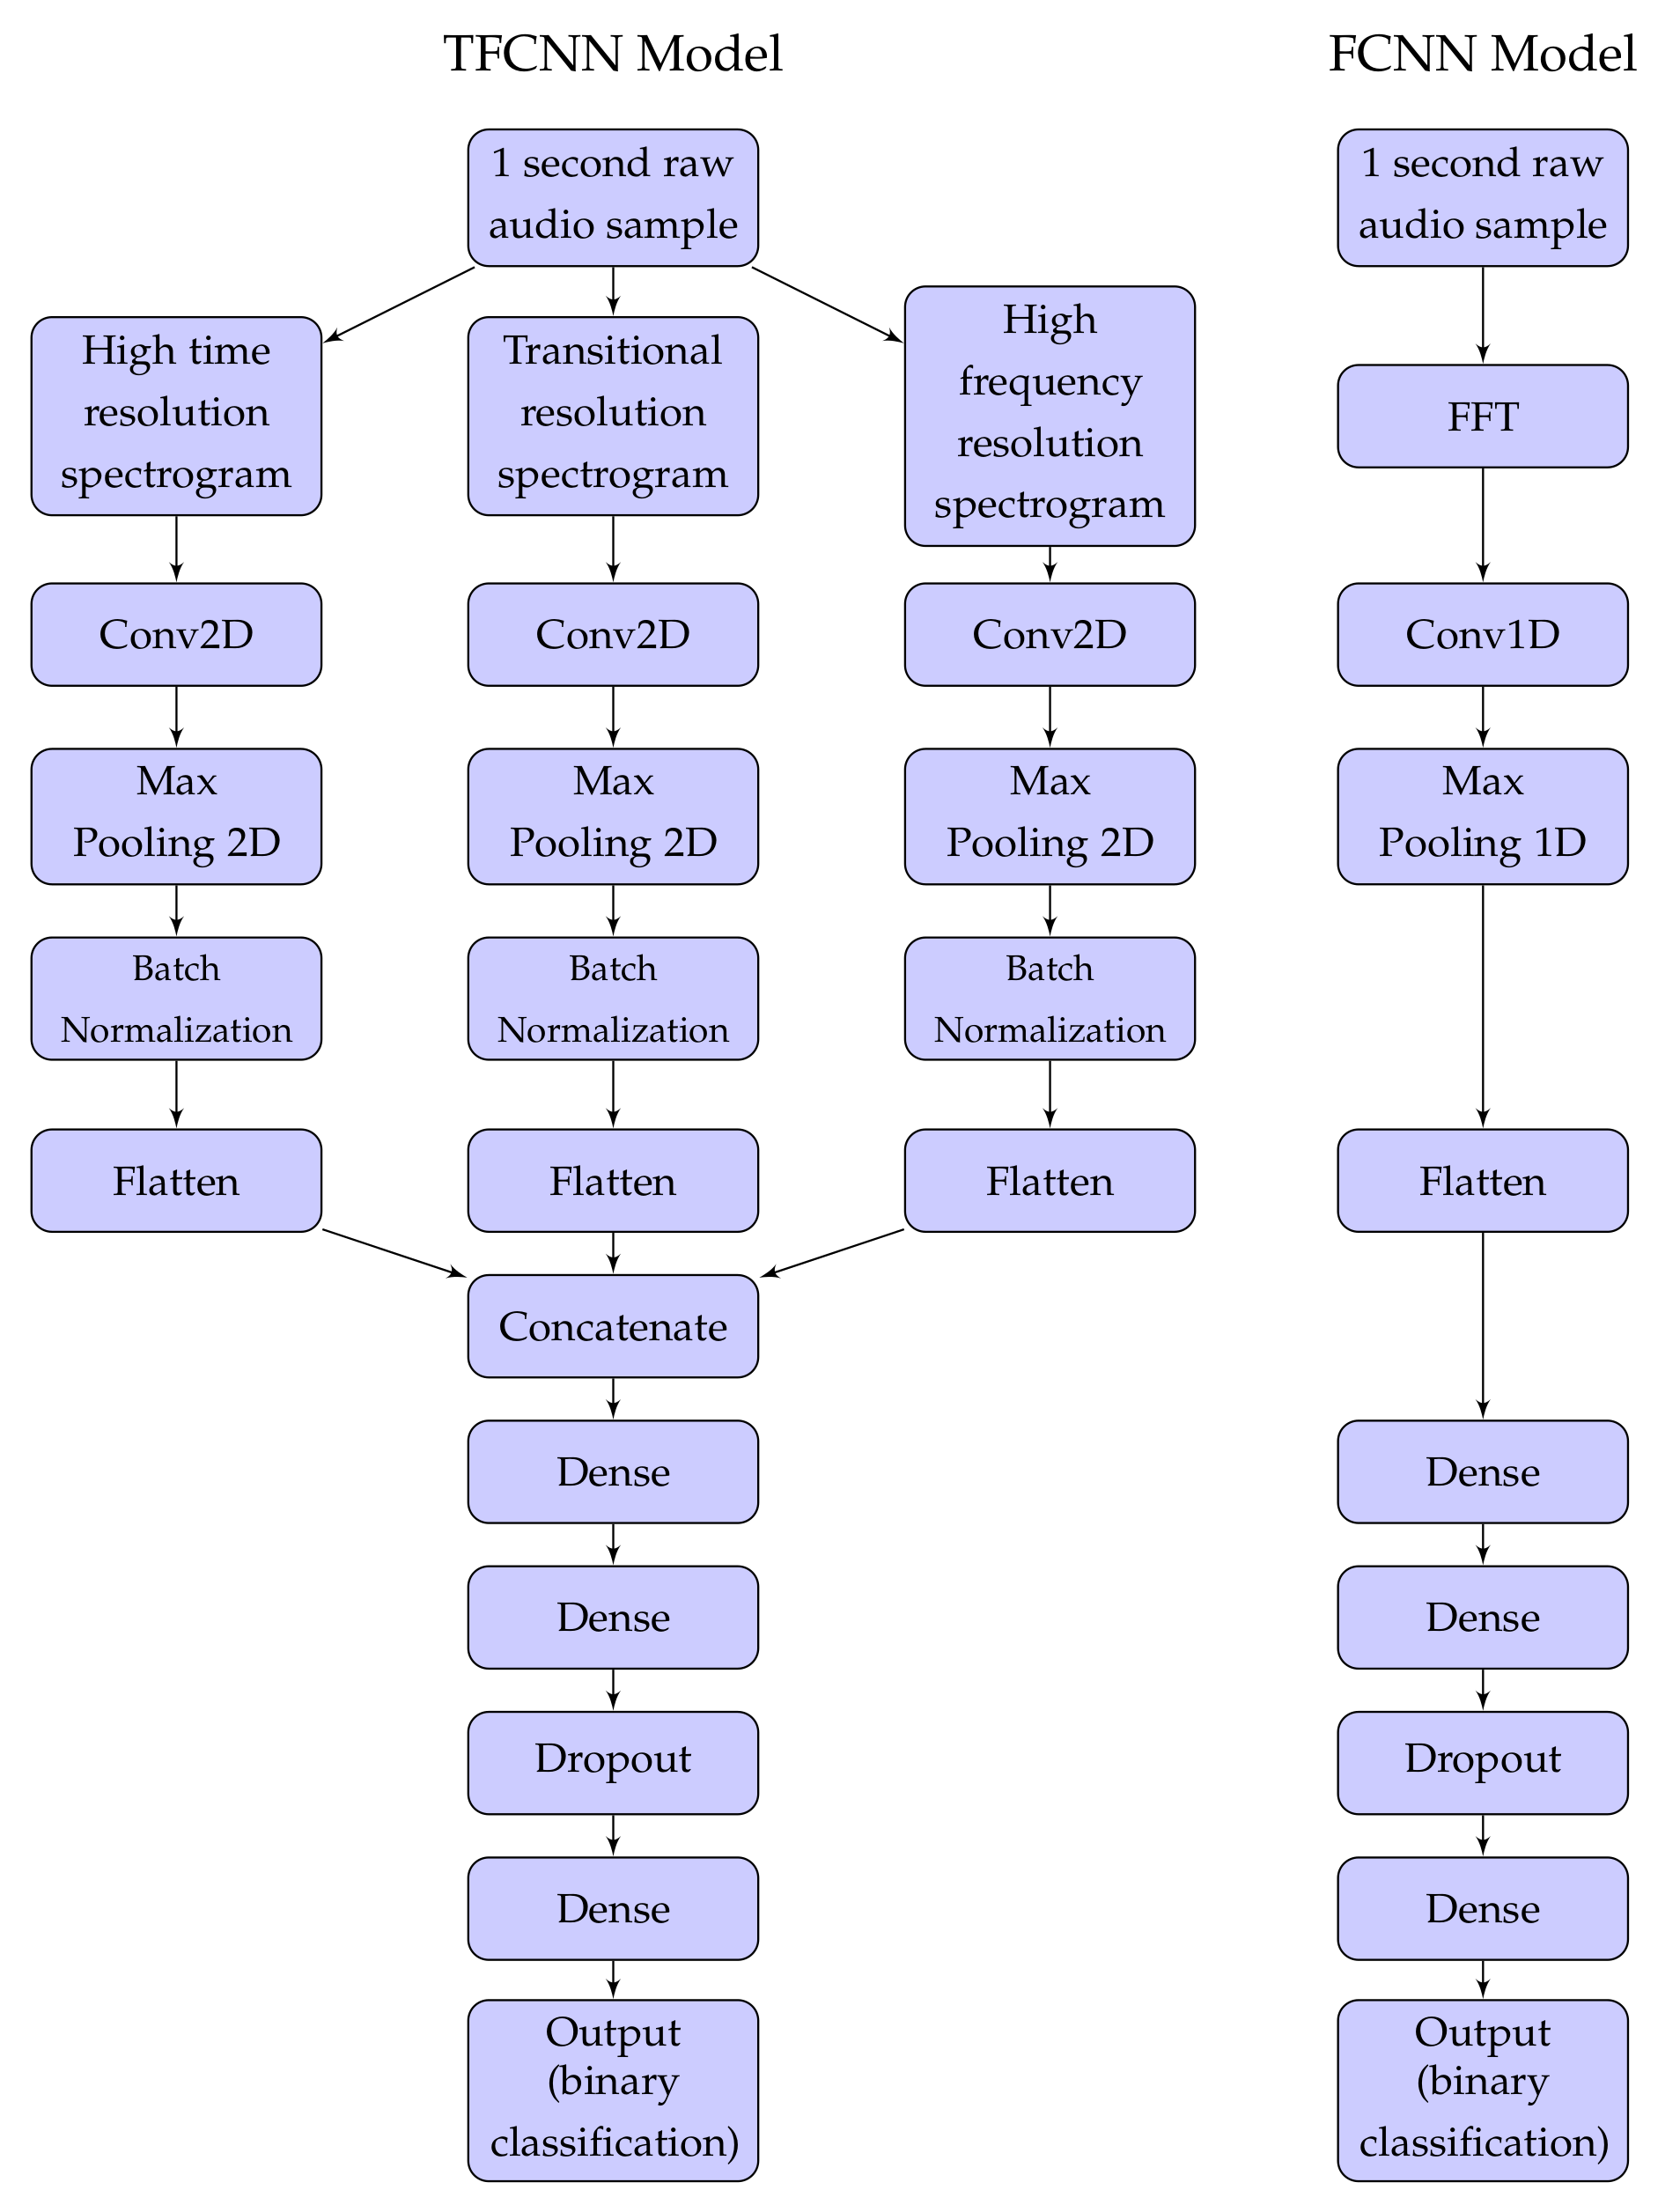
3.3. Binary Classification
4. Results and Discussion
5. Conclusions
Author Contributions
Funding
Data Availability Statement
Conflicts of Interest
Abbreviations
| ALD | Active Leak Detection |
| AUC | Area Under the Receiver Operating Characteristic curve |
| CNN | Convolutional Neural Network |
| DV | Dividing Valve |
| FCNN | Frequency Convolutional Neural Network |
| FFT | Fast Fourier Transform |
| FN | False Negative |
| FP | False Positive |
| GIS | Geographic Information System |
| GWN | Gaussian White Noise |
| L&S | Lift and Shift |
| MNF | Minimum Night Flow |
| NRW | Non-Revenue Water |
| PRV | Pressure Reducing Valve |
| PSD | Power Spectrum Density |
| ROC | Receiver Operating Characteristic |
| RP | Recurrence Plot |
| SNR | Signal-to-noise Ratio |
| STFT | Short-time Fourier Transform |
| TFCNN | Time-frequency Convolutional Neural Network |
| TN | True Negative |
| TP | True Positive |
| WDN | Water Distribution Network |
References
- Puust, R.; Kapelan, Z.; Savic, D.A.; Koppel, T. A review of methods for leakage management in pipe networks. Urban Water J. 2010, 7, 25–45. [Google Scholar] [CrossRef]
- El-Zahab, S.; Zayed, T. Leak detection in water distribution networks: An introductory overview. Smart Water 2019, 4, 5. [Google Scholar] [CrossRef] [Green Version]
- Stoianov, I.; Maksimovic, C.; Graham, N.; Dellow, D. Field validation of the application of hydraulic transients for leak detection in transmission pipelines. Adv. Water Supply Manag. 2003, 9, 86–97. [Google Scholar]
- Xiao, R.; Hu, Q.; Li, J. Experimental investigation of vibro-acoustic techniques to detect and locate leakages in gas pipelines. Meas. Sci. Technol. 2021, 32, 114004. [Google Scholar] [CrossRef]
- Hunaidi, O.; Wang, A.; Bracken, M.; Gambino, T.; Fricke, C. Acoustic methods for locating leaks in municipal water pipe networks. In Proceedings of the International Conference on Water Demand Management, Dead Sea, Jordan, 30 May–3 June 2004. [Google Scholar]
- Hamilton, S.; Charalambous, B. Leak Detection: Technology and Implementation, 1st ed.; IWA Publishing: London, UK, 2013; pp. 13–14. [Google Scholar]
- Kumar, S.S.; Abraham, D.M.; Behbahani, S.S.; Matthews, J.C.; Iseley, T. Comparison of Technologies for Condition Assessment of Small-Diameter Ductile Iron Water Pipes. J. Pipeline Syst. Eng. Pract. 2020, 11, 04020039. [Google Scholar] [CrossRef]
- Pilcher, R.; Hamilton, S.; Chapman, H.; Field, D.; Ristovski, B.; Stapely, S. Leak Location and Repair: Guidance Notes; Version 1; International Water Association: London, UK, 2007; p. 16. [Google Scholar]
- Fuchs, H.V.; Riehle, R. Ten Years of Experience with Leak Detection by Acoustic Signal Analysis. Appl. Acoust. 1991, 33, 1–19. [Google Scholar] [CrossRef]
- Gong, J.; Lambert, M.F.; Stephens, M.L.; Cazzolato, B.S.; Zhang, C. Detection of Emerging through-Wall Cracks for Pipe Break Early Warning in Water Distribution Systems Using Permanent Acoustic Monitoring and Acoustic Wave Analysis. Water Resour. Manag. 2020, 34, 2419–2432. [Google Scholar] [CrossRef]
- Stephens, M.; Gong, J.; Zhang, C.; Marchi, A.; Dix, L.; Lambert, M.F. Leak-Before-Break Main Failure Prevention for Water Distribution Pipes Using Acoustic Smart Water Technologies: Case Study in Adelaide. J. Water Resour. Plann. Manag. 2020, 146, 05020020. [Google Scholar] [CrossRef]
- Marmarokopos, K.; Doukakis, D.; Frantziskonis, G.; Avlonitis, M. Leak Detection in Plastic Water Supply Pipes with a High Signal-to-Noise Ratio Accelerometer. Meas. Control 2018, 51, 27–37. [Google Scholar] [CrossRef]
- Martini, A.; Troncossi, M.; Rivola, A. Automatic Leak Detection in Buried Plastic Pipes of Water Supply Networks by Means of Vibration Measurements. Shock Vib. 2015, 2015, 165304. [Google Scholar] [CrossRef] [Green Version]
- Cody, R.A.; Tolson, B.A.; Orchard, J. Detecting Leaks in Water Distribution Pipes Using a Deep Autoencoder and Hydroacoustic Spectrograms. J. Comput. Civ. Eng. 2020, 34, 04020001. [Google Scholar] [CrossRef]
- Chuang, W.; Tsai, Y.; Wang, L. Leak Detection in Water Distribution Pipes Based on CNN with Mel Frequency Cepstral Coefficients. In Proceedings of the 3rd International Conference on Innovation in Artificial Intelligence, Suzhou, China, 15–18 March 2019. [Google Scholar]
- Müller, R.; Illium, S.; Ritz, F.; Schröder, T.; Platschek, C.; Ochs, J.; Linnhoff-Popien, C. Acoustic Leak Detection in Water Networks. In Proceedings of the 13th International Conference on Agents and Artificial Intelligence–Volume 2, Vienna, Austria, 4–6 February 2021. [Google Scholar]
- El-Zahab, S.; Asaad, A.; Abdelkader, E.M.; Zayed, T. Collective Thinking Approach for Improving Leak Detection Systems. Smart Water 2017, 2, 3. [Google Scholar] [CrossRef] [Green Version]
- Teruhi, S.; Yamaguchi, Y.; Akahani, J. Water Leakage Detection System for Underground Pipes by Using Wireless Sensors and Machine Learning. J. Disaster Res. 2017, 12, 557–568. [Google Scholar] [CrossRef]
- Butterfield, J.D.; Meyers, G.; Meruane, V.; Collins, R.P.; Beck, S.B.M. Experimental investigation into techniques to predict leak shapes in water distribution systems using vibration measurements. J. Hydroinf. 2018, 20, 815–828. [Google Scholar] [CrossRef] [Green Version]
- El-Zahab, S.; Abdelkader, E.M.; Zayed, T. An accelerometer-based leak detection system. Mech. Syst. Sig. Process. 2018, 108, 276–291. [Google Scholar] [CrossRef]
- Ismail, M.I.M.; Dziyauddin, R.A.; Salleh, N.A.A.; Muhammad-Sukki, F.; Bani, N.A.; Izhar, M.A.M.; Latiff, L.A. A Review of Vibration Detection Methods Using Accelerometer Sensors for Water Pipeline Leakage. IEEE Access 2019, 7, 51965–51981. [Google Scholar] [CrossRef]
- Martini, A.; Rivola, A.; Troncossi, M. Autocorrelation analysis of vibroacoustic signals measured in a test field for water leak detection. Appl. Sci. 2018, 8, 2450. [Google Scholar] [CrossRef] [Green Version]
- Chi, Z.; Li, Y.; Wang, W.; Xu, C.; Yuan, R. Detection of water pipeline leakage based on random forest. J. Phys. Conf. Ser. 2021, 1978, 012044. [Google Scholar] [CrossRef]
- Ravichandran, T.; Gavahi, K.; Ponnambalam, K.; Burtea, V.; Jamshid Mousavi, S. Ensemble-based machine learning approach for improved leak detection in water mains. J. Hydroinf. 2021, 23, 307–323. [Google Scholar] [CrossRef]
- Nam, Y.W.; Arai, Y.; Kunizane, T.; Koizumi, A. Water leak detection based on convolutional neural network using actual leak sounds and the hold-out method. Water Supply 2021, 21, 3477–3485. [Google Scholar] [CrossRef]
- Tijani, I.A.; Abdelmageed, S.; Fares, A.; Fan, K.H.; Hu, Z.Y.; Zayed, T. Improving the leak detection efficiency in water distribution networks using noise loggers. Sci. Total Environ. 2022, 821, 153530. [Google Scholar] [CrossRef]
- Guo, G.; Yu, X.; Liu, S.; Ma, Z. Leakage Detection in Water Distribution Systems Based on Time–Frequency Convolutional Neural Network. J. Water Resour. Plann. Manag. 2021, 147, 04020101. [Google Scholar] [CrossRef]
- Martini, A.; Troncossi, M.; Rivola, A. Leak Detection in Water-Filled Small-Diameter Polyethylene Pipes by Means of Acoustic Emission Measurements. Appl. Sci. 2017, 7, 2. [Google Scholar] [CrossRef] [Green Version]
- Tariq, S.; Bakhtawar, B.; Zayed, T. Data-driven application of MEMS-based accelerometers for leak detection in water distribution networks. Sci. Total Environ. 2022, 809, 151110. [Google Scholar] [CrossRef]
- Stephens, M.; Gong, J.; Marchi, A.; Dix, L.; Lambert, M. Field Testing of Adelaide CBD Smart Network Acoustic Technologies. In Proceedings of the 1st International WDSA/CCWI Joint Conference, Kingston, ON, Canada, 23–25 July 2018. [Google Scholar]
- Anguiano, G.; Chiang, E.; Araujo, M.; Strum, S.; Medina, V.; Waisner, S.; Condit, W.; Matthews, J.; Stowe, R. Innovative Acoustic Sensor Technologies for Leak Detection in Challenging Pipe Types (Cost and Performance Report); Naval Facilities Engineering Command Engineering and Expeditionary Welface Centre: Port Hueneme, CA, USA, 2016; pp. 42–44. [Google Scholar]
- Kang, J.; Park, Y.; Lee, J.; Wang, S.; Eom, D. Novel Leakage Detection by Ensemble CNN-SVM and Graph-Based Localization in Water Distribution Systems. IEEE Trans. Ind. Electron. 2018, 65, 4279–4289. [Google Scholar] [CrossRef]


| Zone # | Sensors Deployed | Quantity of Loggers Deployed | Number of Connections | Pipe Length (km) | Average MNF (L/C/H) | Leaks Detected | Types of Leaks Detected |
|---|---|---|---|---|---|---|---|
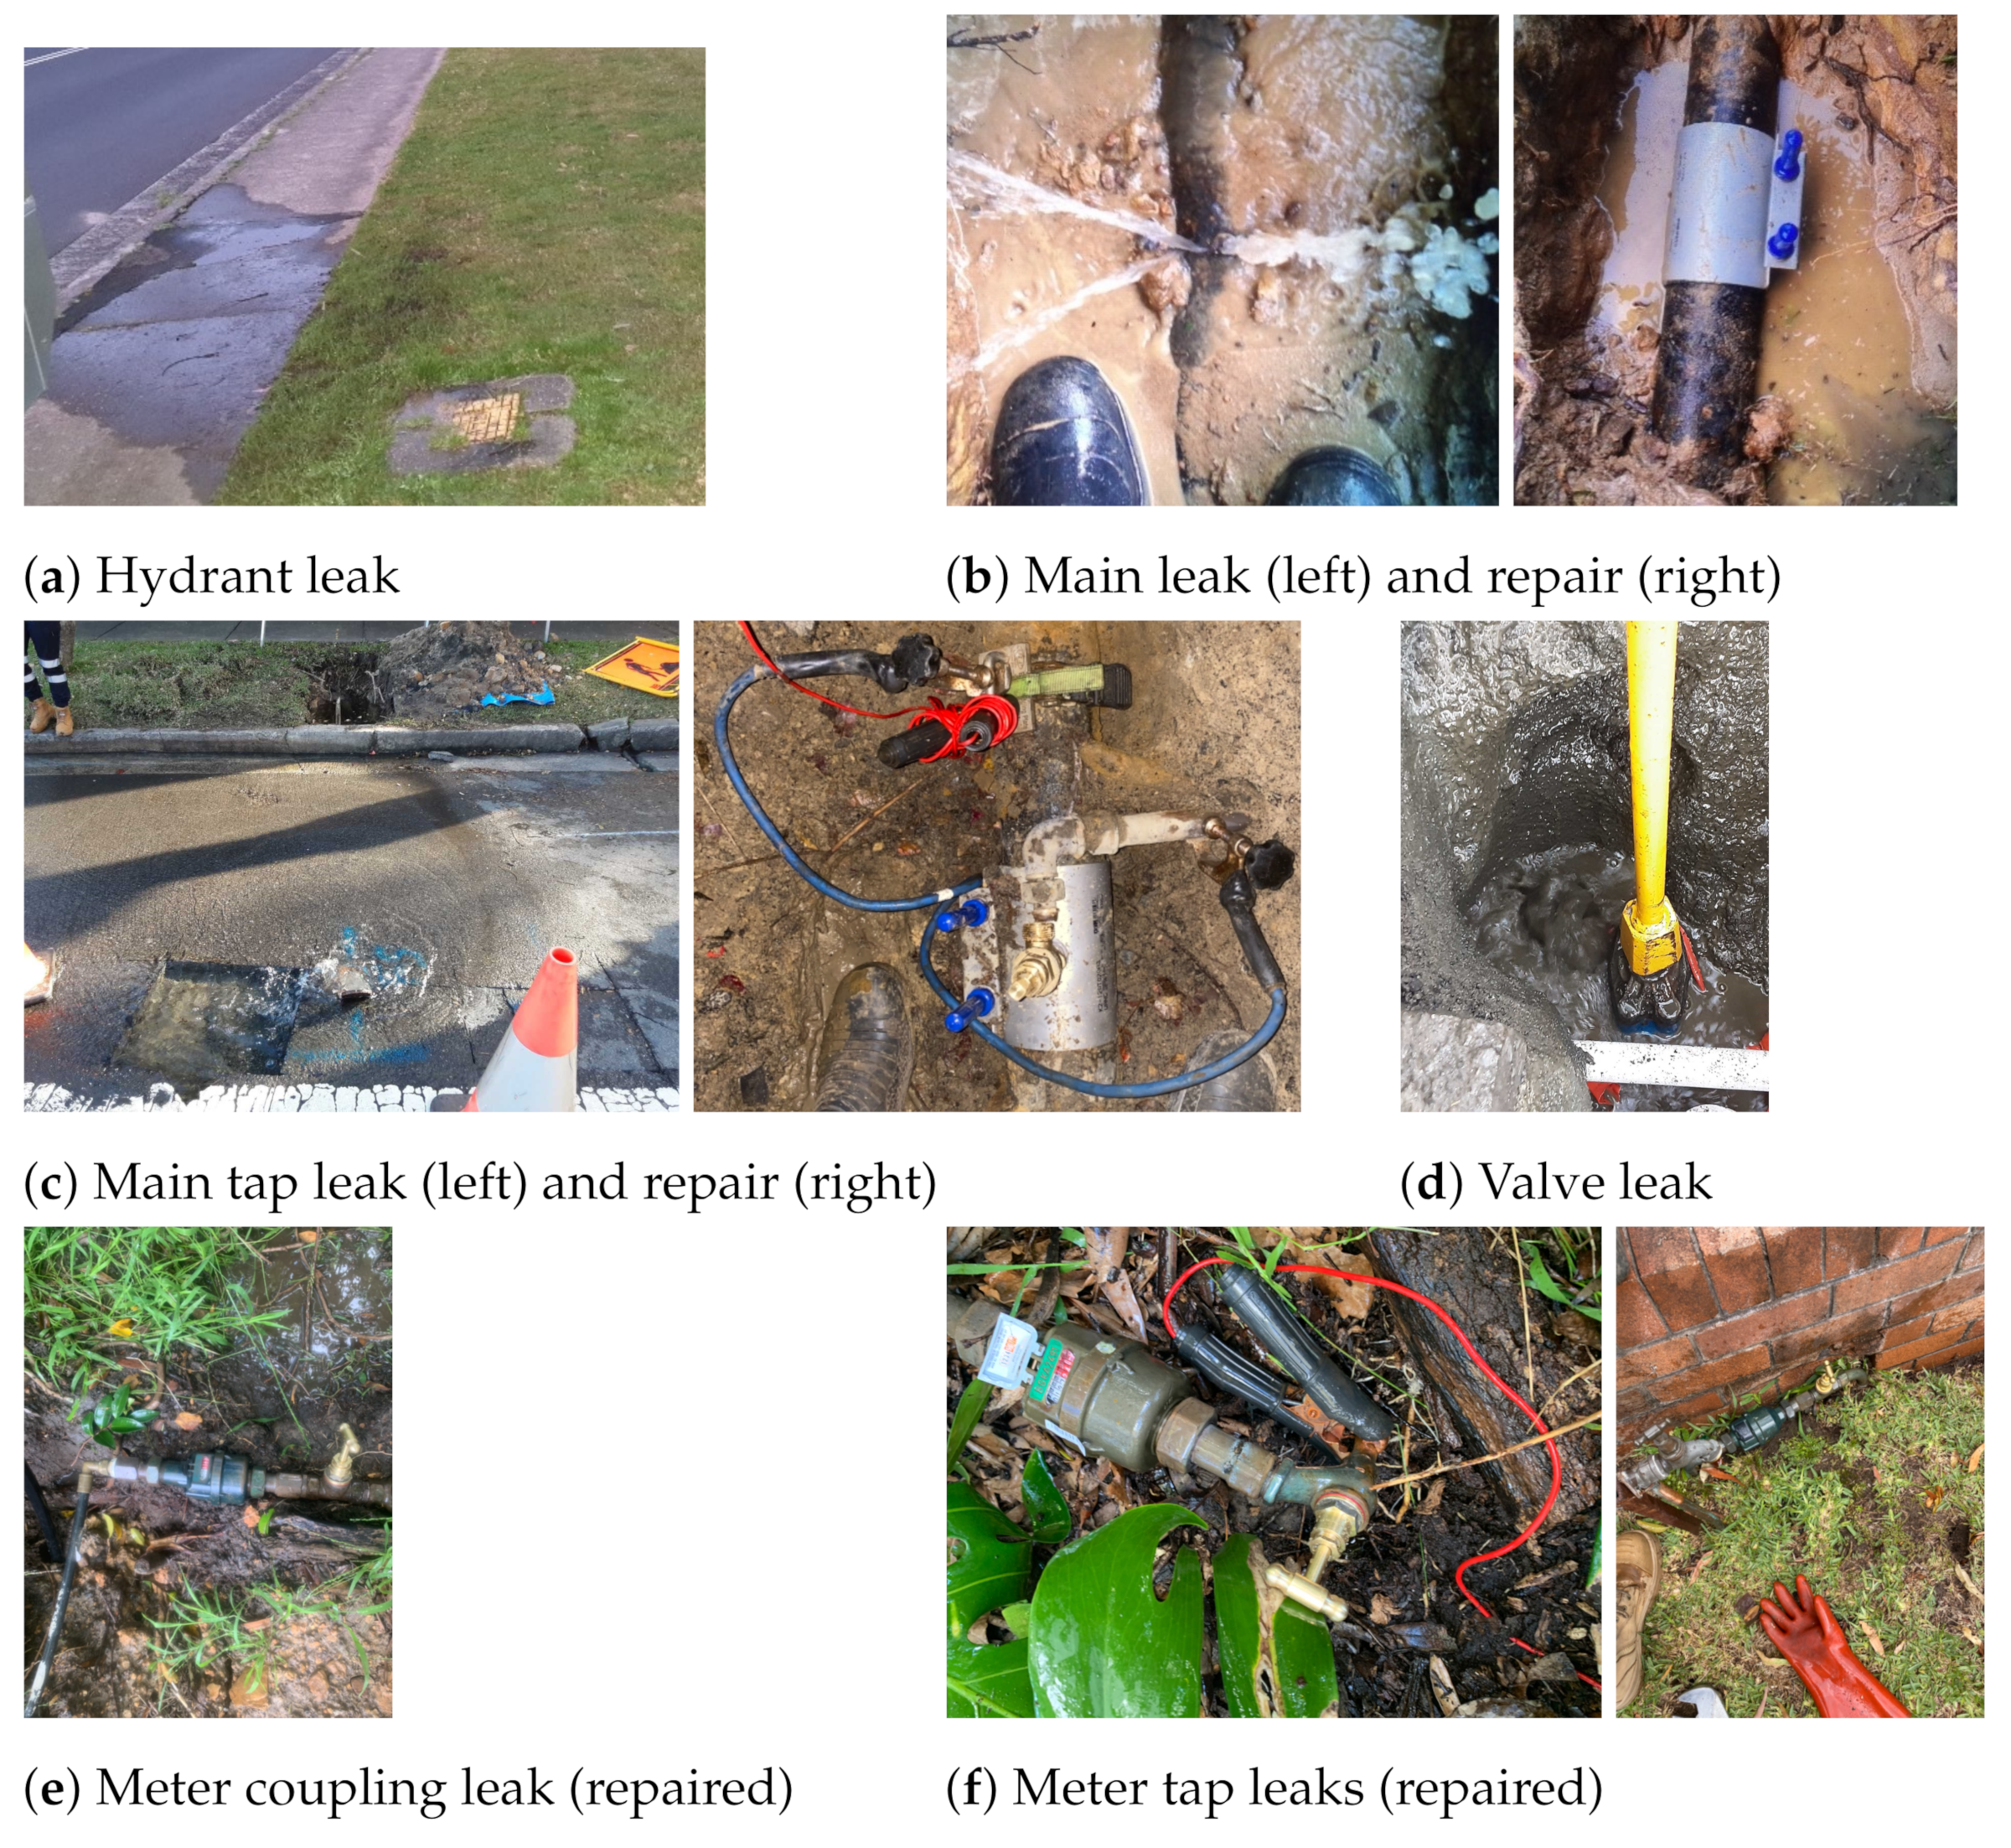
| 1 | HWM PCorr+ | 70 loggers (133 locations) | 1481 | 19.89 | 16.83 | 9 | 1 main tap leak, 3 hydrant leaks, 1 main leak, 1 main break, 1 m coupling leak, 2 mains to meter leaks |
| 2 | Primayer Enigma | 144 (18 boxes) | 438 | 9.7 | 15.0 | 6 | 3 m tap/ coupling leaks, 2 stop valve leaks, 1 DV breach/fault |
| 3 | Primayer Enigma | 72 (9 boxes) | 1163 | 12.9 | 19.0 | 6 | 4 hydrant leaks, 1 main break, 1 mains to meter leak |
| 4 | Primayer Enigma | 80 (10 boxes) | 650 | 14.4 | 20.5 | 2 | 1 DV breach/fault, 1 hydrant leak |
| 5 | Primayer Enigma | 88 (11 boxes) | 1064 | 16.8 | 27.2 | 5 | 2 main tap leaks, 1 hydrant leak, 2 m tap/ coupling leaks |
| 6 | Primayer Enigma | 240 (30 boxes) | 1179 | 38.4 | 30.7 | 21 | 3 main leaks, 3 main breaks, 9 hydrant leaks, 1 main tap leak, 2 stop valve leaks, 1 m tap leak, 2 fire service leaks |
| Logger | Audio Sampling Rate (Hz) | Spectrogram Resolution | ||
|---|---|---|---|---|
| High Time | Transitional | High Frequency | ||
| HWM PCorr+ | 4096 | [114,60] | [226,28] | [451,12] |
| Primayer Enigma | 4864 | [96,72] | [190,34] | [380,15] |
| Logger Type | Total # Files | # Leak Files | # No Leak Files | Accuracy (%) | Specificity (%) | Sensitivity (%) | Precision (%) | AUC | F-beta |
|---|---|---|---|---|---|---|---|---|---|
| HWM | 210 | 150 | 60 | 97.62 | 90.00 | 100.00 | 96.97 | 1.0 | 0.98 |
| Primayer | 99,000 | 15,840 | 83,160 | 97.67 | 98.96 | 90.98 | 94.38 | 0.99 | 0.93 |
| Logger Type | Total # Files | # Leak Files | # No Leak Files | Accuracy (%) | Specificity (%) | Sensitivity (%) | Precision (%) | AUC | F-beta |
|---|---|---|---|---|---|---|---|---|---|
| HWM | 210 | 150 | 60 | 100 | 100 | 100 | 100 | 1.0 | 1.0 |
| Primayer | 99,000 | 15,840 | 83,160 | 97.99 | 99.17 | 91.89 | 95.51 | 0.98 | 0.94 |
Publisher’s Note: MDPI stays neutral with regard to jurisdictional claims in published maps and institutional affiliations. |
© 2022 by the authors. Licensee MDPI, Basel, Switzerland. This article is an open access article distributed under the terms and conditions of the Creative Commons Attribution (CC BY) license (https://creativecommons.org/licenses/by/4.0/).
Share and Cite
Bykerk, L.; Valls Miro, J. Detection of Water Leaks in Suburban Distribution Mains with Lift and Shift Vibro-Acoustic Sensors. Vibration 2022, 5, 370-382. https://doi.org/10.3390/vibration5020021
Bykerk L, Valls Miro J. Detection of Water Leaks in Suburban Distribution Mains with Lift and Shift Vibro-Acoustic Sensors. Vibration. 2022; 5(2):370-382. https://doi.org/10.3390/vibration5020021
Chicago/Turabian StyleBykerk, Lili, and Jaime Valls Miro. 2022. "Detection of Water Leaks in Suburban Distribution Mains with Lift and Shift Vibro-Acoustic Sensors" Vibration 5, no. 2: 370-382. https://doi.org/10.3390/vibration5020021