Article

Relationships between Height, Mass, Body Mass Index, and Trunk Muscle Activation during Seated Whole-Body Vibration Exposure

School of Engineering, University of Guelph, Guelph, ON N1G 2W1, Canada
*
Author to whom correspondence should be addressed.
Vibration 2021, 4(4), 822-835; https://doi.org/10.3390/vibration4040046
Submission received: 29 September 2021 / Revised: 29 October 2021 / Accepted: 31 October 2021 / Published: 4 November 2021

Abstract

:
Operators of heavy equipment are often exposed to high levels of whole-body vibration (WBV), which has been associated with a variety of adverse health outcomes. Although anthropometric factors are known to impact vibration dose and risk of low back pain, studies have yet to investigate the influence of anthropometric factors on muscle activation during WBV exposure. This study quantified the relationships between muscle activation, vibration frequency, body mass, body mass index (BMI), and height both pre- and post-fatigue. Muscle activation of the external oblique (EO), internal oblique (IO), lumbar erector spinae (LE) and thoracic erector spinae (TE) were quantified using surface electromyography. Results indicate increased activation with increased mass, BMI, and frequency for the LE, TE, and IO, which may be a result of increased activation to stabilize the spine. Decreased muscle activation with increased height was seen in the TE, IO, and pre-fatigue EO, which could indicate higher risk for low back injury since height is associated with increased forces on the spine. This may contribute to the association between increased low back pain incidence and increased height. Results suggest that ISO 2631-1 health guidance should incorporate anthropometric factors, as these may influence muscle activation and back injury risk.

1. Introduction

Operators of heavy equipment are exposed to high levels of whole-body vibration (WBV) [1,2,3]. The literature has shown an association between increased low back pain (LBP) and anthropometric factors such as increased height [4] and increased body mass [4,5]. WBV has been related to a variety of adverse health outcomes including degenerative changes in the spine [6,7], low back pain [7,8,9] and sciatic nerve pain [7,9]. WBV exposure can lead to increased muscle activation and spinal instability [10], thus increasing the back injury risk [10,11,12].
ISO 2631-1 provides health guidance zones for vibration exposure. ISO 2631-1 provides health weightings that are used to determine RMS (root mean square) values of frequency weighted acceleration [13]. Once the RMS acceleration values have been determined, they can be compared to the health guidance caution zones, assuming exposure times of 4–8 h [13]. These caution zones are used to evaluate the risks of injury related to WBV; however, anthropometric factors are not incorporated into the risk estimation, although they may affect the vibration dose [3,5,13,14].
The relationship between vibration dose and anthropometric factors during WBV has been investigated in vehicles [14], machinery [3,15], and vibration simulators [16,17,18,19,20]. Increased BMI has been associated with a decreased vibration dose in the z-axis [3,5,14]. Individuals with an increased BMI tend to report increased levels of comfort when exposed to WBV [15] which may indicate that increased BMI may lead to vibration attenuation [3,14]. Further studies have indicated that increased BMI is associated with an increase in the vibration power absorbed (VPA) [17]. Similarly, increased body mass has also been found to be associated with increased VPA [16,17,19,20]. In comparison to body mass and BMI, increased height is associated with an increased vibration dose [5].
Furthermore, the impedance of the human body is strongly correlated with body mass up to approximately 4 Hz, with larger body masses having a higher impedance, leading to lower resonant frequencies [18]. Similarly, increased BMI has been associated with a decreased resonant frequency of the human body [21]. It has also been indicated that female participants have increased damping when compared to male participants. Female participants exhibited a decreased peak VPA, and a lower frequency at which the peak VPA occurred [20]. However, Dewangan et al. has suggested that sex effects in relation to the VPA are strongly coupled with anthropometric factors which may be due in part to the increased body fat content and reduced lean body mass of females relative to males [20]. It has also been proposed that body mass impacts the damping characteristics of air-filled cushions used in suspension seats [19]. In mechanical seat suspensions it has been found that an increased vibration dose is experienced by individuals with a smaller body mass [22].
The literature has shown an association between low back pain (LBP) and anthropometric factors such as height [4,5] and BMI [4,5,23] in farmers who are exposed to WBV. For example, Seidel et al. showed that spinal stress during WBV varied according to body mass and height [24]. WBV exposure leads to increased loading in the spine [25], increased trunk muscle activation [12], trunk muscle fatigue and decreased spine stability. Prolonged muscle activation has been shown to be a contributing factor to repetitive strain injuries [26].
Several studies have suggested that prolonged exposure to WBV leads to muscle fatigue [27,28], where both WBV exposure and muscle fatigue lead to increased levels of muscle activation [27,29]. Muscle fatigue when experienced separately to WBV may lead to neuromuscular recruitment errors, which may lead to increased injury risk [30]. Similarly, when back muscle fatigue and WBV exposure are experienced, concurrently muscle latency, muscle activation, and discomfort are increased [31], leading to escalated back injury risk [32,33,34,35]. Furthermore, muscle activation in the trunk significantly alters the biodynamics for the seated body under WBV [36].
Although literature has suggested that anthropometric factors influence vibration dose [3,5,15,20] and risk of low back pain [4,37], no studies have investigated the relationship between anthropometric factors, muscle fatigue, and muscle activation during WBV. Muscle activation may contribute to risk of injury and low back pain through both prolonged activation [26] or inadequate activation [38], compromising spine stability [39]. Therefore, to understand the relationships between the anthropometry of the driver (height, body mass, BMI) and muscle activation, the purpose of this study was to quantify the relationships between trunk muscle activation and selected anthropometric factors both pre- and post-fatigue during WBV exposure.

2. Materials and Methods

Twenty-nine participants, 18 males (23.9 ± 2.8 years; 78.7 ± 15.3 kg; 176.3 ± 7.5 cm) and 11 females (22.7 ± 2.2 years; 65.2 ± 11.0 kg; 166.4 ± 6.6 cm) with no history of low back pain or musculoskeletal injury took part in this study, following approval by the University of Guelph Research Ethics Board (REB#: 17-08-006).

2.1. Electromyography

Eight surface EMG sensors (four SP-W01 Delsys Trigno and four SP-W04 Delsys Trigno mini sensors (Delsys Inc., Natick, MA, USA)) were placed bilaterally on the lumbar erector spinae (LE) and external obliques (EO), as well as the thoracic erector spinae (TE) and internal obliques (IO) following methods by Cram et al. [40] and O’Sullivan et al. [41], respectively (Figure 1). EMG data were collected at a sampling frequency of 2000 Hz using a Delsys Trigno DST01 System (Delsys Inc., Natick, MA, USA). Three maximum voluntary contractions were performed for each muscle for normalization purposes using the methods outlined by Moreside et al. [42], in which the maximum voluntary electrical activation (MVE) was taken as 100% MVE [43].

2.2. Whole-Body Vibration Exposure

Participants sat on a tractor seat (Darby Manufacturing, Sudbury, ON, Canada) mounted on a Mikrolar R-3000 hexapod robot (Mikrolar, Hampton, NY, USA) with the seat suspension system locked out. Participants sat in a neutral posture, without using the backrest or their hands to support themselves. To ensure that their hands were not used for support, participants loosely gripped ropes, which were suspended from the ceiling in front of them (Figure 2).
Participants were exposed to 25 vibration profiles of 20 s each [44]. The vibration profiles were randomized, with an amplitude of 5 mm and frequencies of 1.25, 2.0, 2.5, 4.0, and 4.5 Hz, each of which was repeated five times. These frequencies were chosen as they are the most common profiles experienced by mobile heavy equipment [45] that were within the bounds of the robot capabilities. The presentation of the vibration bouts was randomized, and each participant received a unique sequence of vibration profiles. The vertical axis acceleration was monitored by a single axis modal array, ceramic shear ICP accel PCB model 333B40 uniaxial accelerometer (Dalimar Instruments, Vaudreuil, QC, Canada) at the seat-operator interface to ensure that the WBV exposure was below the recommended daily exposure limit as outlined by the ISO 2631-1 [13]. The accelerometer was embedded in a seat pad as per ISO 2631-1 [13].

2.3. Fatigue Protocol

Following exposure to the first 25 vibration profiles, the lower back muscles of the participants were fatigued using the Modified Biering-Sorensen Test [46]. Fatigue was confirmed by ensuring that the median power frequency was lower following the test, compared to prior to the fatiguing protocol. Following the fatigue protocol, the participants were exposed to a second set of 25 vibration profiles.

2.4. Data Processing

MATLAB was used to process the EMG and acceleration data. The EMG data were processed using the methods outlined by Cram et al., 1998 [40]. The EMG data were band pass filtered using a fourth order Butterworth filter between 30 and 400 Hz [40]. Following band pass filtering, data were full wave rectified, and then a 7 Hz linear envelope was applied using a fourth order Butterworth filter [40]. The processed EMG data were then normalized using the 100% MVE value for each muscle.
Acceleration data were band pass filtered (0.4–40 Hz) [13], and ISO 2631-1 health weightings were applied using the Vibratools software package (Axiom EduTech, Ljuserö, Sweden) to determine the RMS values of the frequency weighted acceleration and the corresponding health guidance caution zones.

2.5. Statistical Analyses

When performing the statistical analyses, age was excluded due to the limited age range of the participants (19–28 years). Sex was also excluded from the analysis, as it has been suggested that sex has no effect on peak magnitude of the apparent mass or primary resonant frequency at the frequencies investigated in this study [47,48]. Furthermore, Dewangan et al. has suggested that sex-based differences in VPA are largely accounted for via anthropometric factors [20]. Prior to analysis, a Box-Cox transformation was applied to the %MVE data to obtain normally distributed data. Relationships between height, body mass, BMI, and muscle activation for the LE, EO, TE, and IO muscles were quantified using a Spearman’s rank coefficient of correlation (p ≤ 0.05) and stepwise linear regressions. Pairwise Spearman correlations [49] were performed for the entire data set, as well as the individual frequency groupings. Stepwise linear regression was performed using forward selection with an alpha to enter (α) value of 0.10 and the normally distributed %MVE data as the outcome variable. Stepwise linear regressions were performed for each muscle using the entire data set. Body mass, BMI, and height were considered in all the regression models, and frequency was considered where applicable. The stepwise regressions and pairwise correlations were performed using Minitab version 19.2020.1 (Minitab, State College, PA, USA). Pre- and post-fatigue data sets were analyzed separately because current ISO 2631-1 RMS values of frequency weighted acceleration for use in health evaluation and health guidance caution zones do not consider fatigue as a risk factor. However, research has suggested that trunk muscle fatigue during WBV leads to increased muscle latency and increased discomfort [31], which are associated with increased risk of low back injury [32,33,34].

3. Results

Of the 29 participants included in this study, 1 participant had a BMI in the obesity class 2 range (male), 4 participants had a BMI within the obesity class 1 range (1 female, 3 male), 5 were pre-obesity (1 female, 4 male), 1 was underweight (male) and 18 were within the normal range (9 male, 9 female) based on the BMI classes outlined by the World Health Organization [50].

3.1. Spearman’s Rank Coefficient of Correlation

Muscle activation and vibration frequency were positively correlated for pre-fatigue transformed %MVE data (%MVET) of the IO (ρ = 0.25, p < 0.0001), LE (ρ = 0.17, p < 0.0001), and TE (ρ = 0.17, p < 0.0001), but negatively correlated in the EO (ρ = −0.16, p < 0.0001). Post-fatigue, the EO (ρ = 0.17, p < 0.0001), IO (ρ = 0.27, p < 0.0001), LE (ρ = 0.19, p < 0.0001), and TE (ρ = 0.20, p < 0.0001) showed positive correlations of similar magnitudes. Participants showed increased muscle activation with increasing frequency for all muscles. BMI showed positive correlations with IO (ρ = 0.34, p < 0.0001), LE (ρ = 0.14, p < 0.0001) and TE (ρ= 0.11, p < 0.0001) pre-fatigue, and continued to show similar trends post-fatigue with Spearman’s rho values of 0.30 (p < 0.0001), 0.10 (p < 0.0001) and 0.15 (p < 0.0001) for the IO, LE, and TE, respectively. BMI did not exhibit significant correlations with %MVET of the EO. These results indicate increased muscle activation with increased BMI in the IO, LE and TE. Pre-fatigue, height was negatively correlated with IO (ρ = −0.34, p < 0.0001), and TE (ρ = −0.20, p < 0.0001), while the EO (ρ = 0.38, p < 0.0001) and LE (ρ = 0.38, p < 0.0001) exhibited a positive correlation. Post-fatigue, height was negatively correlated with EO (ρ = −0.41, p < 0.0001), IO (ρ = −0.28, p < 0.0001), and TE (ρ = −0.17, p < 0.0001), while the LE (ρ = 0.35, p < 0.0001) exhibited a positive correlation. Thus, participants exhibited decreased muscle activation with increased height in the IO, and TE pre- and post-fatigue, while exhibiting increased muscle activation with increased height in the LE. However, in the EO, participants exhibited increased muscle activation with increased height pre-fatigue and decreased muscle activation with increased height post-fatigue. Pre-fatigue, significant correlations between body mass and EO (ρ = 0.13, p < 0.0001), IO (ρ = 0.20, p < 0.0001), LE (ρ = 0.40, p < 0.0001) and TE (ρ = 0.08, p = 0.004) were observed. Furthermore, significant correlations of a similar magnitude between the %MVET and body mass were observed post-fatigue in EO (ρ = −0.18, p < 0.0001), IO (ρ = 0.20, p < 0.0001), LE (ρ = 0.35, p < 0.0001) and TE (ρ = 0.11, p < 0.0001). Therefore, participants exhibited increased muscle activation with increasing body mass in the EO, IO, LE, and TE pre-fatigue and in the IO, LE and TE post-fatigue.
A further analysis performed for each frequency group showed similar findings; however, the correlation between muscle activation and body mass in the pre-fatigue EO was not significant at 1.25 Hz and 4.5 Hz, and the correlation between muscle activation and BMI was not significant in the pre-fatigue LE at 1.25 Hz (Table 1). In the TE, the correlations between %MVET and mass were not significant for any frequency pre-fatigue, and the correlation between %MVET and BMI was not significant from 1.25 to 2.5 Hz in the pre-fatigue data. In the pre-fatigue data, the largest correlations between muscle activation and BMI occurred in the IO, while the largest correlation between muscle activation and body mass occurred in the LE. Interestingly, the IO, EO, and LE all showed similar magnitudes of correlations between muscle activation and height, although the IO showcased a negative correlation while the EO and LE were positive.
In the IO, the post-fatigue data shows a slightly lower correlation between %MVE and height (Table 2). Further, in the EO, the correlations between %MVE and mass as well as %MVE and height are lower magnitude than the pre-fatigue correlation coefficients for all frequencies. Interestingly, in the EO, muscle activation was correlated positively with both height and mass pre-fatigue, however, post-fatigue muscle activation of the EO is negatively correlated with both body mass and height. Similar to the pre-fatigue data, the % MVET of the LE did not show a significant correlation with BMI at 1.25 Hz, however, post-fatigue, the LE does not exhibit a significant correlation with BMI from 1.25 Hz to 2.5 Hz. Furthermore, pre-fatigue the TE does not show a significant correlation with mass at any frequency, however the correlations are significant for all frequencies except 2.5 Hz and 4.5 Hz post-fatigue.

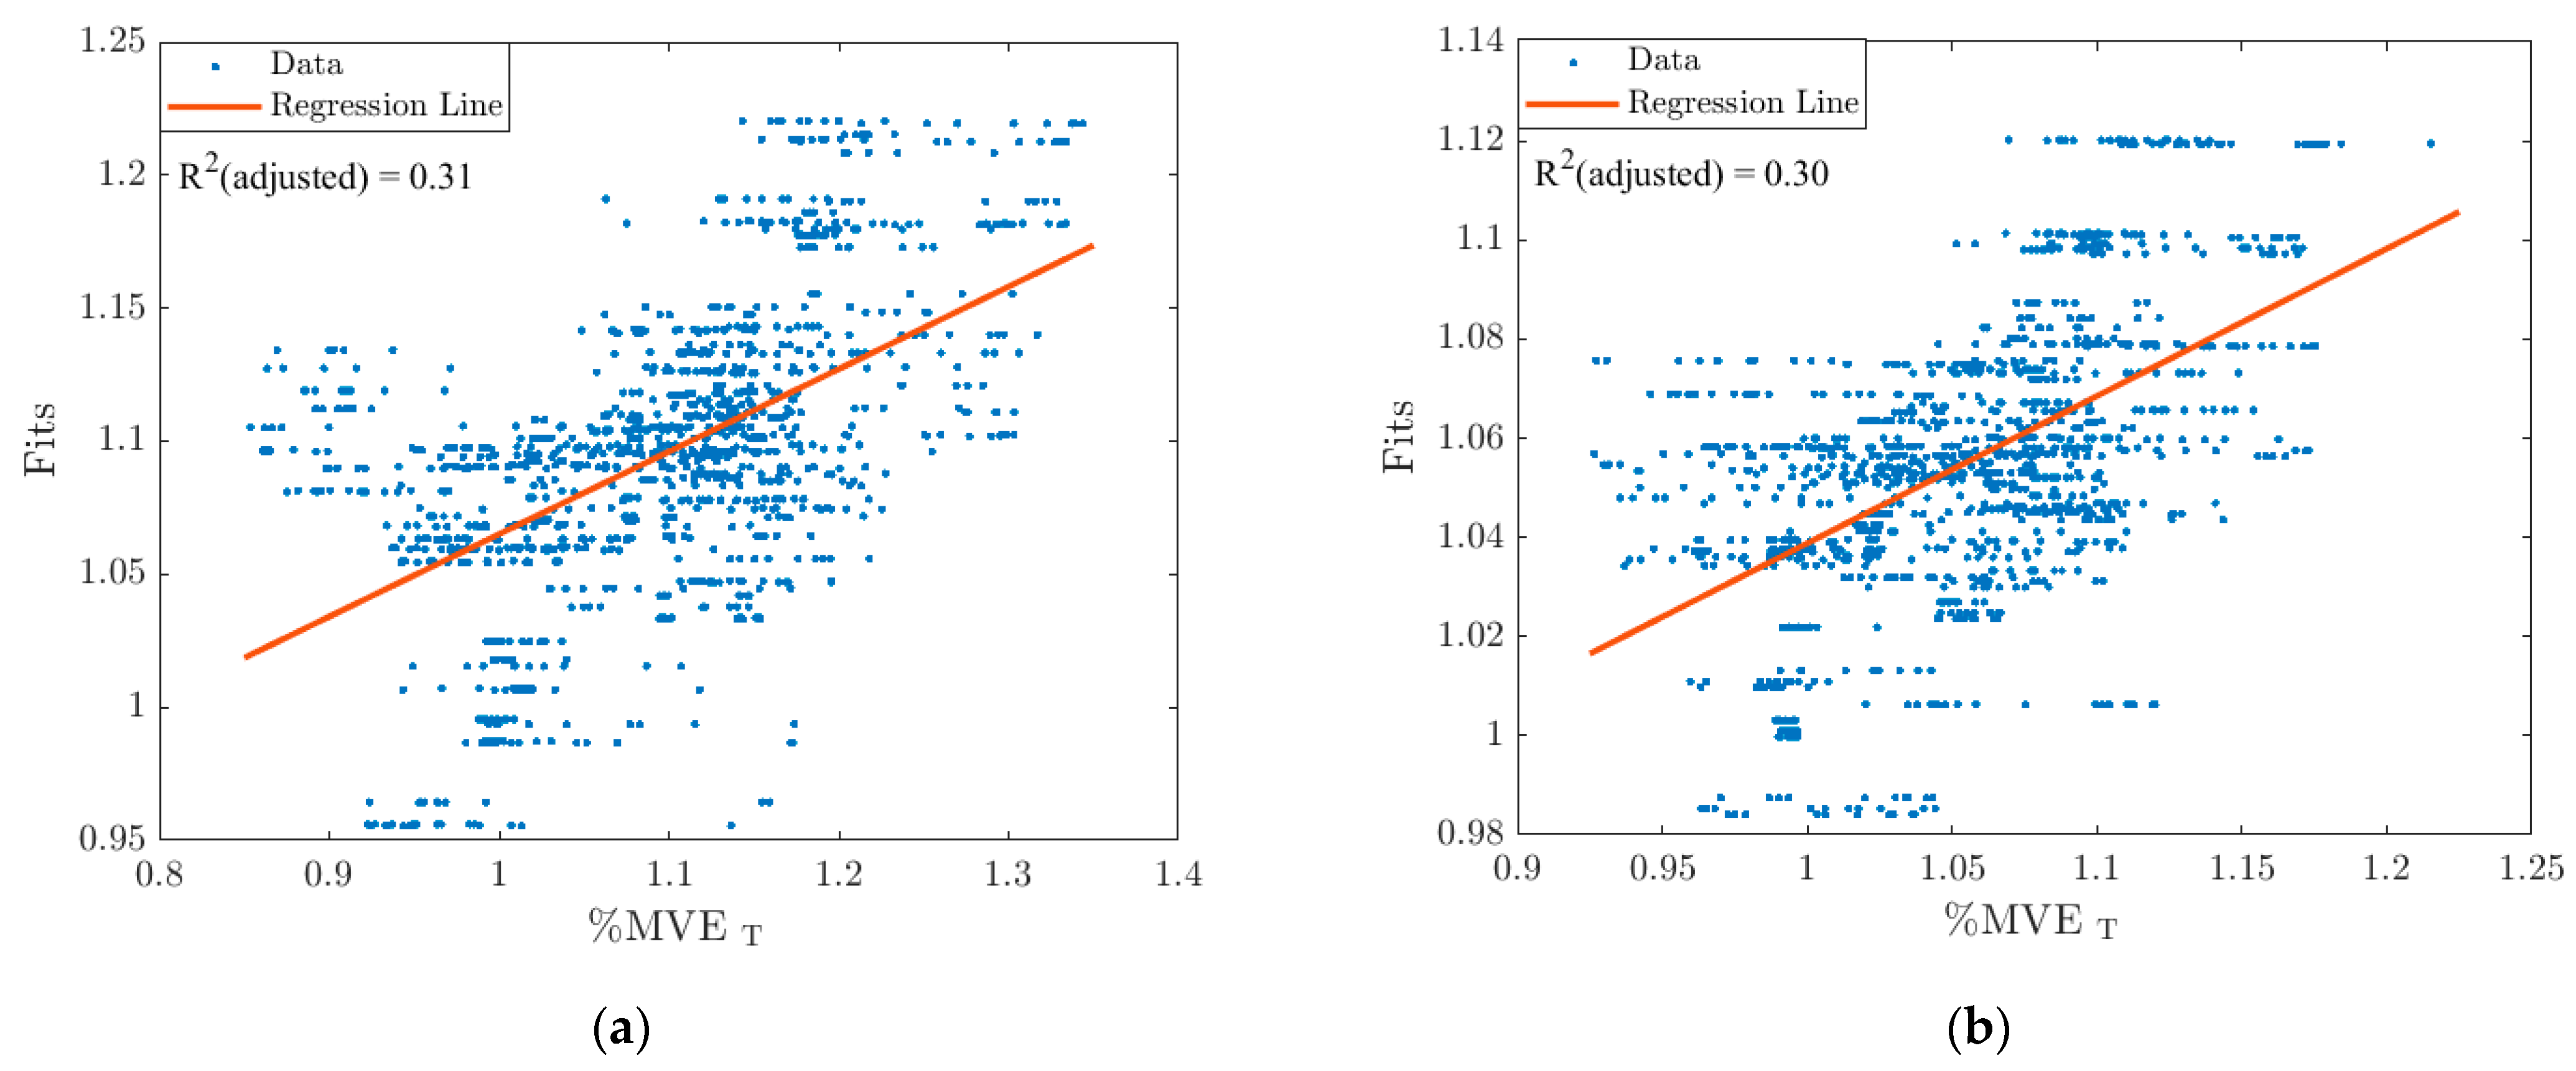
3.2. Stepwise Linear Regression Models

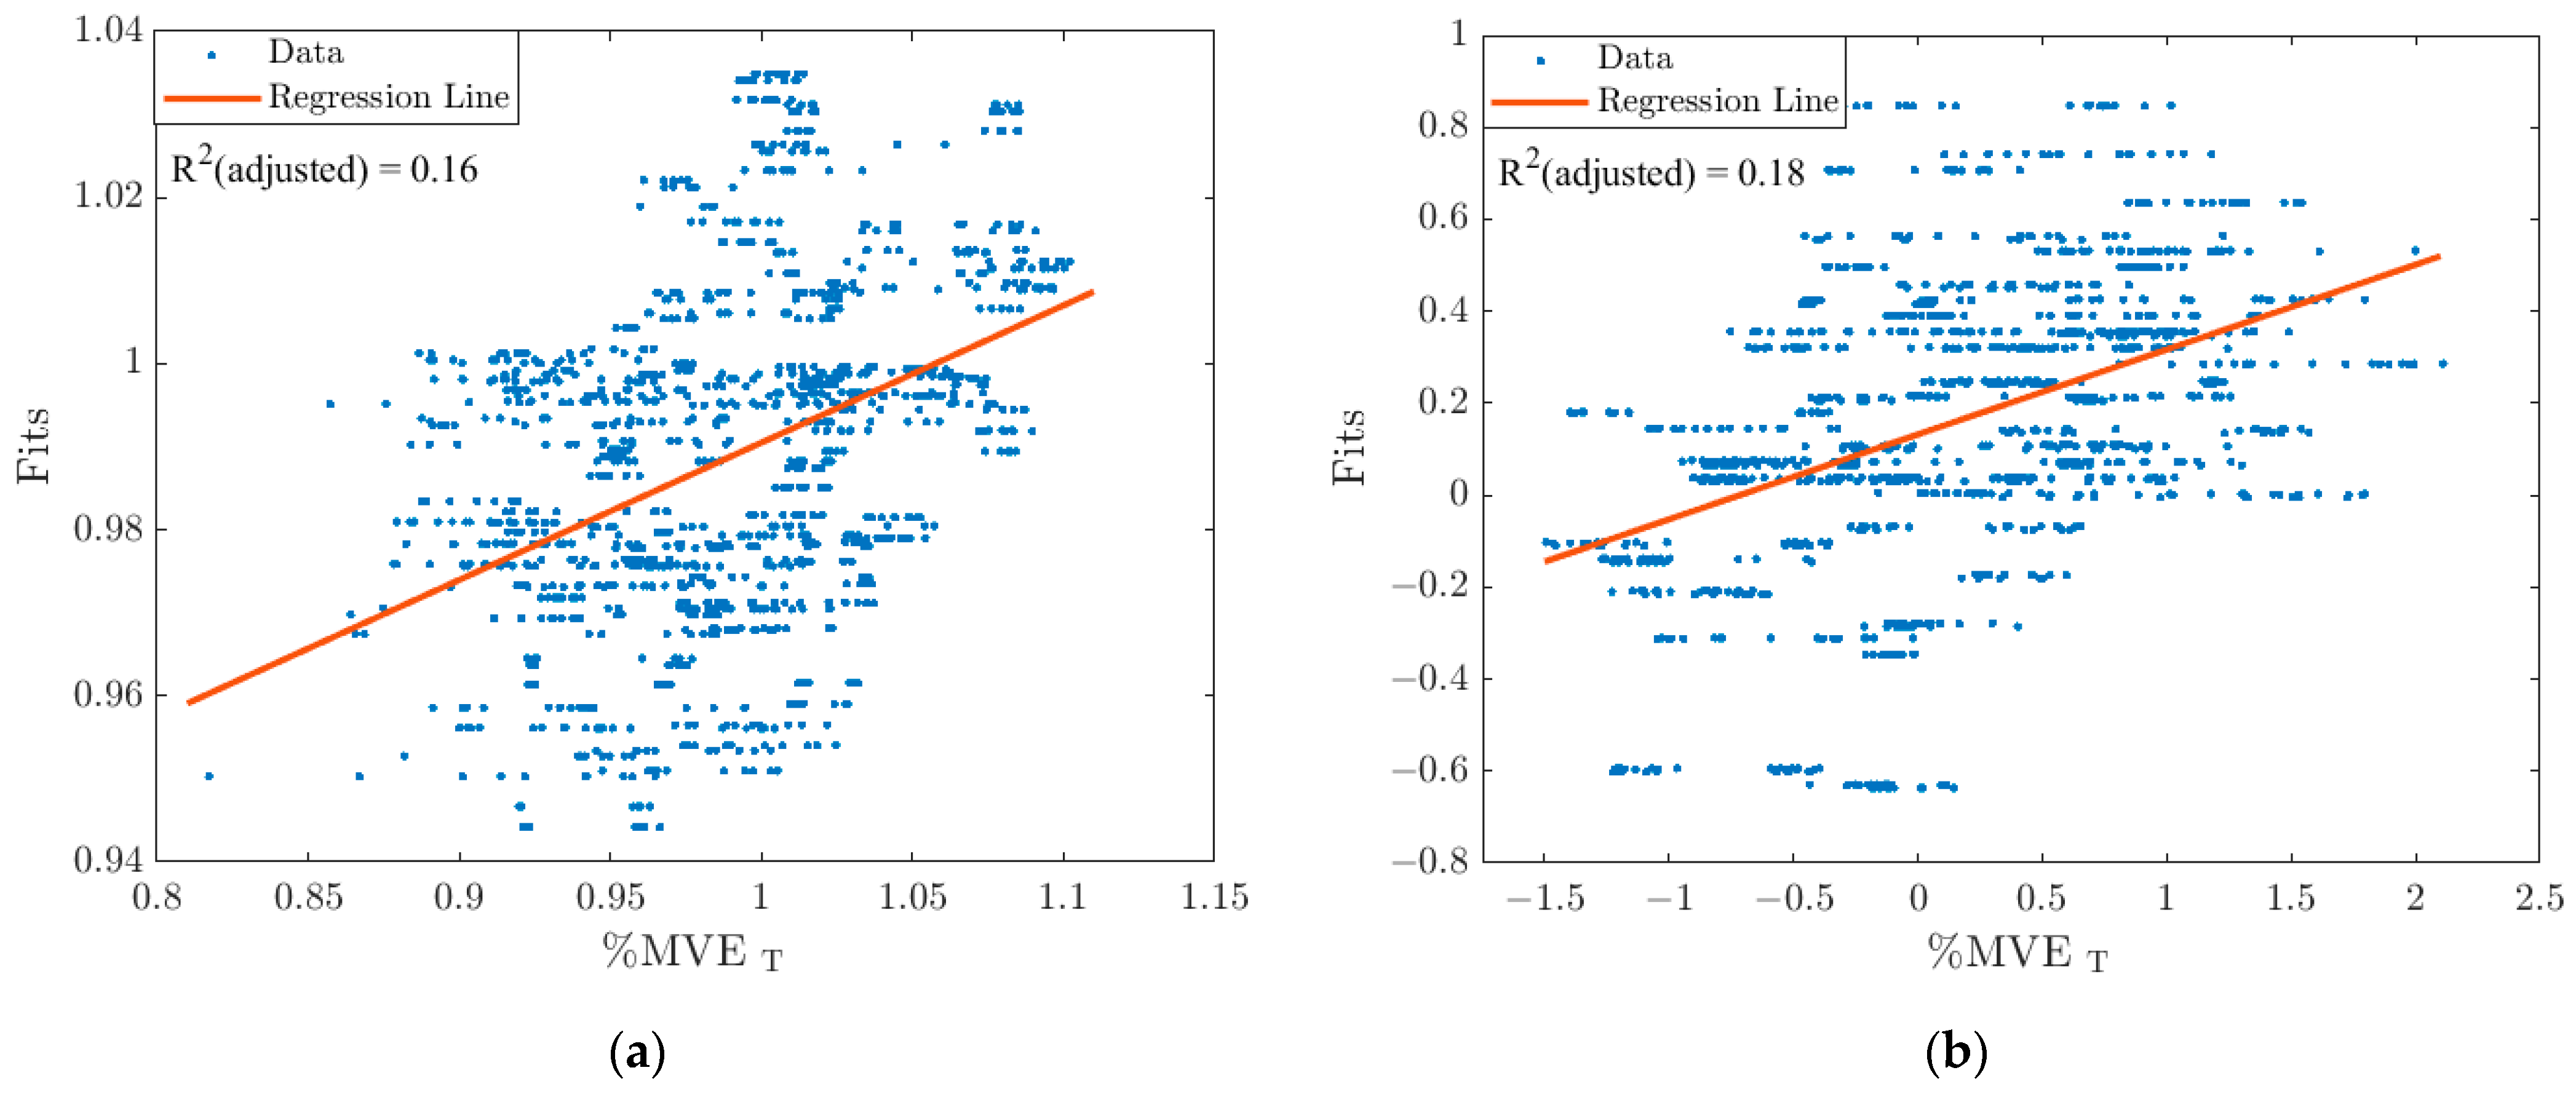
When comparing the pre- and post-fatigue regression models of the EO, there is a minimal change in the R2 (adj) value, with a difference of 0.03 (Figure 3). The regression equations for the pre-fatigue and post-fatigue regression models are presented in Table 3.
The IO showed the largest difference in R2 (adj) values of all the muscles. The pre-fatigue regression was able to explain an additional 5% of the variance in the %MVET data compared to the post-fatigue regression model (Figure 4). The resultant regression model equations for the pre-fatigue and post-fatigue models are presented in Table 4.
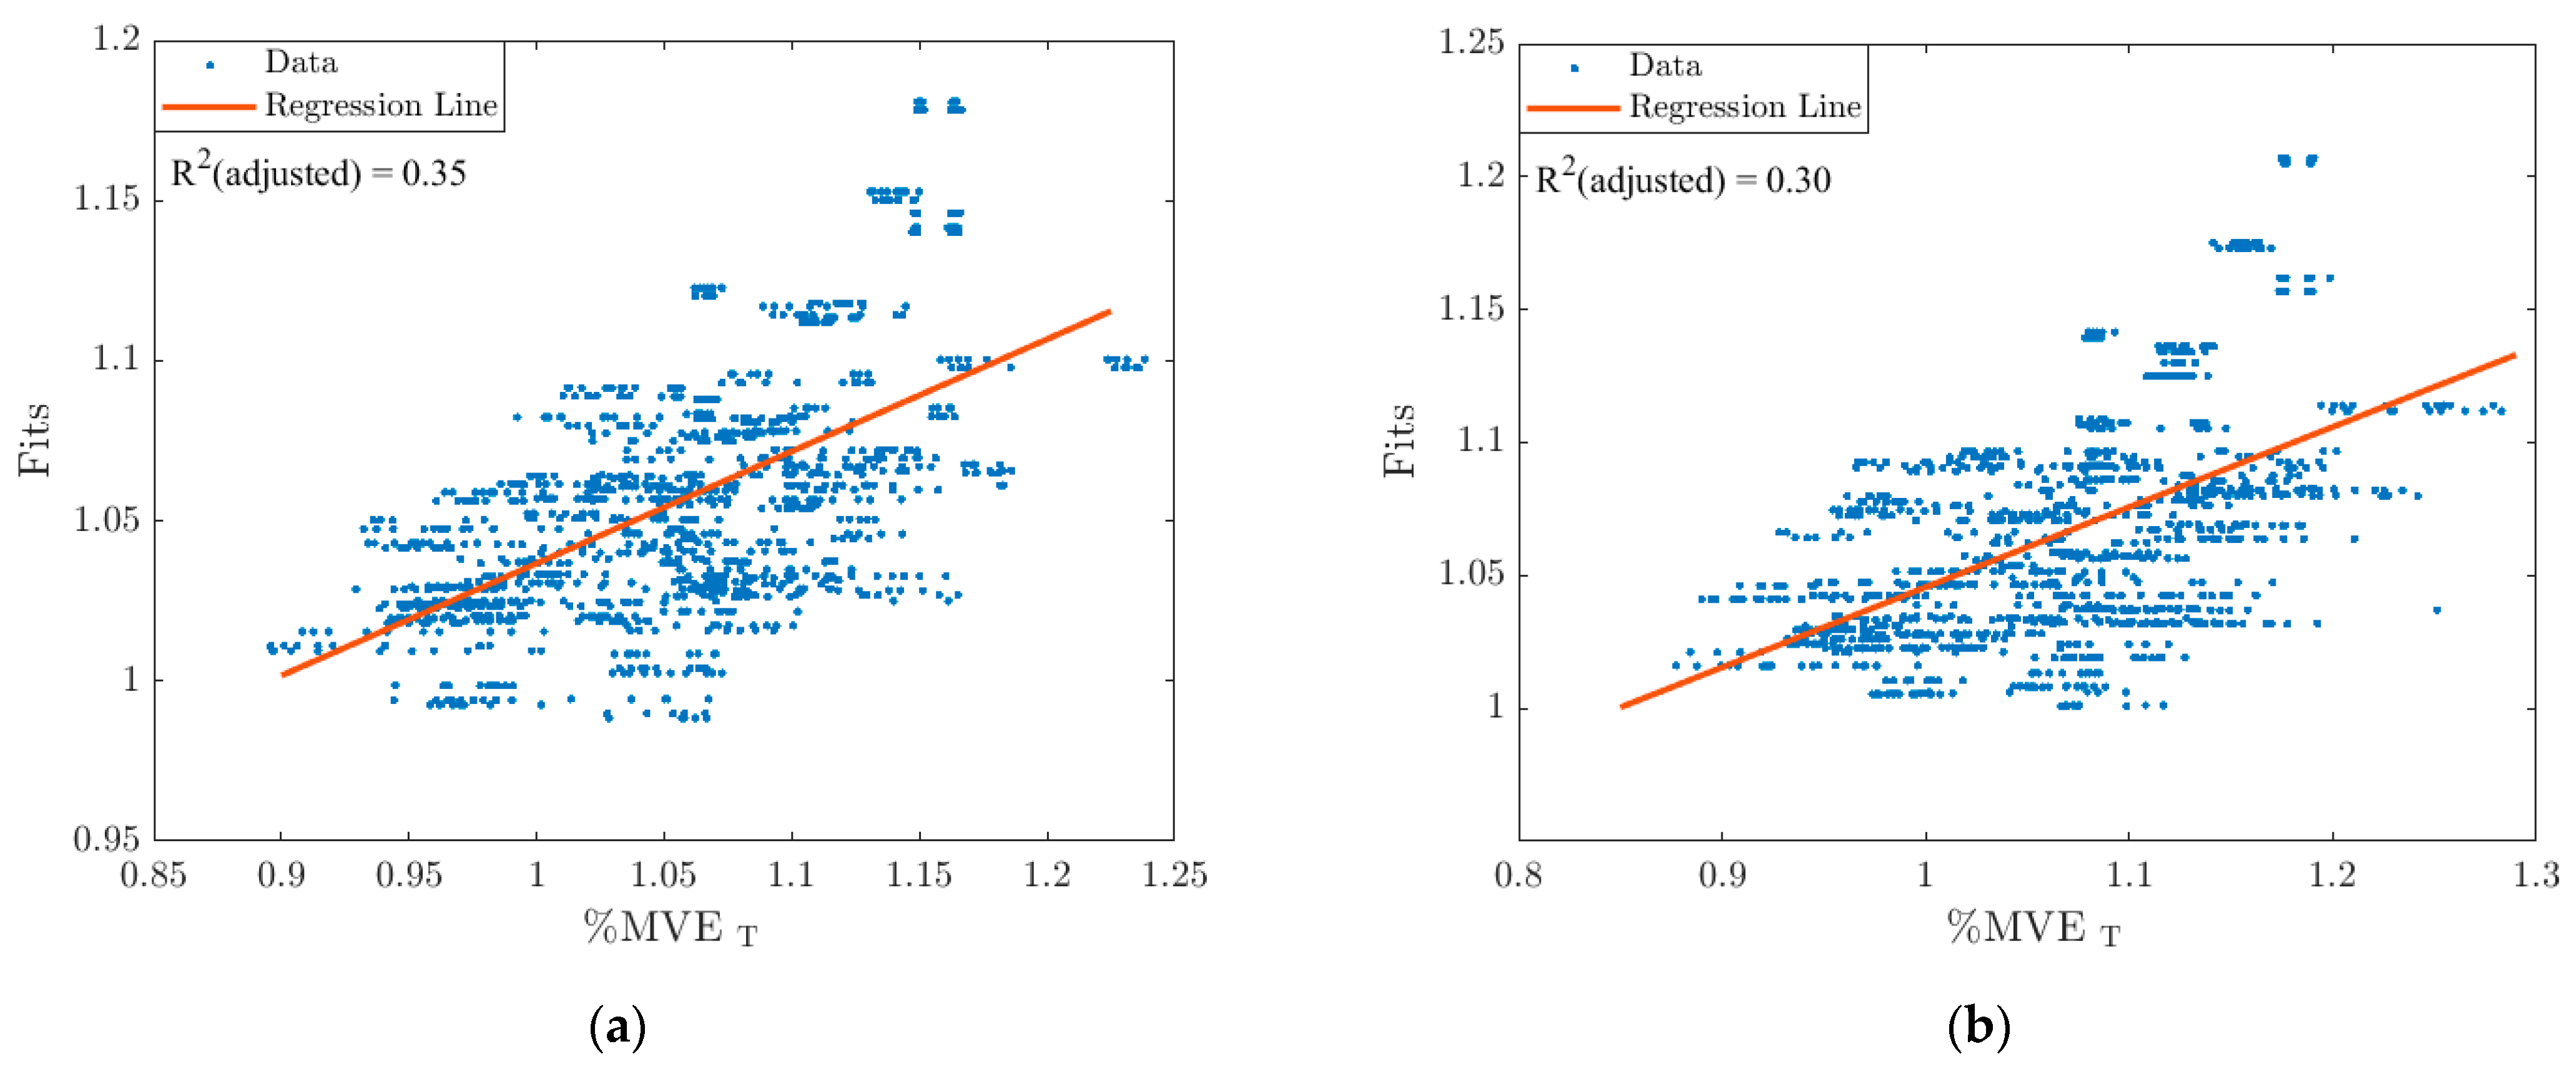
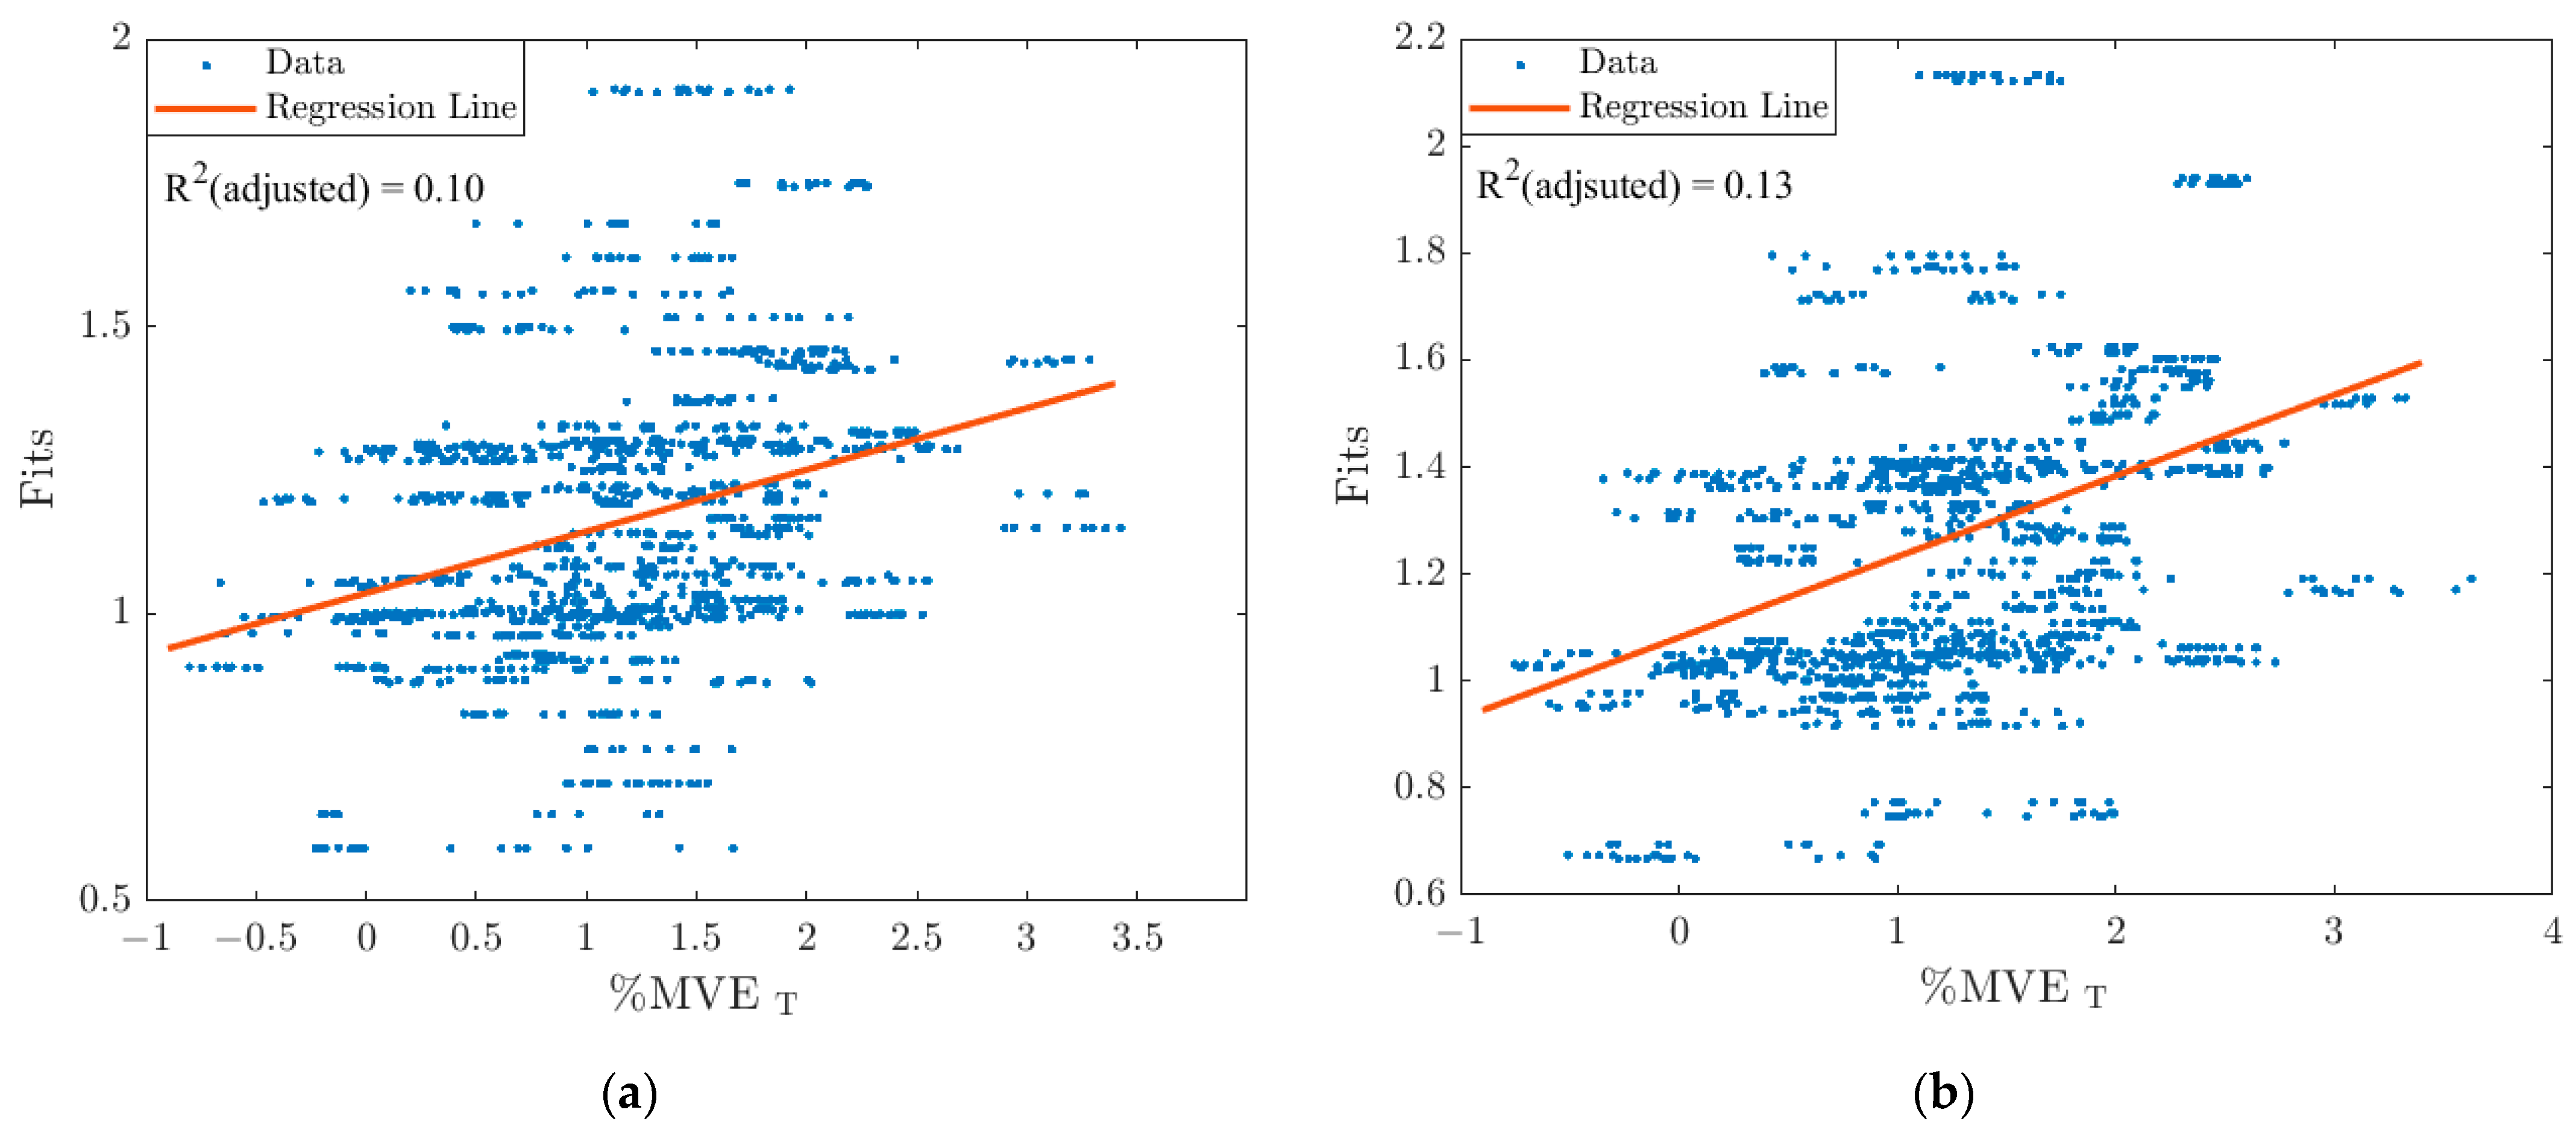
The LE shows minimal changes in the R2 (adj) value and the regression equations (Table 5) between the pre- and post-fatigue regression results (Figure 5).
The TE shows minimal changes in the R2 (adj) value depending on the fatigue condition and the resultant regression model equations (Figure 6). The regression equations for the pre- and post-fatigue models presented in Figure 6 are summarized in Table 6.
When anthropometric factors are excluded from the regression, and frequency is the only factor considered, the resultant pre-fatigue regressions have R2 (adj) values of 0.03, 0.08, 0.02, and 0.03 for the EO, IO, LE and TE, respectively. The post-fatigue regressions result in R2 (adj) values of 0.04, 0.90, 0.04 and 0.05 for the EO, IO, LE and TE, respectively, when frequency is the only factor. These results indicate that using frequency alone describes a small amount of the variance in muscle activation of the muscle groups studied compared to using a combination of frequency and anthropometric factors. The incorporation of anthropometric factors and frequency in the regressions results in increased R2 (adj) values for all muscle groups investigated in both the pre- and post-fatigue regressions. Overall, the weakest regression models were in the TE followed by the EO, while the LE and IO regressions have the largest R2 (adj) values.

4. Discussion

The IO, LE, and TE showed significant positive correlations with frequency in both the pre-and post-fatigue data while the EO exhibited a negative correlation pre-fatigue and a positive correlation post-fatigue. Additionally, frequency was a significant term in the regression models for all muscle groups. This positive correlation may be explained by the forcing frequency of the vibration approaching the peak transmissibility of the thoracic and lumbar spines. When exposed to vertical WBV, peak muscle activation in the thoracic and lumbar erector spinae occurs between 4 and 5 Hz [27], which corresponds to the peak transmissibility of the thoracic and lumbar spines, which occurs at 4 Hz [27]. The negative correlation between muscle activation in the EO pre-fatigue may suggest that participants relied more on the IO, LE, and TE to stabilize their spine pre-fatigue. The positive correlation post-fatigue may suggest that participants began increasing activation of their EO once their erector spinae were fatigued.
IO, LE, and TE resulted in significant positive correlations with BMI as well as body mass, both of which may lead to increased shear forces on the spine [24]. The neuromuscular system often responds to increased forces within the spine by increasing overall trunk muscle activation [38], as this may provide additional stability to the lumbar spine [39]. Although this increased muscle activation is necessary to maintain spine stability, it may lead to increased shear and compression forces on the spine, introducing risk of tissue injury [36]. In contrast to IO, EO had a negative correlation with body mass and post-fatigue. This aligns with previous findings, in which an increased body mass was correlated with reduced WBV transmission [14], thus reducing the muscle activation necessary to stabilize the spine.
Like increased body mass and increased BMI, increased height may lead to increased shear forces within the spine [24]. Furthermore, it has been shown that vertical vibration transmission through the thorax is increased in individuals of increased height in the frequencies investigated [38], thus thoracic muscle activation would be expected to increase to maintain spine stability [39]. However, the correlation between height and muscle activation was negative in the IO and TE both pre- and post-fatigue, as well as negative in the EO post-fatigue. This indicates decreased levels of muscle activation with increased height. Pre- and post-fatigue in the LE, and pre-fatigue in the EO, participants demonstrated increased muscle activation with increased height. This would be beneficial for stabilizing the spine, but the negative correlations observed in the IO, TE, and post-fatigue EO may lead to decreased spine stability due to reduced thoracic muscle activation. This finding may be a contributing factor to the association between low back pain and increased body height in farmers [4]. Therefore, when returning to work following a WBV related low-back injury it may be beneficial to train operators to properly engage the muscles of the abdomen to brace their thorax and increase spine stability during WBV exposure.
Furthermore, the incorporation of anthropometric factors in addition to frequency greatly improved the fit of the regressions, allowing an explanation of 11–35% of the variation in muscle activation, as compared to 2–9% of the variance which was accounted for using frequency alone. However, ISO 2631-1 health guidance caution zones are based on frequency weighted RMS acceleration [13]. The current study suggests that ISO health guidance should consider body mass, BMI, and height in addition to frequency weighted RMS acceleration as these anthropometric factors may influence muscle activation during seated WBV exposure and influence the risk of low back injury when exposed to WBV.
The current problem with the ISO standard is that according to our accelerometry measurements and the determination of the RMS values of the frequency weighted acceleration, all of our participants were in the same health guidance zone. However, our data suggests that their injury risk levels were likely not equal as evidenced by their different muscle activations. When applying the health guidance caution zones from ISO 2631-1, this results in an underestimation of risk in some individuals and an overestimation in others. Moreover, by analyzing pre- and post- fatigue data, we have shown that these potential differences in risk level are present regardless of muscle fatigue status. The evidence that we present is that individuals of increased height as well as individuals of increased BMI may have increased risk both prior to and following fatigue. The increased risk with height is due to lower muscle activation in the thoracic erector spinae (TE), external oblique (EO) and internal oblique (IO) muscles, which may result in decreased spinal stability [39]. Increased risk with increasing BMI is due to increased muscle activation in the IO, LE, and TE, which may lead to increased risk of soft tissue injury [36].
Although the values of the frequency weighted RMS accelerations are different across the five frequency levels (i.e., due to the peak-to-peak displacement always being 5 mm), they result in all participants falling into the same health guidance caution zone because the frequency values are not different enough from each other. Moreover, the health frequency weighted RMS accelerations are all below the lower boundary of the health guidance caution zone.
We propose adding additional features for consideration in health guidance alongside the frequency weighted accelerations. The determination of appropriate features will require much more research, which includes both retrospective and prospective epidemiological studies, as well as a better understanding of how body resonant frequencies are affected by factors such as body composition and seat contact area. This research may also include a sensitivity analysis to determine at which point increased height begins to increase injury risk due to decreased muscle activation and thus decreased spine stability. Furthermore, the point at which increased BMI begins to increase tissue injury risk due to increased muscle activation should also be investigated. This would require a larger and more anthropometrically diverse sample population than the population investigated in this study. This sensitivity analysis could include further factors such as body type (e.g., endomorphic, ectomorphic, mesomorphic), lean body mass, % body fat, age, sex, and the anthropometric variables investigated in this study to determine which factors are the most robust predictors of muscle activation.
Several studies have suggested that obesity is related to decreased postural stability in standing tasks [51,52,53] which may be due to the increased torque necessary to stabilize the body [54], or poor sensory input from the foot mechanoreceptors [55]. Body weight, height, and age have also been shown to be predictors of postural stability [56]. Furthermore, Arora et al. demonstrated decreased postural stability during seated WBV exposure as evidenced by an increased center of pressure (COP) displacement and an increased mean velocity of COP displacement [12]. Thus, the effect of anthropometric factors on postural stability during seated WBV should be investigated. Increased muscle activation in conjunction with increased forces in the spine due to WBV can lead to muscle fatigue and spinal instability, increasing the back injury risk [10,57]. It is therefore important to consider the effect of anthropometric factors on muscle activation, since this may lead to an increased back injury risk.
One of the limitations of the current study was the lack of posture monitoring during data collection, therefore, it cannot be ruled out that some of the differences in muscle activation may be due to postural changes. Additionally, BMI does not differentiate between body fat and muscle [58]. It has been suggested that body fat and muscle mass may impact the resonant frequency of the human body due to their anti-thixotropic and thixotropic properties, respectively [20]. To provide a more complete picture of the correlations between muscle activation and driver anthropometry, further research should be conducted to evaluate muscle activations throughout the range of human torso resonant frequencies (i.e., 4–14 Hz). Furthermore, lean body mass [20], body fat, and hip circumference [59] should also be considered due their influence on biodynamics during WBV exposure.

5. Conclusions

The results indicate increased muscle activation in individuals with increased body mass and BMI in all the trunk muscle groups investigated (EO, IO, LE, TE (pre-fatigue)), as well as decreased muscle activation with increased height in the IO and TE, as well as the EO post-fatigue. The increased activation with increased body mass and BMI may be due to the body responding by increasing thoracic muscle activation to increase spinal stability. Muscle activation was expected to increase with increased height, which is necessary to increase spine stability. However, the results show that muscle activation in the IO, TE, and post-fatigue EO decreased with increasing height. This may be a contributing factor to the increased incidence of low back pain in taller farmers. Additionally, there is increased muscle activation in the IO, LE, TE, and post-fatigue EO with an increased vertical vibration frequency. This is likely due to the vibration frequency approaching the resonant frequency of the thoracic and lumbar spines, requiring increased muscle activation to maintain spinal stability.
The incorporation of BMI, body mass, and height with vibration frequency greatly improves the explanation of variance in the muscle activation of the trunk muscles. These anthropometric differences may pre-dispose certain groups to increased risk of low back injury due to decreased muscle activation leading to decreased spine stability or increased activation leading to risk of repetitive strain injuries. Therefore, this research suggests that ISO 2631-1 health guidance may need to consider anthropometric factors to capture their potential influence on injury risk.

Author Contributions

M.E.G.: conceptualization, methodology, formal analysis, writing. A.J.N.: investigation, methodology, formal analysis. M.H.: writing—review and editing, supervision. M.L.O.: conceptualization, methodology, funding acquisition, writing—review and editing, supervision. All authors have read and agreed to the published version of the manuscript.

Funding

This research was funded by the Natural Sciences and Engineering Research Council of Canada, grant numbers 390178-10 (2009–2010) and 2019-05240 (2019–2025).

Institutional Review Board Statement

The study was conducted according to the guidelines of the Declaration of Helsinki and approved by the University of Guelph Research Ethics Board (REB#: 17-08-006).

Informed Consent Statement

Informed consent was obtained from all subjects involved in the study.

Data Availability Statement

Access to data is restricted due to restrictions placed by the University of Guelph Research Ethics Board to protect the privacy of the study participants.

Conflicts of Interest

The authors declare no conflict of interest. The funders had no role in the study design, in the collection, analyses, or data interpretation, in the writing of the manuscript or in the decision to publish the results.

References

  1. Zeng, X.; Kociolek, A.M.; Khan, M.I.; Milosavljevic, S.; Bath, B.; Trask, C. Whole Body Vibration Exposure Patterns in Canadian Prairie Farmers. Ergonomics 2017, 60, 1064–1073. [Google Scholar] [CrossRef]
  2. Brammer, A.J.; Peterson, D.R. Vibration, mechanical shock, and impact. In Standard Handbook of Biomedical Engineering and Design; McGraw-Hill: New York, NY, USA, 2004; pp. 10.1–10.25. [Google Scholar]
  3. Chaudhary, D.K.; Bhattacherjee, A.; Patra, A.K.; Upadhyay, R.; Chau, N. Associations between Whole-Body Vibration Exposure and Occupational and Personal Factors in Drill Operators in Indian Iron Ore Mines. Min. Metall. Explor. 2019, 36, 495–511. [Google Scholar] [CrossRef]
  4. Gustafsson, B.; Pinzke, S.; Isberg, P. Musculoskeleteal Symptoms in Swedish Dairy Farmers. Swed. J. Agric. Res. 1994, 24, 177–188. [Google Scholar]
  5. Milosavljevic, S.; Mani, R.; Ribeiro, D.C.; Vasiljev, R.; Rehn, B. Exploring How Anthropometric, Vehicle and Workplace Factors Influence Whole-Body Vibration Exposures during on-Farm Use of a Quad Bike. Int. J. Ind. Ergon. 2012, 42, 392–396. [Google Scholar] [CrossRef]
  6. Schwarze, S.; Notbohm, G.; Dupuis, H.; Härtung, E. Dose-Response Relationships between Whole-Body Vibration and Lumbar Disk Disease-A Field Study on 388 Drivers of Different Vehicles. J. Sound Vib. 1998, 215, 613–628. [Google Scholar] [CrossRef]
  7. Bovenzi, M.; Hulshof, C.T.J. An Updated Review of Epidemiologic Studies on the Relationship between Exposure to Whole-Body Vibration and Low Back Pain. J. Sound Vib. 1998, 215, 595–611. [Google Scholar] [CrossRef]
  8. Wikström, B.O.; Kjellberg, A.; Landström, U. Health Effects of Long-Term Occupational Exposure to Whole-Body Vibration: A Review. Int. J. Ind. Ergon. 1994, 14, 273–292. [Google Scholar] [CrossRef]
  9. Burström, L.; Nilsson, T.; Wahlström, J. Whole-Body Vibration and the Risk of Low Back Pain and Sciatica: A Systematic Review and Meta-Analysis. Int. Arch. Occup. Environ. Health 2015, 88, 403–418. [Google Scholar] [CrossRef]
  10. Reeves, N.P.; Cholewicki, J.; Milner, T.; Lee, A.S. Trunk Antagonist Co-Activation Is Associated with Impaired Neuromuscular Performance. Exp. Brain Res. 2008, 188, 457–463. [Google Scholar] [CrossRef] [PubMed] [Green Version]
  11. Arora, N.; Grenier, S.G. Acute Effects of Whole Body Vibration on Directionality and Reaction Time Latency of Trunk Muscles: The Importance of Rest and Implications for Spine Stability. J. Electromyogr. Kinesiol. 2013, 23, 394–401. [Google Scholar] [CrossRef] [PubMed]
  12. Arora, N.; Graham, R.B.; Grenier, S.G. Effect of Whole Body Vibration on the Postural Control of the Spine in Sitting. Hum. Mov. Sci. 2015, 40, 77–88. [Google Scholar] [CrossRef]
  13. ISO-ISO 2631-1:1997-Mechanical Vibration and Shock—Evaluation of Human Exposure to Whole-Body Vibration—Part 1: General Requirements; International Organization for Standardization: Geneva, Switzerland, 1997.
  14. Milosavljevic, S.; Mcbride, D.I.; Bagheri, N.; Vasiljev, R.M.; Mani, R.; Carman, A.B.; Rehn, B. Exposure to Whole-Body Vibration and Mechanical Shock: A Field Study of Quad Bike Use in Agriculture. Ann. Occup. Hyg. 2011, 55, 286–295. [Google Scholar] [CrossRef] [PubMed] [Green Version]
  15. Caffaro, F.; Cremasco, M.M.; Preti, C.; Cavallo, E. Ergonomic Analysis of the Effects of a Telehandler’s Active Suspended Cab on Whole Body Vibration Level and Operator Comfort. Int. J. Ind. Ergon. 2016, 53, 19–26. [Google Scholar] [CrossRef]
  16. Rakheja, S.; Mandapuram, S.; Dong, R.G. Energy Absorption of Seated Occupants Exposed to Horizontal Vibration and Role of Back Support Condition. Ind. Health 2008, 46, 550–566. [Google Scholar] [CrossRef] [PubMed] [Green Version]
  17. Wang, W.; Rakheja, S.; Boileau, P.É. The Role of Seat Geometry and Posture on the Mechanical Energy Absorption Characteristics of Seated Occupants under Vertical Vibration. Int. J. Ind. Ergon. 2006, 36, 171–184. [Google Scholar] [CrossRef]
  18. Holmlund, P.; Lundström, R.; Lindberg, L. Mechanical Impedance of the Human Body in Vertical Direction. Appl. Ergon. 2000, 31, 415–422. [Google Scholar] [CrossRef]
  19. Huston, D.R.; Johnson, C.C.; Wood, M.A.; Zhao, X. Vibration Attenuating Characteristics of Air Filled Seat Cushions. J. Sound Vib. 1999, 222, 333–340. [Google Scholar] [CrossRef]
  20. Dewangan, K.N.; Rakheja, S.; Marcotte, P. Gender and Anthropometric Effects on Whole-Body Vibration Power Absorption of the Seated Body. J. Low Freq. Noise Vib. Act. Control 2018, 37, 167–190. [Google Scholar] [CrossRef] [Green Version]
  21. Toward, M.G.R.; Griffin, M.J. Apparent Mass of the Human Body in the Vertical Direction: Inter-Subject Variability. J. Sound Vib. 2011, 330, 827–841. [Google Scholar] [CrossRef] [Green Version]
  22. Blood, R.P.; Ploger, J.D.; Johnson, P.W. Whole Body Vibration Exposures in Forklift Operators: Comparison of a Mechanical and Air Suspension Seat. Ergonomics 2010, 53, 1385–1394. [Google Scholar] [CrossRef]
  23. Holmberg, S.; Thelin, A.; Stiernstrom, E.-L.; Svardsudd, K. Psychosocial Factors and Low Back Pain, Consultations, and Sick Leave Among Farmers and Rural Referents: A Population-Based Study. J. Occup. Environ. Med. 2004, 46, 993–998. [Google Scholar] [CrossRef] [PubMed]
  24. Seidel, H.; Blüthner, R.; Hinz, B. Application of Finite-Element Models to Predict Forces Acting on the Lumbar Spine during Whole-Body Vibration. Clin. Biomech. 2001, 16, 57–63. [Google Scholar] [CrossRef]
  25. Fritz, M. Description of the Relation between the Forces Acting in the Lumbar Spine and Whole-Body Vibrations by Means of Transfer Functions. Clin. Biomech. 2000, 15, 234–240. [Google Scholar] [CrossRef]
  26. van der Windt, D.A.W.; Thomas, E.; Pope, D.P.; de Winter, A.F.; Macfarlance, G.J.; Bouter, L.M.; Silman, A.J. Occupational Risk Factors for Shoulder Pain: A Systemic Review. Occup. Environ. Med. 2000, 57, 433–442. [Google Scholar] [CrossRef] [PubMed] [Green Version]
  27. Baig, H.A.; Dorman, D.B.; Bulka, B.A.; Shivers, B.L.; Chancey, V.C.; Winkelstein, B.A. Characterization of the Frequency and Muscle Responses of the Lumbar and Thoracic Spines of Seated Volunteers during Sinusoidal Whole Body Vibration. J. Biomech. Eng. 2014, 136, 101002. [Google Scholar] [CrossRef] [PubMed] [Green Version]
  28. Bazrgari, B.; Shirazi-Adl, A.; Kasra, M. Seated Whole Body Vibrations with High-Magnitude Accelerations-Relative Roles of Inertia and Muscle Forces. J. Biomech. 2008, 41, 2639–2646. [Google Scholar] [CrossRef] [PubMed]
  29. Grondin, D.E.; Potvin, J.R. Effects of Trunk Muscle Fatigue and Load Timing on Spinal Responses during Sudden Hand Loading. J. Electromyogr. Kinesiol. 2009, 19, e237–e245. [Google Scholar] [CrossRef] [PubMed]
  30. Granata, K.P.; Gottipati, P. Fatigue Influences the Dynamic Stability of the Torso. Ergonomics 2008, 51, 1258–1271. [Google Scholar] [CrossRef]
  31. Nolan, A.J.; Govers, M.E.; Oliver, M.L. Effect of Fatigue on Muscle Latency, Muscle Activation and Perceived Discomfort When Exposed to Whole-Body Vibration. Ergonomics 2021, 64, 1281–1296. [Google Scholar] [CrossRef] [PubMed]
  32. Panjabi, M.M. The Stabilizing System of the Spine. Part II. Neutral Zone and Instability Hypothesis. J. Spinal Disord. 1992, 5, 390–397. [Google Scholar] [CrossRef] [PubMed]
  33. Panjabi, M.M. The Stabilizing System of the Spine. Part I. Function, Dysfunction, Adaptation and Enhancement. J. Spinal Disord. 1992, 5, 383–389. [Google Scholar] [CrossRef] [PubMed]
  34. Hamberg-van Reenen, H.H.; van der Beek, A.J.; Blatter, B.; van der Grinten, M.P.; van Mechelen, W.; Bongers, P.M. Does Musculoskeletal Discomfort at Work Predict Future Musculoskeletal Pain? Ergonomics 2008, 51, 637–648. [Google Scholar] [CrossRef] [PubMed]
  35. Wilder, D.G.; Aleksiev, A.R.; Magnusson, M.L.; Pope, M.H.; Spratt, K.F.; Goel, V.K. Muscular Response to Sudden Load: A Tool to Evaluate Fatigue and Rehabilitation. Spine 1996, 21, 2628–2639. [Google Scholar] [CrossRef] [PubMed]
  36. Wang, W.; Bazrgari, B.; Shirazi-Adl, A.; Rakheja, S.; Boileau, P.-E. Biodynamic Response and Spinal Load Estimation of Seated Body in Vibration Using Finite Element Modeling. Ind. Health 2010, 48, 557–564. [Google Scholar] [CrossRef] [PubMed] [Green Version]
  37. Milosavljevic, S.; Bagheri, N.; Vasiljev, R.M.; McBride, D.I.; Rehn, B. Does Daily Exposure to Whole-Body Vibration and Mechanical Shock Relate to the Prevalence of Low Back and Neck Pain in a Rural Workforce? Ann. Occup. Hyg. 2012, 56, 10–17. [Google Scholar] [CrossRef] [Green Version]
  38. Kingma, I.; Staudenmann, D.; van Dieën, J.H. Trunk Muscle Activation and Associated Lumbar Spine Joint Shear Forces under Different Levels of External Forward Force Applied to the Trunk. J. Electromyogr. Kinesiol. 2007, 17, 14–24. [Google Scholar] [CrossRef] [PubMed]
  39. Cholewicki, J.; Juluru, K.; Mcgill, S.M. Intra-Abdominal Pressure Mechanism for Stabilizing the Lumbar Spine. J. Biomech. 1999, 32, 13–17. [Google Scholar] [CrossRef]
  40. Cram, J.R.; Kasman, G.S.; Holtz, J. Introduction to Surface Electromyography; Aspen Publishers Inc.: Chicago, IL, USA, 1998. [Google Scholar]
  41. O’Sullivan, K.; McCarthy, R.; White, A.; O’Sullivan, L.; Dankaerts, W. Lumbar Posture and Trunk Muscle Activation during a Typing Task When Sitting on a Novel Dynamic Ergonomic Chair. Ergonomics 2012, 55, 1586–1595. [Google Scholar] [CrossRef] [PubMed]
  42. Moreside, J.M.; Vera-garcia, F.J.; Mcgill, S.M. Trunk Muscle Activation Patterns, Lumbar Compressive Forces, and Spine Stability When Using the Bodyblade. Phys. Ther. 2007, 87, 153–163. [Google Scholar] [CrossRef] [Green Version]
  43. Mathiassen, S.E.; Winkel, J.; Hagg, G.M. Normalization of Surface EMG Amplitude from the Upper Trapezius Muscle in Ergonomic Studies-A Review. J. Electromyogr. Kinesiol 1995, 5, 197–226. [Google Scholar] [CrossRef]
  44. Dickey, J.P.; Oliver, M.L.; Boileau, P.-E.; Eger, T.R.; Trick, L.M.; Edwards, A.M. Multi-Axis Sinusoidal Whole-Body Vibrations: Part I-How Long Should the Vibration and Rest Exposures Be for Reliable Discomfort Measures? J. Low Freq. Noise Vib. Act. Control 2006, 25, 175–184. [Google Scholar] [CrossRef]
  45. Ji, X.; Eger, T.R.; Dickey, J.P. Development of a Seat Selection Algorithm to Match Industrial Seats with Specific Forestry Vibration Exposures. Int. J. For. Eng. 2015, 26, 48–59. [Google Scholar] [CrossRef]
  46. Mannion, A.F.; Connolly, B.; Dolan, P. The Use of Surface EMG Power Spectral Analysis in the Evaluation of Back Muscle Function. J. Rehabil. Res. Dev. 1997, 34, 427–447. [Google Scholar]
  47. Mansfield, N.J.; Holmlund, P.; Lundström, R. Apparent Mass and Absorbed Power during Exposure to Whole-Body Vibration and Repeated Shocks. J. Sound Vib. 2001, 248, 427–440. [Google Scholar] [CrossRef]
  48. Wang, W.; Rakheja, S.; Boileau, P.É. Effects of Sitting Postures on Biodynamic Response of Seated Occupants under Vertical Vibration. Int. J. Ind. Ergon. 2004, 34, 289–306. [Google Scholar] [CrossRef]
  49. Hardyck, C.D.; Petrinovich, L.F. Introduction to Statistics for the Behavioral Sciences; W. B. Saunders Company: Philadelphia, PA, USA, 1976. [Google Scholar]
  50. WHO/Europe | Nutrition-Body Mass Index-BMI. Available online: https://www.euro.who.int/en/health-topics/disease-prevention/nutrition/a-healthy-lifestyle/body-mass-index-bmi (accessed on 15 August 2021).
  51. Son, S.M. Influence of Obesity on Postural Stability in Young Adults. Osong Public Health Res. Perspect. 2016, 7, 378–381. [Google Scholar] [CrossRef] [PubMed] [Green Version]
  52. Teasdale, N.; Hue, O.; Marcotte, J.; Berrigan, F.; Simoneau, M.; Doré, J.; Marceau, P.; Marceau, S.; Tremblay, A. Reducing Weight Increases Postural Stability in Obese and Morbid Obese Men. Int. J. Obes. 2007, 31, 153–160. [Google Scholar] [CrossRef] [PubMed] [Green Version]
  53. Ku, P.X.; Abu Osman, N.A.; Yusof, A.; Wan Abas, W.A.B. Biomechanical Evaluation of the Relationship between Postural Control and Body Mass Index. J. Biomech. 2012, 45, 1638–1642. [Google Scholar] [CrossRef] [Green Version]
  54. Corbeil, P.; Simoneau, M.; Rancourt, D.; Tremblay, A.; Teasdale, N. Increased Risk for Falling Associated with Obesity: Mathematical Modeling of Postural Control. IEEE Trans. Neural Syst. Rehabil. Eng. 2001, 9, 126–136. [Google Scholar] [CrossRef]
  55. Vedel, J.P.; Roll, J.P. Response to Pressure and Vibration of Slowly Adapting Cutaneous Mechanoreceptors in the Human Foot. Neurosci. Lett. 1982, 34, 289–294. [Google Scholar] [CrossRef]
  56. Hue, O.; Simoneau, M.; Marcotte, J.; Berrigan, F.; Doré, J.; Marceau, P.; Marceau, S.; Tremblay, A.; Teasdale, N. Body Weight Is a Strong Predictor of Postural Stability. Gait Posture 2007, 26, 32–38. [Google Scholar] [CrossRef] [PubMed]
  57. Reeves, N.P.; Everding, V.Q.; Cholewicki, J.; Morrisette, D.C. The Effects of Trunk Stiffness on Postural Control during Unstable Seated Balance. Exp. Brain Res. 2006, 174, 694–700. [Google Scholar] [CrossRef] [PubMed]
  58. Rothman, K.J. BMI-Related Errors in the Measurement of Obesity. Int. J. Obes. 2008, 32, S56–S59. [Google Scholar] [CrossRef] [PubMed] [Green Version]
  59. Dewangan, K.N.; Rakheja, S.; Marcotte, P.; Shahmir, A.; Patra, S.K. Comparisons of Apparent Mass Responses of Human Subjects Seated on Rigid and Elastic Seats under Vertical Vibration. Ergonomics 2013, 56, 1806–1822. [Google Scholar] [CrossRef] [PubMed]
Figure 1. Bilateral EMG sensor placement for the (a) internal oblique (IO) and external oblique (EO) as well as the (b) lumbar erector spinae (LE) and thoracic erector spinae (TE).
Vibration 04 00046 g001
Figure 2. Participant seated on the tractor seat in the hexapod robot setup.
Vibration 04 00046 g002
Figure 3. Fits vs. %MVET (transformed % maximum voluntary electrical activation data) (a) before and (b) after back muscle fatigue from the stepwise regression models of the external oblique (EO).
Vibration 04 00046 g003
Figure 4. Fits vs. %MVET (transformed % maximum voluntary electrical activation data) (a) before and (b) after back muscle fatigue from the stepwise regression models of the internal oblique (IO).
Vibration 04 00046 g004
Figure 5. Fits vs. %MVET (transformed % maximum voluntary electrical activation data) (a) before and (b) after back muscle fatigue from the stepwise regression models of the lumbar erector spinae (LE).
Vibration 04 00046 g005
Figure 6. Fits vs. %MVET (transformed % maximum voluntary electrical activation data) (a) before and (b) after back muscle fatigue from the stepwise regression models of the thoracic erector spinae (TE).
Vibration 04 00046 g006
Table 1. Spearman’s rank coefficient of correlation (ρ) for pairwise comparison of BMI (body mass index), mass, and height with %MVET (transformed % maximum voluntary electrical activation data) in the internal oblique, external oblique, lumbar erector spinae and thoracic erector spinae prior to back muscle fatigue. Spearman’s rho (ρ) values denoted with * are statistically significant.
Internal Oblique
Pair1.25 Hz2.0 Hz2.5 Hz4.0 Hz4.5 Hz
ΡΡρρρ
%MVET and mass0.26 (p < 0.0001) *0.24 (p < 0.0001) *0.21 (p = 0.001) *0.16 (p = 0.01) *0.14 (p = 0.02) *
%MVET and height−0.34 (p < 0.0001) *−0.35 (p < 0.0001) *−0.36 (p < 0.0001) *−0.37 (p < 0.0001) *−0.35 (p < 0.0001) *
%MVET and BMI0.38 (p < 0.0001) *0.38 (p < 0.0001) *0.34 (p < 0.0001) *0.31 (p < 0.0001) *0.28 (p < 0.0001) *
External Oblique
Pair1.25 Hz2.0 Hz2.5 Hz4.0 Hz4.5 Hz
ΡΡρρρ
%MVET and mass0.11 (p = 0.08)0.14 (p = 0.02) *0.14 (p = 0.03) *0.14 (p = 0.03) *0.10 (p = 0.10)
%MVET and height0.37 (p < 0.0001) *0.38 (p < 0.0001) *0.38 (p < 0.0001) *0.39 (p < 0.0001) *0.38 (p < 0.0001) *
Lumbar Erector Spinae
Pair1.25 Hz2.0 Hz2.5 Hz4.0 Hz4.5 Hz
ΡΡρρρ
%MVET and mass0.36 (p < 0.0001) *0.43 (p < 0.0001) *0.39 (p < 0.0001) *0.44 (p < 0.0001) *0.42 (p < 0.0001) *
%MVET and height0.42 (p < 0.0001) *0.44 (p < 0.0001) *0.36 (p < 0.0001) *0.33 (p < 0.0001) *0.34 (p < 0.0001) *
%MVET and BMI0.08 (p = 0.23)0.15 (p = 0.01) *0.14 (p = 0.02) *0.21 (p = 0.001) *0.17 (p = 0.01) *
Thoracic Erector Spinae
Pair1.25 Hz2.0 Hz2.5 Hz4.0 Hz4.5 Hz
ΡΡρρρ
%MVET and mass0.08 (p = 0.21)0.08 (p = 0.19)0.09 (p = 0.15)0.07 (p = 0.26)0.09 (p = 0.13)
%MVET and height−0.19 (p = 0.002) *−0.18 (p = 0.003) *−0.19 (p = 0.002) *−0.21 (p = 0.001) *−0.22 (p < 0.0001) *
%MVET and BMI0.10 (p = 0.10)0.10 (p = 0.12)0.12 (p = 0.06)0.13 (p = 0.04) *0.15 (p = 0.02) *
Table 2. Spearman’s rank coefficient of correlation for pairwise comparison of BMI (body mass index), mass, and height with %MVET (transformed % maximum voluntary electrical activation data) in the internal oblique, external oblique, lumbar erector spinae and thoracic erector spinae after back muscle fatigue. Spearman’s rho (ρ) values denoted with * are statistically significant.
Internal Oblique
Pair1.25 Hz2.0 Hz2.5 Hz4.0 Hz4.5 Hz
ΡρρΡρ
%MVET and mass0.21 (p < 0.0001) *0.26 (p < 0.0001) *0.27 (p < 0.0001) *0.14 (p = 0.03) *0.13 (p = 0.03) *
%MVET and height−0.29 (p < 0.0001) *−0.28 (p < 0.0001) *−0.29 (p < 0.0001) *−0.27 (p < 0.0001) *−0.29 (p < 0.0001) *
%MVET and BMI0.30 (p < 0.0001) *0.36 (p < 0.0001) *0.36 (p < 0.0001) *0.26 (p < 0.0001) *0.25 (p < 0.0001) *
External Oblique
Pair1.25 Hz2.0 Hz2.5 Hz4.0 Hz4.5 Hz
ΡρρΡρ
%MVET and mass−0.20 (p = 0.001) *−0.23 (p < 0.0001) *−0.17 (p = 0.004) *−0.17 (p = 0.01) *−0.15 (p = 0.02) *
%MVET and height−0.41 (p < 0.0001) *−0.46 (p < 0.0001) *−0.41 (p < 0.0001) *−0.41 (p < 0.0001) *−0.40 (p < 0.0001) *
Lumbar Erector Spinae
Pair1.25 Hz2.0 Hz2.5 Hz4.0 Hz4.5 Hz
ΡρρΡρ
%MVET and mass0.39 (p < 0.0001) *0.36 (p < 0.0001) *0.37 (p < 0.0001) *0.35 (p < 0.0001) *0.35 (p < 0.0001) *
%MVET and height0.41 (p < 0.0001) *0.39 (p < 0.0001) *0.39 (p < 0.0001) *0.31 (p < 0.0001) *0.29 (p < 0.0001) *
%MVET and BMI0.10 (p = 0.12)0.08 (p = 0.22)0.10 (p = 0.12)0.15 (p = 0.02) *0.12 (p = 0.05) *
Thoracic Erector Spinae
Pair1.25 Hz2.0 Hz2.5 Hz4.0 Hz4.5 Hz
ΡρρΡρ
%MVET and mass0.17 (p = 0.01) *0.12 (p = 0.05) *0.08 (p = 0.18)0.15 (p = 0.02) *0.08 (p = 0.19)
%MVET and height−0.17 (p = 0.004) *−0.16 (p = 0.01) *−0.19 (p = 0.002) *−0.16 (p = 0.01) *−0.19 (p = 0.002) *
%MVET and BMI0.20 (p = 0.001) *0.15 (p = 0.02) *0.12 (p = 0.05) *0.19 (p = 0.002) *0.12 (p = 0.04) *
Table 3. Stepwise regression models for %MVET (transformed % maximum voluntary electrical activation data) of the external oblique pre- and post-back muscle fatigue, where mass, height, and body mass index (BMI) are continuous predictors, and vibration frequency is a categorical predictor.
FrequencyPre-Fatigue Regression EquationsPost-Fatigue Regression Equations
1.25 Hz%MVET = 1.35 − 0.01 mass + 0.20 height + 0.20 BMI%MVET = 6.14 − 3.51 height
2.00 Hz%MVET = 1.35 − 0.01 mass + 0.20 height + 0.20 BMI%MVET = 6.15 − 3.51 height
2.50 Hz%MVET = 1.35 − 0.01 mass + 0.20 height + 0.20 BMI%MVET = 6.14 − 3.51 height
4.00 Hz%MVET = 1.34 − 0.01 mass + 0.20 height + 0.20 BMI%MVET = 6.43 − 3.51 height
4.50 Hz%MVET = 1.33 − 0.01 mass + 0.20 height + 0.20 BMI%MVET = 6.43 − 3.51 height
Table 4. Stepwise regression models for %MVET (transformed % maximum voluntary electrical activation data) of the internal oblique pre-and post-back muscle fatigue, where mass, height, and body mass index (BMI) are continuous predictors, and vibration frequency is a categorical predictor.
Frequency Pre-Fatigue Regression EquationsPost-Fatigue Regression Equations
1.25 Hz%MVET = −0.46 − 0.01 mass + 0.80 height + 0.45 BMI%MVET = −0.84 − 0.02 mass + 1. 01 height + 0.05 BMI
2.00 Hz%MVET = −0.46 − 0.01 mass + 0.80 height + 0.45 BMI%MVET = −0.84 − 0.02 mass + 1. 01 height + 0.05 BMI
2.50 Hz%MVET = −0.46 − 0.01 mass + 0.80 height + 0.45 BMI%MVET = −0.83 − 0.02 mass + 1. 01 height + 0.05 BMI
4.00 Hz%MVET = −0.42 − 0.01 mass + 0.80 height + 0.45 BMI%MVET = −0.79 − 0.02 mass + 1. 01 height + 0.05 BMI
4.50 Hz%MVET = −0.42 − 0.01 mass + 0.80 height + 0.45 BMI%MVET = −0.79 − 0.02 mass + 1. 01 height + 0.05 BMI
Table 5. Stepwise regression models for %MVET (transformed % maximum voluntary electrical activation data) of the lumbar erector spinae pre- and post-back muscle fatigue, where mass, height, and body mass index (BMI) are continuous predictors, and vibration frequency is a categorical predictor.
Frequency Pre-Fatigue Regression EquationsPost-Fatigue Regression Equations
1.25 Hz%MVET = −2.94 − 0.02 mass + 2.26 height + 0.08 BMI%MVET = −1.08 − 0.01 mass + 1.20 height + 0.04 BMI
2.00 Hz%MVET = −2.94 − 0.02 mass + 2.26 height + 0.08 BMI%MVET = −1.08 − 0.01 mass + 1.20 height + 0.04 BMI
2.50 Hz%MVET = −2.94 − 0.02 mass + 2.26 height + 0.08 BMI%MVET = −1.07 − 0.01 mass + 1.20 height + 0.04 BMI
4.00 Hz%MVET = −2.91 − 0.02 mass + 2.26 height + 0.08 BMI%MVET = −1.06 − 0.01 mass + 1.20 height + 0.04 BMI
4.50 Hz%MVET = −2.91 − 0.02 mass + 2.26 height + 0.08 BMI%MVET = −1.06 − 0.01 mass + 1.20 height + 0.04 BMI
Table 6. Stepwise regression models for %MVET (transformed % maximum voluntary electrical activation data) of the thoracic erector spinae pre- and post-back muscle fatigue, where mass, height, and body mass index (BMI) are continuous predictors, and vibration frequency is a categorical predictor.
FrequencyPre-Fatigue Regression EquationsPost-Fatigue Regression Equations
1.25 Hz%MVET = −21.65 − 0.18 mass + 12.97 height + 0.53 BMI%MVET = −22.64 − 0.18 mass + 13.49 height + 0.56 BMI
2.00 Hz%MVET = −21.65 − 0.18 mass + 12.97 height + 0.53 BMI%MVET = −22.65 − 0.18 mass + 13.49 height + 0.56 BMI
2.50 Hz%MVET = −21.59 − 0.18 mass + 12.97 height + 0.53 BMI%MVET = −22.62 − 0.18 mass + 13.49 height + 0.56 BMI
4.00 Hz%MVET = −21.36 − 0.18 mass + 12.97 height + 0.53 BMI%MVET = −22.29 − 0.18 mass + 13.49 height + 0.56 BMI
4.50 Hz%MVET = −21.36 − 0.18 mass + 12.97 height + 0.53 BMI%MVET = −22.28 − 0.18 mass + 13.49 height + 0.56 BMI
Publisher’s Note: MDPI stays neutral with regard to jurisdictional claims in published maps and institutional affiliations.

