


A Study on the Maximum Temperature of a Ceiling Jet of Asymmetric Dual Strong Plumes in a Naturally Ventilated Tunnel
Abstract
:1. Introduction
2. Numerical Simulation
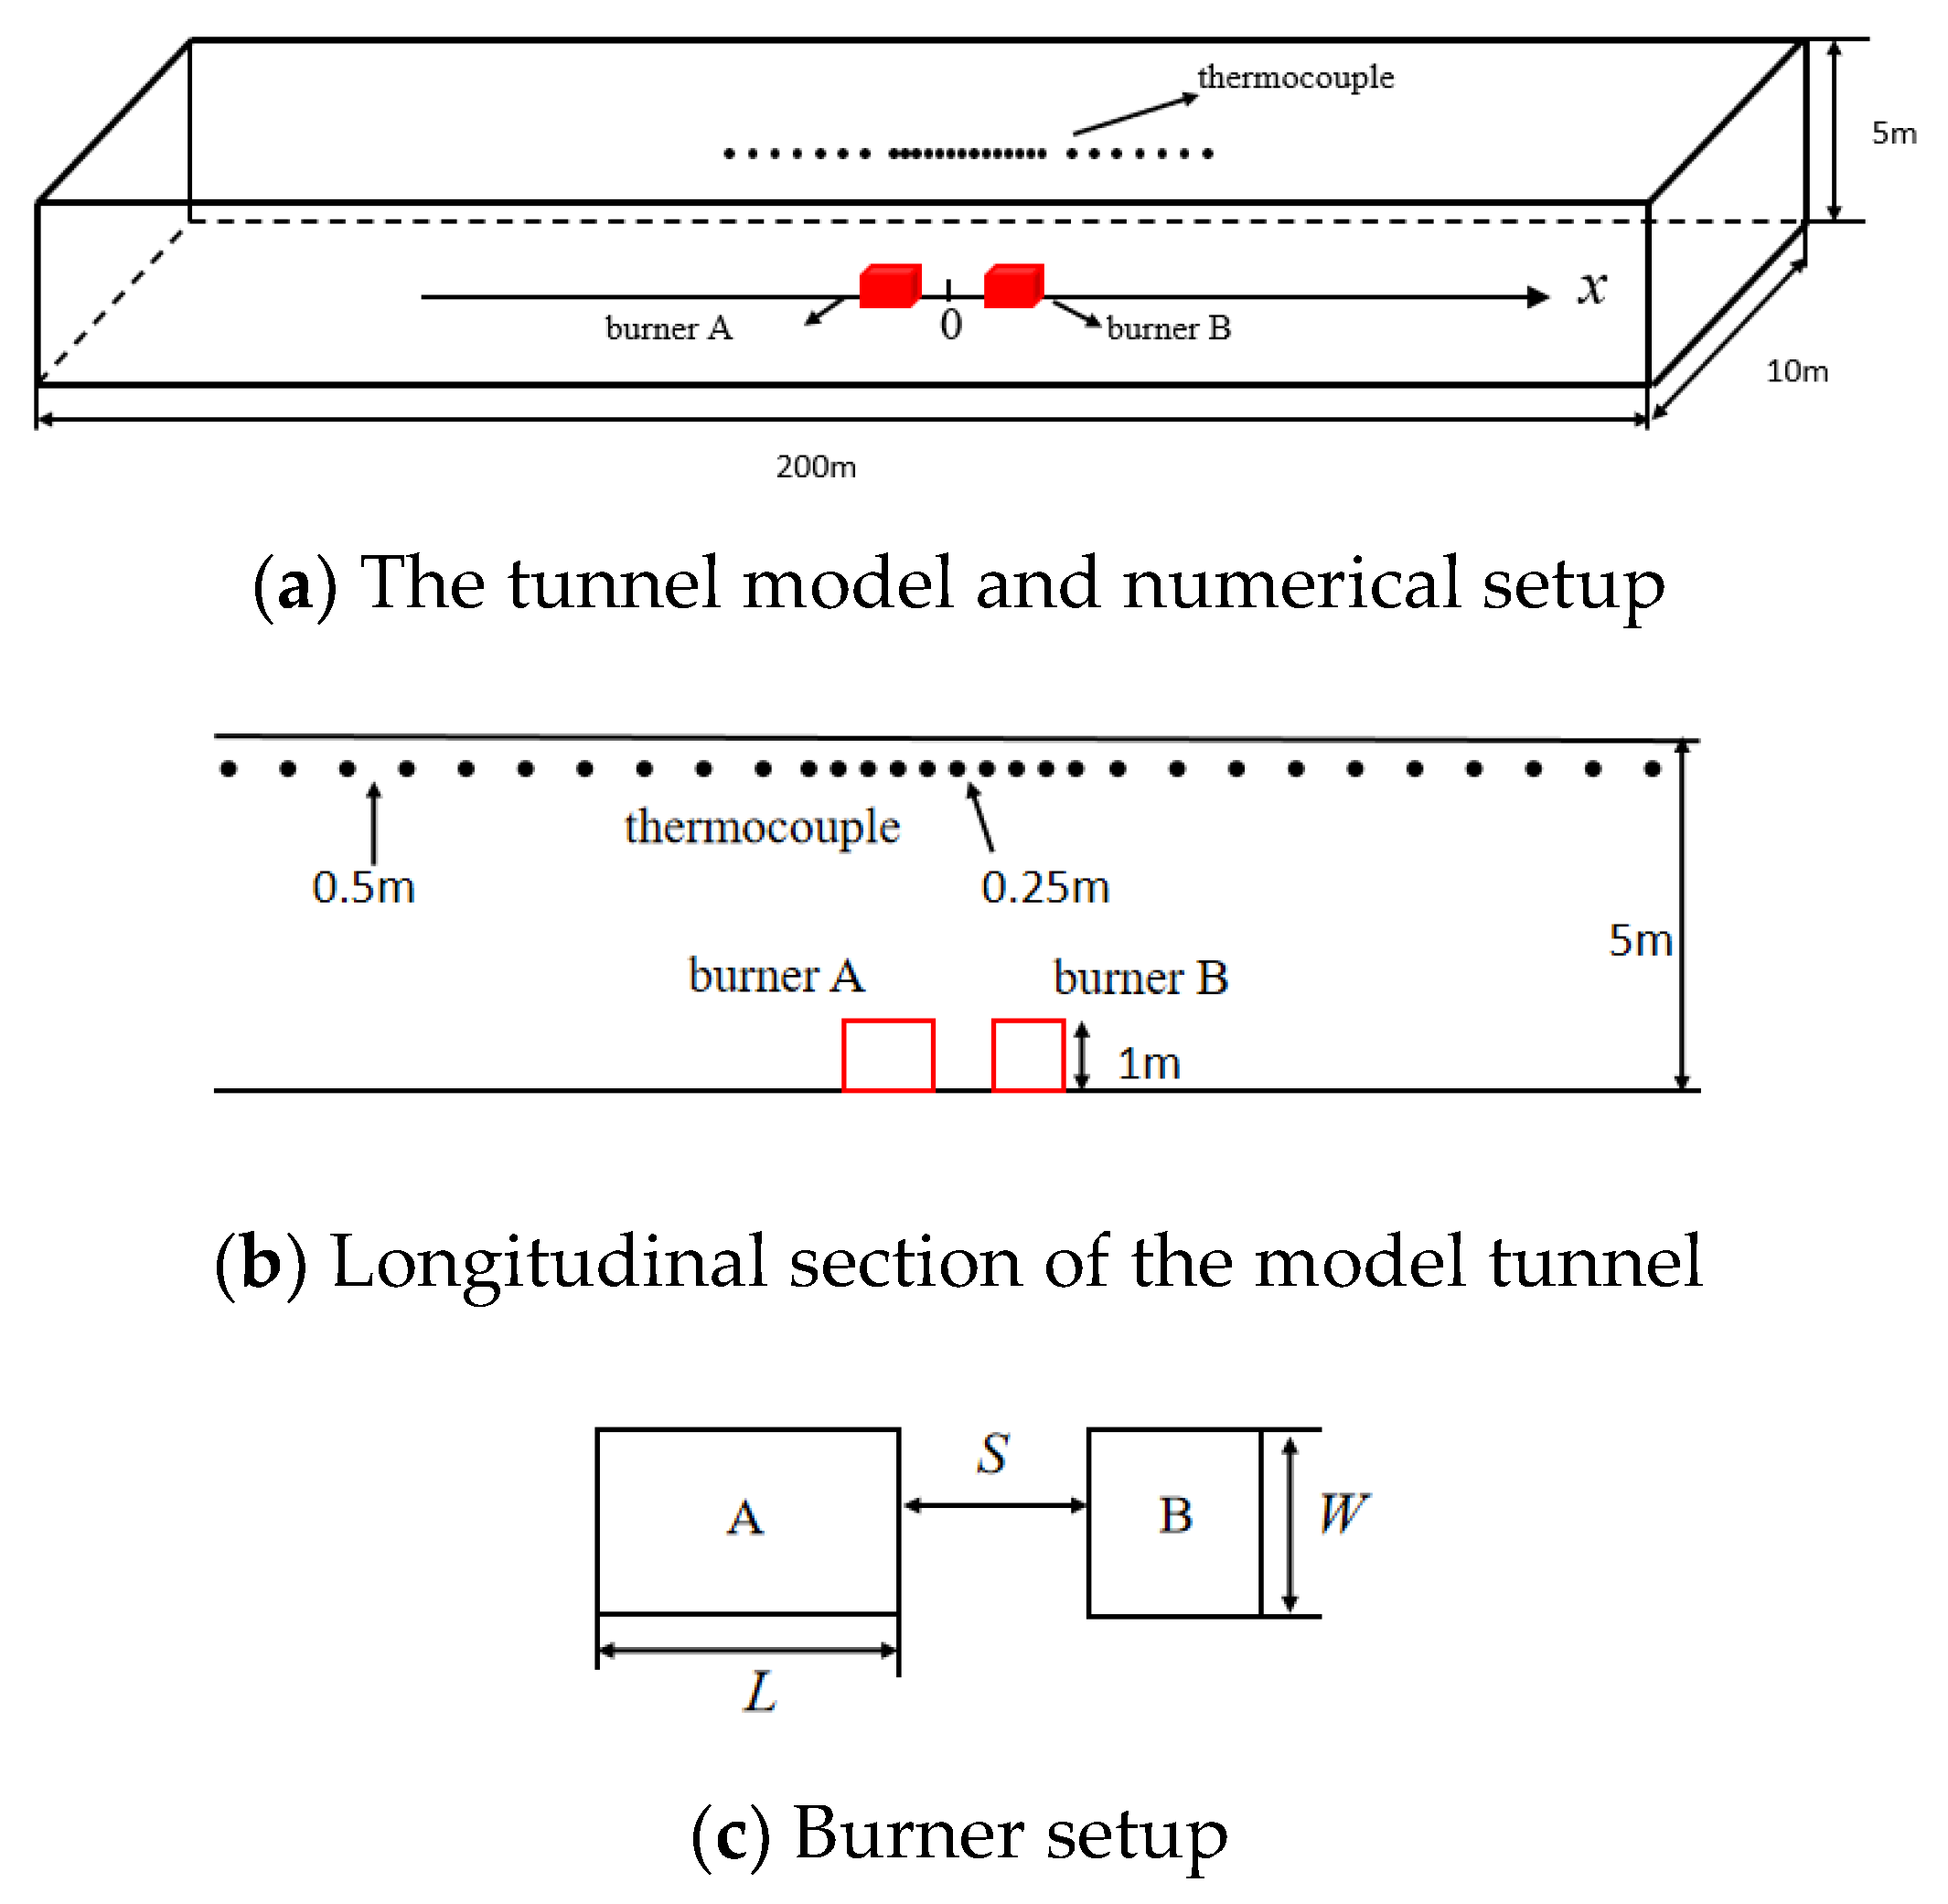
2.1. Numerical Modelling of Tunnels
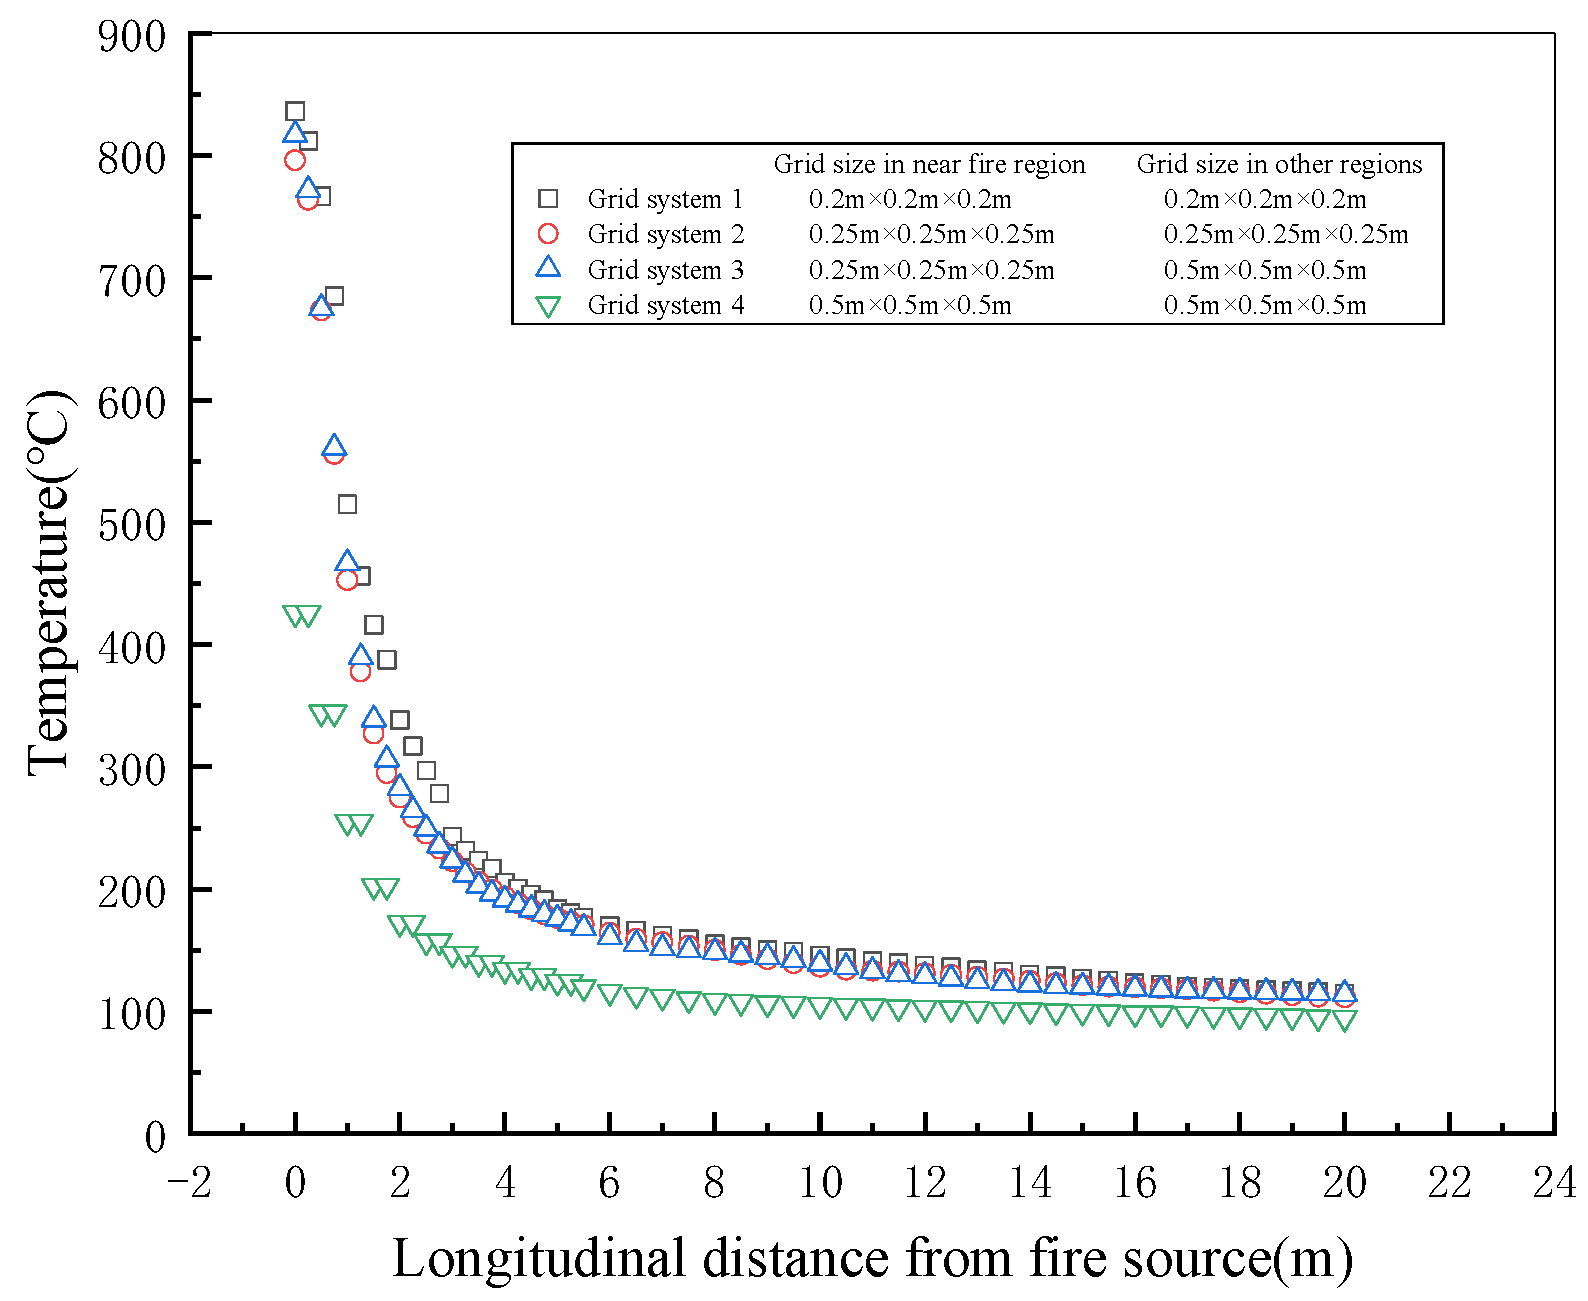
2.2. Grid System
3. Results and Discussion
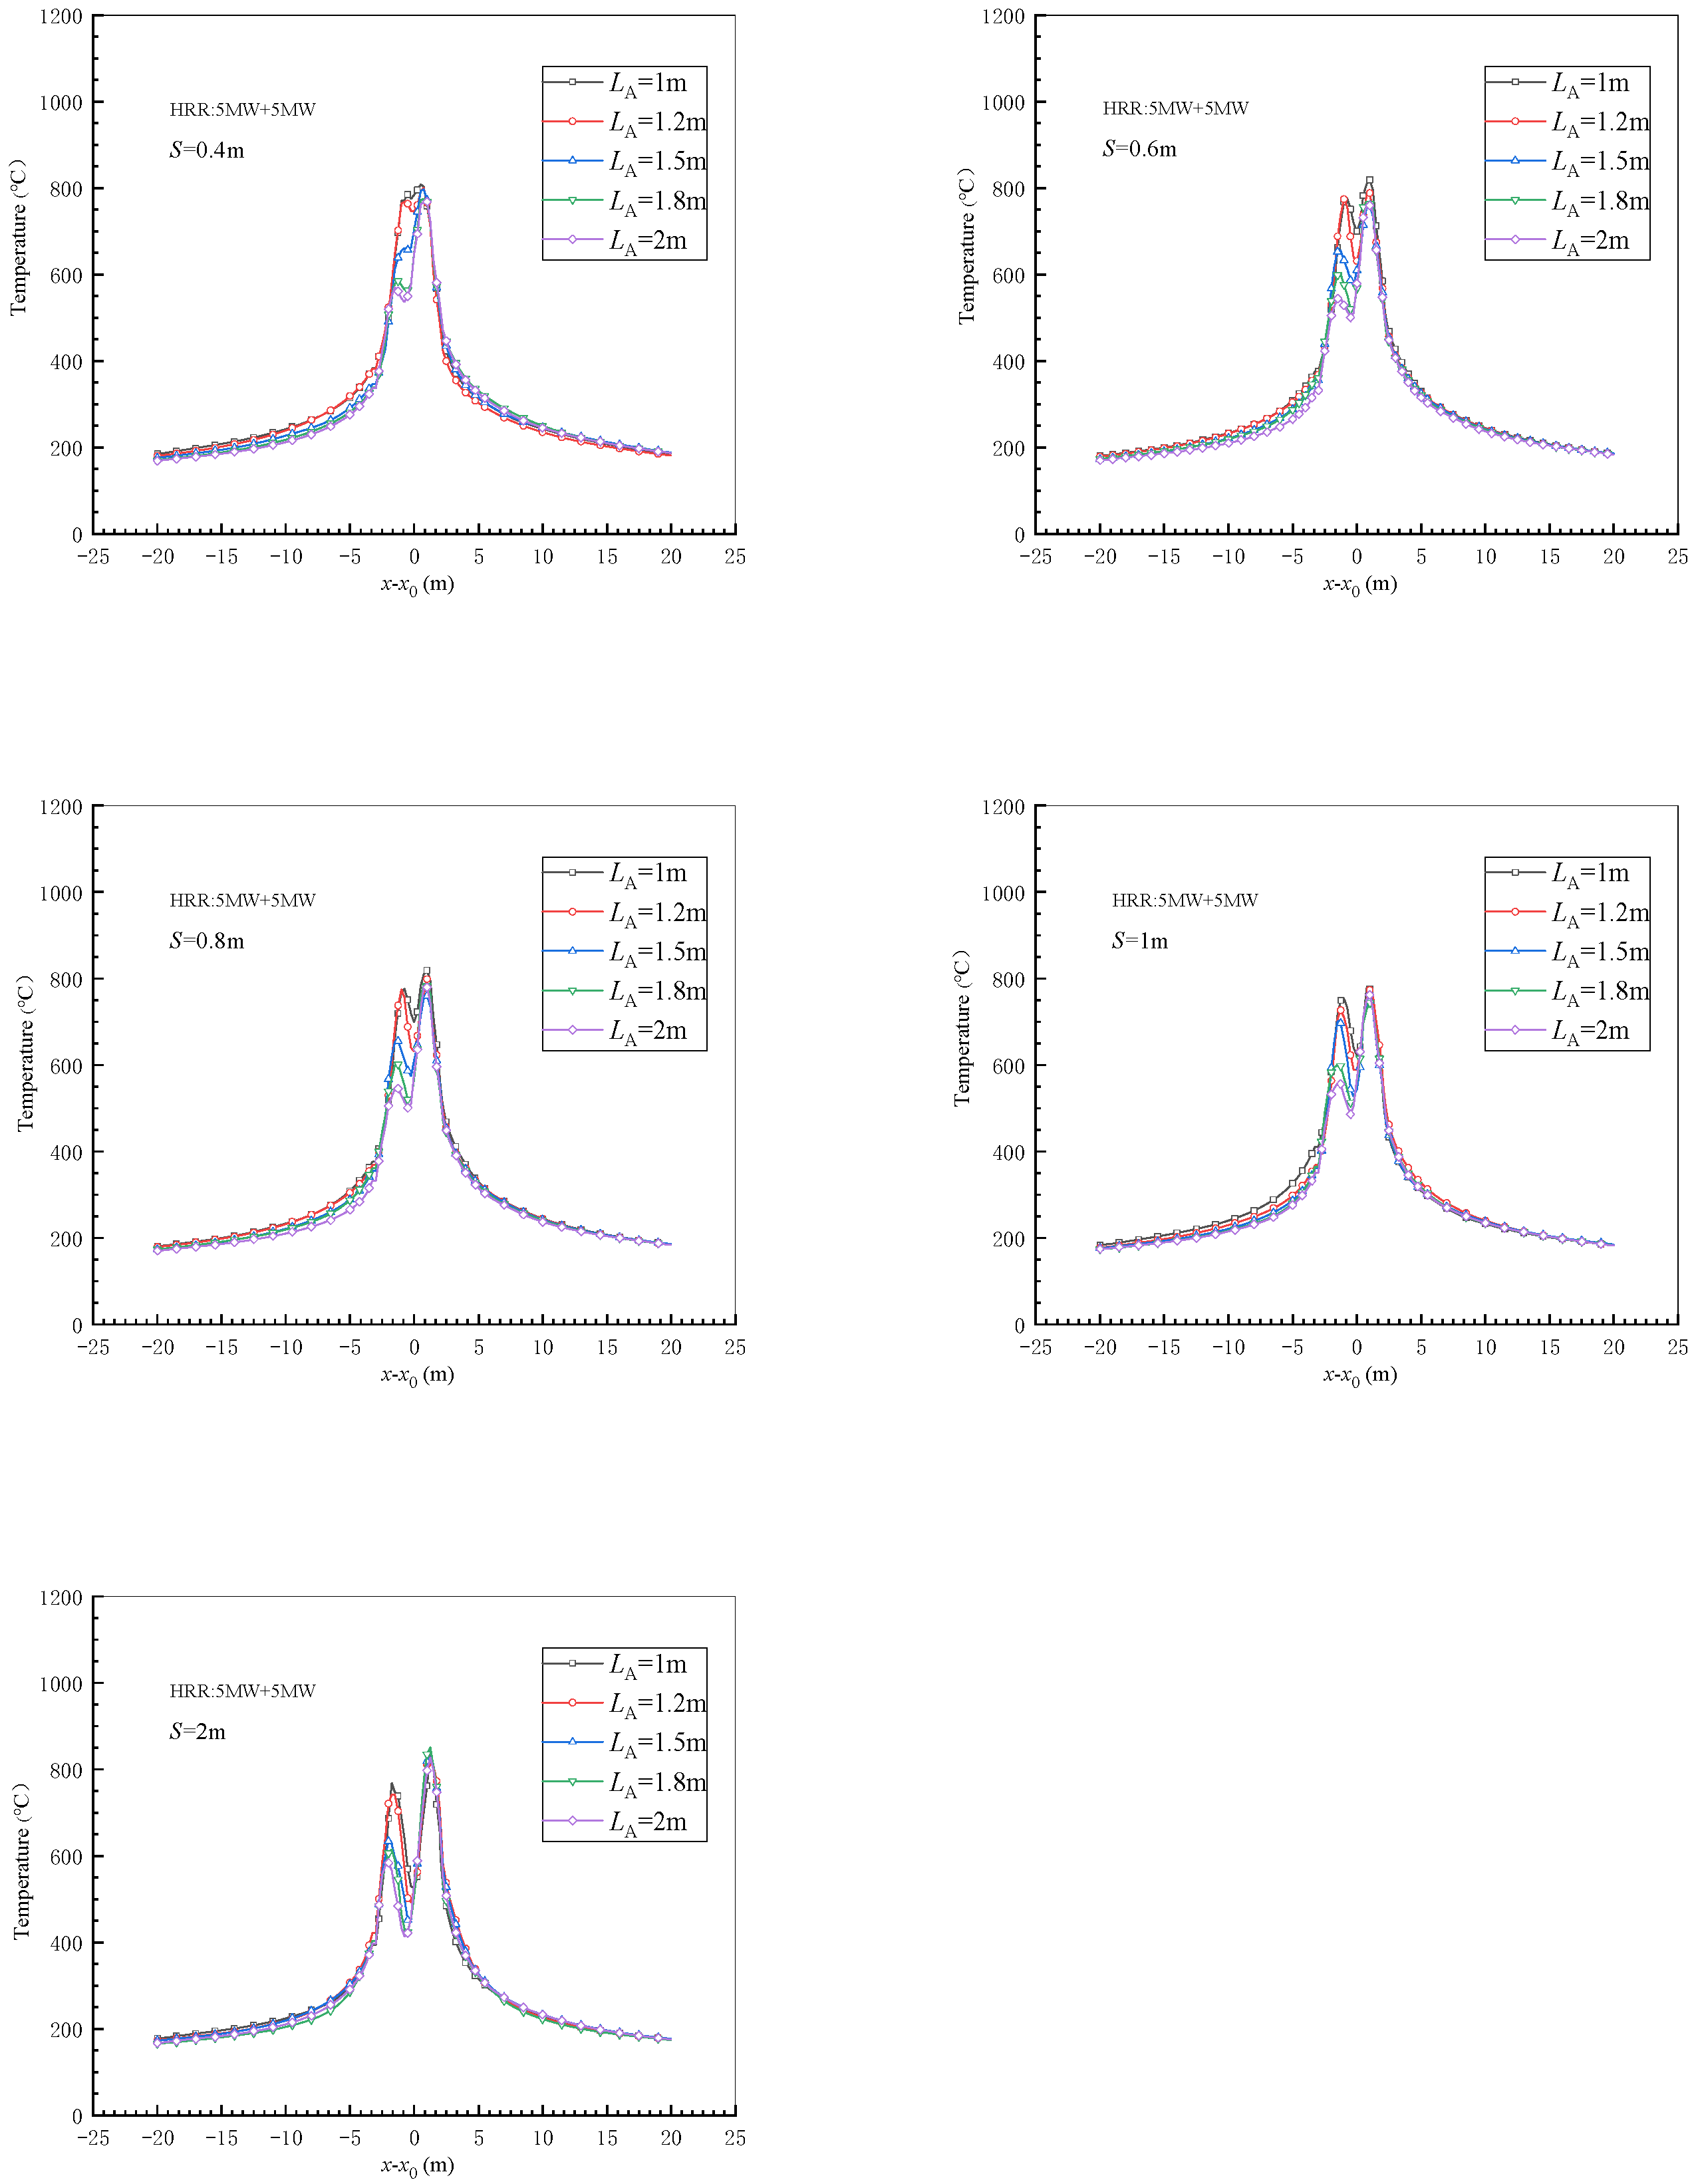
3.1. Longitudinal Temperature Distribution (TD)
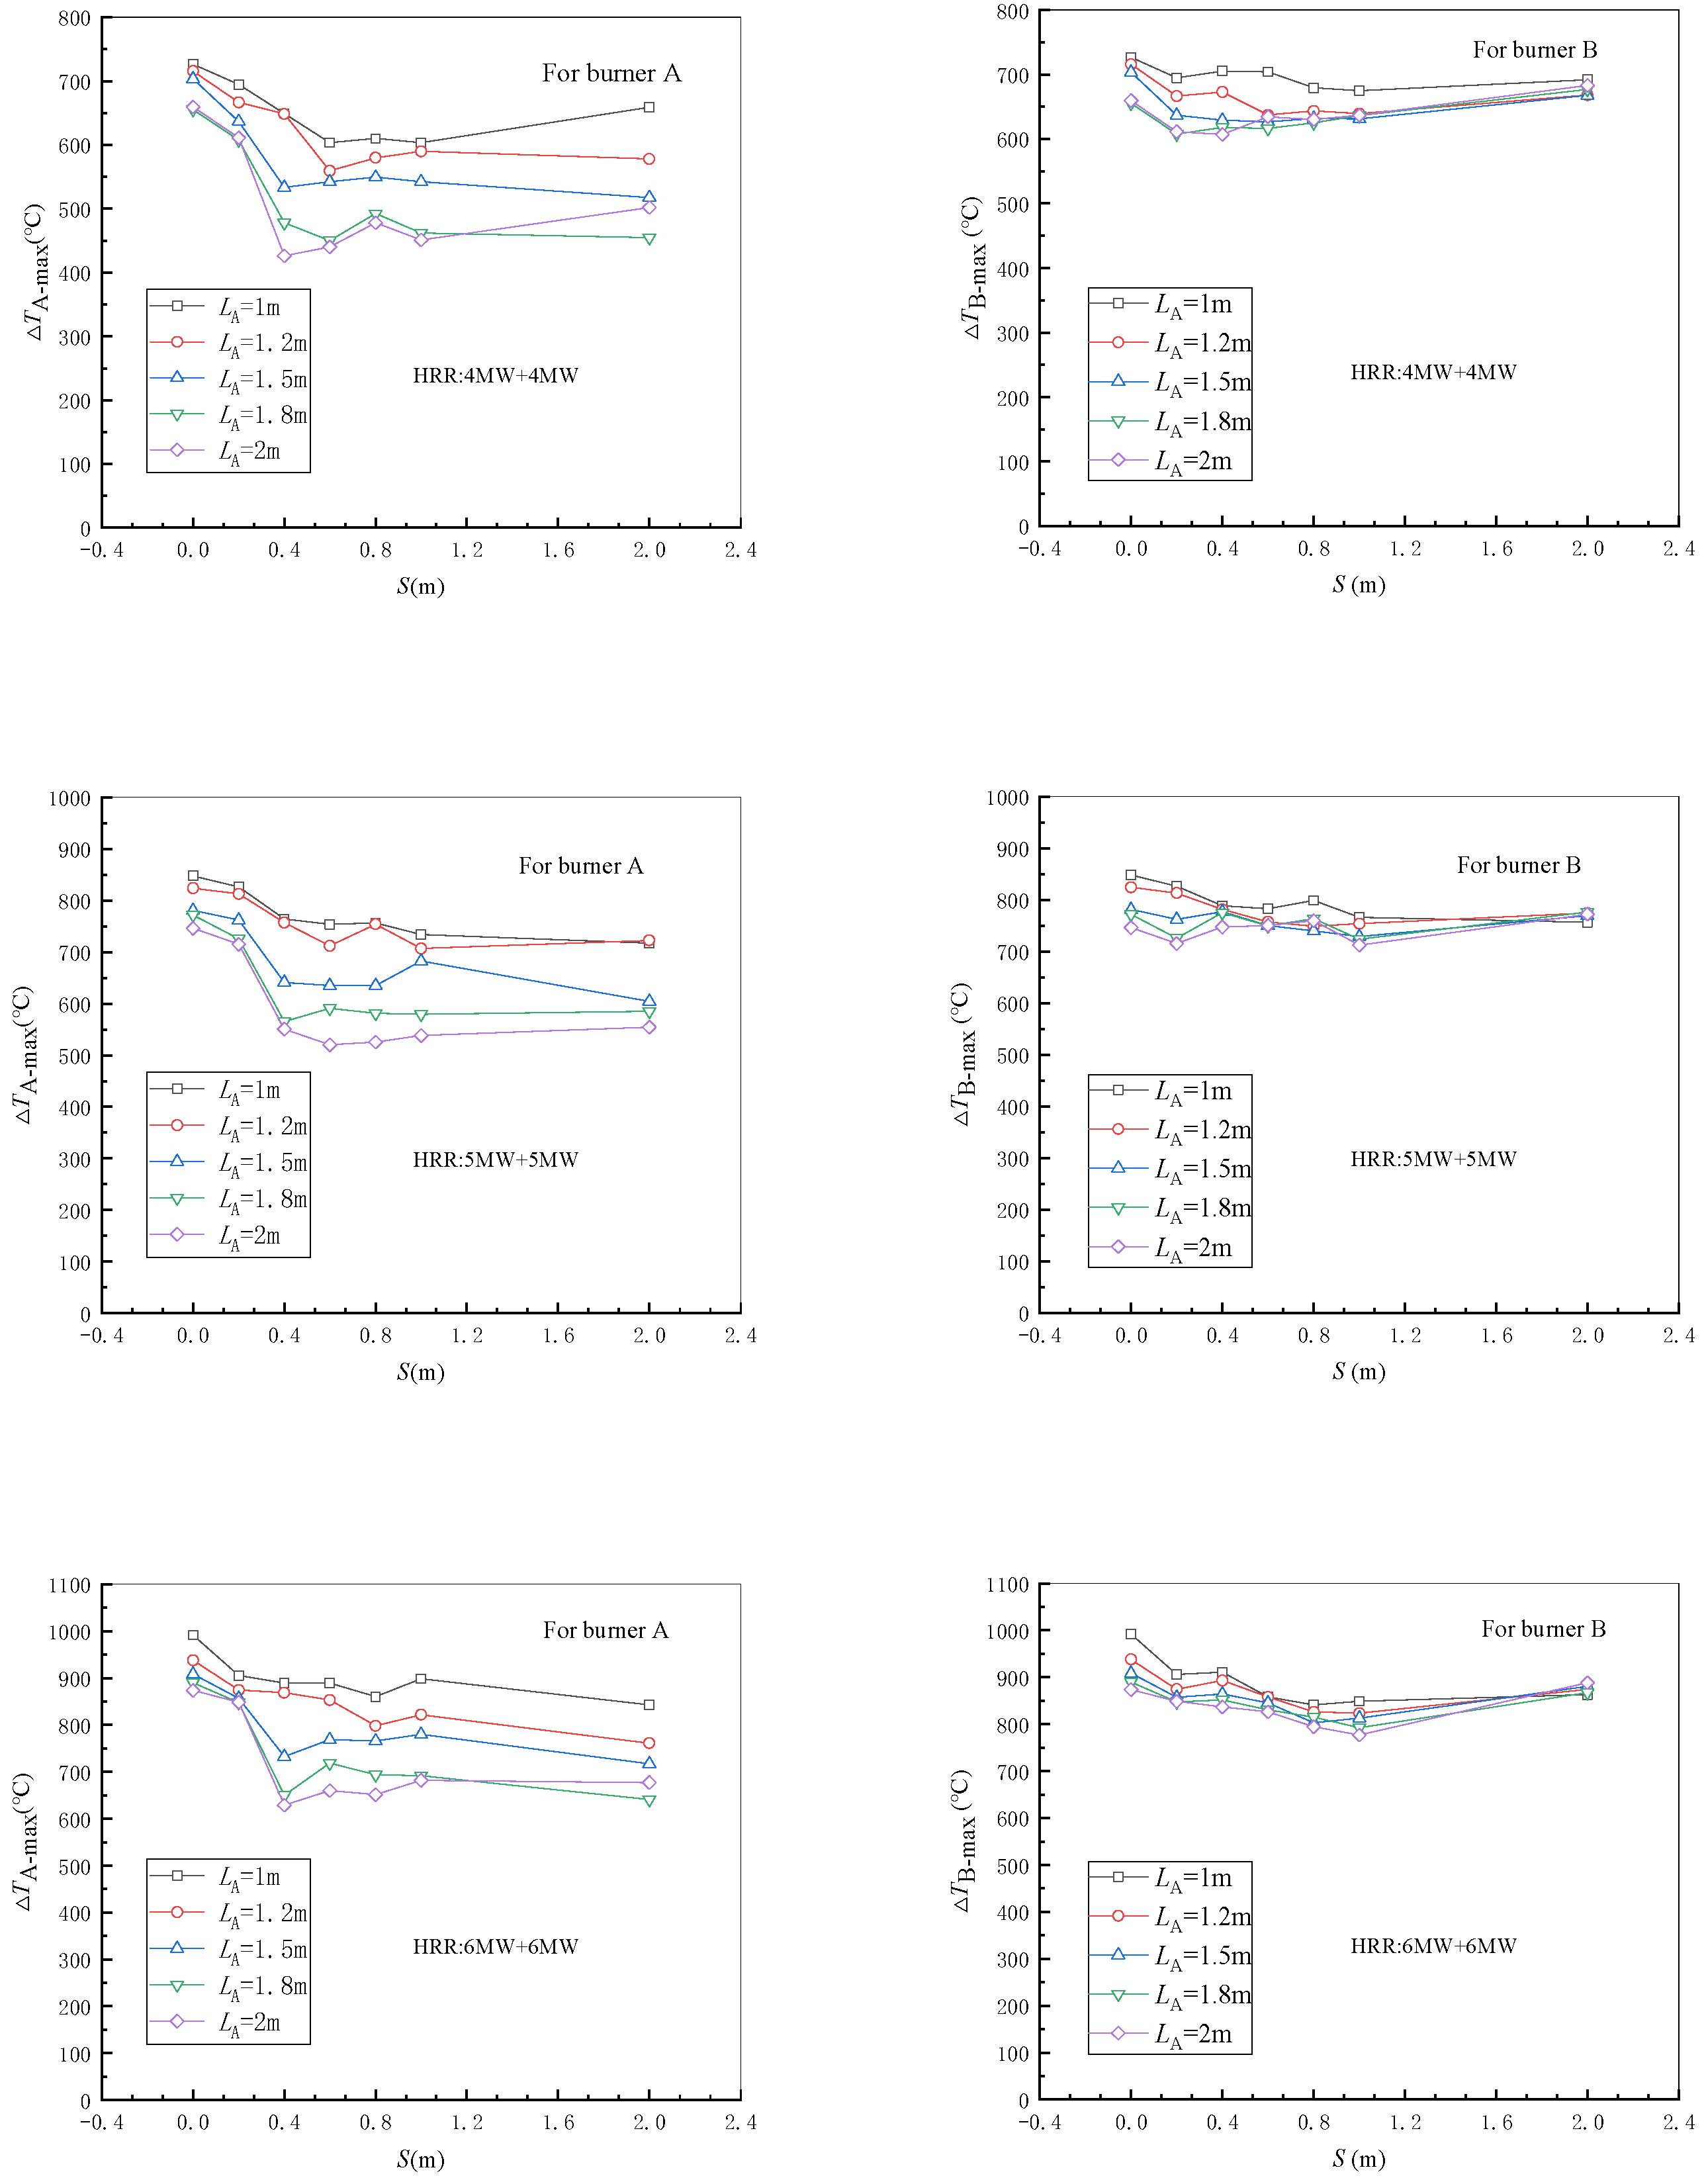
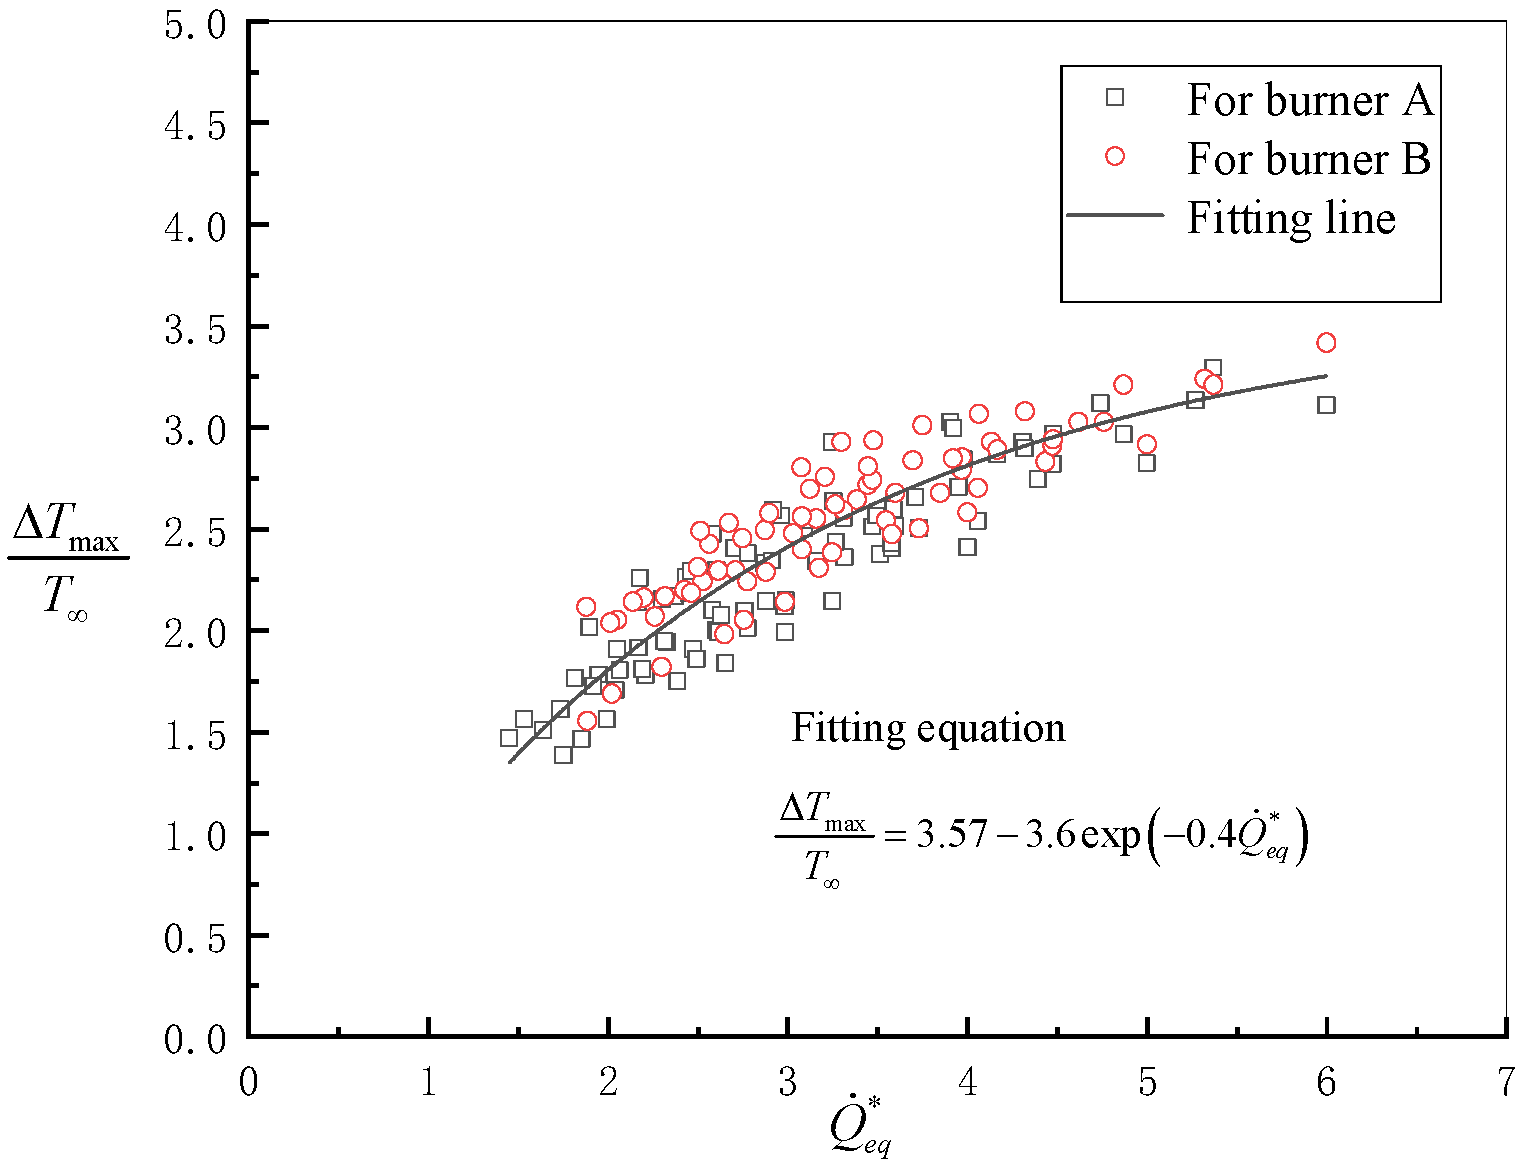
3.2. Maximum Temperature Modelling
4. Conclusions
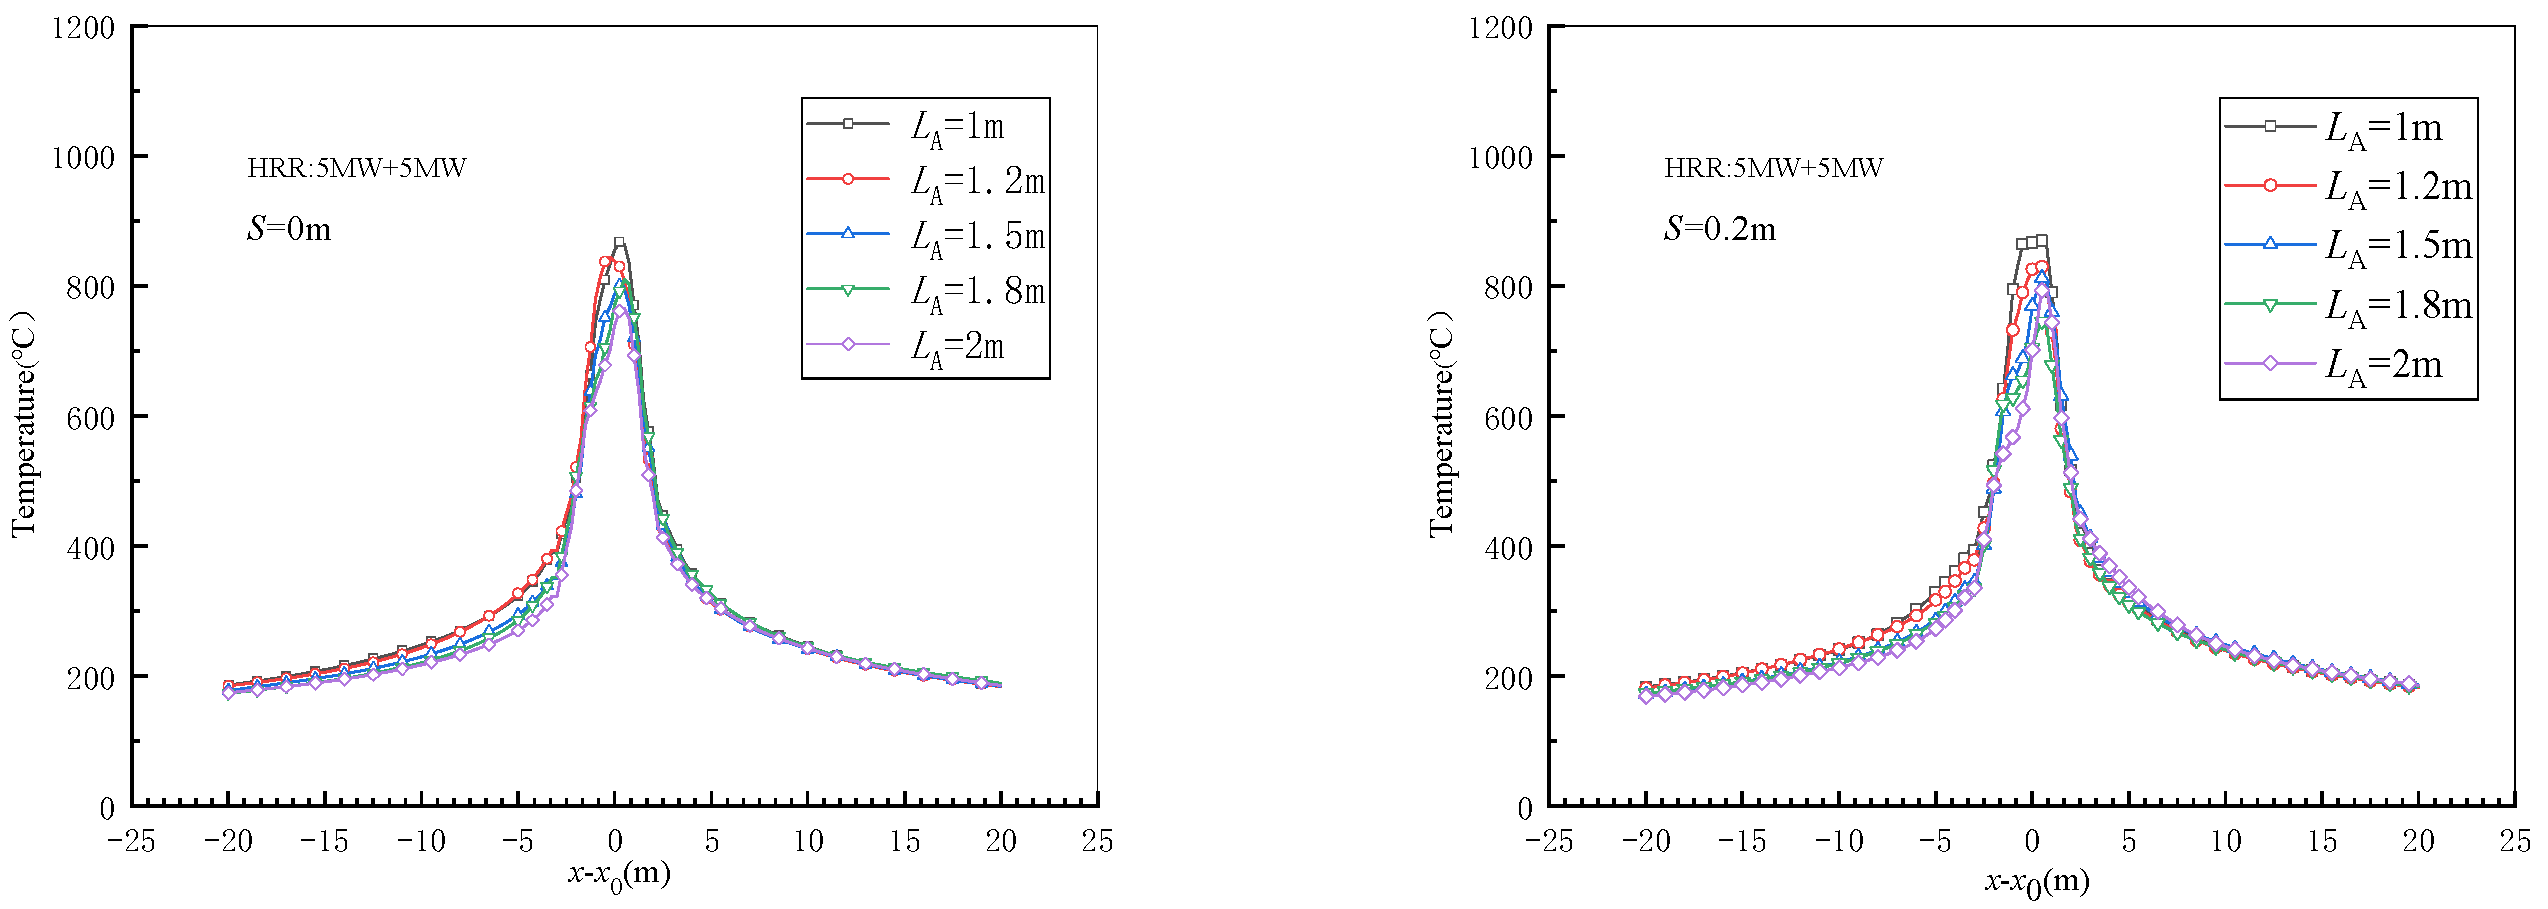
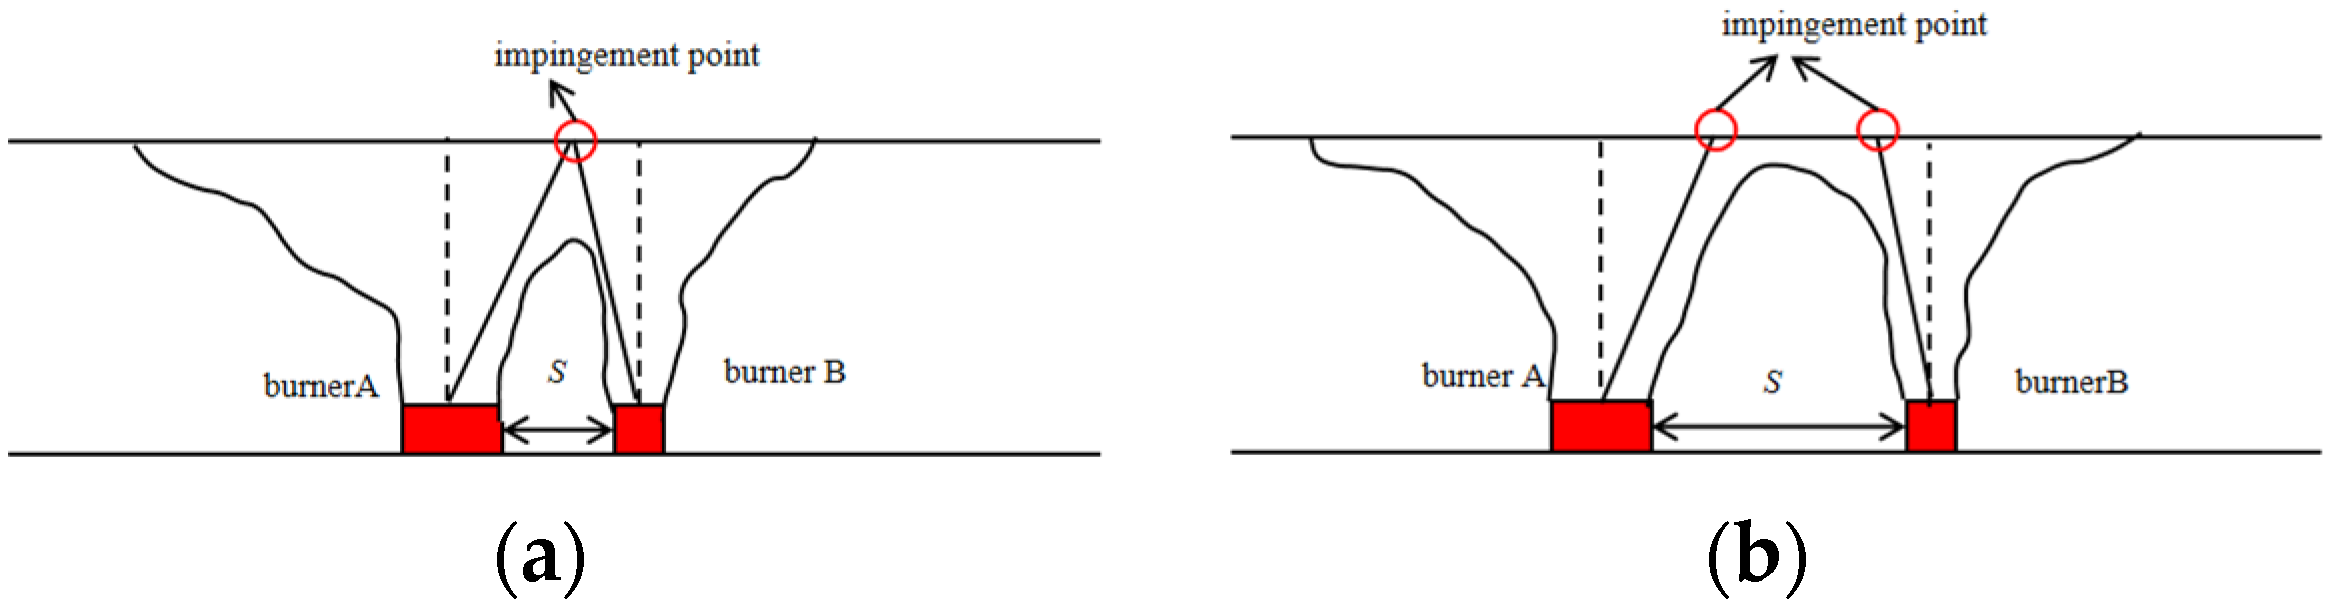
- With the same power of fire source, when the size of one of the fire sources increases, the corresponding maximum temperature beneath ceiling decreases. With the increase in fire spacing, the temperature peak below the ceiling shifts from one to two, and the peak temperature of the larger fire source is lower compared to that of the smaller one.
- When the fire sources distance increases, the maximum temperature initially decreases and then increases. Beyond a certain distance, the maximum temperature no longer changes with increasing distance.
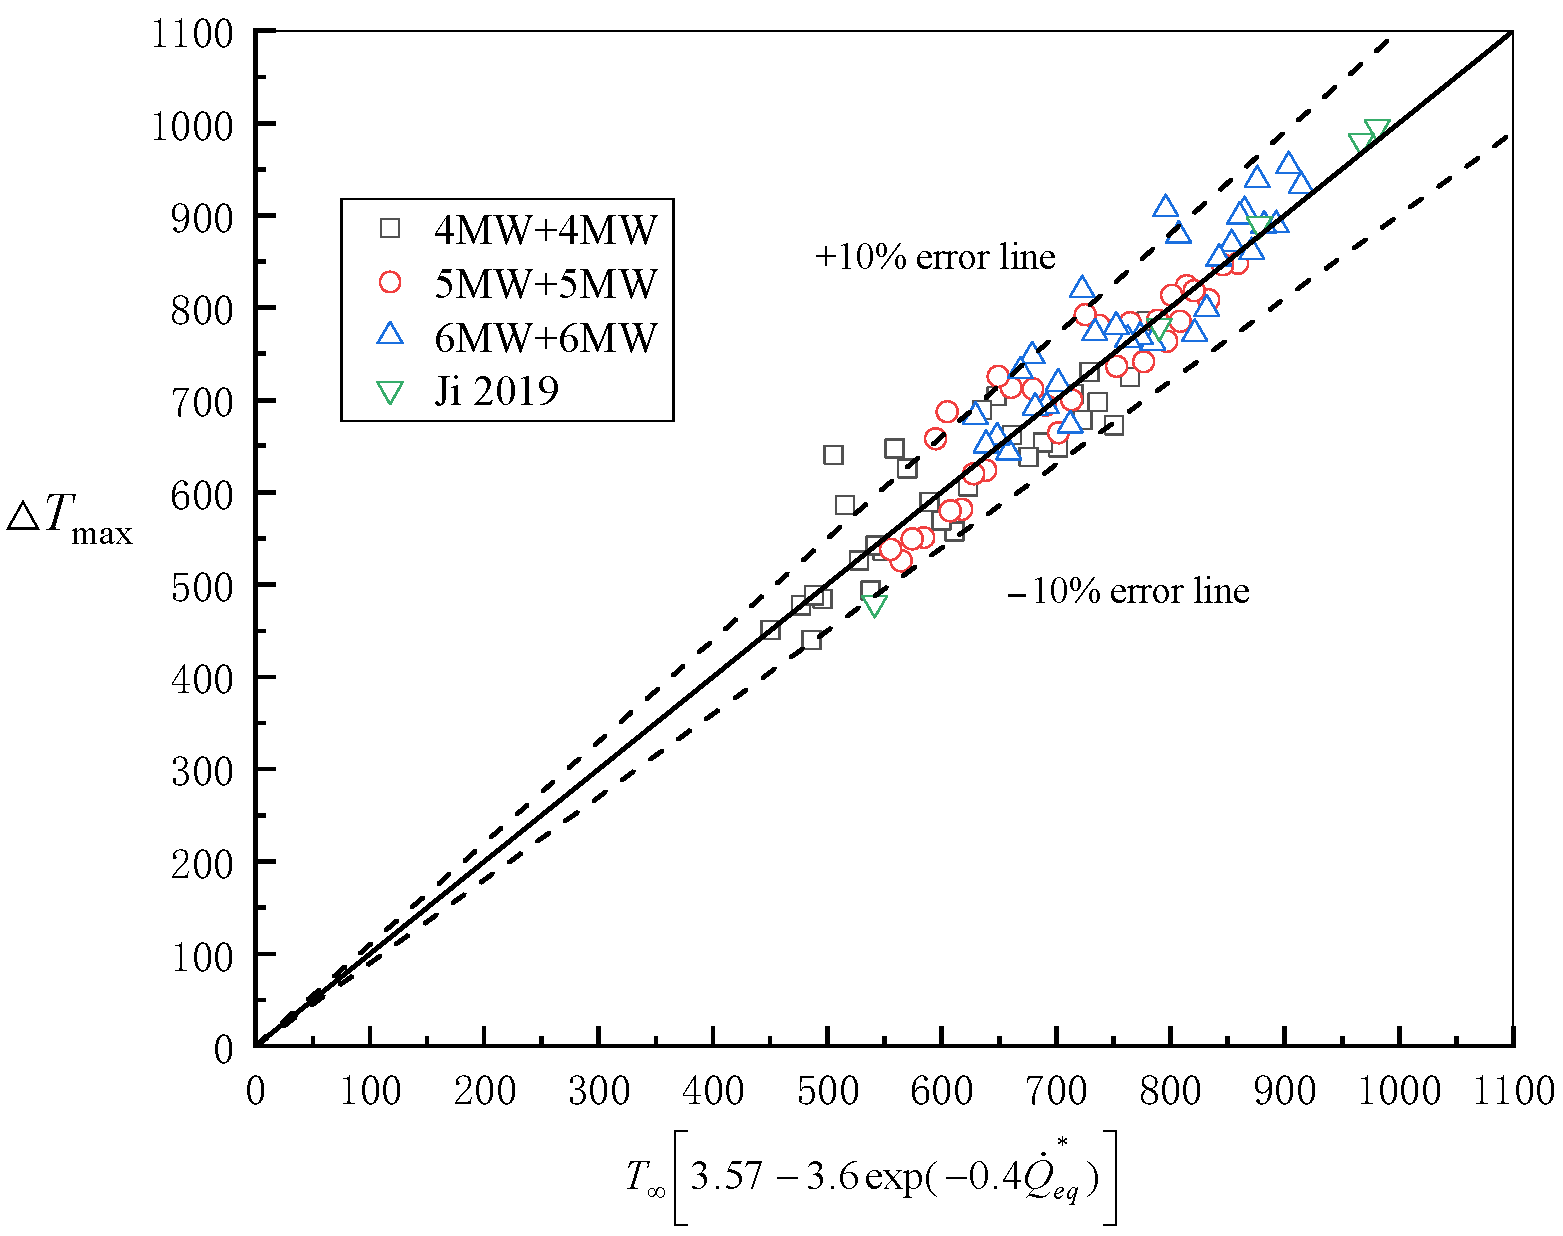
- Considering the impact of fire sizes and spacings on the MT, we developed a new predictive model for calculating MT in the case of asymmetric fire sources under a tunnel ceiling. The model performs well in predicting simulation results, showing its novelty and validity for predicting the maximum temperature under case of asymmetric dual fire sources.
Author Contributions
Funding
Institutional Review Board Statement
Informed Consent Statement
Data Availability Statement
Conflicts of Interest
References
- Fridolf, K.; Nilsson, D.; Frantzich, G. Fire evacuation in underground transportation systems: A review of accidents and empirical research. Fire Technol. 2013, 49, 451–475. [Google Scholar] [CrossRef]
- Gehandler, J. Road tunnel fire safety and risk: A review. Fire Sci. Rev. 2015, 4, 2. [Google Scholar] [CrossRef]
- Carvel, R. A review of tunnel fire research from Edinburgh. Fire Saf. J. 2019, 105, 300–306. [Google Scholar] [CrossRef]
- Arends, B.J.; Jonkman, S.N.; Vrijling, J.K.; van Gelder, P.H.A.J.M. Evaluation of tunnel safety: Towards an economic safety optimum. Reliab. Eng. Syst. Saf. 2005, 90, 217–228. [Google Scholar] [CrossRef]
- Amundsen, F.H.; Ranes, G. Studies on traffic accidents in Norwegian road tunnels. Tunn. Undergr. Space Technol. 2000, 15, 3–11. [Google Scholar] [CrossRef]
- Haule, H.J.; Sando, T.; Lentz, R.; Chuan, C.H.; Alluri, P. Evaluating the impact and clearance duration of freeway incidents. Int. J. Transp. Sci. Technol. 2009, 8, 13–24. [Google Scholar] [CrossRef]
- Miclea, P.C.; Chow, W.K.; Shen-Wen, C.; Junmei, L.; Kashef, A.; Kang, K. International tunnel fire-safety design practices. ASHRAE J. 2007, 49, 50–60. [Google Scholar]
- Oka, Y.; Atkinson, G.T. Control of smoke flow in tunnel fires. Fire Saf. J. 1995, 25, 305–322. [Google Scholar] [CrossRef]
- Kodur, V.; Naser, M.Z. Fire hazard in transportation infrastructure: Review, assessment, and mitigation strategies. Front. Struct. Civ. Eng. 2021, 15, 46–60. [Google Scholar] [CrossRef]
- Bernardi, P.; Michelini, E.; Sirico, A.; Rainieri, S.; Corradi, C. Simulation methodology for the assessment of the structural safety of concrete tunnel linings based on CFD fire—FE thermo-mechanical analysis: A case study. Eng. Struct. 2020, 225, 111193. [Google Scholar] [CrossRef]
- Maraveas, C.; Vrakas, A.A. Design of Concrete Tunnel Linings for Fire Safety. Struct. Eng. Int. 2014, 24, 319–329. [Google Scholar] [CrossRef]
- Alpert, T.R. Calculation of response time of ceiling-mounted fire detectors. Fire Technol. 1972, 8, 181–195. [Google Scholar] [CrossRef]
- Heskestad, G.; Hamada, T. Ceiling jets of strong fire plumes. Fire Saf. J. 1993, 21, 69–82. [Google Scholar] [CrossRef]
- Ingason, H.; Li, Y.Z. Model scale tunnel fire tests with longitudinal ventilation. Fire Saf. J. 2010, 45, 371–384. [Google Scholar] [CrossRef]
- Kurioka, H.; Oka, Y.; Satoh, H.; Sugawa, O. Fire properties in near field of square fire source with longitudinal ventilation in tunnels. Fire Saf. J. 2003, 38, 319–340. [Google Scholar] [CrossRef]
- Zhang, X.; Lin, Y.; Shi, C.; Zhang, J. Numerical simulation on the maximum temperature and smoke back-layering length in a tilted tunnel under natural ventilation. Tunn. Undergr. Space Technol. 2021, 107, 103661. [Google Scholar] [CrossRef]
- Caliendo, C.; Genovese, G.; Russo, I. A 3D CFD modeling for assessing the effects of both longitudinal slope and traffic volume on user safety within a naturally ventilated road tunnel in the event of a fire accident. IATSS Res. 2022, 46, 547–558. [Google Scholar] [CrossRef]
- Ji, J.; Tan, T.T.; Gao, Z.H.; Wan, H.X.; Zhu, Z.P.; Ding, L. Numerical investigation on the influence of length-width ratio of fire source on the smoke movement and temperature distribution in tunnel fires. Fire Technol. 2019, 55, 963–979. [Google Scholar] [CrossRef]
- Gao, Z.; Li, L.; Sun, C.; Zhong, W.; Yan, C. Effect of longitudinal slope on the smoke propagation and ceiling temperature characterization in sloping tunnel fires under natural ventilation. Tunn. Undergr. Space Technol. 2022, 123, 104396. [Google Scholar] [CrossRef]
- Zhou, Y.; Chen, F.; Geng, Z.Y.; Bu, R.W.; Gong, W.X.; Fan, C.G.; Yi, L. Experimental study on the characteristics of temperature distribution of two pool fires with different transverse locations in a naturally ventilated tunnel. Tunn. Undergr. Space Technol. 2021, 116, 104095. [Google Scholar] [CrossRef]
- Zhang, Y.C.; Xing, S.S.; Chen, R.J.; Chen, L.F.; Li, T.; Mao, P.F. Experimental study on maximum temperature beneath tunnel ceiling under the condition of double fire sources. Tunn. Undergr. Space Technol. 2020, 106, 103624. [Google Scholar] [CrossRef]
- Wan, H.X.; Xiao, Y.Y.; Wei, S.Q.; Zhang, Y.C. Performance of ceiling jet induced by dual unequal strong plumes in a naturally ventilated tunnel. Appl. Therm. Eng. 2022, 211, 118447. [Google Scholar] [CrossRef]
- Meng, N.; Shu, Y.M.; Zhang, S.H. Study on smoke temperature induced by two fires in a naturally ventilated tunnel. Tunn. Undergr. Space Technol. 2023, 131, 104774. [Google Scholar] [CrossRef]
- Wang, Q.; Wang, S.M.; Liu, H.; Sheng, J.Y.; Shang, F.J.; Shi, C.L.; Tang, F. Characterization of ceiling smoke temperature profile and maximum temperature rise induced by double fires in a natural ventilation tunnel. Tunn. Undergr. Space Technol. 2020, 96, 103233. [Google Scholar] [CrossRef]
- Jia, Y.; Fan, X.L.; Zhao, X.J.; Deng, Y.L.; Zhu, X.L.; Zhao, W.F. Study on the longitudinal ceiling temperature distribution induced by double pool fires in a tunnel. Int. J. Therm. Sci. 2021, 168, 107059. [Google Scholar] [CrossRef]
- Zhao, J.L.; Cui, X.Y.; Yao, Y.Z.; Yang, R.; Chen, C.K. The burning process and temperature profile of double fires in a tunnel: An experimental study. Tunn. Undergr. Space Technol. Inc. Trench. Technol. Res. 2022, 125, 104500. [Google Scholar] [CrossRef]
- Heidarinejad, G.; Mapar, M.; Pasdarshahri, H. A comprehensive study of two fire sources in a road tunnel: Considering different arrangement of obstacles. Tunn. Undergr. Space Technol. 2016, 59, 91–99. [Google Scholar] [CrossRef]
- Clement, J.M.; Fleischmann, C.M. Experimental verification of the Fire dynamics simulator (FDS) hydrodynamic model. Fire Saf. Sci. 2003, 7, 839–850. [Google Scholar] [CrossRef]
- Beji, T.; Bonte, F.; Merci, B. Numerical simulations of a mechanically-ventilated multi-compartment fire. Fire Saf. Sci. 2014, 11, 499–509. [Google Scholar] [CrossRef]
- Gannouni, S.; Zinoubi, J.; Maad, R.B. Numerical study on the thermal buoyant flow stratification in tunnel fires with longitudinal imposed airflow: Effect of an upstream blockage. Int. J. Therm. Sci. 2019, 136, 230–242. [Google Scholar] [CrossRef]
- Oliveira, R.L.F.; Doubek, G.; Vianna, S.S.V. On the behaviour of the temperature field around pool fires in controlled experiment and numerical modelling. Process Saf. Environ. Prot. 2019, 123, 358–369. [Google Scholar] [CrossRef]
- Brohez, S.; Caravita, I. Fire induced pressure in airthigh houses: Experiments and FDS validation. Fire Saf. J. 2020, 114, 103008. [Google Scholar] [CrossRef]
- Xu, H.S.; Lin, K.; Mao, S.H.; Wang, J.; Ding, Y.M.; Lu, K.H. Numerical investigation of air curtain jet effect upon the compartment-facade fire safety protection based on temperature evolution and thermal impact. Therm. Sci. Eng. Prog. 2023, 43, 101988. [Google Scholar] [CrossRef]
- Ma, T.G.; Quintiere, J.G. Numerical simulation of axisymmetric fire plumes: Accuracy and limitations. Fire Saf. J. 2003, 38, 467–492. [Google Scholar] [CrossRef]
- Oka, Y.; Kurioka, H. Effect of Shape and Size of a Fire Source on Fire Properties in Vicinity of a Fire Source in a Tunnel. Fire Sci. Technol. 2006, 25, 15–29. [Google Scholar] [CrossRef]
- McGrattan, K.; McDermott, R.; Weinschenk, C.; Forney, G. Fire Dynamics Simulator Users Guide, 6th ed.; Special Publication (NIST SP); National Institute of Standards and Technology: Gaithersburg, MD, USA, 2013.
- McGrattan, K.; McDermott, R.; Weinschenk, C.; Overholt, K.; Hostikka, S.; Floyd, J. Fire Dynamics Simulator Technical Reference Guide Volume 1: Mathematical Model (NIST SP); National Institute of Standards and Technology: Gaithersburg, MD, USA, 2013.
- Zukoski, E.E.; Kubota, T.; Cetegen, B. Entrainment in Fire Plumes. Fire Saf. J. 1981, 3, 107–121. [Google Scholar] [CrossRef]
- Alpert, T.R. Turbulent ceiling-jet induced by large-scale fires. Combust. Combust. Sci. Technol. 1975, 11, 197–213. [Google Scholar] [CrossRef]
- Haghighat, A.; Luxbacher, K. Determination of critical parameters in the analysis of road tunnel fires. Int. J. Min. Sci. Technol. 2019, 29, 187–198. [Google Scholar] [CrossRef]
- Cooper, L.Y.; Woodhouse, A. The buoyant plume-driven adiabatic ceiling temperature revisited. J. Heat Transf. 1986, 108, 822–826. [Google Scholar] [CrossRef]
- Motevalli, V. Numerical prediction of ceiling jet temperature profiles during ceiling heating using empirical velocity profiles and turbulent continuity and energy equations. Fire Saf. J. 1994, 22, 125–144. [Google Scholar] [CrossRef]
- Tang, F.; Hu, P.; Wen, J. Experimental investigation on lateral ceiling temperature distribution induced by wall- attached fire with various burner aspect ratios in underground space. Fire Saf. J. 2021, 120, 103055. [Google Scholar] [CrossRef]


| Test No. | Heat Release Rate (MW) | The Dimensions of Burner A (L × W) (m × m) | The Distance between Two Burners (m) |
|---|---|---|---|
| 1–30 | 4 + 4 | 1 × 1, 1.2 × 1, 1.5 × 1, 1.8 × 1, 2 × 1 | 0, 0.2, 0.4, 0.6, 0.8, 1, 2 |
| 31–60 | 5 + 5 | 1 × 1, 1.2 × 1, 1.5 × 1, 1.8 × 1, 2 × 1 | 0, 0.2, 0.4, 0.6, 0.8, 1, 2 |
| 61–90 | 6 + 6 | 1 × 1, 1.2 × 1, 1.5 × 1, 1.8 × 1, 2 × 1 | 0, 0.2, 0.4, 0.6, 0.8, 1, 2 |
| Grid System | Grid Size in Near-Fire Region | Grid Size in Other Regions | Total Number of Mesh |
|---|---|---|---|
| 1 | 0.2 m × 0.2 m × 0.2 m | 0.2 m × 0.2 m × 0.2 m | 1,890,000 |
| 2 | 0.25 m × 0.25 m × 0.25 m | 0.25 m × 0.25 m × 0.25 m | 967,680 |
| 3 | 0.25 m × 0.25 m × 0.25 m | 0.5 m × 0.5 m × 0.5 m | 524,160 |
| 4 | 0.5 m × 0.5 m × 0.5 m | 0.5 m × 0.5 m × 0.5 m | 120,960 |
Disclaimer/Publisher’s Note: The statements, opinions and data contained in all publications are solely those of the individual author(s) and contributor(s) and not of MDPI and/or the editor(s). MDPI and/or the editor(s) disclaim responsibility for any injury to people or property resulting from any ideas, methods, instructions or products referred to in the content. |
© 2024 by the authors. Licensee MDPI, Basel, Switzerland. This article is an open access article distributed under the terms and conditions of the Creative Commons Attribution (CC BY) license (https://creativecommons.org/licenses/by/4.0/).
Share and Cite
Zhang, S.; Meng, N. A Study on the Maximum Temperature of a Ceiling Jet of Asymmetric Dual Strong Plumes in a Naturally Ventilated Tunnel. Fire 2024, 7, 110. https://doi.org/10.3390/fire7040110
Zhang S, Meng N. A Study on the Maximum Temperature of a Ceiling Jet of Asymmetric Dual Strong Plumes in a Naturally Ventilated Tunnel. Fire. 2024; 7(4):110. https://doi.org/10.3390/fire7040110
Chicago/Turabian StyleZhang, Shenghao, and Na Meng. 2024. "A Study on the Maximum Temperature of a Ceiling Jet of Asymmetric Dual Strong Plumes in a Naturally Ventilated Tunnel" Fire 7, no. 4: 110. https://doi.org/10.3390/fire7040110