
Pyrogeography of the Western Great Plains: A 40-Year History of Fire in Semi-Arid Rangelands

Abstract
:1. Introduction
2. Materials and Methods
2.1. Data Employed
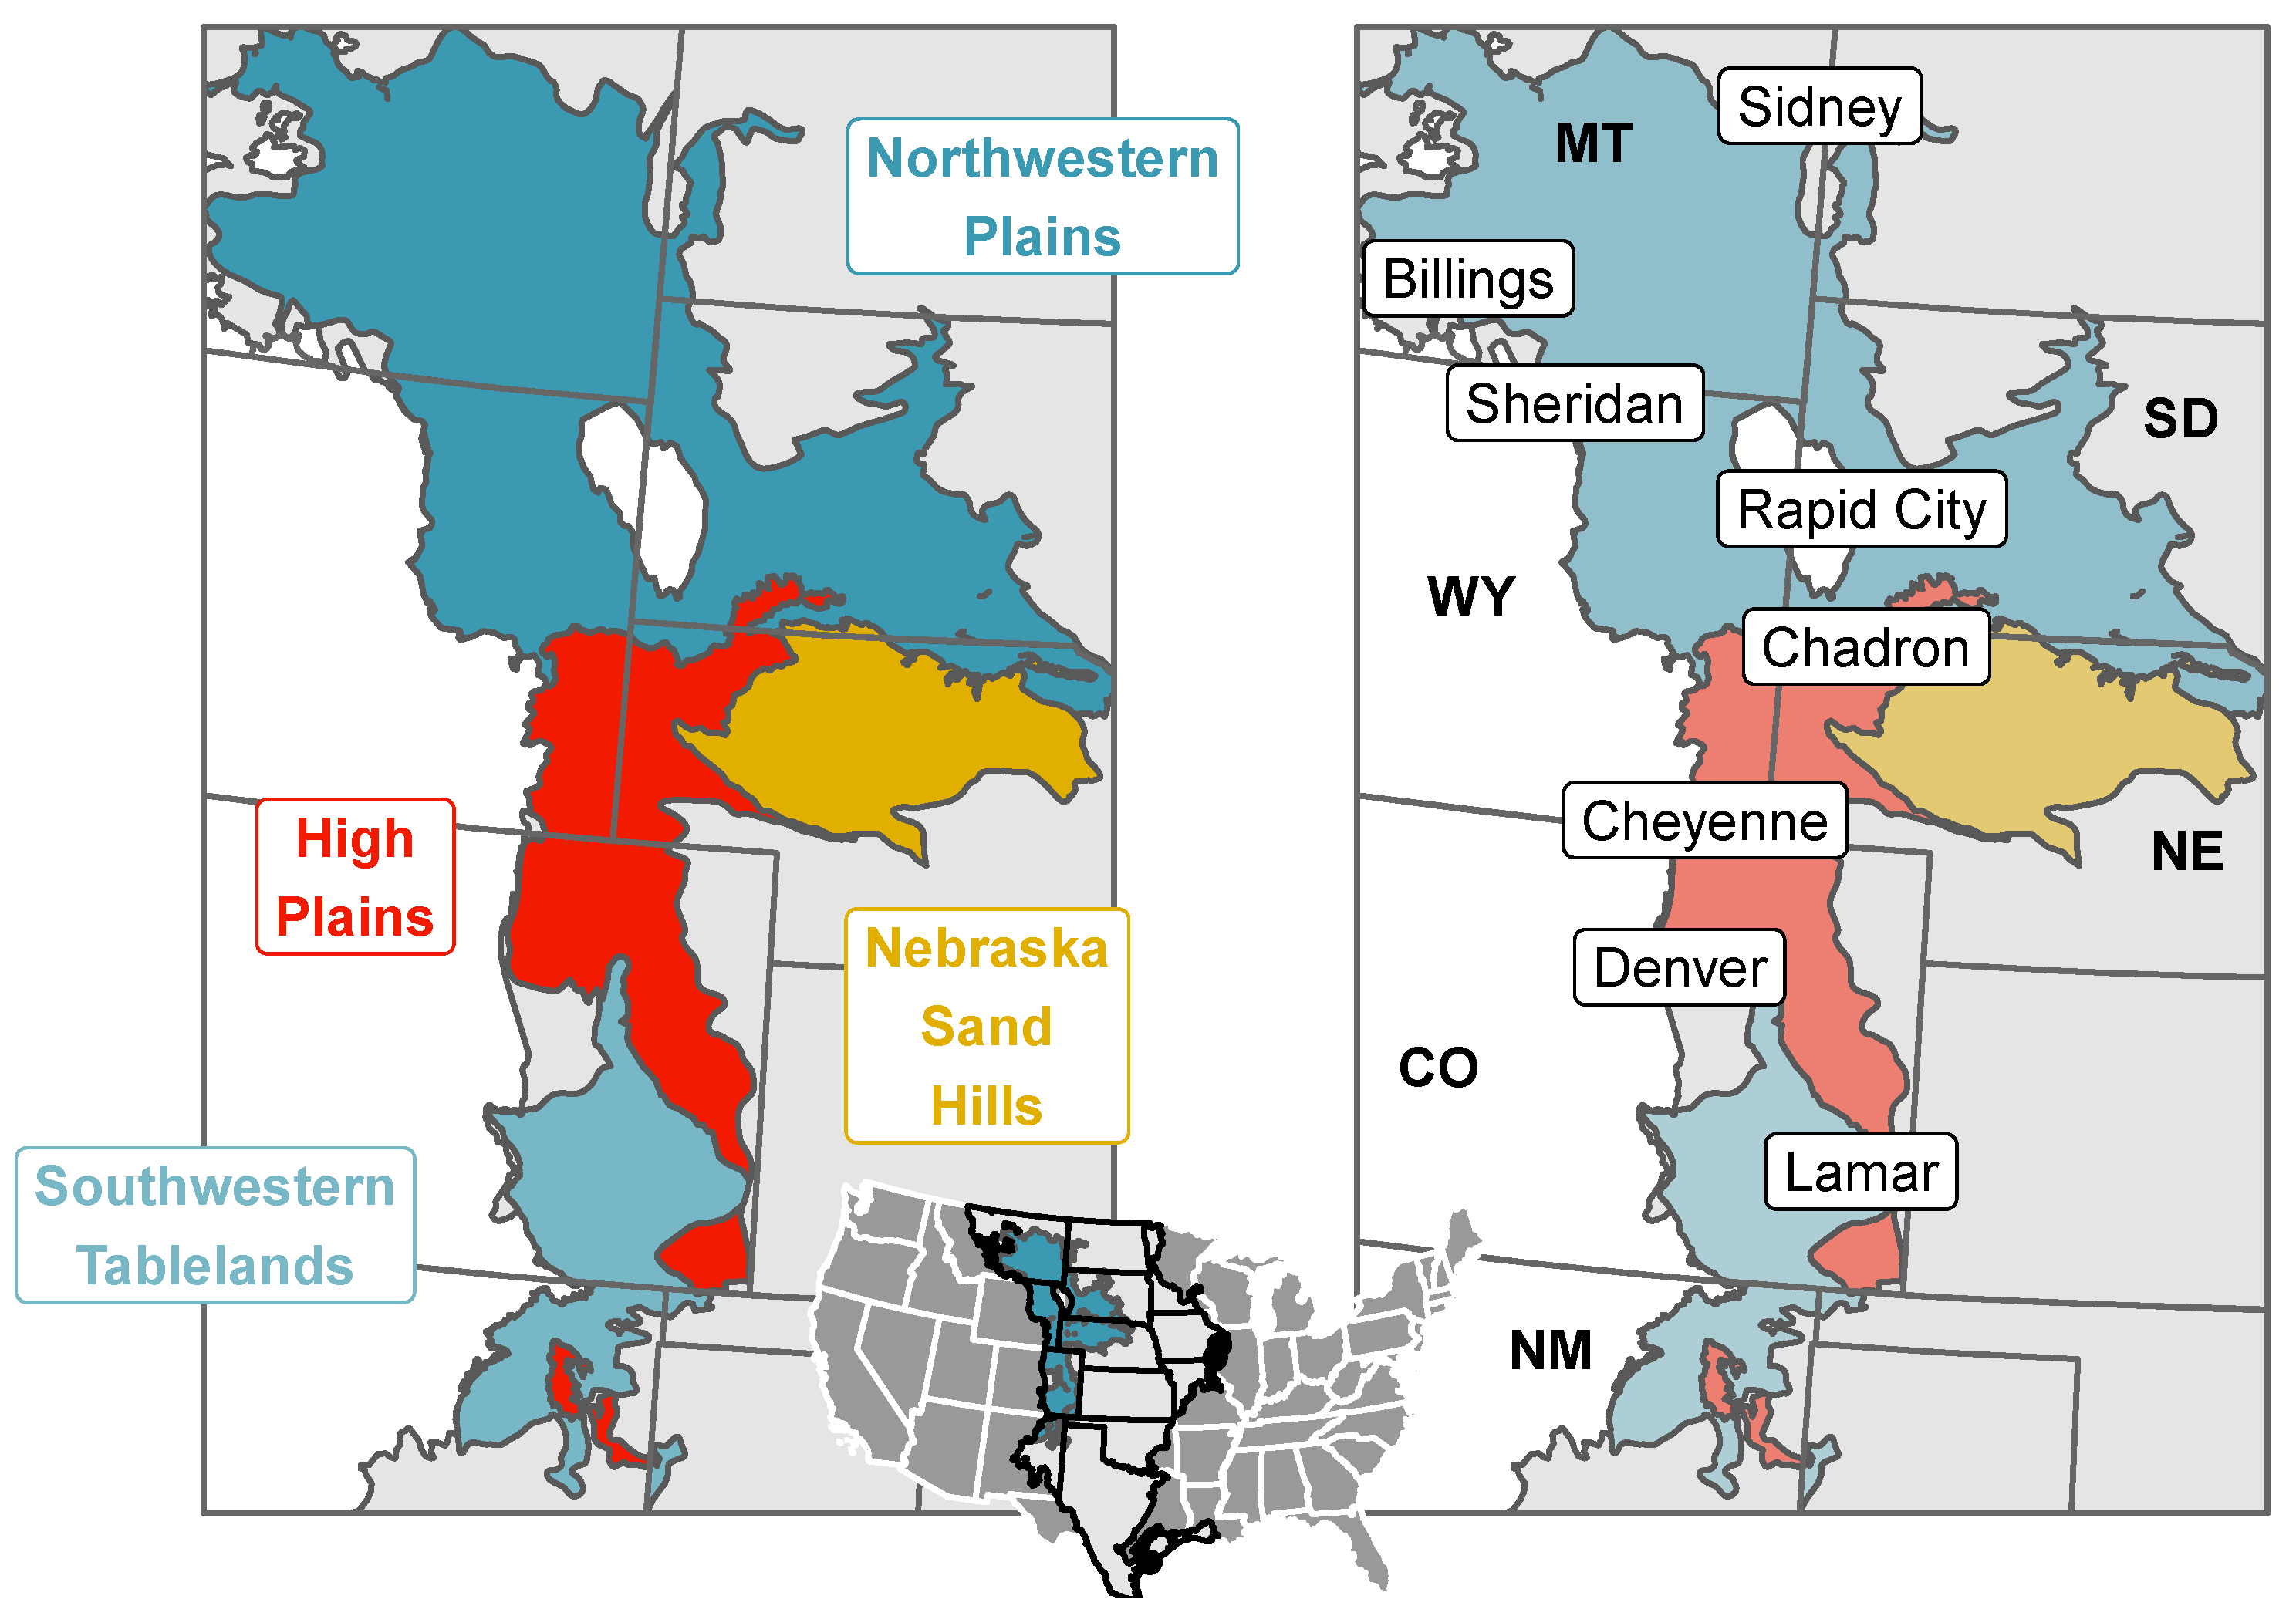
2.1.1. Study Region
2.1.2. Environment and Land Cover
2.1.3. Land Management Jurisdiction
2.1.4. Historical Fire Data
2.2. Data Summary and Analysis
2.2.1. Regional Trends in Fire Incidents
Incidence and Burned Area
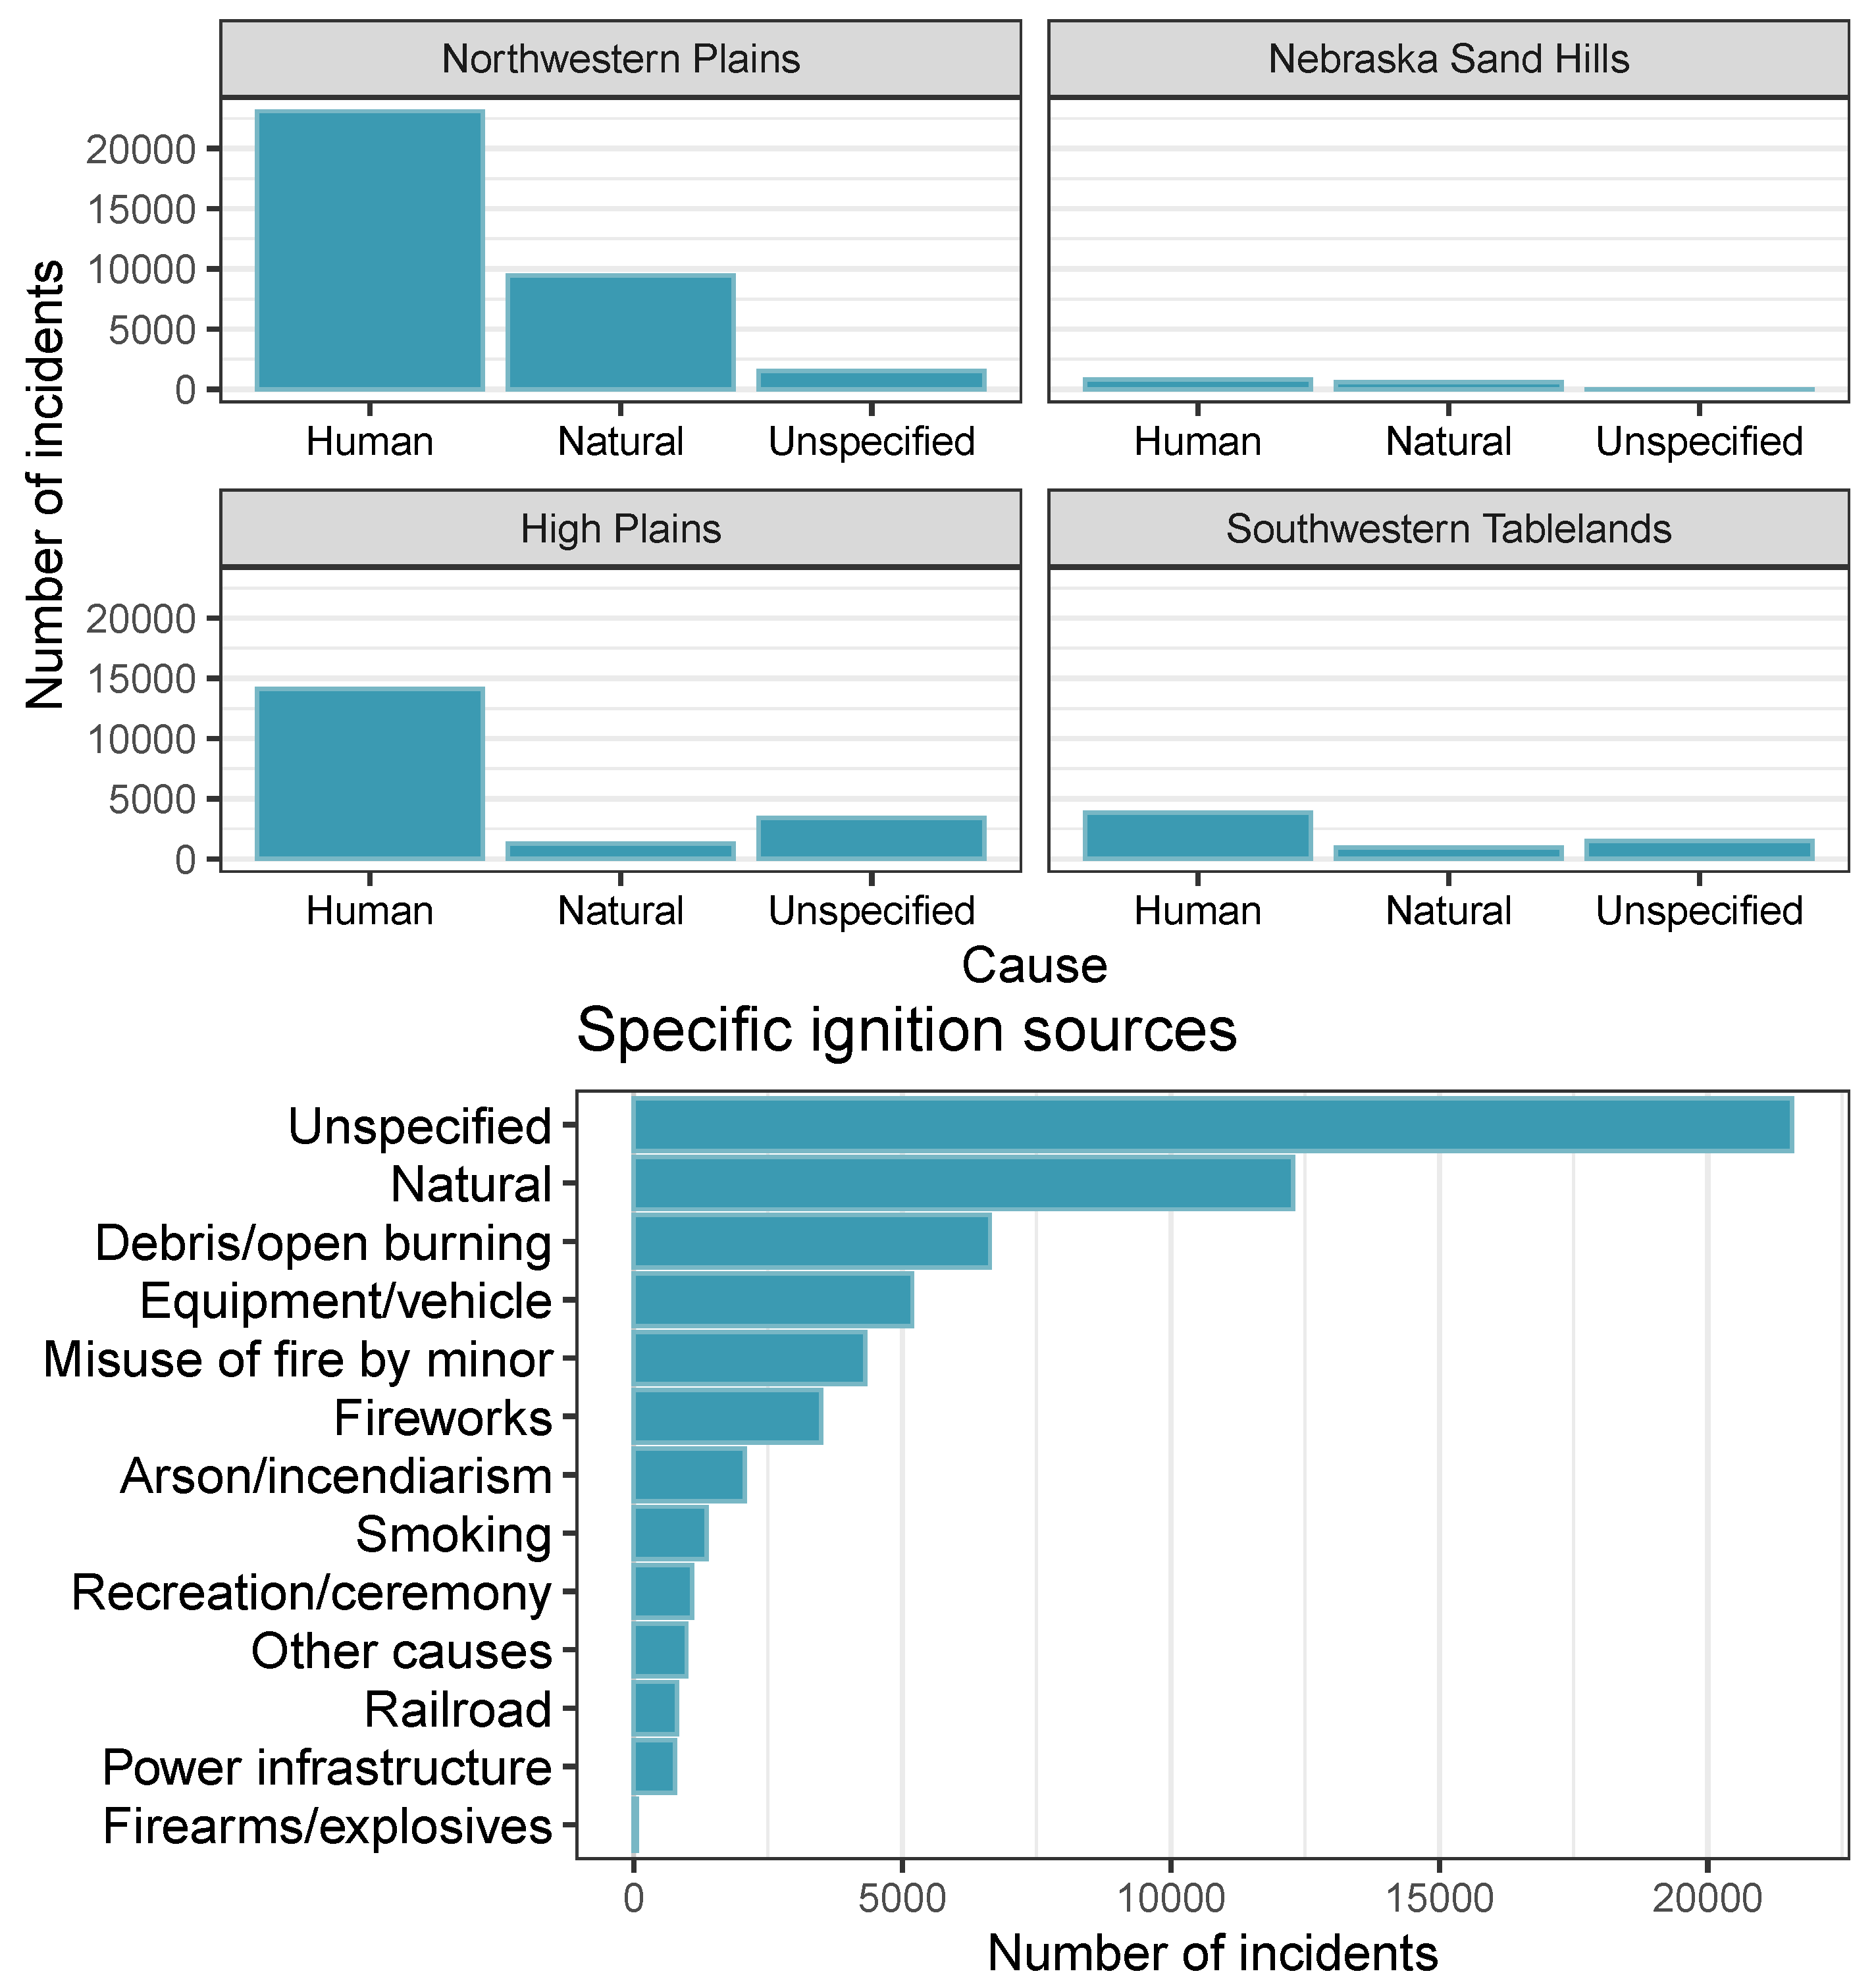
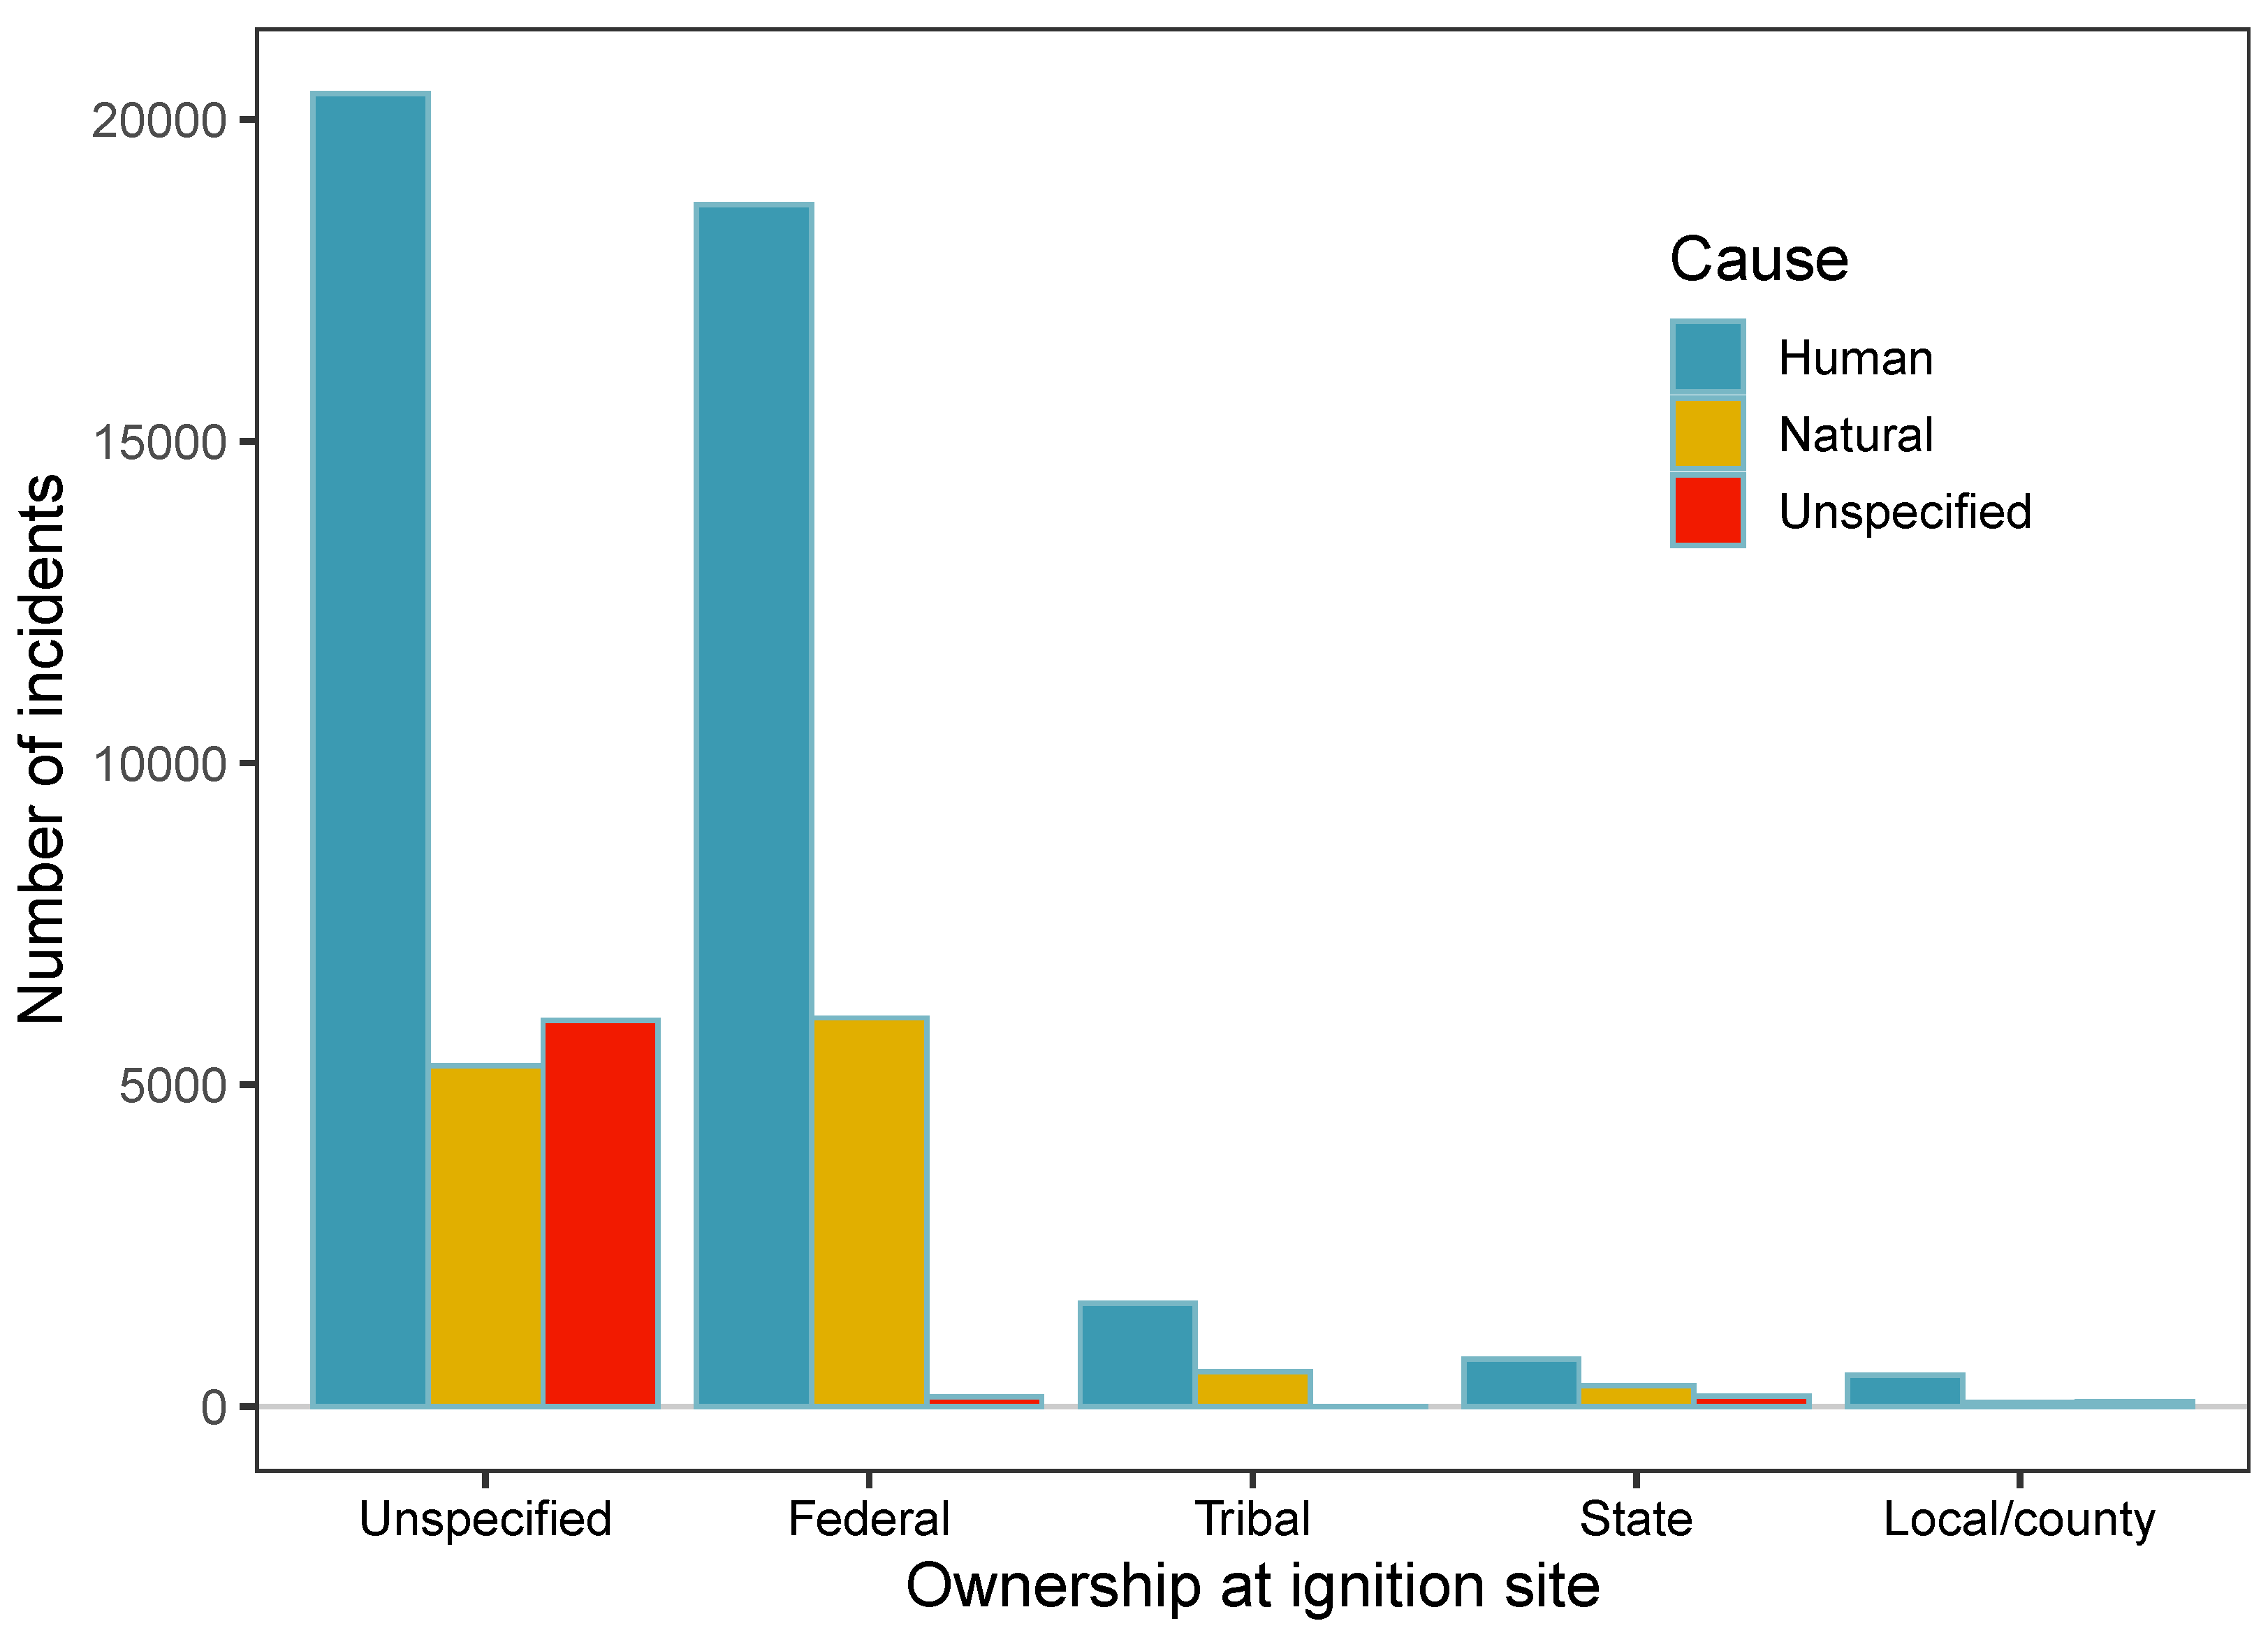
Causes of Fires
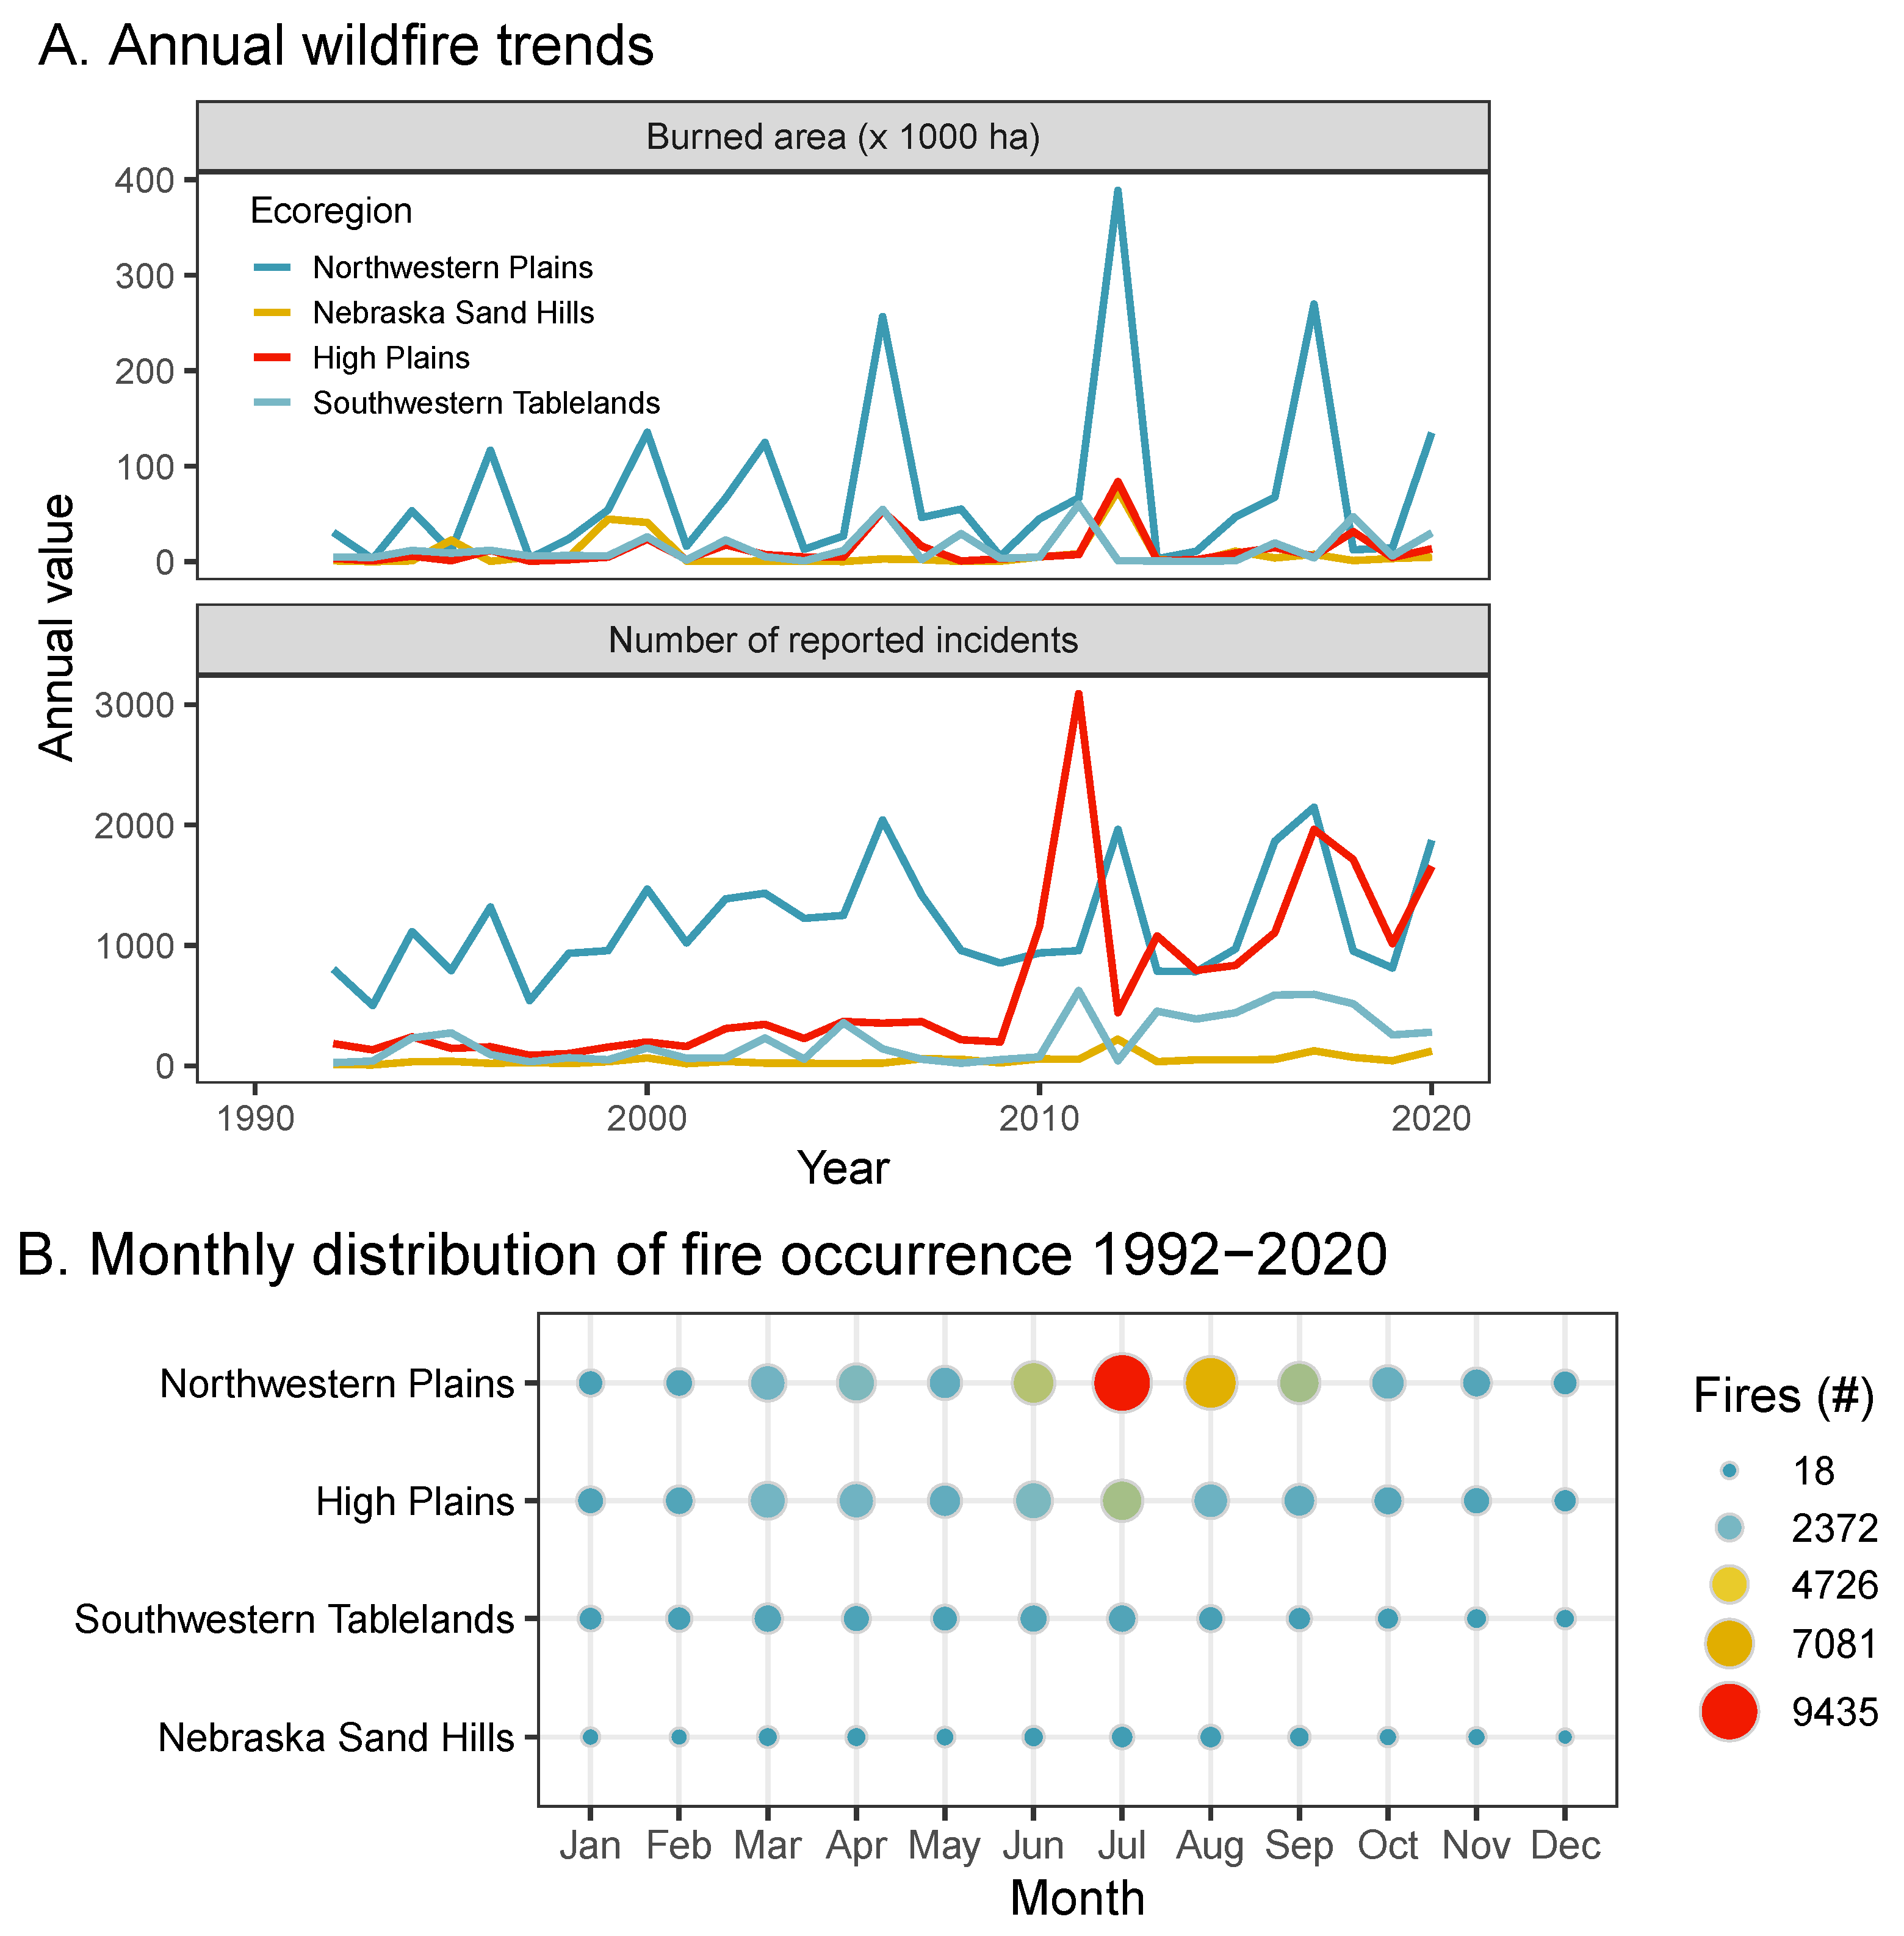
Temporal Trends
2.2.2. Burned Area by Management Jurisdiction and Vegetation Type
3. Results and Discussion
3.1. Regional Fire Patterns
3.1.1. Incidence and Burned Area
General Patterns
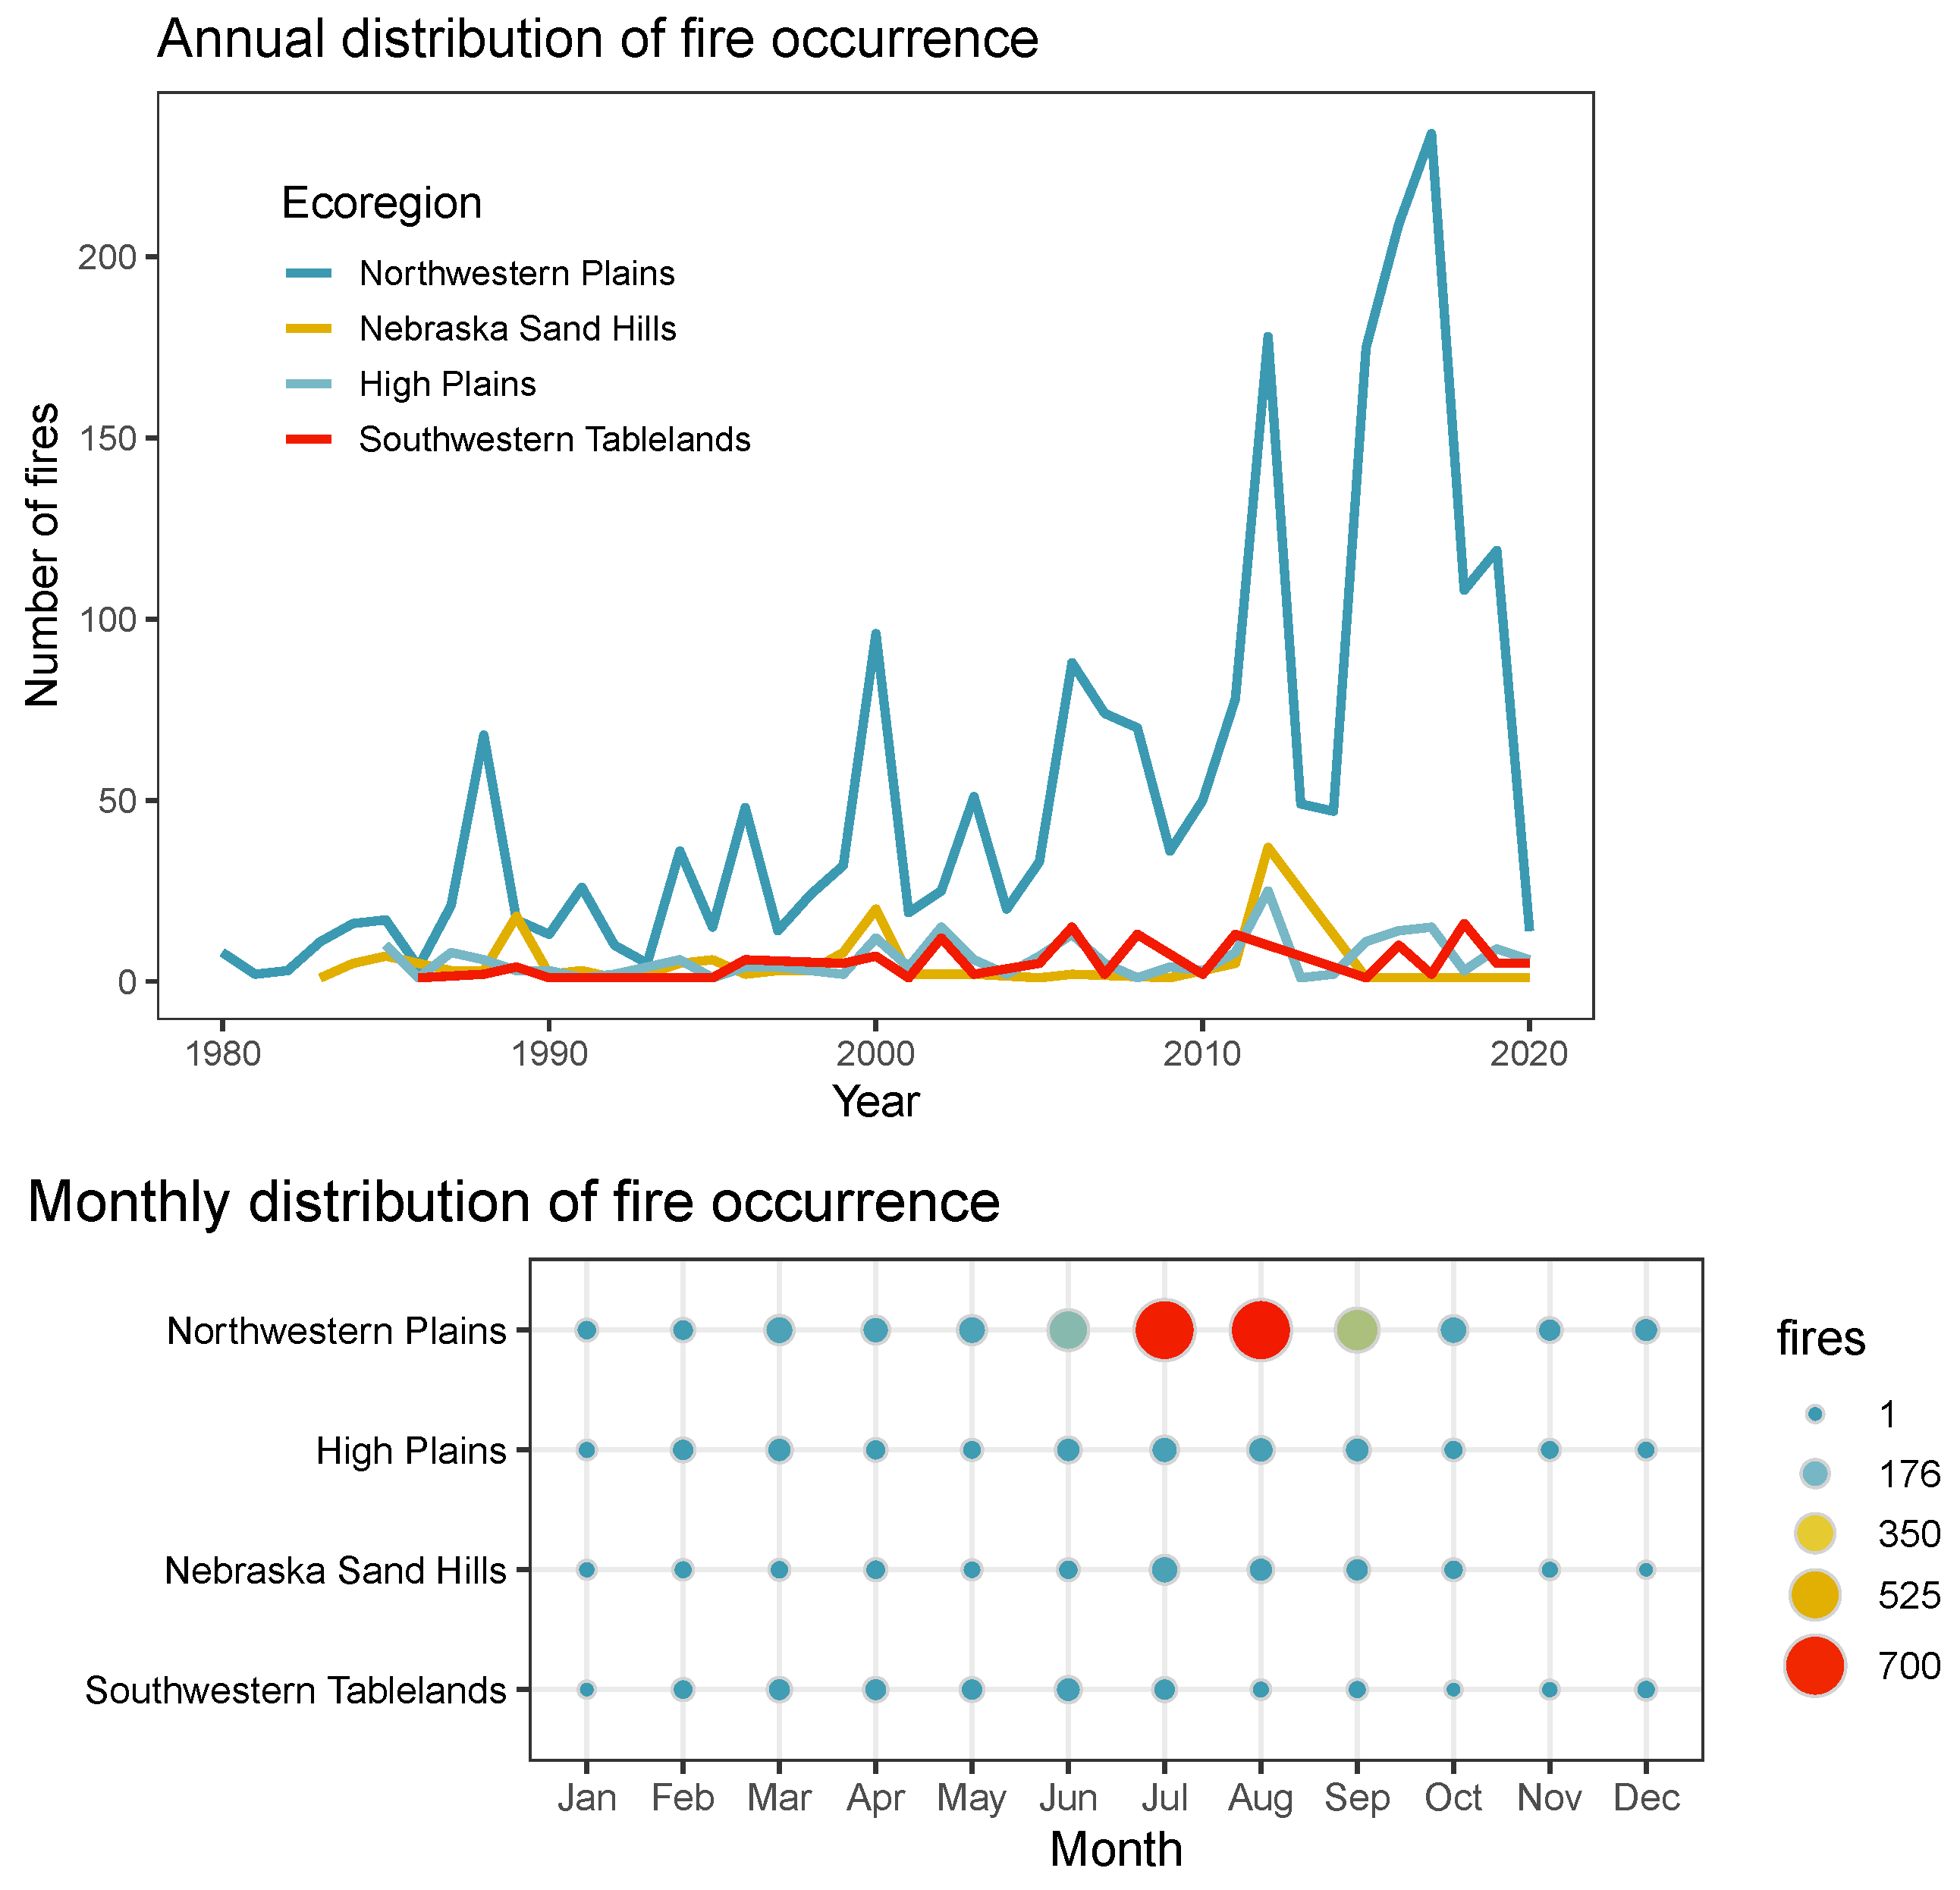
Temporal Trends
3.1.2. Drivers of Fire Activity
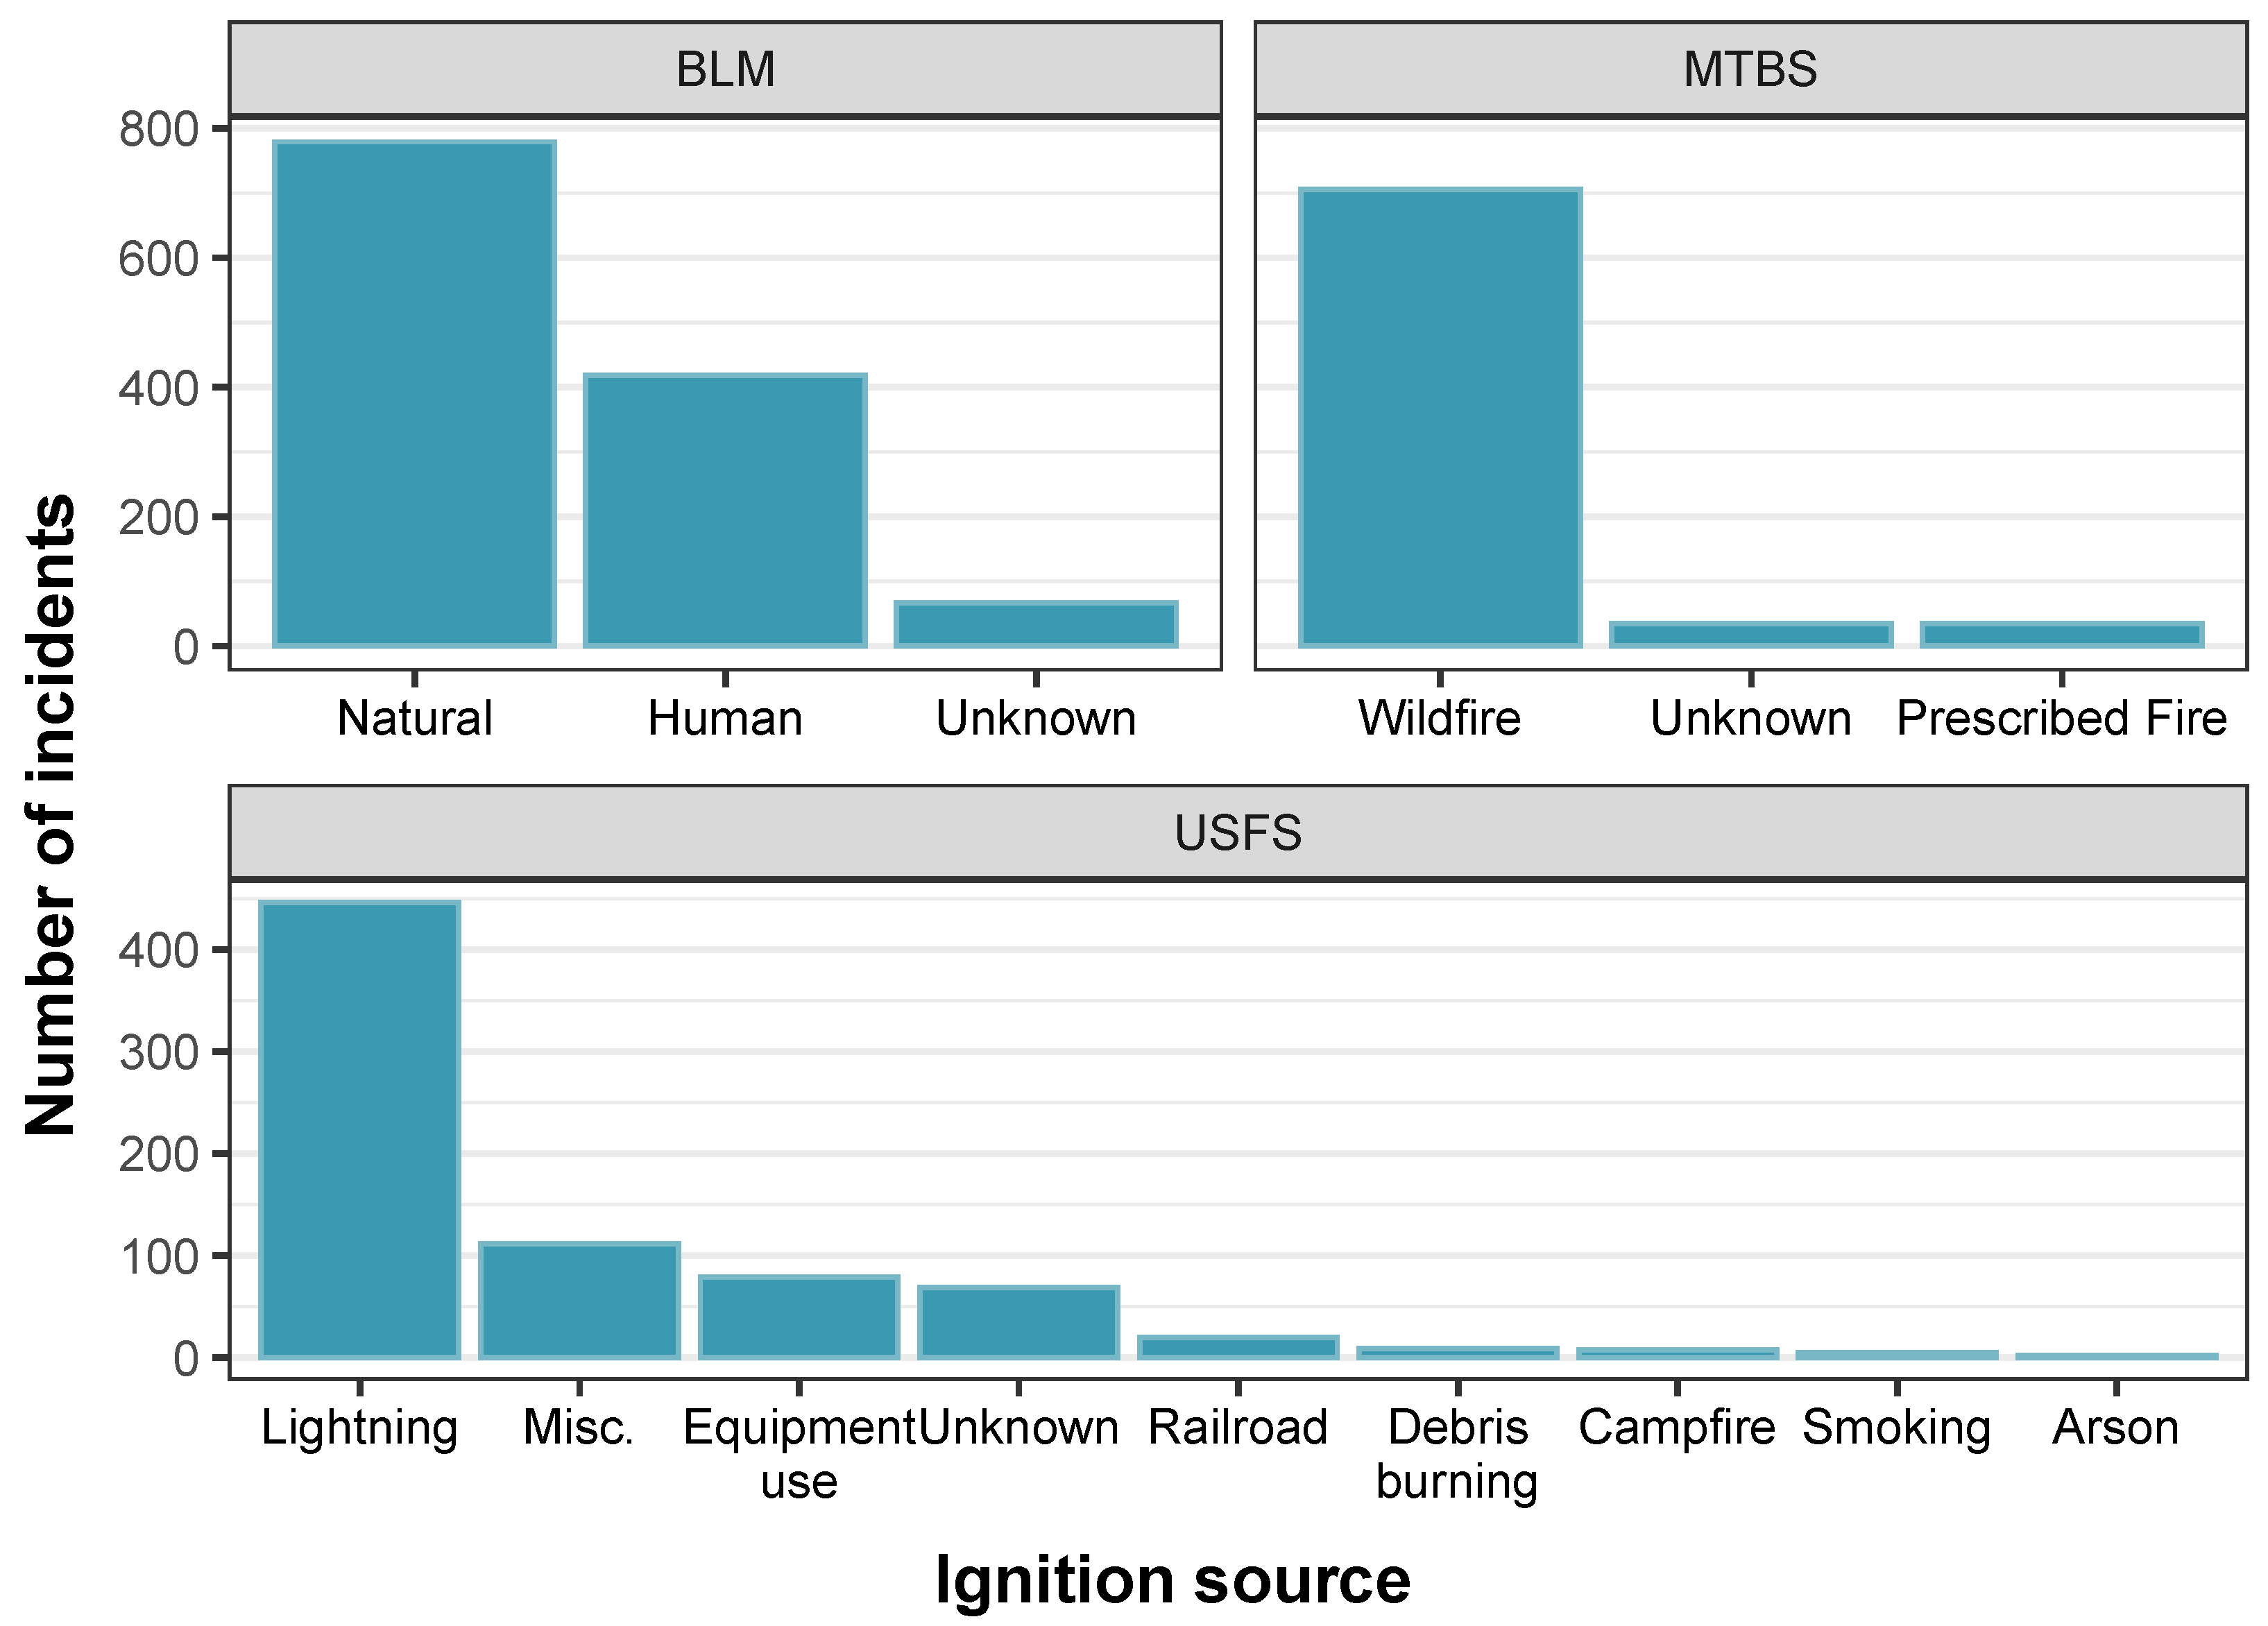
Specific Causes
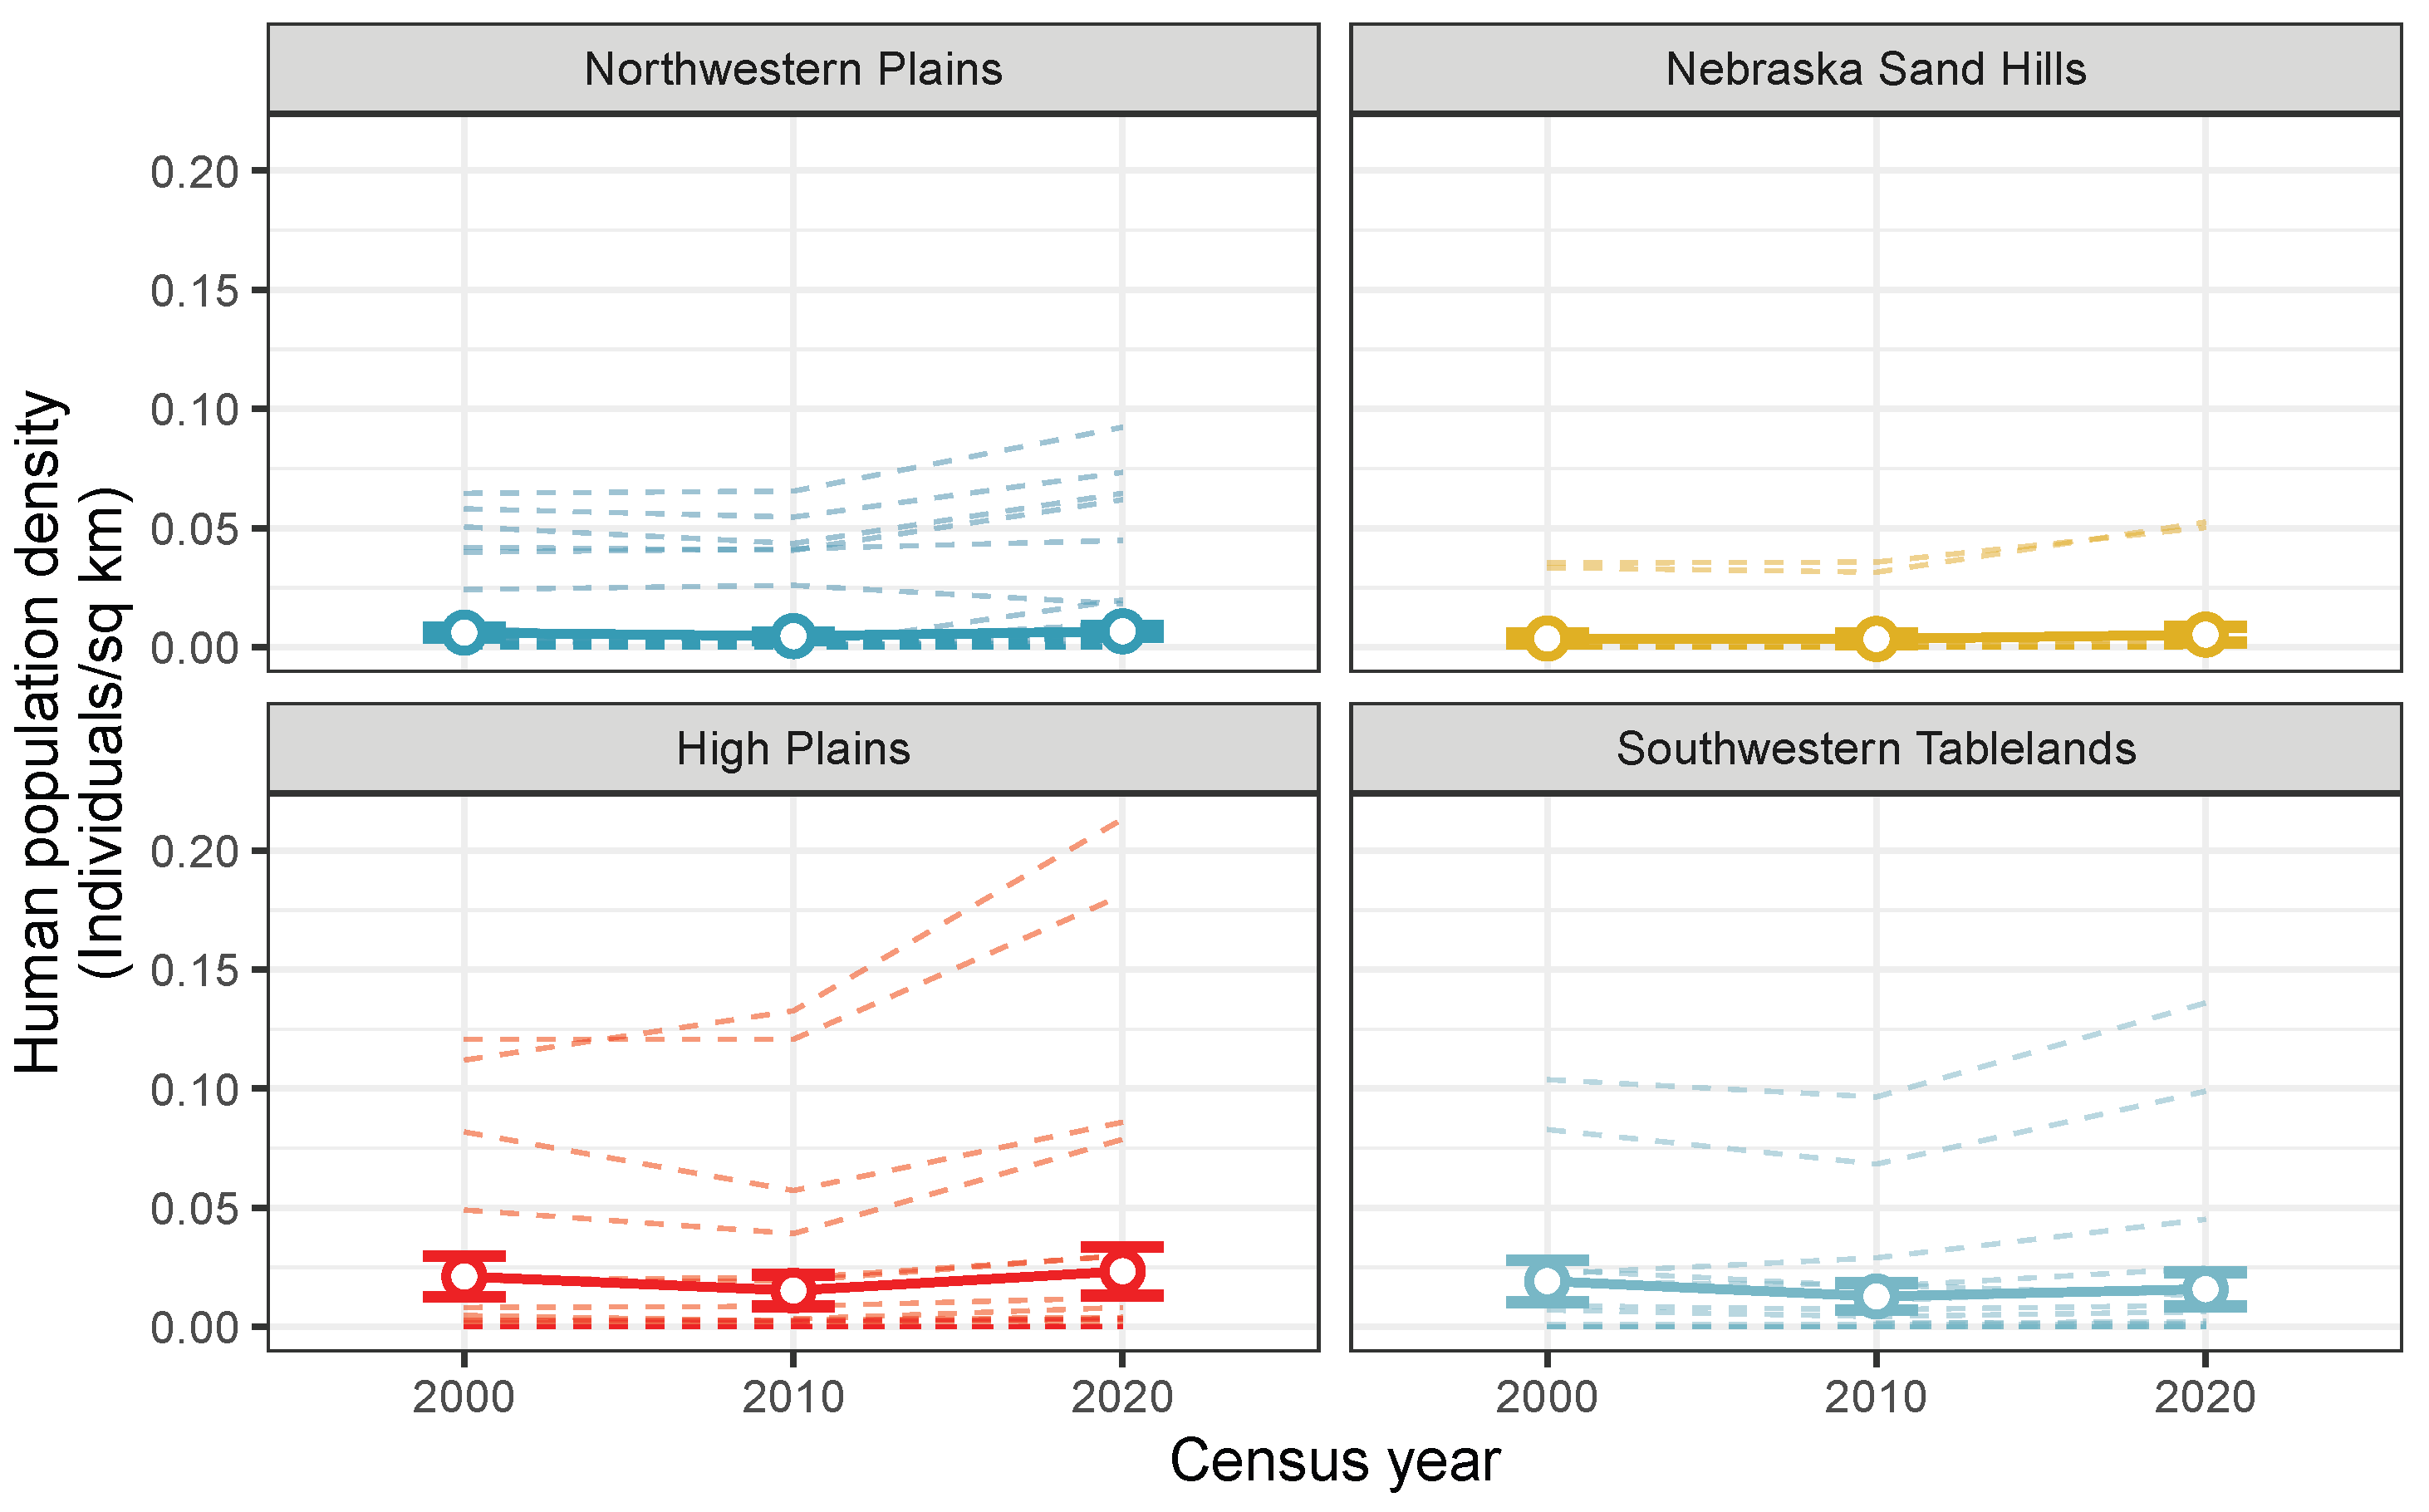
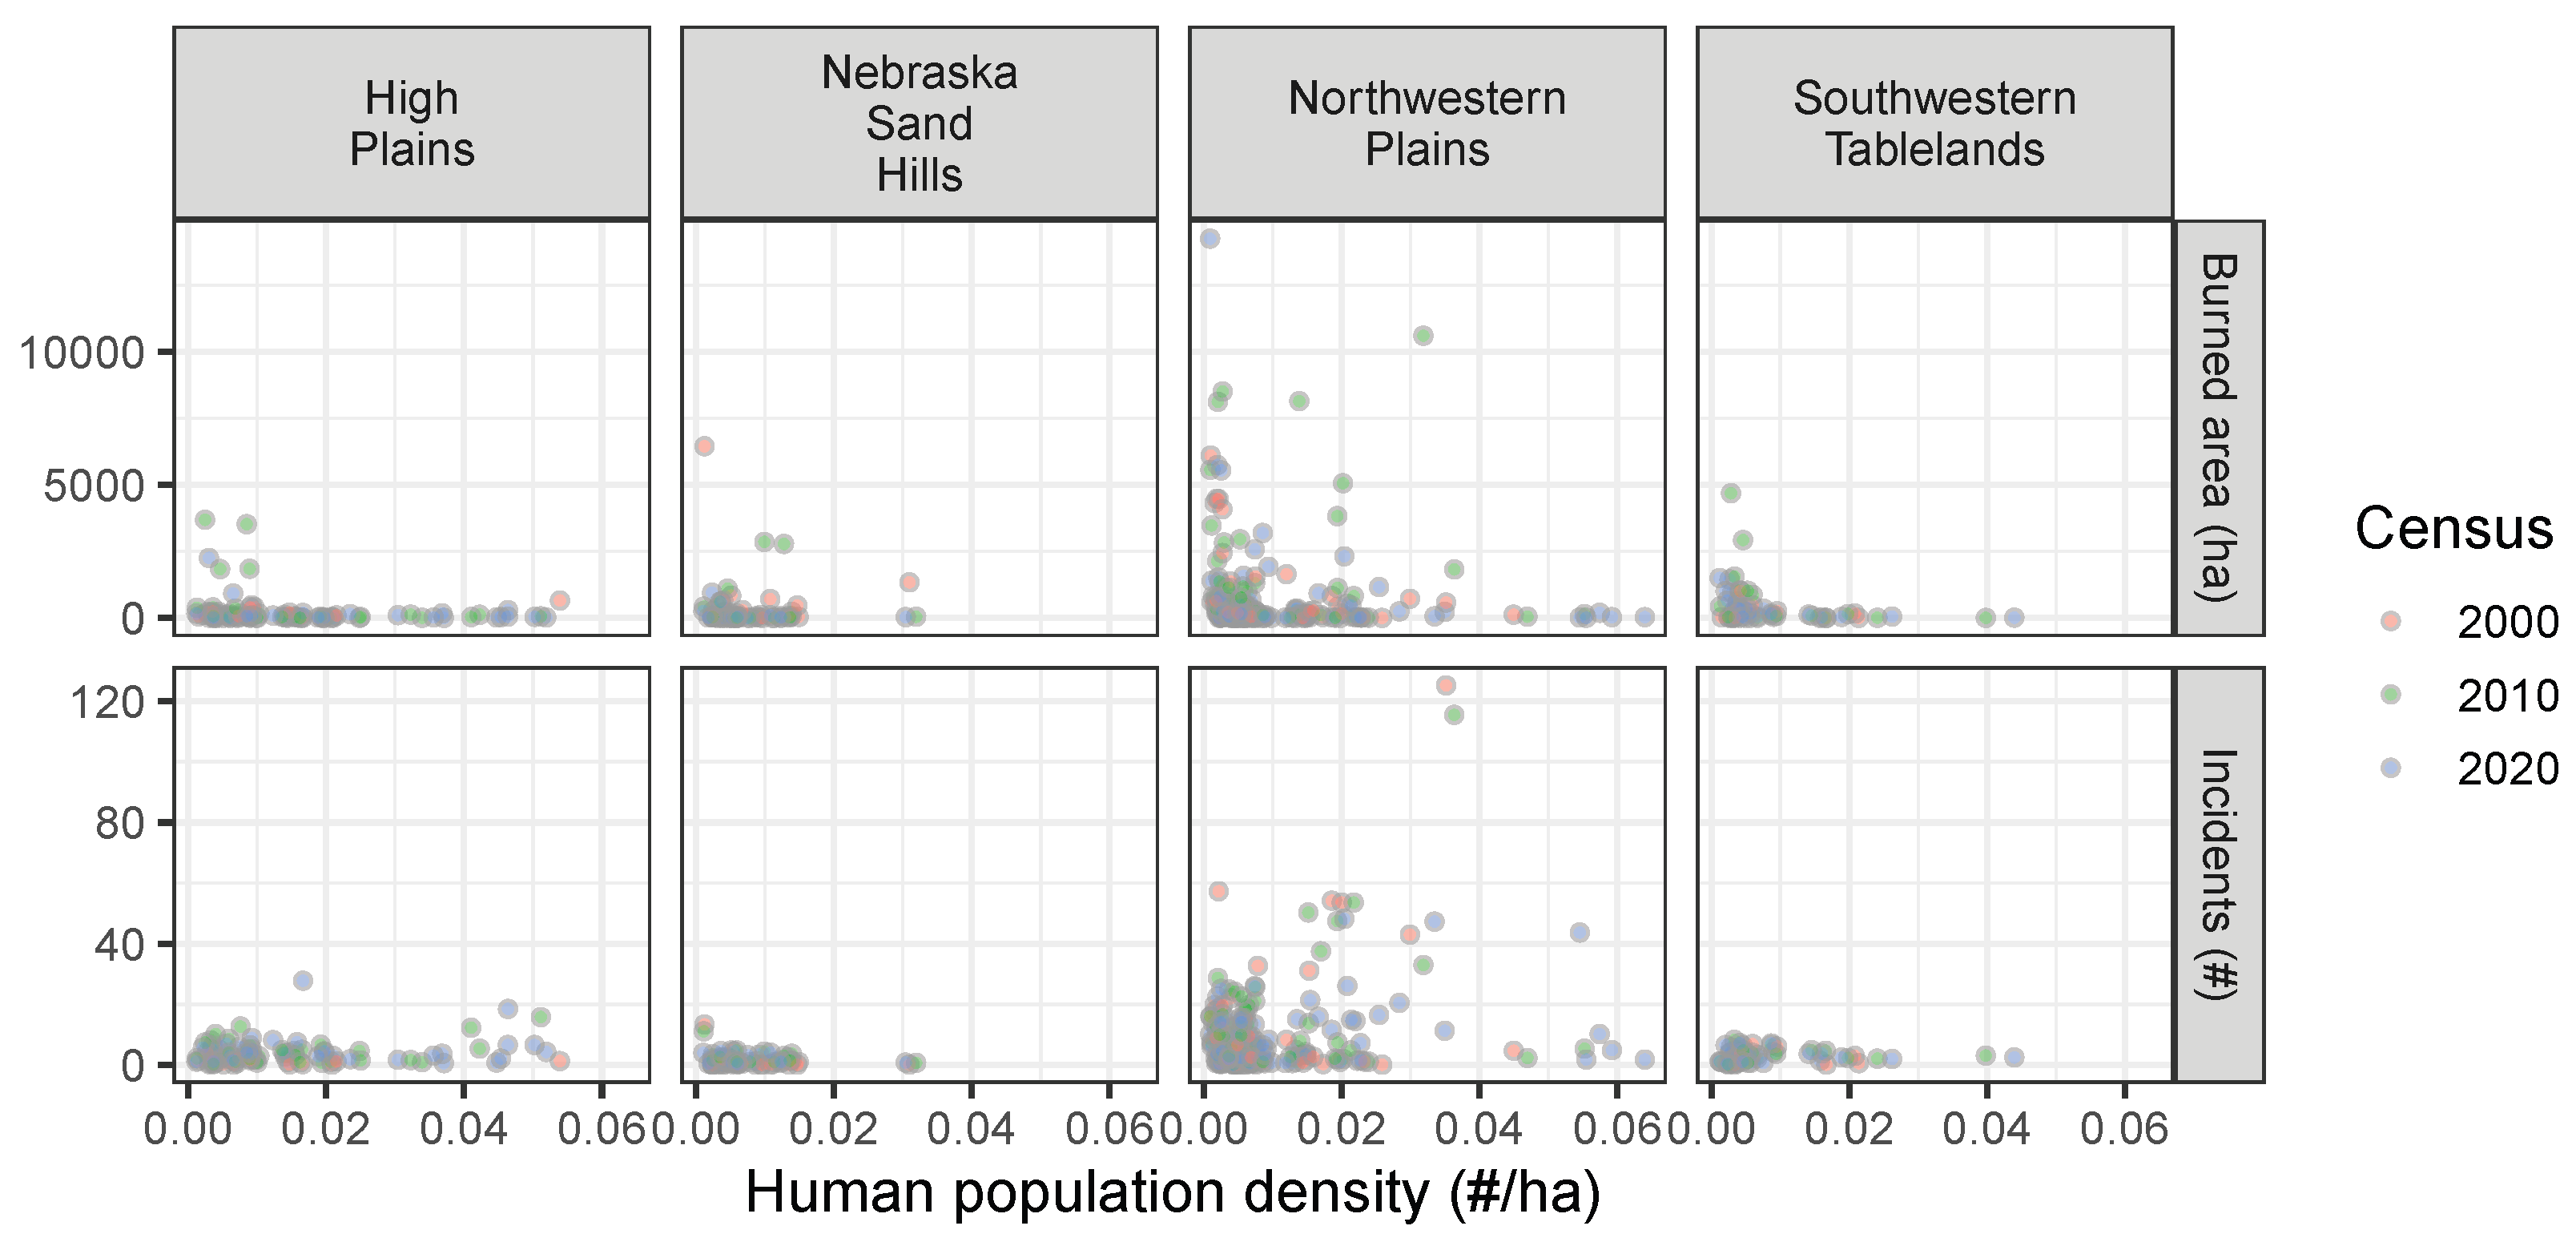
Human Population
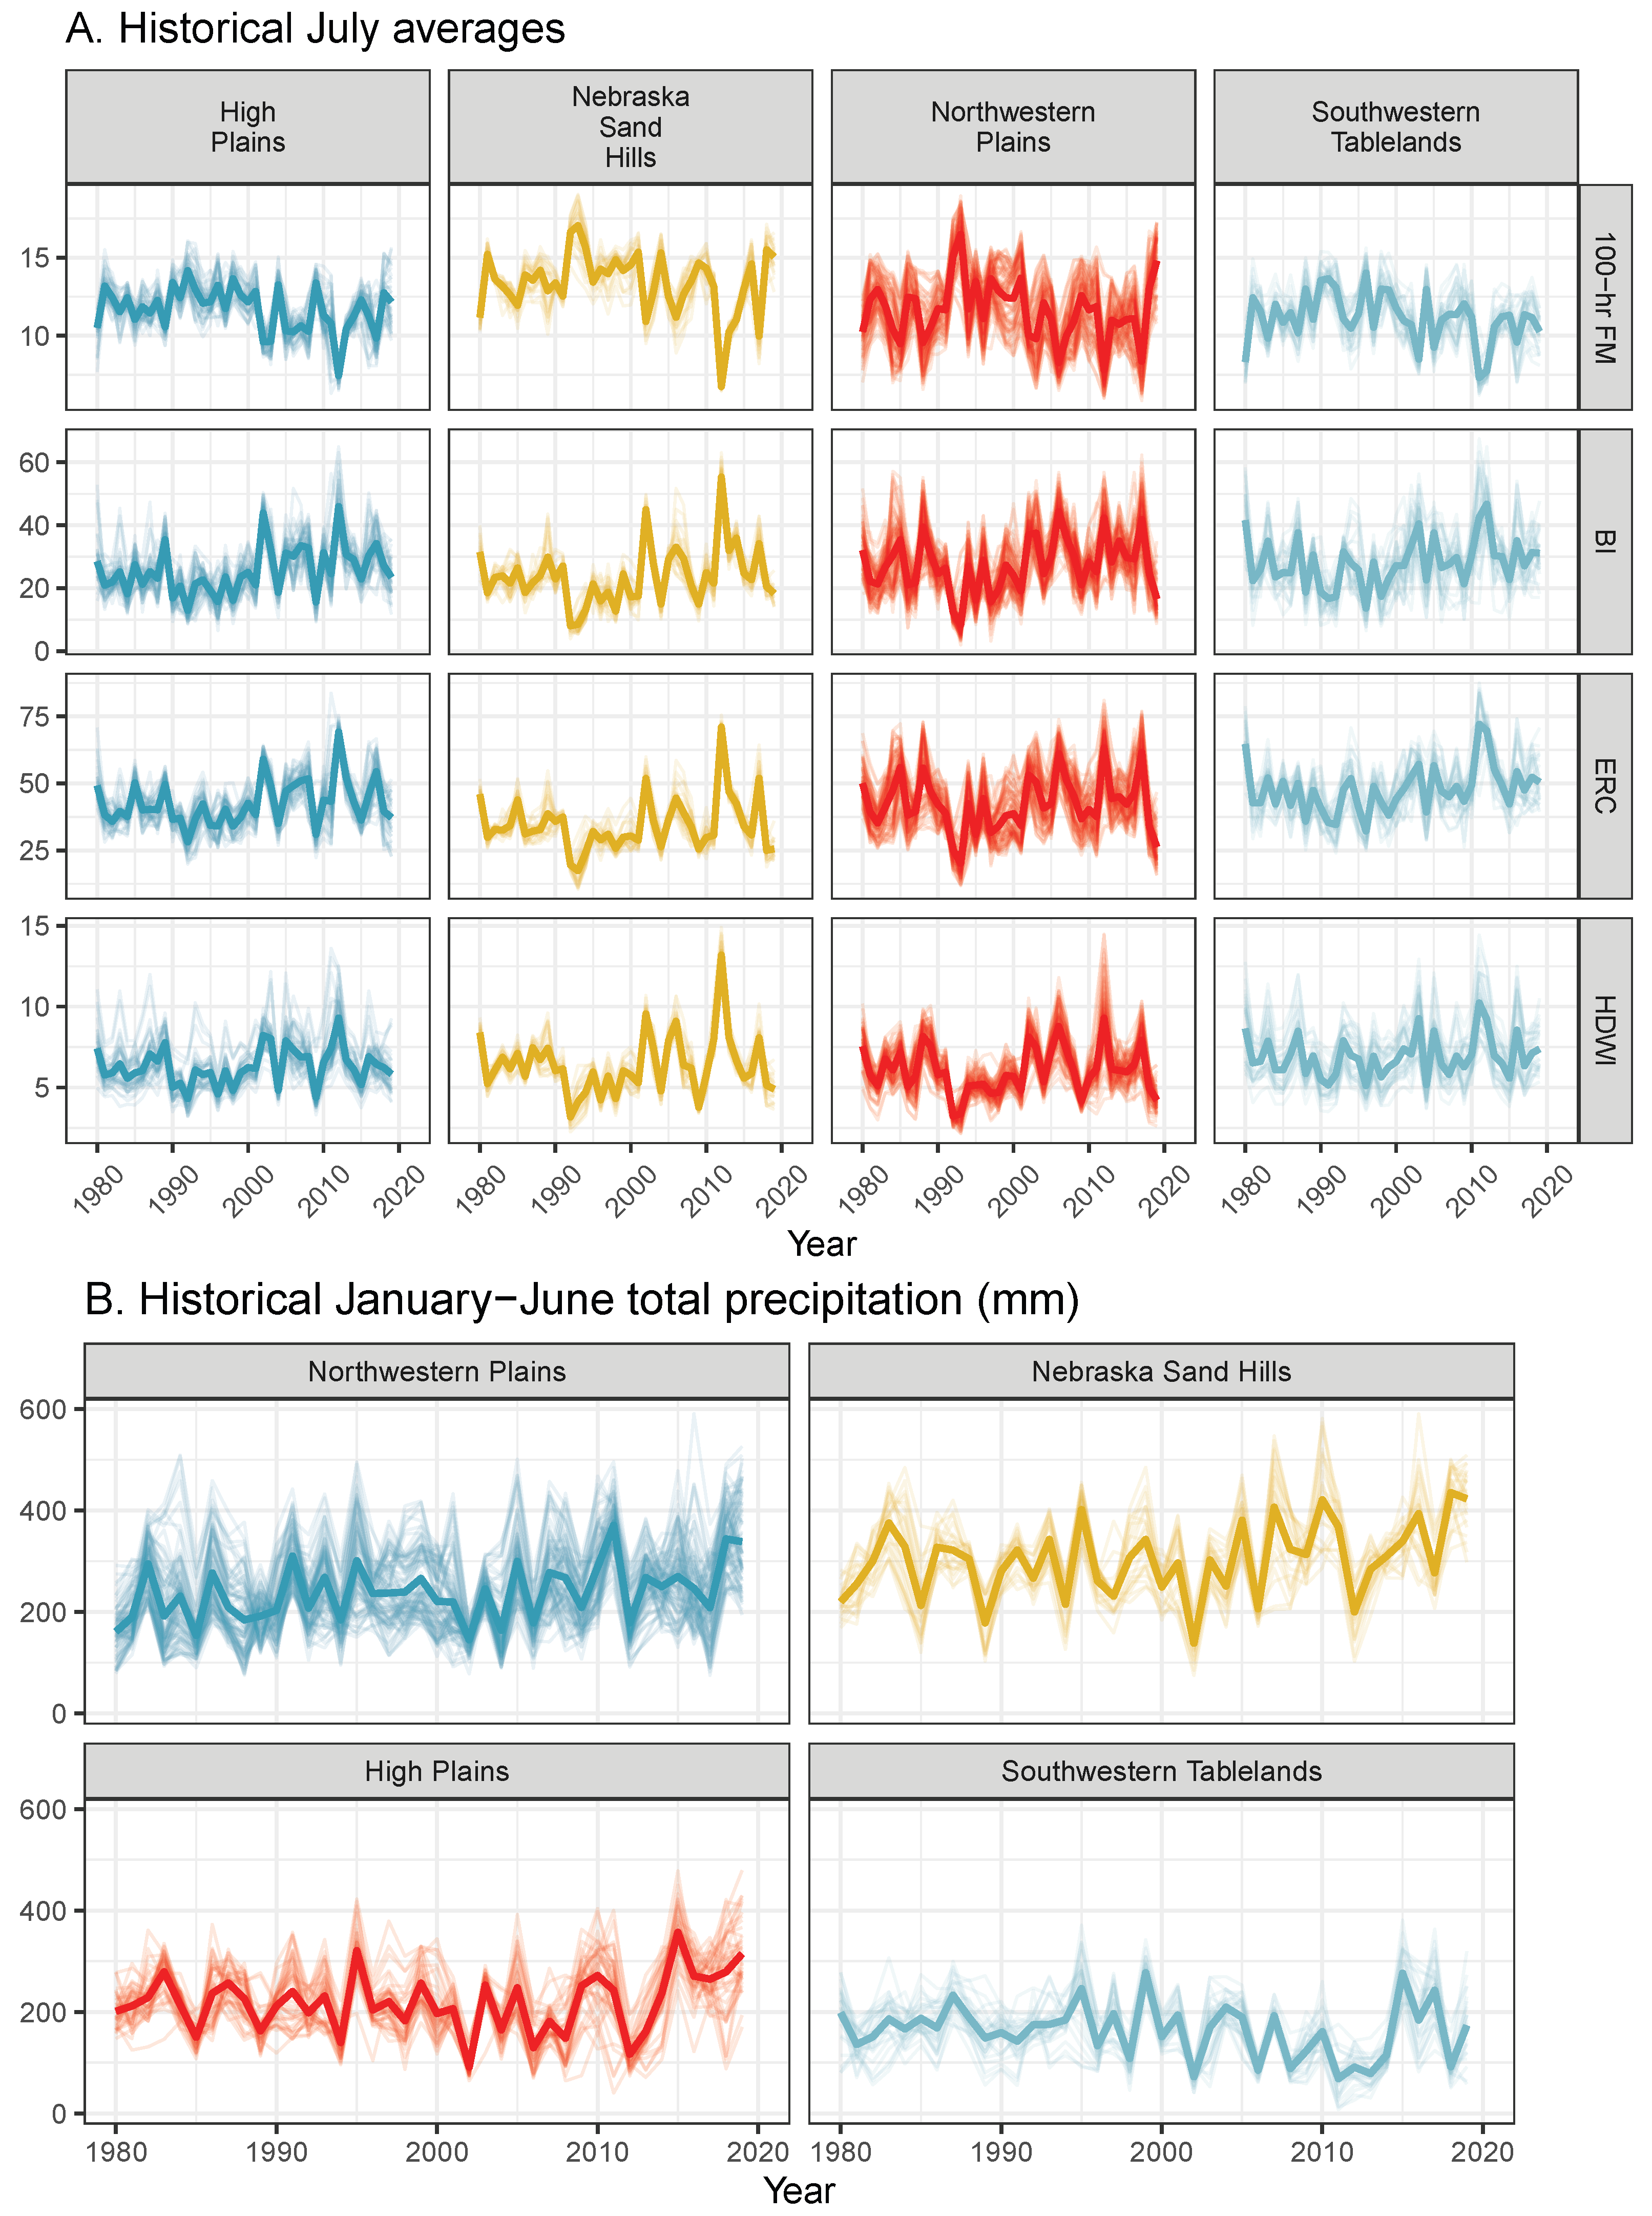
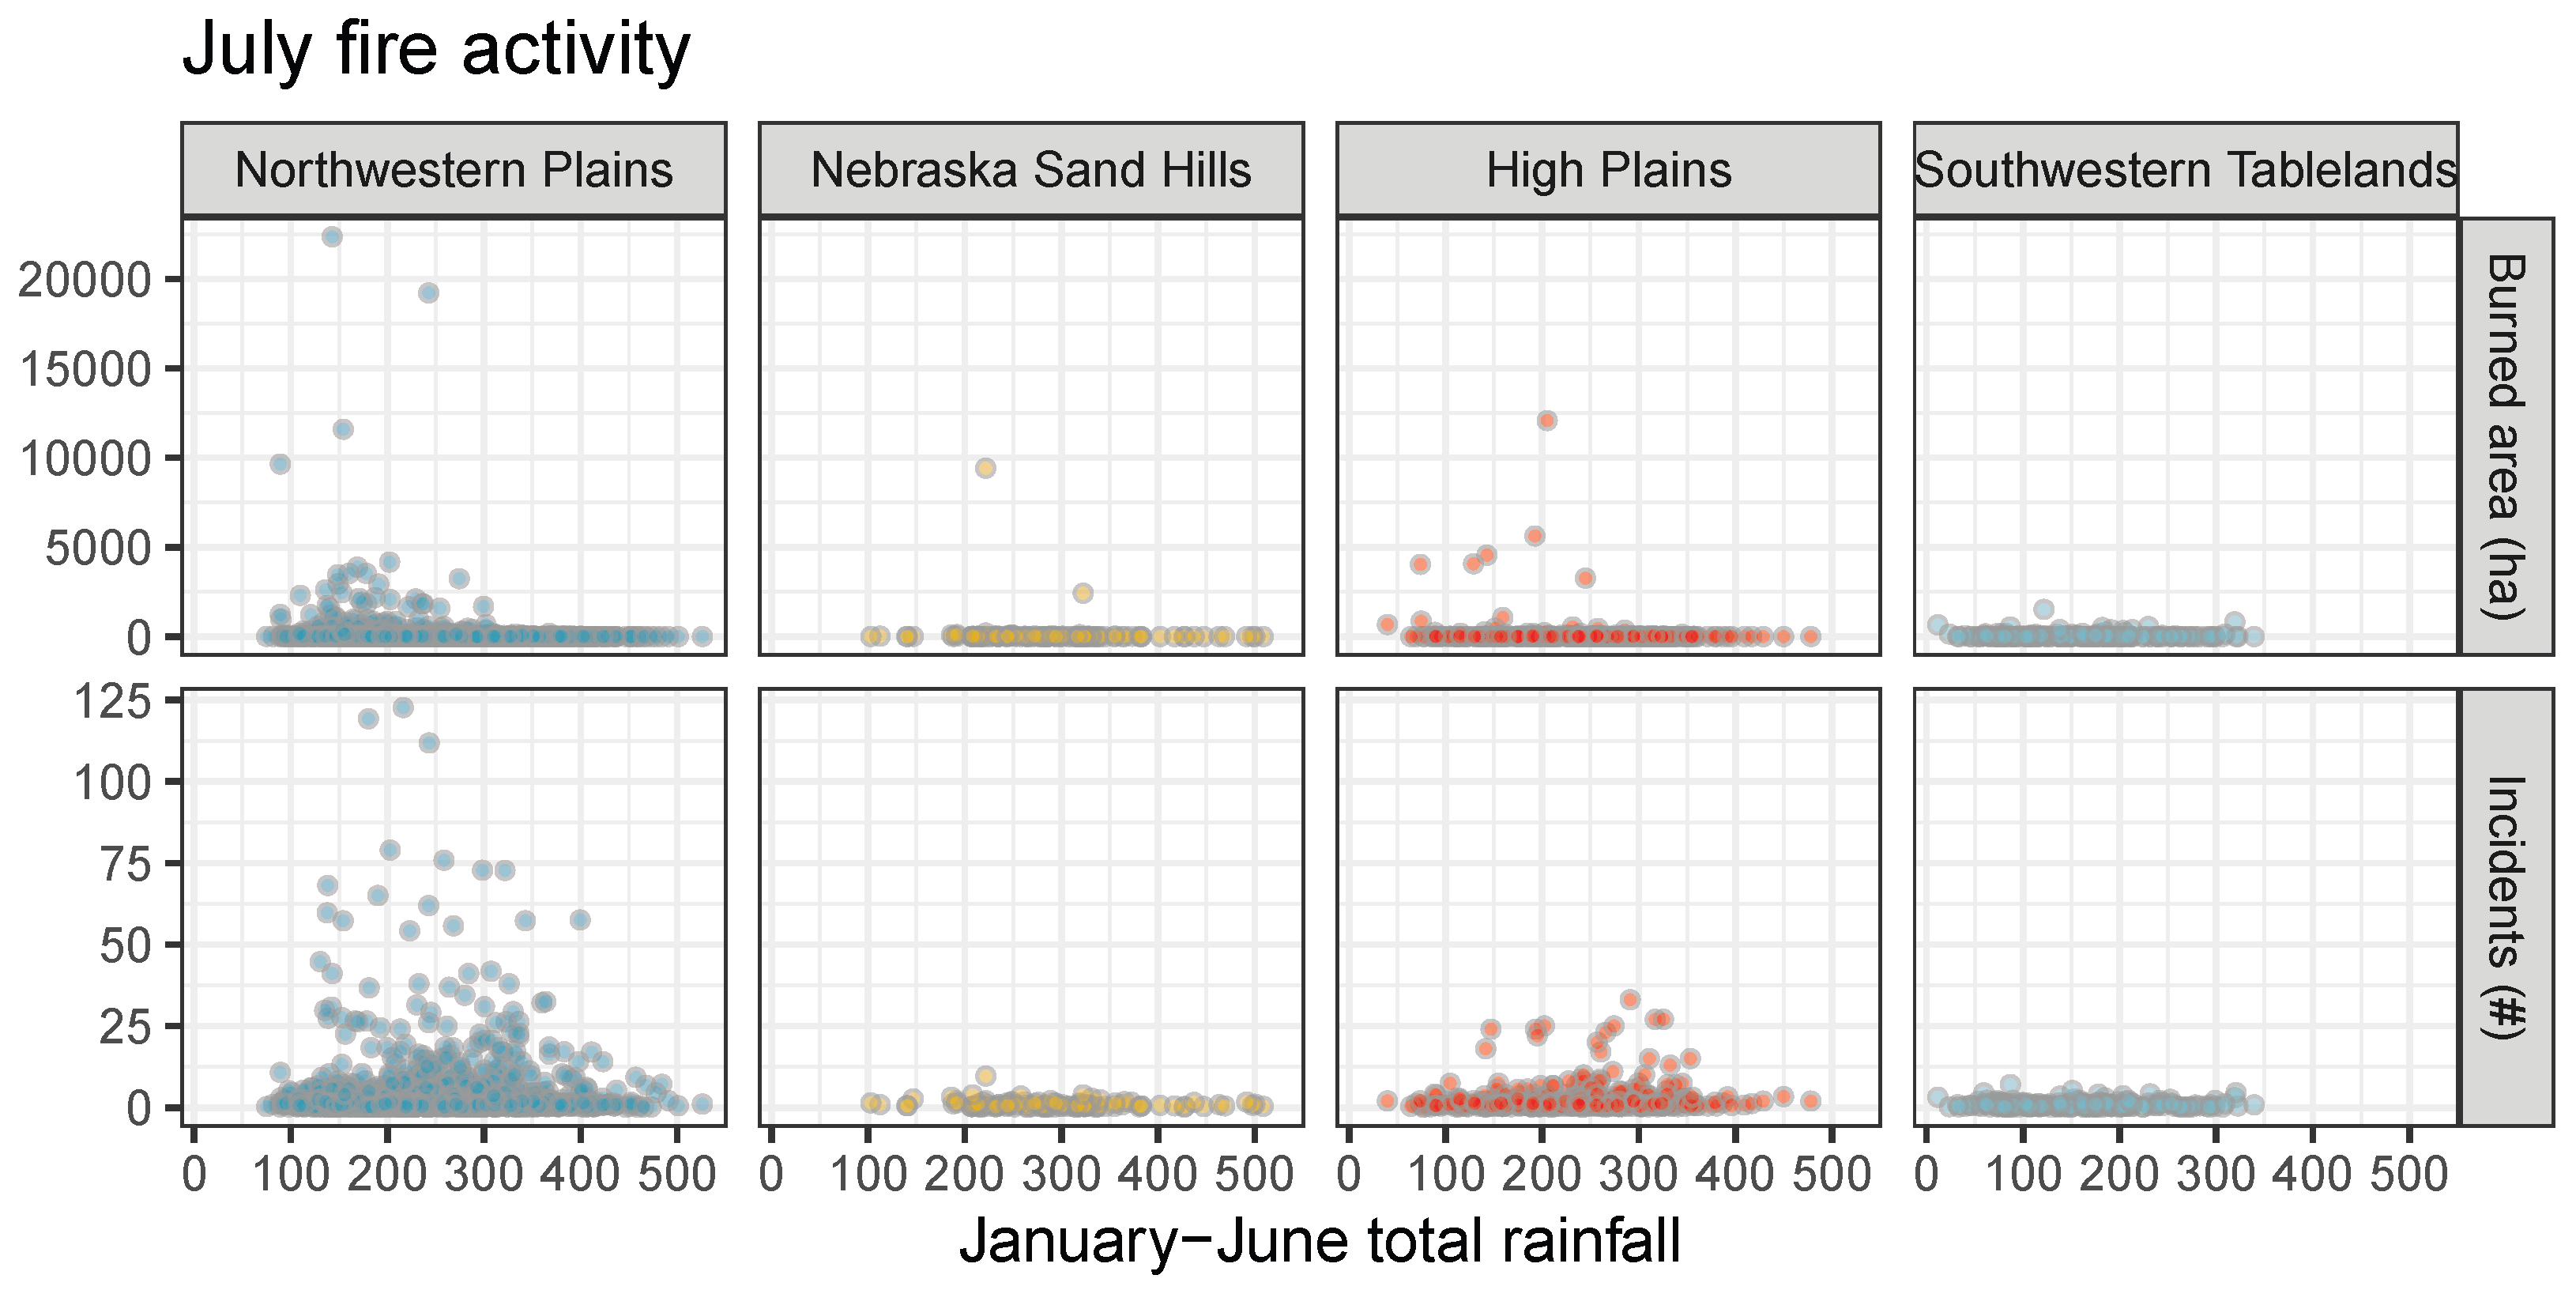
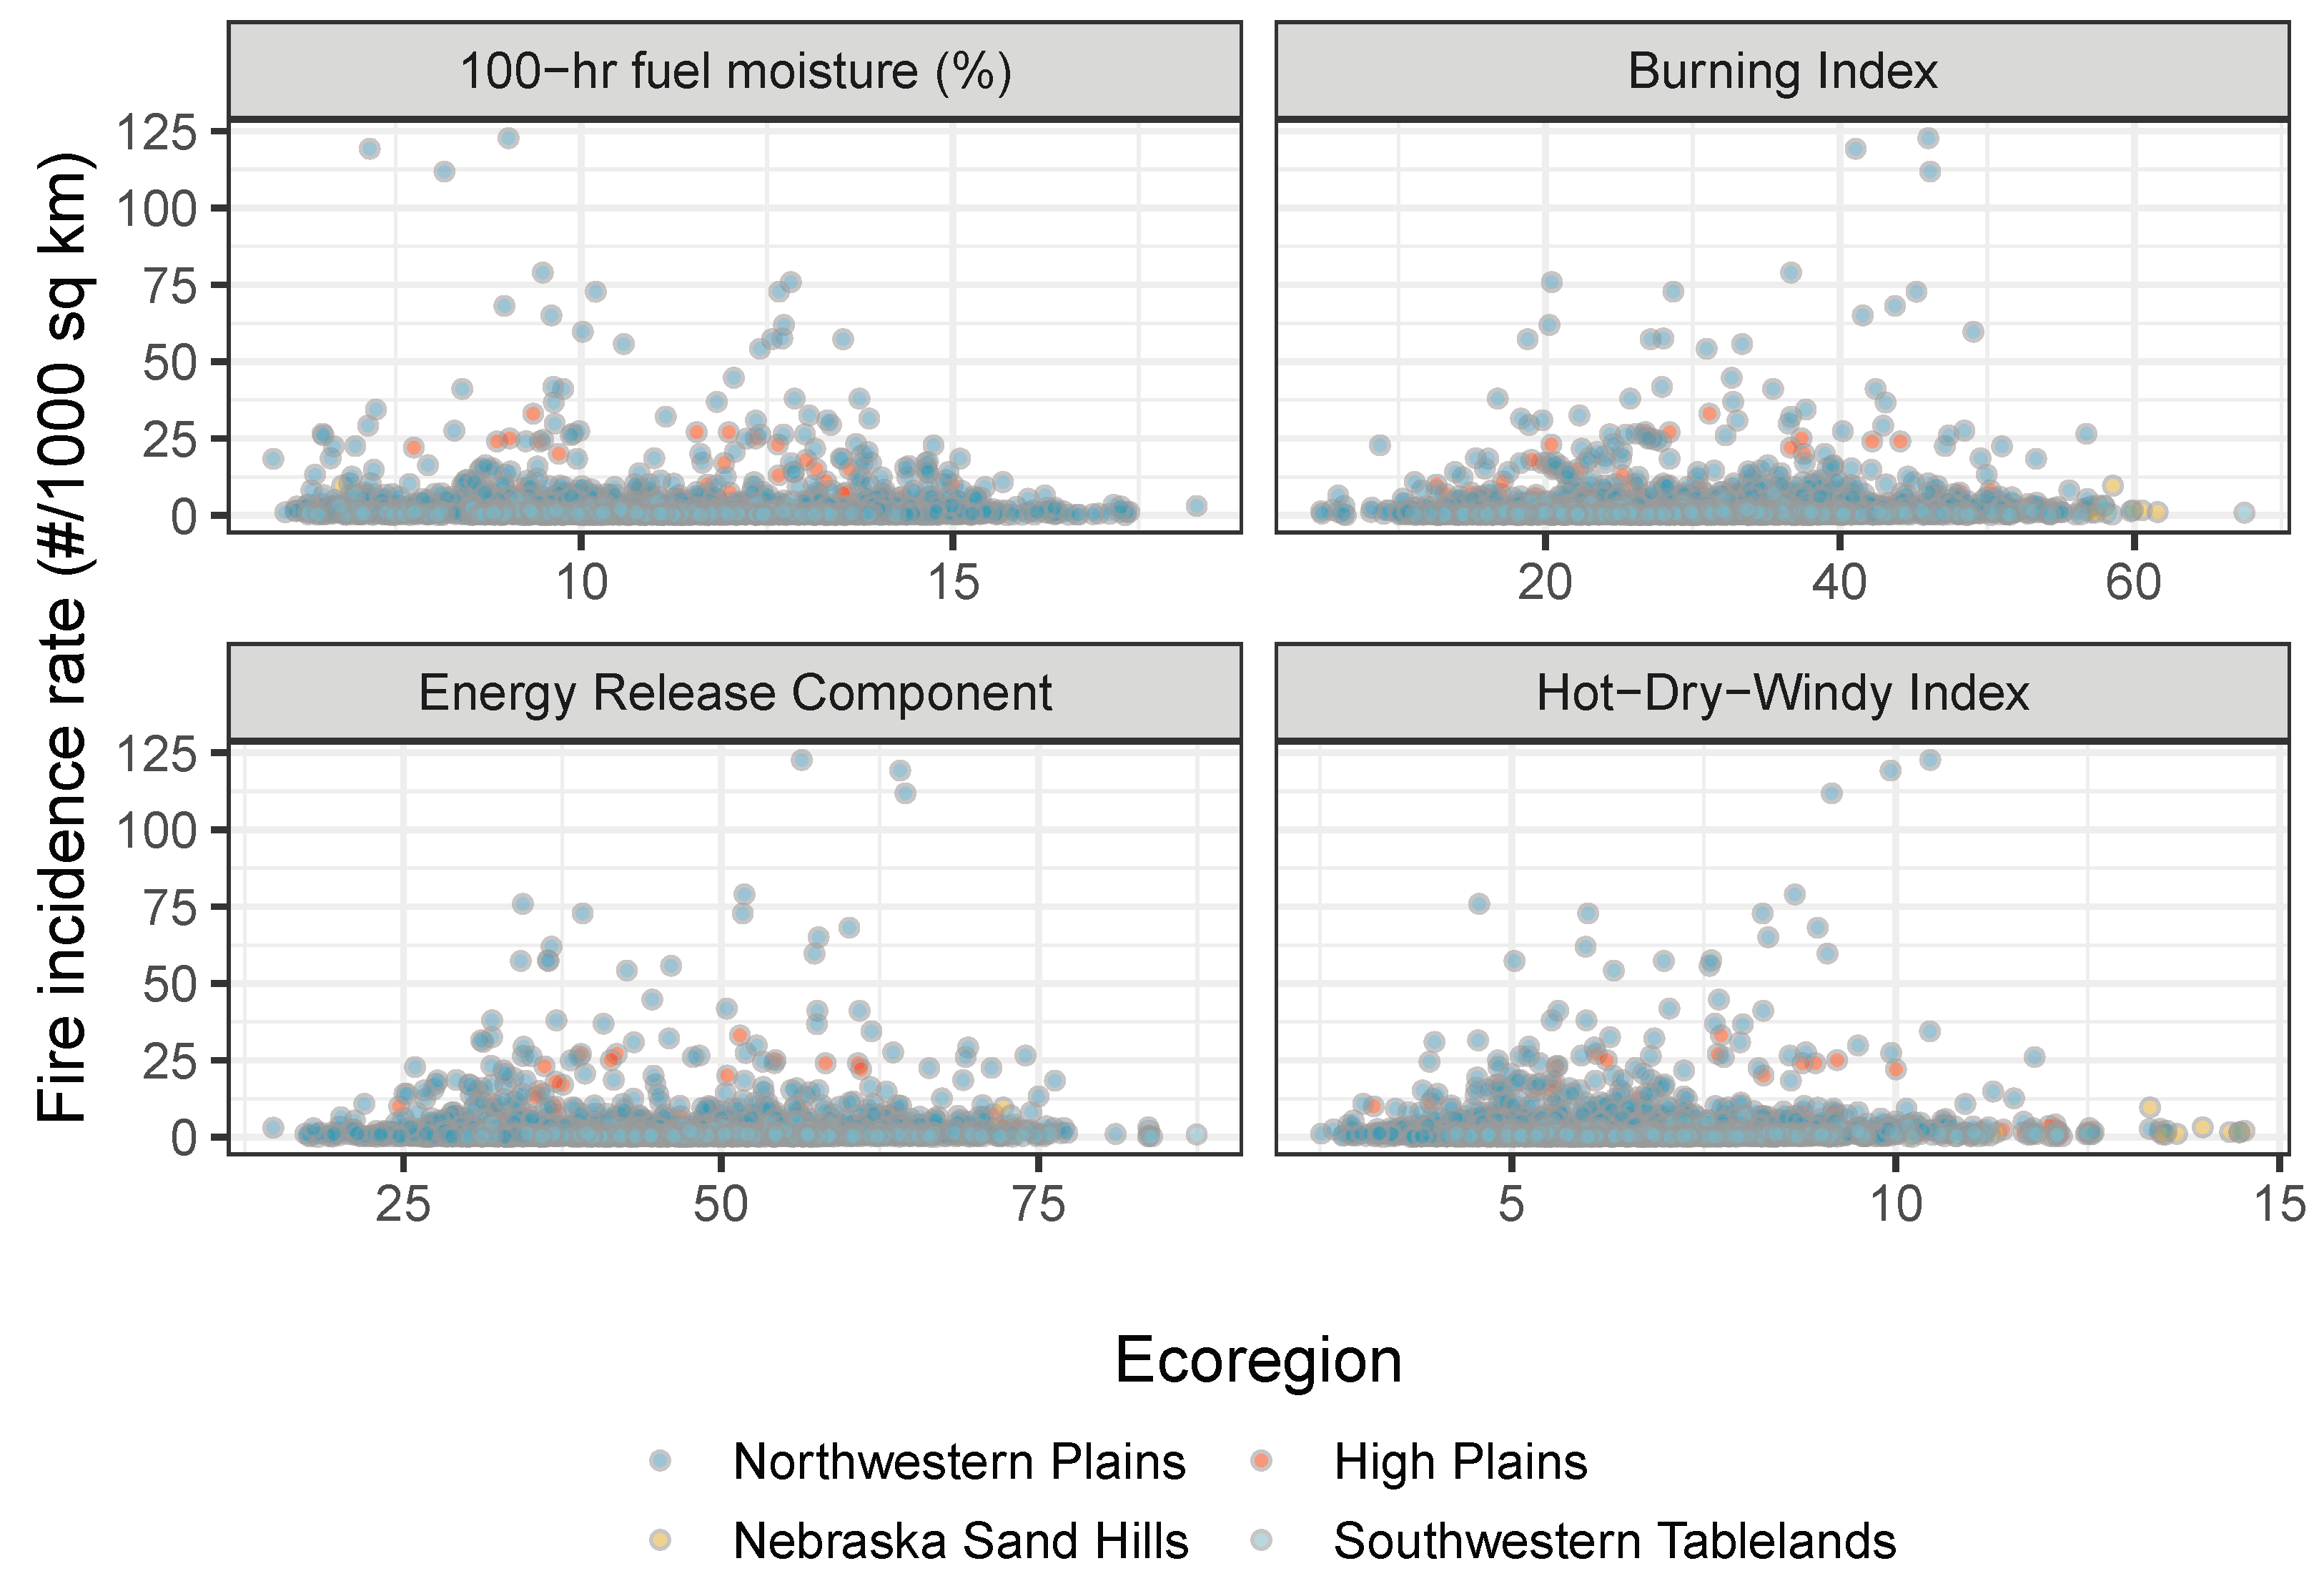
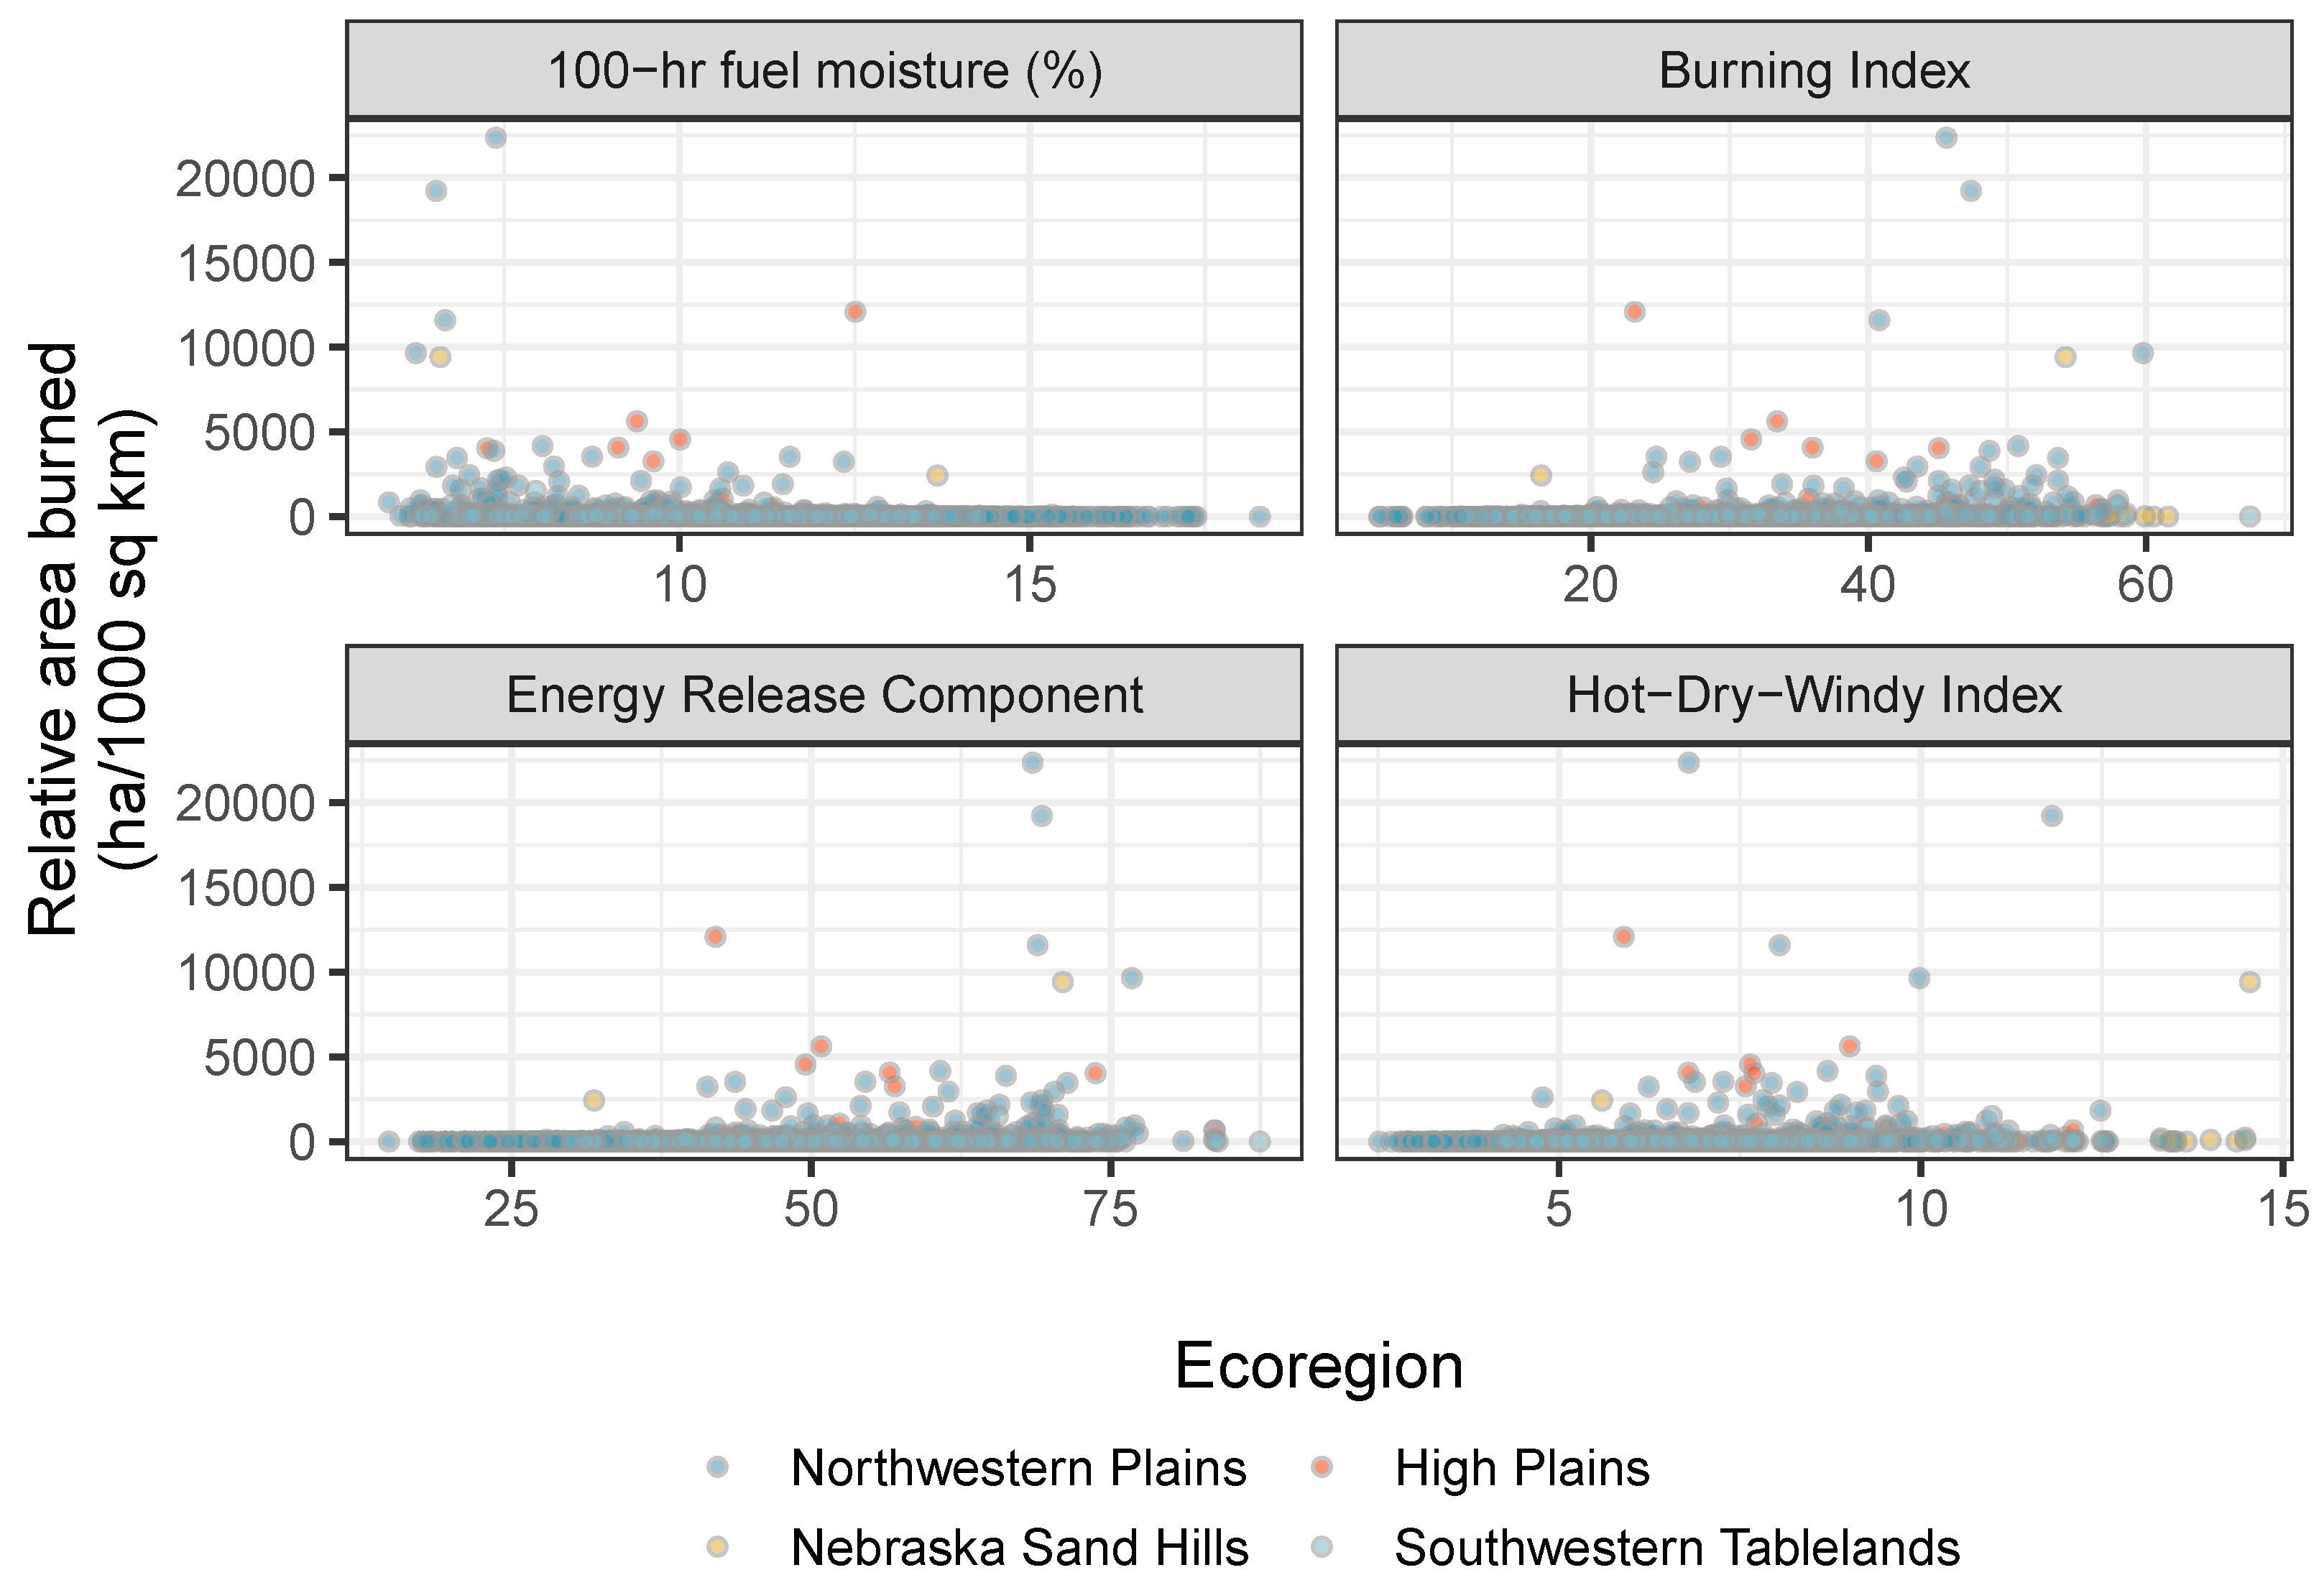
Fire Weather
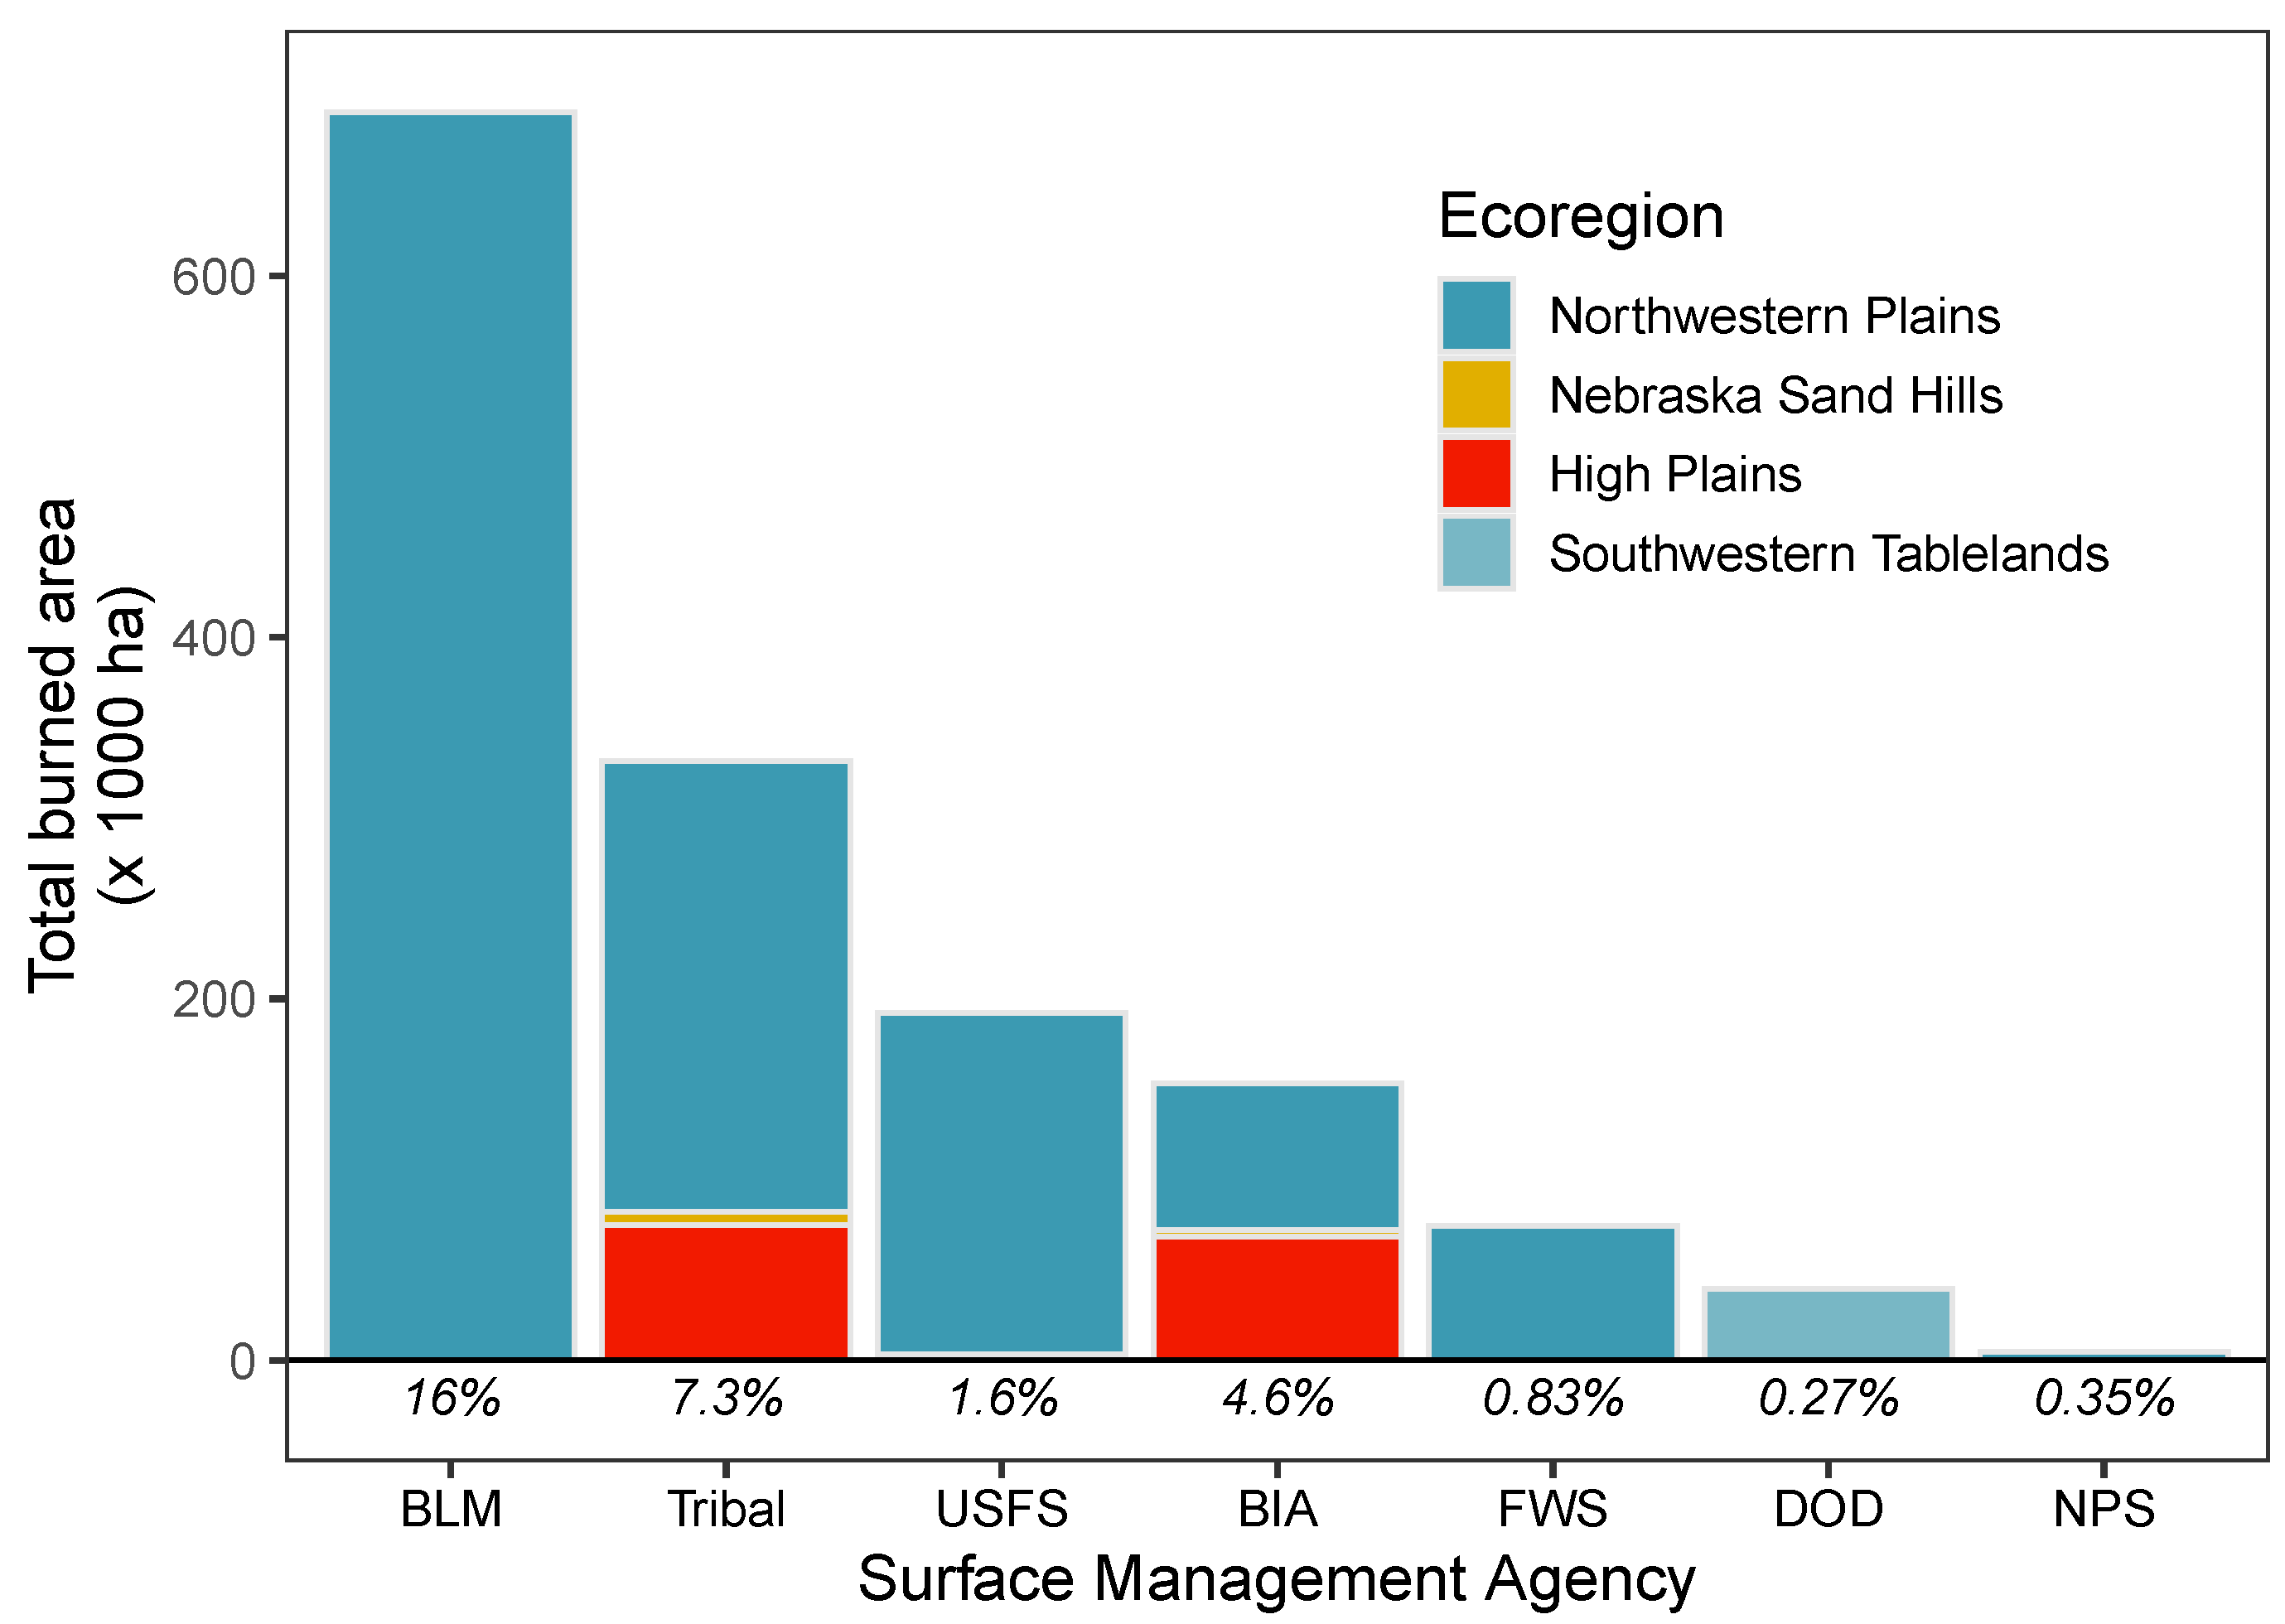
3.2. Wildfire across Jurisdictional Boundaries
3.2.1. General Trends
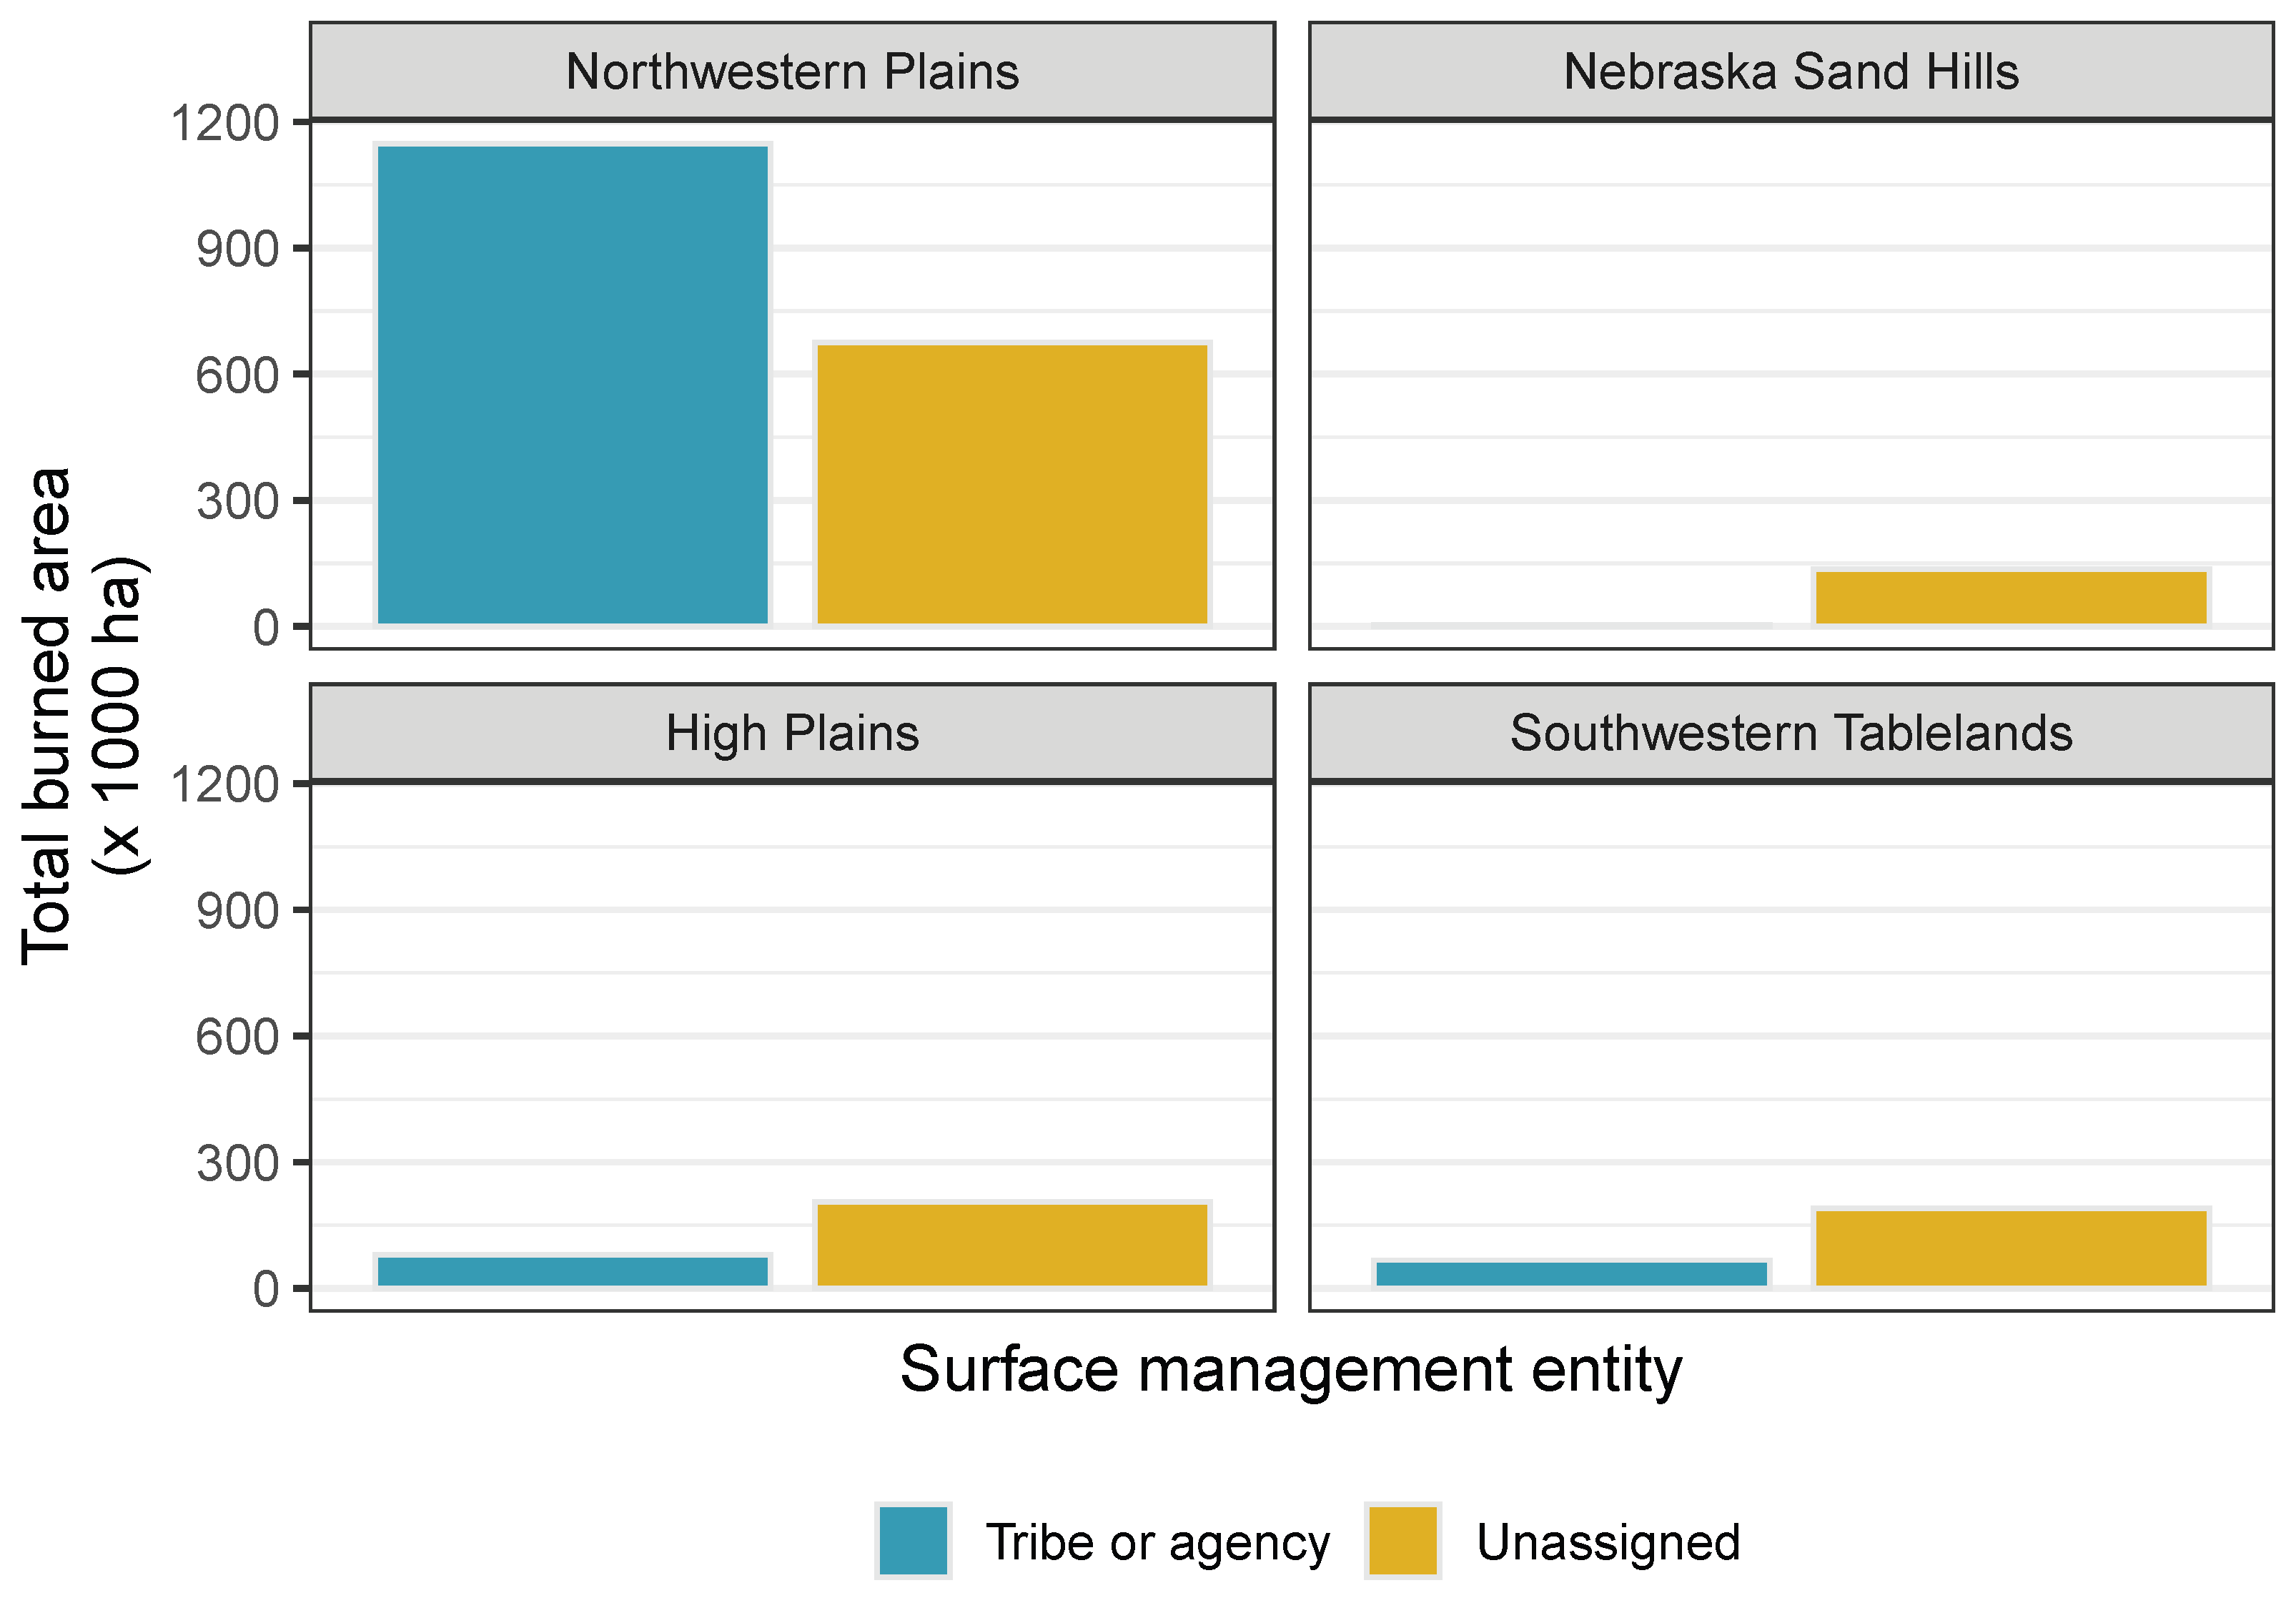
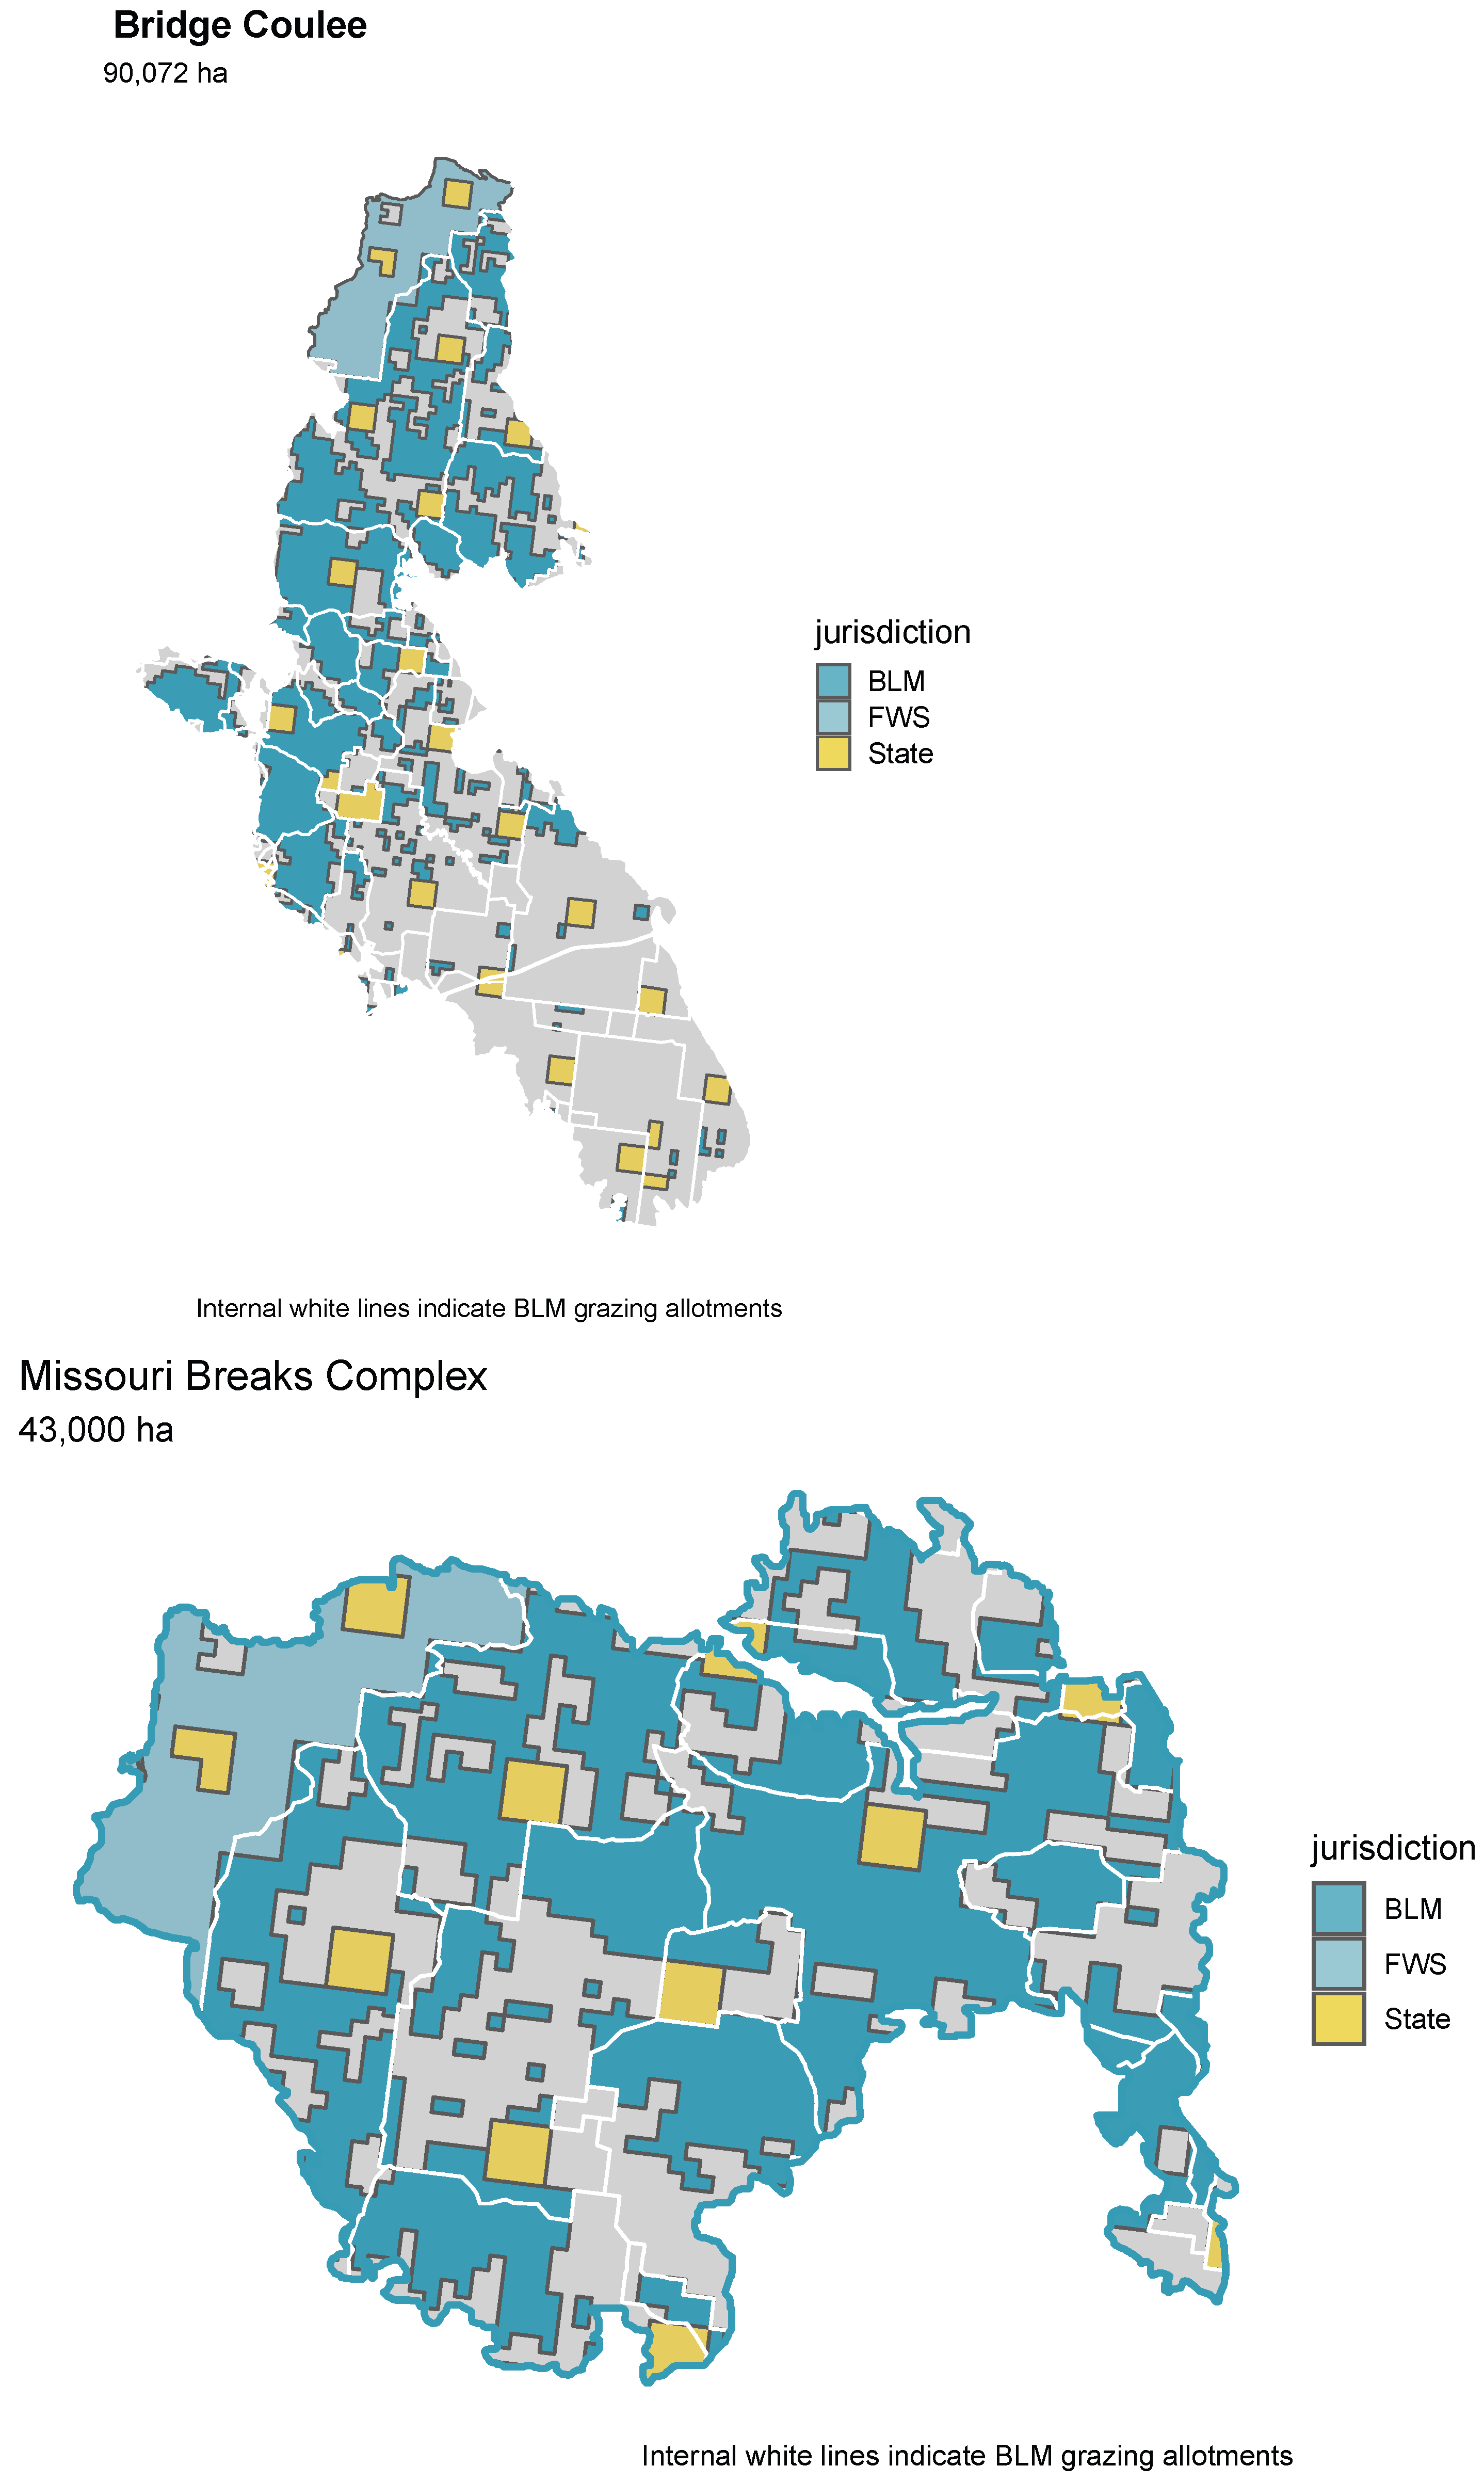
3.2.2. Wildfire and Public Grazing Lands
3.3. On Differences among Pyrogeographic Data and Reporting
4. Conclusions
Author Contributions
Funding
Data Availability Statement
Acknowledgments
Conflicts of Interest
Appendix A. Additional Information on Methodology

| Data Type | Name | Description | Available From | Ref. |
|---|---|---|---|---|
| Biogeographical | Land Resource Regions | Broad landscape divisions based on bio-geo-physical attributes | USDA NRCS 1 | [97] |
| Level III ecoregions | Areas with similar ecosystems and type, quality, and quantity of environmental resources | US EPA 2 | [98] | |
| Environmental | Extent of US rangelands | Land cover from LANDFIRE & FIA | USFS 3 | [45] |
| Rangeland Analysis Platform | Plant cover to functional group 1986–present | https://rangelands.app | [47] | |
| TerraClimate | Monthly historical weather, 1958–2019 | Public Domain 4 | [99] | |
| gridMET | Daily gridded (km) surface weather, 1979–yesterday | Public Domain 5 | [20] | |
| Demographic | Urban areas of the US | Populated areas > 2500 in 2020 | Census Bureau 6 | [100] |
| US decennial census | Total population in 2000, 2010, 2020 | Census Bureau 7 | ||
| Management | Surface Management Agency | Surface land management under state and federal jurisdiction | US BLM 8 | [101] |
| PADUS 2.1 | Protected Areas Database: Fee, declaration, easement, and proclamation | US Geological Survey 9 | [102] | |
| Fires | Fire Occurrence Database | Wildfire records acquired from reporting systems of federal, state, and local fire organizations, 1992–2020. | USFS 10 | [48] |
| MTBS | Fire perimeters > 405 ha, 1984–2021 | USFS 11 | [49] | |
| Inter Agency Fire Perimeters | Final fire perimeters for various state and federal agencies, early 1900s–2021 | NIFC 12 | ||
| National Fire Perimeters | Fire perimeter data to 2019 | US BLM 13 | ||
| S_USA.FinalFirePerimeter | Final fire perimeters for the continental USFS, early 1900s–2021 | USFS 14 |
Appendix B. Additional Data

| Variable | Ecoregion | p | Slope (95% CI) | |
|---|---|---|---|---|
| Fire activity | ||||
| Burned Area | Northwestern Plains | 0.15 | >0.05 | 0.77 (−0.86, 3.5) |
| Nebraska Sand Hills | 0.15 | >0.05 | 0.06 (−0.04, 0.22) | |
| High Plains | 0.24 | >0.05 | 0.21 (−0.02, 0.53) | |
| Southwestern Tablelands | −0.03 | >0.05 | −0.026 (−0.33, 0.64) | |
| Incidents | Northwestern Plains | 0.17 | >0.05 | 12 (−6.1, 40) |
| Nebraska Sand Hills | 0.47 | <0.001 | 1.8 (1, 2.9) | |
| High Plains | 0.67 | <0.001 | 42 (24, 56) | |
| Southwestern Tablelands | 0.36 | <0.01 | 11 (2, 21) | |
| July fire weather | ||||
| 100 h FM | Northwestern Plains | −0.08 | >0.05 | −0.023 (−0.07, 0.03) |
| Nebraska Sand Hills | −0.04 | >0.05 | −0.01 (−0.07, 0.04) | |
| High Plains | −0.16 | >0.05 | −0.029 (−0.07, 0.01) | |
| Southwestern Tablelands | −0.17 | >0.05 | −0.025 (−0.08, 0.01) | |
| BI | Northwestern Plains | 0.13 | >0.05 | 0.14 (−0.08, 0.4) |
| Nebraska Sand Hills | 0.13 | >0.05 | 0.13 (−0.09, 0.39) | |
| High Plains | 0.23 | 0.04 | 0.19 (0.02, 0.38) | |
| Southwestern Tablelands | 0.19 | >0.05 | 0.18 (−0.02, 0.36) | |
| ERC | Northwestern Plains | 0.05 | >0.05 | 0.087 (−0.2, 0.34) |
| Nebraska Sand Hills | 0.01 | >0.05 | 0.006 (−0.19, 0.3) | |
| High Plains | 0.18 | >0.05 | 0.15 (−0.04, 0.41) | |
| Southwestern Tablelands | 0.22 | 0.05 | 0.21 (0.002, 0.43) | |
| HDWI | Northwestern Plains | 0.04 | >0.05 | 0.01 (−0.04, 0.05) |
| Nebraska Sand Hills | 0.01 | >0.05 | 0.003 (−0.04, 0.05) | |
| High Plains | 0.13 | >0.05 | 0.02 (−0.01, 0.04) | |
| Southwestern Tablelands | 0.09 | >0.05 | 0.01 (−0.02, 0.04) | |
| Growing season precipitation | ||||
| Northwestern Plains | 0.26 | 0.02 | 1.9 (0.34, 3.4) | |
| Nebraska Sand Hills | 0.21 | >0.05 | 2.1 (−0.18, 4) | |
| High Plains | 0.12 | >0.05 | 1 (−0.87, 2.3) | |
| Southwestern Tablelands | −0.12 | >0.05 | −0.96 (−2.7, 0.7) | |


| Ecoregion | 25% | 50% | 95% |
|---|---|---|---|
| Northwestern Plains | 0.04 | 0.2 | 65.0 |
| Nebraska Sand Hills | 0.4 | 1.2 | 324.0 |
| High Plains | 0.04 | 0.04 | 12.2 |
| Southwestern Tablelands | 0.04 | 0.04 | 162.0 |
| Ecoregion | Year (Burned Area × 1000 ha) | Year (Incidents) |
|---|---|---|
| Northwestern Plains | 2012 (389) | 2017 (2148) |
| 2017 (270) | 2006 (2043) | |
| 2006 (257) | 2012 (1963) | |
| 2000 (136) | 2020 (1872) | |
| 2020 (135) | 2016 (1865) | |
| Nebraska Sand Hills | 2012 (75) | 2012 (221) |
| 1999 (45) | 2017 (125) | |
| 2000 (41) | 2020 (122) | |
| 1995 (23) | 2018 (71) | |
| 2015 (11) | 2000 (66) | |
| High Plains | 2012 (84) | 2011 (3091) |
| 2006 (53) | 2017 (1963) | |
| 2018 (31) | 2018 (1713) | |
| 2000 (24) | 2020 (1654) | |
| 2002 (18) | 2010 (1156) | |
| Southwestern Tablelands | 2011 (60) | 2011 (625) |
| 2006 (55) | 2017 (594) | |
| 2018 (47) | 2016 (588) | |
| 2020 (30) | 2018 (516) | |
| 2008 (29) | 2013 (454) |


| County, State | Year | Incident Rate |
|---|---|---|
| Todd County, SD | 2006 | 123 |
| Todd County, SD | 2017 | 112 |
| Oglala Lakota County, SD | 2012 | 119 |


| Ecoregion | County, State | Year | RBA | BI | ERC | FM | HDWI |
|---|---|---|---|---|---|---|---|
| Northwestern Plains | Big Horn, MT | 2006 | 22,359 | 45.6 | 68.5 | 7.4 | 6.8 |
| Northwestern Plains | Todd, SD | 2012 | 19,215 | 47.4 | 69.3 | 6.5 | 11.8 |
| High Plains | Scotts Bluff, NE | 2000 | 12,082 | 23.2 | 42.0 | 12.5 | 5.9 |
| Northwestern Plains | Yellowstone, MT | 2006 | 11,592 | 40.8 | 68.9 | 6.7 | 8.0 |
| Northwestern Plains | Garfield, MT | 2017 | 9646 | 59.8 | 76.8 | 6.2 | 10.0 |
| Nebraska Sand Hills | Brown, NE | 2012 | 9415 | 54.2 | 71.0 | 6.6 | 14.5 |
| High Plains | Dawes, NE | 2006 | 5624 | 33.4 | 50.8 | 9.4 | 9.0 |
References
- Bowman, D.M.; O’Brien, J.A.; Goldammer, J.G. Pyrogeography and the Global Quest for Sustainable Fire Management. Annu. Rev. Environ. Resour. 2013, 38, 57–80. [Google Scholar] [CrossRef]
- Bond, W.J. Out of the Shadows: Ecology of Open Ecosystems. Plant Ecol. Divers. 2022, 14, 205–222. [Google Scholar] [CrossRef]
- Bowman, D.M.; Balch, J.; Artaxo, P.; Bond, W.J.; Cochrane, M.A.; D’antonio, C.M.; DeFries, R.; Johnston, F.H.; Keeley, J.E.; Krawchuk, M.A. The Human Dimension of Fire Regimes on Earth. J. Biogeogr. 2011, 38, 2223–2236. [Google Scholar] [CrossRef] [PubMed]
- Balch, J.K.; Bradley, B.A.; Abatzoglou, J.T.; Nagy, R.C.; Fusco, E.J.; Mahood, A.L. Human-Started Wildfires Expand the Fire Niche across the United States. Proc. Natl. Acad. Sci. USA 2017, 114, 2946. [Google Scholar] [CrossRef]
- Abatzoglou, J.T.; Balch, J.K.; Bradley, B.A.; Kolden, C.A. Human-Related Ignitions Concurrent with High Winds Promote Large Wildfires across the USA. Int. J. Wildland Fire 2018, 27, 377–386. [Google Scholar] [CrossRef]
- Barbero, R.; Abatzoglou, J.T.; Larkin, N.K.; Kolden, C.A.; Stocks, B. Climate Change Presents Increased Potential for Very Large Fires in the Contiguous United States. Int. J. Wildland Fire 2015, 24, 892. [Google Scholar] [CrossRef]
- Zennaro, P.; Kehrwald, N.; Marlon, J.; Ruddiman, W.F.; Brücher, T.; Agostinelli, C.; Dahl-Jensen, D.; Zangrando, R.; Gambaro, A.; Barbante, C. Europe on Fire Three Thousand Years Ago: Arson or Climate? Geophys. Res. Lett. 2015, 42, 5023–5033. [Google Scholar] [CrossRef]
- Brey, S.J.; Barnes, E.A.; Pierce, J.R.; Wiedinmyer, C.; Fischer, E.V. Environmental Conditions, Ignition Type, and Air Quality Impacts of Wildfires in the Southeastern and Western United States. Earth’s Future 2018, 6, 1442–1456. [Google Scholar] [CrossRef] [PubMed]
- McGranahan, D.A.; Wonkka, C.L. Ecology of Fire-Dependent Ecosystems: Wildland Fire Science, Policy, and Management; CRC Press: Boca Raton, FL, USA, 2021. [Google Scholar]
- Pausas, J.G.; Paula, S. Fuel Shapes the Fire-Climate Relationship: Evidence from Mediterranean Ecosystems. Glob. Ecol. Biogeogr. 2012, 21, 1074–1082. [Google Scholar] [CrossRef]
- Brown, P.M.; Sieg, C.H. Historical Variability in Fire at the Ponderosa Pine - Northern Great Plains Prairie Ecotone, Southeastern Black Hills, South Dakota. Écoscience 1999, 6, 539–547. [Google Scholar] [CrossRef]
- Heyerdahl, E.K.; Brubaker, L.B.; Agee, J.K. Spatial Controls of Historical Fire Regimes: A Multiscale Example from the Interior West, USA. Ecology 2001, 82, 660–678. [Google Scholar] [CrossRef]
- Reid, A.M.; Fuhlendorf, S.D.; Weir, J.R. Weather Variables Affecting Oklahoma Wildfires. Rangel. Ecol. Manag. 2010, 63, 599–603. [Google Scholar] [CrossRef]
- Falk, D.A.; Heyerdahl, E.K.; Brown, P.M.; Farris, C.; Fulé, P.Z.; McKenzie, D.; Swetnam, T.W.; Taylor, A.H.; Horne, M.L.V. Multi-Scale Controls of Historical Forest-Fire Regimes: New Insights from Fire-Scar Networks. Front. Ecol. Environ. 2011, 9, 446–454. [Google Scholar] [CrossRef] [PubMed]
- Deeming, J.E.; Burgan, R.E.; Cohen, J.D. The National Fire-Danger Rating System—1978; General Technical Report INT-GTR-39; US Forest Service, Intermountain Forest and Range Experiment Station: Ogden, UT, USA, 1977.
- Bradshaw, L.S.; Deeming, J.E.; Burgan, R.E.; Cohen, J.D. The 1978 National Fire-Danger Rating System: Technical Documentation; General Technical Report GTR-INT-169; US Forest Service, Intermountain Forest and Range Experiment Station: Ogden, UT, USA, 1984.
- Fosberg, M.A.; Schroeder, M.J. Fine Herbaceous Fuels in Fire-Danger Rating; Technical Report Res. Note RM-185; Digital Public Library of America: Fort Collins, CO, USA, 1971. [Google Scholar]
- Srock, A.F.; Charney, J.J.; Potter, B.E.; Goodrick, S.L. The Hot-Dry-Windy Index: A New Fire Weather Index. Atmosphere 2018, 9, 279. [Google Scholar] [CrossRef]
- Higuera, P.E.; Abatzoglou, J.T. Record-Setting Climate Enabled the Extraordinary 2020 Fire Season in the Western United States. Glob. Chang. Biol. 2021, 27, 1–2. [Google Scholar] [CrossRef] [PubMed]
- Abatzoglou, J.T. Development of Gridded Surface Meteorological Data for Ecological Applications and Modelling. Int. J. Climatol. 2013, 33, 121–131. [Google Scholar] [CrossRef]
- Aldrich, S.R.; Lafon, C.W.; Grissino-Mayer, H.D.; DeWeese, G.G. Fire History and Its Relations with Land Use and Climate over Three Centuries in the Central Appalachian Mountains, USA. J. Biogeogr. 2014, 41, 2093–2104. [Google Scholar] [CrossRef]
- Nagy, R.C.; Fusco, E.; Bradley, B.; Abatzoglou, J.T.; Balch, J. Human-Related Ignitions Increase the Number of Large Wildfires across U.S. Ecoregions. Fire 2018, 1, 4. [Google Scholar] [CrossRef]
- Hantson, S.; Andela, N.; Goulden, M.L.; Randerson, J.T. Human-Ignited Fires Result in More Extreme Fire Behavior and Ecosystem Impacts. Nat. Commun. 2022, 13, 2717. [Google Scholar] [CrossRef]
- Higuera, P.E.; Cook, M.C.; Balch, J.K.; Stavros, E.N.; Mahood, A.L.; St. Denis, L.A. Shifting Social-Ecological Fire Regimes Explain Increasing Structure Loss from Western Wildfires. PNAS Nexus 2023, 2, pgad005. [Google Scholar] [CrossRef] [PubMed]
- Keane, R.E.; Agee, J.K.; Fulé, P.; Keeley, J.E.; Key, C.; Kitchen, S.G.; Miller, R.; Schulte, L.A. Ecological Effects of Large Fires on US Landscapes: Benefit or Catastrophe? Int. J. Wildland Fire 2008, 17, 696. [Google Scholar] [CrossRef]
- Alexandre, P.M.; Stewart, S.I.; Keuler, N.S.; Clayton, M.K.; Mockrin, M.H.; Bar-Massada, A.; Syphard, A.D.; Radeloff, V.C. Factors Related to Building Loss Due to Wildfires in the Conterminous United States. Ecol. Appl. 2016, 26, 2323–2338. [Google Scholar] [CrossRef]
- Balch, J.K.; Bradley, B.A.; D’Antonio, C.M.; Gómez-Dans, J. Introduced Annual Grass Increases Regional Fire Activity across the Arid Western USA (1980–2009). Glob. Chang. Biol. 2013, 19, 173–183. [Google Scholar] [CrossRef]
- Stavros, E.N.; Abatzoglou, J.; Larkin, N.K.; McKenzie, D.; Steel, E.A. Climate and Very Large Wildland Fires in the Contiguous Western USA. Int. J. Wildland Fire 2014, 23, 899. [Google Scholar] [CrossRef]
- Wright, C.K.; Wimberly, M.C. Recent Land Use Change in the Western Corn Belt Threatens Grasslands and Wetlands. Proc. Natl. Acad. Sci. USA 2013, 110, 4134–4139. [Google Scholar] [CrossRef] [PubMed]
- Ratajczak, Z.; Nippert, J.B.; Briggs, J.M.; Blair, J.M. Fire Dynamics Distinguish Grasslands, Shrublands and Woodlands as Alternative Attractors in the Central Great Plains of North America. J. Ecol. 2014, 102, 1374–1385. [Google Scholar] [CrossRef]
- Dennison, P.E.; Brewer, S.C.; Arnold, J.D.; Moritz, M.A. Large Wildfire Trends in the Western United States, 1984-2011. Geophys. Res. Lett. 2014, 41, 2928–2933. [Google Scholar] [CrossRef]
- Donovan, V.M.; Wonkka, C.L.; Twidwell, D. Surging Wildfire Activity in a Grassland Biome. Geophys. Res. Lett. 2017, 44, 5986–5993. [Google Scholar] [CrossRef]
- Falke, J.A.; Fausch, K.D.; Magelky, R.; Aldred, A.; Durnford, D.S.; Riley, L.K.; Oad, R. The Role of Groundwater Pumping and Drought in Shaping Ecological Futures for Stream Fishes in a Dryland River Basin of the Western Great Plains, USA. Ecohydrology 2011, 4, 682–697. [Google Scholar] [CrossRef]
- Wilmer, H.; Augustine, D.J.; Derner, J.D.; Fernández-Giménez, M.E.; Briske, D.D.; Roche, L.M.; Tate, K.W.; Miller, K.E. Diverse Management Strategies Produce Similar Ecological Outcomes on Ranches in Western Great Plains: Social-Ecological Assessment. Rangel. Ecol. Manag. 2018, 71, 626–636. [Google Scholar] [CrossRef]
- Wilmer, H.; Fernández-Giménez, M.E.; Ghajar, S.; Taylor, P.L.; Souza, C.; Derner, J.D. Managing for the Middle: Rancher Care Ethics under Uncertainty on Western Great Plains Rangelands. Agric. Hum. Values 2020, 37, 699–718. [Google Scholar] [CrossRef]
- Guyette, R.P.; Stambaugh, M.C.; Marschall, J.; Abadir, E. An analytic approach to climate dynamics and fire frequency in the Great Plains. Great Plains Res. 2015, 25, 139–150. [Google Scholar] [CrossRef]
- Roos, C.I.; Zedeño, M.N.; Hollenback, K.L.; Erlick, M.M. Indigenous impacts on North American Great Plains fire regimes of the past millennium. Proc. Natl. Acad. Sci. USA 2018, 115, 8143–8148. [Google Scholar] [CrossRef]
- Whicker, A.D.; Detling, J.K. Ecological consequences of prairie dog disturbances. BioScience 1988, 38, 778–785. [Google Scholar] [CrossRef]
- Heimbuch, N.G.; McGranahan, D.A.; Wonkka, C.L.; Vermeire, L.T.; Branson, D.H. Grasshopper abundance and offtake increase after prescribed fire in semi-arid grassland. Int. J. Wildland Fire 2023, 32, 1828–1833. [Google Scholar] [CrossRef]
- Wendt, J.A.; McWethy, D.B.; Hempson, G.P.; Brookshire, E.J.; Fuhlendorf, S.D. Past and present biomass consumption by herbivores and fire across productivity gradients in North America. Environ. Res. Lett. 2023, 18, 124038. [Google Scholar] [CrossRef]
- R Core Team. R: A Language and Environment for Statistical Computing; R Foundation for Statistical Computing: Vienna, Austria, 2020. [Google Scholar]
- Walker, K.E. Tigris: An R Package to Access and Work with Geographic Data from the US Census Bureau. R J. 2016, 8, 231–242. [Google Scholar] [CrossRef]
- Walker, K.; Herman, M. Tidycensus: Load US Census Boundary and Attribute Data as ’Tidyverse’ and ’Sf’-Ready Data Frames. 2023. Available online: https://CRAN.R-project.org/package=tidycensus (accessed on 22 November 2022).
- Johnson, M. climateR: An R Package for Getting Point and Gridded Climate Data by AOI, 2021.
- Reeves, M.C.; Mitchell, J.E. Extent of Coterminous US Rangelands: Quantifying Implications of Differing Agency Perspectives. Rangel. Ecol. Manag. 2011, 64, 585–597. [Google Scholar] [CrossRef]
- Hijmans, R.J.; Bivand, R.; Forner, K.; Ooms, J.; Pebesma, E.; Sumner, M.D. Package ‘Terra’, 2022.
- Allred, B.W.; Bestelmeyer, B.T.; Boyd, C.S.; Brown, C.; Davies, K.W.; Duniway, M.C.; Ellsworth, L.M.; Erickson, T.A.; Fuhlendorf, S.D.; Griffiths, T.V. Improving Landsat Predictions of Rangeland Fractional Cover with Multitask Learning and Uncertainty. Methods Ecol. Evol. 2021, 12, 841–849. [Google Scholar] [CrossRef]
- Short, K.C. Spatial Wildfire Occurrence Data for the United States, 1992–2020 [FPA_FOD_20221014], 6th ed.; Technical report; Forest Service Research Data Archive: Fort Collins, CO, USA, 2021.
- Eidenshink, J.; Schwind, B.; Brewer, K.; Zhu, Z.L.; Quayle, B.; Howard, S. A Project for Monitoring Trends in Burn Severity. Fire Ecol. 2007, 3, 3–21. [Google Scholar] [CrossRef]
- Millard, S.P. EnvStats: An R Package for Environmental Statistics; Springer: New York, NY, USA, 2013. [Google Scholar]
- Chas-Amil, M.; Prestemon, J.; McClean, C.; Touza, J. Human-Ignited Wildfire Patterns and Responses to Policy Shifts. Appl. Geogr. 2015, 56, 164–176. [Google Scholar] [CrossRef]
- Narayanaraj, G.; Wimberly, M.C. Influences of Forest Roads on the Spatial Patterns of Human- and Lightning-Caused Wildfire Ignitions. Appl. Geogr. 2012, 32, 878–888. [Google Scholar] [CrossRef]
- Yocom, L.L.; Jenness, J.; Fulé, P.Z.; Thode, A.E. Previous Fires and Roads Limit Wildfire Growth in Arizona and New Mexico, U.S.A. For. Ecol. Manag. 2019, 449, 117440. [Google Scholar] [CrossRef]
- Syphard, A.D.; Radeloff, V.C.; Keeley, J.E.; Hawbaker, T.J.; Clayton, M.K.; Stewart, S.I.; Hammer, R.B. Human Influence on California Fire Regimes. Ecol. Appl. 2007, 17, 1388–1402. [Google Scholar] [CrossRef]
- Syphard, A.D.; Radeloff, V.C.; Hawbaker, T.J.; Stewart, S.I. Conservation Threats Due to Human-Caused Increases in Fire Frequency in Mediterranean-Climate Ecosystems. Conserv. Biol. 2009, 23, 758–769. [Google Scholar] [CrossRef]
- Price, O.; Bradstock, R. Countervailing Effects of Urbanization and Vegetation Extent on Fire Frequency on the Wildland Urban Interface: Disentangling Fuel and Ignition Effects. Landsc. Urban Plan. 2014, 130, 81–88. [Google Scholar] [CrossRef]
- Ricotta, C.; Bajocco, S.; Guglietta, D.; Conedera, M. Assessing the Influence of Roads on Fire Ignition: Does Land Cover Matter? Fire 2018, 1, 24. [Google Scholar] [CrossRef]
- Jones, N.F.; Pejchar, L. Comparing the Ecological Impacts of Wind and Oil & Gas Development: A Landscape Scale Assessment. PLoS ONE 2013, 8, e81391. [Google Scholar] [CrossRef]
- Baynard, C.W.; Mjachina, K.; Richardson, R.D.; Schupp, R.W.; Lambert, J.D.; Chibilyev, A.A. Energy Development in Colorado’s Pawnee National Grasslands: Mapping and Measuring the Disturbance Footprint of Renewables and Non-Renewables. Environ. Manag. 2017, 59, 995–1016. [Google Scholar] [CrossRef] [PubMed]
- Spiess, J.; McGranahan, D.A.; Whippo, C.; Poling, B.; Daigh, A.L.M.; Hovick, T. Bird and Invertebrate Communities Appear Unaffected by Fracking Traffic along Rural Roads despite Dust Emissions. Ambio 2020, 49, 605–615. [Google Scholar] [CrossRef]
- Littell, J.S.; McKenzie, D.; Peterson, D.L.; Westerling, A.L. Climate and Wildfire Area Burned in Western US Ecoprovinces, 1916–2003. Ecol. Appl. 2009, 19, 1003–1021. [Google Scholar] [CrossRef]
- Abatzoglou, J.T.; Kolden, C.A. Relationships between Climate and Macroscale Area Burned in the Western United States. Int. J. Wildland Fire 2013, 22, 1003. [Google Scholar] [CrossRef]
- Gedalof, Z.; Peterson, D.L.; Mantua, N.J. Atmospheric, Climatic, and Ecological Controls on Extreme Wildfire Years in the Northwestern United States. Ecol. Appl. 2005, 15, 154–174. [Google Scholar] [CrossRef]
- Abatzoglou, J.T.; Williams, A.P. Impact of Anthropogenic Climate Change on Wildfire across Western US Forests. Proc. Natl. Acad. Sci. USA 2016, 113, 11770–11775. [Google Scholar] [CrossRef]
- Wendt, J.A.; McWethy, D.B.; Widga, C.; Shuman, B.N. Large-scale climatic drivers of bison distribution and abundance in North America since the Last Glacial Maximum. Quat. Sci. Rev. 2022, 284, 107472. [Google Scholar] [CrossRef]
- McMillan, N.A.; Fuhlendorf, S.D.; Luttbeg, B.; Goodman, L.E.; Davis, C.A.; Allred, B.W.; Hamilton, R.G. Bison movements change with weather: Implications for their continued conservation in the Anthropocene. Ecol. Evol. 2022, 12, e9586. [Google Scholar] [CrossRef]
- Derner, J.; Briske, D.; Reeves, M.; Brown-Brandl, T.; Meehan, M.; Blumenthal, D.; Travis, W.; Augustine, D.; Wilmer, H.; Scasta, D.; et al. Vulnerability of grazing and confined livestock in the Northern Great Plains to projected mid-and late-twenty-first century climate. Clim. Chang. 2018, 146, 19–32. [Google Scholar] [CrossRef]
- Seager, R.; Hooks, A.; Williams, A.P.; Cook, B.; Nakamura, J.; Henderson, N. Climatology, variability, and trends in the US vapor pressure deficit, an important fire-related meteorological quantity. J. Appl. Meteorol. Climatol. 2015, 54, 1121–1141. [Google Scholar] [CrossRef]
- Predictive Services Intelligence Operations. ICS-209 PROGRAM (NIMS) User’s Guide; Technical Report Version 4.0; National Interagency Coordination Center, National Interagency Fire Center: Boise, ID, USA, 2017.
- Davis, E.J.; Huber-Stearns, H.; Cheng, A.S.; Jacobson, M. Transcending Parallel Play: Boundary Spanning for Collective Action in Wildfire Management. Fire 2021, 4, 41. [Google Scholar] [CrossRef]
- Hiers, J.K.; O’Brien, J.J.; Varner, J.M.; Butler, B.W.; Dickinson, M.; Furman, J.; Gallagher, M.; Godwin, D.; Goodrick, S.L.; Hood, S.M. Prescribed Fire Science: The Case for a Refined Research Agenda. Fire Ecol. 2020, 16, 11. [Google Scholar] [CrossRef]
- Van Wagtendonk, J.W. The History and Evolution of Wildland Fire Use. Fire Ecol. 2007, 3, 3–17. [Google Scholar] [CrossRef]
- Pietruszka, B.M.; Young, J.D.; Short, K.C.; St. Denis, L.A.; Thompson, M.P.; Calkin, D.E. Consequential Lightning-Caused Wildfires and the “Let Burn” Narrative. Fire Ecol. 2023, 19, 50. [Google Scholar] [CrossRef]
- Davis, E.J.; Huber-Stearns, H.; Caggiano, M.; McAvoy, D.; Cheng, A.S.; Deak, A.; Evans, A. Managed Wildfire: A Strategy Facilitated by Civil Society Partnerships and Interagency Cooperation. Soc. Nat. Resour. 2022, 35, 914–932. [Google Scholar] [CrossRef]
- Huber-Stearns, H.R.; Davis, E.J.; Cheng, A.S.; Deak, A.; Huber-Stearns, H.R.; Davis, E.J.; Cheng, A.S.; Deak, A. Collective Action for Managing Wildfire Risk across Boundaries in Forest and Range Landscapes: Lessons from Case Studies in the Western United States. Int. J. Wildland Fire 2022, 31, 936–948. [Google Scholar] [CrossRef]
- Blaisdell, J.P.; Murray, R.B.; McArthur, E.D. Managing Intermountain Rangelands: Sagebrush-Grass Ranges; General Technical Report INT-134; US Forest Service, Intermountain Forest and Range Experiment Station: Ogden, UT, USA, 1982.
- BLM. Livestock management post-fire. In Burned Area Emergency Stabilization and Rehabilitation Handbook; BLM Handbook H-1742-1; US Department of the Interior Bureau of Land Management: Washington, DC, USA, 2007; pp. 35–37. [Google Scholar]
- Donovan, V.M.; Twidwell, D.; Uden, D.R.; Tadesse, T.; Wardlow, B.D.; Bielski, C.H.; Jones, M.O.; Allred, B.W.; Naugle, D.E.; Allen, C.R. Resilience to Large, “Catastrophic” Wildfires in North America’s Grassland Biome. Earth’s Future 2020, 8, e2020EF001487. [Google Scholar] [CrossRef]
- Li, Z.; Angerer, J.P.; Wu, X.B. The Impacts of Wildfires of Different Burn Severities on Vegetation Structure across the Western United States Rangelands. Sci. Total. Environ. 2022, 845, 157214. [Google Scholar] [CrossRef] [PubMed]
- Gates, E.A.; Vermeire, L.T.; Marlow, C.B.; Waterman, R.C. Reconsidering Rest Following Fire: Northern Mixed-Grass Prairie Is Resilient to Grazing Following Spring Wildfire. Agric. Ecosyst. Environ. 2017, 237, 258–264. [Google Scholar] [CrossRef]
- Kral-O’Brien, K.C.; Sedivec, K.K.; Geaumont, B.A.; Gearhart, A.L. Resiliency of Native Mixed-Grass Rangelands and Crested Wheatgrass Pasture Lands to Spring Wildfire. Rangel. Ecol. Manag. 2020, 73, 119–127. [Google Scholar] [CrossRef]
- Williams, A.R.; Vermeire, L.T.; Waterman, R.C.; Marlow, C.B. Grazing and Defoliation Timing Effects in Great Plains Ponderosa Pine Woodland Following a Large Summer Wildfire. For. Ecol. Manag. 2022, 520, 120398. [Google Scholar] [CrossRef]
- Spiess, J.W.; McGranahan, D.A.; Geaumont, B.; Sedivec, K.; Lakey, M.; Berti, M.; Hovick, T.J.; Limb, R.F. Patch-burning buffers forage resources and livestock performance to mitigate drought in the northern Great Plains. Rangel. Ecol. Manag. 2020, 73, 473–481. [Google Scholar] [CrossRef]
- Allred, B.W.; Scasta, J.D.; Hovick, T.J.; Fuhlendorf, S.D.; Hamilton, R.G. Spatial Heterogeneity Stabilizes Livestock Productivity in a Changing Climate. Agric. Ecosyst. Environ. 2014, 193, 37–41. [Google Scholar] [CrossRef]
- Spiess, J.W. Patch-Burn Grazing in Southwestern North Dakota: Assessing Above-and Belowground Rangeland Ecosystem Responses. Ph.D. Thesis, North Dakota State University, Fargo, ND, USA, 2021. [Google Scholar]
- Wanchuk, M.R. Patch-Burning Improves Forage Nutritive Value and Livestock Performance over Rotational and Continuous Grazing Strategies. Master’s Thesis, North Dakota State University, Fargo, ND, USA, 2022. [Google Scholar]
- McGranahan, D.A.; Wonkka, C.L.; Dangi, S.; Spiess, J.W.; Geaumont, B. Mineral nitrogen and microbial responses to soil heating in burned grassland. Geoderma 2022, 424, 116023. [Google Scholar] [CrossRef]
- Duquette, C.A.; Hovick, T.J.; Geaumont, B.A.; Harmon, J.P.; Limb, R.F.; Sedivec, K.K. Spatially discrete disturbance processes enhance grassland floral resources. J. Appl. Ecol. 2022, 59, 1700–1708. [Google Scholar] [CrossRef]
- Westerling, A.L.; Gershunov, A.; Brown, T.J.; Cayan, D.R.; Dettinger, M.D. Climate and Wildfire in the Western United States. Bull. Am. Meteorol. Soc. 2003, 84, 595–604. [Google Scholar] [CrossRef]
- Szpakowski, D.M.; Jensen, J.L.R. A Review of the Applications of Remote Sensing in Fire Ecology. Remote Sens. 2019, 11, 2638. [Google Scholar] [CrossRef]
- Tedim, F.; Leone, V.; Amraoui, M.; Bouillon, C.; Coughlan, M.R.; Delogu, G.M.; Fernandes, P.M.; Ferreira, C.; McCaffrey, S.; McGee, T.K.; et al. Defining Extreme Wildfire Events: Difficulties, Challenges, and Impacts. Fire 2018, 1, 9. [Google Scholar] [CrossRef]
- Liu, Z.; Wimberly, M.C. Climatic and Landscape Influences on Fire Regimes from 1984 to 2010 in the Western United States. PLoS ONE 2015, 10, e0140839. [Google Scholar] [CrossRef]
- Parker, N.J.; Sullins, D.S.; Haukos, D.A.; Fricke, K.A.; Hagen, C.A. Recovery of Working Grasslands Following a Megafire in the Southern Mixed-Grass Prairie. Glob. Ecol. Conserv. 2022, 36, e02142. [Google Scholar] [CrossRef]
- Belval, E.J.; Wei, Y.; Calkin, D.E.; Stonesifer, C.S.; Thompson, M.P.; Tipton, J.R. Studying Interregional Wildland Fire Engine Assignments for Large Fire Suppression. Int. J. Wildland Fire 2017, 26, 642. [Google Scholar] [CrossRef]
- Madsen, R.S.; Haynes, H.J.G.; McCaffrey, S.M. Wildfire Risk Reduction in the United States: Leadership Staff Perceptions of Local Fire Department Roles and Responsibilities. Int. J. Disaster Risk Reduct. 2018, 27, 451–458. [Google Scholar] [CrossRef]
- National Interagency Fire Center. InterAgencyFirePerimeterHistory All Years. 2022. Available online: https://data-nifc.opendata.arcgis.com/datasets/nifc::interagencyfireperimeterhistory-all-years-view/explore?location=29.282787,-122.087025,3.64 (accessed on 22 November 2022).
- USDA Natural Resource Conservation Service. Part 649 – Land Resource Areas. In National Soil Survey Handbook Title 430-VI; USDA: Washington, DC, USA, 2017. [Google Scholar]
- Omernik, J.M.; Griffith, G.E. Ecoregions of the Conterminous United States: Evolution of a Hierarchical Spatial Framework. Environ. Manag. 2014, 54, 1249–1266. [Google Scholar] [CrossRef] [PubMed]
- Abatzoglou, J.T.; Dobrowski, S.Z.; Parks, S.A.; Hegewisch, K.C. TerraClimate, a High-Resolution Global Dataset of Monthly Climate and Climatic Water Balance from 1958 to 2015. Sci. Data 2018, 5, 170191. [Google Scholar] [CrossRef]
- United States Census Bureau. Urban and Rural; United States Census Bureau: Suitland, MD, USA, 2020.
- Bureau of Land Management. BLM National Surface Management Agency Area Polygons - National Geospatial Data Asset (NGDA). 2022. Available online: https://gbp-blm-egis.hub.arcgis.com/datasets/blm-national-surface-management-agency-area-polygons-national-geospatial-data-asset-ngda/about (accessed on 22 November 2022).
- USGS Gap Analysis Project. Protected Areas Database of the United States (PAD-US) 3.0; Technical report; US Geological Survey: Reston, VA, USA, 2022.


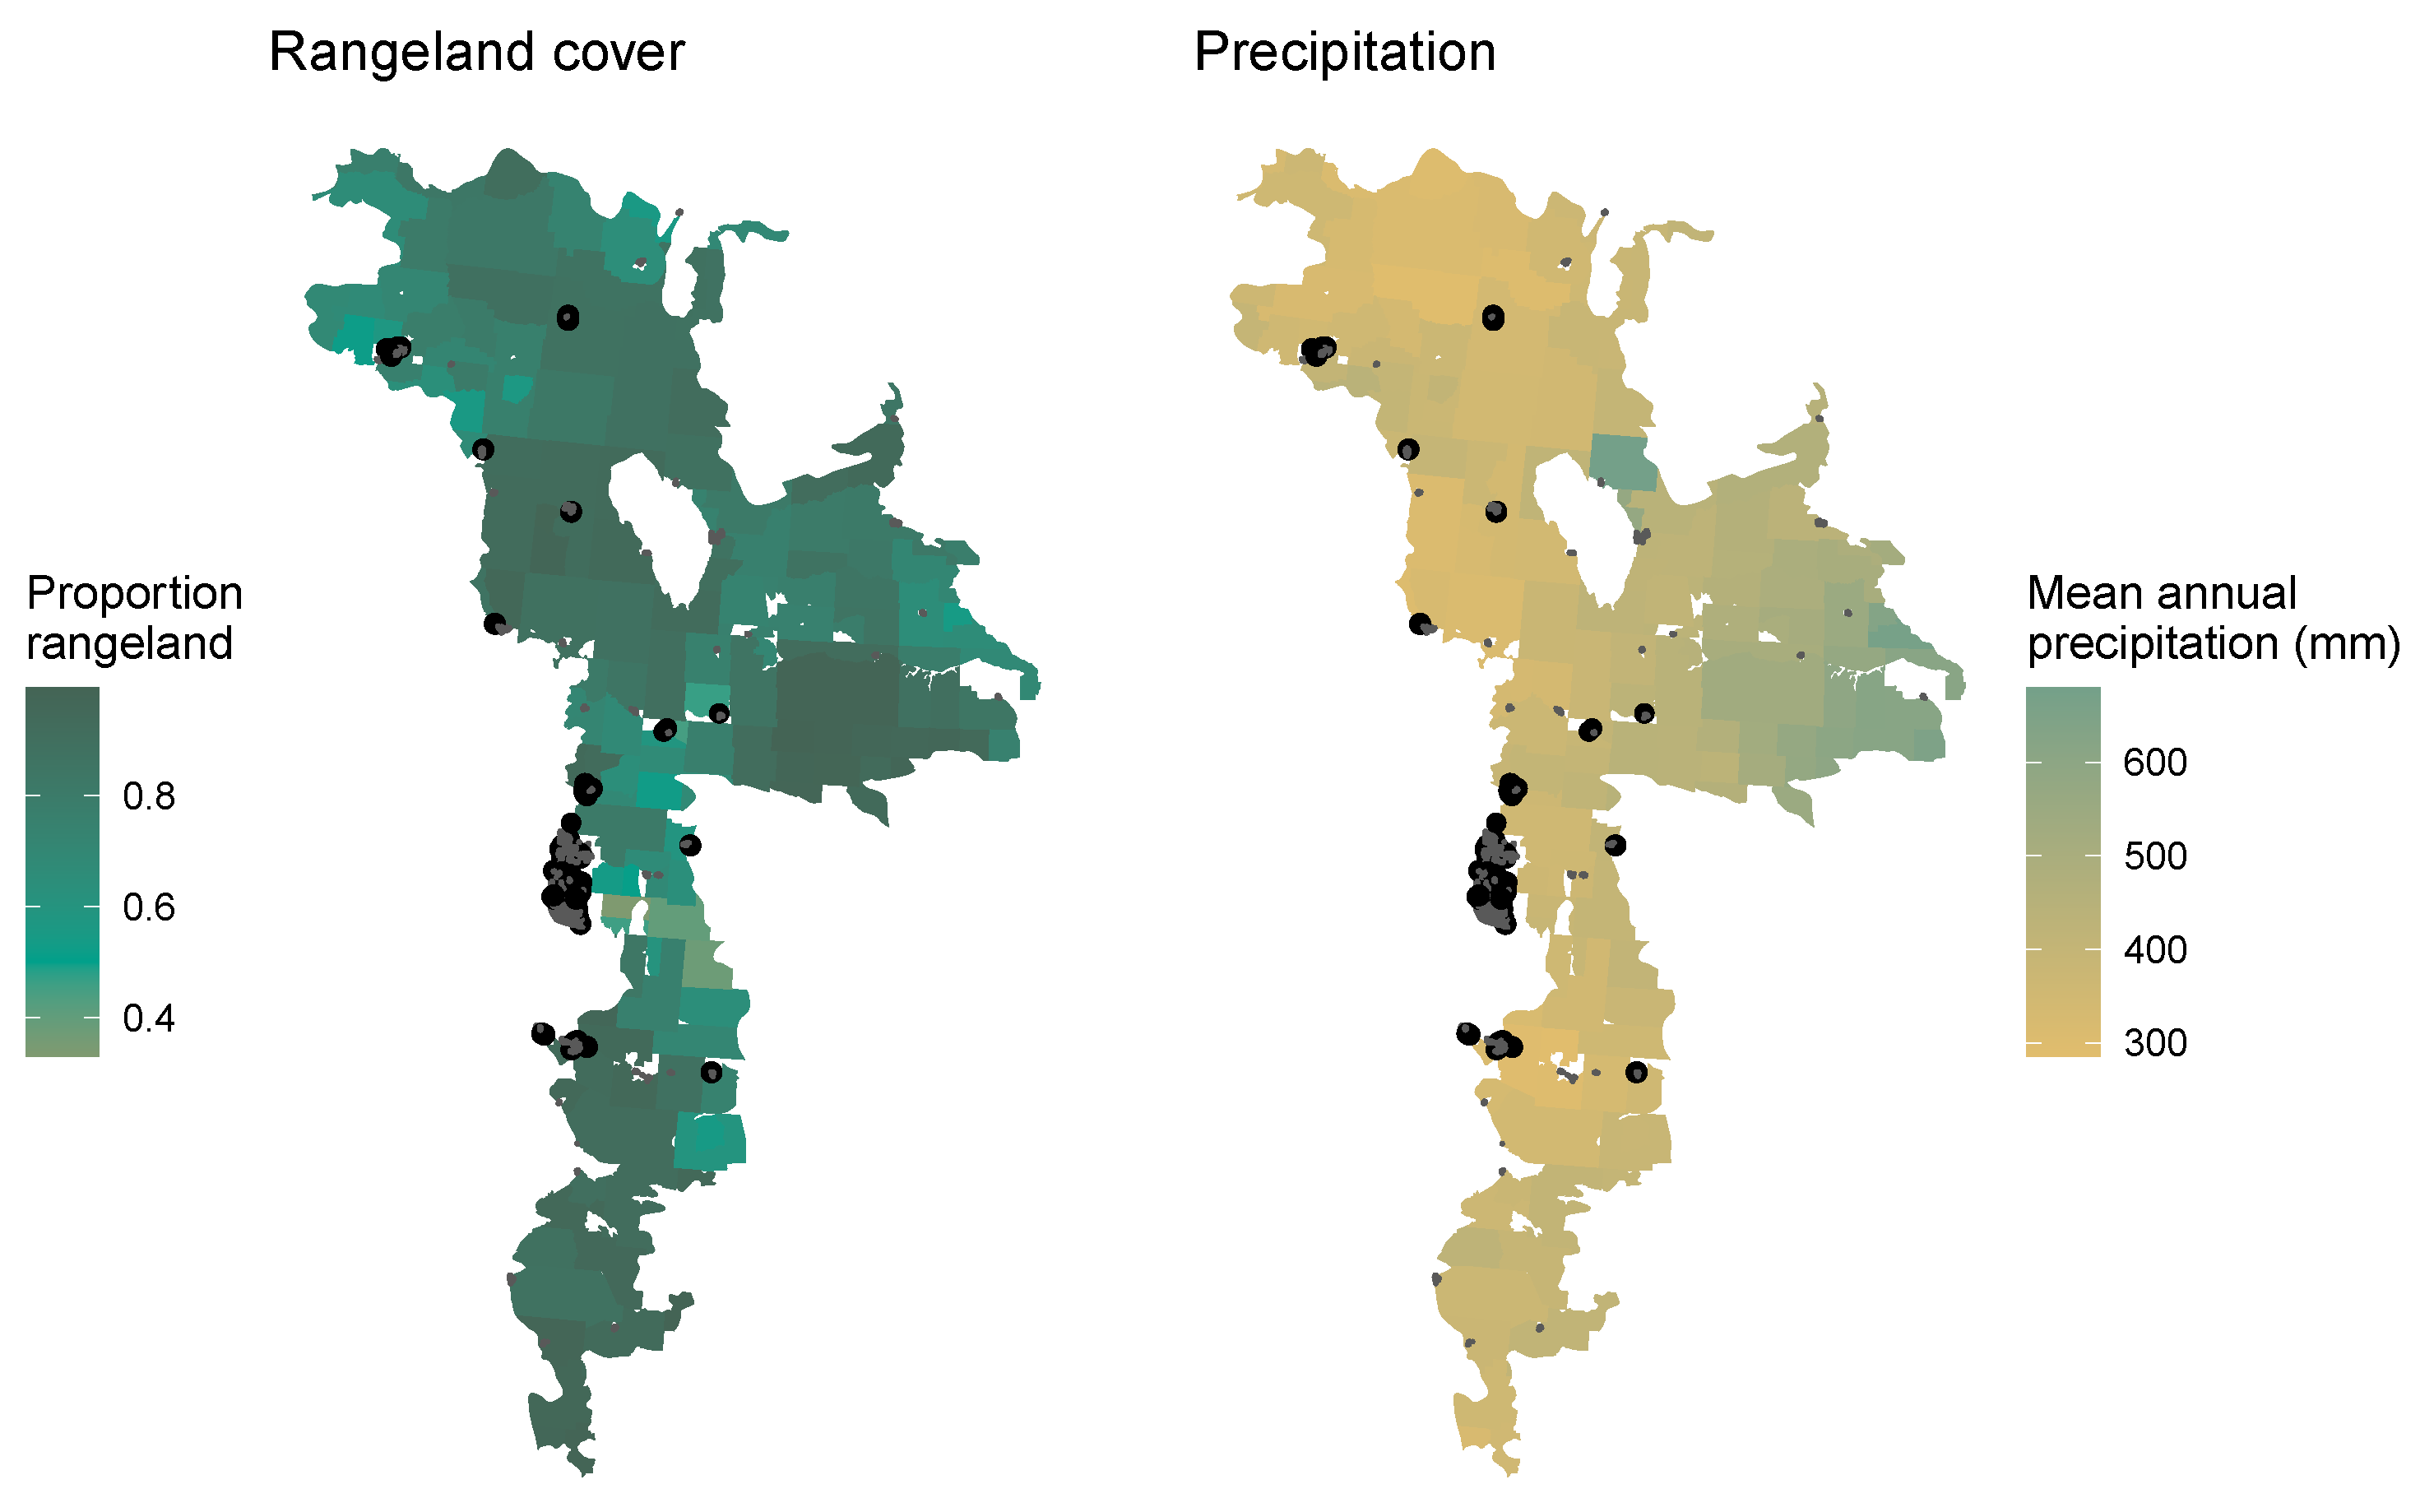
| Ecoregion | Proportion Rangeland (%) | Precipitation (mm) |
|---|---|---|
| Northwestern Plains | 80 | 410 |
| Nebraska Sand Hills | 92 | 538 |
| High Plains | 68 | 392 |
| Southwestern Tablelands | 90 | 356 |
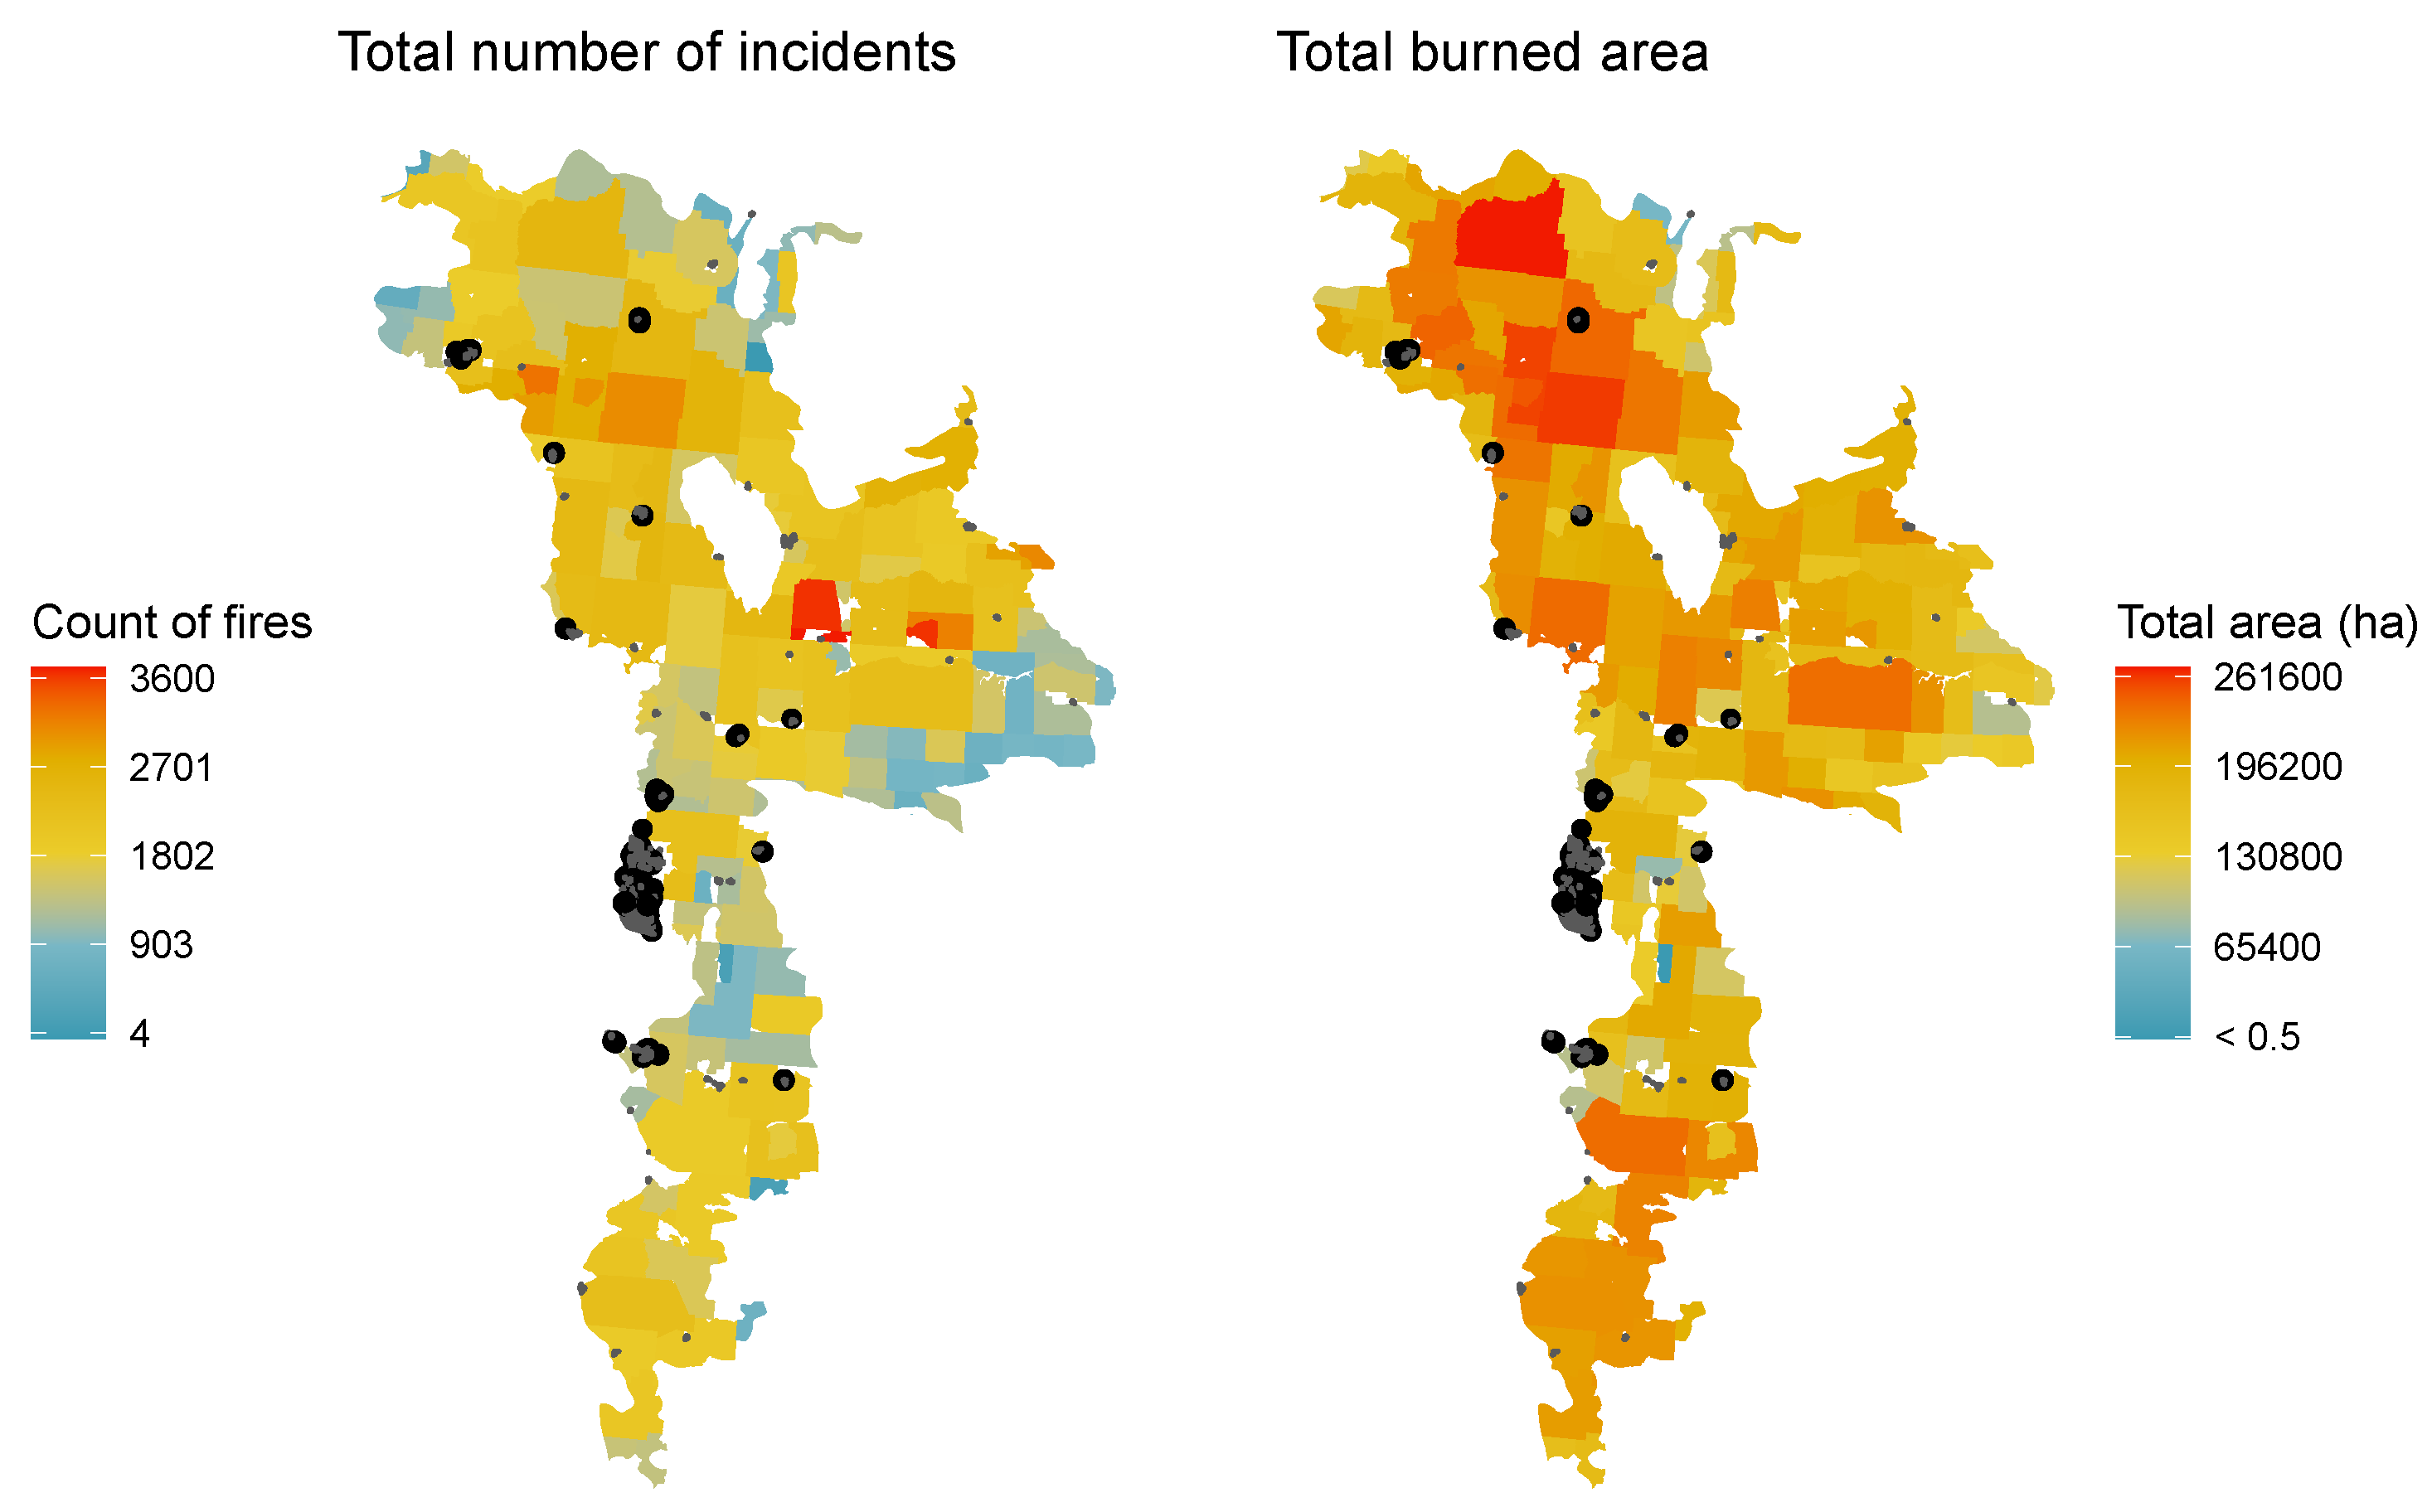
| Ecoregion | Fires (/km2) | Burned Area (% of Ecoregion †) |
|---|---|---|
| Northwestern Plains | 34,069 (0.38) | 2,104,345 (21.3%) |
| Nebraska Sand Hills | 1423 (0.03) | 251,136 (4.4%) |
| High Plains | 18,807 (0.07) | 342,945 (1.2%) |
| Southwestern Tablelands | 6276 (0.1) | 394,098 (6%) |
| Ecoregion | Agency | Fire-Affected Allotments |
|---|---|---|
| Northwestern Plains | BLM | 1032 (31%) |
| USFS | 365 (51%) | |
| High Plains | BLM | 40 (16%) |
| USFS | 83 (24%) | |
| Nebraska Sand Hills | BLM | 1 (8%) |
| USFS | 39 (80%) | |
| Southwestern Tablelands | BLM | 8 (3%) |
| USFS | 23 (21%) |
Disclaimer/Publisher’s Note: The statements, opinions and data contained in all publications are solely those of the individual author(s) and contributor(s) and not of MDPI and/or the editor(s). MDPI and/or the editor(s) disclaim responsibility for any injury to people or property resulting from any ideas, methods, instructions or products referred to in the content. |
© 2024 by the authors. Licensee MDPI, Basel, Switzerland. This article is an open access article distributed under the terms and conditions of the Creative Commons Attribution (CC BY) license (https://creativecommons.org/licenses/by/4.0/).
Share and Cite
McGranahan, D.A.; Wonkka, C.L. Pyrogeography of the Western Great Plains: A 40-Year History of Fire in Semi-Arid Rangelands. Fire 2024, 7, 32. https://doi.org/10.3390/fire7010032
McGranahan DA, Wonkka CL. Pyrogeography of the Western Great Plains: A 40-Year History of Fire in Semi-Arid Rangelands. Fire. 2024; 7(1):32. https://doi.org/10.3390/fire7010032
Chicago/Turabian StyleMcGranahan, Devan Allen, and Carissa L. Wonkka. 2024. "Pyrogeography of the Western Great Plains: A 40-Year History of Fire in Semi-Arid Rangelands" Fire 7, no. 1: 32. https://doi.org/10.3390/fire7010032