Article

Research and Application of Improved Multiple Imputation Based on R Language in Fire Prediction

1
School of Resource and Environmental Engineering, Wuhan University of Science and Technology, Wuhan 430081, China
2
Hubei Research Center of Industrial Safety Engineering Technology, Wuhan 430081, China
3
Safety and Emergency Response Institute, Wuhan University of Science and Technology, Wuhan 430081, China
4
Faculty of Engineering, China University of Geosciences (Wuhan), Wuhan 430074, China
*
Author to whom correspondence should be addressed.
Fire 2023, 6(6), 235; https://doi.org/10.3390/fire6060235
Submission received: 12 April 2023 / Revised: 9 June 2023 / Accepted: 11 June 2023 / Published: 13 June 2023

Abstract

:
An improved multiple imputation based on R language is proposed to deal with the miss of data in a fire prediction model, which can affect the accuracy of the prediction results. Hazard and operability (HAZOP) is used to accurately find the data related to the research purpose, and exclude data with a missing rate greater than 80% and small differences in characteristics. Then, by changing the m value in the mice package under the R language (R-mice), the relevant parameters of the complete filling factor set under different m values are obtained. The value of m is determined after observing and comparing the parameters. The proposed method fully considers the randomness of filling and the difference between the generated dataset. Taking Hubei Province as an example, the data processed by this method are used as the input of the Bayesian network, and the fire trend is used as the output. The results show that the improved multiple imputation based on R-mice can solve the problem of missing data very well, and have a high prediction effect (AUC = 94.0800). In addition, the results of the predictive reasoning and sensitivity analysis show that the government’s supervision has a vital influence on the trend of fires in Hubei Province.

1. Introduction

Missing data are a common problem in research, and the main reasons for the deletion are measurement errors, data corruption, and equipment failure [1]. The treatment of missing data can be roughly divided into three categories: not processing, direct deletion, and filling. Among them, non-processing refers to the direct application of incomplete data by machine learning such as Bayesian networks [2] and artificial neural networks [3], they are widely employed to estimate the fire risk of human casualties [4]. However, the requirements for operators are high and the error is large. Direct deletion refers to the deletion of data objects or attributes that contain missing values, but the deletion method applies to completely randomly missing datasets with a missing percentage of less than 5%. Otherwise, the loss of critical information affects the results of the study [5].
The filler method is increasingly recognized by scholars as it preserves key data and obtains more accurate research results [6]. The main methods are the maximum expected value algorithm (EM) [7], regression fill [8], cluster fill, and multiple fill [9] etc., and methods of improvement based on their various theories (e.g., KEMI [10], MIDA [11] etc.). Among them, the multiple-fill method is the most commonly used [12], which can fill the missing data with the appropriate statistical methods according to the pattern of data loss, which not only ensures the correlation between the variables but also effectively solves the uncertainty of data loss [13]. However, most of its applications are used in clinical studies [14], and a few scholars have applied it to the field of fire prediction [15,16]. Most of the ways to deal with missing data in the fire field are direct deletion, such as Liu deletes data with missing key features [17]; Jin et al., retain data containing complete features [18]; and Sattari et al., remove cases where the information required for classification was missing [19]. However, with the rapid development of economy and society, although the risk of fire is decreasing year by year and tends to a stable state, the base is still large and cannot be underestimated. Fire situation assessment and prediction play an important role in reducing its risk, which requires that the error of the research results is as small as possible, and the deletion method may cause larger errors.
The coding of the R-based multi-fill method is detailed in Section 2.2, where the m value defaults to 5 [20], which can be taken as 3 to 5 [21], 5 to 10 [22], or 5 to 20, or even higher [23]; the larger the value, the better, but the size of the calculation amount should also be considered. Therefore, the value of m needs to be discussed on a case-by-case basis, and should not be too large or too small, which may make the filling inaccurate and affect the research results.
To solve the above problems, our work proposes an improved multi-imputation based on the R language. In recent years, the relevant national security departments and enterprises have accumulated a large amount of fire data. Therefore, firstly, the Hazard and Operability Study (HAZOP) is used to qualitatively filter out the categories of data that best affected the trend of fire occurrence from the fire statistics, thereby reducing noise, and then the improved multi-fill was applied. After filling it, it is used as the input of the prediction model and the fire occurrence trend is used as the output. The output can provide a basis for decision-makers to formulate countermeasures to reduce the adverse effects of fires. The idea of this article is shown in Figure 1.

2. Methodology

2.1. Hazard and Operability (HAZOP)
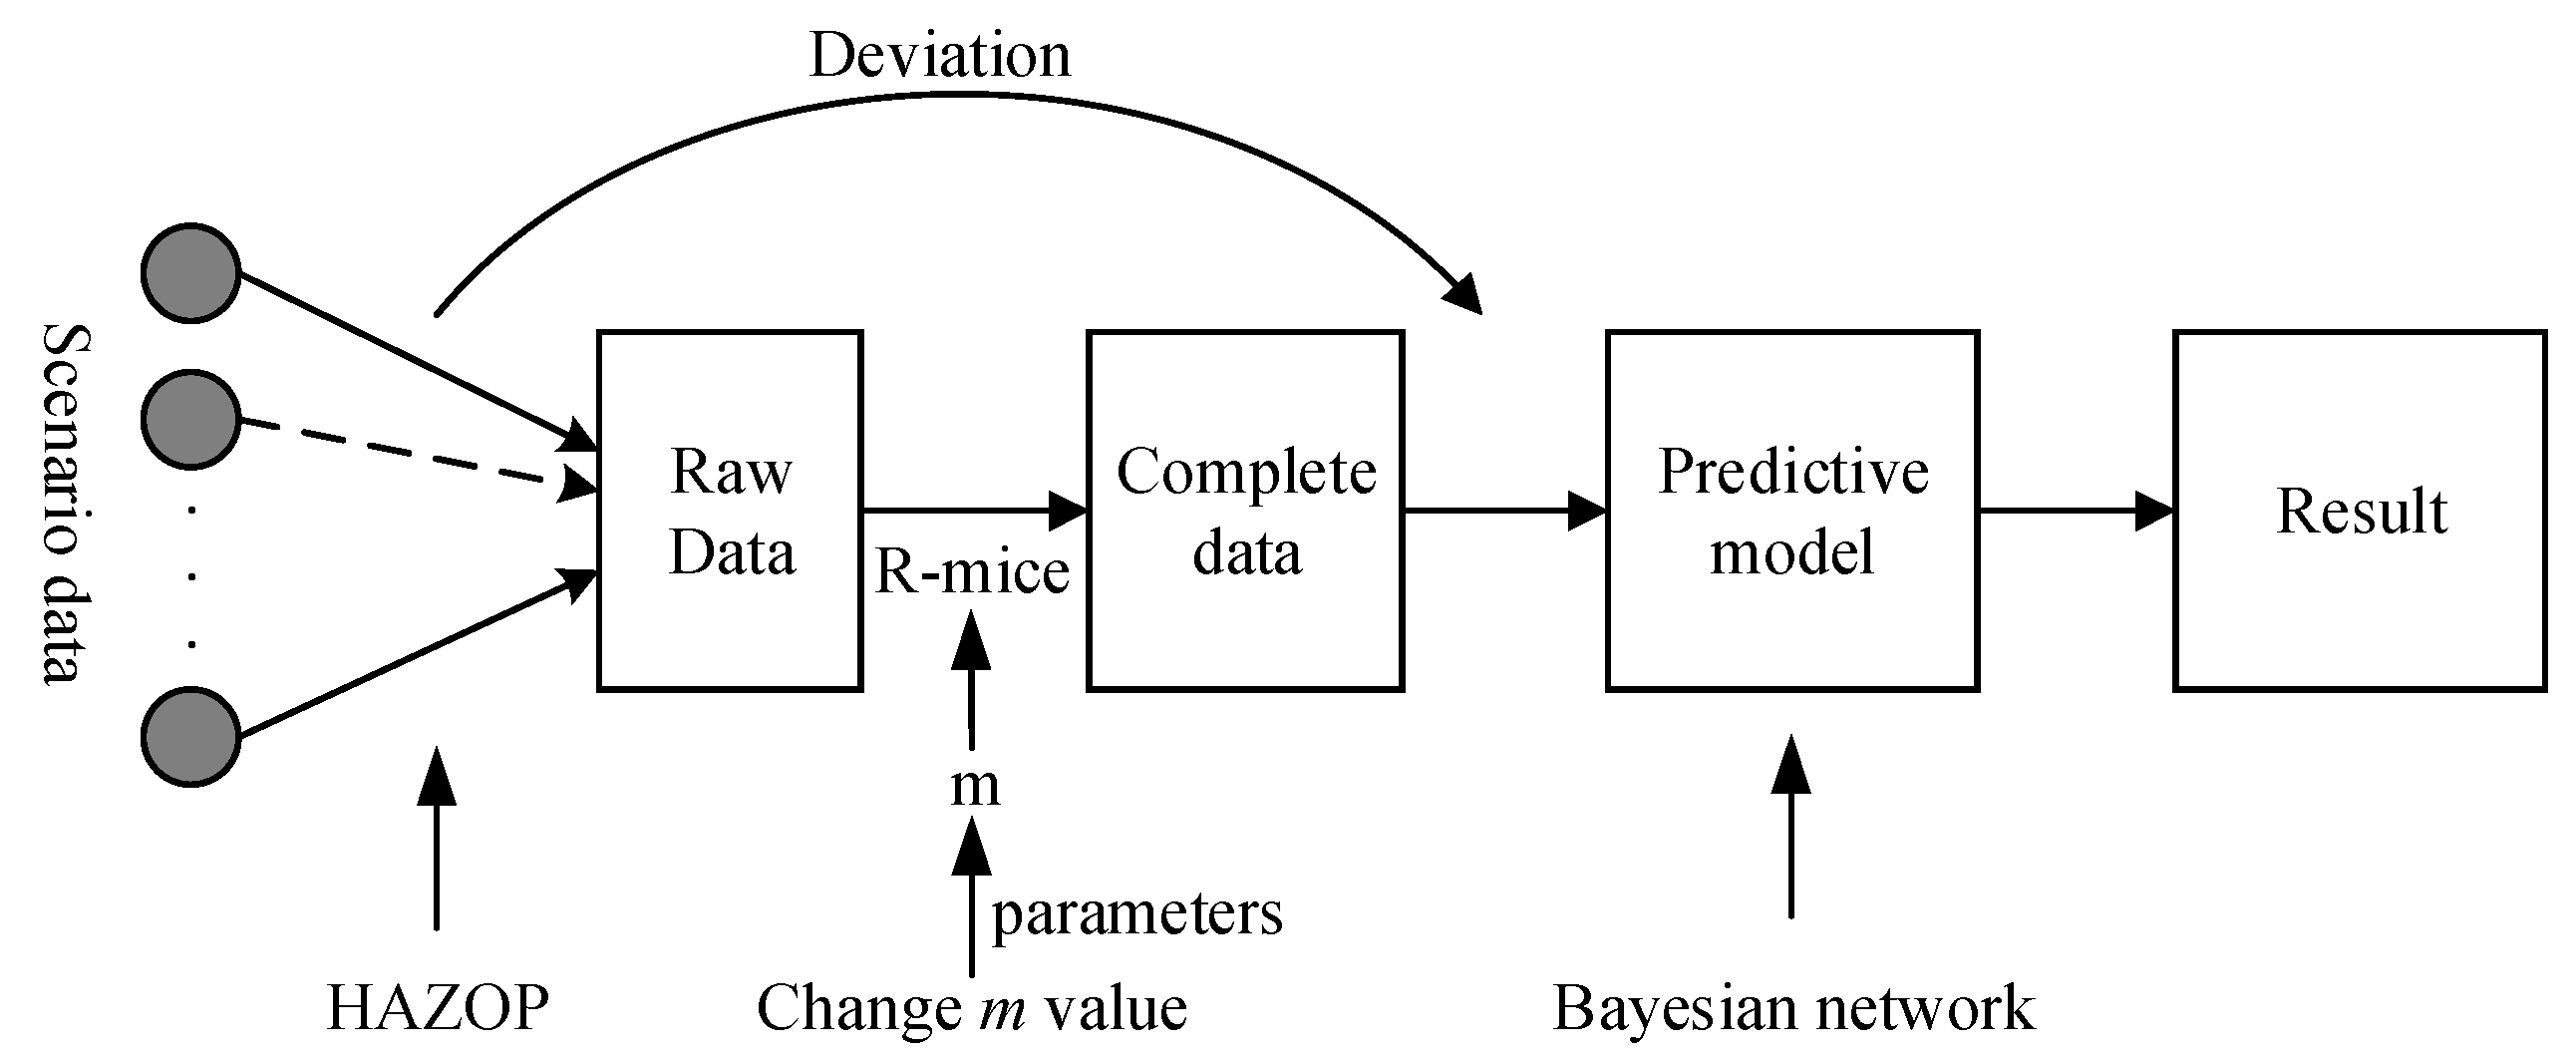
HAZOP is a qualitative safety evaluation method, guided by keywords (e.g., more, less, part of, no, as well as, reserve, other than) [23], combined with the process parameters (e.g., temperature, pressure, etc.) to find out the deviation of the process state, and then analyze the causes and consequences of the deviation, and finally formulate the prevention and control measures [24], as shown in Figure 2.
The HAZOP analysis is conducted in the form of expert discussion. Before the analysis, the expert decomposes the system into several units according to the research purposes. Each unit has its related functional requirements. There are one or more related parameters, and each parameter corresponds to several guiding words. Select a unit to test the combination of parameters and guiding words that is a deviation. If there is a deviation, analyze its causes and consequences, conduct a risk assessment, and propose the measures to eliminate and control the dangers and reduce losses. After the analysis of all the possible deviations of one unit is completed, transfer to another unit, and repeat the above steps until the analysis of all units is completed.

2.2. Multiple Fills

The multiple-fill method is based on Bayesian estimation theory, and the fills of the missing data are random and all derived from observations. The specific filling steps can be divided into three steps:
  • Choose the appropriate padding method based on the data deletion pattern: monotonic or arbitrary [25], such as predictive mean matching, logistic regression imputation, and professional odds models, m-fill missing data to generate m-group complete datasets.
  • Statistical analysis of m-group datasets.
  • The Rubin method was used to integrate all the analysis results to produce a final inference.
Many pieces of software can implement multiple fillings, such as SOLAS, SAS, and R languages, among others [13]. Compared with other software, R is simple to operate, easy to understand and effective, and is more suitable for scholars to apply it. The steps to implement multiple fillings using the R language and their codes are [26,27]:
  • library(mice) # Call into the function package
  • x1<- read.spss(“data location/file name.sav”, to.data.frame = T) # Import data
  • x2<- mice(x1, m, meth) # Fill in the data
  • fit <- with(x2, analysis) # Contains m individual statistical analysis results, analysis is used to set the statistical analysis method applied to m-filled datasets
  • pooled <- pool(fit) # Contains m statistical analysis of the average results
  • summary(pooled) # Summary

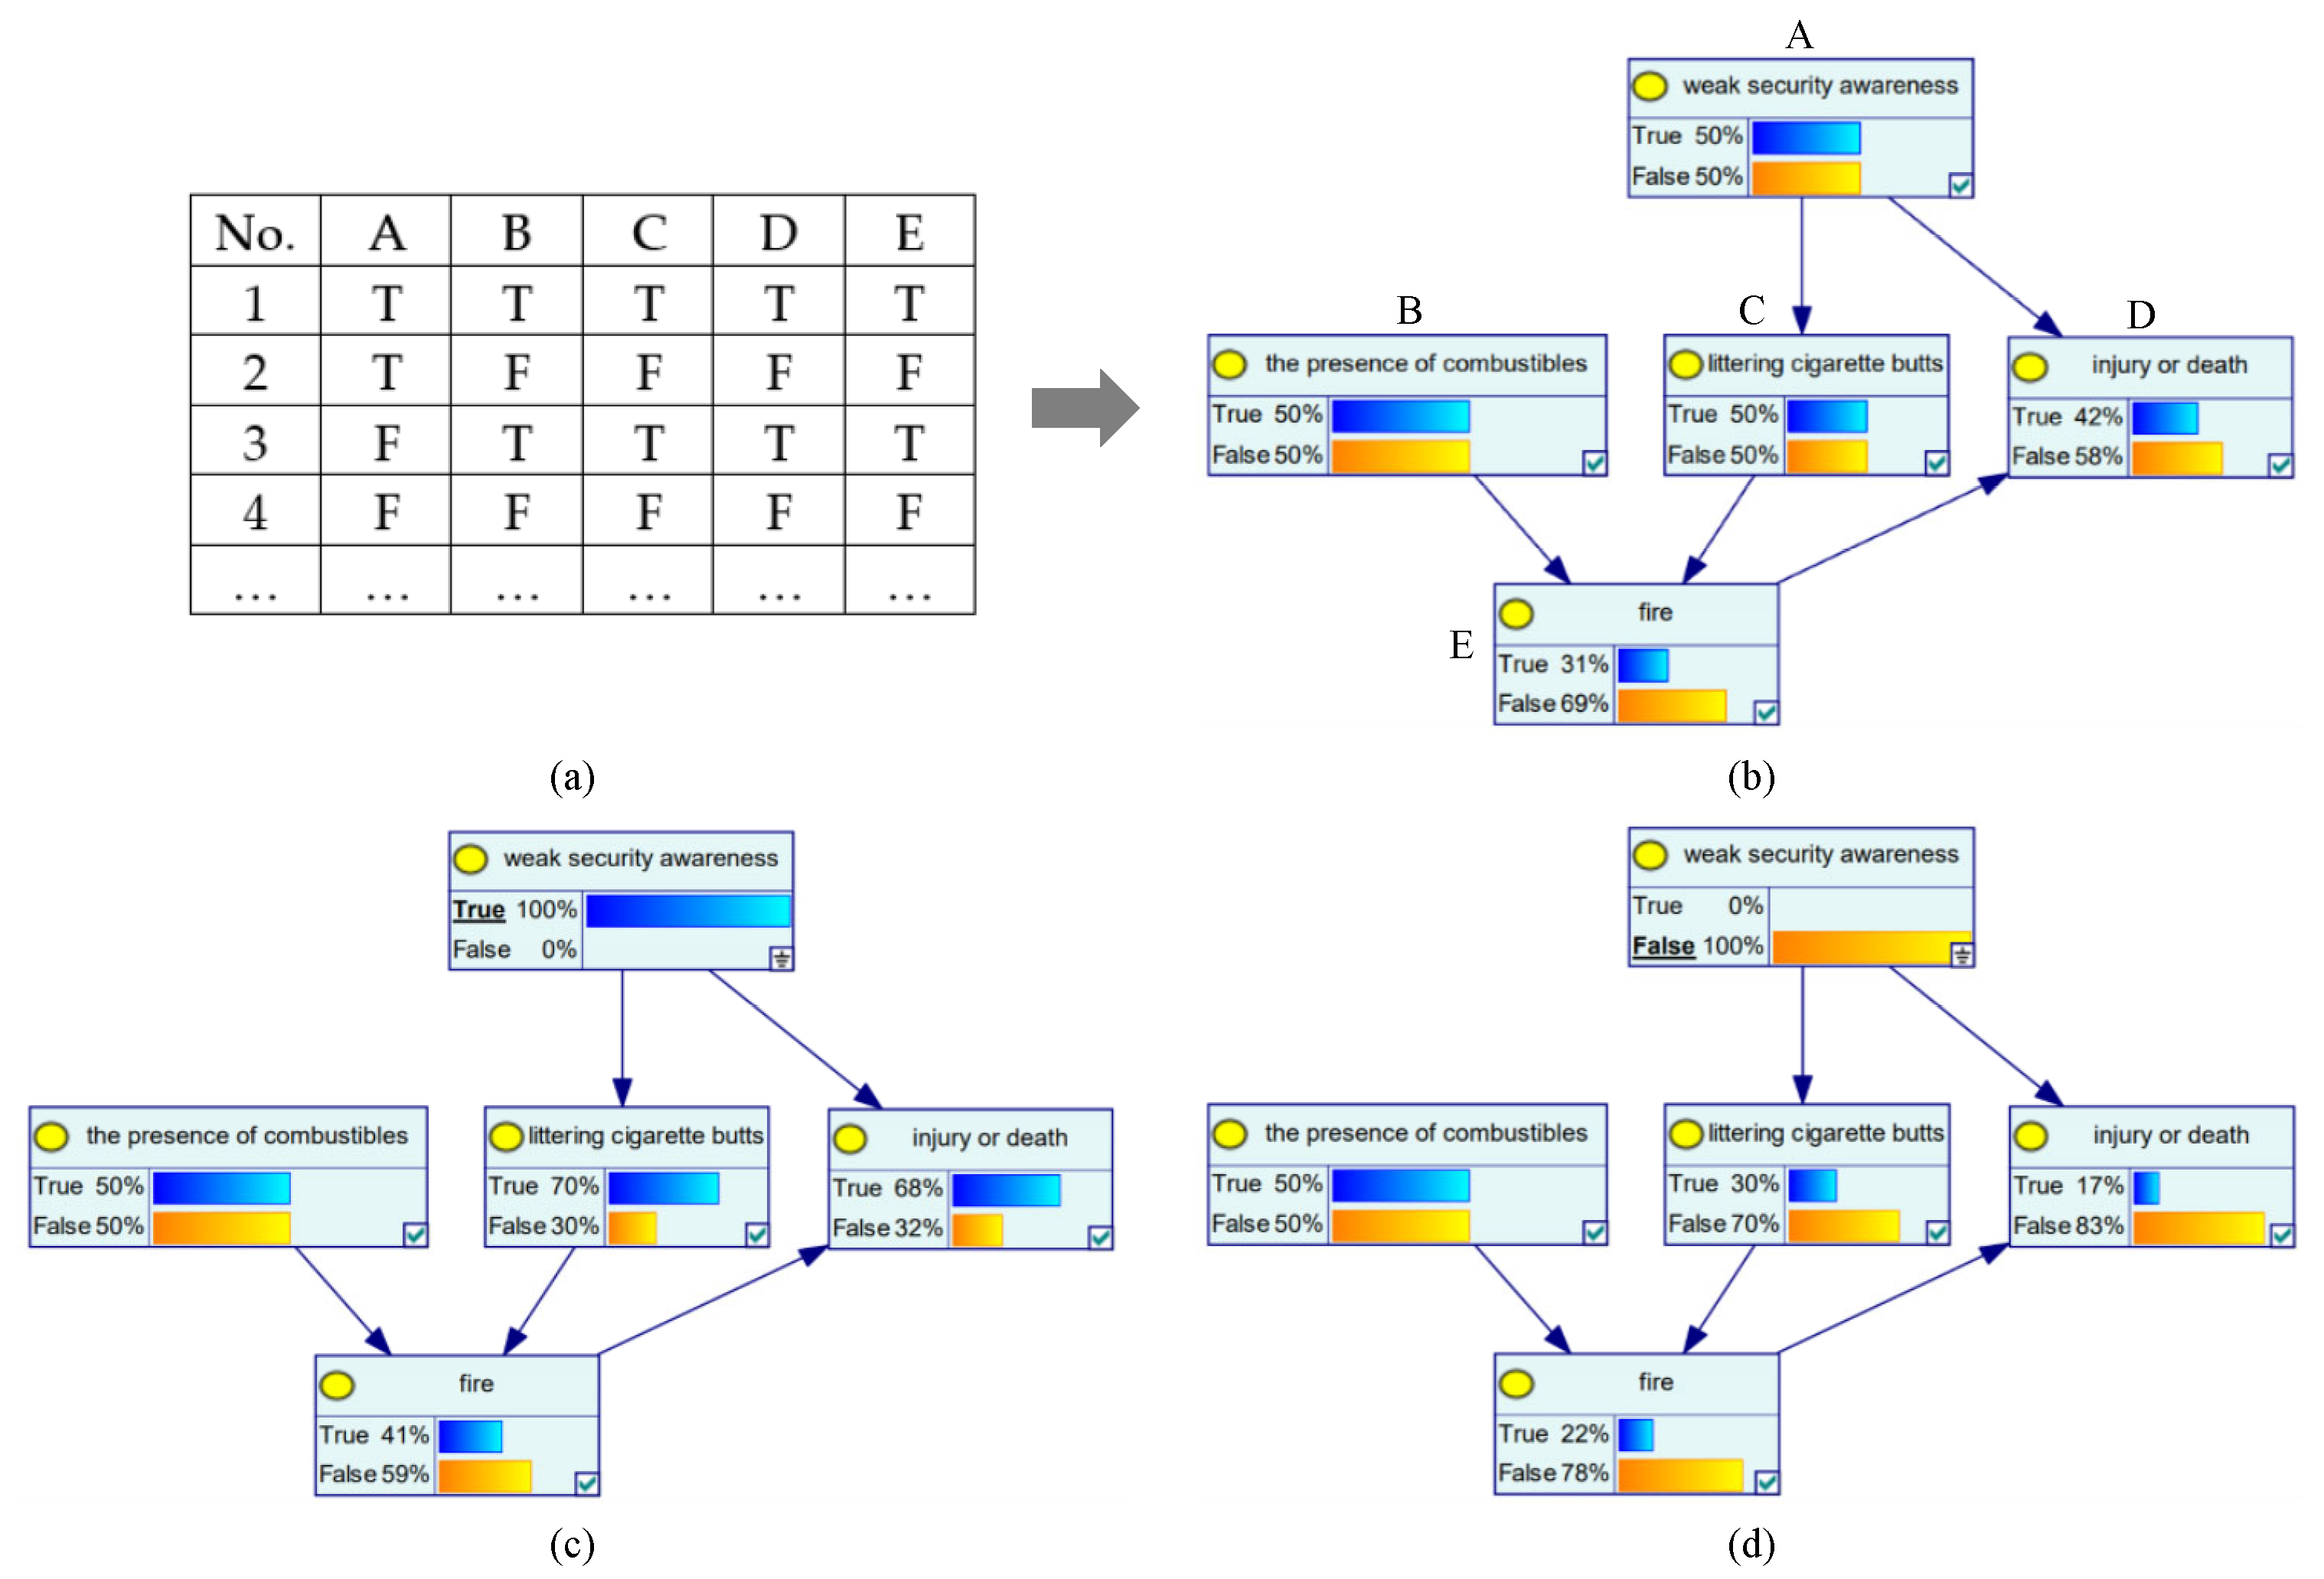
2.3. Bayesian Networks

In solving the practical problems, inferences and judgments need to be made from uncertain knowledge and information, and Bayesian networks (BN) can use a probability theory to deal with the uncertainties caused by conditional correlation [28]. Its network topology is a directed acyclic graph (DAG). The nodes in BN consist of the random variables X = {X1, X2, …, Xn}, non-conditionally independent variables are connected by arrows, and the parent node points to the child node [29]. It has the flexibility to not only learn network structures and parameters through large amounts of data [30], but also to use expert knowledge and data to improve the performance of the model, thus helping us analyze some complex problems (uncertain or missing data) [31], and even support us in developing measures [32].
Let BN = (G, θ), G is the network structure, and θ is the network parameter. The joint probability distribution on X is Equation (1) [33,34,35]:
P ( X ) = i = 1 n P ( X i P a ( X i ) )
where Pa(Xi) is all parent nodes of Xi. For arbitrary variables, the joint probability distribution can also be expressed as Equation (2):
P ( X ) = P ( X n | X 1 , , X n 1 ) P ( X 2 | X 1 ) P ( | X 1 )
A simple Bayesian network: a person with a weak security awareness may be unconsciously littering unextinguished cigarette butts, and if there is combustible material around them, it is highly likely to cause a fire. If the fire is not detected and controlled in time, it will grow larger and quickly spread to the surrounding area, and then improper operation or untimely escape will cause injury or even death; in some cases, such as in Figure 3a, the network structure and condition probability table can be obtained in the input software, as shown in Figure 3b. Its joint probability distribution is P(X) = P(XA) P(XC|XA) P(XD|XA) P(XB) P(XE|XB, XC) P(XD|XA, XE). Change either condition, and the probability of being late will change accordingly. For example, when a person has an extremely weak security awareness (True = 100%, Figure 3c), the probability of injury or death will increase from 42% to 68%. Conversely, when a person has a good sense of security (False = 100%, Figure 3d), the probability of injury or death will reduce from 42% to 17%.

3. Instance Calculations

Hubei Province is located in the east of China, with 17 cities and prefectures in total. This article will use an improved multiple imputation based on R-mice to construct a prediction model to predict fire trends x0 and provide a basis for decision-makers to formulate fire prevention measures. The specific analysis steps are as follows.

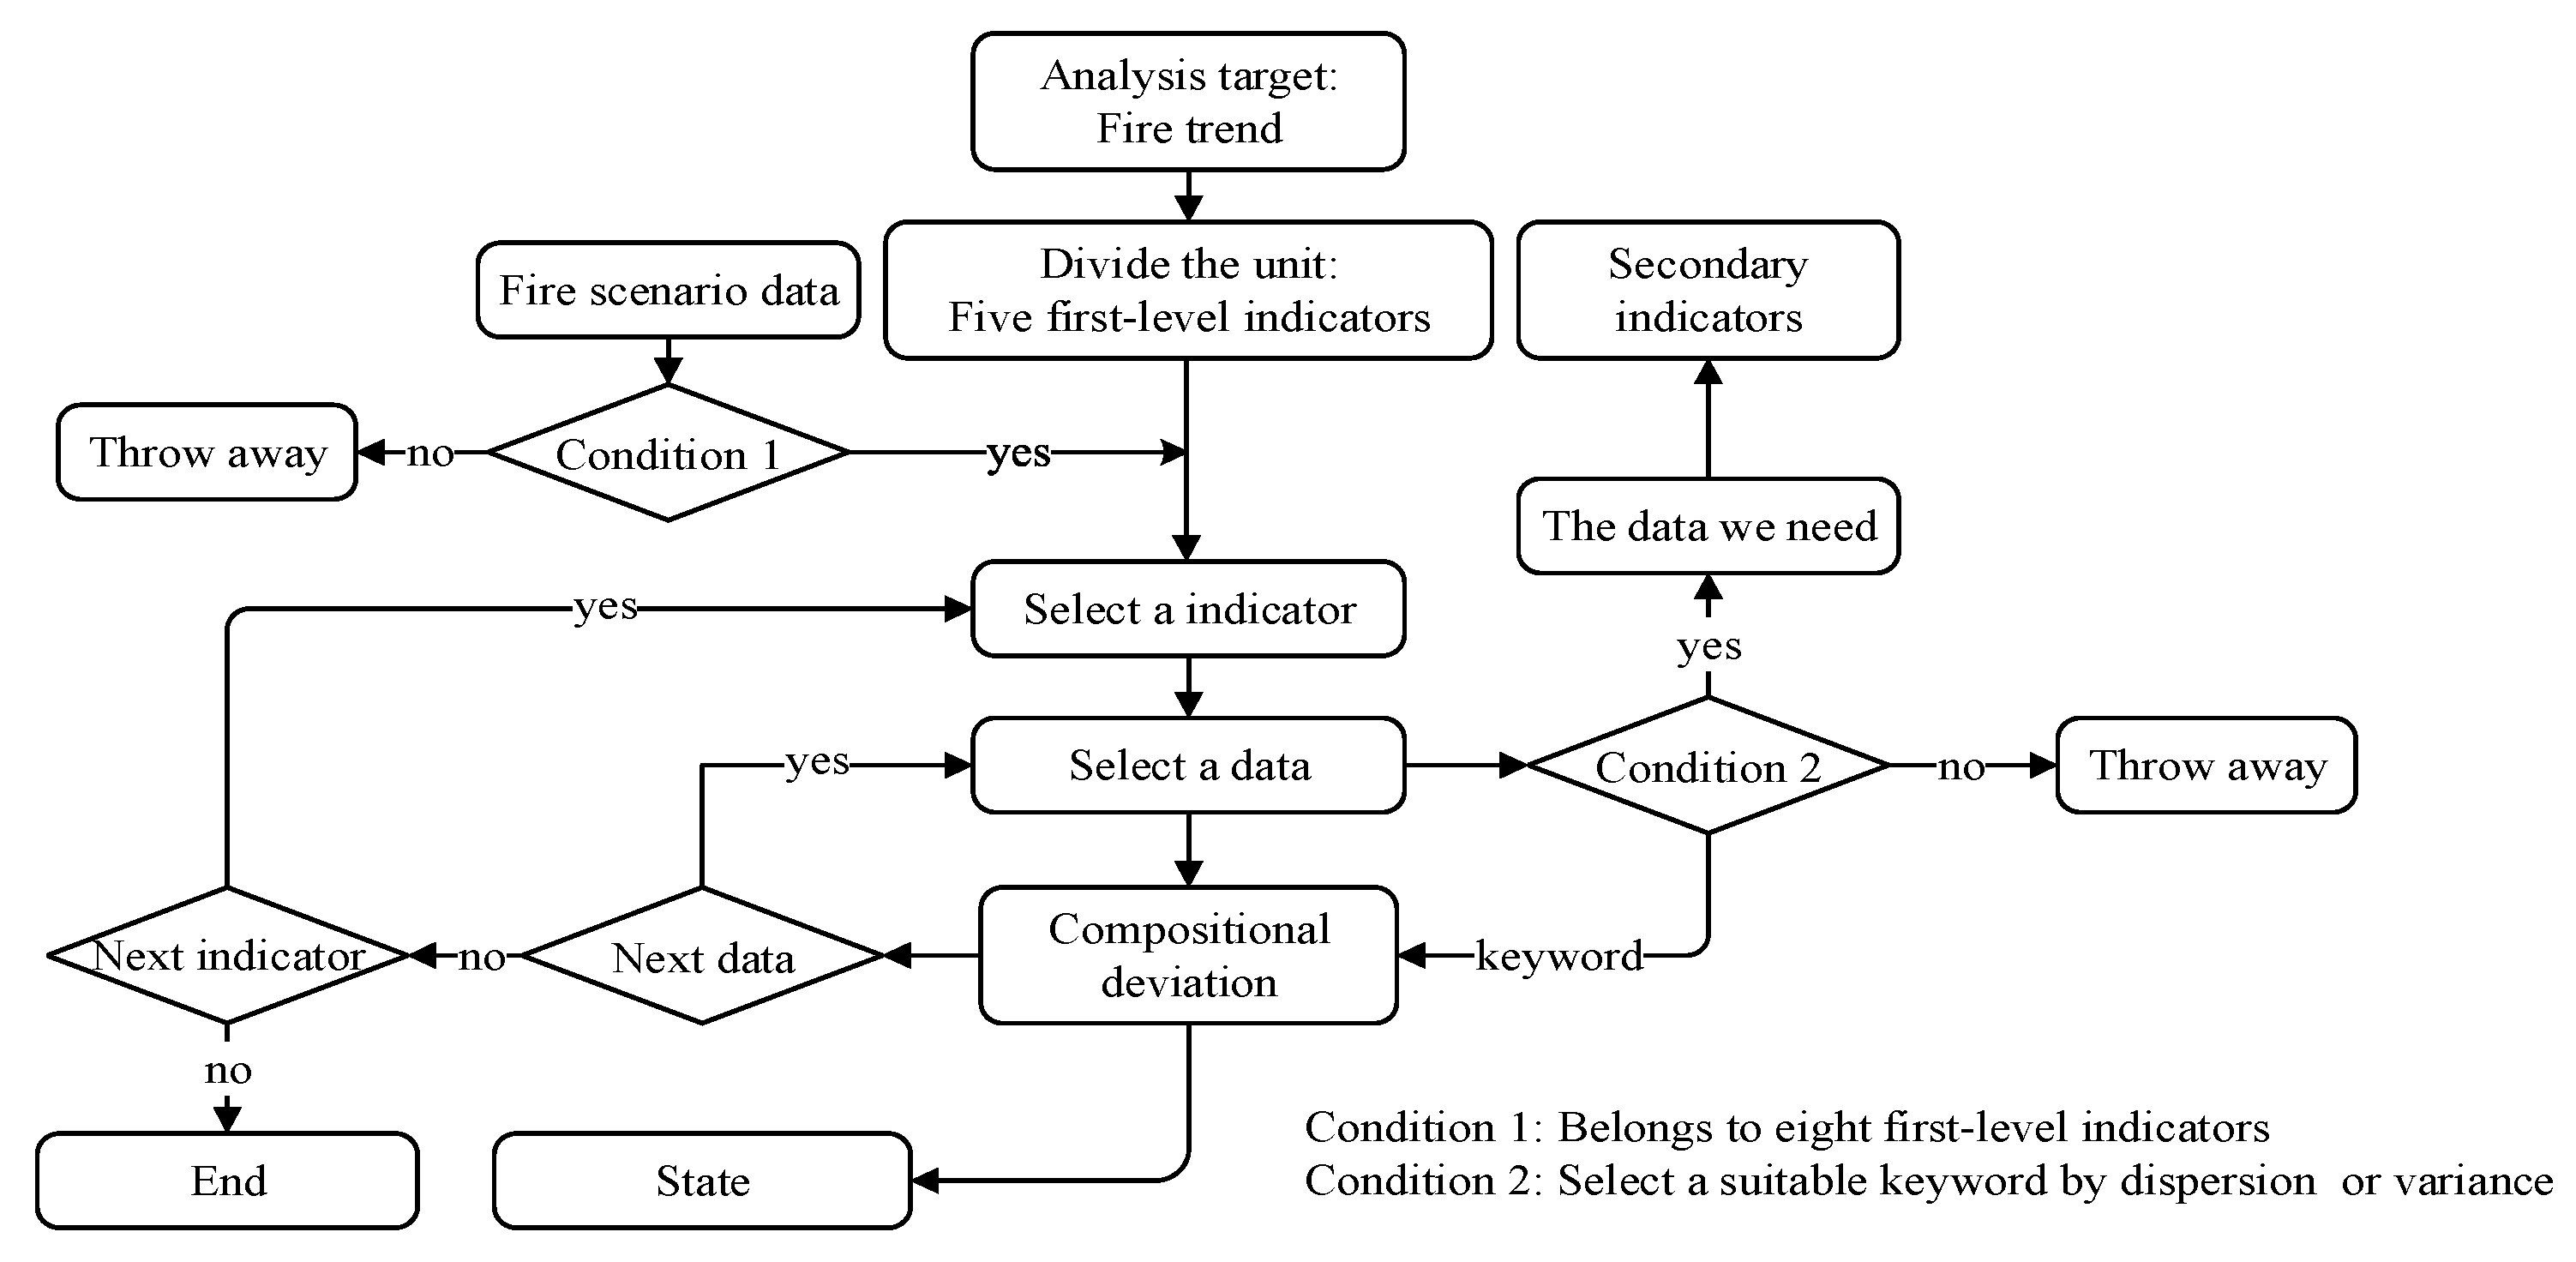
3.1. Collection and Processing of Fire Statistics

Through field investigation and consulting the China Fire Rescue Yearbook, we have obtained data on various fire scenarios in Hubei Province from 2016 to 2018, which can be roughly divided into the following 5 categories: fire loss, fire information, fire rescue, fire brigade, and fire equipment [36]. However, not all of them are what we need. Exclude some scenario data that have little influence on the research purposes, which can reduce the complexity and noise of the model, reduce the amount of calculation, and increase the readability and accuracy of the model [37]. Last but not least, all data need to be normalized to facilitate the subsequent analysis [38], as shown in Equation (3):
x i = x i min ( x i ) max ( x i ) min ( x i )
The role of HAZOP in this article is to screen out the data we need. The advantage of the HAZOP method is simplicity and ease of operation. Experts from various fields gather together to express their opinions, influence, and inspire each other and discover more problems creatively. The specific process of using HAZOP to screen data is shown in Figure 4, that is, screen out some data irrelevant to the research purpose and data with unobvious characteristics through Condition 1 and Condition 2. The most important thing is in the analysis process, the primary and secondary indicators generated can construct a prediction model structure about the fire trend through correlation analysis, and the deviation can be used as the state of the model node, as shown in Table 1.

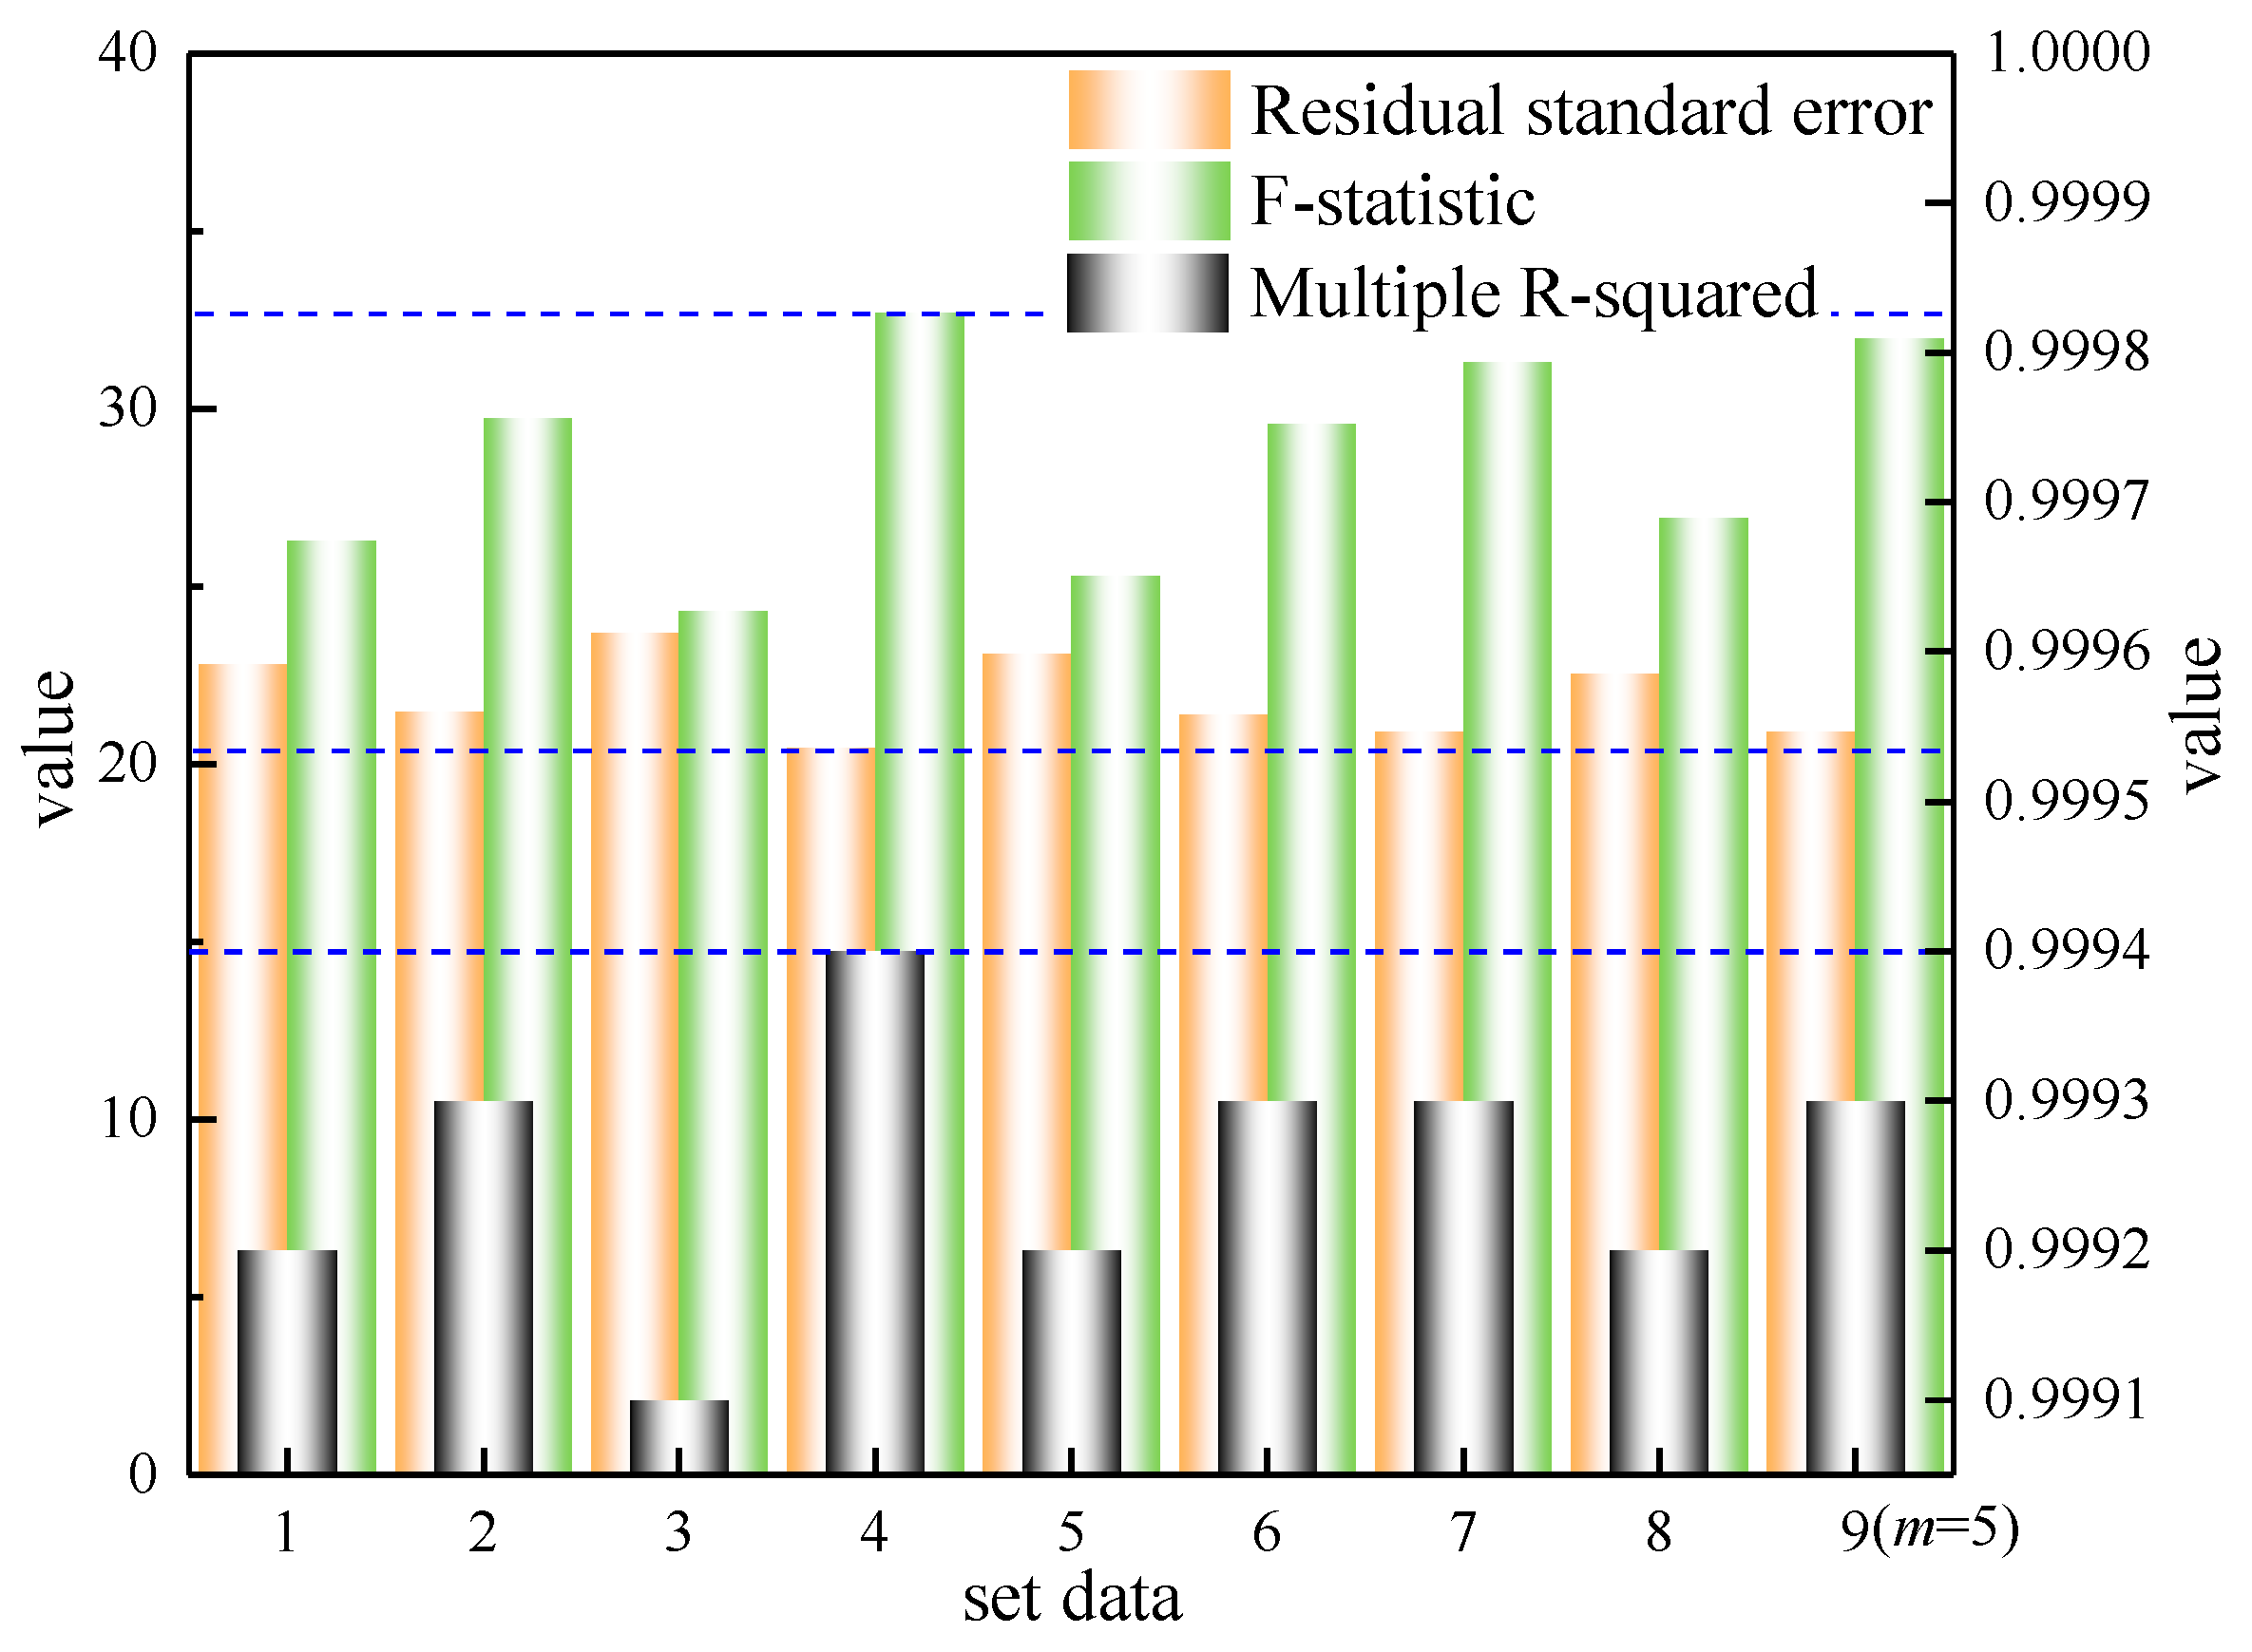
3.2. Fill Scenario Data

A total of 51 cases were obtained, with 1683 data and 312 missing data, with a missing rate of 18.54%. When the missing rate is about 20%, compared with the deletion method, mean (mode) method, and regression method, the R-mice filling effect is the best [11]. The specific steps are shown in Section 2.2. In this section, the value of m is determined and a complete dataset is obtained.
First, calculate the total variance t (Equation (4)) of the complete factor set x1, x2, x9~x15, x17~x20, and x22 filled under different values of m through code 1 and code 2. The above value of t is smaller the better. The results are shown in Figure 5. The t value of each complete factor set under eleven different m values is presented in the form of a scatter plot. As the m value increases, the t value continues to decrease. Observing the black dashed line in Figure 5, it can be seen that when m ≥ 8, the change in the t value is small, or even no longer changes. That is, when m > 8, the value of m has little effect on the value of t. Therefore, the value of m is 8 in this work.
  • code 1: data <-mice(x, m = I, maxit = 100, seed = 2020), i = 1, 2, …, n
  • code 2: fit <- with(data, lm (x0~x1 + x2 + … + x21+ x22))
u = 1 n i = 1 n ( x i x ¯ ) 2 t = u + ( 1 + 1 m ) × u 1 2
where m refers to the number of interpolated datasets, maxit refers to the number of iterations, seed refers to the number of set seeds, and u refers to the mean squared error (MSE).
Then, use code 3 to find eight complete datasets, use code 4 to analyze them, and find the residual standard error (on 57 degrees of freedom), the multiple R-squared, and the F statistic value. It is not difficult to see from the three dashed lines in Figure 6 that the parameters of the fourth dataset are the best in all datasets. Among them, dataset 9 is the dataset with the best parameters when m is 5. Therefore, this article chooses the fourth dataset as the input of the predictive model. Moreover, the results show that determining the value of m by the above method can make the filled data better fit the real data. The impact on the forecast results will be analyzed below.
  • code 3: data y <- complete(data, y), y = 1, 2, 3, …, 8
  • code 4: fit y <- with(data y, lm (x0~x1 + x2 + … + x21 + x22))
where the code 3 is to fill in one of the eight filling datasets to the vacant position, and finally form a complete dataset.
Based on the filled complete dataset and expert knowledge, the structure of the prediction model is learned, and then the dataset is learned according to the training ratio of 8:2, and the final fire occurrence trend prediction and prediction model is obtained as shown in Figure 7.

4. Results and Discussion

This section considers the predictive reasoning of the Bayesian network, that is, forward propagation analysis [28,39]. By comprehensively using the fire scenario data and expert knowledge of Hubei Province in 2018, it is input into the prediction model to predict the trend of fire occurrence in Hubei Province in 2019, and compared with actual data to verify the accuracy of the model.
This paper uses the area under the Receiver Operating Characteristic (ROC) curve, that is, the AUC value, to test the prediction effect. Among them, the AUC standard for judging the pros and cons of the prediction model is shown in Table 2 [40,41]. The classification threshold is calculated through the Youden index (Equation (4)). When the predicted probability is greater than the threshold, it is considered to happen; otherwise, it is considered not to happen [42].
Youden index = specificity + sensitivity − 1

4.1. Predictive Reasoning

Through the controlled variable method, three other sets of prediction models are constructed, as shown in Table 3, in which feature screening is to screen out features that have greater weight on the predictor variables from the original data, and the methods include filtering, wrapping, and embedded; this article uses the filtering, because it and HAZOP both screen the data before building the predictive model. According to the analysis and processing of the screening method and m value, the status of each scenario data of each city in Hubei Province in 2018 is obtained then input into the prediction model to find the fire occurrence trend in 2019. The prediction effect is tested using the ROC curve and AUC, as shown in Figure 8.
When m is 5 (the default and the most used), it is better to use HAZOP (3) to screen the data compared with no screening (1) and using the filtering method (2). First, the amount of calculation required is relatively small. Second, it can not only screen quantitative data, but also qualitative data, and the operation difficulty is relatively low. The most important thing is that part of the predictive model construction is completed in the screening process, that is, the state of the node, which greatly reduces the time consumed and improves the efficiency of screening. Finally, the forecasting effect is better (82.52843 > 78.59072 > 77.44641). Therefore, HAZOP is more suitable for data screening.
Compared with m = 5 based on the HAZOP method (3), the prediction effect of m = 8 based on the HAZOP method (4) is better (94.08003 > 82.52844). Although there are differences in other aspects, they are negligible and can be ignored. The results show that improved multiple imputation based on R language can be used for data processing before constructing a prediction model, and it has a good prediction effect (AUC = 94.0800).
Taking full account of the geographical location, population density, and GDP distribution of each city in Hubei Province, combined with the prediction results in Figure 9, a fire risk map of Hubei Province is finally generated, as shown in Figure 9. It can be seen from Figure 9 that the eastern part of Hubei Province is economically developed, although the population is dense, the fire risk is low; the western region is relatively backward in the economy and sparsely populated, but the fire risk is high, especially in the southwest.
The reason for this phenomenon may be that compared with the eastern region, the western region has a higher terrain, mostly mountainous areas, and inconvenient transportation. In addition, the processing industry is relatively weak, the development of the high-precision tertiary industry is relatively lagging, the degree of industrialization is low, and the economic relevance is low. This has led to the relatively slow economic development of the western region and the inability to provide sufficient funds and talents for the development of fire rescue services. It is directly manifested in the lack of firefighting funds, weak government supervision, insufficient propaganda, and inadequate facilities and equipment.

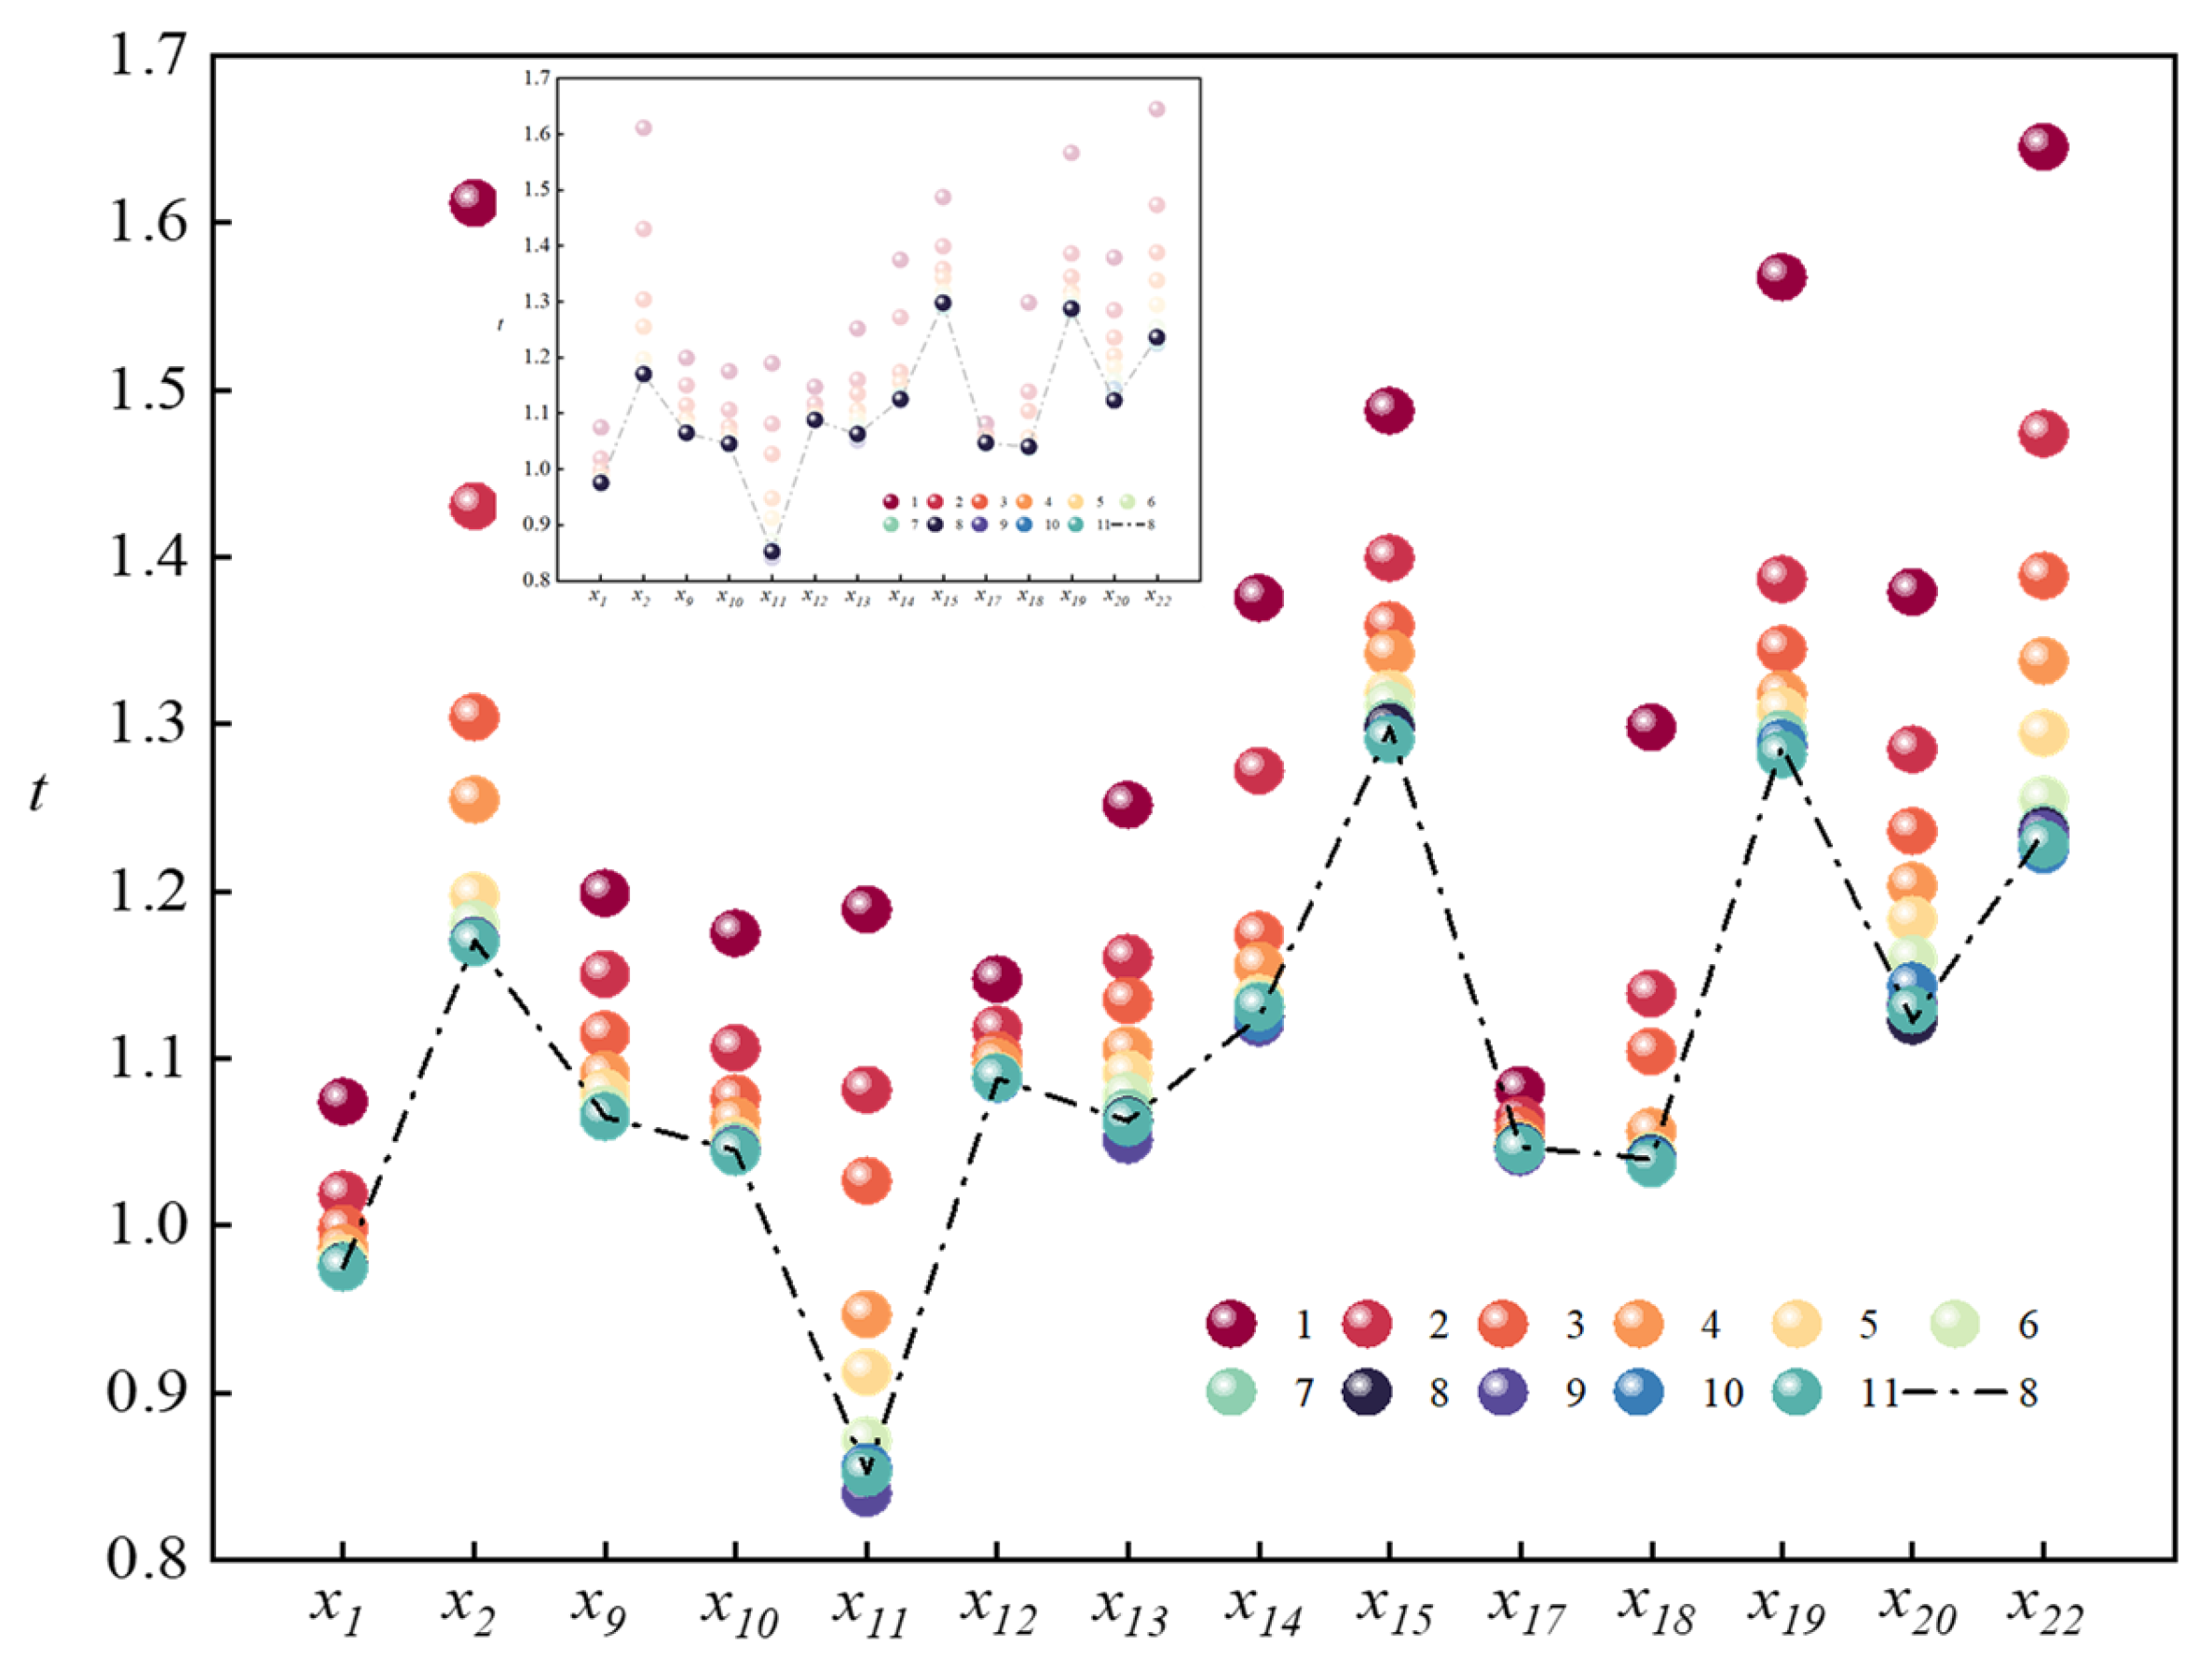
4.2. Sensitivity Analysis

Sensitivity analysis refers to the study of the impact degree of changes in one node in the prediction model on other nodes from the perspective of quantitative analysis, which can identify errors in network structure or CPT [28,43], and provide the basis for risk analysis and control measures. In this paper, entropy reduction (Equation (6)) is used to quantify the sensitivity [44], and the nodes were sorted according to the impact of the results on x0 nodes. The results of the sensitivity analysis are shown in Table 4.
E R = H ( Y ) H ( Y X ) = y x P ( y , x ) log 2 y , x P ( y ) P ( x )
where H(Y) is the entropy and H(Y|X) is the conditional entropy.
As shown in Table 4, y5 is the most significant variable, leading to the maximum entropy reduction of x0. y1 and y4 also have a large impact, with entropy reduction of more than 20%. However, the influence of y3 and y2 is relatively small, and the entropy reduction is less than 10%, so they are not suitable to be used as control variables in the prediction. Therefore, y5, y1, and y4 can be used as control variables.
Compared to reality, the result of sensitivity is reasonable. Because if the government’s supervision is insufficient, fire hazards cannot be managed in time, firefighting funds cannot be fully utilized, firefighting equipment and facilities will lag behind more and more complex fire situations, and even people’s safety awareness will become weak, leading to urban fire risks. The rapid increase cannot be controlled by the emergency rescue capability alone, that is, it cannot improve the state of the target node alone. Because of the importance of supervision and management, the relevant departments should attach great importance to the development and soundness of efficient and resilient supervision mechanisms and systems.

4.3. Measures and Suggestions

The western region should develop processing industries, promote the development of leading industries from resource exporting to processing industries, and increase the added value of products; develop a tertiary industry with a high rate of return, increase the degree of relevance to surrounding industries, cultivate new economic growth points, and drive the development of other industries; and take advantage of talents, develop high-tech industries and emerging industries, and accelerate the pace of transforming scientific and technological achievements into productivity, so that there are surplus funds to develop the firefighting and rescue business, to meet the growing safety needs of the people.
Among them, cities of F, O, K, D, M, E, and L should strengthen supervision, promptly discover and supervise the elimination of fire hazards (especially electrical hazards), and archive major hazards and conduct regular inspections; timely check, repair, update, upgrade, and add rescue equipment to ensure that they play their due role in the disaster; and strengthen the publicity, innovative publicity ways, expand the scope of publicity, make fire prevention propaganda ubiquitous, and subtly improve people’s safety awareness and skills. While strengthening supervision and propaganda, other cities also need to improve the legal system for fires, increase penalties for deliberate arson, and restrict them.

5. Conclusions

Aiming at the fire prediction model of firefighters, they can accurately obtain the relevant scenario data, predict the fire trend of the next year for the first time, and provide a quantitative basis for effective control measures to reduce the number of fires. This paper constructs a predictive model, analyzes, verifies, and applies the predictive model, and the results show that the model can predict the trend of fire occurrence well. It can not only propose specific measures for a certain city, but also provide a strong basis for a province to formulate accurate and effective fire protection planning, thereby reducing the number of fires, casualties, and property losses, and building a safe living environment. The specific conclusions are as follows:
  • Using the HAZOP method to screen data can complete multiple tasks in a shorter time and make full use of expert knowledge and collected data. This method combines qualitative and quantitative data, which not only makes expert knowledge more convincing but also makes data more meaningful and valuable.
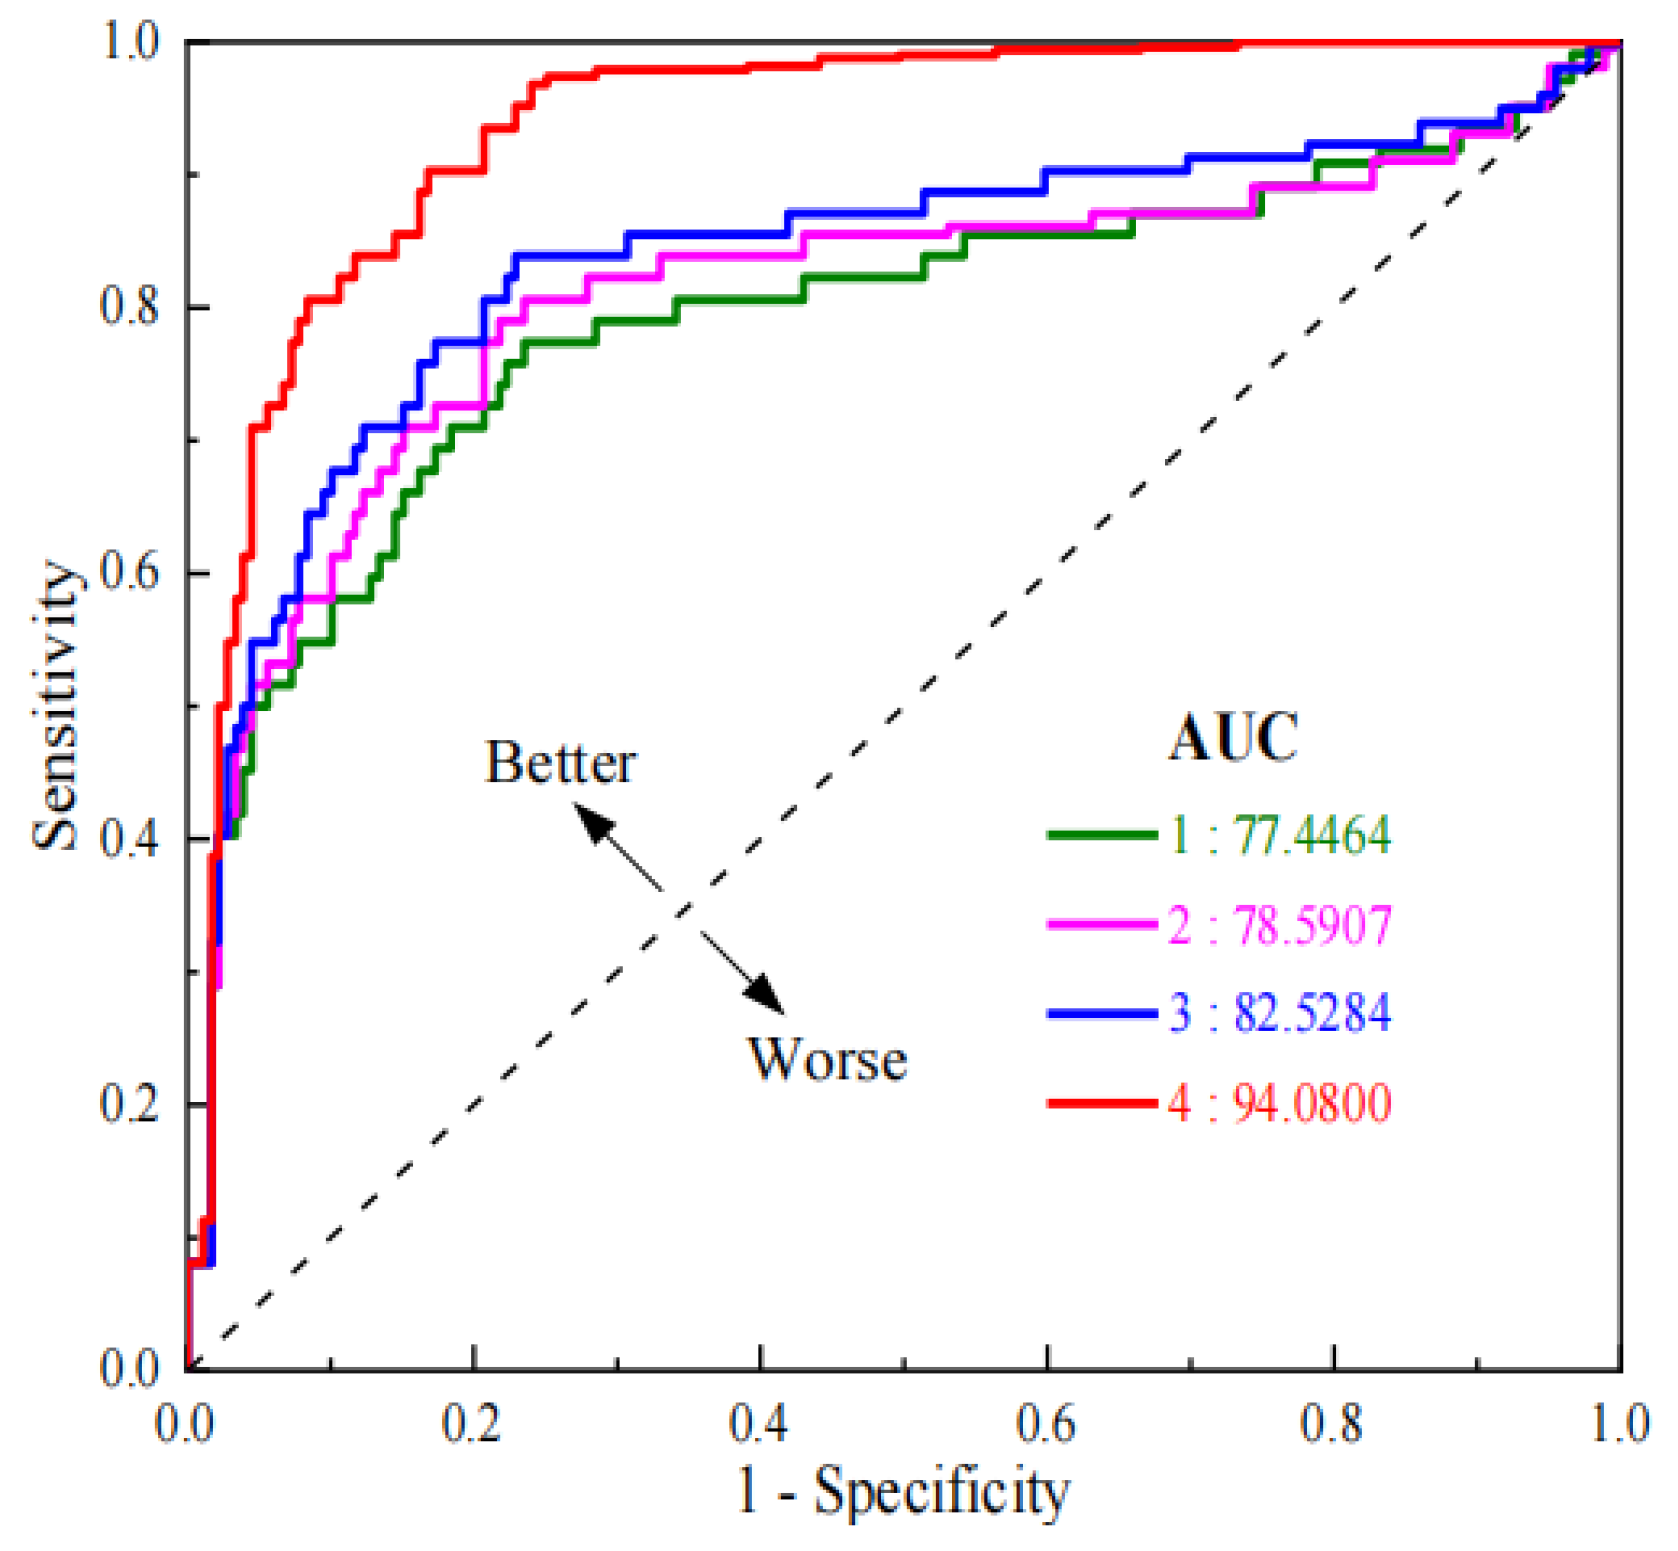
  • Determining the value of m through relevant parameters fully considers the randomness of filling data and the differences between datasets. By continuously changing the value of m and using the relevant parameters as the basis for judgment, the best filling data are selected, so that the complete dataset obtained is closer to the real data, and the prediction effect of the prediction model is greatly improved (AUC: 94.0800 > 82.5284).
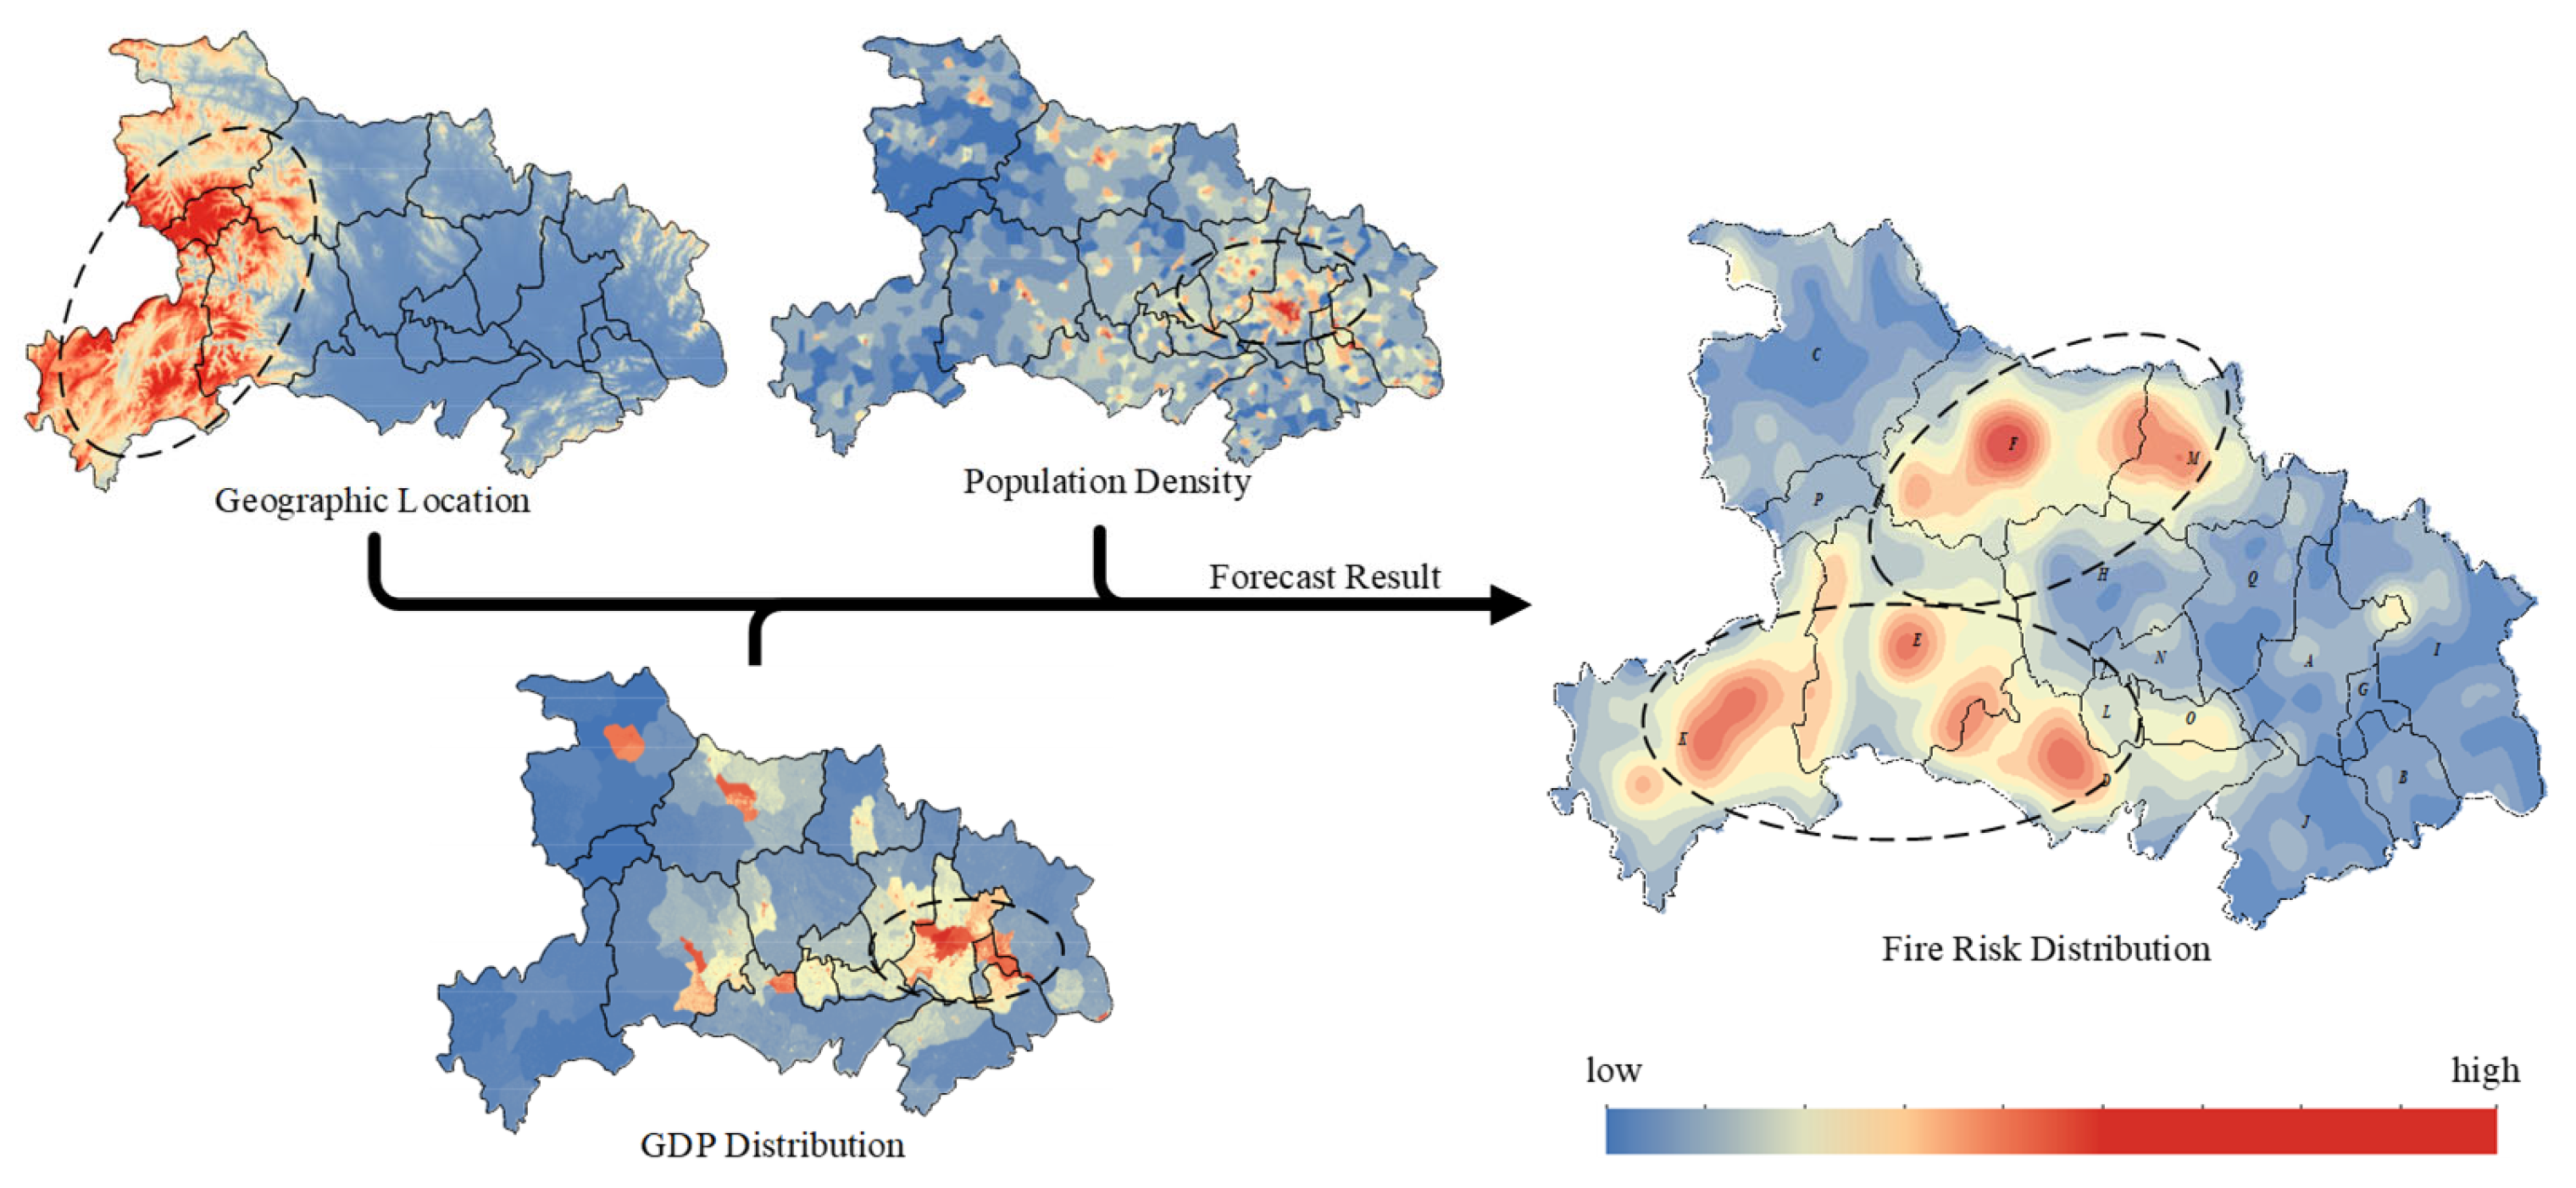
  • The forecast results show that the western part of Hubei Province (especially the southwestern part) is a high fire risk area, which is consistent with the actual situation. The reason may be that its geographic location and development strategy has caused its economic development to lag, lack of rich funds to develop the fire protection industry, neglect of safety management, and generally low awareness of public safety. For the above reasons, this article puts forward some suggestions for improvement, see Section 4.3 for details.

Author Contributions

Conceptualization, J.W.; formal analysis, T.L. and M.Y.; investigation, X.J.; writing—original draft preparation, T.L.; writing—review and editing, J.W. and M.Y.; supervision, K.L. All authors have read and agreed to the published version of the manuscript.

Funding

This research was funded by the National Natural Science Foundation of China under Grant Nos. 52076199 and 51806156.

Data Availability Statement

The data presented in this study are available on request from the corresponding author. The data are not publicly available due to privacy.

Acknowledgments

This study was supported by the National Natural Science Foundation of China under Grant Nos. 52076199 and 51806156. The authors gratefully acknowledge all these supports.

Conflicts of Interest

The authors declare no conflict of interest.

References

  1. Alipour, M.; La Puma, I.; Picotte, J.; Shamsaei, K.; Rowell, E.; Watts, A.; Kosovic, B.; Ebrahimian, H.; Taciroglu, E. A Multimodal Data Fusion and Deep Learning Framework for Large-Scale Wildfire Surface Fuel Mapping. Fire 2023, 6, 36. [Google Scholar] [CrossRef]
  2. Tavakol Sadrabadi, M.; Innocente, M.S. Vegetation Cover Type Classification Using Cartographic Data for Prediction of Wildfire Behaviour. Fire 2023, 6, 76. [Google Scholar] [CrossRef]
  3. Mahamed (Polinova), M.; Wittenberg, L.; Kutiel, H.; Brook, A. Fire Risk Assessment on Wildland–Urban Interface and Adjoined Urban Areas: Estimation Vegetation Ignitability by Artificial Neural Network. Fire 2022, 5, 184. [Google Scholar] [CrossRef]
  4. Kussul, N.; Fedorov, O.; Yailymov, B.; Pidgorodetska, L.; Kolos, L.; Yailymova, H.; Shelestov, A. Fire Danger Assessment Using Moderate-Spatial Resolution Satellite Data. Fire 2023, 6, 72. [Google Scholar] [CrossRef]
  5. Łopucki, R.; Kiersztyn, A.; Pitucha, G.; Kitowski, I. Handling missing data in ecological studies: Ignoring gaps in the dataset can distort the inference. Ecol. Model. 2022, 468, 109964. [Google Scholar] [CrossRef]
  6. Xiong, Z.; Guo, H.; Wu, Y. Review of Missing Data Processing Methods. Comput. Eng. Appl. 2021, 57, 27–38. [Google Scholar]
  7. Dempster, A.P.; Laird, N.M.; Rubin, D.B. Maximum likelihood from incomplete data via the EM algorithm. J. R. Stat. Soc. Ser. B Methodol. 1977, 39, 1–22. [Google Scholar]
  8. Little, R.J.A. Hierarchical Logistic Regression Models for Imputation of Unresolved Enumeration Status in Undercount Estimation: Comment. J. Am. Stat. Assoc. 1993, 88, 1159. [Google Scholar] [CrossRef]
  9. Rubin, D.B.; Service, E.T. Multiple imputations in sample surveys—A phenomenological Bayesian approach to nonresponse. In Proceedings of the Survey Research Methods Section of the American Statistical Association, Alexandria, VA, USA, 2 January 1978. [Google Scholar]
  10. Razavi-Far, R.; Cheng, B.; Saif, M.; Ahmadi, M. Similarity-learning information-fusion schemes for missing data imputation. Knowl.-Based Syst. 2020, 187, 104805. [Google Scholar] [CrossRef]
  11. Gondara, L.; Wang, K. MIDA: Multiple Imputation Using Denoising Autoencoders. Adv. Knowl. Discov. Data Min. 2018, 91, 10939. [Google Scholar]
  12. Mohammed, Y.S.; Abdelkader, H.; Pławiak, P.; Hammad, M. A novel model to optimize multiple imputation algorithm for missing data using evolution methods. Biomed. Signal Process. Control 2022, 76, 103661. [Google Scholar] [CrossRef]
  13. Li, W.; Wang, Y.; Zhang, J.; Li, J.; Huang, B. Application of MICE in R for imputing incomplete multivariate data. Chin. J. Hosp. Stat. 2011, 18, 309–312. [Google Scholar]
  14. Jakobsen, J.C.; Gluud, C.; Wetterslev, J.; Winkel, P. When and how should multiple imputation be used for handling missing data in randomised clinical trials—A practical guide with flowcharts. BMC Med. Res. Methodol. 2017, 17, 162. [Google Scholar] [CrossRef] [Green Version]
  15. Cory, W.O.; Bishrant, A.; Simon, P.A.; Paddington, H.; Chen, X.; Thomas, A.M. Predicting Fire Propagation across Heterogeneous Landscapes Using WyoFire: A Monte Carlo-Driven Wildfire Model. Fire 2020, 3, 71. [Google Scholar]
  16. Malik, A.A.; Nasif, M.S.; Arshad, U.; Mokhtar, A.A.; Tohir, M.Z.; Al-Waked, R. Predictive Modelling of Wind-Influenced Dynamic Fire Spread Probability in Tank Farm Due to Domino Effect by Integrating Numerical Simulation with ANN. Fire 2023, 6, 85. [Google Scholar] [CrossRef]
  17. Liu, X.; Lu, Y.; Xia, Z.; Li, F.; Zhang, T. A Data Mining Method for Potential Fire Hazard Analysis of Urban Buildings based on Bayesian Network. In Proceedings of the 2nd International Conference on Intelligent Information Processing—IIP’17, Bangkok, Thailand, 17–18 July 2017; ACM Press: New York, NY, USA, 2017; pp. 1–6. [Google Scholar]
  18. Jin, G.; Wang, Q.; Zhu, C.; Feng, Y.; Huang, J.; Hu, X. Urban Fire Situation Forecasting: Deep sequence learning with spatio-temporal dynamics. Appl. Soft Comput. 2020, 97, 106730. [Google Scholar] [CrossRef]
  19. Sattari, F.; Macciotta, R.; Kurian, D.; Lefsrud, L. Application of Bayesian network and artificial intelligence to reduce accident/incident rates in oil & gas companies. Saf. Sci. 2021, 133, 104981. [Google Scholar]
  20. Squillante, R.; Santos Fo, D.J.; Maruyama, N.; Junqueira, F.; Moscato, L.A.; Nakamoto, F.Y.; Miyagi, P.E.; Okamoto, J. Modeling accident scenarios from databases with missing data: A probabilistic approach for safety-related systems design. Saf. Sci. 2018, 104, 119–134. [Google Scholar] [CrossRef]
  21. Carpenter, J.R.; Kenward, M.G. Multiple Imputation And Its Application. Int. Stat. Rev. 2014, 82, 151–152. [Google Scholar]
  22. Schafer, J.L. Multiple imputation: A primer. Stat. Methods Med. Res. 1999, 8, 3–15. [Google Scholar] [CrossRef]
  23. Buuren, S.V. Flexible Imputation of Missing Data; Chapman and Hall/CRC: New York, NY, USA, 2012. [Google Scholar]
  24. Marhavilas, P.K.; Filippidis, M.; Koulinas, G.K.; Koulouriotis, D.E. An expanded HAZOP-study with fuzzy-AHP (XPA-HAZOP technique): Application in a sour crude-oil processing plant. Saf. Sci. 2020, 124, 104590. [Google Scholar] [CrossRef]
  25. Dunjo, J.; Fthenakis, V.; Vilchez, J.A.; Arnaldos, J. Hazard and operability (HAZOP) analysis. A literature review. J. Hazard. Mater. 2010, 173, 19–32. [Google Scholar] [CrossRef] [PubMed]
  26. Dohoo, I.R.; Nielsen, C.R.; Emanuelson, U. Multiple imputation in veterinary epidemiological studies: A case study and simulation. Prev. Vet. Med. 2016, 129, 35–47. [Google Scholar] [CrossRef] [PubMed] [Green Version]
  27. Flatau Harrison, H.; Griffin, M.A.; Gagne, M.; Andrei, D. Assessing shortened safety climate measures: Simulating a planned missing data design in a field setting. Saf. Sci. 2018, 104, 189–201. [Google Scholar] [CrossRef]
  28. Enders, C.K. Applied Missing Data Analysis, 1st ed.; The Guilford Press: New York, NY, USA, 2010. [Google Scholar]
  29. Lawrence, J.-M.; Ibne Hossain, N.U.; Jaradat, R.; Hamilton, M. Leveraging a Bayesian network approach to model and analyze supplier vulnerability to severe weather risk: A case study of the U.S. pharmaceutical supply chain following Hurricane Maria. Int. J. Disaster Risk Reduct. 2020, 49, 101607. [Google Scholar] [CrossRef] [PubMed]
  30. Cooper, G.F.; Herskovits, E. A Bayesian method for the induction of probabilistic networks from data. Mach. Learn. 1992, 9, 309–347. [Google Scholar] [CrossRef] [Green Version]
  31. Dlamini, W.M. Application of Bayesian networks for fire risk mapping using GIS and remote sensing data. GeoJournal 2011, 76, 283–296. [Google Scholar] [CrossRef]
  32. Sevinc, V.; Kucuk, O.; Goltas, M. A Bayesian network model for prediction and analysis of possible forest fire causes. For. Ecol. Manag. 2020, 457, 117723. [Google Scholar] [CrossRef]
  33. Leao, T.; Madeira, S.C.; Gromicho, M.; De Carvalho, M.; Carvalho, A.M. Learning dynamic Bayesian networks from time-dependent and time-independent data: Unraveling disease progression in Amyotrophic Lateral Sclerosis. J. Biomed. Inform. 2021, 117, 103730. [Google Scholar] [CrossRef]
  34. Lee, S.; Kang, J.E.; Park, C.S.; Yoon, D.K.; Yoon, S. Multi-risk assessment of heat waves under intensifying climate change using Bayesian Networks. Int. J. Disaster Risk Reduct. 2020, 50, 101704. [Google Scholar] [CrossRef]
  35. Baksh, A.-A.; Khan, F.; Gadag, V.; Ferdous, R. Network based approach for predictive accident modelling. Saf. Sci. 2015, 80, 274–287. [Google Scholar] [CrossRef]
  36. Liu, H.; Guo, Y. Design and implementation of fire prediction model based on scenario data. Technol. Innov. Appl. 2018, 26, 79–80. [Google Scholar]
  37. Guyon, I.; Elisseeff, A. An Introduction of Variable and Feature Selection. J. Mach. Learn. Res. Spec. Issue Var. Feature Sel. 2003, 3, 1157–1182. [Google Scholar]
  38. Liang, H.; Zhang, M.; Wang, H. A Neural Network Model for Wildfire Scale Prediction Using Meteorological Factors. IEEE Access 2019, 7, 176746–176755. [Google Scholar] [CrossRef]
  39. Neil, M. Risk Assessment and Decision Analysis with Bayesian Networks, 2nd ed.; Chapman and Hall/CRC: Boca Raton, FL, USA, 2018. [Google Scholar]
  40. Gu, X.; Wu, Z.; Zhang, Y.; Yan, S.; Fu, J.; Du, L. Prediction research of the forest fire in Jiangxi province in the background of climate change. Acta Ecol. Sin. 2020, 40, 667–677. [Google Scholar]
  41. Bai, H.; Liu, X.; Niu, S.; He, Y. Construction of forest fire prediction model based on Bayesian model averaging method: Taking Dali Prefecture, Yunnan Province of southwestern China as an example. J. Beijing For. Univ. 2021, 43, 44–52. [Google Scholar]
  42. Chang, Y.; Zhu, Z.; Bu, R.; Chen, H.; Feng, Y.; Li, Y.; Hu, Y.; Wang, Z. Predicting fire occurrence patterns with logistic regression in Heilongjiang Province, China. Landsc. Ecol. 2013, 28, 1989–2004. [Google Scholar] [CrossRef]
  43. Pollino, C.A.; Woodberry, O.; Nicholson, A.; Korb, K.; Hart, B.T. Parameterisation and evaluation of a Bayesian network for use in an ecological risk assessment. Environ. Model. Softw. 2007, 22, 1140–1152. [Google Scholar] [CrossRef]
  44. De Iuliis, M.; Kammouh, O.; Cimellaro, G.P.; Tesfamariam, S. Quantifying restoration time of pipelines after earthquakes: Comparison of Bayesian belief networks and fuzzy models. Int. J. Disaster Risk Reduct. 2021, 64, 102491. [Google Scholar] [CrossRef]
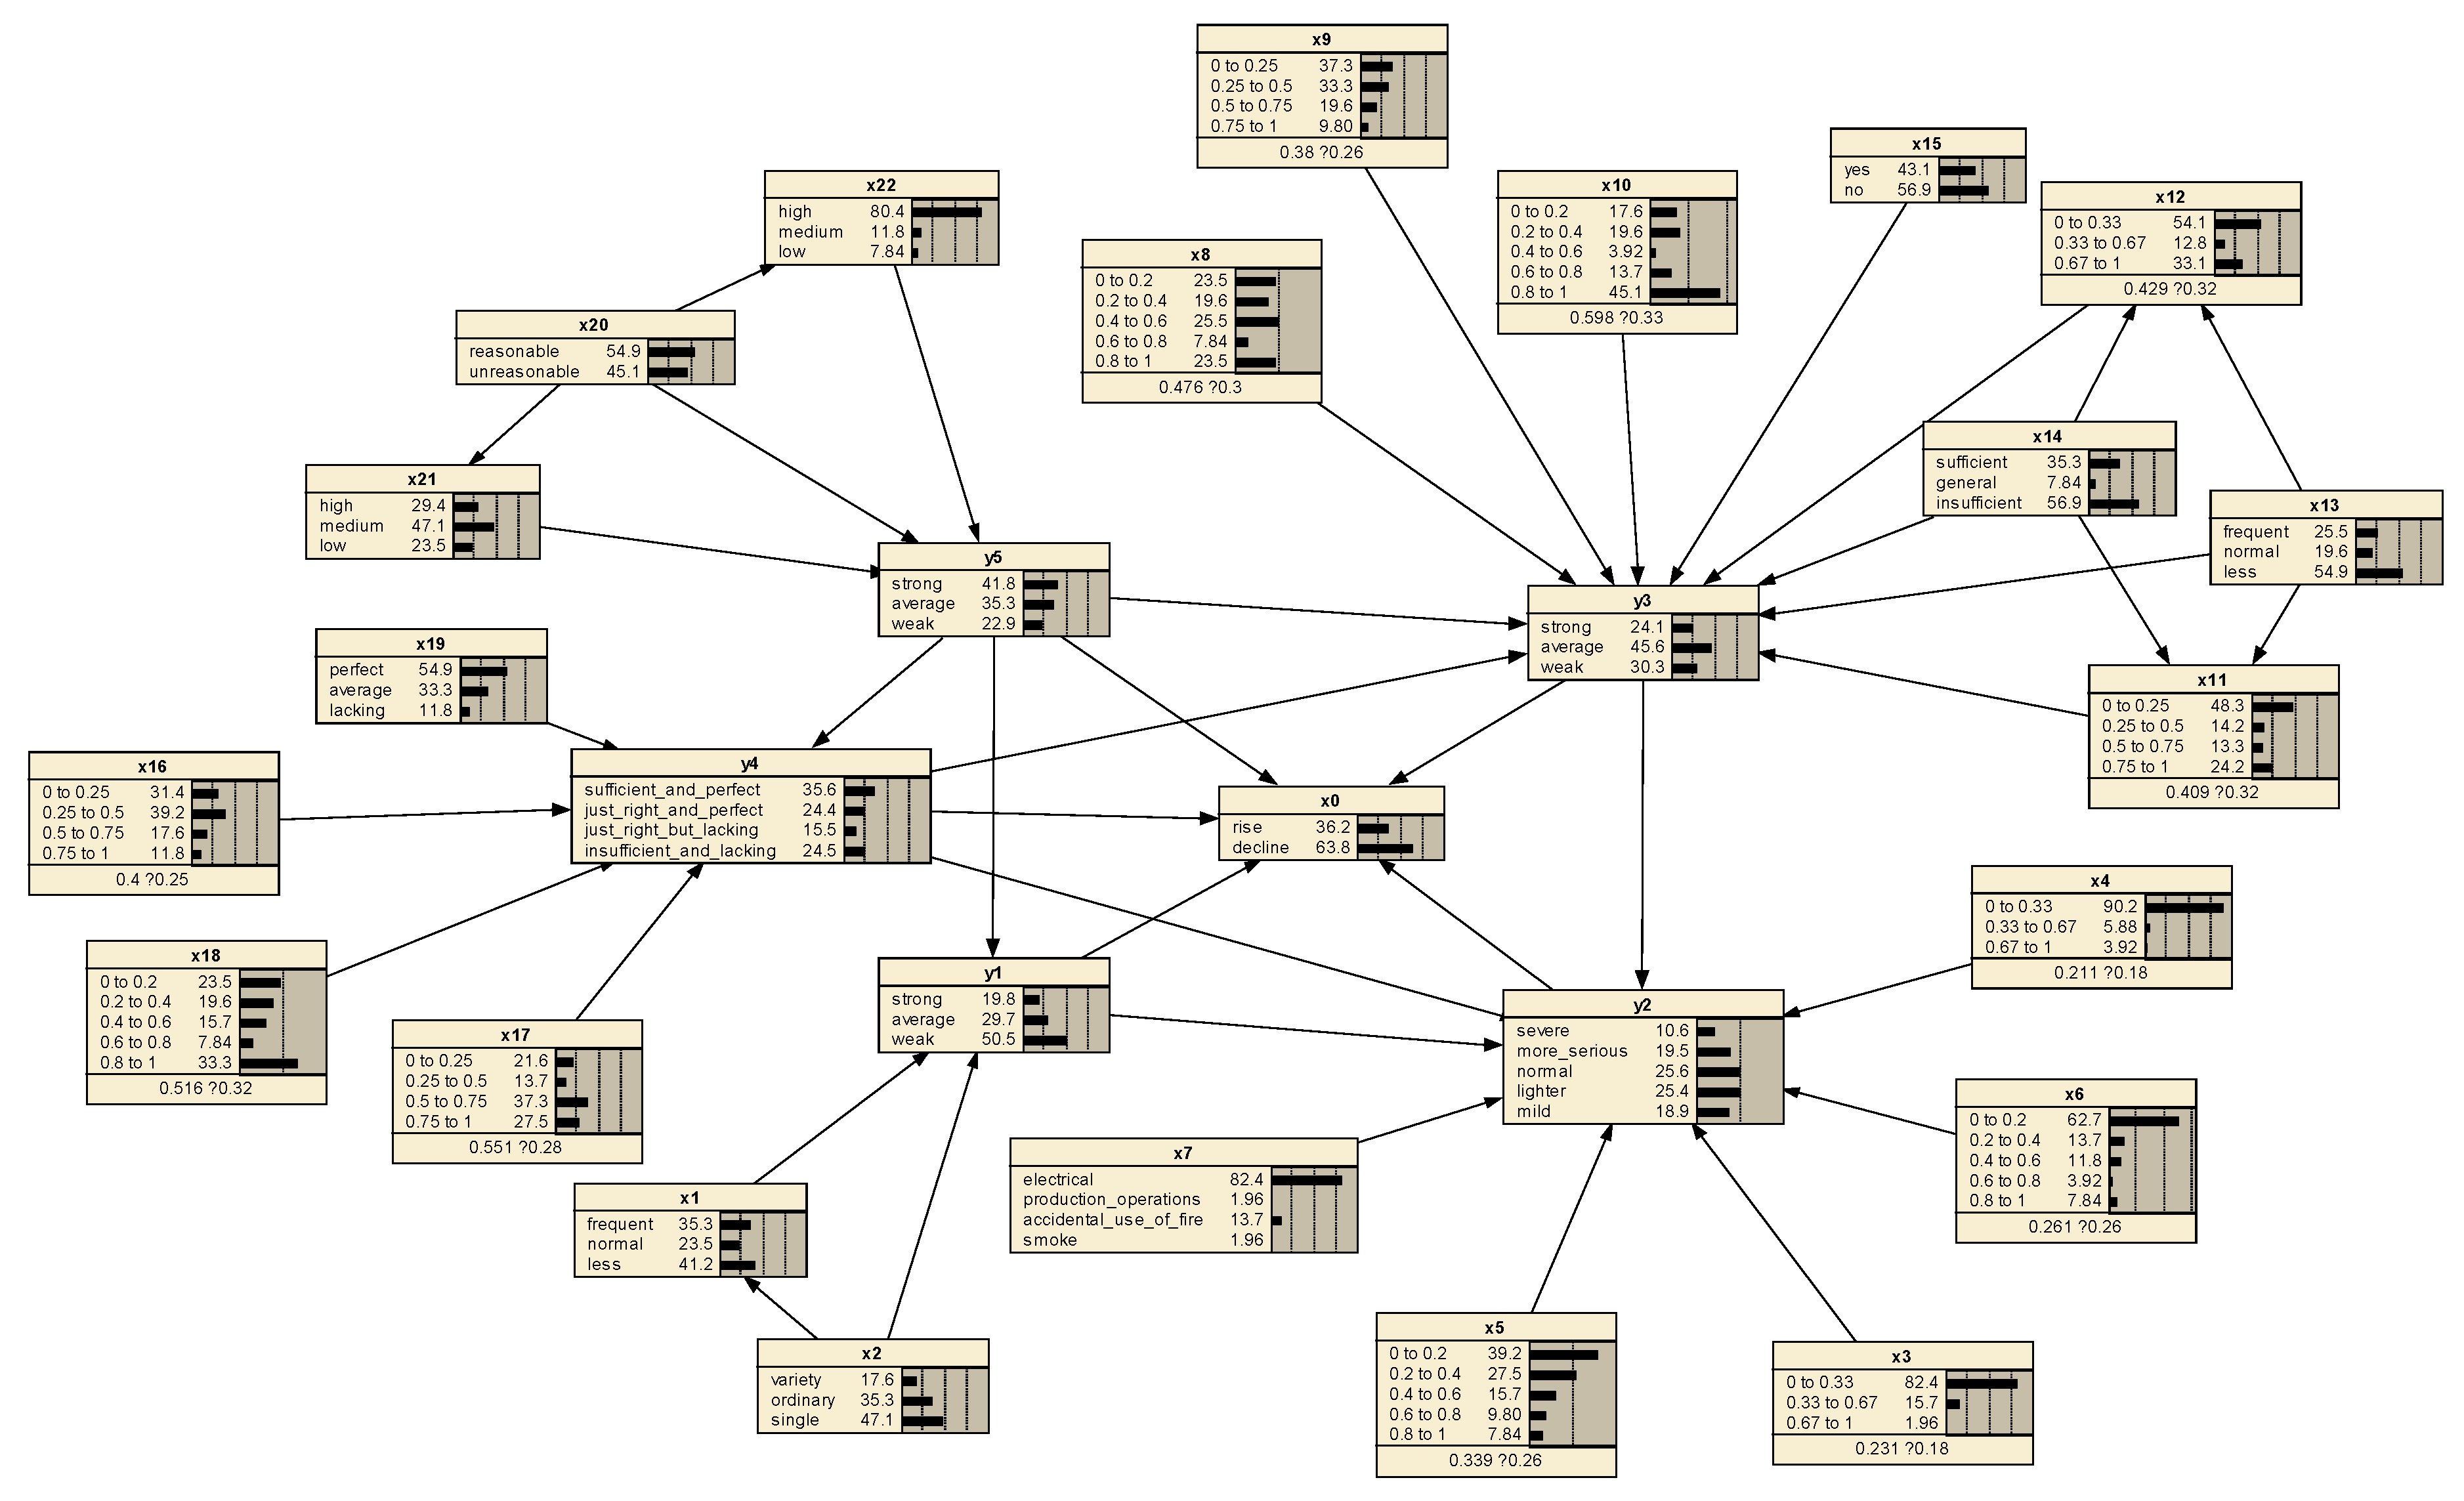
Figure 1. Schematic diagram of improving multiple imputation based on R language.
Fire 06 00235 g001
Figure 2. The HAZOP analysis process flow diagram.
Fire 06 00235 g002
Figure 3. Simple Bayesian network. (a) A table of some cases; (b) The network structure and condition probability table of a person with moderate security awareness; (c) The network structure and condition probability table of a person with extremely weak security awareness; (d) The network structure and condition probability table of a person with extremely high security awareness.
Fire 06 00235 g003
Figure 4. Flow chart of screening scenario data using HAZOP.
Fire 06 00235 g004
Figure 5. The value of t under different m values.
Fire 06 00235 g005
Figure 6. Related parameters of the interpolated dataset.
Fire 06 00235 g006
Figure 7. Fire occurrence trend prediction model.
Fire 06 00235 g007
Figure 8. The ROC curve and AUC value of the prediction model.
Fire 06 00235 g008
Figure 9. Visualization of fire trend prediction results in Hubei Province.
Fire 06 00235 g009
Table 1. Prediction model structure about the fire trend.
Test No.First-Level IndicatorsScenario Data (Illustration)Abbr.Deviation
1Safety awareness y1propaganda situation
fire propaganda method (internet, slogans, lectures, etc.)
x1
x2
frequent, normal, less
variety, ordinary, single
2Adverse effects y2number of dead
number of injures
direct economic loss
affected households
x3
x4
x5
x6
[0, 0.33), [0.33, 0.67), [0.67, 1]
[0, 0.33), [0.33, 0.67), [0.67, 1]
[0, 0.2), [0.2, 0.4), [0.4, 0.6), [0.6, 0.8), [0.8, 1]
[0, 0.2), [0.2, 0.4), [0.4, 0.6), [0.6, 0.8), [0.8, 1]
Cause of the fire (electrical, production operations, accidental use of fire, smoking, nature, lightning strikes, static electricity, arson, etc.)x7dominant reason
3Emergency rescue capability y3alarm dispatch situation
number of combatants
number of dispatched vehicles
number of rescuers
salvage property value
joint training situation
emergency plan preparation
fire research results
x8
x9
x10
x11
x12
x13
x14
x15
[0, 0.2), [0.2, 0.4), [0.4, 0.6), [0.6, 0.8), [0.8, 1]
[0, 0.25), [0.25, 0.5), [0.5, 0.75), [0.75, 1]
[0, 0.2), [0.2, 0.4), [0.4, 0.6), [0.6, 0.8), [0.8, 1]
[0, 0.25), [0.25, 0.5), [0.5, 0.75), [0.75, 1]
[0, 0.33), [0.33, 0.67), [0.67, 1]
frequent, normal, less
sufficient, general, insufficient
yes, no
4Equipment and facilities y4number of fire stations
number of fire engines
number of rescue equipment
public fire protection facilities (fire hydrants, smoke alarms, etc.)
x16
x17
x18
x19
[0, 0.25), [0.25, 0.5), [0.5, 0.75), [0.75, 1]
[0, 0.25), [0.25, 0.5), [0.5, 0.75), [0.75, 1]
[0, 0.2), [0.2, 0.4), [0.4, 0.6), [0.6, 0.8), [0.8, 1]
perfect, average, lacking
5Supervision intensity y5organizational structure (informatization, flattening, and standardization)
hidden danger rectification rate ((Nrectifications)/(Ndiscoveries))
fire protection expenditure utilization rate ((use/approve))
x20
x21
x22
reasonable, unreasonable
high, medium, low
high, medium, low
Table 2. AUC standard for judging the pros and cons of the prediction model.
AUC[0.5, 0.7][0.7, 0.85][0.85, 0.95][0.95, 1]
Effectlowfairgoodperfect
Table 3. Condition setting of data processing before the model construction.
Text No.Data Screening Methodm Value
1/5
2Filtering5
3HAZOP5
4HAZOPm
Table 4. The influence of sensitivity analysis results based on entropy reduction on x0.
Nodesy5y1y4y3y2
ER0.71750.32380.2610.13760.1279
Percentage (%)45.3326.7720.119.678.93
Disclaimer/Publisher’s Note: The statements, opinions and data contained in all publications are solely those of the individual author(s) and contributor(s) and not of MDPI and/or the editor(s). MDPI and/or the editor(s) disclaim responsibility for any injury to people or property resulting from any ideas, methods, instructions or products referred to in the content.

