Article

A Cold Climate Wooden Home and Conflagration Danger Index: Justification and Practicability for Norwegian Conditions

Fire Disasters Research Group, Department of Safety, Chemistry and Biomedical Laboratory Sciences, Western Norway University of Applied Sciences, 5533 Haugesund, Norway
*
Author to whom correspondence should be addressed.
Fire 2023, 6(10), 377; https://doi.org/10.3390/fire6100377
Submission received: 30 August 2023 / Revised: 24 September 2023 / Accepted: 28 September 2023 / Published: 30 September 2023

Abstract

:
The vast majority of fire-related deaths occur in residential buildings. Until recently, the fire risk for these buildings was only considered through static risk assessments or period-based assessments applying to certain periods of the year, e.g., Christmas holidays. However, for homes with indoor wooden panelling, especially in the ceiling, a dynamic fire danger indicator can be predicted for cold climate regions. Recognising the effect of fuel moisture content (FMC) of indoor wooden panelling on the enclosure fire development allows for the prediction of a wooden home fire danger indicator. In the present study, dry wood fire dynamics are analysed and experimental observations are reported to support in-home wooden panel FMC as a suitable wooden home fire danger indicator. Then, from previous work, the main equation for modelling in-home FMC is considered and a generic enclosure for FMC modelling is justified based on literature data and supported through a sensitivity study for Norwegian wooden homes. Further, ten years of weather data for three selected locations in Norway, i.e., a coastal town, an inland fjord town and a mountain town, were analysed using a three-dimensional risk matrix to assess the usability of the fire risk modelling results. Finally, a cold climate wooden home fire danger index was introduced to demonstrate how the risk concept can be communicated in an intuitive way using similar gradings as the existing national forest fire index. Based on the generic enclosure, the findings support FMC as a fire risk indicator for homes with interior wooden panelling (walls and ceiling). Large differences in the number of days with arid in-home conditions were identified for the selected towns. The number of days with combined strong wind and dry wooden homes appears to depend more on the number of days with strong wind than days of in-home drought. Thus, the coastal town was more susceptible to conflagrations than the drier inland towns. This aligns well with the most significant fire disasters in Norway since 1900. In addition, it was demonstrated that the number of high-risk periods is manageable and can be addressed by local fire departments through proactive measures. In turn, the fire risk modelling and associated index respond well to the recent changes in Norwegian regulations, requiring the fire departments to have systems for detecting increased risk levels. Testing the modelling for a severe winter fire in the USA indicates that the presented approach may be of value elsewhere as well.

1. Introduction

1.1. Fire Risk in Cold Climates

Fire results in more than 300,000 deaths annually, making it one of the most significant causes of accidental injury and a worldwide threat [1]. In many areas of society and industry, attempts are made to dynamically model the imminent risk from fires or fire-related events, enabling situational awareness and sound risk management. Typically, dynamic fire risk modelling is applied to industries and areas where potential consequences of an unwanted event could involve major economic losses and potential fire phenomena receiving public attention, such as boiling liquid expanding vapour explosions (BLEVEs), vapour cloud explosions, jet fires, forest fires, etc. A common feature for industrial dynamic risk modelling is safety barriers and the associated condition monitoring, where system status or plant risk is considered through indicators based on the status of specific safety barriers [2]. Such an approach is only possible for systems where safe operation relies on safety systems. For systems such as forests or built environments, dynamic risk modelling cannot rely on safety barriers in the same way, and needs to be based on the status of the system itself. For forest fires, this is a well-known principle. When modelling vegetation fire risk, a generic approach is chosen for areas of similar vegetation, where typically soil and fuel moisture content (FMC) are correlated with the observed and predicted weather. This enables indications of vegetation fire risk based on how the modelled moisture content affects experienced flammability and fire spread rates. However, while statistics suggest that residential fires cause 83% of fire-related deaths [3], dynamic fire risk modelling depicting the imminent fire risk for the built environment has been lacking. The reasons for this relate to the extent of structural fires, usually affecting a single structure such as a single-family home, i.e., limited consequences and attention. More importantly, the lack of dynamic risk modelling for single-structure homes is thought to relate to the random nature of the problem, not recognizing the possibilities for a generic approach for certain types of homes, as used in forest fires.
In cold climate regions, it is well known that the fire frequency in homes increases during the winter months [4]. For Norway, from where examples are drawn in the present study, the fire frequency is highest during December and January [5]. However, a calendar-based approach to house fire risk may be insufficient to support proper risk and resource management. This approach may be too simple in an ever-changing environment where climate and cities continue to develop, posing new challenges for sufficient and safe operations and continuously stretching the limited resources of local fire departments. Hence, knowing days of high single-home fire risk could allow for proactive measures to be taken and for better risk management within a changing environment. According to the recently updated Norwegian fire safety regulations [6], the fire departments shall, from 2022, have systems to detect significant changes in the risk picture and develop plans to deal with these high-risk situations. If necessary, the fire department shall increase its emergency preparedness accordingly. Hence, tools for identifying high-risk events have become a new requirement from the Norwegian authorities as of 2022.
The cause of the increased winter fire frequency involves a combination of factors, e.g., (1) the extended use of candles during the dark season and holidays (a source of ignition), (2) the extended use of heat sources such as a fireplace or electrical ovens (ignition by flame or increased electrical loads, including chimney fires), (3) more time spent indoors, (4) alcohol consumption (Christmas holidays), and (5) dry indoor conditions favouring fire establishment and development. This latter climatic condition was identified in 1956, when the ambient dew point was suggested to explain the increased fire frequencies during the winter in cold climate regions in the USA [7]. The dry indoor conditions are especially evident in wooden homes with internal wooden surfaces, which are widespread and characteristic for wooden houses in Norway, as well as in other cold climate regions [8]. Generally, a wooden home refers to a structure with a load-bearing system and possibly external cladding made of wood. Nonetheless, in the current context, it is always assumed that wooden homes have some fraction of in-home wooden surfaces/panelling, such as a wooden ceiling and some or maybe all of the interior walls.
In recent years, increased attention from researchers towards cold climate fires has resulted in the rediscovery of the wooden home cold climate fire risk [9]. Severe conflagrations in wooden towns have been found to relate to very dry indoor and/or outdoor conditions in combination with strong wind. When indoor wooden surfaces in heated homes dry during the winter, they may highly affect fire development and the time to flashover (TTF) in the case of an enclosure fire event [10]. In turn, this leaves less time for safe escape and for the fire brigades to intervene, as well as more intense fire development post flashover and increased probability of involving new homes in the blaze.
It is evident from fire dynamics [9], statistics [5], and the literature [11,12,13] that wooden home fire risk (WHFR) in cold climate regions is not a static quantity. On the contrary, the WHFR is highly dynamic, changing both with the seasons and within the high-risk months of the year [11,12]. Just as heathland fire risk can become high during spring and forest fire risk during summer, the WHFR reaches a peak period during winter. It is generally known that indoor conditions become dry during the winter, as evident from gaps in parquet flooring, wooden doors sliding differently etc.; however, until recently, it was not known when this in-home drought occurs and to what extent.
Following the rediscovering of the cold climate fire risk, efforts have led to the DYNAMIC research project [14,15], which among other things emphasises the development of a WHFR and possible conflagration warning system. Herein, a model predicting indoor relative humidity (RH) and fuel moisture content (FMC) of indoor wooden surfaces was developed and validated [11] based on the findings and concepts developed in [4,16].
The present study emphasises WHFR based on indoor conditions and the associated wooden home conflagration risk. While the previously developed model for predicting indoor RH and FMC has undergone essential validation, it lacks a justified generic approach to the many Norwegian wooden homes. In addition, the WHFR indicator has not yet been justified, and the practicability of output from existing models has not been assessed. The present paper takes a step back from previous work to underpin the WHFR indicator in order to justify a generic approach and to show that explicit modelling of indoor wooden home fire risk is possible and identifies a manageable number of high fire risk events for the considered locations. In addition, the wrapping of the existing national forest fire index, in combination with the WHFR, makes an intuitive risk communication concept. The present study may serve as a guideline with respect to parameters and aspects that need consideration if attempts are made to implement the model in other cold climate regions.

1.2. Related Work

Despite little effort in dynamic fire risk modelling for homes, increased efforts have been undertaken in the field of building fire safety through fire risk quantification and assessment for structures. Rahikainen and Keski-Rahkonen [13] considered a statistical determination of ignition frequency of structural fires in Finland. As part of performance-based fire safety design, such frequencies are important variables in probabilistic quantitative fire risk assessments. The ignition frequency was considered as a function of floor area for different class structures. Periodic distribution of fire alarms was considered for the months, weeks, days, and the time of the day for 1994–1995. The results indicated that December, and particularly weeks 51 and 52, had increased alarm frequency. Another general observation was the occurrence of fire events in the afternoon, from 1500–2000, when people are at home.
Samson et al. [17] considered the ignition frequency of structural fires in Australia for different class structures, as in the previously mentioned study. The authors suggested a new coefficient for the generalised Barrois model based on statistics from Australia. A somewhat lower fire frequency was obtained than the similar study in Finland [18]. A possible explanation promoted by the authors is the widespread use of wood as a construction material in Finland, compared to wood and concrete in Australia, with the widespread use of gypsum (plasterboard) as interior surfaces. It should be mentioned that Finland and Norway are neighbouring countries in a cold climate region, both of which are known for a high number of wooden homes which internally become very dry in the wintertime due to the cold climate.
Many structural fires originate outdoors, either due to activities within the property or due to conflagration events such as wildland–urban interface (WUI) fires. A framework and implementation of a spatial incident-level fire risk model for wildfire to residential structures at the WUI was proposed by Abo et al. [19]. They argued that understanding the wildfire impact on structures in WUI areas is necessary for planning emergency and mitigating measures. Their impact assessment on structures included evaluating hazard, inventory, exposure, and impact. The implementation was presented through a case study. The framework requires knowledge on structural vulnerability, such as the wildfire vulnerability index for buildings proposed by Papathoma-Köhle et al. [20]. They considered building surroundings and characteristics, such as ground inclination, surrounding vegetation and ground covering, type of structure, roofing, and building material and shape when developing a physical vulnerability index (PVI) for buildings subjected to wildfires. These parameters were formed into an index using a random forest based automated feature selection to weight relevant indicators based on data from the documented Mati fire in Greece in 2018, which killed more than 100 people.
These studies have in common that they consider static single-structure fire risk through specific external building characteristics, as well as the ground and the vegetation around the structures. The present study emphasises dynamic modelling of in-home fuel conditions, which change with outdoor conditions.
The remainder of this paper is organised as follows. In Section 2, depth is added to the problem domain, before considering dry wood enclosure fire dynamics from the theoretical and experimental perspectives. Then, the model is briefly explained and key model parameters are qualitatively considered. Section 3 presents the sensitivity analysis of the key parameters to support the generic approach. Ten years of weather data are analysed for three selected locations in Norway in order to analyse whether the risk modelling provides a possible basis for evaluating proactive measures. The wooden home fire danger index is then presented by combining the wrapping of the existing national forest fire index with the WHFR. The findings are discussed in Section 4, while Section 5 sums up the main conclusions.

2. Materials and Methods

2.1. Wooden Homes

A characteristic of Norway is the widespread use of wood as external and partly internal panelling [8]. Nowadays, only Canada and the USA have an equal fraction of wooden homes compared to the remaining building mass [8]. While still widely used, internal wooden cladding is especially evident in older wooden houses. Norway has over 200 densely built wooden home heritage sites [21], which manifest a long tradition and several hundred years of constructional engineering development. By definition, these sites contain a minimum of 20 wooden single-structure homes with less than eight meters of separation. In addition, the buildings should primarily be constructed before the 1900s [22]. Norway does not have a tradition of high-rise buildings. Thus, low-rise single-structure wooden homes dominate how people live. Even today, wood is the primary construction material for low-rise homes [23]. While older wooden homes used wood for all internal surfaces, nowadays it is common to combine materials, and gypsum boards have become quite popular in recent years. Recently, the use of decorative wooden wall laths has gained popularity and reintroduced wood as a modern internal cladding material. In the coming years, it is not unlikely that wood as an interior building material will be increasingly used for new and refurbished homes as increased attention is brought toward its potential health effects as an indoor humidity buffer [24] and as a sustainable material. Figure 1 presents parts of a wooden home heritage site in Bergen, Norway (top), as well as a typical modern Norwegian neighbourhood in Haugesund (bottom). While both pictures present wooden homes, the old homes in Bergen are situated closer together and with can be expected to have widespread use of wood as interior panelling. The newer homes in Haugesund, while being wooden homes, are more likely to vary with respect to the indoor materials. In general, such wooden heritage sites are far more susceptible to conflagration events due to the short separation distance and use of wood as both an exterior and interior material. Additionally, many heritage sites and other wooden towns and villages are in areas without permanently manned fire stations, resulting in quite long deployment times.

2.2. Conflagrations

Town fire conflagrations involving several homes or other structures can originate from different scenarios contributing to fire spread. Every conflagration starts with an initiating event involving ignition, which can be separated into structure-related or vegetation-related initiating events, referring to the object or area where the initial fire originated. Structure-related events might be a house on fire, typically a fire starting within the structure, spreading to the building envelope, and then spreading further to new objects. A vegetation-related initiating event could be, e.g., a grass fire initiated by a grid failure causing sparks. Despite the initiating event, the fire may spread within a combination of vegetation and structures, i.e., a WUI fire, or only within one of the two, i.e., a wildfire or a town fire, as evident from many historical fires. Two critical factors associated with the formation of a conflagration event appear to be (1) dry fuel conditions and (2) strong wind [9,25]. The latter factor is related to wind strong enough to cause flame spread by ember transport (firebrands) or flame impingement on nearby structures or objects. This discontinuous fire spread mechanism has been a dominant fire spread mechanism for many town fire conflagrations, such as the wind-driven fires in London in 1666, Grand Forks in 1997, and the more recent Lærdal fire in 2014 [25,26].
A conflagration is imminent when the fire spreads over horizontal distances faster than firefighters can respond, quickly outgrowing the available resources. As stated in [25], “Conflagrations occur generally when strong winds drive a fire to overwhelm human suppression efforts”. This concerns vegetation fires and rapid fire spread in, e.g., cured grass, and relates to the spread of resources over larger areas as well. Flame spread by firebrands from structure-to-structure (wooden home to wooden home) was in the Lærdal fire recorded at above 200 m distance [9]. During the more recent Sotra fire in Bergen 2021, a fire spread about 270 m across a fjord to the vegetation on the opposite side [27]. Such large leaps have been recorded for previous conflagrations as well, such as the crossing of the Chicago River during the 1871 Chicago Fire or the San Diego Freeway during the 1961 Bel-Air Fire [25]. Such rapid fire spread over large distances causes significant challenges for the fire brigade with respect to resources and resource redistribution. Typically, a conflagration event is of such an extent that it is not stopped or controlled by human interaction. It ends when the line of fuel ends or when the dominating mechanism for fire spread reduces in potential, e.g., reduced wind strengths or precipitation. Figure 2 illustrates potential scenarios following an initiating fire event, possibly towards a conflagration.
The Lærdal fire in Norway in January 2014 is an example of a wooden town conflagration where the fire spread from structure to structure during strong wind. Over 60 buildings were damaged, of which at least 40 were lost [9]. The first home to catch fire was next to the fire station. When the part-time firefighters passed this home upon mustering at the station, 90–120 s after the emergency call, flashover had already occurred and the external wooden sidings were already burning [9]. Within an hour, two-story buildings burned to the ground. The fire risk for Lærdal at the time was reported as non-existent [28]. This reported risk was related to vegetation fire, however, and had nothing to do with the fire risk of the wooden homes in Lærdal at the time. However, in the aftermath of that fire it was found that the houses had very dry external and internal wooden panelling [9,26].
More recently, the Marshal fire in Boulder County, USA on 30 December 2021, was a wildland–urban interface (WUI) conflagration. The fire initially spread through vegetation and then secondarily from structure to structure. Estimated losses exceeded a thousand buildings, including homes and shopping centres. A moist spring and dry summer had resulted in abundant cured grass. This, combined with snow-free ground and wind gusts reaching 50 m/s on the day of the fire, resulted in large amounts of dry fuel, rapid fire spread into the town area, and loss of many wooden structures [29].

2.3. Dry Wood Fire Dynamics

It is necessary to consider the involved fire dynamics in order to understand the modelling approach for the indoor wooden home fire risk, which may be associated with the risk related to initiating a conflagration event. It is assumed that the reader is familiar with enclosure fires and how these fires may develop very differently depending on variables such as HRR, type of fuel, orientation of fuel with respect to ignition, location of fuel, ignition source, layout, volume and height of the compartment, and ventilation conditions, to mention a few. Nevertheless, the basics are provided here.
An enclosure fire typically develops through four stages [30]. The initial stage, involving ignition, lasts until the fire has been established. In this phase, average compartment temperatures are low and the heat transport is dominated by convection from hot gases and conduction within the solid materials involved. When the fire has been established, it enters the second phase, the growth phase. Heat radiation from the smoke layer becomes increasingly dominant within the growth phase, as it is proportional to the absolute temperature to the 4th power. As the fire grows in size and the temperature of the smoke layer trapped beneath the ceiling increases, a rapid, severe, and self-induced acceleration in fire development may occur, i.e., flashover. The flashover phenomenon marks the transition from the growth phase to the stage of a fully developed fire. Typically, at this stage the HRR within the enclosure becomes controlled by ventilation and all combustible surfaces become involved in the fire [31]. There are several criteria used for flashover, e.g., average smoke layer temperatures at about 550–600 °C, heat fluxes at floor level at about 20  kW · m 2 , or visible flames escaping through compartment openings (indicating insufficient oxygen supply within compartment). Quite often all of these criteria are met within a short period. The last phase is the decay phase, where the fire intensity declines. This phase is not considered further in the present context.
The HRR is considered the most important parameter characterising fire behaviour [32]. It may be expressed as [30]
Q ˙ c = A f · m ˙ f · χ · Δ H c
where  A f  is the fuel surface area ( m 2 ),  m ˙ f  is the mass flow per unit area from the fuel surface ( kg · s 1 · m 2 ),  χ  is the combustion efficiency, known to be less than unity, and  Δ H c  is the heat of combustion ( J · kg 1 ).
A heat balance for the production of volatiles for gas phase oxidation may be expressed as
Q ˙ F + Q ˙ E Q ˙ L = m ˙ f · L V
where the net heat fluxes to the surface involve the heat flux from flames  Q ˙ F  ( W · m 2 ), any external heat supply  Q ˙ E  ( W · m 2 ), i.e., the hot smoke layer, and heat lost from water evaporation and other heat transport mechanisms is provided by  Q ˙ L  ( W · m 2 ), and  L V  ( J · kg 1 ) is the latent heat of vaporisation and pyrolysis.
The following briefly describes an enclosure fire developing inside a living room where walls and ceiling are covered with untreated wooden panels. A potentially established fire will produce hot gases rising towards the wooden ceiling. The convective heat release is typically described by
Q ˙ c o n = χ c o n · Q ˙ c
where  χ c o n  is the convective fraction of the heat released by combustion. Most of the heat released interacts with the wooden ceiling, followed by the wooden walls post formation of the smoke layer. It is not unlikely that the walls are involved in a very early phase, as many fires originate close to the walls due to, e.g., electric apparatuses, socket short-circuits, candles, old fireplaces, or stove fires. The moisture content of the wooden panels interacting with the hot gases influences fire development. In principle, the wooden panels may either restrict fire development or contribute to a more rapid fire development (ignoring a possible neutral state). Restricting fire development is consistent with high FMC values. For such a scenario, the heat of combustion  Δ H c  and the combustion efficiency  χ  presented in Equation (1) decrease as a function of increasing water content in the panels [9]. This reduces the HRR and provides less external heat flux  Q ˙ E  and preheating. Increased water levels increase the heat loss  Q ˙ L , through increased thermal conductivity as well as increasing the latent heat of vaporisation and pyrolysis  L V , as energy is consumed in the evaporation of water. Further, the evaporated water increases the heat capacity of the smoke layer and dilutes oxygen. Hence, increased FMC values reduce temperatures, and may result in prolonged time until flashover. Although this brief description emphasises wooden panels, it relates to other fuels with hygroscopic properties as well.
If the wooden panels contribute to fire development through low FMC, the wooden surfaces participate in the production of volatiles and thereby increase the net energy released within the compartment at an early stage. This would increase the smoke layer temperature and thereby the external heat flux  Q ˙ E , causing increased preheating and potentially further accelerating the fire growth rate.
It should be mentioned that post-flashover combustion within the compartment is usually restricted by air access. Uncombusted hot gases exiting the ventilation openings burn on the outside of the vent openings. These external flames then represent a strong ignition source for neighbouring buildings, in addition to further accelerating fire spread on the initial structure. The drier the compartment wooden fuel is, the more combustion generally takes place outside the vent openings.
Many factors influence an enclosure fire, and any attempt to describe a possible fire scenario development would require a case-specific consideration. However, supporting the presented theory, it has been shown through experiments that for enclosure fires with indoor wooden panels the TTF is highly dependent on the FMC of the wall and ceiling panels [10]. This has been shown for different sizes of compartments and HRRs. The most recent experiments performed within the DYNAMIC research project were one half-scale ISO-room size experiments involving 12 mm wooden pine panel cladding. The one half-scale ISO-rooms were conditioned in a climate chamber three rooms at a time and burned successively. The initial HRR was kept constant, and the only parameter intentionally varied was the FMC. The FMC values ranged from 10% to approximately 18% by dry weight. The time to flashover for the wooden compartments ranged from less than 4 min to more than 18 min for the low and high FMC values, respectively. An observation from this experiments is that when the FMC is high, preheating new fuel (especially wooden ceiling panels) takes much more time (energy), as previously described, causing the currently involved wood to char to depths where the fuel becomes thermally insulated and the production of pyrolysis products is significantly reduced. This causes the fire to decrease in size, and it takes time before it increases again in intensity, resulting in the large differences in observed TTF. The intensity increases after a time when the humidity of the wood panels was removed, and the wooden surfaces were sufficiently heated to produce pyrolysis products. In the case of dry wooden compartments, very thin layers of char (less than 0.5 mm) were observed for large areas of the compartment, typically the whole ceiling and upper walls. These results indicate that when the wooden panels are dry, energy is mostly consumed by heating and pyrolysis. The fire spreads across the wooden panels faster than thermally insulating char develops, causing a rapid temperature increase and full room involvement at a much earlier stage. This experimental work is reported for the first time in the present study.
From the presented theory and experimental observations, it is evident that the FMC is expected to highly influence fire development for enclosure fires involving wooden interior surfaces (ceiling and walls). Nonetheless, despite high FMC values, the initial fuel and fire spread may be fast enough to cause rapid fire growth and flashover. Hence, large variations in fire development will be observed despite the modelled FMC indicator. Figure 3 illustrates this through skewed normal distributions. The respective distributions illustrate the variation in observed TTF for the many different wooden homes; however, depending on the FMC level, different average TTF probabilities exist. It is these expected values that are being implicitly modelled when computing the wooden home fire risk indications. In similar fire scenarios where the only difference is the FMC value of the wooden panels, lower FMC values generally result in faster fire development towards flashover and more severe fire development post-flashover.

2.4. Modelling In-Home Fuel Moisture Content

Considering that the FMC is a reasonable WHFR indicator and may be used for indicating wooden home conflagration events, it needs to be modelled. From previous efforts, a model predicting indoor relative humidity (RH) and FMC of in-home wooden surfaces was developed and validated in [11]. The indoor FMC was then correlated with the TTF according to the findings in [10] and further validated in terms of producing reasonable output [12]. The model uses outdoor RH and outdoor temperature to compute the indoor RH and FMC of ceilings and walls from first principle mathematics and physics. Previous model versions have been implemented as a cloud-based microservice [12,33], as well as in a mobile application using edge computing [34]. The model does not need sophisticated tools to run and can simply be implemented and tested on a spreadsheet; however, it is the continuous (dynamic) operation of the model that requires a more advanced implementation. Using historical and predicted (forecasted) weather data, the indoor RH and FMC can be computed for the present and near future. Predictions are shown reliable for the upcoming 2–3 days [33]. The uncertainty in the predictions depends highly on the uncertainty of the weather forecast, that is, forecasted versus occurring weather. Reliable weather data for Norway are supplied by the Norwegian Meteorological Institute and made available through the application programming interfaces (APIs) of FROST [35] and MET [36].
While the mentioned model has undergone essential validation, it lacks a justified generic approach to many Norwegian wooden homes. In order to quantify the general modelling parameters, the principle of the modelling and a short discussion on the sensitivity of key parameters are presented.
The final equation to solve in order to determine the indoor water concentration, and consequently the FMC [11], is
d C d t = m ˙ s u r f + m ˙ a c + m ˙ s u p p l y V h
where C ( kg · m 3 ) is the water vapour concentration in the indoor air used to calculate the indoor RH,  m ˙ s u r f  ( kg / s ) is the mass transfer of water vapour across wooden surfaces,  m ˙ a c  ( kg / s ) is the mass transfer of water vapour through air changes induced by either a ventilation system or natural ventilation and leaks,  m ˙ s u p p l y  ( kg / s ) is the water vapour production through everyday use such as cooking, showering, and respiring, and  V h  ( m 3 ) is the enclosure volume. A principal sketch of the terms in Equation (4) is shown in Figure 4. It can be seen that the water concentration of the bulk air within the enclosure changes as a function of (1) humidity exchange between wooden surfaces and bulk air, (2) air changes caused by ventilation, and (3) humidity supplied from in-home activities.
The  m ˙ s u r f  depends on the area of indoor wooden surfaces available for humidity exchange. For old wooden homes, all interior surfaces may be covered by wood; however, for newer or refurbished homes wood is more likely to be only part of the room. The fraction of wooden surface area is considered through the AV ratio, which is the ratio of the wooden surface area available for vapour exchange to the room volume ratio. The  m ˙ a c  primarily depends on the ventilation principle, herein taken as natural ventilation. For natural ventilation, variations occur due to pressure differences caused by wind or temperature differences, i.e., the stack effect. The quantity  m ˙ s u p p l y  depends on the intended use of the considered enclosure. In the following, these terms are briefly considered with respect to the existing literature.

2.5. Model Input

There are probably no generic wooden homes, at least not considering the modern building mass. Nonetheless, it may be argued that a generic home is more reasonable for modelling older wooden homes at heritage sites. However, for the modelling of indoor FMC the generic home is not needed per se; when modelling the risk indicator, the layout and exact content of the house are not very important, as the key influencing factors for the FMC described in Equation (
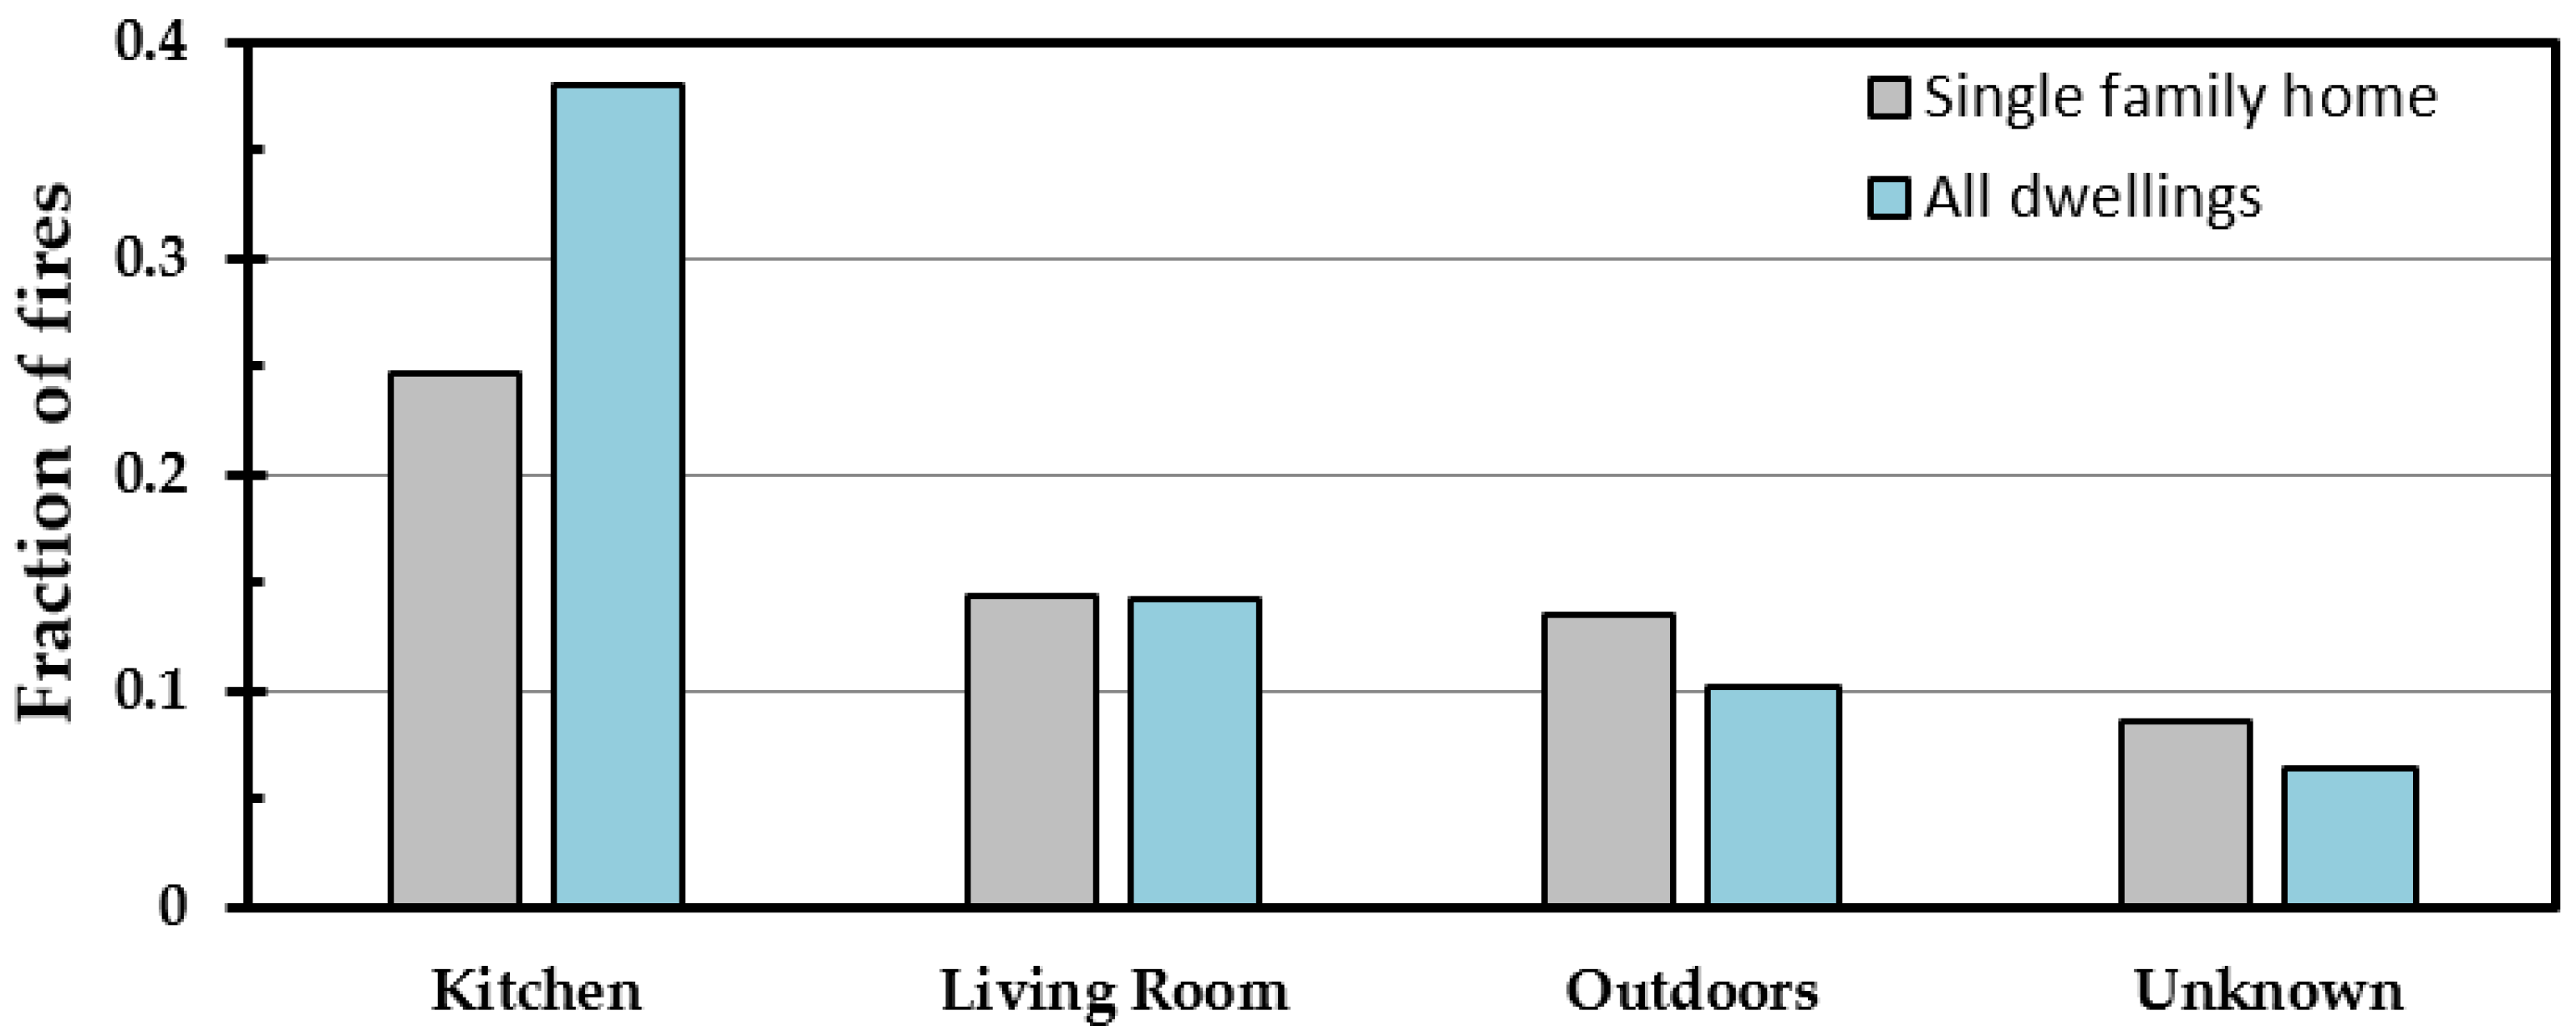
4) either account for potential effects, i.e., hygroscopic properties, or are independent of these specific house-related variables. Instead of a generic home, the model uses a generic wooden home enclosure to compute a representative FMC value. Statistics from Norway show that kitchens and living rooms are the enclosures of fire origin in about 40% of all single-home fires [5]. Expanding these statistics to comprise dwellings, which might include apartments and multiple units (multiplex) houses, in which the latter may be wooden heritage townhouses, the share of fires in kitchens and living rooms increases to 50%. Compared to other compartments or areas of fire origin, kitchen and living room fires are highly representative, as can be seen from Figure 5. Hence, for modelling the FMC it is reasonable to take these enclosures as the basis. Note that fires originating from outside the building envelope are the third largest reported place of fire origin. Hence, the modelling of FMC for external wooden panels is an important topic and a part of a future conflagration warning system combining interior and exterior fire risks; however, it is not addressed in the present study.
Concerning the modelling of the FMC, the key parameters from Equation (4) and associated sub-terms are considered from statistics for a generic living room and kitchen.

2.5.1. Enclosure Base Area

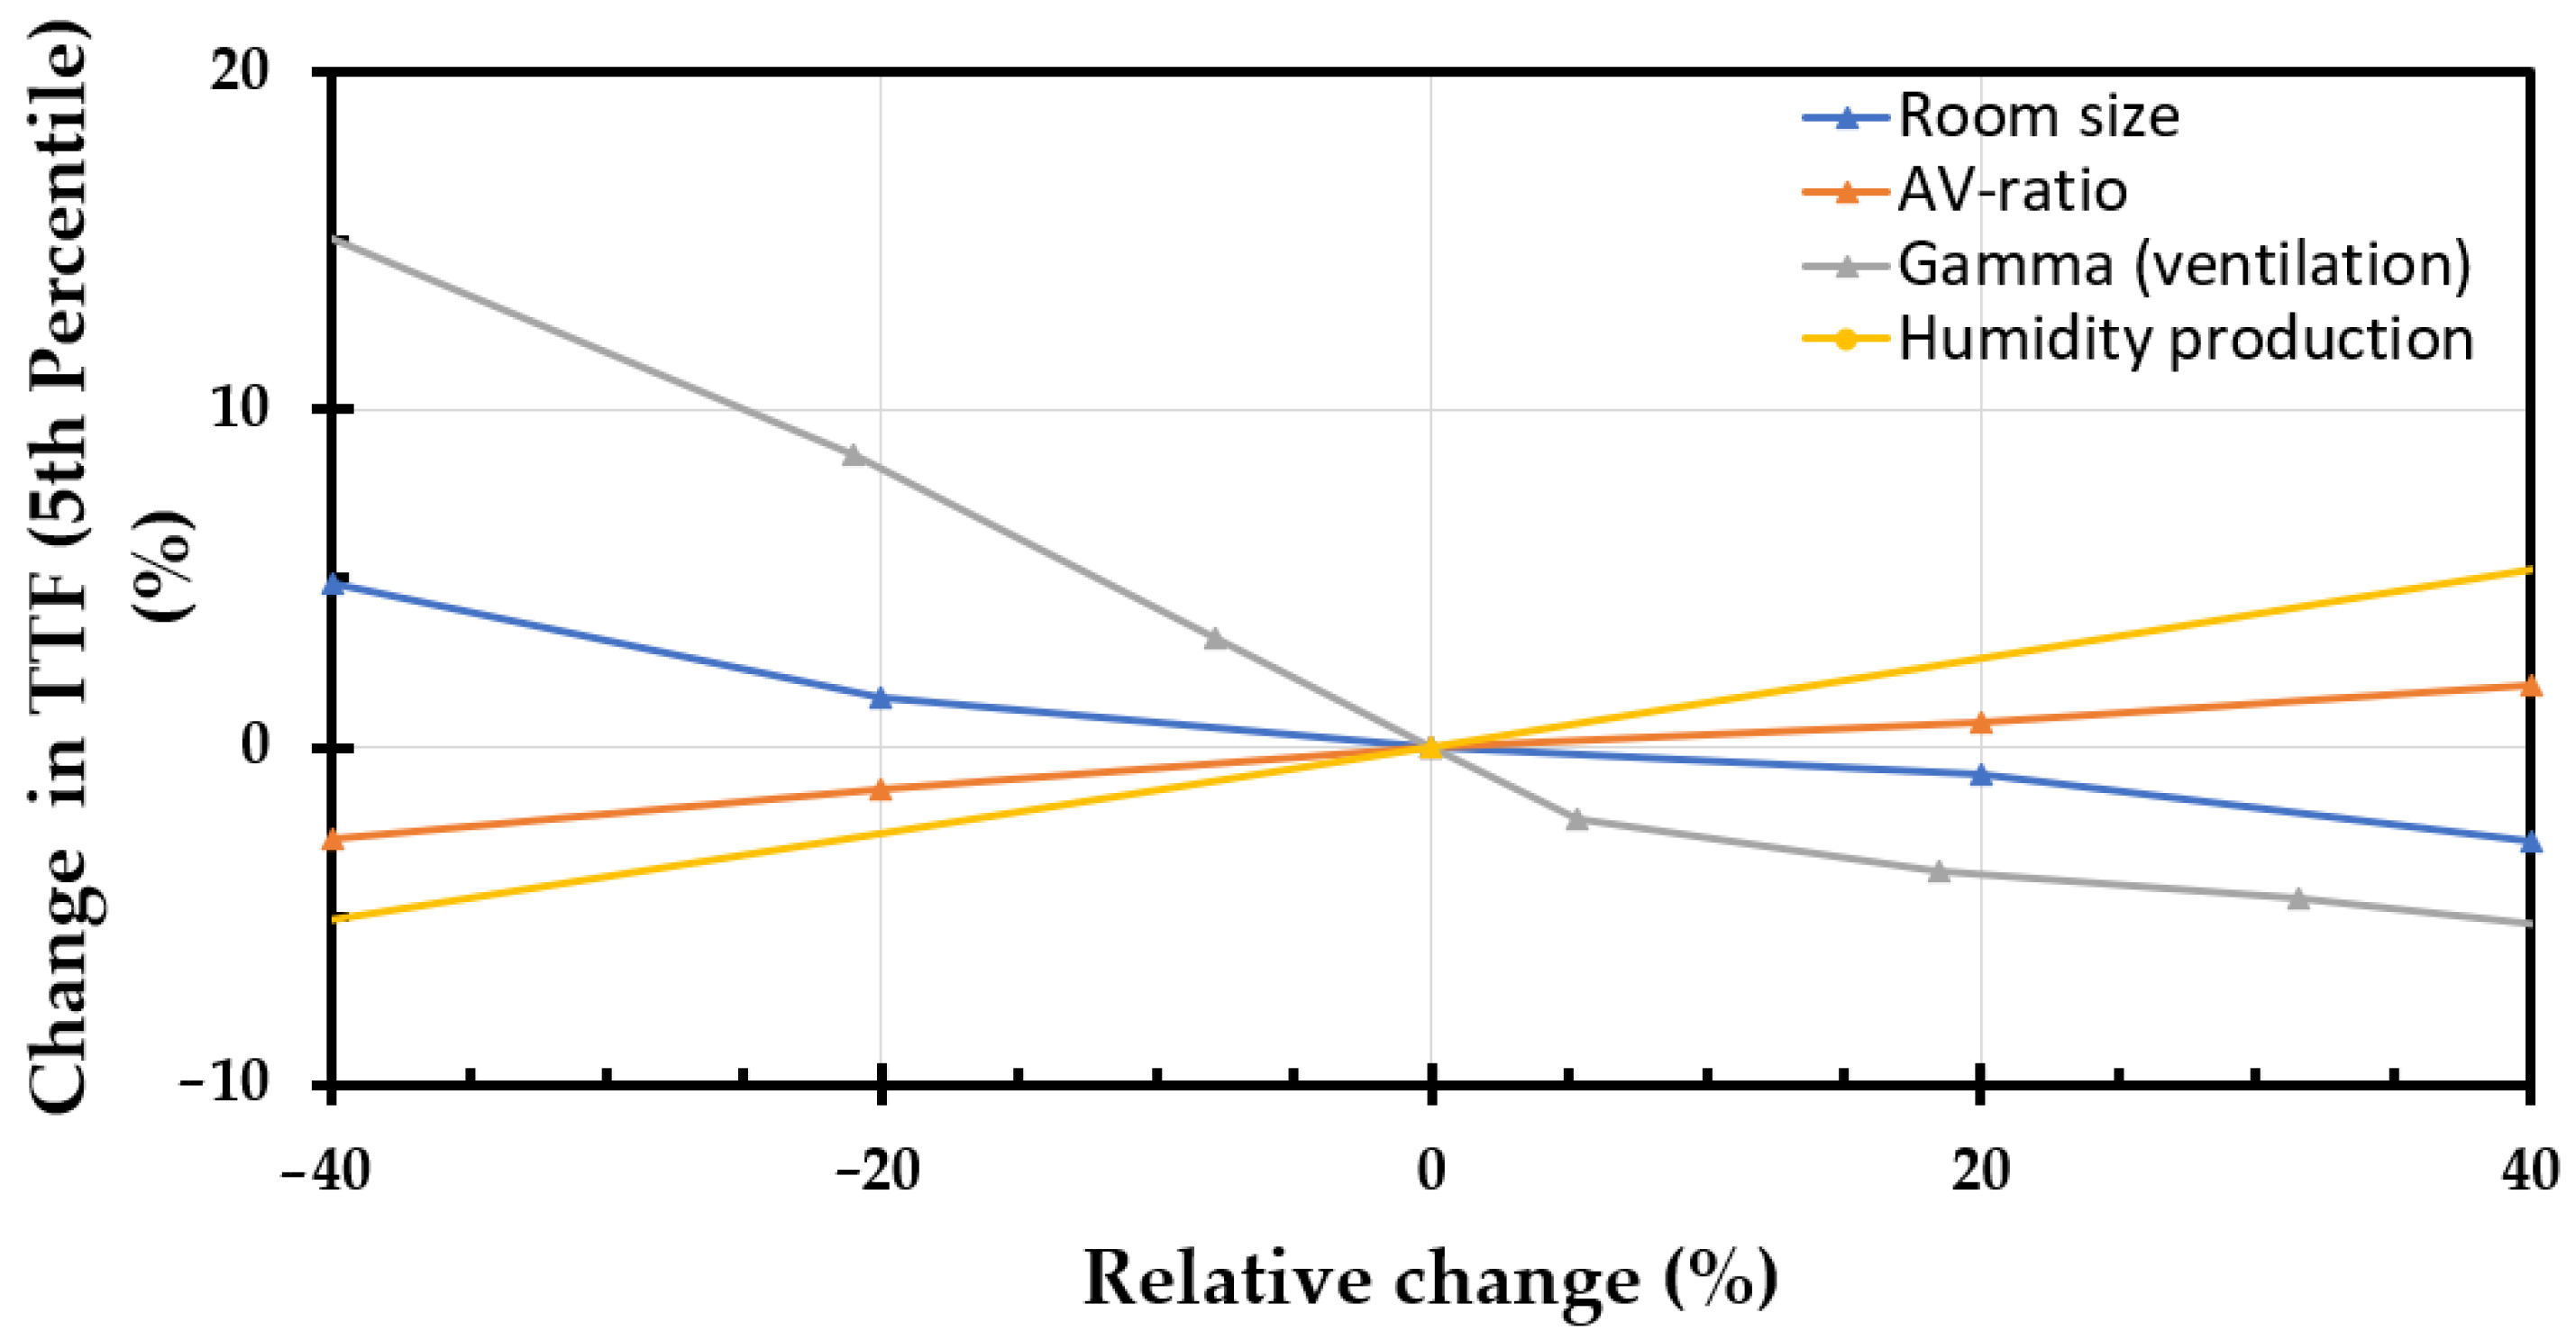
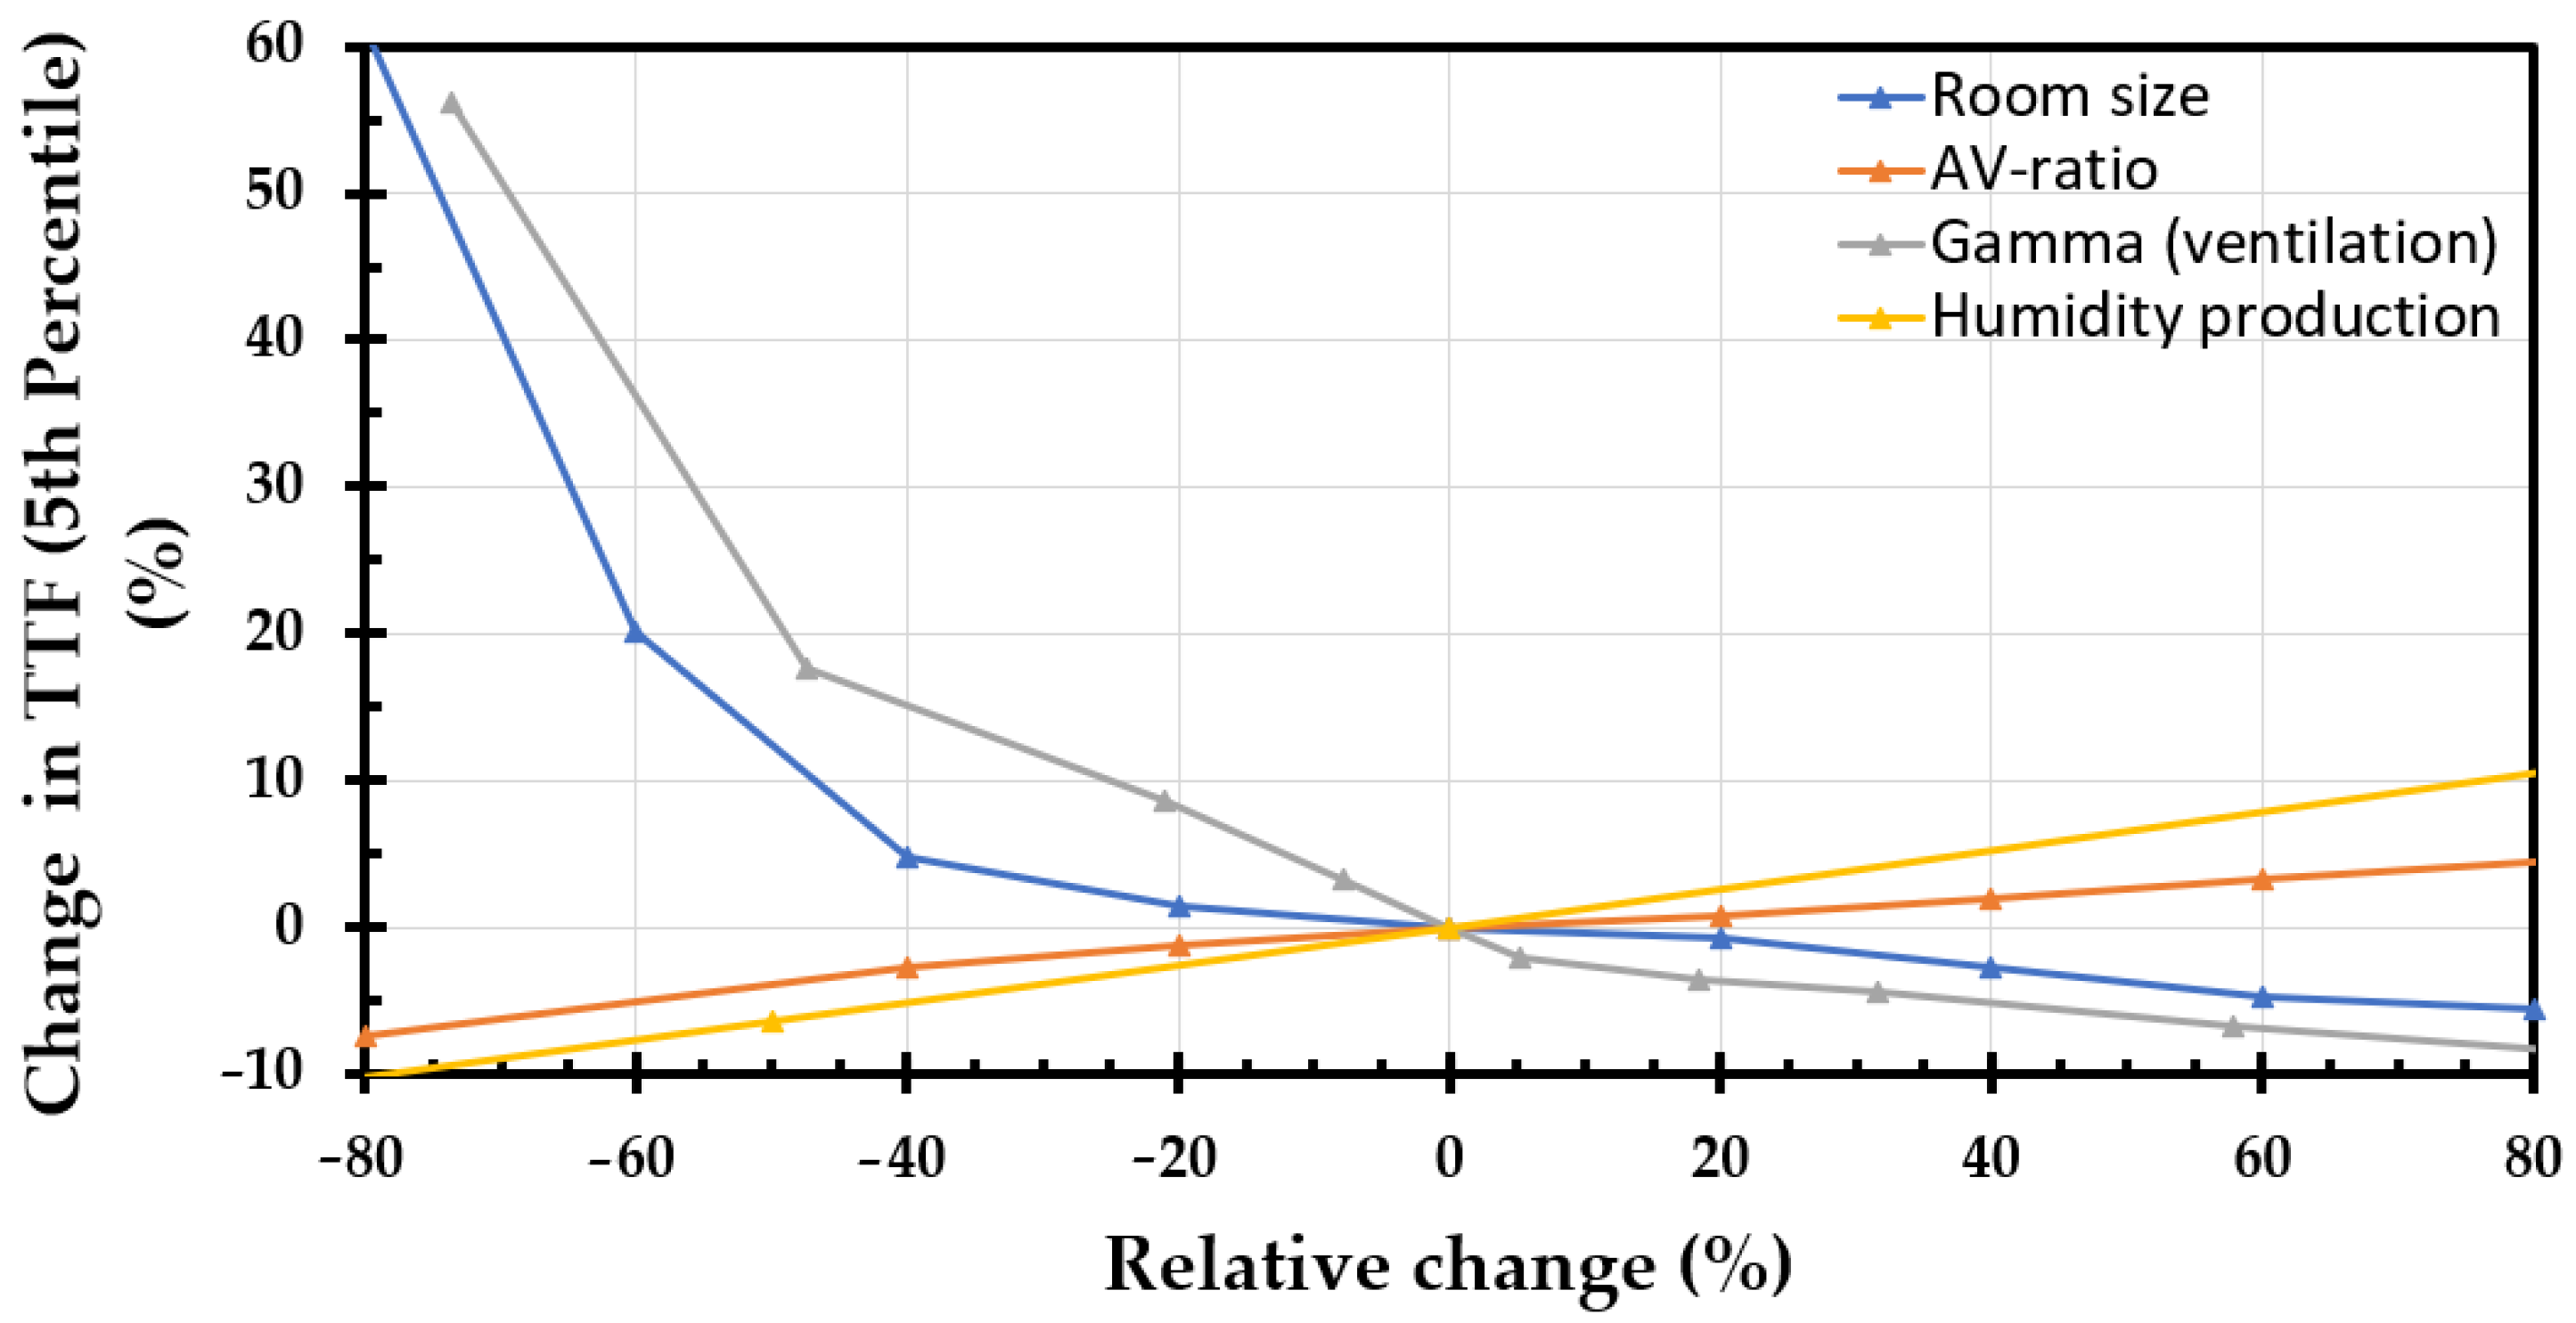
When determining the area of a representative enclosure, it is important to consider the effects of the enclosure base area when modelling the FMC. An increased base area generally results in increased enclosure volume and increased surface area for humidity exchange. It may be assumed that the ratio between the humidity exchange area, i.e., wooden surfaces, and the enclosure volume is constant. Then, increasing the enclosure base area will result in reduced FMC values as the volume increases relative to internal humidity production. The opposite is true when decreasing the base area. Then, higher FMC values are achieved if the humidity production is kept at a constant level. The connection between these parameters is associated with a larger base area typically housing more inhabitants, causing larger humidity production. Therefore, these parameters must be seen in context.
The enclosure base area for the model is determined based on field studies and the literature. A general trend for dwellings is combining the kitchen and living room into one enclosure. This modern trend affects new as well as refurbished older homes in Norway. For old wooden houses, the kitchen is typically adjacent to the living room, though with different degrees of openness between the rooms. Hence, humidity production within the kitchen likely affects the living room, and vice versa. By taking this into account and considering the larger enclosures to generally provide a lower FMC, a general area for the kitchen and living room can be determined. According to more recent Norwegian guidelines [37], the minimum combined kitchen and living room area for a four-room dwelling is 35 m 2 . However, field observations and expert opinion suggest a 40–60  m 2  range. Therefore, the present study assumes a value of 50  m 2  as quite representative. Combined with a standard room height of about 2.4 m, the compartment volume becomes 120  m 3 .

2.5.2. Humidity Production

As mentioned, humidity production must be seen in context with compartment size. If considering the suggested 50  m 2  combined living room and kitchen to house a family of five, the moisture supply from respiration and sweating during five hours is in the range of 1.2 kg (Distribution; father = 70 g/h, mother = 60 g/h, Children 1 and 2 = 40 g/h and Children 3 = 30 g/h) [8]. Then, cooking and dishwashing for five persons adds another kilogram of moisture to the indoor air, adding up to at least 2 kg/day of humidity production. However, only a part of the humidity supplied to the indoor air reaches equilibrium with indoor materials, with a large portion being ventilated away before the temporarily increased humidity levels can reach a new equilibrium with the surroundings. Currently, the assumption has been that 50% of the supplied water vapour stays within the room while the remaining vapour becomes ventilated. Field measurements from old wooden homes combined with modelling efforts support a 1 kg/day humidity production distributed evenly throughout the hours of the day [11]. This even humidity distribution allows for smoothing of the FMC development, avoiding unnecessary fluctuations.

2.5.3. Air-Volume Ratio

The humidity exchange area to the enclosure volume ratio, or AV ratio, is another important aspect of the generic enclosure. Increasing the wooden exchange area for a set enclosure base area prolongs the time until equilibrium is reached, as more mass is available as a humidity buffer. In turn, a smaller wooden exchange area results in more responsive modelling, as the wooden enclosure more rapidly adapts to outdoor conditions. This latter observation might be part of a conservative modelling approach taken to ensure that dry indoor periods are identified early. The AV ratio should stay above 0.4 to ensure that wooden panels cover at least an exchange area consistent with the enclosure roof. Based on refurbishments and the identified lag (if too large wooden areas are assumed), it is suggested to keep the AV ratio in the range of 0.4–0.6, with a recommended value of 0.5. The suggested value corresponds to at least the ceiling (most importantly) and about one wall being covered with wooden panels.

2.6. Natural Ventilation

Regarding ventilation and the associated  m ˙ a c , older homes are unlikely to have balanced ventilation systems, and, as previously mentioned, natural ventilation is assumed. When considering ventilation, the air change rate per hour (ACH) expresses the fraction of the building or enclosure volume being replaced in an hour. In the model, the ACH is a function of temperature differences (stack effect). The specific ACH then depends on the temperature difference between outdoor air, indoor air, and a ventilation factor  γ  used to match proper ventilation rates, as described in [11]. For the considered climatic region, the literature suggests an average ACH for naturally ventilated single homes equal to 0.32 [8]. This translates into a recommended  γ  in the range 350–400, with a suggested value of 380 based on an experimental best fit approach.
The ranges and recommendations of the key parameters related to Equation (4) in the modelling of the FMC are summarised in Table 1. While the model parameters can be altered to describe a particular case, the recommended values should be used for a general FMC calculation, e.g., for a town or city.

3. Results

3.1. Sensitivity Analysis

The previously discussed key model parameters were assessed through a single-parameter sensitivity analysis and a lightweight combined-parameter analysis, i.e., changing more than one parameter at a time. In addition, the outdoor weather data of relative humidity and temperature collected from external services and used as input data for the model were analysed.
In previous work, the TTF was correlated with the FMC [10], expressing the WHFR in units of minutes. The TTF has subsequently been used as a measure for the WHFR as part of a risk communication concept. For this reason, the TTF is used in the following analysis.
The sensitivity study for the key model parameters of room size, AV ratio, ventilation factor  γ , and humidity production are presented in Figure 6. The results are presented as the percentage change in the 5th percentile of the computed TTF values versus the relative change in parameter value compared to the recommended values. The chosen measure was tested and found to be suitable. It captures the resulting changes at the low TTF values, a critical model output range. The recommended values, ranges, and corresponding percentage change in range, as provided in Section 2.4, are presented in Table 1. The latter can be used to better interpret Figure 6. Most parameters were suggested within a range of  ± 20 %  of the recommended value. However, the presented analysis shows a greater range of change for insight purposes. A parameter is termed sensitive if the 5th percentile TTF change exceeds 0.5 times a single TTF class. This is further discussed in Section 4.
From Figure 6, it can be seen that the 5th percentile TTF develops nearly linearly with the relative change in parameter size for both AV ratio and humidity production. Within the suggested range of  ± 20 %  of the recommended value, both parameters appear with a relatively small slope, resulting in minor changes to the 5th percentile TTF. The most significant differences can be observed at the boundaries, at  ± 20 % . For the AV ratio, the corresponding change in 5th percentile TTF is  0.71 %  to  1.22 % . In terms of the computed TTF values and a reference TTF at 4 min, this translates to TTF values in the range of 3.96–4.02 min, i.e., insignificant changes. The humidity production has a steeper slope, and for the same range the changes in the 5th percentile TTF equal  2.5 %  to  2.5 % . When increasing the range to  ± 40 % , the largest difference in the 5th percentile TTF can be observed for the humidity production, at about  ± 5 % . Hence, concerning model output, the two parameters are not very sensitive within the recommended range. The humidity production is further considered in Section 4.
When considering the room size and ventilation factor  γ , less linearity is observed, i.e., they both appear to have an inverse-like dependency to the 5th percentile TTF when expanding the axis of relative change, as shown in Figure 7. This is understandable, as reducing the room size and/or ventilation would increase the in-home RH and FMC. It is, however, not reasonable to consider these parameters at points far beyond the recommended range. Within this range, the most significant change in the 5th percentile TTF is observed for the ventilation factor at −20%, an 8.7% increase. This increase equals 0.35 min for a reference TTF at 4 min, and is not considered significant. Neither the ventilation factor nor the room size are found to be sensitive parameters within the recommended range with respect to model output.
In general, the parameters must be seen in context. When decreasing the enclosure base area, Figure 7 suggests an increase in the 5th percentile TTF. However, such a reduction in the base area needs to probably be followed by a decrease in humidity production, as smaller rooms suggest fewer people and less humidity supply.
The combined effect of all parameters was briefly assessed within the  ± 40 %  range, and it was found that the different parameters can take on different values within the range without experiencing any special combined effect on model output. While the percentage change in 5th percentile TTF cannot be summed for the different parameters, that is, adds up to the new 5th percentile TTF, it was found that the computed 5th percentile TTF from random parameter values within the  ± 40 %  range (beyond the recommended range) was within  ± 5 %  of the added values. Hence, according to Figure 6, adding the percentage change to the 5th percentile TTF could be used to estimate the combined effect of changing the parameters.
The sensitivity analysis for outdoor relative humidity and outdoor temperature is presented in Figure 8. These parameters are model input data harvested from external sources comprising historical and predicted data. The results are considered in terms of the mean (modelled) TTF at relative humidities ranging from 40–90% and temperatures in the range of −10 °C to 10 °C. The chosen ranges represent many wooden towns in Norway during December and January, including the towns of Haugesund, Lærdal, and Røros. However, the latter town may become significantly colder. For low outdoor temperatures, the modelled TTF becomes less dependent upon the outdoor RH, as presented in Figure 8. At −10 °C, the mean TTF has a spread of 0.6 min in the range of 40–90% RH. Hence, the model output is not very sensitive to the outdoor RH at low temperatures. However, the dependency on the outdoor RH increases with temperature, and at 10 °C the spread across the different RHs corresponds to a mean TTF ranging from 4.6–8.1 min, which is significant.
It is important to note that the outdoor RH and temperature are taken from input data harvested from high-end weather data sources, such as the Norwegian Meteorological Institute [35,36]. These results support the need for mathematical modelling to keep track of the changing conditions.

3.2. Practicability

An important aspect of risk modelling is the practicability (usefulness) of the modelled results. Herein, paying attention to the different users of the modelled WHFR is important. If only considering the TTF (FMC), predictions can be related to the susceptibility and consequences of a potential fire developing indoors for a single home, i.e., a responsibility of the homeowner. Considering the coexistence of dry homes and strong wind, the combination may serve as a conflagration risk indicator, i.e., a more important concern for the local fire department.
This section presents an analysis of nearly ten years of registered weather data, for the period 1 November 2013 to 1 April 2023, i.e., ten winters, for the locations of Haugesund coastal town (N 59.41°, E 5.28°), Lærdal village (N 61.10°, E 7.48°), and Røros mountain village (N 62.576°, E 11.386°), a UNESCO World Heritage Monument. The historical weather data were used as input for the WHFR model to identify days of low TTF and events where low TTF coexisted with days of strong wind (conflagration indicator). In accordance with previous work, the FMC risk indicator is primarily expressed by quantifying the correlated TTF value. The wind and computed TTF values were divided into classes as presented in Table 2 and Table 3. In the present study, strong wind refers to the classes Medium to High, while in-home drought relates to the classes Medium-high and High. This is further discussed in Section 4.
The historic annual frequency of the daily mean TTF for the different TTF classes and areas for the last ten winters is presented in Table 4. Taking these results as a fair estimate of future expected frequencies, it can be seen that the expected number of days with High risk TTF (low TTF value) per year is limited to 3.2 days for Haugesund (coast), 26 days for Lærdal (inner fjord), and 97 days for Røros (inland mountain). Significant differences are observed for days of Medium high risk, where Haugesund has the lowest frequency at 31 days while Lærdal and Røros experience 110 and 108 days, respectively. For the remaining TTF classes, the differences are less substantial. However, because Røros has a high number of days with High and Medium high risk, there are fewer days of lower risk, as can be seen by comparing the 165 days of Low risk in Haugesund compared to the 73 days in Røros. The differences can generally be explained by a drier and colder inland climate for Lærdal and especially for Røros. While Lærdal is not equally cold, it typically experiences adiabatic heating of descending mountain air for most wind directions during the winter, which reduces the outdoor RH [9].
Considering the distribution of the daily mean TTF throughout the year, it has previously been shown that seasonal changes apply and that low TTF values are observed during the winter months [12].
The risk matrix for Haugesund after analysing the modelled TTF in combination with recorded wind strengths (2013–2023) is presented in Figure 9. As can be seen, the axis of the risk matrix is made up of the different classes of wind strength and modelled TTF, making up the 25 main cells. As it is important to distinguish between the number of hours with specific wind speeds, each main cell is subdivided into four sub-cells referring to the registered duration of the wind. The subdivision of the cells can be seen in Figure 10. The numbers inside the risk matrix represent the annual frequency of the specific event registered for Haugesund.
It can be seen from the matrix that lower-risk events occur more often than higher-risk events, as expected. The dotted white and black squares indicate the events where, based on analysis of historic fire incidents, it is recommended to implement proactive measures. Hence, from Figure 9, events needing risk reducing measures add up to ten events per year regardless of wind duration. If only emphasising the coexistence of in-home drought and strong winds lasting more than 12 h, it adds up to 6.8 events per year. For Haugesund, the historic data shows a manageable set of high-risk events for the local fire department.
The risk matrix for Lærdal is presented in Figure 11. It can be seen that, for a specific wind speed, the frequencies are not necessarily reduced with increasing TTF classes. Hence, the frequencies have less spread for a larger portion of the matrix. For Medium-low winds, the Low and Medium-high TTF classes have quite similar frequencies in the range of 2–12 h wind duration, while for 13–24 h the Medium-high TTF has a higher frequency. This can be explained by the high number of days of both Low and Medium-high TTF for Lærdal. Considering the recommended area of proactive measures, i.e., the dotted rectangle, a frequency of 1.9 days per year is observed for Lærdal, which is less than Haugesund, despite Lærdal having a significantly higher number of days with Medium-high and High TTF. This primarily relates to Haugesund being a coastal town with many days with strong wind, resulting in more days with coexisting high wind strength and high TTF.
The risk matrix for Røros is presented in Figure 12. Here, similar observations as for Lærdal can be observed. For the Medium-low winds, the highest frequency can be seen for Medium-high and High TTF classes. The number of addressable events for Røros equals 10.3, regardless of wind duration. When only considering events where the registered wind speed lasts 12–24 h, 1.1 events per year are registered. As for Lærdal, the number of events recommended for proactive measures is relatively low and manageable for the local fire department. However, notice should be taken of the high number of days corresponding to the High and Medium high TTF classes. This means that Røros and Lærdal are areas where the interiors of wooden homes become very dry during the winter. In turn, this means that an occurring fire may develop rapidly and pose severe risks for both inhabitants and the buildings, many of which are of high historical value. In addition, despite the low numbers of coexisting strong winds and high TTF classes, many old wooden homes at the different heritage sites in Norway are attached. Hence, a fire may spread between structures before the arrival of the local fire department even during moderate wind speeds.

3.3. Fire Danger Communication

Recent work emphasising user-driven iterative development of a graphical user interface (GUI) for fire risk communication revealed that using the term TTF when presenting the WHFR may not be suitable [34]. While serving as a measure for quantifying the WHFR, the TTF risk communication concept needs a new approach. Developing intuitive communication concepts is challenging; thus, the focus was directed towards existing concepts, notably the Norwegian forest fire index and how that risk is communicated within Norway. The Norwegian forest fire risk is communicated as a forest fire danger, not as a fire risk, with an index of seven classes ranging from No danger to Great danger. The idea here is to use this well-established terminology in the wrapping of the FMC (TTF) indicator, thereby communicating the novel in-home wooden fire risk through an established concept. Adopting such an approach can provide a wooden home fire danger index, with the risk communicated as far as possible through a similar index with similar colours. Adjustments had to be made, as the forest fire danger index has a No danger level, which is not applicable for an in-home wooden fire risk indicator considering the year-round risk of imminent fire. The Norwegian forest fire danger index and the adopted wooden home fire danger index are presented in Figure 13.
The indexing into the different levels of danger presented in Figure 13 follows from Table 5. The classification of the modelled TTF is based on the modelling of several historical fires. After analysing these fires and associated video materials, records, and descriptions from the fire brigade, knowledge of model performance was obtained, resulting in the suggested classification. According to the risk matrices presented in Section 3.2, the defined area where risk reducing measures are recommended to be implemented is associated with the Great Danger level. The presented indexing has already been implemented in a second version mobile application, and is ready for testing within selected Norwegian Fire brigades.

3.4. The Marshall Fire

In this section, the model is applied outside the cold climate region of Norway to demonstrate the modelling principle for another region. If the model is to be applied to other areas, the most important aspect is the presence of heated homes with wood as an internal cladding material, especially in the ceiling. In such cases the modelling principle is transferable, even to areas less cold than those considered in the present study. However, as seen in the sensitivity analysis for the outdoor weather parameters, the modelled TTF would rely more on the outdoor RH in a warmer climate. Despite the modelling results not necessarily being invalid, warmer climate areas may not be exposed to the same cold climate fire risk. In addition, such areas may typically have quite different traditions for constructing homes, and wood as internal cladding may not be widespread. Nevertheless, without considering the interior of involved building mass, we applied the model to the area of the recent Marshall fire, Boulder County, Colorado, USA on 30 December 2021 [29].
While the Marshall Fire was a WUI fire initially spreading through cured grass, it is interesting to consider the potential in-home drought of involved wooden homes. Potentially, such a large outdoor fire could originate indoors as a rapidly developing wooden home fire. In addition, the FMC of the involved structures is of importance to the post-flashover fire intensity, which affects further fire spread.
Weather data were collected from the nearby Denver airport and used as input for the fire risk model. Model-specific parameters were kept at the recommended values reflecting the generic Norwegian combined kitchen and living room. Figure 14 presents the modelling results. It can be seen that the wooden homes in the area were becoming drier at the beginning of December 2021. By about the 10th of December, the wooden homes had passed the identified critical limit of 4 min, essentially passing into a stage where fire development is known to be extreme based on historical events [12]. The wooden homes then continued to dry out, becoming equally dry as the most severe registered in-home drought conditions, similar to the conditions during the Lærdal fire in Norway on 28 January 2014. The very dry interior of the wooden homes in the Marshall fire likely contributed to fast burnout and increased production of firebrands in the strong winds.
This modelling highlights in-home drought as a potential risk influencing factor in a somewhat different climate than Norway. Further, the area of Boulder County is not unfamiliar in terms of its high wind strengths [29]. Considering the recent findings on conflagration risk depending more on days of strong wind than days of in-home drought, this area likely experiences increased conflagration risk due to the potential combination of very dry wooden homes and strong winds during the winters.

4. Discussion

4.1. The Generic Enclosure

Concerning whether the analysed parameters were considered sensitive or not, a criterion equal to 0.5 times a single TTF class was used, which means that changes within the recommended values could not result in a difference in the 5th percentile TTF equal to more than 0.5 times a TTF risk class. Because the TTF classes are separated into five classes of one minute per class, this means that if a parameter was considered not sensitive, the TTF value changed with less than 0.5 min for the considered change in parameter size. This was the case for nearly all individually considered parameters within  ± 40 %  of the recommended value. The exception, however, was the ventilation factor, which, at −40% change, slightly exceeded the 0.5-min criteria. A TTF value of 4 min was used to calculate the percentage deviation, as this has shown to be a critical limit for the low value of TTF [12]. The idea behind this criteria is that minor changes in parameter size should not change the predicted risk class. If they do, the parameter must be considered sensitive, and the issue must be addressed.
While all parameters can be changed beyond the recommendations, this would typically provide unrealistic representations of the generic enclosure. e.g., if the ventilation factor was reduced beyond −40%, significant increases in the 5th percentile TTF were observed as humidity was continuously supplied to the enclosure. Hence, the parameters must be considered in relation to each other.
Indeed, the considered literature and the performed sensitivity analysis have increased the credibility regarding the recommended values and range of key model parameters. The most uncertain parameter, however, is the humidity supply, which appears as a relatively insensitive parameter within the recommended range. This parameter, however, has been recommended at 1 kg/day based on field measurements and model analysis [11]. If the humidity production were changed from 1 to 2 kg/day (100% increase), this would result in a 13.1% increase to the 5th percentile TTF, or 27.3% at 3 kg/day. The reason why this is particularly interesting is due to the literature suggesting higher humidity supplies than are used in the model. Herein, it is important to distinguish between supplied water vapour to the indoor air and the actual water vapour contributing to a rise in indoor RH and FMC. Water vapour is lighter than air, and part of the supplied humidity is likely to rise within the enclosure, escaping (leaking) through small gaps in the ceiling and upper parts of the walls. In addition, most old wooden homes have a kitchen and living room on the first floor with bedrooms on the second floor. A fraction of supplied water vapour is likely to rise within the building through doors and via the staircase to higher-level floors. The ventilation system or ventilation principle is another mechanism for transporting supplied water vapour. Hence, there is probably a difference between supplied water vapour and increased relative humidity and FMC value. For this reason, this parameter was set by changing its value to best fit the field measurements of indoor RH. In contrast, most of the other parameters were explicitly set to describe the particular enclosure. It would be necessary to perform additional field measurements and model analysis to increase the accuracy of the humidity production levels. However, many of the considered quantities are variables, and take different values within different homes, e.g., a particular wooden house with a specific humidity production may be drier than another nearby home exposed to another humidity production. The important aspect is not to explicitly model each wooden home; rather, it is to model a representative average and how this would change with changing ambient temperature and RH. In comparison, the ground and the trees in a forest could have significant local variations in FMC; nonetheless, a generic approach is used to describe the conditions over large areas. In general, the sensitivity analysis performed within this study supports the possibility of computing such an average despite the local variations.
The chosen parameters were recommended based on literature and field studies. Parameters were considered from a conservative point of view, e.g., the humidity production, which is pointed out as the most uncertain parameter, is unlikely to take on much lower values than 1 kg/day; however, it might take higher values. By recommending a lower value compared to a higher value, the model provides lower TTF predictions, indicating increased risk. This could be a problem if the number of high-danger days were too many. The presented modelling does, however, show that the number of days with combined strong wind and low TTF is manageable for all the considered locations, even Røros, the mountain village, which despite increased humidity production would appear with far more days of greater home fire danger than the other considered locations.

4.2. Practicability of the Modelled FMC

In the simplest sense, the modelling of the wooden home fire danger results in the FMC (TTF) indicator of in-home drought, indicating when and to what degree the wooden interior of homes is in a state where it is likely to increase the susceptibility to and negative consequences of an initiating or established fire. Homeowners may use such an indication to implement simple measures, e.g., avoiding candles, deep frying, and unattended electric apparatuses. Additionally, the indicator may be used to notify family members and others about increased risk, such as elderly people living alone. For such use, days of high fire danger may last for several days and occur on multiple occasions. In this case, use is mostly about raising awareness, and potential measures are simple but important.
The other modelling aspect is the coexistence of very dry homes and strong wind, where the combination may be understood as a conflagration danger indicator. This is a major concern of local fire brigades. If the combined occurrence of modelled low TTF and predicted winds results in too many high-risk events, it might not be possible for the fire brigades to address these events, even if the model provides a correct picture of the danger. That is to say, if risk modelling and wind forecasts result in a hundred days of high fire danger per year, the outcome might not result in proactive risk management but rather an acceptance of many days of increased danger. However, if abnormal danger levels are seen, e.g., an expected average of about ten days per year, measures could be taken during predicted days of high conflagration danger, especially to protect dense wooden heritage sites. These might typically be a focus area for the different fire brigades, as they are of historical value and particularly vulnerable; see Section 2.1.
Based on the modelling and the identified manageable number of events needing risk-reducing measures, it appears that the modelling may serve as a tool for identifying increased danger levels. Hence, modelling the indoor FMC (TTF) may be an answer to the Norwegian fire safety regulations supporting a risk-based approach to emergency preparedness. Such identification of upcoming increased danger levels in dense wooden house areas may enable improved risk management, in turn allowing proactive measures to be implemented by the fire departments, e.g., raising awareness among citizens, increasing emergency preparedness, temporarily increasing staff, temporarily staffing unstaffed fire stations, and strategically placing equipment and units to reduce the response time.
The presented results identified many days corresponding to High and Medium high TTF for Lærdal and Røros, i.e., low TTF values. In turn, when considering the coexistence with strong winds, a substantial number of days with high conflagration danger were expected. However, it turned out that Haugesund, with far less days of modelled low TTF, experienced more days of high conflagration danger. This indicates that the number of days with strong wind and low TTF depends more on the number of days with strong wind than the number of days with low TTF. Haugesund is a coastal city where periods with dry in-home conditions occur; when this happens, it is more likely to coexist with strong wind. Historical records support this observation, as the majority of the largest peacetime fires in Norway have been coastal town fires [38].
In the present work, strong winds are associated with the wind classes of Medium to High. In this sense, strong winds reflect critical classes of wind speed. Any critical wind speed is scenario-dependent, e.g., it depends on the fuel, HRR, surroundings, etc. In terms of a city or town fire, the critical wind speed may be winds strong enough to cause flame impingement on adjacent structures. This wind speed may be lower than the strong winds associated with the generation of firebrands and spotting fires. Nonetheless, previous conflagrations [25] and expert opinions [39] suggest that wind speeds close to 10 m/s may be challenging. With respect to in-home drought, the present study associates it with the Medium high and High TTF classes. This is based on observations from Norway, where fires developing very quickly have been associated with TTF values corresponding to these classes [12]. When considering the indoor relative humidity and EMC of wooden surfaces, this corresponds to a wooden surface in equilibrium with an indoor RH equal to or less than 27%, i.e., an equilibrium water content of 5.75%.
An interesting observation from the sensitivity study was the dependency of model output on outdoor temperatures. At −10 °C, the modelled TTF varied by only 15.7% when the outdoor air humidity changed from 40% to 90% RH. This is an integral part of why Røros mountain village experiences such a high number of days with low TTF values. Røros has a mean temperature during December, January, and February of −8 °C, −11 °C, and −8 °C, respectively. Both before and after this period, the monthly mean temperature can be expected to be −5 °C. From the sensitivity analysis of outdoor weather parameters, Figure 8 shows that these mean temperatures correspond to about three months with a modelled TTF below 4 min, which corresponds to the High TTF risk class. As a mountain village with several months of subzero temperatures, there are long periods of arid in-home conditions; however, the number of days with strong winds during the winter is low.

4.3. Measures of Risk and Risk Communication

In previous work, the FMC was correlated with the TTF to construct an intuitive risk indicator. The idea was to express the FMC risk indicator through a well known quantity within the fire safety community. The correlation was based on a series of one quarter-scale wooden ISO-room experiments [10], similar to the aforementioned one half-scale experiments. Such a correlation becomes relative to the experiments performed, and changing the experiments, e.g., having a basis in a correlation made from the one half-scale experiments would make for a somewhat different correlation. Hence, the use of TTF to express the risk indicator was primarily intended as a practical approach to the communication of the WHFR. However, recent studies [12,34], feedback, and user tests have raised awareness concerning possible misconceptions when using such a specific term with units in minutes. This is especially challenging when model results are compared to historical fires and associated with an observed time to flashover, as in [12]. It is important to note that while the risk indicator expresses a TTF, this is generally not an accurate quantity for attempting to describe the exact time to flashover for wooden homes. Nonetheless, in cases where an enclosure fire develops from a limited initial fuel source and the wooden walls and ceilings become the only fuel for further fire spread until flashover, experimental results suggest that the modelled TTF can indicate the actual TTF, or at least indicate the top point of a skewed normal distribution of expected TTFs if a number of similar tests are repeated. However, this is not a realistic scenario, and other fuels will likely be involved in the fire during the growth phase. In this case, it could be argued that the modelled TTF indicates fire development within an empty wooden enclosure, and including more fuel and more extensive initial fuel sources could result in even less time until flashover than indicated by the model.
Nevertheless, the risk communication approach described in this paper has been implemented in a mobile application and awaits further testing within fire brigades. The modelled TTF was thought to benefit from a well-established fire danger concept, i.e., the wildfire danger system. In turn, this reduces the need for describing and interpreting new concepts, which is likely to limit the number of misinterpretations and simplify the design of the graphical user interface.

4.4. Validity of the Risk Modelling

Computing the risk matrices involves handling and arranging significant amounts of data, e.g., the datasets gathered for a particular location containing outdoor RH, outdoor temperature, and wind speeds, may have missing elements and could need to be treated by handling the associated timestamps. Depending on the duration of the period with missing elements, interpolation can be used to fill the small gaps for modelling purposes. However, if too much time passes without proper data recordings it must be computed as separate series. All handling of data involves the possibility of introducing errors. For this reason, the Matlab scripts responsible for handling the data were validated through a single-step procedure. Small parts of the code were considered separately as the scripts for data analysis were gradually extended by the validated pieces. In addition, two separate scripts using different approaches and hence code were developed to validate the part where low TTF and strong winds were found to coexist. This was an essential part of the data analysis, as the results can support the practicability of the modelling approach. However, handling large amounts of data over a large temporal scale and performing multiple operations on the data sets always carries the chance of introducing possible errors.
Further, it is important to mention that when analysing several years of historical weather data it may be impossible to find the desired combination of weather parameters registered at the exact location. This was a challenge for Lærdal, where outdoor RH and temperature were taken from a unit in Lærdal while recordings of wind velocities had to be taken from Sogndal airport, 20 km west of Lærdal. Considering the local topography, the wind data from Sogndal probably underestimate the actual winds in Lærdal. It is not unlikely that some of these events could be associated with higher wind speeds, and consequently a higher frequency of addressable events. It is important to note that the fire risk modelling primarily relies on predicted weather data interpolated onto a higher-resolution grid by sophisticated models. Hence, the predicted weather data, especially for the near future (hours), are probably more representative of the actual weather at a location than historical weather records at a distant meteorological station.

4.5. Suggestions for Future Research

At this stage, substantial efforts have been put into developing a wooden home fire danger and possibly a conflagration danger indicator. However, there are several aspects in need of further attention and research. More effort should be put into quantifying humidity production and ventilation rates to ensure that the recommended values are representative. Then, the model should preferably be tested for a set of wooden homes with interior wooden panels in the ceiling, and to different degrees on the interior walls. This would serve as a final validation of the FMC modelling and the chosen generic approach. The model has already undergone substantial testing and validation in an earlier phase [11,12]; however, testing arranged for validating the model could be better targeted when the model parameters are known. This could include testing the recorded in-home RH values versus values predicted solely by weather forecasts, which have only been briefly validated previously in [11].
The conflagration danger indicator is at an early stage, indicating a possible conflagration event by considering an initiating event of a wooden home fire starting indoors. However, more substantial modelling efforts are needed to describe the FMC of external wooden panels. When a fire breaches the building envelope and becomes an exterior fire, the wind strength is the most critical factor for initiating a conflagration event. However, if all the neighbouring structures have high FMC values and free water on surfaces and gutters, a conflagration might be less likely to develop. Hence, more research is needed to consider such conditions.
While only a few related studies have been mentioned, notably studies that emphasise the structure and immediate surroundings, other studies have considered urban fire risk from a broader perspective. Noori et al. [40] considered multiple criteria, including static building information, when mapping urban fire risk. When combined with dynamic fire danger indicators, such multi-criteria risk maps may serve as promising tools to improve risk management in the built environment.

5. Conclusions

To support and justify existing approaches for wooden home fire risk modelling, in this paper we considered and analysed homes with wooden internal surfaces, the general concept, input parameters, and model-specific parameters. From a theoretical and experimental point of view, the modelled FMC, often expressed through the TTF indicator, was found to be a reasonable fire risk indicator for homes with sufficient in-home wooden surfaces. An important criterion is that the share of wooden surfaces is managed through the recommended range of the AV ratio parameter. Further, the recommended values and ranges associated with the different parameters likely describe a generic combined kitchen–living room enclosure in a Norwegian wooden home. This assumption was further strengthened through a sensitivity analysis, which identified all of the key parameters in modelling in-home FMC to be relatively insensitive to realistic variations. Considering usability, an analysis of ten years of weather data records revealed that the number of days with high-risk TTF could exceed the practical limit of addressable events for the fire brigades while raising awareness among homeowners. However, when combining days of high-risk TTF with days of strong wind, i.e., conflagration danger, the historical weather data analysis for the considered locations confirmed the assumption of these being infrequent events, i.e., typically 2–10 days each winter for the analysed locations. These days of increased conflagration risk can be addressed by the local fire departments through proactive measures. The fire risk modelling can then serve as a response to the new requirements in the Norwegian Fire and Emergency Regulations requiring systems for identifying days of high risk, in this particular case, risk associated with wooden homes and heritage sites of historical value. Finally, it appears that coastal towns are more prone to conflagrations, as conflagration danger depends more on days of strong wind rather than days of in-home drought. This is in line with the most severe historical fires in Norway since the 1900s.

Author Contributions

Conceptualization, T.L.; Formal analysis, R.D.S.; Funding acquisition, R.D.S. and T.L.; Investigation, T.L.; Methodology, R.D.S. and T.L.; Project administration, R.D.S. and T.L.; Resources, R.D.S. and T.L.; Software, R.D.S.; Supervision, T.L.; Validation, R.D.S. and T.L.; Visualization, R.D.S.; Writing—original draft, R.D.S.; Writing—review and editing, R.D.S. and T.L. All authors have read and agreed to the published version of the manuscript.

Funding

This research was funded by the Research Council of Norway, grant no. 298993, Reducing fire disaster risk through dynamic risk assessment and management (DYNAMIC), and supported by Haugaland Kraft Nett, Norwegian Directorate for Cultural Heritage, and Stavanger municipality.

Institutional Review Board Statement

Not applicable.

Informed Consent Statement

Not applicable.

Data Availability Statement

All the weather data are available through https://seklima.met.no/ (accessed 5 July 2023).

Acknowledgments

The authors very much appreciate the valuable guidance on statistical analysis from Sveinung Erland at Western Norway University of Applied Sciences.

Conflicts of Interest

The authors declare no conflict of interest.

Abbreviations

The following abbreviations are used in this manuscript:
WHFRWooden Home Fire Risk
RHRelative Humidity
TTFTime To Flashover
FMCFuel Moisture Content
HRRHeat Release ate

References

  1. Mock, C.; Michael Peck, C.J.; Meddings, D.; Gielen, A.; McKenzie, L. Burn Prevention: Success Stories and Lessons Learned; World Health Organization: Geneva, Switzerland, 2011; Available online: https://apps.who.int/iris/bitstream/handle/10665/97938/9789241501187_eng.pdf?sequence=1&isAllowed=y (accessed on 23 June 2023).
  2. Villa, V.; Paltrinieri, N.; Khan, F.; Cozzani, V. Chapter 1—A Short Overview of Risk Analysis Background and Recent Developments. In Dynamic Risk Analysis in the Chemical and Petroleum Industry; Paltrinieri, N., Khan, F., Eds.; Butterworth-Heinemann: Oxford, UK, 2016; pp. 3–12. [Google Scholar] [CrossRef]
  3. Brushlinsky, N.; Sokolov, S.; Wagner, P.; Messerschmidt, B. World Fire Statistics; No. 27; International Association of Fire and Rescue Services: Ljubljana, Slovenia, 2022; Available online: https://ctif.org/sites/default/files/2022-08/CTIF_Report27_ESG.pdf (accessed on 2 June 2023).
  4. Log, T. Indoor relative humidity as a fire risk indicator. Build. Environ. 2017, 111, 238–248. [Google Scholar] [CrossRef]
  5. Directorate for Civil Protection and Emergency Planning. Search in Statistics. Available online: https://www.brannstatistikk.no/brus-ui/search (accessed on 10 April 2023).
  6. The Norwegian Ministry of Justice and Public Security. Forskrift om organisering, Bemanning og Utrustning av brann- og Redningsvesen og Nødmeldesentralene. Available online: https://lovdata.no/dokument/LTI/forskrift/2021-09-15-2755 (accessed on 1 June 2023).
  7. Pirsko, A.R.; Fons, W.L. Frequency of Urban Building Fires as Related to Daily Weather Conditions; Technical Report AFSWP-866; U.S. Department of Agriculture: Washington, DC, USA, 1956. Available online: https://www.fs.usda.gov/psw/publications/documents/cfres_series/cfres_itr_afswp866.pdf (accessed on 23 August 2023).
  8. Geving, S.; Thue, J.V. Fukt i Bygninger; Sintef–Norsk Byggforskningsinstitutt: Trondheim, Norway, 2002. [Google Scholar]
  9. Log, T. Cold Climate Fire Risk; A Case Study of the Lærdalsøyri Fire. Fire Technol. 2014, 52, 1815–1843. [Google Scholar]
  10. Kraaijeveld, A.; Gunnarshaug, A.; Schei, B.; Log, T. Burning rate and time to flashover in wooden 1/4 scale compartments as a function of fuel moisture content. In Proceedings of the 8th International Fire Science & Engineering Conference, Interflam, London, UK, 4–6 July 2016; pp. 553–558. [Google Scholar]
  11. Log, T. Modeling Indoor Relative Humidity and Wood Moisture Content as a Proxy for Wooden Home Fire Risk. Sensors 2019, 19, 5050. [Google Scholar] [CrossRef] [PubMed]
  12. Strand, R.D.; Stokkenes, S.; Kristensen, L.M.; Log, T. Fire Risk Prediction Using Cloud-based Weather Data Services. J. Ubiquitous Syst. Pervasive Netw. 2021, 16, 37–47. [Google Scholar] [CrossRef]
  13. Rahikainen, J.; Keski-Rahkonen, O. Statistical Determination of Ignition Frequency of Structural Fires in Different Premises in Finland. Fire Technol. 2004, 40, 335–353. [Google Scholar] [CrossRef]
  14. Reducing fire Disaster Risk through Dynamic Risk Assessment and Management (DYNAMIC). Available online: https://www.hvl.no/en/project/2495578/ (accessed on 27 March 2023).
  15. Log, T.; Vandvik, V.; Velle, L.; Metallinou, M.M. Reducing Wooden Structure and Wildland-Urban Interface Fire Disaster Risk through Dynamic Risk Assessment and Management. Appl. Syst. Innov. 2020, 3, 16. [Google Scholar] [CrossRef]
  16. Maria-Monika, M.; Torgrim, L. Cold Climate Structural Fire Danger Rating System? Challenges 2018, 9, 12. [Google Scholar] [CrossRef]
  17. Tan, S.; Moinuddin, K.; Joseph, P. The Ignition Frequency of Structural Fires in Australia from 2012 to 2019. Fire 2023, 6, 35. [Google Scholar] [CrossRef]
  18. Tillander, K.; Keski-Rahkonen, O. The Ignition Frequency Of Structural Fires In Finland 1996–1999. Fire Saf. Sci. 2003, 7, 1051–1062. [Google Scholar] [CrossRef]
  19. Abo El Ezz, A.; Boucher, J.; Cotton-Gagnon, A.; Godbout, A. Framework For Spatial Incident-level Wildfire Risk Modelling to Residential Structures at the Wildland Urban Interface. Fire Saf. J. 2022, 131, 103625. [Google Scholar] [CrossRef]
  20. Papathoma-Köhle, M.; Schlögl, M.; Garlichs, C.; Diakakis, M.; Mavroulis, S.; Fuchs, S. A Wildfire Vulnerability Index for Buildings. Sci. Rep. 2022, 12, 6378. [Google Scholar] [CrossRef] [PubMed]
  21. The Directorate for Cultural Heritage. Vil Hindre Brann i Norges 200 Verneverdige Trehusmiljøer. Available online: https://www.riksantikvaren.no/siste-nytt/pressemeldinger/vil-hindre-brann-i-norges-200-verneverdige-trehusmiljoer/ (accessed on 21 June 2023).
  22. The Directorate for Cultural Heritage. Innføring i Emnene tett Trehusbebyggelse, Brannvern og Tilskuddsordning for Brannvern. Available online: https://www.riksantikvaren.no/veileder/tilskudd-til-brannsikring-av-tette-trehusomrader/ (accessed on 21 June 2023).
  23. Edvardsen, K.I.; Ramstad, T. Trehus; Sintef: Trondheim, Norway, 2014. [Google Scholar]
  24. Alapieti, T.; Mikkola, R.; Pasanen, P.; Salonen, H. The Influence of Wooden Interior Materials on Indoor Environment: A Review. Eur. J. Wood Wood Prod. 2020, 78, 617–634. [Google Scholar] [CrossRef]
  25. Koo, E.; Pagni, P.J.; Weise, D.R.; Woycheese, J.P. Firebrands and spotting in large-scale fires. Int. J. Wildland Fire 2010, 19, 818–843. [Google Scholar] [CrossRef]
  26. Steen-Hansen, A.; Bøe, A.; Hox, K.; Mikalsen, R.F.; Stensaas, J.; Storesund, K. Evaluation of fire spread in the large Lærdal fire. In Proceedings of the 14th International Conference and Exhibition on Fire and Materials, San Francisco, CA, USA, 2–4 February 2015; pp. 1014–1024. [Google Scholar]
  27. Log, T.; Gjedrem, A.M. A Fire Revealing Coastal Norway’s Wildland-Urban Interface Challenges and Possible Low-Cost Sustainable Solutions. Int. J. Environ. Res. 2022, 19, 3038. [Google Scholar] [CrossRef] [PubMed]
  28. Mjelstad, H.; Meteorologist, Oslo, Norway. Personal communication, 2022.
  29. Dougherty, M.T.; Johnson, C. Marshall Fire Investigative Summary and Review. Boulder County. 2023. Available online: https://assets.bouldercounty.gov/wp-content/uploads/2023/06/marshall-fire-investigative-summary.pdf (accessed on 24 August 2023).
  30. Drysdale, D. Fire Dynamics; John Wiley & Sons Inc: Hoboken, NJ, USA, 2011. [Google Scholar]
  31. Karlsson, B.; Quintiere, J.G. Enclosure Fire Dynamics; CRC Press: Boca Raton, FL, USA, 2022. [Google Scholar]
  32. Babrauskas, V.; Peacock, R.D. Heat release rate: The single most important variable in fire hazard. Fire Saf. J. 1992, 18, 255–272. [Google Scholar] [CrossRef]
  33. Stokkenes, S.; Kristensen, L.; Log, T. Cloud-based Implementation and Validation of a Predictive Fire Risk Indication Model. In Proceedings of the Norwegian Informatics Conference, Narvik, Norway, 25–27 November 2019; pp. 1–12. [Google Scholar]
  34. Strand, R.D.; Kristensen, L.M.; Svendal, T.; Fisketjøn, E.H.; Hussain, A.T. A Mobile Application for Wooden House Fire Risk Notifications Based on Edge Computing. In Lecture Notes in Networks and Systems Series, Proceedings of the 11th World Conference on Information Systems and Technologies, Pisa, Italy, 4–5 April; Springer: London, UK, 2022; in press. [Google Scholar]
  35. Norwegian Meteorological Institute. Historical Weather Data. Frost. Available online: https://frost.met.no/index.html (accessed on 20 June 2023).
  36. Norwegian Meteorological Institute. MET Weather API. Predicted Weather Data. Available online: https://api.met.no (accessed on 20 June 2023).
  37. Schlunk, L.; Kirkhus, A. Stue i boliger; 361.105; Sintef Byggforsk: Trondheim, Norway, 2019; Available online: https://www.byggforsk.no/dokument/140# (accessed on 23 August 2023).
  38. Losnegård, G. Norske Ulykker og Katastrofar; Skald: Leikanger, Norway, 2013. [Google Scholar]
  39. Botnen, D.; Chief Fire Officer, Haugesund, Norway. Personal communication, 2023.
  40. Noori, S.; Mohammadi, A.; Miguel Ferreira, T.; Ghaffari Gilandeh, A.; Mirahmadzadeh Ardabili, S.J. Modelling and Mapping Urban Vulnerability Index against Potential Structural Fire-Related Risks: An Integrated GIS-MCDM Approach. Fire 2023, 6, 107. [Google Scholar] [CrossRef]
Figure 1. Parts of a wooden home heritage site in Bergen, Norway (top, photo by Silje Marie Hatlestad, reproduced with permission) and a typical Norwegian neighbourhood in Haugesund (bottom).
Fire 06 00377 g001
Figure 2. Illustration of possible developments following an initiating fire event.
Fire 06 00377 g002
Figure 3. Skew normal distributions illustrating the probability of flashover as a function of time and fuel moisture content.
Fire 06 00377 g003
Figure 4. A principle sketch of the parameters influencing the in-home relative humidity and FMC of wooden panels.
Fire 06 00377 g004
Figure 5. Fire origin in investigated fires from 2016–2023, as reported in [5].
Fire 06 00377 g005
Figure 6. Sensitivity analysis of key parameters associated with modelling the in-home RH and FMC (TTF). A relative change of 0% represents modelling using the recommended values in Table 1.
Fire 06 00377 g006
Figure 7. Sensitivity analysis of key parameters associated with modelling the in-home RH and FMC (TTF). A relative change of 0% represents modelling using the recommended values in Table 1. This figure shows an extended range of relative change compared to Figure 6.
Fire 06 00377 g007
Figure 8. Sensitivity analysis of outdoor relative humidity and outdoor temperature.
Fire 06 00377 g008
Figure 9. The computed risk matrix for Haugesund, Norway. The numbers within the matrix represent the annual frequency (days/year) of the specific TTF and wind combination and for a duration according to the sub-classes specified in Figure 10. The dotted rectangle indicates a risk level where it is recommended to implement proactive measures.
Fire 06 00377 g009
Figure 10. The sub-cells of the risk matrix refer to four different classes of wind duration (h), i.e., a single hour of registered wind above the threshold value is ignored.
Fire 06 00377 g010
Figure 11. The computed risk matrix for Lærdal, Norway. The numbers represent the annual frequency (days/year) of the TTF and wind combination for a duration according to the sub-classes specified in Figure 10. The dotted rectangle indicates the risk level where it is recommended to implement proactive measures.
Fire 06 00377 g011
Figure 12. The computed risk matrix for Røros, Norway. The numbers within the matrix represent the annual frequency (days/year) of the TTF and wind combination for a duration according to the sub-classes specified in Figure 10. The dotted rectangle indicates the risk level where it is recommended to implement proactive measures.
Fire 06 00377 g012
Figure 13. The different levels of danger for the Norwegian Forest Fire Index (Top) and the corresponding suggested levels for the Wooden Home Fire Danger Index (Bottom).
Fire 06 00377 g013
Figure 14. Modelled TTF for Denver during December prior to the Marshall fire. The fire occurred on 30 December. Weather data were taken from Denver airport.
Fire 06 00377 g014
Table 1. Recommended values for key parameters used in the modelling of in-home RH and FMC.
ParameterRecommended ValueRecommended RangeRecommended Range as % Change from ReferenceDescription
Enclosure Base Area50 m 2 40–60 m 2 ± 20 %
AV-ratio0.50.4–0.6 ± 20 % Humidity exchange area to enclosure volume
Gamma,  γ 380350–400−8–5%Ventilation factor
Humidity production1 kg/day0.8–1.2 kg/day ± 20 % From respiring, cooking, plants, etc.
Table 2. The qualitative classification of wind with respect to wind speed.
ClassBeaufortDescriptionWind Speed, U (m/s)
High9+Severe gale–Hurricane force 20.8 U
Medium high7, 8High wind, Near–Fresh gale 13.9 U 20.7
Medium5, 6Fresh–Strong breeze 8.0 U 13.8
Medium low4Moderate breeze 5.5 U 7.9
Low0–3Calm–Gentle breeze U 5.4
Table 3. The qualitative classification of modelled TTF and the associated FMC.
ClassIndoor RH [%]FMC 1 [wt.%]TTF [min]
High R H 19 F M C 4.35 T T F 4
Medium high   19 < R H 27 4.35 < F M C 5.75 4 < T T F 5
Medium 27 < R H 35 5.75 < F M C 6.90 5 < T T F 6
Medium low 35 < R H 41 6.90 < F M C 7.85 6 < T T F 7
Low 41 < R H 7.85 < F M C 7 < T T F
1 Modelled value represents indoor wooden panels at 2–3 mm depth.
Table 4. The annual distribution of daily mean TTF for Haugesund, Lærdal, and Røros based on weather data from 1 November 2013 to 1 April 2023 (ten winters).
ClassTTF [min]HaugesundLærdalRøros
High T T F 4 3.22697
Medium high 4 < T T F 5 31110108
Medium 5 < T T F 6 957145
Medium low 6 < T T F 7 713143
Low 7 < T T F 16512873
Table 5. Wooden Home Fire Index with associated TTF values and classification.
IndexColorTTF ClassTTF [min]
Great DangerDark redHigh T T F 4
Great DangerRedMedium high 4 < T T F 5
Increased DangerOrangeMedium 5 < T T F 6
Increased DangerYellowMedium low 6 < T T F 7
Normal DangerTurquoiseLow 7 < T T F
Disclaimer/Publisher’s Note: The statements, opinions and data contained in all publications are solely those of the individual author(s) and contributor(s) and not of MDPI and/or the editor(s). MDPI and/or the editor(s) disclaim responsibility for any injury to people or property resulting from any ideas, methods, instructions or products referred to in the content.

