
Upward Fire Spread Hazard of Vertical Greenery Systems: A Comparative Study with External Thermal Insulation Composite System and Double-Skin Façade

Abstract
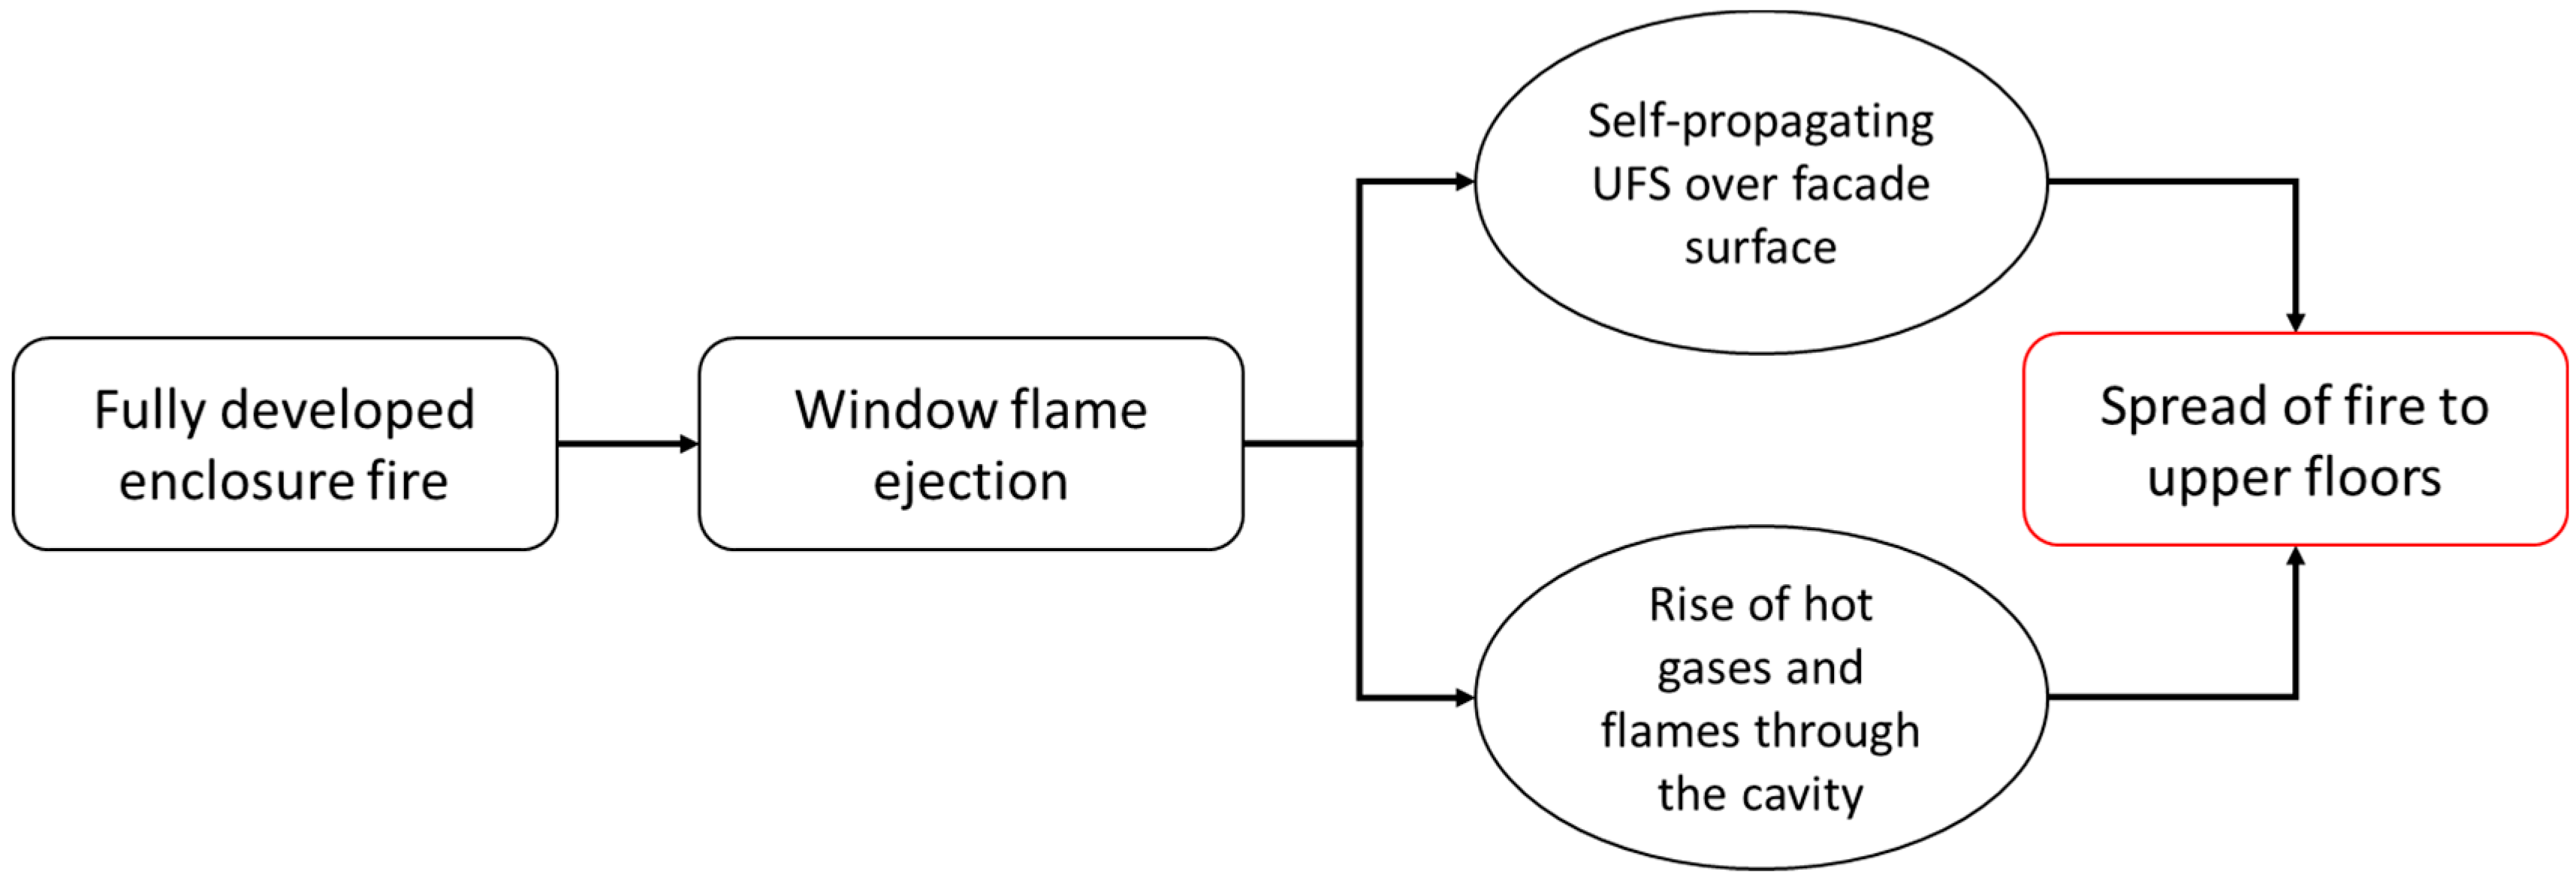
:1. Introduction
2. Numerical Simulation of Upward Fire Spread of Thermally Efficient Building Façade Systems
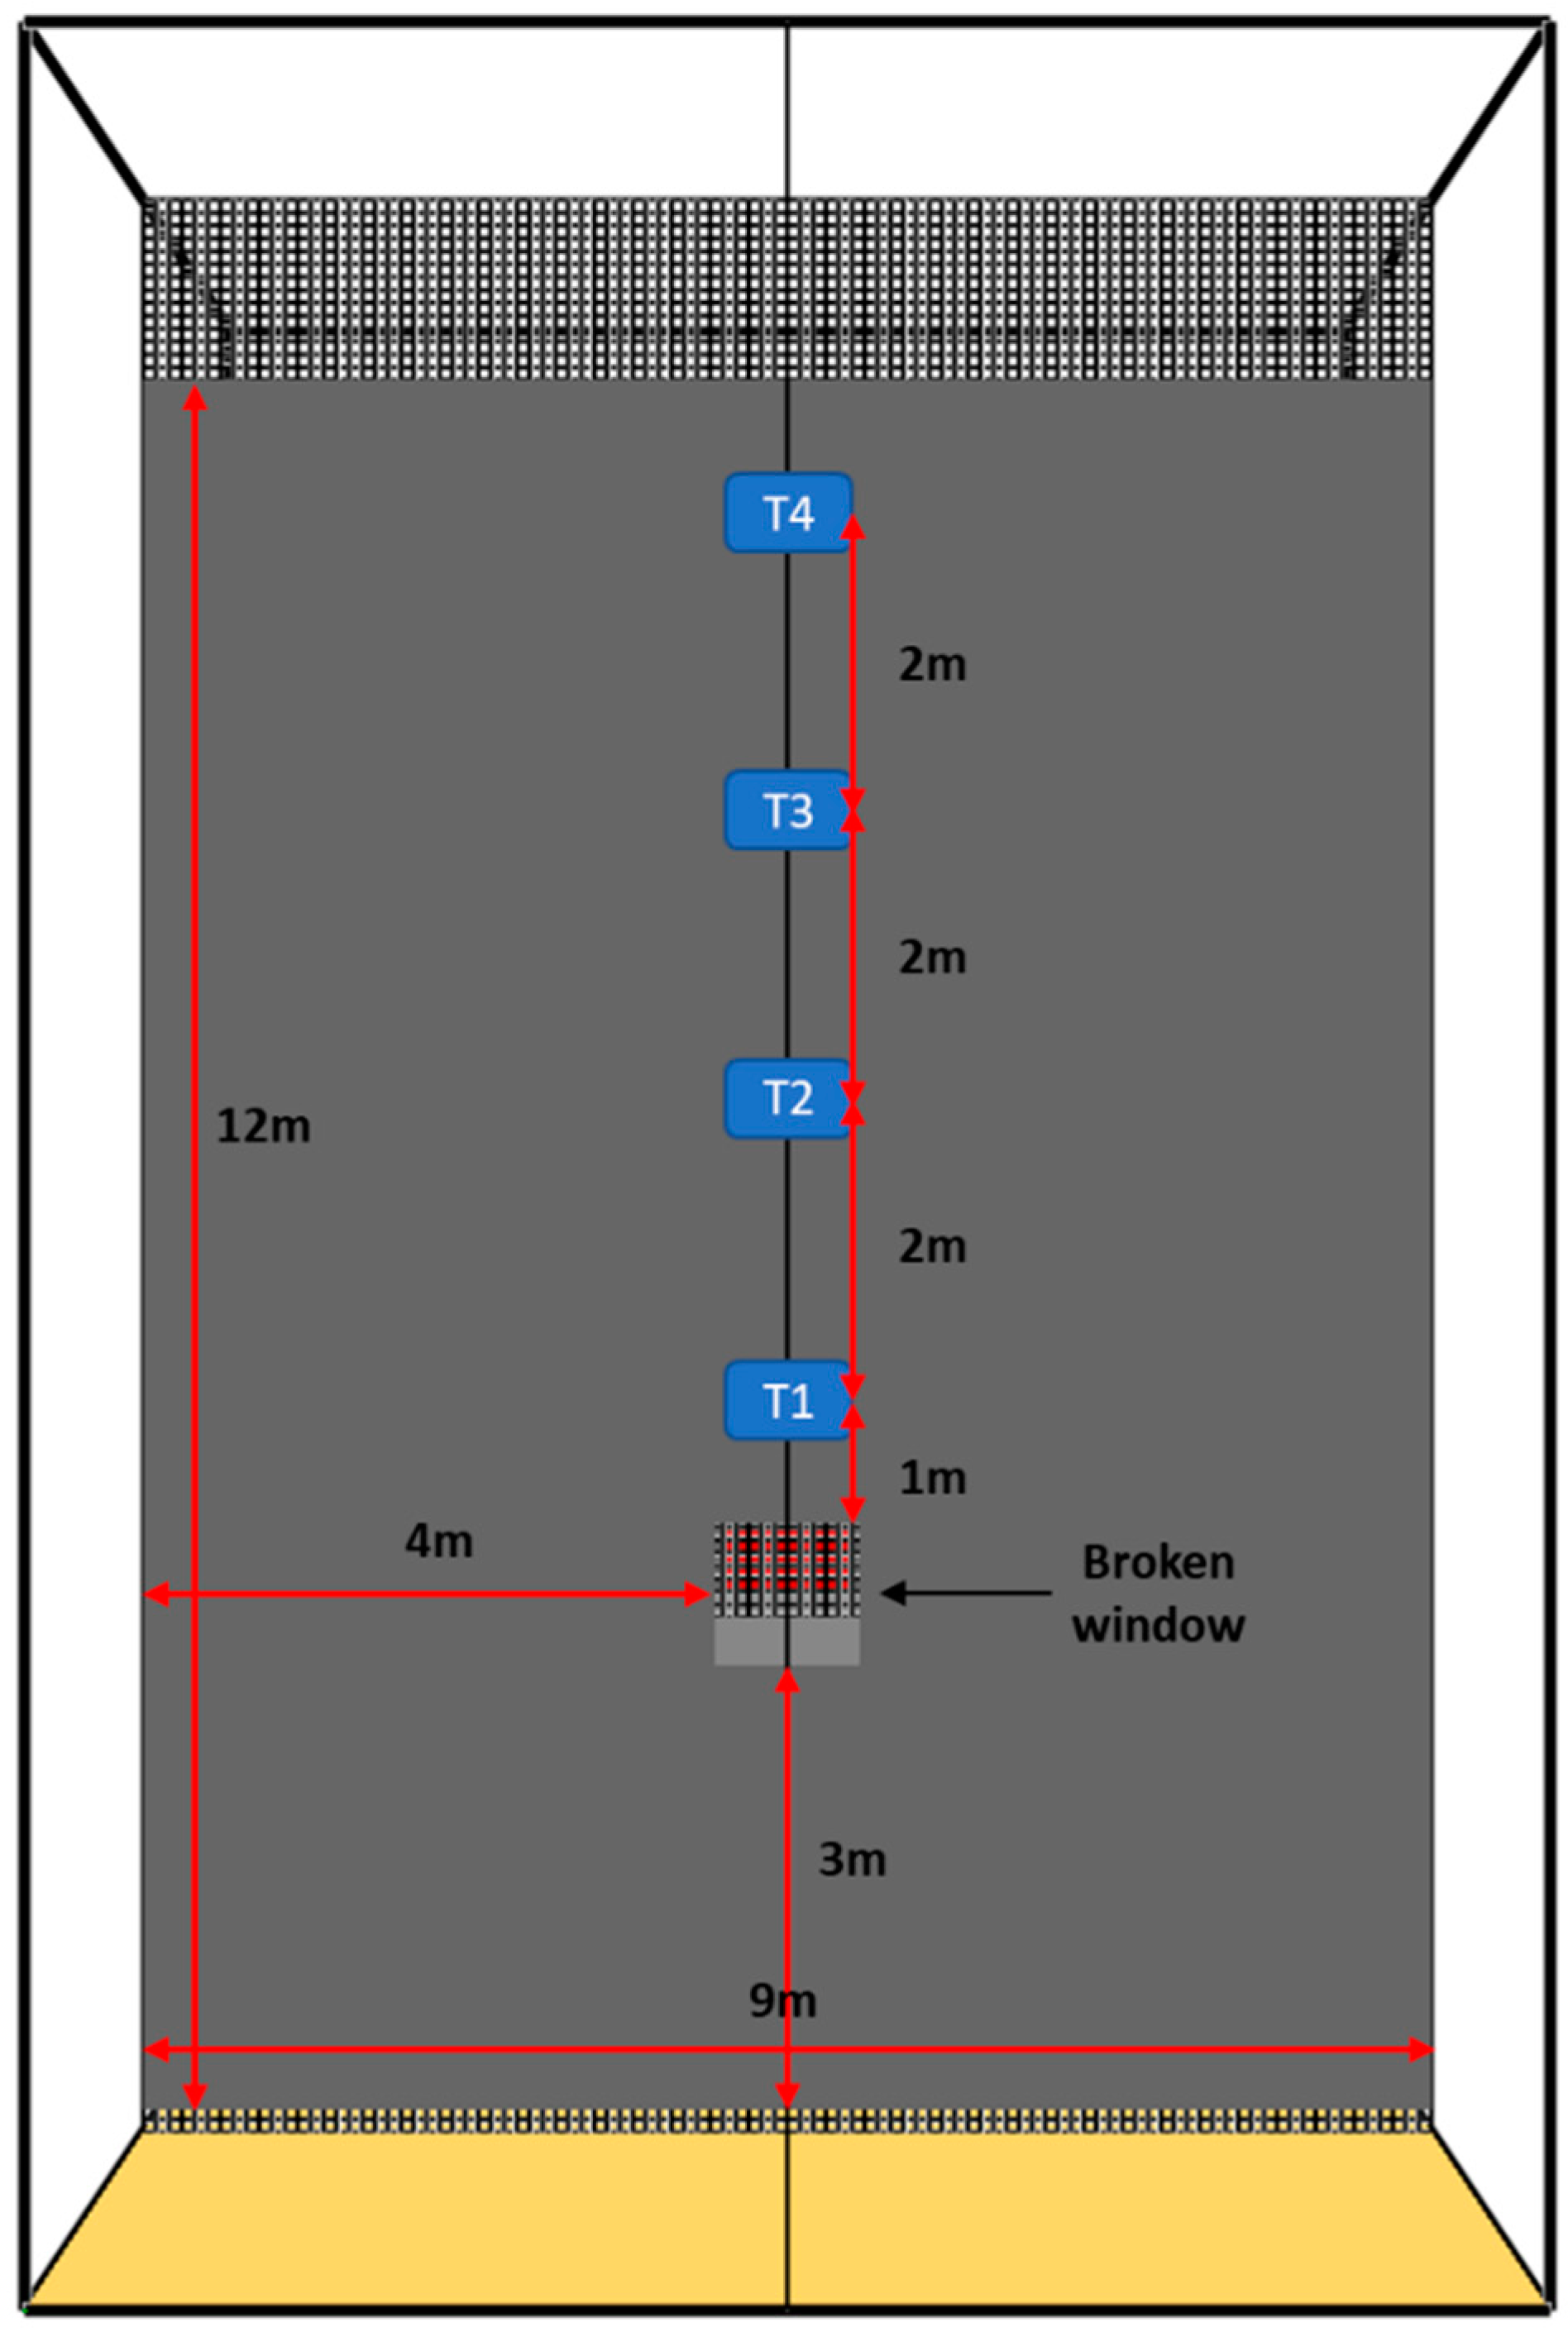
2.1. Overview of the FDS Model
2.2. Details of the Scenarios Simulated
2.3. Input Parameters of the FDS Model
3. Results and Discussion
3.1. Upward Fire Spread along the TEBFS
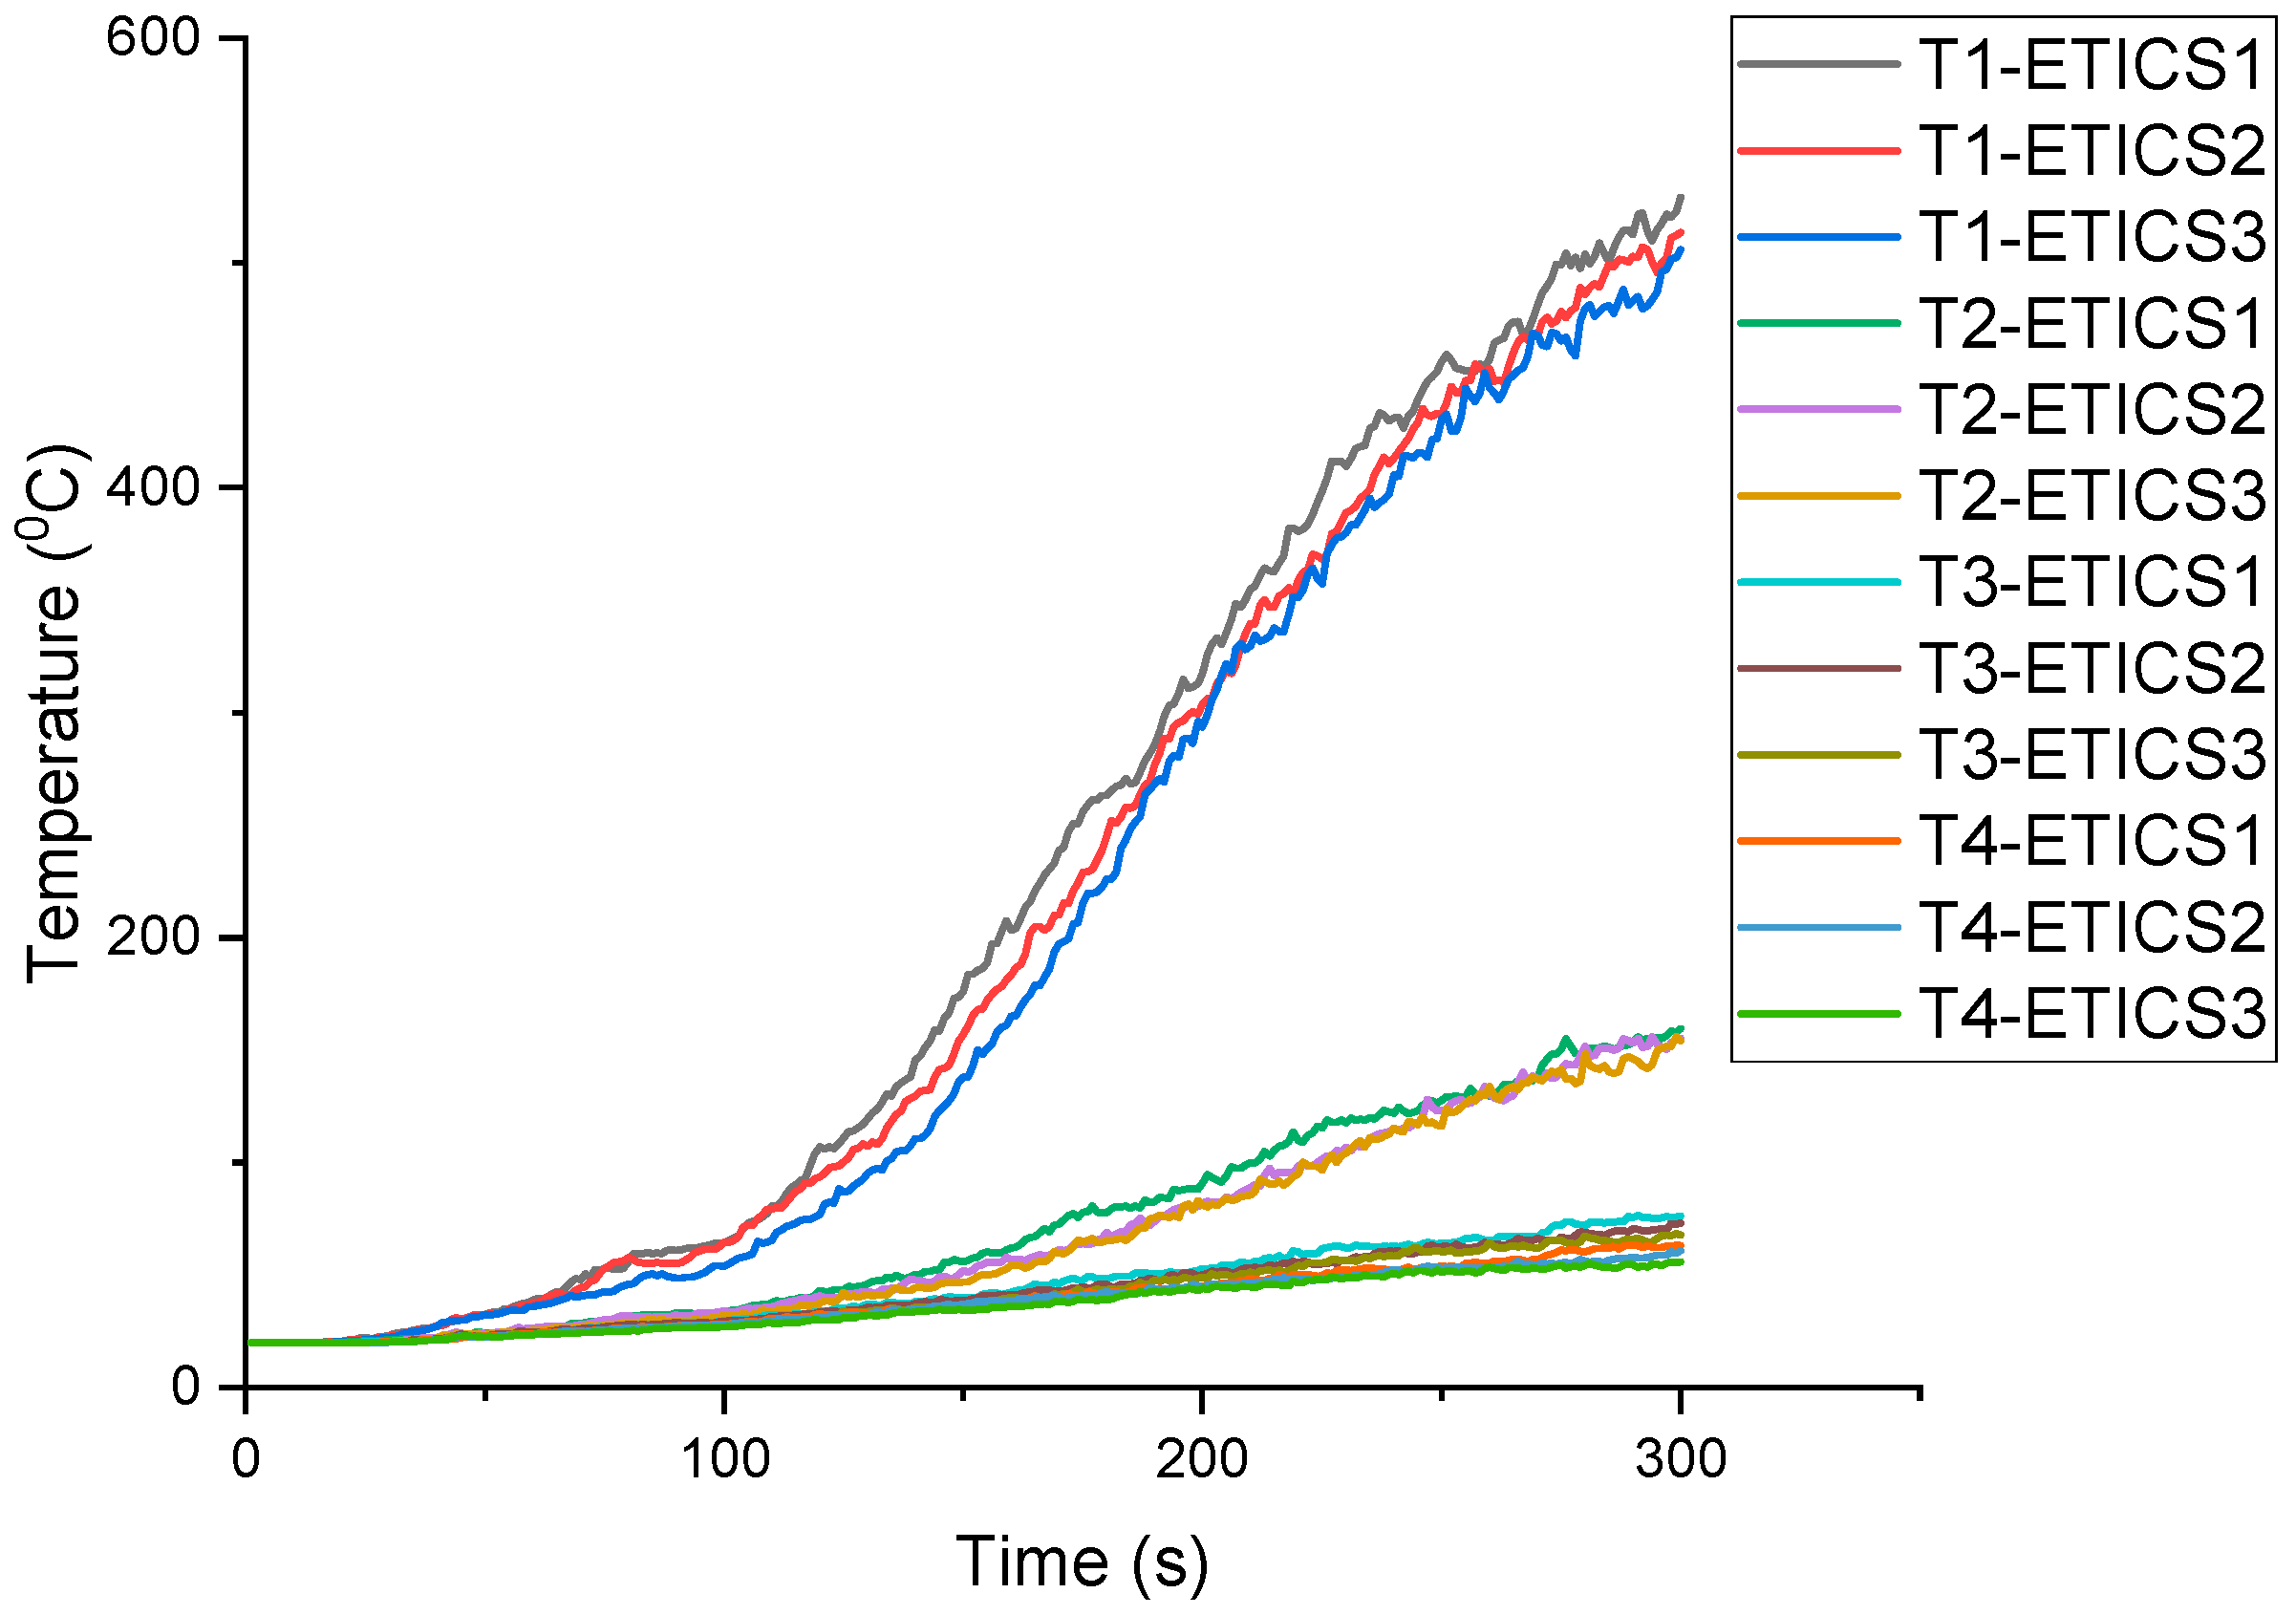
3.2. Temperature Distribution along the TEBFS
4. Conclusions
5. Limitations and Future Work
Author Contributions
Funding
Institutional Review Board Statement
Informed Consent Statement
Data Availability Statement
Conflicts of Interest
References
- Yildiz, Y.; Arsan, Z.D. Identification of the building parameters that influence heating and cooling energy loads for apartment buildings in hot-humid climates. Energy 2011, 36, 4287–4296. [Google Scholar] [CrossRef]
- Kwok, Y.T.; Lau, K.; Ng, E. The Influence of Building Envelope Design on the Thermal Comfort of High-Rise Residential Buildings in Hong Kong. In Proceedings of the 10th Windsor Conference, Windsor Great Park, UK, 12–15 April 2018; pp. 1062–1075. [Google Scholar]
- Rathnayake, U.; Lau, D.; Chow, C.L. Review on energy and fire performance of water wall systems as a green building façade. Sustainability 2020, 12, 8713. [Google Scholar] [CrossRef]
- Hu, L.; Yang, T. Studies of fire prevention issues in exterior wall thermal insulation system. In Proceedings of the 2011 Second International Conference on Mechanic Automation and Control Engineering, Inner Mongolia, China, 15–17 July 2011; pp. 6104–6106. [Google Scholar]
- Niziurska, M.; Wieczorek, M.; Borkowicz, K. Fire Safety of External Thermal Insulation Systems (ETICS) in the Aspect of Sustainable Use of Natural Resources. Sustainability 2022, 14, 1224. [Google Scholar] [CrossRef]
- Chow, W.K.; Hung, W.Y. Effect of cavity depth on smoke spreading of double-skin façade. Build. Environ. 2006, 41, 970–979. [Google Scholar] [CrossRef]
- Rathnayake, U.; Karunaratne, T.L.W.; Han, S.; Lau, D.; Chow, C.L. Experimental investigation on thermal performance of water wall systems exposed to fire. Indoor Built Environ. 2022, 32, 170–182. [Google Scholar] [CrossRef]
- Lee, Y.-P.; Delichatsios, M.A.; Silcock, G.W.H. Heat fluxes and flame heights in façades from fires in enclosures of varying geometry. Proc. Combust. Inst. 2007, 31, 2521–2528. [Google Scholar] [CrossRef]
- Chow, N.C.L.; Li, S.S.; Huang, D.X. Apron design for protecting double-skin fac¸ade fires. Fire Mater. 2015, 39, 189–206. [Google Scholar] [CrossRef]
- Huang, Y.; Yeboah, S.; Shao, J. Numerical investigation of fire in the cavity of naturally ventilated double skin façade with venetian blinds. Build. Serv. Eng. Res. Technol. 2022, 44, 45–61. [Google Scholar] [CrossRef]
- Yanagisawa, A.; Goto, D.; Ohmiya, Y.; Delichatsios, M.A.; Lee, Y.-P.; Wakatsuki, K. Effect of a facing wall on façade flames. In Proceedings of the Fire Safety Science—9th International Symposium, Karlsruhe, Germany, 21–26 September 2008; pp. 801–811. [Google Scholar]
- Miao, L.; Chow, C.L. A study on window plume from a room fire to the cavity of a double-skin façade. Appl. Therm. Eng. 2018, 129, 230–241. [Google Scholar] [CrossRef]
- Chow, C.L. Numerical studies on smoke spread in the cavity of a double-skin façade. J. Civ. Eng. Manag. 2011, 17, 371–392. [Google Scholar] [CrossRef]
- Chow, W.K.; Hung, W.Y.; Gao, Y.; Zou, G.; Dong, H. Experimental study on smoke movement leading to glass damages in double-skinned façade. Constr. Build. Mater. 2007, 21, 556–566. [Google Scholar] [CrossRef]
- An, W.; Wang, Z.; Xiao, H.; Sun, J.; Liew, K.M. Thermal and fire risk analysis of typical insulation material in a high elevation area: Influence of sidewalls, dimension and pressure. Energy Convers. Manag. 2014, 88, 516–524. [Google Scholar] [CrossRef]
- Zhang, Y.; Sun, J.H.; Huang, X.J.; Chen, X.F. International Journal of Heat and Mass Transfer Heat transfer mechanisms in horizontal flame spread over wood and extruded polystyrene surfaces. Int. J. Heat Mass Transf. 2013, 61, 28–34. [Google Scholar] [CrossRef]
- Peng, L.; Ni, Z.; Huang, X. Review on the Fire Safety of Exterior Wall Claddings in High-rise Buildings in China. Procedia Eng. 2013, 62, 663–670. [Google Scholar] [CrossRef]
- McKenna, S.T.; Jones, N.; Peck, G.; Dickens, K.; Pawelec, W.; Oradei, S.; Harris, S.; Stec, A.A.; Hull, T.R. Fire behaviour of modern façade materials—Understanding the Grenfell Tower fire. J. Hazard. Mater. 2019, 368, 115–123. [Google Scholar] [CrossRef] [PubMed]
- Zhou, B.; Yoshioka, H.; Noguchi, T.; Wang, K.; Huang, X. Upward Fire Spread Rate Over Real-Scale EPS ETICS Façades. Fire Technol. 2021, 57, 2007–2024. [Google Scholar] [CrossRef]
- Ezinwa, J.U.; Robson, L.D.; Obach, M.R.; Torvi, D.A.; Weckman, E.J. Evaluating Models for Predicting Full-Scale Fire Behaviour of Polyurethane Foam Using Cone Calorimeter Data. Fire Technol. 2014, 50, 693–719. [Google Scholar] [CrossRef]
- Pitts, W.M. Role of two stage pyrolysis in fire growth on flexible polyurethane foam slabs. Fire Mater. 2014, 38, 323–338. [Google Scholar] [CrossRef]
- D’Souza, M.V.; McGuire, J.H. ASTM E-84 and the flammability of foamed thermosetting plastics. Fire Technol. 1977, 13, 85–94. [Google Scholar] [CrossRef]
- Hadden, R.; Alkatib, A.; Rein, G.; Torero, J.L. Radiant Ignition of Polyurethane Foam: The Effect of Sample Size. Fire Technol. 2014, 50, 673–691. [Google Scholar] [CrossRef]
- Wong, N.H.; Tan, A.Y.K.; Tan, P.Y.; Sia, A.; Wong, N.C. Perception studies of vertical greenery systems in Singapore. J. Urban Plan. Dev. 2010, 136, 330–338. [Google Scholar] [CrossRef]
- Pérez, G.; Rincón, L.; Vila, A.; González, J.M.; Cabeza, L.F. Green vertical systems for buildings as passive systems for energy savings. Appl. Energy 2011, 88, 4854–4859. [Google Scholar] [CrossRef]
- Chew, M.Y.L.; Conejos, S.; Azril, F.H. Bin Design for maintainability of high-rise vertical green facades. Build. Res. Inf. 2019, 47, 453–467. [Google Scholar] [CrossRef]
- Dahanayake, K.C.; Chow, C.L. Moisture Content, Ignitability, and Fire Risk of Vegetation in Vertical Greenery Systems. Fire Ecol. 2018, 14, 125–142. [Google Scholar] [CrossRef]
- Dahanayake, K.C.; Yang, Y.; Wan, Y.; Han, S.; Chow, C.L. Study on the fire growth in underground green corridors. Build. Simul. 2020, 13, 627–635. [Google Scholar] [CrossRef]
- Karunaratne, T.L.W.; Chow, C.L. Fire spread along vertical greenery systems from window ejected flame: A study based on a fire dynamic simulator model. J. Build. Eng. 2022, 62, 105359. [Google Scholar] [CrossRef]
- Anderson, W.R.; Catchpole, E.A.; Butler, B.W. Convective heat transfer in fire spread through fine fuel beds. Int. J. Wildl. Fire 2010, 19, 284–298. [Google Scholar] [CrossRef]
- McGrattan, K.; Hostikka, S.; McDermott, R.; Floyd, J.; Weinschenk, C.; Overhold, K. Fire Dynamics Simulator User ’s Guide (FDS), 6th ed.; NIST Spec. Publ. 1019; National Institute of Standards and Techology: Gaithersburg, MD, USA, 2020. [Google Scholar]
- Cicione, A.; Walls, R.S. Towards a simplified fire dynamic simulator model to analyse fire spread between multiple informal settlement dwellings based on full-scale experiments. Fire Mater. 2021, 45, 720–736. [Google Scholar] [CrossRef]
- Karlsson, B.; Quintiere, J.G. Enclosure Fire Dynamics; CRC Press: New York, NY, USA, 1999. [Google Scholar]
- Ahmadi, O.; Mortazavi, S.B.; Pasdarshahri, H.; Mohabadi, H.A. Consequence analysis of large-scale pool fire in oil storage terminal based on computational fluid dynamic (CFD). Process Saf. Environ. Prot. 2019, 123, 379–389. [Google Scholar] [CrossRef]
- Zhou, B.; Yoshioka, H.; Noguchi, T.; Ando, T. Numerical prediction of mass loss rate of expanded polystyrene (EPS) used for external thermal insulation composite systems (ETICS) in cone calorimeter. Fire Mater. 2018, 42, 517–526. [Google Scholar] [CrossRef]
- Chow, C.L. Full-scale burning tests on double-skin façade fires. Fire Mater. 2013, 37, 17–34. [Google Scholar] [CrossRef]
- Nilica, R.; Harmuth, H. Mechanical and fracture mechanical characterization of building materials used for external thermal insulation composite systems. Cem. Concr. Res. 2005, 35, 1641–1645. [Google Scholar] [CrossRef]
- Stoliarov, S.I.; Crowley, S.; Lyon, R.E.; Linteris, G.T. Prediction of the burning rates of non-charring polymers. Combust. Flame 2009, 156, 1068–1083. [Google Scholar] [CrossRef]
- Jayalakshmy, M.S.; Philip, J. Thermophysical properties of plant leaves and their influence on the environment temperature. Int. J. Thermophys. 2010, 31, 2295–2304. [Google Scholar] [CrossRef]
- Simpson, W.; TenWolde, A. Physical properties and moisture relations of wood. In Wood Handbook: Wood as An Engineering Material; General Technical Report FPL; GTR-113; USDA Forest Service, Forest Products Laboratory: Madison, WI, USA, 1999; pp. 3.1–3.24. [Google Scholar]
- Park, W.C.; Atreya, A.; Baum, H.R. Determination of pyrolysis temperature for charring materials. Proc. Combust. Inst. 2009, 32, 2471–2479. [Google Scholar] [CrossRef]
- Jiang, L.; He, J.J.; Sun, J.H. Sample width and thickness effects on upward flame spread over PMMA surface. J. Hazard. Mater. 2018, 342, 114–120. [Google Scholar] [CrossRef]
- McAllister, S.; Grenfell, I.; Hadlow, A.; Jolly, W.M.; Finney, M.; Cohen, J. Piloted ignition of live forest fuels. Fire Saf. J. 2012, 51, 133–142. [Google Scholar] [CrossRef]
- Chow, W.K.; Chow, C.L.; Li, S.S. Simulating smoke filling in big halls by computational fluid dynamics. Model. Simul. Eng. 2011, 2011, 781252. [Google Scholar] [CrossRef]
- Yakovchuk, R.; Kuzyk, A.; Skorobagatko, T.; Yemelyanenko, S.; Borys, O.; Dobrostan, O. Computer simulation of fire test parameters façade heat insulating system for fire spread in fire dynamics simulator (FDS). Ser. Geol. Technol. Sci. 2020, 4, 35–44. [Google Scholar] [CrossRef]


| TEBFS | Differentiating Parameter | Sources | ||
|---|---|---|---|---|
| ETICS façade | EPS thickness | |||
| ETICS1 | ETICS2 | ETICS3 | ||
| 5 cm | 10 cm | 20 cm | [35] | |
| DSF | Cavity Width | |||
| DSF1 | DSF2 | DSF3 | ||
| 0.5 m | 1 m | 1.5 m | [6,13,14,36] | |
| VGS | Vegetation MC | |||
| VGS1 | VGS2 | VGS3 | ||
| 30% | 50% | 80% | [27] | |
| Parameter | Value |
|---|---|
| ETICS | |
| PCM thickness | 0.002 m |
| CM thickness | 0.001 m |
| DSF | |
| Glass dimensions (L × W × T) | 11.5 m × 9 m × 0.10 m |
| Bottom vent height | 0.15 m |
| VGS | |
| PR | 0.50 |
| Particle dimensions (L × W × T) | 0.04 m × 0.04 m × 0.01 m |
| VGS wall thickness | 0.10 m |
| Number of vegetation particles in the VGS wall | 1,070,000 particles |
| Particle density of the VGS wall | 100,000 particles/m3 |
| Bulk density of vegetation in the VGS wall | 50 kg m−3 |
| Material | Density (kg m−3) | Conductivity (Wm−1 k−1) | Specific Heat |
|---|---|---|---|
| ETICS | |||
| PCM | 1000 [35] | 0.4 [35] | 1.420 [35] |
| CM | 1200 [35] | [35] | 0.880 [35] |
| EPS | 15 [35] | 0.038 [35] | [35] |
| PSm | 1200 [35] | [35] | [37] |
| VGS | |||
| Dry vegetation | 100 [27] | 0.21 [38] | [39] |
| Char | 300 [31] | 0.05 [31] | [40] |
| Ash | 67 [31] | 0.1 [31] | [41] |
| DSF | |||
| Glass | 2000 | 0.8 | 0.840 |
| Galvanised steel | 7800 | 52 | 0.470 |
| Reaction | A | E (J/mol) |
|---|---|---|
| PCM pyrolysis (R1) | 1.68 × 10⁶ [35] | 9.42 × 10⁷ [35] |
| EPS melting (R2) | 1.6 × 10⁻² [35] | 0 [35] |
| PS melt decomposition (R3) | 1.16 × 10⁸ [35] | 1.73 × 10⁸ [35] |
| Moisture evaporation (R4) | 600,000 [31] | 48,200 [31] |
| Vegetation pyrolysis (R5) | 36,300 [31] | 60,300 [31] |
| Char oxidation (R6) | 430 [31] | 74,800 [31] |
| MC (%) | Time Taken to Reach the MC Level | ||
|---|---|---|---|
| HH | PO | AO | |
| 30% | 15 days | 62 days | More than 74 days |
| 50% | 13 days | 58 days | More than 74 days |
| 80% | 11 days | 55 days | More than 74 days |
Disclaimer/Publisher’s Note: The statements, opinions and data contained in all publications are solely those of the individual author(s) and contributor(s) and not of MDPI and/or the editor(s). MDPI and/or the editor(s) disclaim responsibility for any injury to people or property resulting from any ideas, methods, instructions or products referred to in the content. |
© 2023 by the authors. Licensee MDPI, Basel, Switzerland. This article is an open access article distributed under the terms and conditions of the Creative Commons Attribution (CC BY) license (https://creativecommons.org/licenses/by/4.0/).
Share and Cite
Karunaratne, T.L.W.; Chow, C.L. Upward Fire Spread Hazard of Vertical Greenery Systems: A Comparative Study with External Thermal Insulation Composite System and Double-Skin Façade. Fire 2023, 6, 200. https://doi.org/10.3390/fire6050200
Karunaratne TLW, Chow CL. Upward Fire Spread Hazard of Vertical Greenery Systems: A Comparative Study with External Thermal Insulation Composite System and Double-Skin Façade. Fire. 2023; 6(5):200. https://doi.org/10.3390/fire6050200
Chicago/Turabian StyleKarunaratne, Tharindu Lakruwan Wickremanayake, and Cheuk Lun Chow. 2023. "Upward Fire Spread Hazard of Vertical Greenery Systems: A Comparative Study with External Thermal Insulation Composite System and Double-Skin Façade" Fire 6, no. 5: 200. https://doi.org/10.3390/fire6050200