1. Introduction
Galicia is the most northwestern autonomous community of Spain, accounting for approximately 8% of the national forest area. Galicia can roughly be divided into two regions with different economic dynamics. The mainland has a strong dependence on the agricultural and livestock sectors, whereas the more densely populated Atlantic coast area is more industrialized. However, the cultural heritage and socioeconomic relationships in both regions are strongly determined by the presence of the forest. First, the Galician forests provide goods and services that significantly influence the local economy. In particular, the region provides about 54% of the overall Spanish timber logging from coniferous and hardwoods [
1]. Forest ownership is mostly spread over many private owners, with small land parcels (fewer than 0.3 ha per plot with a total average of 1.6 hectares per owner, [
2]). They employ the forest as a financial asset focused on satisfying the family’s occasional economic needs, such as buying a car or remodelling a house. Therefore, the widely spread character of forest property reduces the industrial incentive but represents a strategic source of family savings. Second, the local population also develops many leisure activities in the forest. The Galician woodland thus plays a socioeconomic role that shapes the local lifestyle and cultural heritage in a more general sense, and public policies should consequently protect this natural resource by preserving both the forest stand and ecosystem services.
A peculiarity of the Galician woodland is the heterogeneity and variety of land ownership, in combination with a small average terrain size. This results in the existence of different types of forest landowners who, in their choice of land management options, must take into account the spatial relations with the neighbouring terrains and owners [
3,
4]. These relations influence the landscape, the ecosystem values, and the fire risk, and should therefore be taken into account by private as well as public agents, in particular when developing forest administration policies, for instance, those related to the promotion of proper forest cover and land usage, and their effect on wildfire risk.
Indeed, wildfires are the most critical hazard faced by the Galician forests. Uncontrolled wildfires cause critical natural and material damages as well as a high social disruption. This is not only because of the socioeconomic importance of forest land, as described above, but also because of the increasing ecological awareness of the importance of ecosystem conservation and preservation and the intense coverage of wildfires by the mass media [
5]. The occurrence of wildfires presents strong anthropomorphic influences linked with the disruption of traditional land management and changes in the patterns of forest environment uses. While this diagnosis is generally valid for the whole of Galicia, there is also an important need to differentiate both the analysis and suggestions for improvement. This is because there are strong (spatial and temporal) heterogeneities in the patterns of wildfires which should be taken into account when designing and implementing efficient forest policies [
6]. Apart from the obvious concentration of wildfires during summer, some years also see global hot spots in comparison with the overall time series trends [
7,
8]. The spatial distribution in the past decades also manifests strong spatial heterogeneity trends, with some regions showing increasing rates wildfires and other regions, on the contrary, showing decreasing rates [
6,
9]. For all these reasons, it makes sense to differentiate the wildfire analysis in Galicia depending on the geographical area.
In this paper, we particularly focus on the Galician mountain systems. The core of the Galician mountains lies in the provinces of Lugo and Ourense. Both are relatively wild areas whose ecosystem reservoir is important in terms of air quality, water supply, and biodiversity. In economic terms, they have a low presence of industry, and the small population depends strongly on the primary sector, from the obvious timber resources to the highly appreciated agrifood products, such as wild harvesting, game hunting, and honey production. In the present paper, we will develop a statistic and econometric modelling of wildfires in the Galician mountain area, with a particular emphasis on the effect of spatial heterogeneity and land use. Although the main point of the model is to describe and understand this spatial heterogeneity and some of the factors that influence it, we will also make some remarks about how these effects could be taken into account when designing prevention policies and the protection of forest services and goods.
The paper begins with a brief literature review of the previous research on wildfires, mountain regions, and forest management.
Section 3 contains a description of the research methodology, with an emphasis on the definition of the spatial weight matrices and an overview of the statistical and econometric models. The data are described in
Section 4, with a detailed description of the area under study and of some essential statistical characteristics. The main research results are presented in
Section 5, while
Section 6 contains a brief discussion, conclusions, and recommendations for future research.
2. Background
Wildfires can occur naturally, but in many cases human factors are involved. They are thus a very relevant field of study to analyse the anthropomorphic hazards faced by natural resources at a global level as well as specifically for Spain [
10,
11,
12,
13,
14,
15]. Previous studies highlight the relevance of different types of socioeconomic patterns on the wildfire risk through variables such as the population density, community structures, agricultural use, livestock activity, and economic organisation.
Research on wildfires applies a wide range of statistical and econometric frameworks, from discrete statistical models [
16,
17] over beta regressions [
18] to panel data [
19] or spatial econometric models [
20]. However, in most cases, spatial relations are not explicitly taken into account through specific statistics and econometric models; instead, panel data models are used to control temporal and spatial patterns. This research proposes to focus explicitly on spatial statistics and econometrics to relate the wildfire occurrence to other independent variables.
Within the context of mountain research in Spain, there exists a certain focus on forest management and wildfire prevention. For example, the work by Ortega et al. (2012) [
21] centres on the agricultural changes in Spain and how these have conditioned the wildfire risk during the last decades. Other factors that have been studied within the same scope are, for example, soil moisture [
22,
23], climate, and topographic features [
24,
25]. With respect to the Galician mountain systems in particular, Lombao et al. (2015) [
26] analysed how wildfires change the natural mountain environment, while other papers such as those by Fuentes et al. (2013) [
27] and Marey-Perez et al. (2021) [
28] contribute to the design of preventive measures for avoiding wildfire risk through public policy improvements. The regulation and administration of natural resources in the Galician mountain regions are also the subject of papers by Pérez et al. (2010), Bruña and Pérez (2018), Caballero (2015), and Nieto-Romero et al (2021) [
29,
30,
31,
32]. Several of these works have emphasized the relevance of local particularities and specifically of property fragmentation and type of ownership to the degree of success of the implementation of public policies. There exist studies on wildfires in other Mediterranean mountain areas, such as those by Fonseca et al. (2017), Martínez et al. (2022), and Colonico et al. (2022) [
33,
34,
35]. However, the present authors are not aware of any research that explicitly uses spatial statistical and/or econometric methods to investigate wildfire risk in Spanish mountain and rural areas, let alone for the specific case of the Galician mountain areas.
The present work thus aims to contribute to the protection and preservation of the natural environment in the Galician mountain range. This topic is not only of high ecological and socioeconomic interest, but also of academic interest. It involves both ex ante and ex post policies as well as the triangular relation between, first, policy; second, variables that encode local conditions such as the ratio of agricultural land; and third, purely spatial factors such as contiguity. In this sense, we have applied methodologies that are innovative in this particular context, and thus contribute to a better understanding and hopefully a better protection and management of the natural resources in Galicia.
3. Methodology
This paper focuses on spatial statistical and econometric models to describe and analyse wildfire patterns. In particular, the spatial relations between each pair of local entities determine a binary weight matrix
W, as defined by Equation (
1). Here,
if the element in row
i and the element in column
j are
contiguous; otherwise,
, with
by definition.
This matrix can be used at different lag levels. The matrix encodes only direct contiguity, whereas also includes spatial relations in which two entities border a common ("lag-1”) entity but are not necessarily direct neighbours, up to n spatial lags.
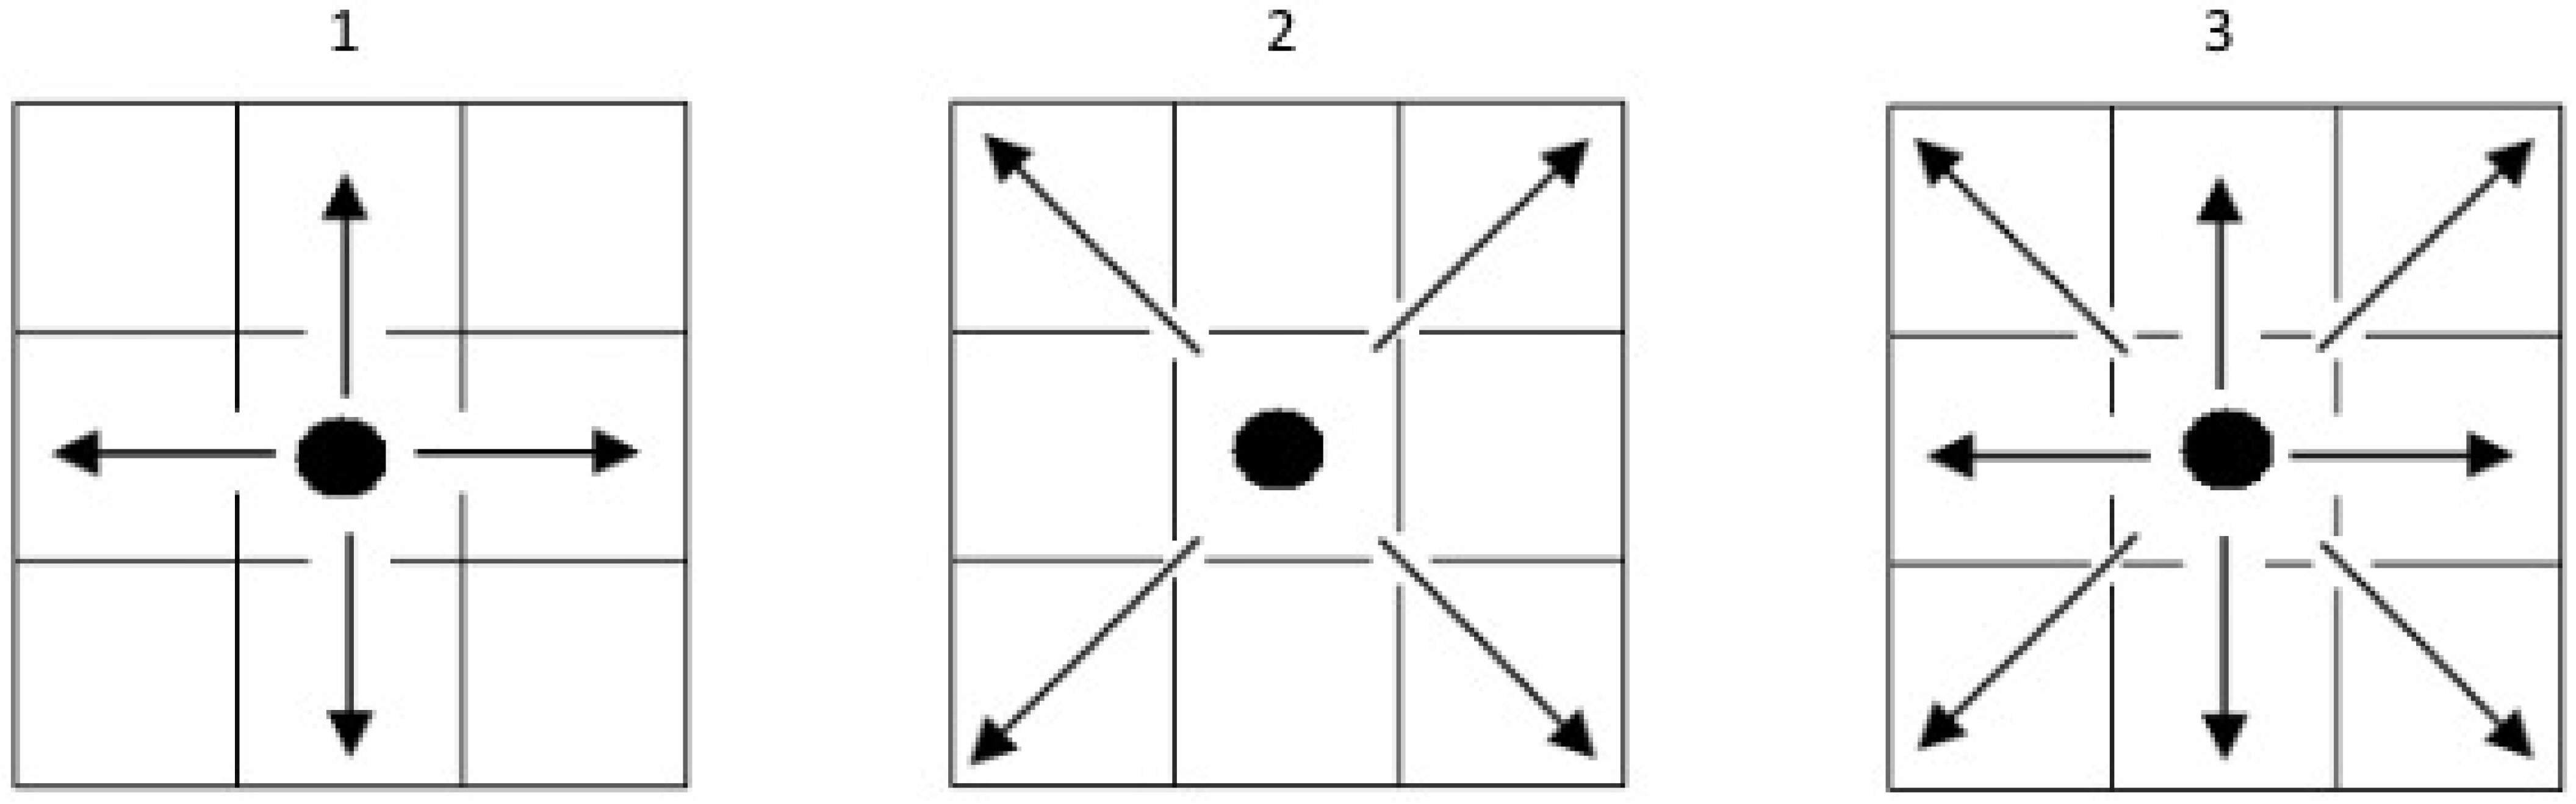
These spatial lags themselves can be defined in different ways, the most common being the “rook” and the “queen” relationships, as seen in
Figure 1. The rook model takes into account the direct contact with the nonzero-length contiguity border. The bishop relation incorporates only the diagonal cross on the chessboard, representing entities which have a common vertex but no common border. Finally, the queen frame combines the rook and bishop connection models. Note that a bishop relation of order 1 always represents a rook relation of order 2, but not all rook relations of order 2 can be written as a bishop relation of order 1. Since our intention is to analyse the relevance of spatial relations to wildfire patterns at different levels, we will use the most general relationship, namely the queen contiguity model.
The contiguity matrix defined above allows for the calculation of different indicators of spatial (auto)correlation. The first indicator is Moran’s
I index. This index is a global indicator of the existence of spatial autocorrelations among nearby units. It is calculated at different spatial lag values, and the value that results (after the adequate normalization) in the optimal level of spatial autocorrelation is the one that will be used in the remainder of the study. Equation (
Section 3) describes Moran’s
I index, calculated in terms of the number of observations (N), the sum of the weight matrix (
), the recorded data (
x) for each pair of entities (
)—for example, the frequency of wildfires—and the global average (
). If the result is significantly different from zero, then it confirms the existence of spatial autocorrelations. Otherwise, there is no evidence to support the existence of spatial cluster patterns as opposed to the null hypothesis of spatial randomness.
The previous statistic is a global measure of the presence or absence of spatial patterns. In order to identify the concrete local spatial autocorrelation patterns, i.e., to pinpoint the location of spatial clusters as well as outliers, a local Moran index
is also calculated for each local entity
i:
where the index
k is the sum of all entities, whereas
j is the sum of only thee entity
i’s neighbours (i.e.,
if
i and
j are not contiguous).
With these data, a local indicator spatial autocorrelation (LISA) map is constructed for all locally significant autocorrelation values by using the position in the scatter plot of absolute differences between this local Moran index and the global mean [
36]. Thus, points that falls in the top-right quadrant of the scatter plot represent a high–high cluster relation because the location
i and its neighbours (at the spatial lag in question) both show high values (for instance, of the frequency of wildfires) relative to the global mean. Likewise, low–low values (the bottom-left quadrant of the scatter plot) represent a cluster of low incidence relative to the global mean. Outliers correspond to high–low (bottom-right) and low–high (top-left) relations, i.e., entities with a high incidence in spite of the fact that their neighbours show values below the global average, or vice versa.
Another indicator of local clustering patterns used in this research is the Local Getis–Ord (
) statistic. This analyses the presence of hot and cold spots in the data, i.e., neighbourhoods that are significantly higher or lower than a globally average neighbourhood. Equation (
4) explains how this
statistic is obtained from the adjacent data (
), its standard deviation (
S), and global mean (
).
A
z-score is then obtained for each location by comparing this result with the global expected value, which is divided by the standard deviation; see Equation ((
5)). These values are expected to follow a standard normal distribution, and thus a
z-score of 1.65 (in absolute value) or higher is significant at an
level, 1.96 at an
level etc., with positive values indicating hot spots and negative values indicating cold spots. Note that the Getis–Ord statistic verifies only the value of a variable in a neighbourhood (entity
i included) and compares this with the globally expected value, whereas the local Moran index compares the local value in a certain entity
i with its direct neighbours
j. In this sense, most Getis–Ord hot spots roughly (but not necessarily) correspond to high–high Local Moran spots, while cold spots correlate with low–low spots.
Finally, the analysis implements a spatial econometric model to identify how well the application of spatial relations and land use works to describe and predict wildfire patterns in the study area. Equation (
6) describes the Durbin model, which is a complete spatial econometric design that involves a dependent variable
Y and its spatial lag(s)
, a set of independent variables
X and their spatial lag(s)
, the spatial error
, and the random error
.
Rather than imposing a concrete econometric model beforehand, the approach followed here dictates that the data should decide which model is best. The most commonly used models in this type of spatial econometric research are the spatial lag model (SLM), spatial error model (SEM), and spatial simultaneous autoregressive model (SAC). Depending on the concrete model selected, one or more of the terms in Equation (
6) will be absent.
Lagrange multipliers (LM) and a portmanteau SARMA test (Spatial AutoRegressive Moving Average) are used to decide upon the most adequate one between these models [
37,
38,
39]. Essentially, the LM statistics determines if there exists a spatial dependence by considering the spatial lag (SLM) or spatial error model (SEM), separately, while the portmanteau SARMA test involves both spatial effects simultaneously, combined into a SAC model. Thus, if all tests are significant (
p-value below
), a SAC will be indicated. If one of the LM tests is significant but the SARMA test is not (or less) significant, then either an SLM or an SEM will be implemented. If all tests are not significant, then an ordinary least squares (OLS) should be run without considering spatial patterns. Note that LM tests are run also for robust error and robust lag, which should be considered if both normal LM test statistics are significant in order to decide which model to apply [
40].
Figure 2 offers a more complete summary of the different steps and models, depending whether or not the null value of certain parameters is rejected.
The analysis makes use of specialised software, including R-Project, GeoDa, and QGIS. QGIS was used for spatial cleanings and shape management [
42], GeoDa to create the weight matrices [
43], and R-Project (with spatial packages such as
spdep [
44] or
tmap [
45] among others) to develop all the statistical and econometric models [
46].
4. Data
In this research, the main Galician mountain systems are studied. These are the
Ancares-Caurel region in the province of Lugo, and
Macizo Central,
Pena Trevinca, and
Pena Maseira in the province of Ourense.
Figure 3 shows where these regions are located within the overall situation of Galicia, as well the all their parts that are protected as nature reserves (the coloured polygons). The total area of these four regions totals 300,413.2 hectares 128,390.4 ha which have been affected by a total of 20,216 wildfires registered from 1991 to 2019. This paper uses parishes as local entities to analyse the wildfires’ patterns and their relationship with land management. Parishes are originally religious units which are still the most useful representation of the current distribution of Galicia into small social districts, each with their own characteristic customs and lifestyles. These 232 parishes are also shown (delimited by lines) in the right-hand side of
Figure 3.
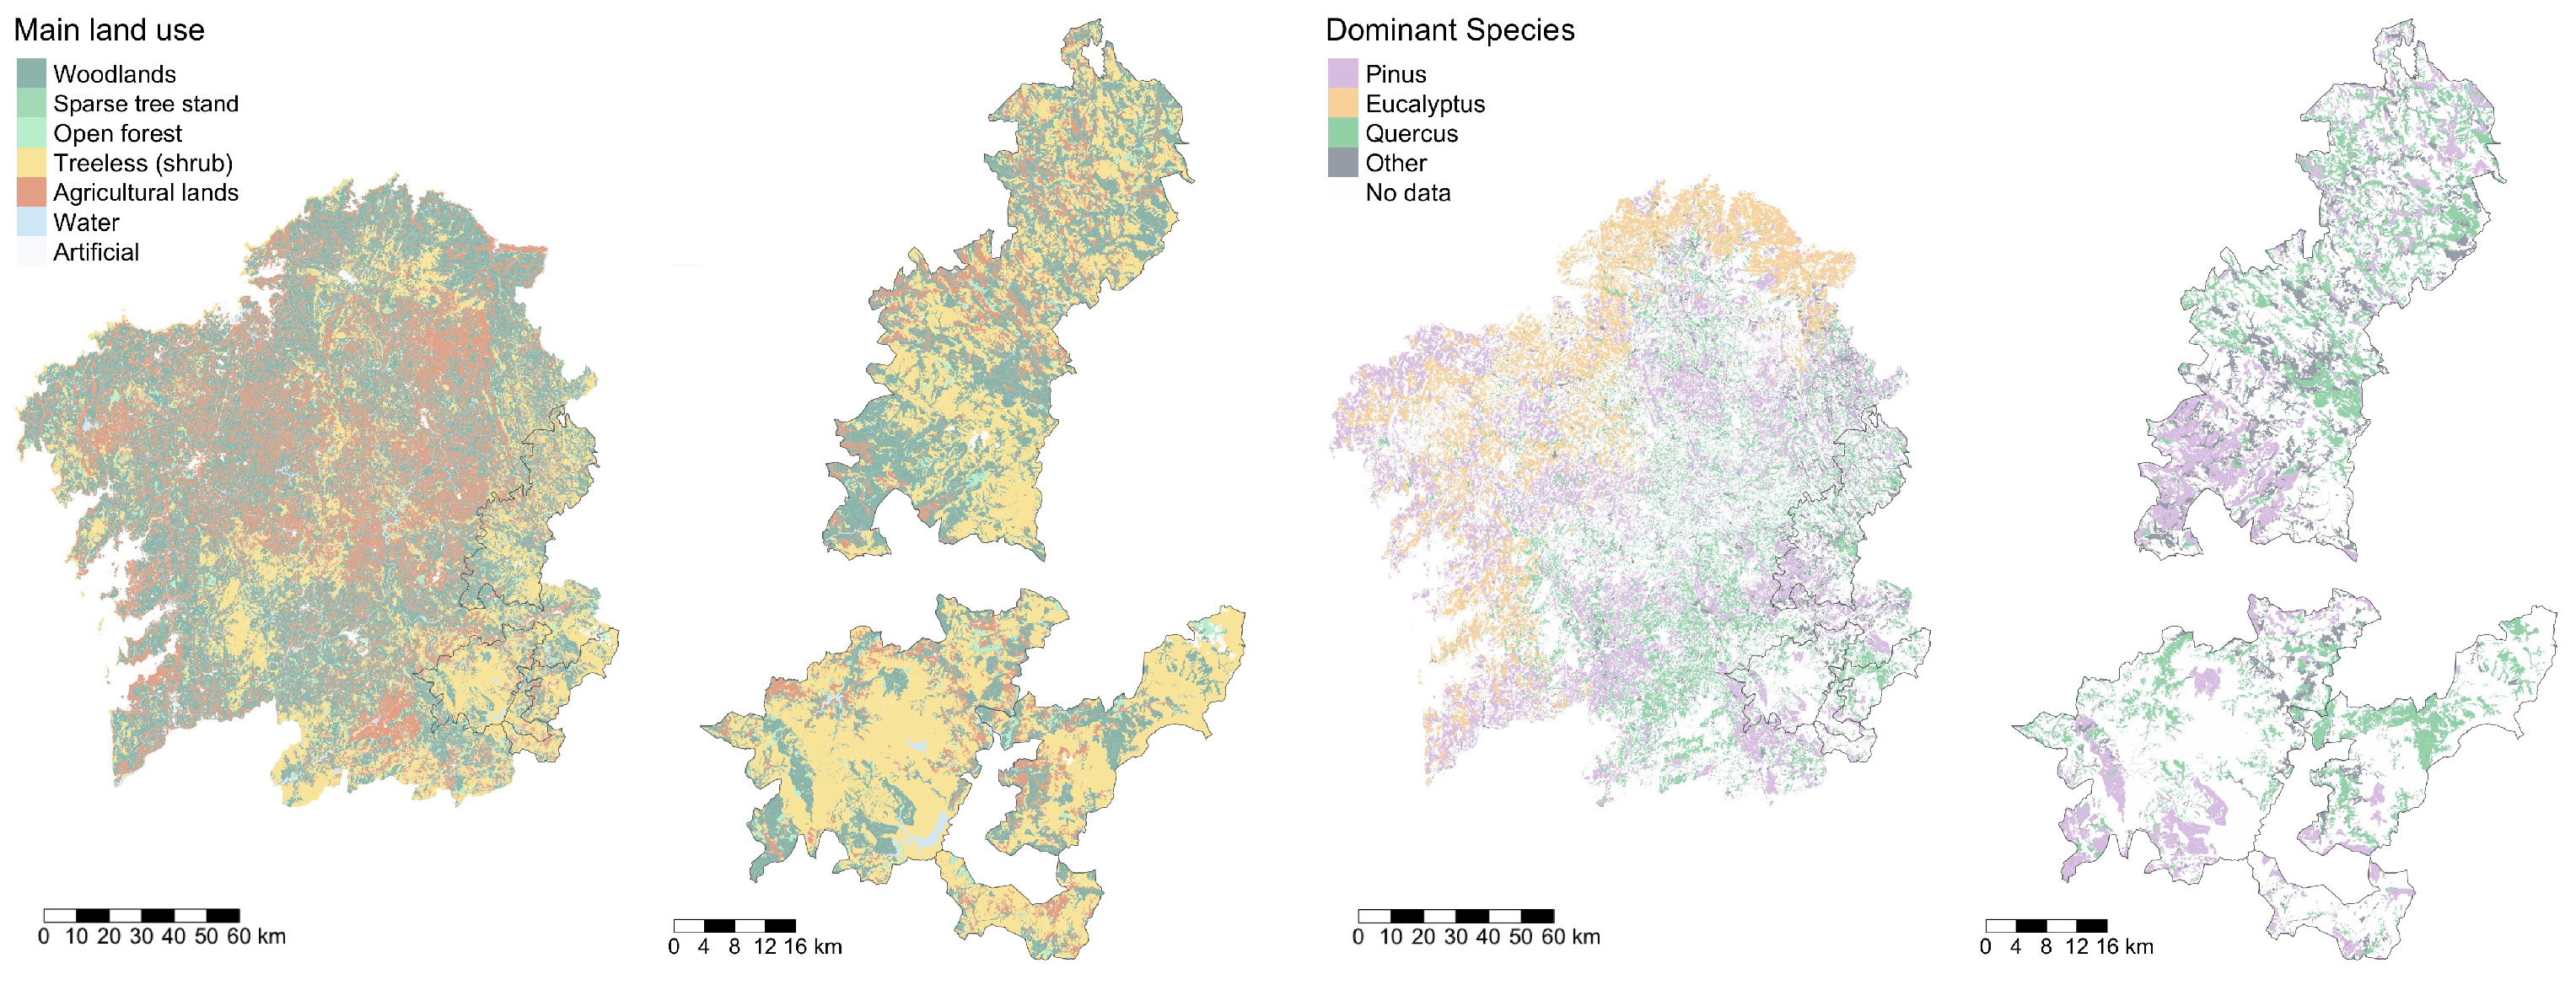
Figure 4 describes the key features of the main land use and dominant tree species for both Galicia in general and the Galician mountain areas in particular. For Galicia in general, the central region is characterised by the importance of agriculture, which is also prevalent in some specific places on the coast. Outside of these, forest and shrub cover dominates the landscape, but with a large irregularity in terms of density and of main species across the territory. Woodlands and sparse tree stands, although present all over Galicia, are dominant mainly in the coastal areas. Shrublands are principally present in Galicia’s southeast, including the mountain areas studied in this study, with an important presence also in the interior of the Pontevedra province. In terms of leading species,
Eucalyptus plantations prevail in the coastal areas, particularly along the north coast. On the Atlantic coast,
Eucalyptus coexists with
Pinus, which is also common in some specific areas.
Quercus becomes ever more important, still coexisting with
Pinus towards the interior regions, including the mountain regions, where the
Eucalyptus is residual.
The variables used in this study are shown in
Table 1. As dependent variables, four quantities are used that characterize the wildfire patterns, namely their frequency, ratio of affected area, suppression time, and extension. The Galician Regional Forest Office have collected these data since 1991, and the full range of available data was used in this paper [
49]. All these variables are expressed as yearly (total or average) quantities.
In the econometric model, these dependent variables will be linked to a set of independent variables. The first four of these characterise the land cover and usage, namely the ratios of agricultural land, of coniferous area, of transitional woodland–shrub area, and of industrial and related facilities, with respect to either the total parish area, the parish forest area, or the parish nonforest area. This information was obtained from the CORINE Land Cover (CLC) maps, using the most recently published version for each year (1990, 2000, 2006, 2012, 2018) [
50]. The ratio of agricultural land over total area is used to analyse how the evolution of this parameter affects the occurrence and effect of wildfires. If this variable turns out to be statistically significant, it could be useful to promote or limit (depending on the sign of the estimated coefficient) this type of area. The remaining variables follow a similar aim: the ratio of coniferous areas characterises the forest stand structure (which is particularly relevant in terms of the combustion profile and wildfire propagation); transitional woodland–shrub is indicative of shrubland presence; and the ratio of industrial area and facilities typifies secondary and tertiary economic development.
The last three independent variables are the population density, the ratio of protected land, and the ratio of common lands. The population density identifies where human dwellings are most concentrated. Protected land (in particular, protected birdlife reserve or ZEPA, which is the best-documented variable related to ecological protection in these regions) and common lands are indicative of land regulation and the role it plays in risk exposure in these mountain areas. These three variables were obtained from regional government information [
47].
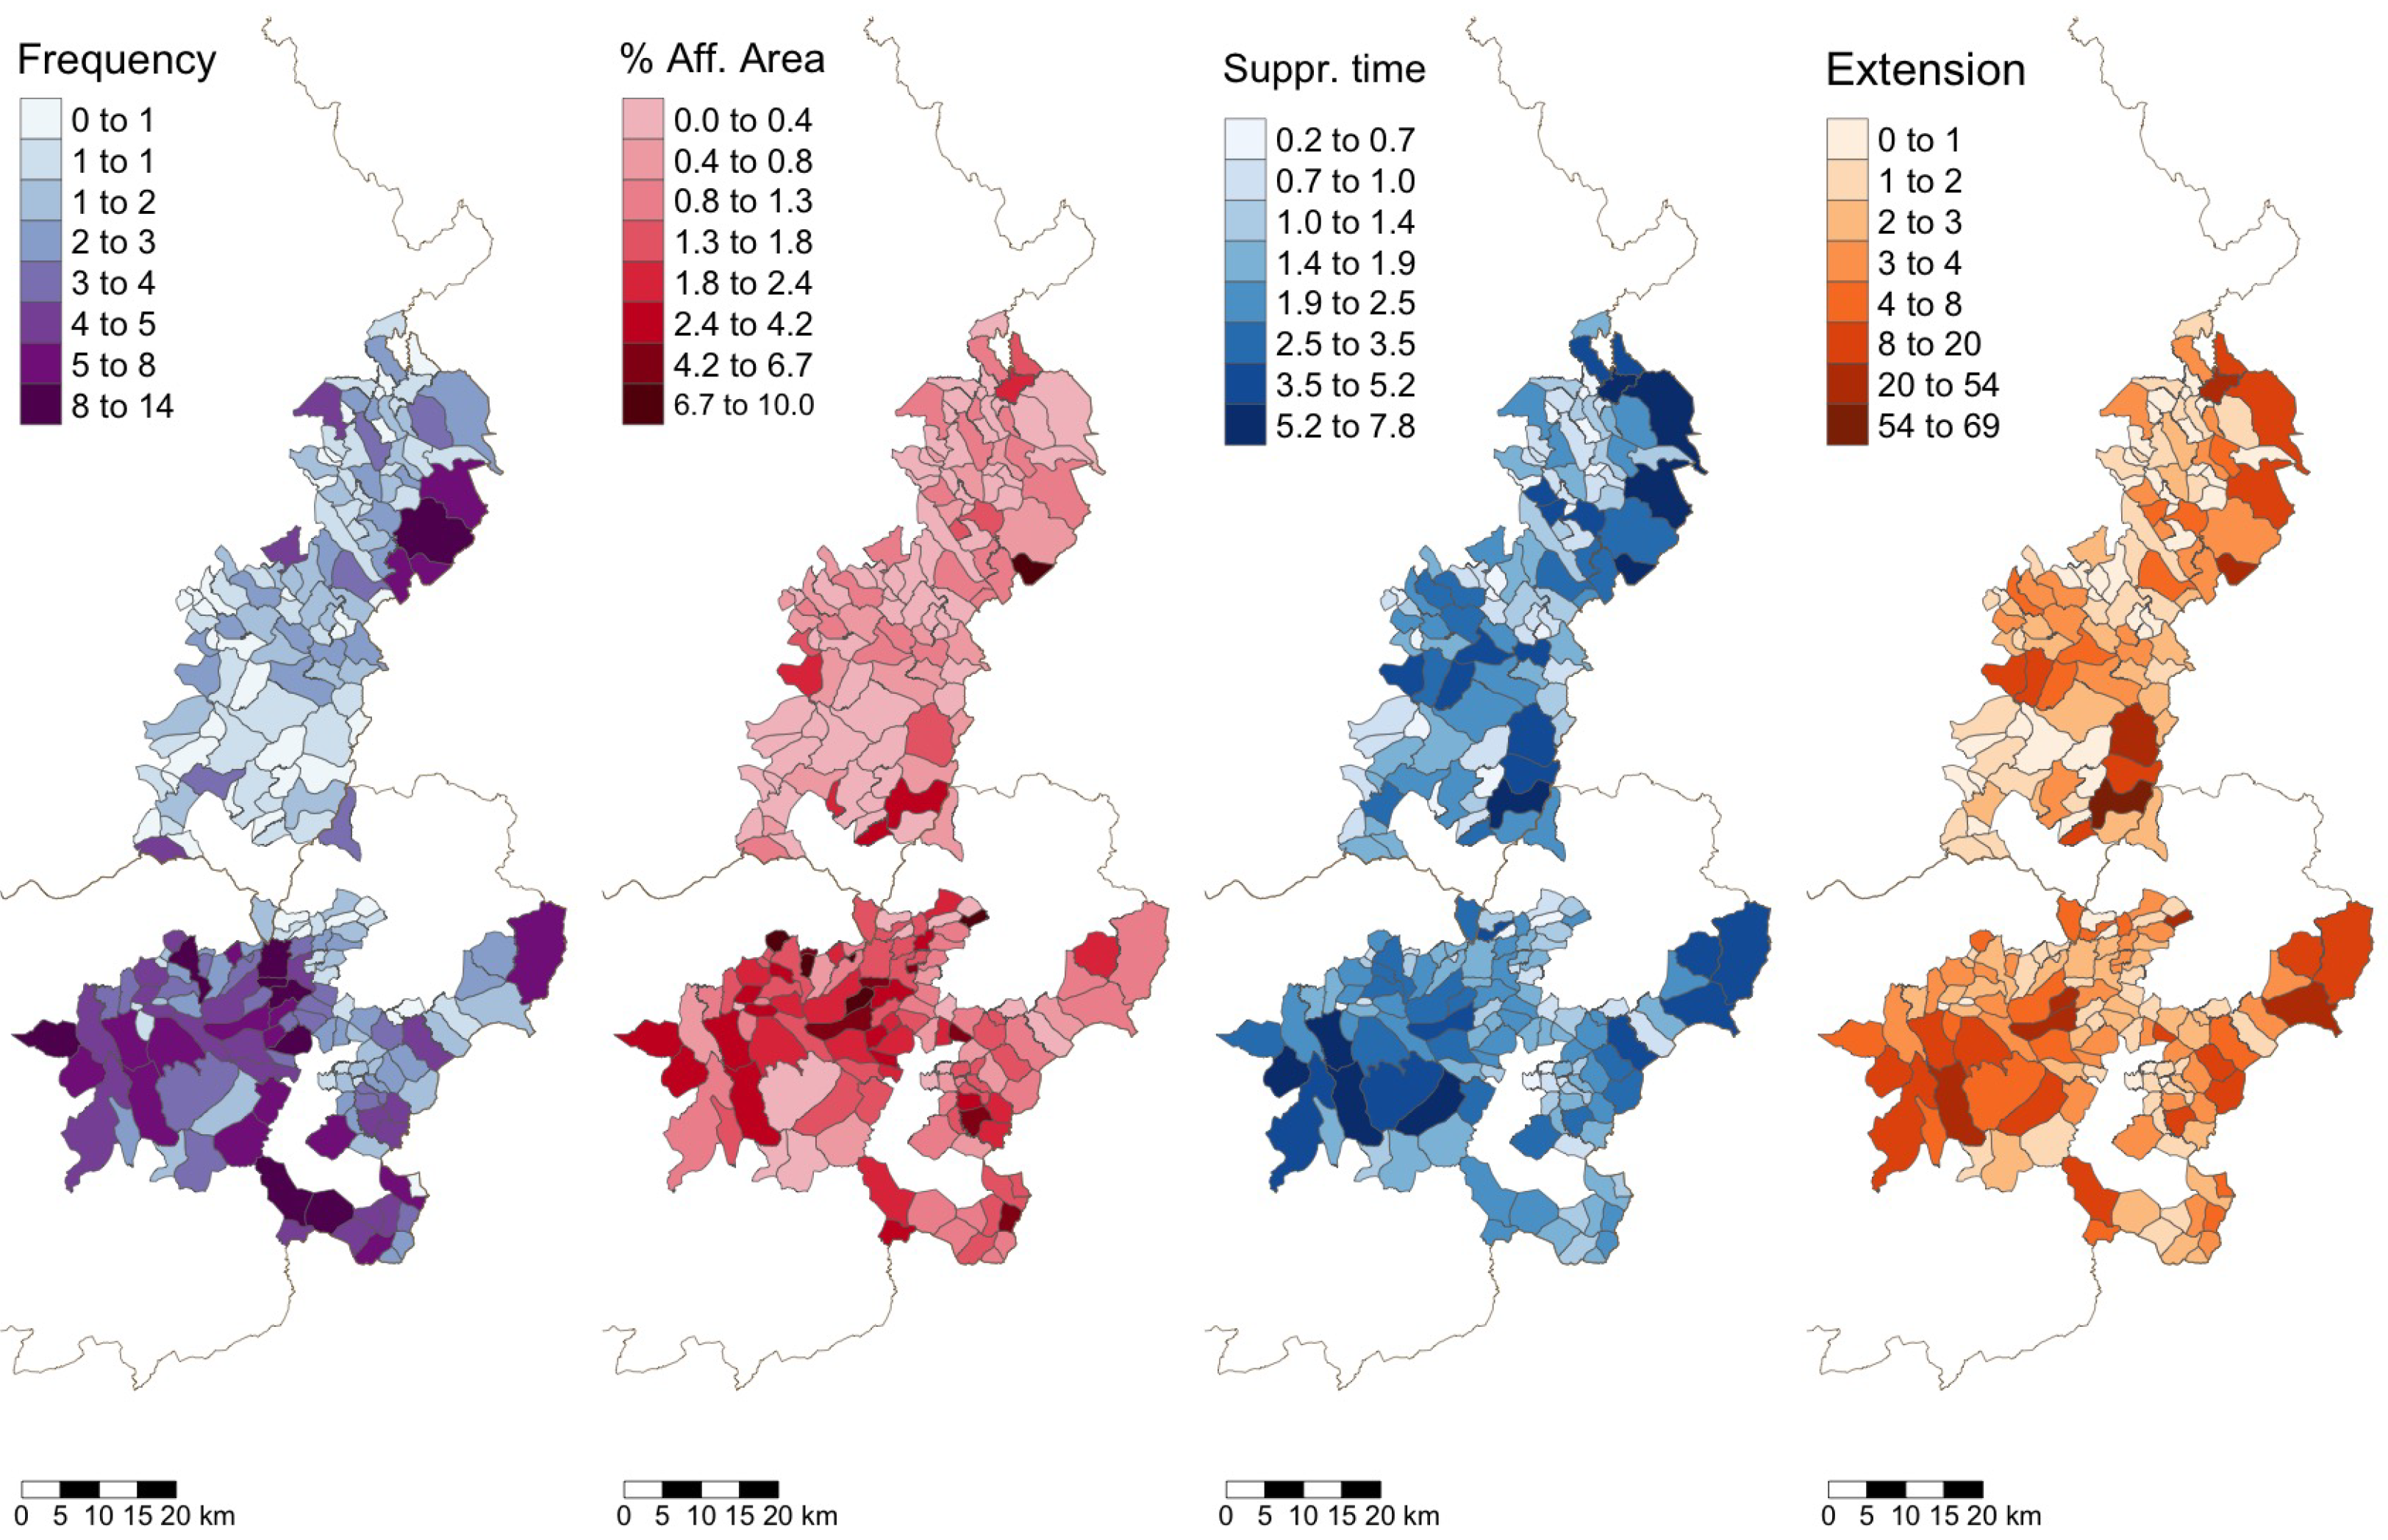
Figure 5 shows the spatial distribution of the dependent wildfire variables as average values over the full study period. Note first that the data present a marked spatial inhomogeneity both across and inside the different mountain areas and second that there are important differences in these irregularities for the different variables under study. In other words, it can be expected that the spatial patterns to be uncovered will be different across the different variables.
Figure 6 describes the spatial distribution of the land cover and other independent variables. These plots also present important spatial pattern differences across the mountain systems and between the individual parishes. For example, the coniferous rate is dominant in the southern part of the Macizo Central, with a second significant contribution in the south of the Ancares-Caurel system. The agricultural lands lie mainly in the central part of Ancares-Caurel and on the north–south line across the Meseta Central, Pena Trevinca, and Pena Maseira. The population density is low throughout the whole region, with the exception of the two smallest parishes in Ancares-Caurel and Meseta Central, which have a higher concentration. Finally, the protected areas lie mostly in the northeastern parts of Ancares-Caurel and Pena Trevinca, while the common lands have a distribution that varies greatly throughout the whole region of study.
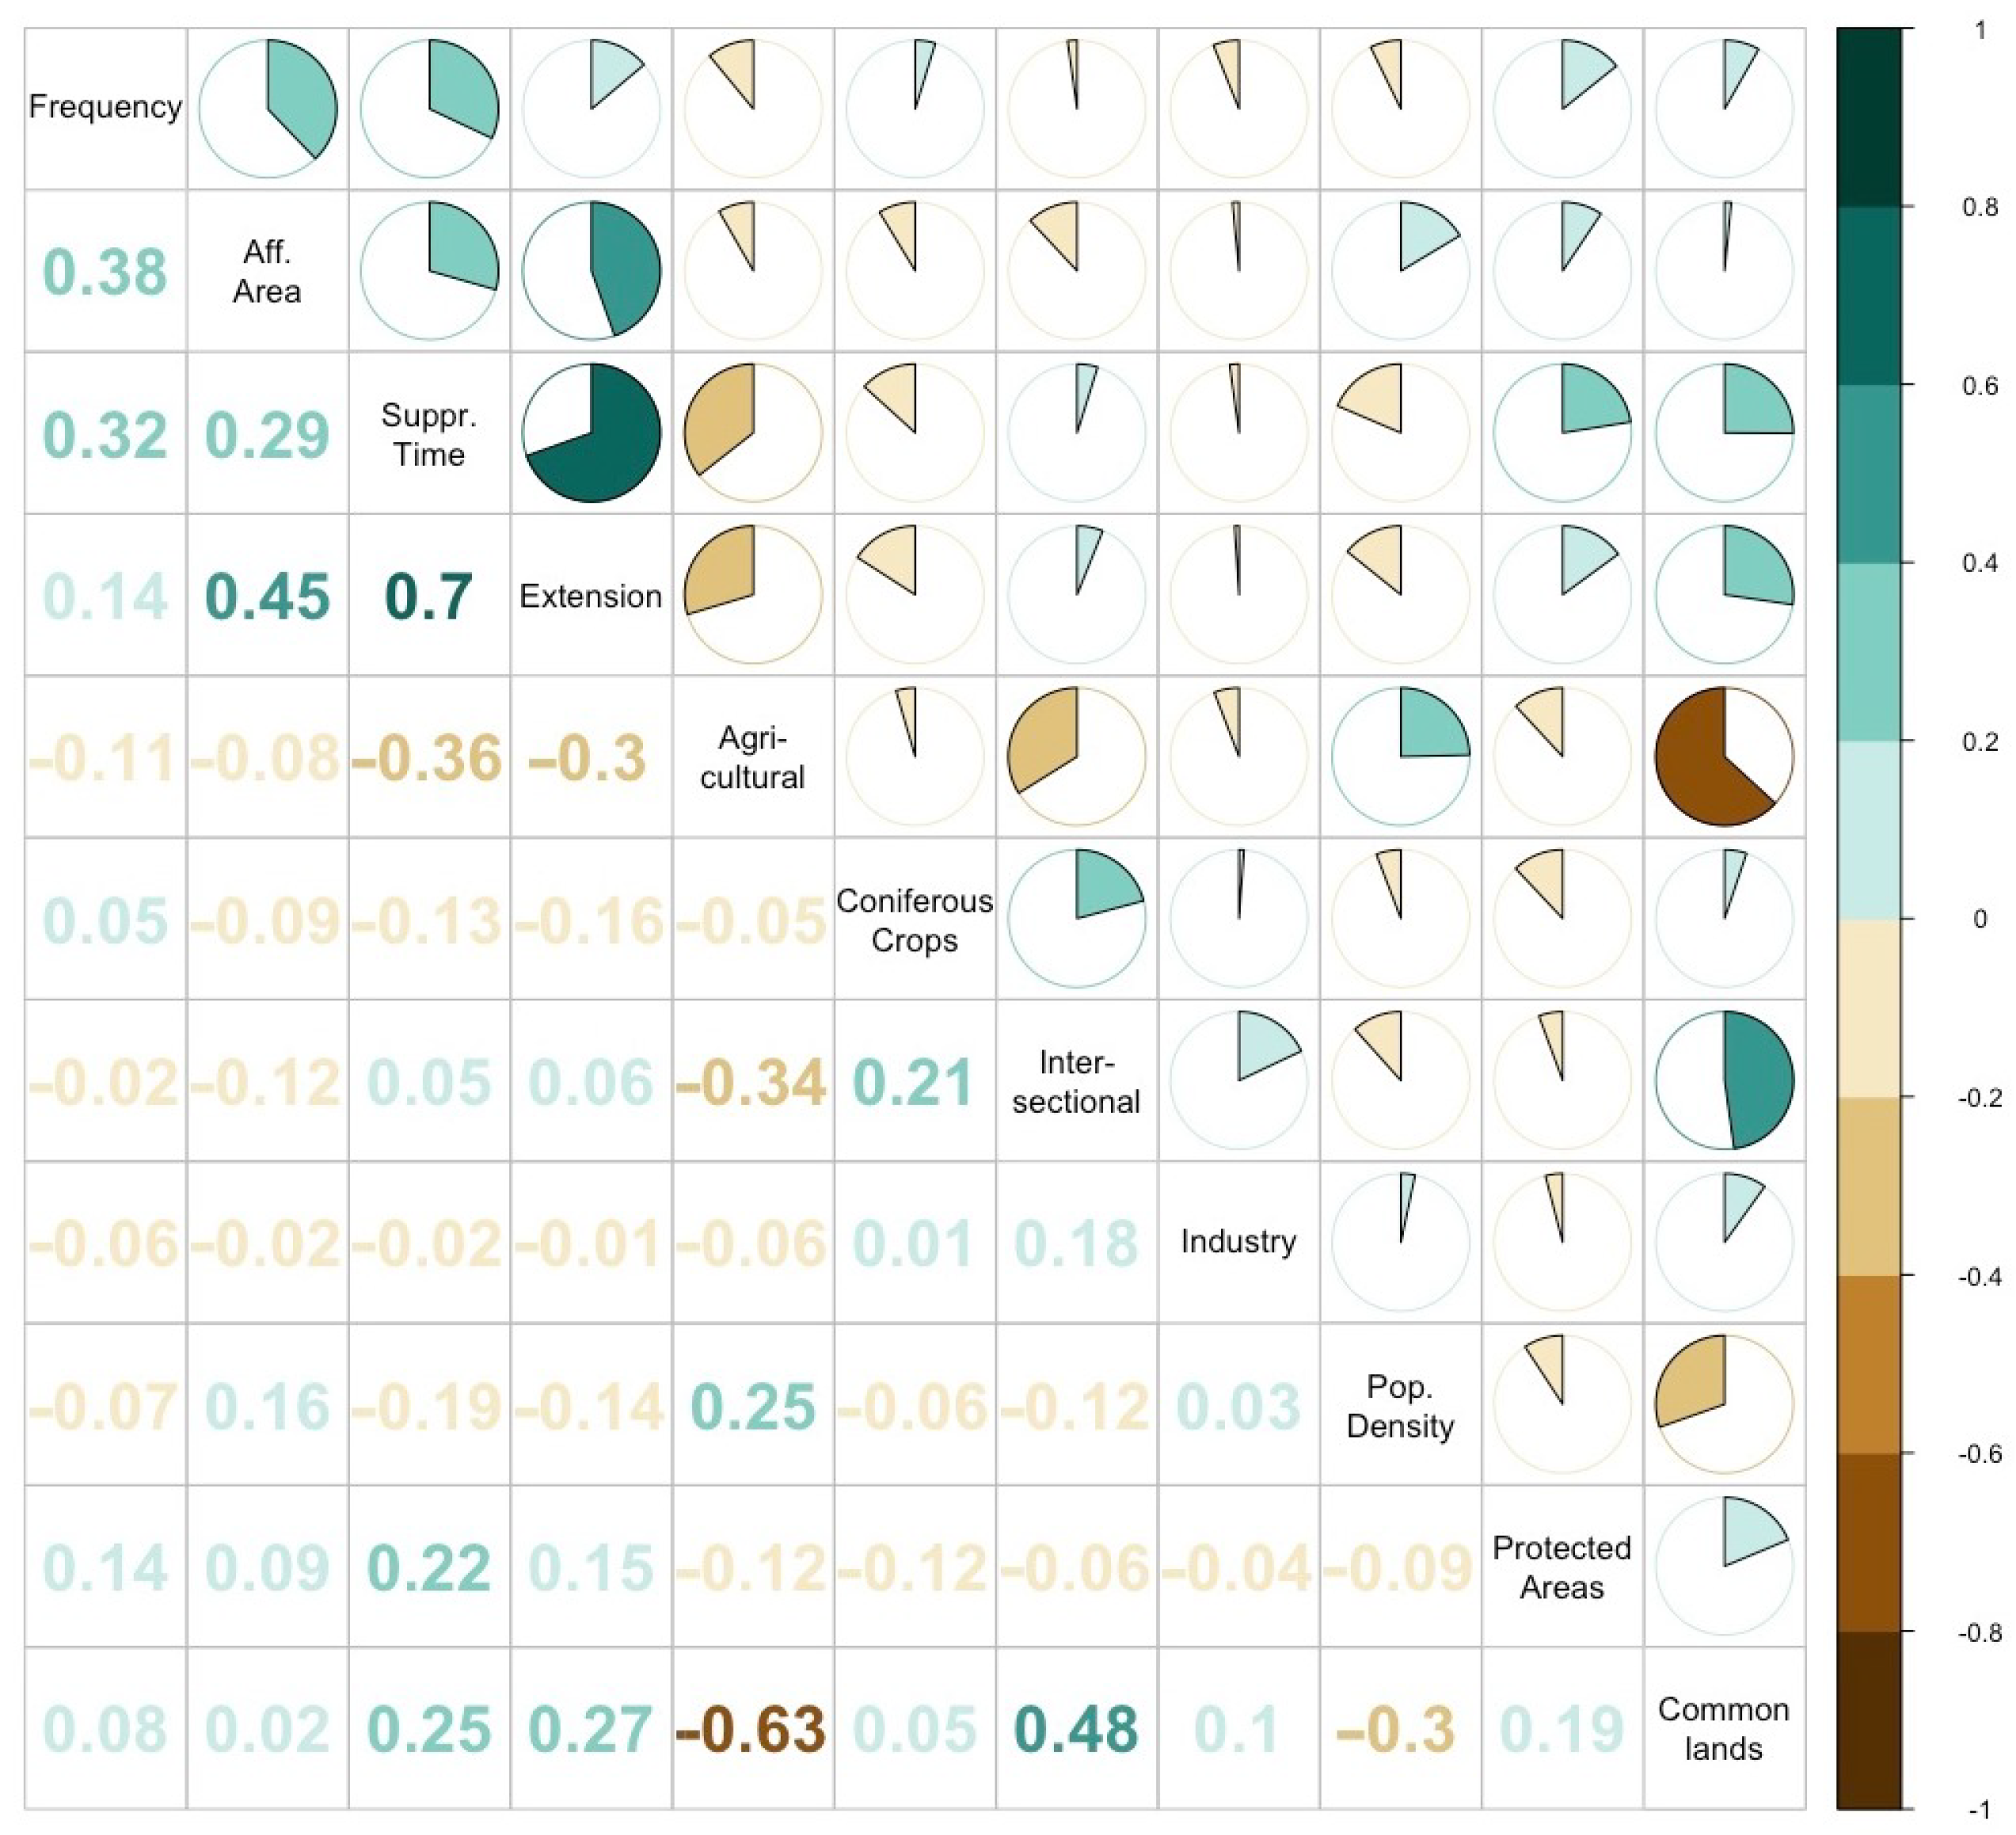
The correlations between all (dependent and independent) variables are shown in
Figure A1 in the Appendix. The results generally present low statistical correlations, except amongst the dependent variables, where extension is significantly correlated with frequency and especially suppression time. We can thus trust that the econometric models will not present problems of redundant information and hence unreliable significance and determination levels.
5. Results and Discussion
The first step of the study was to determine the number of lags to consider in the construction of the weight matrix.
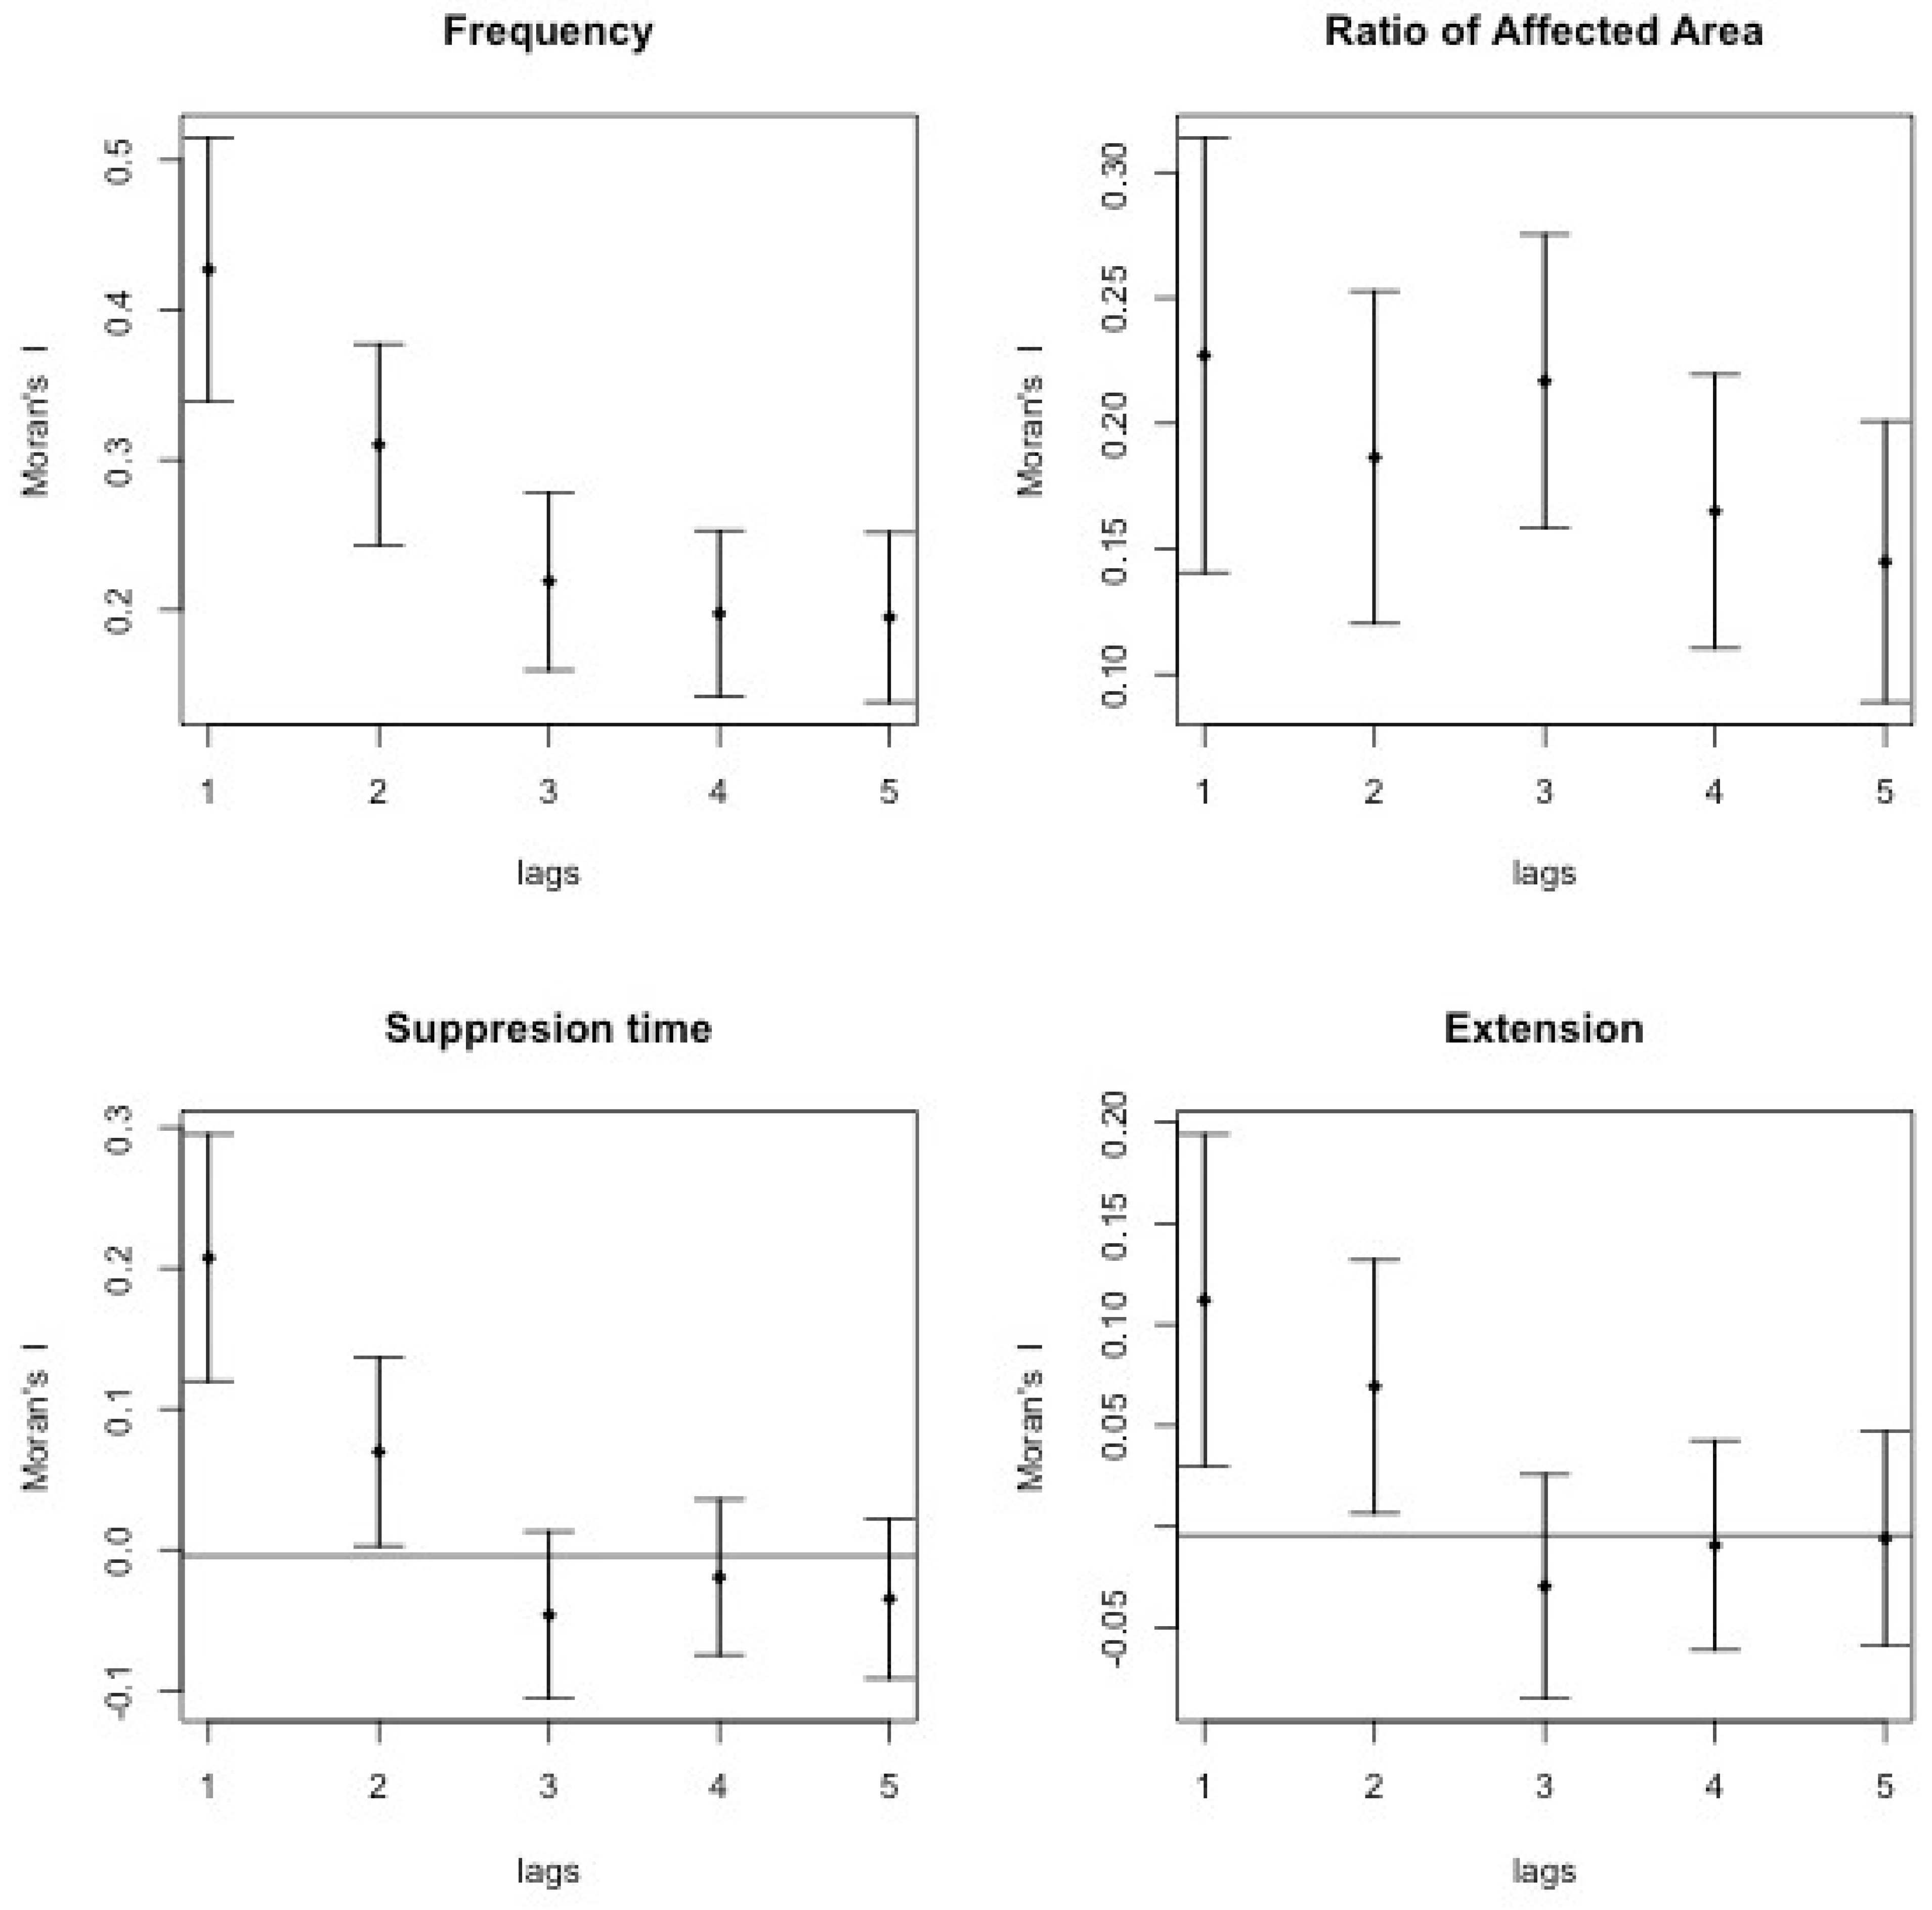
Figure 7 plots the Moran`s
I statistic and the 95% confidence interval for spatial lags from one to five, for all four dependent variables. For the frequency and the ratio of affected area, all results (up to lag 5) are statistically different from zero. For the suppression time and the fire extension, the
I statistic shows a significant spatial influence up to level-2 neighbours. These results clearly demonstrate an important spatial influence, even beyond the nearest neighbours. Nevertheless, the highest value of the
I statistic is obtained, in all four cases, for a single lag, i.e., taking into account only the influence of the nearest neighbour. Moreover, we have also verified that the corresponding
p-values (indicative of how strongly the null hypothesis of spatial randomness can be rejected) is much smaller for the suppression time and extension variables at lag 1 than at lag 2.
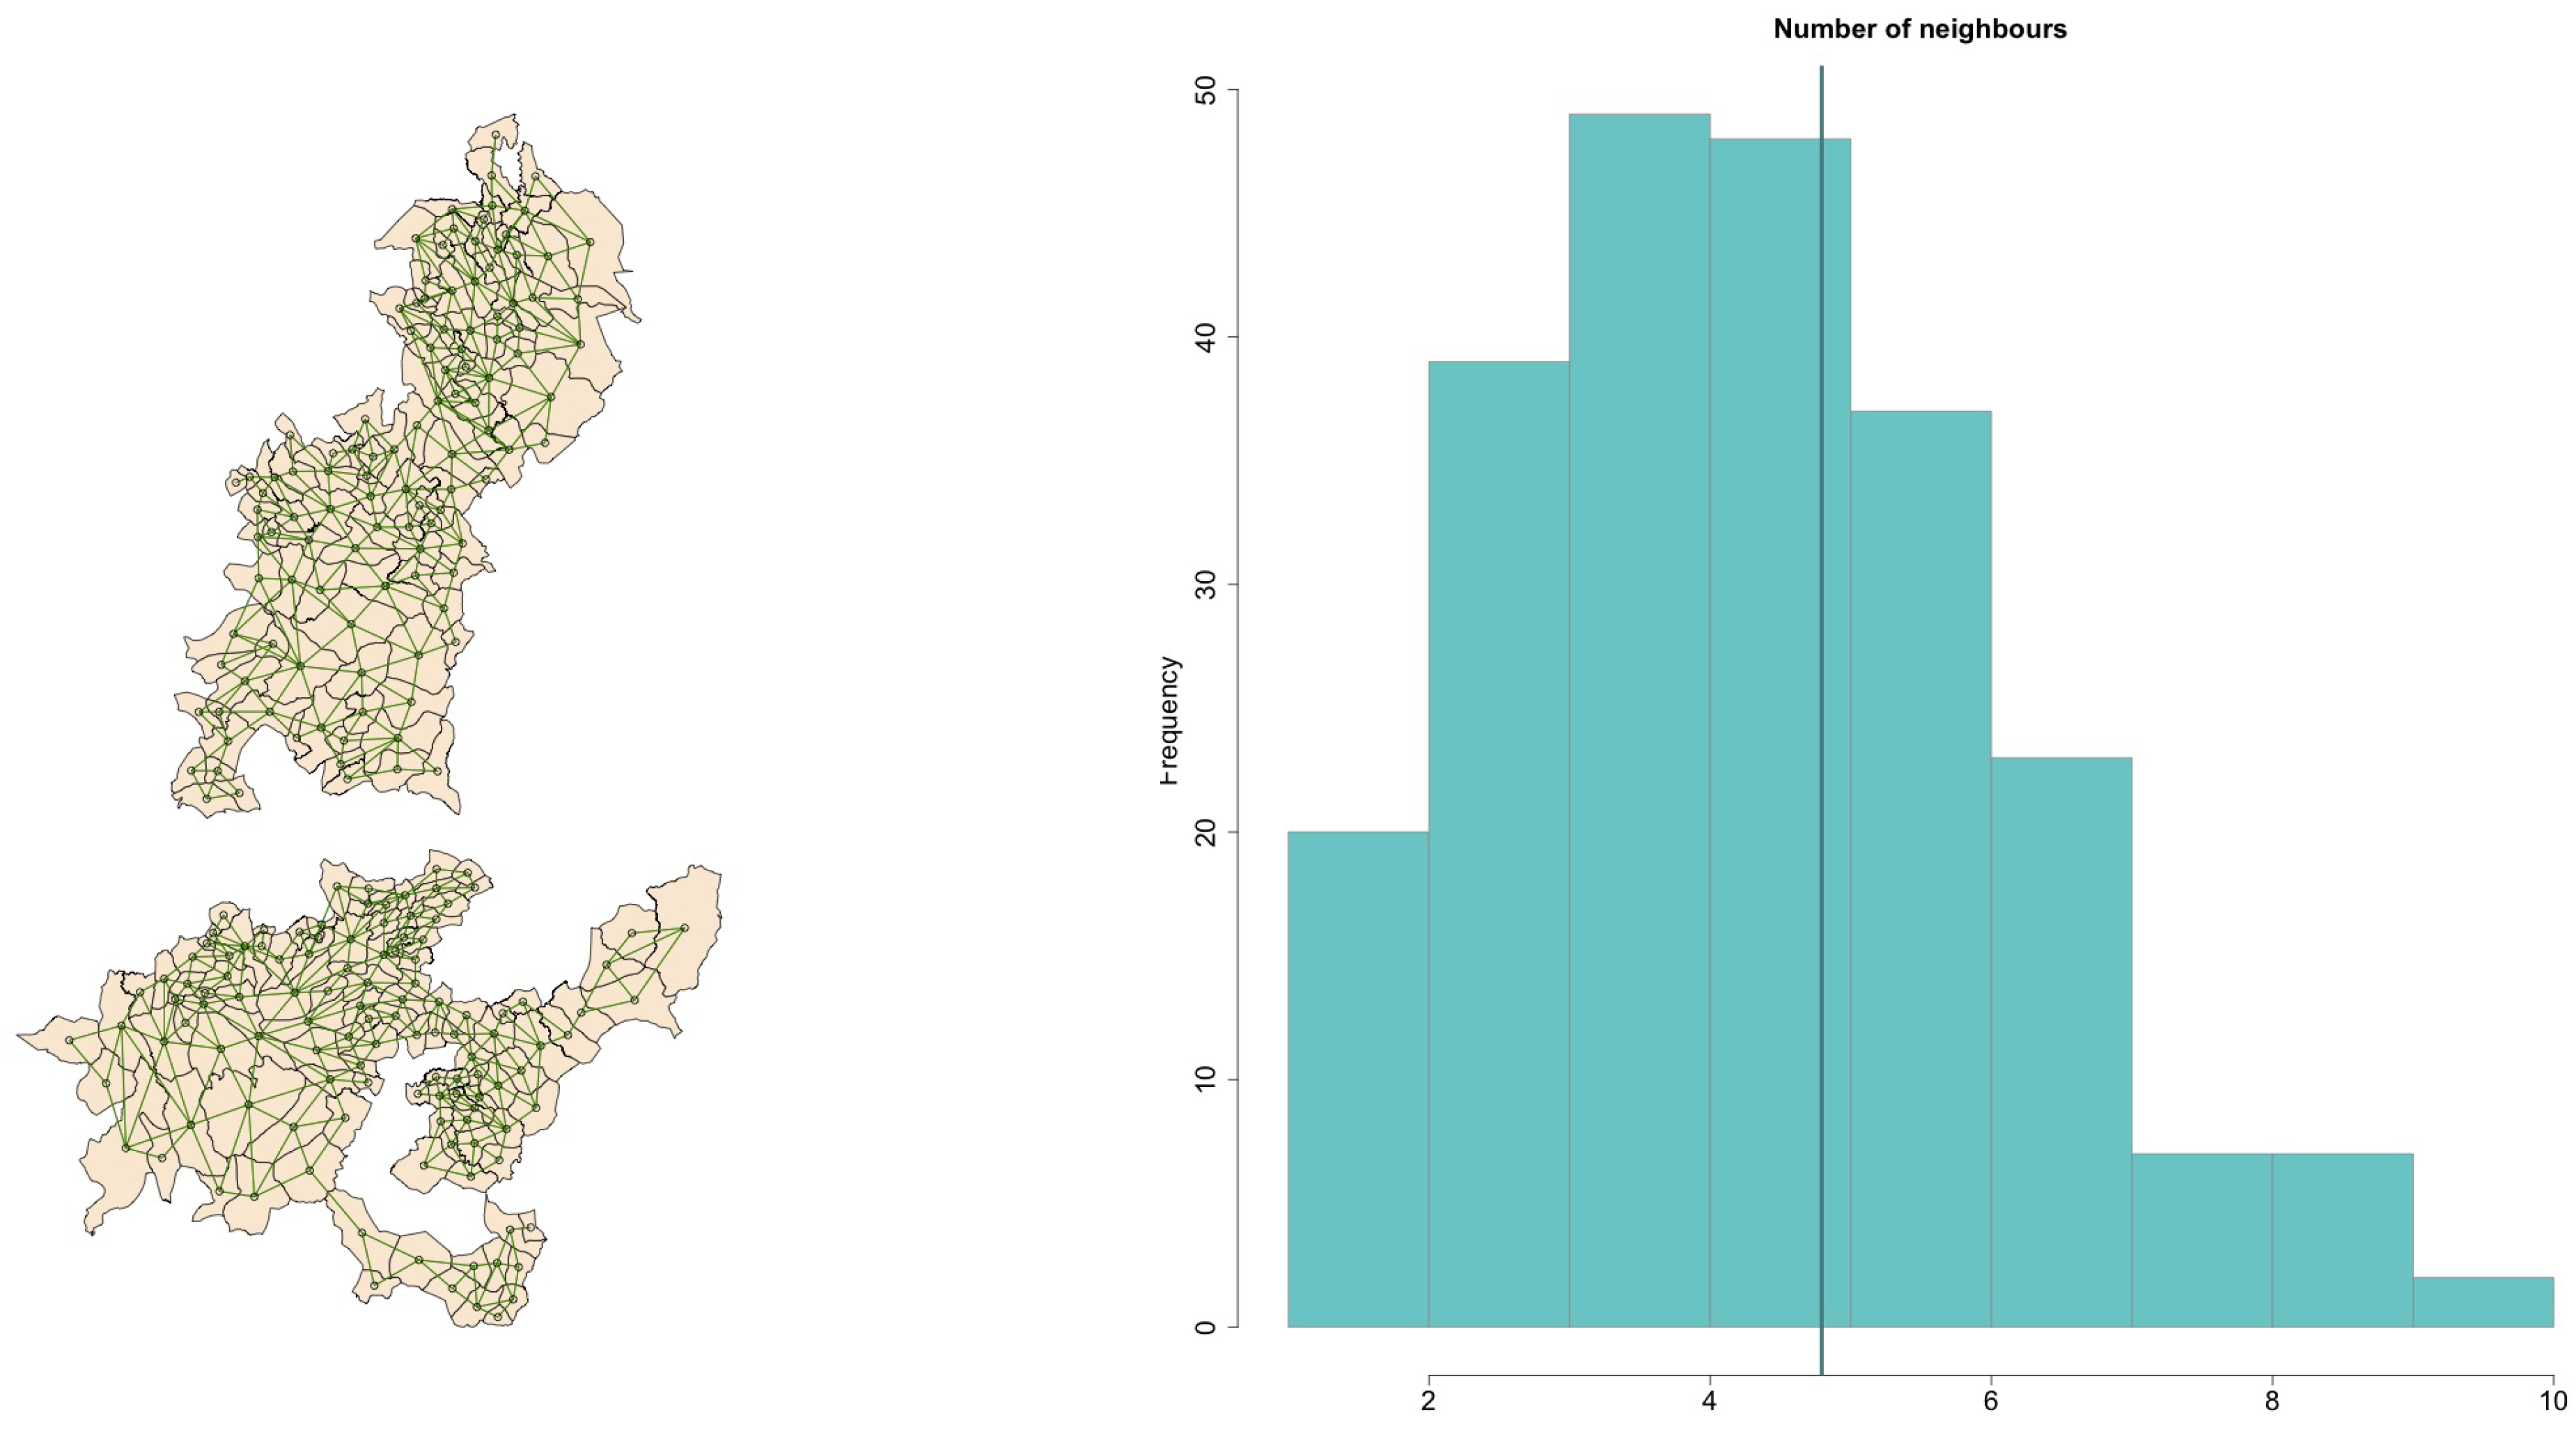
Figure A2 shows the queen contiguity relations for one spatial lag, as well as a histogram for the number of neighbours per parish. Note that the average number of direct (lag 1) parish neighbours is close to five.
Figure 8 shows the scatter plots with the local values (horizontal) and the neighbouring values (vertical) at the optimum spatial lag, namely 1. For all variables, the relation between the local data and spatial lagged values is positive, with a relatively narrow confidence interval for the frequency, affected area, and suppression time variables. There is thus a clear positive correlation between the value of each variable at any location
X and the same variable in the neighbouring locations. Note that even for the extension, where the slope is relatively flat and the confidence interval range quite wide, it still does not fall down to zero (which would be indicative of a possible absence of spatial dependence).
The analysis so far confirms the importance of spatial patterns and thus the relevance of identifying clusters as well as hot/cold spots, and of performing an explanatory econometric model. With respect to the first part, the clusters and hot/cold spots, the local Moran
I and the Getis–Ord
statistics are shown in
Figure 9. The first row plots the local Moran, at a 5% significance level, highlighting many areas with significant high–high or low–low spatial clustering patterns. The Getis–Ord results show several hot spots for all four variables and also a few cold spots in terms of frequency, affected area, and suppression time. The most salient features from both figures are the following. There is an extended region of high fire frequencies which covers a large part of the Macizo Central and Pena Maseira. This is clearly seen in the Moran plot as a high–high region and in the Getis–Ord plot as a hotspot. A smaller and partially overlapping region shows similar features in terms of the other variables. There is also a high–high region and corresponding hotspot for suppression time in the northeastern corner of the Ancares-Caurel region, of which roughly half is also a frequency high–high/hotspot region, with the other half being similar in terms of extension. All of these are obviously regions that demand specific spatial attention in terms of fire prevention and control. On the opposite end of the spectrum, there is a low–low region and corresponding cold spot in terms of frequency in the central–southwestern part of the Ancares-Caurel region, accompanied by small low–low/cold spot patches for the affected area and suppression time. It would be interesting to verify whether this lower occurrence is due (only) to natural factors or whether local land use and policy measures also play a part which could be emulated in other areas.
The above-mentioned statistics and plots prove that there exist important spatial dependencies in the variables that are being studied. The next step was then to attempt a partial explanation, namely to relate the wildfires with land management and spatial modellings. For this purpose, a set of econometric models were developed according to
Figure 2 above. The Lagrange multiplier criterion determines the selected functional form according to the significance of the spatial dependences (
p-value
).
Table 2 provides the test results. Based on these results, it can be concluded that for the wildfire frequency, a SAC model is appropriate because the SARMA as well as the LM error and LM lag null hypotheses are all rejected with high significance. For the suppression time, the results also indicate that a spatial model is appropriate, but, in this case, an SLM model is appropriate because the LM error and LM lag statistics are more significant than is the SARMA, while the LM lag has a higher value than does the LM Error.
With respect to the wildfire extension, the results in
Table 2 show that an OLS model is indicated rather than any spatial econometric model since none of the standard LM statistics significantly rejects the corresponding null hypothesis. Note that this does not imply that the spatial relations are not significant but rather that these spatial relations are already accounted for through the dependence on the independent variables, without the need for an explicit inclusion of the lagged dependent variable or error term. We leave for further research whether this picture would change with the addition of more independent variables or more fine-grained information (for example, about individual terrains) and/or whether other statistical tools could be relevant to analyse the spatial dependencies. Finally, with respect to the affected area, an SEM model is indicated because of the significance of the (normal and robust) error statistic. In the following section, we describe the development of the spatial econometric models for the frequency, suppression time, affected area, and OLS for the fire extension.
Table 3 presents the spatial econometric models. Note that the constant parameter is set to zero; in other words, the overall mean is distributed across the distinct mountain areas through the use of one dummy variable for each region. These dummy variables are significant in almost all cases. In the few cases where it is not (Pena Trevinca for fire extension and the affected area, and Ancares-Caurel for the affected area), it should nevertheless be retained in the model because the other levels are significant.
In regards to the independent variables, the rate of transitional woodland–shrub is the most contradictory because it helps to reduce both the fire extension and suppression time, but it has a significant influence in increasing the frequency of fires. We are not aware of any previous paper studying this variable in similar areas, so we could not compare the obtained result, which would certainly deserve further study. A possible interpretation could be the following. The usual form of cleaning agrarian lands in the area under study is by burning the cleared vegetation. Since these agrarian lands are often right next to transitional land, which moreover presents a high amount of potential fuel, the presence of this transitional land could increase the frequency of fire ignition. However, since it typically lies close to farms and is well accessible, these fires are suppressed more rapidly and affect a smaller extension compared with other types of forest fires.
The ratios of agricultural land, industrial areas, and forestry coniferous cover have various levels of significance but (whenever significant) always a mitigating impact on all dependent variables. Agricultural land, in particular, will reduce the suppression time and fire extension, whereas it has no significant influence on the frequency or the affected area. This contrasts with previous studies on the whole of Galicia. Chas-Amil et al. (2015) [
51] found there to be a positive effect on wildfire number, while Barreal et al. (2011) find the same effect on the recorded number of wildfires but a negative effect for affected areas [
52]. The landscape could explain the result because, as already mentioned earlier, in the Galician mountain systems, agricultural lands are relatively easily accessible to firemen, and in a mountain area this could mark a significant difference in the time required to fight a fire as well as its extension. The coniferous ratio is significant in explaining the wildfire recording and the affected area. This result partially contradicts that reported by Barreal and Loureiro (2015) [
15], who again, studied Galicia as a whole. The reason could be the low ratio of these plantations in part of the studied area, where they are located close to houses and serve more for home firewood than do other species with more extended rotation periods and more specific economic use which are more widespread in other parts of Galicia. The proximity of such coniferous firewood to the dwellings implies an easier management and could thus explain the mitigating impact. The presence of industrial facilities reduces the wildfire frequency, probably because their economic relevance often linked to the primary sector, making these regions better managed.
The population density, protected areas, and the ratio of common lands are relevant to explain some wildfire features, but in contrast to the previously mentioned variables, they have a positive (fire-enhancing) effect. In particular, a higher population density has a strongly significant influence on the affected area, which is in contrast to the mitigating impact found by De Diego et al. 2021 [
12], but in agreement with the positive (increasing) effect found by Barreal and Loureiro (2015) [
15]; however, these authors found this increasing effect for all considered wildfire-dependent variables, not only the affected area. The ratio of protected areas significantly increases fire occurrence, suppression time, and affected area. Thus, it is clear that ecological protection does not translate into better protection against fire hazard in this area. Finally, common lands increase the affected area of wildfires. This is due to an intricate combination of issues, in which conflicts between forest communities as well as between commoners of the same community often play a crucial role [
53].
The interpretation of these results and their comparison with previous results in the literature shows that there are clearly several subtle issues at play in explaining the wildfire patterns in the Galician mountain systems (and in Galicia in general). It would be interesting, for future research, to verify the importance of the elder and scattered character of the population, who manage the areas close to their houses but entrust the managing of the lands further away to their progeny who are mainly motivated by economic factors. More generally, the different management models and their relation to economic interests should be scrutinized in detail.
From an econometric point of view, note that the
and
parameters, where present in the model in question, are indeed significant, thus confirming the consistency of the model selection. Note also that the negative value of
for the frequency has no direct interpretation because it is combined with
in the SAC model [
54]. In fact, when an LM lag model (without error term) is run for the frequency variable, this returns a positive
, thereby confirming the amplifying character of the neighbours’ influence on the wildfire frequency, as seen above in
Figure 8. The highly significant, positive value of
for the wildfire frequency, and to a slightly lesser degree for the affected area, is probably indicative of the obvious fact that other factors beyond the ones included in the present model are also relevant to explain the wildfire behaviour.
In the models with an autoregressive spatial parameter
, i.e.,: for the frequency and suppression time, a correct interpretation of the coefficients implies an impact analysis. For this purpose, the total effect is calculated and split into two terms: the direct effect, and the indirect effect or spillover influence, as shown in
Table 4. For the frequency variable, in all cases, the direct and indirect effects have opposite signs. However, as pointed out above, this is likely due to the interplay between the negative value of
and the positive
, and therefore should not be attached too much importance. The total effects, however, can safely be interpreted and compared. In particular, the strong mitigating value of the presence of industrial land stands out when compared to the other variables, which is indicative of the above-mentioned importance of economic interest and the associated models of management in fire prevention. For the suppression time, agricultural land and transitional woodland–shrub have similar mitigating effects, mainly direct. Curiously, this is also of the same magnitude (but opposite sign) as that of the ratio of protected land. Thus, if the ratio of agricultural land is increased by 1%, for example, then the average time to extinguish the fire decreases directly by 0.02 h, which is further augmented by the indirect effect which increases the reduction to reach a global effect of 0.024 h/fire. The opposite happens with the protected areas, which have a magnifying effect, both directly and indirectly, leading to a total increment of 0.02 h/fire for a 1% increase in protected areas.
A comparison of the fitted values based on the previously mentioned results with the original data is shown in
Figure 10. The upper figures show the fitted results; the bottom ones the residuals. Note that the higher concentration of frequency in the south is well captured by the model. The peak in the upper-northeast corner is correctly predicted, but its actual value is underestimated by the model, thus leading to a substantial residual. The same occurs with the frequency peak in the bottom-left corner (western part of the Macizo Central), which is also correctly identified but underestimated by the model, again leading to a substantial residual. Likewise, in terms of suppression time, the peaks in the south part of the Galician mountain system are well approximated. The more isolated regions of high concentrations in the northern part are correctly located by the model, but there are a few isolated parishes where the actual value is underestimated, thus showing high residuals. Finally, for the affected area, the prediction is in general very good, except for a few individual parishes. The presence of residual outliers (for each of the variables) is again indicative that there are additional variables beyond the ones considered here that influence the spatial wildfire patterns.
6. Summary and Conclusions
A detailed analysis of the wildfire patterns and the factors that influence them is crucial to understanding and anticipating their occurrence and impact. Several statistical and econometric studies on the spatial wildfire patterns in Galicia exist and demonstrate good awareness of the heterogeneity in these patterns. However, most of these studies do not explicitly consider the interactions between neighbouring entities. Moreover, no existing study that the authors are aware of focuses specifically on the Galician mountain system. The present study thus highlights the importance of these spatial interactions and autocorrelations in the Galician mountains, an area with significant cultural heritage and important ecosystem service provisions.
It was found that the neighbouring interactions are positive (effect-enhancing) for all wildfire variables under study, with a maximum spatial autocorrelation at a lag of one (direct neighbour). However, it should be stressed that the wildfire suppression time and extension are significantly influenced by neighbours up to two lags away, and even up to five lags for the frequency and affected area. This has important implications for designing public actions against wildfires because if the policymaker implements a regulation in a specific entity, this has consequences in the surrounding areas, conditioning the neighbouring wildfire risk and potential impact. At present, however, there are no specific plans in fire management to address the high mountain areas in Galicia; rather, districts are generated that do not take this crucial issue into consideration.
These autocorrelation measures were then used to construct a lag-1 contiguity matrix and look for specific local concentration patterns. Several regions of high-intensity concentration (high–high local Moran I clusters as well as Getis–Ord hotspots) were identified, particularly in the Macizo Central and the northeastern part of the Ancares-Laurel for several variables, as well as for individual variables in part of the Pena Maseira (frequency) and northeastern Pena Trevinca (suppression time and extension). These are obviously regions that require specific attention from policymakers. Conversely, a few low–low clusters and colds pots were identified, mainly in the south-central part of Ancares-Laurel. It would thus be very interesting to verify whether these concentrations appear exclusively due to natural factors or whether they are also influenced by local regulations and practices, and in particular, whether some of the local regulations and practices that exist in the low–low/cold spot areas could be successfully transposed to the regions with higher intensity.
In order to allow policymakers to effectively act, both through prevention and actual firefighting, it is critical to determine the factors that contribute to the different wildfire characteristics and to identify those that can be acted upon. The previous statistical models were therefore complemented by an econometric model. Several variables related to land use (agriculture and industrial) and land cover (conifers; woodland–shrub transitional) were considered and complemented by population density, ecological protection, and common lands. With these external variables, an econometric model with spatial autoregressions was constructed for the frequency, suppression time, and affected area, whereas for the fire extension, an OLS was preferred. Amongst the results obtained, we highlight the mixed effect of transitional woodland–shrub cover (mitigating suppression time and extension, but enhancing frequency). Mitigating factors are coniferous cover (for the frequency and affected area), agricultural land (for suppression time and extension), and industrial areas (strong mitigating effect on frequency). Fire-enhancing factors are the population density (for the affected area), ecologically protected areas (for the frequency and suppression time), and to a lesser extent, common lands (for the affected area). Some of these results are in contrast with previous results in the literature for Galicia as a whole, thus demonstrating the idiosyncrasy of the mountainous part of Galicia in terms of wildfire patterns.
The results are in the first place descriptive, but nevertheless provide some clues for policy recommendations. For example, economic relevance (through agriculture or industry) has a preventive effect against wildfires and should thus be stimulated. Furthermore, increasing the coniferous stand seems to be indicated. Conversely, ecological protection does not contribute to wildfire prevention and has the opposite effect. The present results should be complemented by a careful analysis of the local policies and practices, including qualitative aspects. However, an obvious point that must be stressed based on the present results is the importance of coordinating local policies in order to take into account the influence and importance of spatial contiguity in the risk and impact of wildfires. Indeed, effective and ineffective measures will have positive or negative implications, respectively, not only locally but also for the neighbouring entities, which can propagate surprisingly far.
With regard to future research, the models developed here are all static. Evidently, not all the years have the same wildfire numbers or impact. Taking the temporal evolution into consideration could therefore improve future results. The databases that were used typically do not present full data for every year. However, spline interpolation could be used to approximate the values for the unknown years. Finally, it is obvious that other socioeconomic, environmental, or climatic variables are also relevant for the wildfire patterns in the Galician mountains. Several findings in the present research point to this. For instance, the fact that an autoregressive spatial error component is present in the model for the frequency as well as the affected area can be interpreted as indication of the incompleteness of the model. We therefore recommend extending the model with additional socioeconomic characteristics, environmental features, or climate information. Within the first category, the importance of different land management models and their connection to economic interests seem crucial. Environmental features could include wind patterns, soil moisture, terrain slope, existence of paths, and more detailed characteristics of the vegetation. Finally, climate information could cover not only the peculiarities of the Galician climate as such but also the local effects of global climate change.


