Article

Short-Term Effects of Experimental Fire on Physicochemical and Microbial Properties of a Mediterranean Cambisol

1
Faculty of Science, University of Zagreb, 10000 Zagreb, Croatia
2
Faculty of Agriculture, University of Zagreb, 10000 Zagreb, Croatia
3
Faculty of Mining, Geology and Petroleum Engineering, University of Zagreb, 10000 Zagreb, Croatia
4
Environmental Management Laboratory, Mykolas Romeris University, 08303 Vilnius, Lithuania
*
Author to whom correspondence should be addressed.
Fire 2023, 6(4), 155; https://doi.org/10.3390/fire6040155
Submission received: 18 March 2023 / Revised: 5 April 2023 / Accepted: 12 April 2023 / Published: 13 April 2023
(This article belongs to the Special Issue Mediterranean Fires)

Abstract

:
Little is known about the bonfire impact on microbial properties in soil. This work aimed to study moderate- to high-severity experimental burning (250 °C) compared to unburned Cambisol in a natural Mediterranean environment (Croatia) on selected soil properties. The soil was sampled immediately and 1, 2, 4, and 6 months after the fire. The fire increased the mean weight diameter, water stable aggregates, and water repellence in different soil fractions, and the observed effect was the strongest immediately after the fire. It also altered soil pH, electrical conductivity, total nitrogen carbon, and sulphur content, and completely destroyed carbapenem-resistant bacteria, but did not significantly affect the soil’s mineralogical properties. Six months after the fire, most microbial properties (save for pH) returned to near control values. Heterotrophic, sporogenic, and phosphate-solubilising bacteria started to recover after a month, whereas the population of carbapenem-resistant bacteria was destroyed initially, but recovered by the fourth month after the fire. Dehydrogenase activity was not significantly affected, but proper recovery started four months after the fire. Even though Cambisol showed some resilience to fire and its properties mostly returned to normal by the sixth month, and a full recovery is expected to occur later, as vegetation returns.

1. Introduction

In fire-prone environments like the Mediterranean, the abandonment of agricultural lands and depopulation of rural areas has resulted in a dramatic increase in the number, size, and frequency of wildfires. Global warming and heat waves make this issue even more serious [1] as the recurrence of wildfires is expected to increase in the future [2]. The severity of wildfires determines an ecosystem’s post-fire resilience or ability to return to a pre-fire state in the face of new fires, making this factor one of the essential components of a fire’s aftermath [3].
Due to the increase in fire recurrence and intensifying effects, there is a need to study soil functions [4]. After one single fire, the soil is usually acknowledged to recover more quickly than after recurrent fires [5]. The final influence of fire will affect ecosystems depending on several factors such as fire severity and intensity, climate conditions, and topography or landscape heterogeneity [6]. The functional consequences of these changes are evident in the ability of an ecosystem to recover after these disturbances [7]. Recurrent fires, through erosion and repeated burnings, may progressively impoverish the soil, especially in terms of organic matter and nutrients, to such a point that soil microbial properties may be durably altered [8,9]. Despite the abundant research on vegetation dynamics following fires and on immediate post-fire changes in the chemical and microbiological properties of soils, little is known about the impact of recurrent fires on soil microbiological recovery, and the driving factors remain uncertain [10].
Soil enzymatic activities act as potentially sensitive indicators of soil quality and have been used in studies of wildfires [11]. Bacteria control organic matter content, net fluxes, soil carbon, nutrients, mineralisation, and immobilisation processes [12]. Furthermore, among other soil properties, microorganisms are recognized as the first indicators of changes in soil quality. Wildfires are known to have strong effects on the diversity and functioning of soil microbial communities. These effects can occur in the short term (e.g., by killing all microbial species sensitive to elevated temperatures) or long term (e.g., by greatly altering the soil’s chemical properties, which consequently alter the soil microbial community structure) [13]. At the ecosystem level, highly severe wildfires represent the disturbance process, which can lead to complete ecosystem degradation, after which the ecological succession is re-established. As with plant species during vegetation succession, some bacterial and fungal species are the pioneers in ecosystem succession, i.e., they favour early successional post-fire habitats. In addition, the vegetation type in which the wildfire occurs can later differentially alter the soil microbial communities [14]. To date, changes in microbial diversity following wildfires are well studied. However, the changes in microbial functional composition following wildfires are becoming of utmost importance, as they can be directly linked to the ecosystem processes and functioning [13]. A better understanding of mechanisms underlying the recovery of soil properties after a fire can have direct implications for selection of land management options [10].
This work aimed to study moderate- to high-severity experimental burning compared to unburned soil on selected soil properties (mineralogical, physical, chemical, and microbial). Experimental burning enables better research than other experiments conducted after wildfires, since pre-fire soil conditions can be determined and fire characteristics are adequately assessed.
The experimental fire is a helpful tool to study areas with great changes after recurrent fires. The experiment was based on the hypothesis that fire has a detrimental influence on physiochemical soil properties and soil microorganism composition in the short term but that the affected soil should show signs of recovery after six months.

2. Materials and Methods

2.1. Study Area

The study was conducted in the Dalmatia region in Croatia (43°45′06.5″ N; 15°56′01.9″ E; 100 m a.s.l.; Figure 1) on a pasture abandoned for 60 years. Historically, this type of land was an economic resource for the area, but now only vines, figs, and olives are cultivated on a smaller scale. The climate is Mediterranean (Csa) with warm temperatures and dry, hot summers [15]. The vegetation of the broader study area is composed mainly of Pinus halepensins Mill., Pistacia lentiscus L., Juniperus oxycedrus L., and maquis. The meadow flora consist mostly of Globularia cordifolia L., Teucrium montanum L., and Anthyllis montana L. ssp. jacquinii. There are also arable olive groves (Olea europea L.) and figs (Ficus carica L.) in the surrounding area. The soil is sandy clay loam (6.2%, 58.6%, and 35.2% sand, silt, and clay content, respectively) classified as Cambisol [16], developed on limestone. The wider area has a history of recurrent wildfires, and the last one before the experiment occurred on 28 July 2019, affecting an area of 900 ha, including our meadow. Its severity was moderate to high.

2.2. Experimental Design and Field Sampling

The experiment took place on 15 May 2021 at noon on a sunny day with an air temperature of 20.4 °C and humidity of 50%, three days after the last rainfall. Soil humidity before we started the fire ranged from 16.23 to 19.80% over four measurements.
To start the experimental fire (F), we used five bundles (5 kg each) of firewood (a mixture of beech and hornbeam) and branches of pine (Pinus halepensins Mill.) and juniper (Juniperus oxycedrus L.) for kindling (Figure 2a) (<5 cm in diameter) collected at the site. The branches and firewood were arranged evenly to ensure even burning on the soil surface (~1 m2) (Figure 2b). Fire severity was classified by ash colouration as moderate to high according to the Munsell colour chart. The soil temperature was measured during burning with a thermocouple sensor of type K was ~250 °C. The fire lasted about 90 min.
For baseline and control we used randomly sampled surrounding soil within five meters from the fire (control C). Both treatments presented similar environmental characteristics in terms of their parent material, topography, and vegetation. Inside each treatment (C and F) we collected six topsoil samples (0–3 cm). Soil sampling in burned and C was conducted for six months: immediately after the fire (IAF) (Figure 2b), and 1 (Figure 2c), 2, 4, and 6 (Figure 2d) months after the fire (MAF). In total, 60 soil samples were collected (6 replicates × 2 treatments × 5 sampling periods). After the fire, no agricultural or forestry management measures were implemented.

2.3. Analyses of Physical Parameters

After each sampling, the soil was stored in a plastic bag and transported to the laboratory, where it was air-dried at room temperature (±22 °C; 20–24 °C) for 48 h. Soil water repellency was measured in a composite sample and individual fractions (<0.25, 0.25–0.5, 0.5–1, and 1–2 mm in diameter) using the water drop penetration time (WDPT) method described by Doerr et al. [17]. Soil aggregate fractions (<0.25, 0.25–0.5, 0.5–1, 1–2, 2–4, 4–5, and 5–8 mm) were determined by dry sieving for 30 s, calculated after weighting, and expressed as mean weight diameter (MWD). Water-stable aggregates (WSA) were determined using Eijkelkamp’s wet sieving apparatus which is similar to method of Kemper and Rosenau [18]. The 4 g of aggregates (1–2 mm fraction) was soaked in distilled water for 3 min and then dispersed in solution with 2 g L−1 of sodium hexametaphosphate. The percentage of WSA was obtained using the equation:
WSA = W d s W d s + W d w ,  
where WSA is the percentage of stable water aggregates, Wds is the weight of the aggregates dispersed in the dispersing solution (g), and Wdw is the weight of the aggregates dispersed in distilled water (g).

2.4. Analyses of Chemical Parameters

For the chemical analyses, we air-dried the soil samples and sieved them through a 2 mm diameter sieve. Soil pH was measured in a 1:2.5 (w/v) soil-to-solution (KCl suspension) ratio with a Beckman pH Φ72 m (Beckman Coulter, Brea, California, USA). Electrical conductivity was measured in a suspension of soil in water (1:5 ratio) at 25 °C. The organic matter content was measured using the digestion method described by Walkley and Black [19]. Total sulphur, nitrogen, and carbon contents (%) were determined with a Vario MACRO CHNS analyser (Elementar, Langenselbold, Germany) using a dry combustion method.

2.5. Mineralogical Analyses

Bulk samples of soil (control and burnt, <2 mm fractions) were analysed for structure with a PANalytical Empyrean X-ray diffractometer with an automatic divergent slit and Cu LFF tube at 45 kV and 40 mA. The diffractometer had a range of 3–70° 2θ and step size of 0.013°. The obtained images were analysed using the X’Pert HighScore software package.
Oxalate and dithionite soluble iron and manganese were determined as described by Mehra and Jackson [20] and Schwertmann [21] using an Analyst 700 atomic absorption spectrometer. The aim was to determine whether fire changed the mineral composition and whether the proportion of dithionite soluble iron increased, as this would indicate that poorly crystallised iron oxides, e.g., ferrihydrite, had been converted to well-crystallised iron oxides (e.g., goethite, hematite, or maghemite) as reported for forest fires [22].

2.6. Bacteriological Analyses

The soil was sampled in aseptic conditions and transported to the laboratory within 12 h. All analyses were done in quadruplicate and the values are shown as mean ± standard deviation. One gram of soil was suspended in 9 mL of nutrient broth (Biolife, Milan, Italy) and vortexed at 45 Hz for 3 min. The suspension was further decimally diluted in sterile physiological solution (10−1–10−7). From each dilution, 0.1 mL was inoculated onto plates for determination of the different physiological groups of bacteria.
From the first dilution set we first determined total heterotrophic bacteria (THB) count on Tryptic soy agar (Biolife, Italy) after aerobic incubation at 22 °C for 72 h. Then, we pasteurised the dilution set at 80 °C for 15 min and repeated the above procedure to determine the count of aerobic sporogenic bacteria (SB).
In another dilution set, we incubated the samples at 28 °C for 4 days to determine the count of phosphate-solubilising bacteria (PSB) on Pikovskaya’s agar (Himedia, Mumbai, India). Bacterial colonies surrounded by a clear zone were considered phosphate-solubilising. Carbapenem-resistant bacteria (CRB) were determined on a substrate of CHROMagar Acinetobacter supplemented with CR102 intended for the cultivation of clinically relevant carbapenem-resistant bacteria after incubation at 37 °C for 72 h (Figure 3). The bacterial counts are expressed as colony forming units per one gram of soil (CFU/g).
Dehydrogenase activity was determined using the method described by Casida et al. [23]. The results are expressed as the mean value and standard deviation of quadruplicate measurements.

2.7. Statistical Analyses

As the Shapiro–Wilk and Levene’s tests showed no normality and homogeneity of variances, respectively, for any data set, we performed a non-parametric Friedman analysis of variance (ANOVA) to compare samples for all variables over time.
The differences in properties between samples were tested with non-parametric Kruskal–Wallis ANOVA. If significant differences were observed at p < 0.05, we proceeded with a post hoc Tukey HSD for organic matter content and multiple comparison rank sum tests for other variables.
To identify the relationships between all soil properties for each sampling date, we performed principal component analysis (PCA) based on the correlation matrix using logarithmically transformed data as those were the closest to a normal distribution.
All analyses were performed using Statistica 12.0 for Windows and CANOCO 5 software.

3. Results

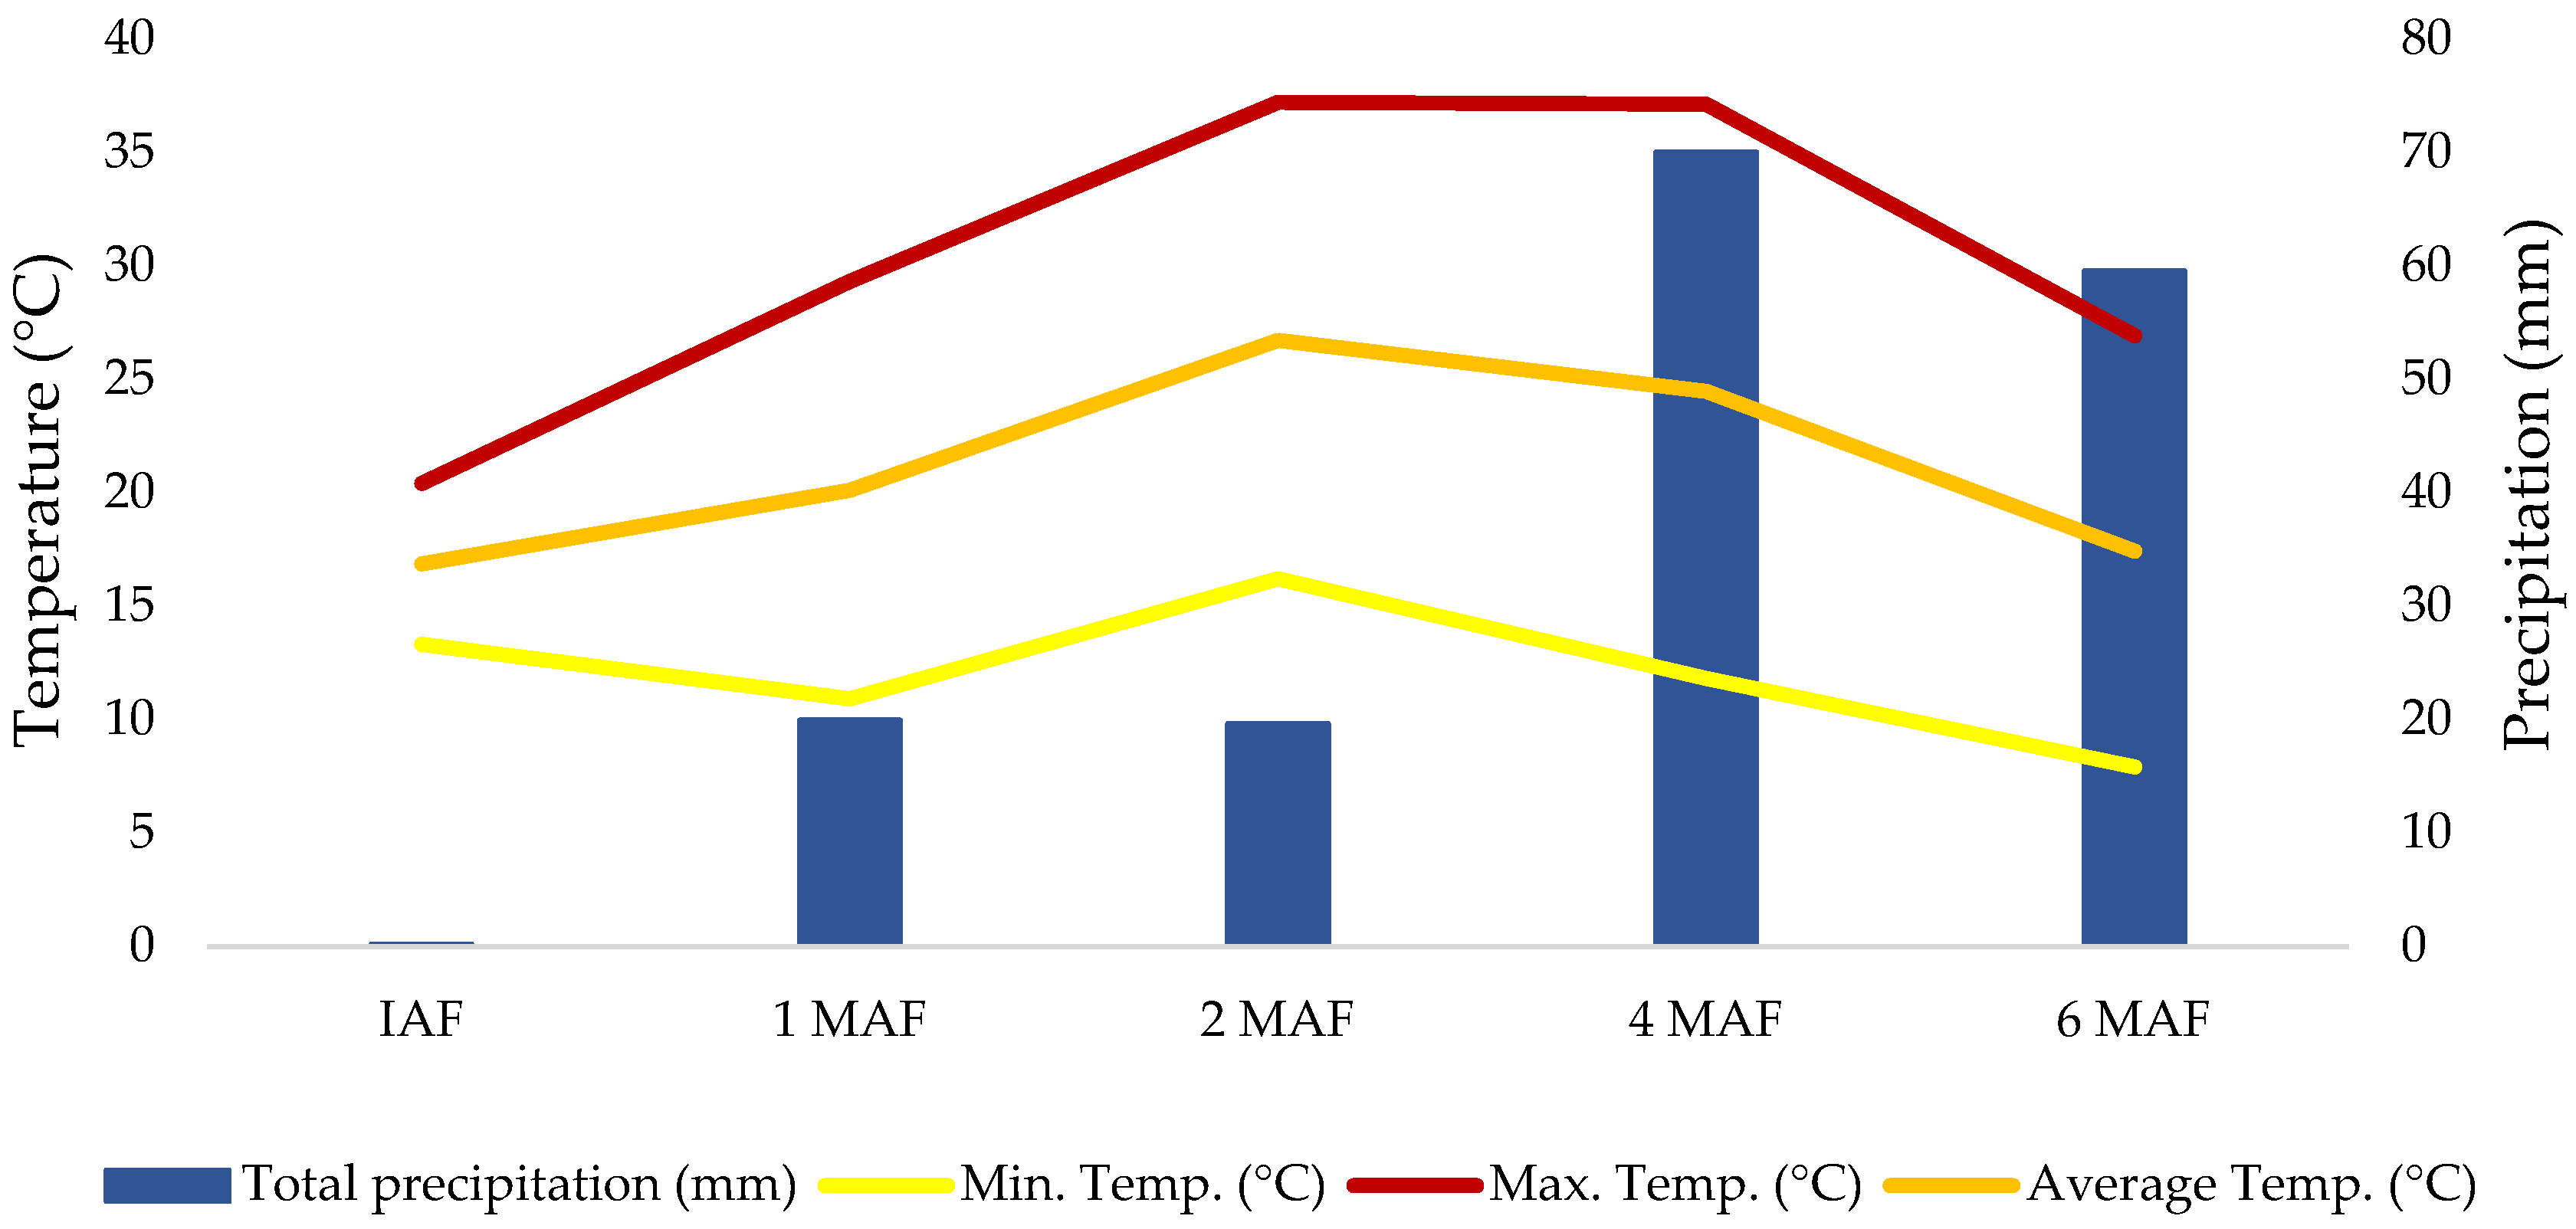
3.1. Post-Fire Meteorological Observation

The lowest amount of rainfall occurred IAF (0.2 mm), i.e., in the afternoon after the experiment set up. Between IAF and 1MAF there was 19.9 mm of rainfall, and between 1 and 2MAF, 19.6 mm precipitated. The highest rainfall occurred between 2 and 4MAF (70 mm). Finally, between 4 and 6MAF it rained 59.5 mm (Figure 4).

3.2. Soil Physical Properties

Table 1 shows the SWR measured in the composite and different soil fractions. In the composite fractions, SWR was significantly higher IAF than at the other sampling dates, while in C, no significant differences were observed. Comparing treatments, a significantly higher SWR was observed IAF and 1MAF in F than in C for composite soil. Within the 0.25–0.5 mm fractions, a significantly higher SWR was observed in both treatments IAF than at the rest sampling dates. In the <0.25 mm fraction, a significantly higher SWR was observed IAF, and 2 and 4MAF compared to 1 and 6MAF in C, while in the F treatment, a significantly higher SWR was observed IAF than at the other sampling dates. In the smallest soil fractions (0.25–0.5, and <0.25 mm), significantly higher SWR was observed in the F than C treatment IAF and 1MAF.
A significantly higher MWD and WSA in the F treatment were observed IAF compared to the last sampling date (Table 2). In the C treatment, a significantly higher MWD was observed at 6MAF compared to the initial dates (IAF and 1MAF). In the F treatment, a significantly higher WSA was observed at 6MAF than 1MAF. Comparing treatments, in the first four sampling dates (IAF, 1, 2, and 4MAF), a significantly higher MWD was observed in the F compared to the C treatment. For WSA, significantly higher values in the F than in the C treatment were observed at the first two sampling dates (IAF and 1MAF).

3.3. Soil Chemical Properties

A significantly higher soil pH was observed in the F compared to the C treatment at 2, 4, and 6MAF (Table 3). In the F treatment, the highest value was observed at 6MAF, and 1MAF in the C treatment. The electrical conductivity (EC) was significantly higher IAF and 1MAF compared to the other sampling dates within the C treatment. EC was significantly higher in the F treatment at 1 and 4 MAF compared to IAF. Between treatments, a significantly higher EC was observed in F than in C at all sampling dates. The TN in the C treatment was significantly higher at 1MAF than IAF, while in the F treatment, TN was significantly higher IAF and 1MAF than at the other sampling dates. By comparing treatments, TN was significantly higher IAF, 1MAF, and 6MAF in the C than in F treatment. In the C treatment, TC was significantly lower at 1MAF than at the other sampling dates. In the F treatment, a significantly higher TC was observed IAF and 1MAF compared to 6MAF. By comparing treatments, a significantly higher TC was observed IAF, and 1 and 6MAF in the C compared to F treatment.
The C/N was significantly higher in the C treatment with higher values 1 and 6MAF compared to IAF. By comparing treatments, a significantly higher C/N was observed in the F than in C treatment IAF. TS was significantly lower at 1MAF than at the other sampling dates in the C treatment. In the F treatment, TS was significantly higher IAF and 2MAF compared to 6MAF. By comparing treatments, a significantly higher TS was observed in the C than in F treatment 1 and 6MAF, while a significantly higher TS was observed IAF in the F compared to C treatment.

3.4. Soil Mineralogical Properties

Natural and burned soil contain the same mineral phases: quartz as a dominant phase followed by muscovite/illite, plagioclase, K-feldspar, chlorite, 14 Å mineral (vermiculite and/or smectite), and amphibole. The samples may contain a small amount (<2 wt%) of calcite and dolomite. Although the colour of the sample indicates the presence of goethite, this mineral phase was not identified (probably due to the very low percentage). Based on the analysis of the bulk samples, no differences were observed between the samples.
The observed values for dithionite-soluble iron (Fed) in natural and burned soil were 5250 and 5021 mg kg−1, while the values for oxalate-soluble iron (Feo) were 1790 and 1830 mg kg−1, respectively. The results show that both natural and burned soil contain well and poorly crystallised Fe oxides. Based on the soil colour, we suspect that the main iron oxide in the soil is goethite. We did not find any significant change in the content of both Feo and Fed indicating that poorly crystallised Fe oxides did not transform into well-crystallised iron oxides as a result of the induced soil fire.
The observed values for dithionite-soluble manganese (Mnd) in natural and burned soil were 845 and 840 mg kg−1, while the values for oxalate-soluble manganese (Mno) were 645 and 710 mg kg−1, respectively. The results show that poorly crystallised Mn oxides dominated both natural and burned soils. We did not find any significant change in the content of both Mno and Mnd as a result of the induced soil fire.

3.5. Soil Microbial Properties

A significantly higher THB in the C treatment was observed 4 and 6MAF compared to IAF (Table 4, Figure A1). In the F treatment, a significantly higher THB was observed 4 and 6MAF compared to IAF, and 2 and 4MAF. Between treatments, a significantly higher THB was observed IAF, and 1 and 2MAF in the C compared to F treatment. A significantly higher SB was observed 1MAF than IAF, and 4 and 6MAF in the C treatment, while a significantly higher SB was observed 4 and 6MAF compared to IAF and 1MAF in the F treatment. Between treatments, a significant SB was observed IAF and 1 MAF in the C compared to F treatment, while the opposite was noted 4 and 6MAF, identifying a significantly higher SB in the F than C treatment.
A significantly higher PSB was observed 2, 4, and 6MAF compared to IAF and 1MAF in the C and F treatments. Comparing treatments showed that a significantly higher PSB was observed in C than in F IAF and 1MAF. The CRB was significantly higher 1MAF compared to IAF, and 4 and 6MAF in the C treatment. In the F treatment, a significantly higher CRB was observed 4 and 6MAF compared to the other sampling dates. By comparing treatments, a significantly higher CB was observed in the C than F treatment, IAF, and 1 and 2MAF.
The DA was significantly higher 4MAF compared to IAF in the F treatment. By comparing treatments, a significantly higher DA was only observed at 1MAF in the C compared to F treatment.
In summary, the negative influence of the fire on soil microbial properties stopped at 4MAF.

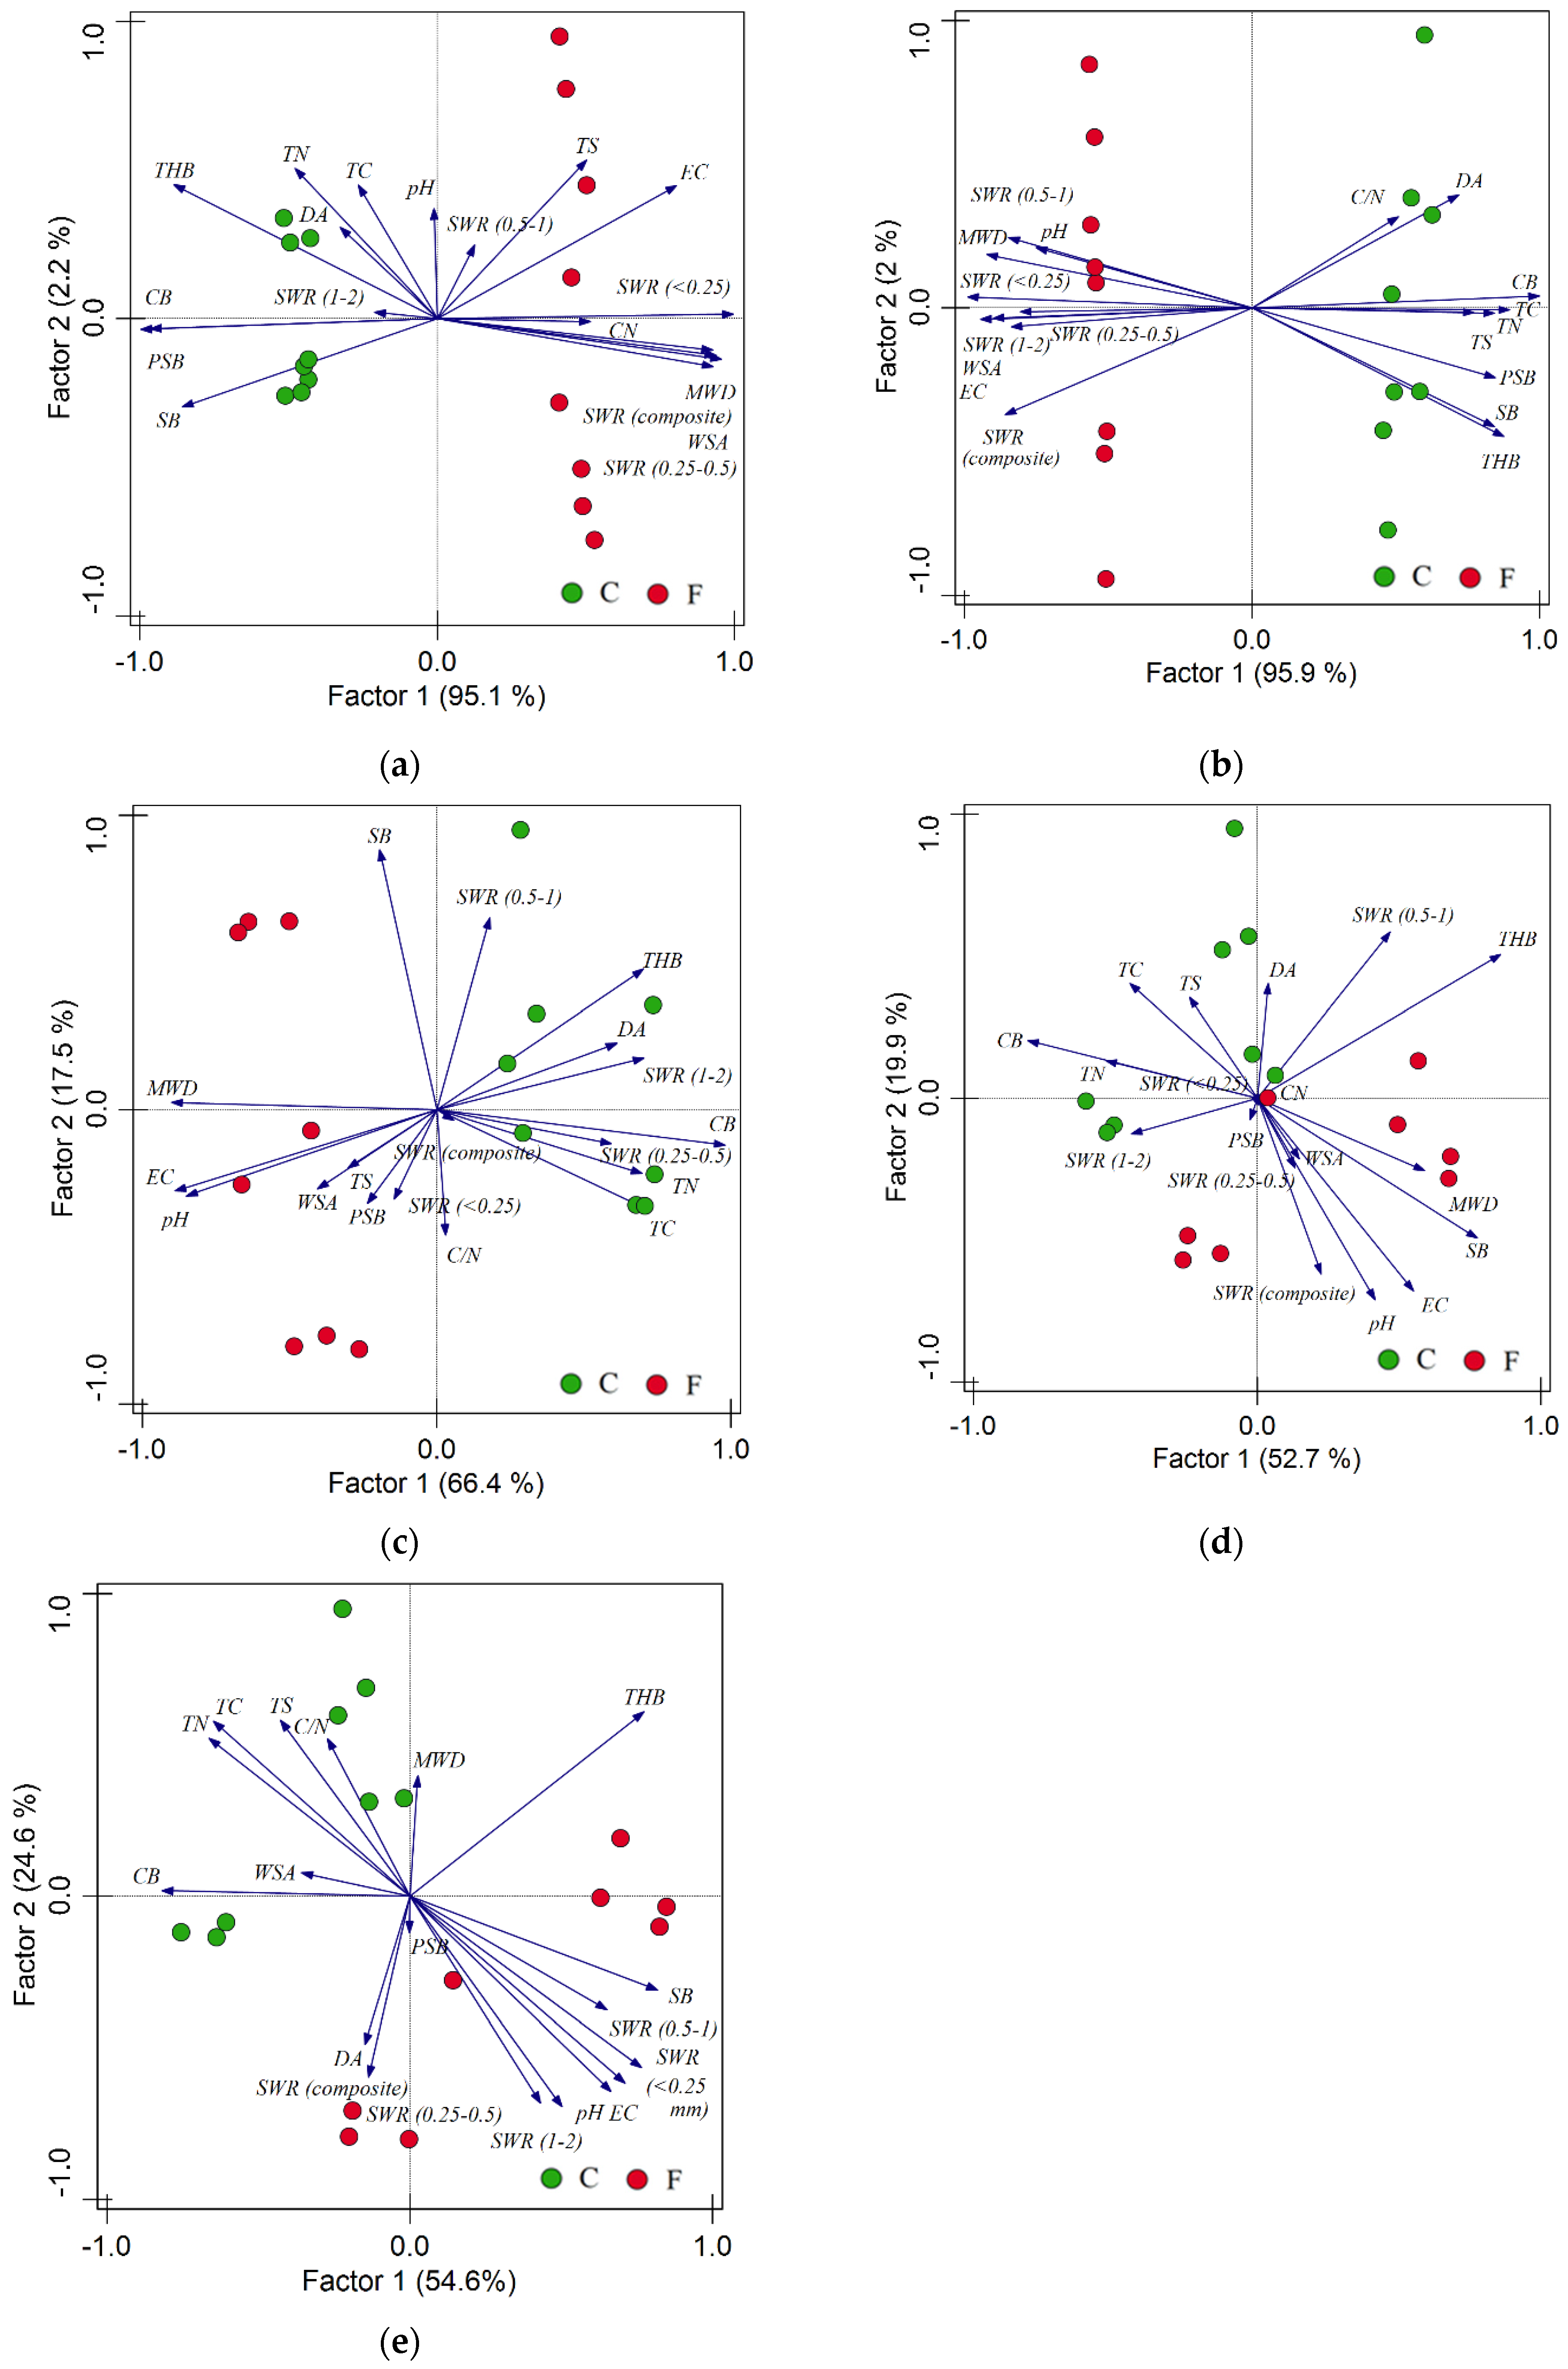
3.6. Multivariate Analysis

In the PCA performed on the IAF data, factor 1 explained 95.1% of the variance, while factor 2 explained 2.2% (Figure 5). The IAF analysis identified four groups: (i) THB, CB, PSB, and SB; (ii) TN, TC, and DA; (iii) TS and EC, and (iv) SWR (composite, <0.25 mm, 0.25–0.5), C/N, MWD, and WSA. Groups (i) and (ii) were associated with the C treatment, while groups (iii) and (iv) were associated with the F treatment.
In the PCA calculated from the 1MAF data, factor 1 explained 95.9% of the variance, while factor 2 explained 2%. The 1MAF analysis identified two groups: (i) SWR (composite, <0.25, 0.25–0.5, 0.5–1, 1–2), pH, MWD, WSA, and EC; and (ii) TS, TN, TC, C/N, CB, THB and SB. Group (i) was associated with F, while group (ii) was associated with C. Groups (i) and (ii) were inversely related.
In the PCA performed for the 2MAF data, factor 1 explained 66.4% of the variance, while factor 2 explained 17.5%. The 2MAF analysis identified four groups: (i) SB, and SWR (0.5–1); (ii) MWD, EC, and pH; (iii) TS, WSA, PSB, C/N, and SWR (composite, <0.25); and (iv) THB, DA, CB, SWR (0.25–0.5, 1–2), TN, and TC. Groups (i) and (iii) were inversely related, while group (ii) was inversely related to (iv). Group (ii) was associated with F, while group (iv) was associated with the C treatment.
In the PCA performed for the 4MAF data, factor 1 explained 52.7% of the variance, while factor 2 explained 19.9%. The 4MAF analysis identified four groups: (i) TS, TC, CB, and TN; (ii) SWR (0.5–1) and THB; (iii) SWR (0.25–0.5) and WSA; and (iv) MWD, SB, EC, pH, and SWR (composite). Groups (i) and (iv) were inversely related. Group (i) was associated with C, while group (iv) was associated with F.
Finally, in the PCA computed for the 6MAF data, factor 1 explained 54.6% of the variance, while factor 2 explained 24.6%. The 6MAF analysis identified four groups: (i) TN, TC, TS, C/N, WSA, MWD, and CB (ii) SWR (<0.25, 0.25–0.5, 0.5–1, 1–2), SB, pH, and EC; (iii) DA and SWR (composite); and (iv) THB. Group (i) was associated with C, while groups (ii) and (iii) were associated with the F treatment. Groups (i) and (ii) were inversely related.

4. Discussion

The present study showed that fire significantly altered SWR; however, there were contrasting effects depending on the different soil fractions. On smaller soil fractions, SWR usually comes to the fore due to the creation of hydrophobic components on individual soil particles and the presence of fine, hydrophobic inferential matter that are pronounced on the smallest individual soil particles, which was also the case in our study [24,25]. Smaller soil particles have a larger area of exposed individual particles. In our study, the hydrophobic effect was mitigated by reducing soil fraction sizes. According to de Jonge et al. [26] and Delač et al. [25], components of hydrophobic materials are sufficiently small to increase the degree of SWR compared to the larger ones. Furthermore, the SWR in composite soil samples showed the highest values IAF. The mixture of various sizes of soil particles caused these effects [25]. The reduction of hydrophobicity in the post-burn period was attributed to the rainfall impact and the redistribution of hydrophobic compounds from the soil surface. The increased SWR was still present 1MAF and then gradually decreased in the following months. After a fire, the ash properties usually determine the soil hydrophobicity. However, in our study, on each sampling day, the ash was removed from the soil surface. The SWR can also be explained due the changes in soil aggregate stability. Higher aggregate stability was noted in burned soil which enhanced cementing surface soil particles, increasing hydrophobicity. High temperatures increase the cementation process in these types of soils. According to Giovannini and Lucchesi [27], if the temperature is high enough to produce a thermal fusion of particles and recrystallisation of minerals in the clay fraction, the outcome will be stable soil aggregates. Similar results of increasing aggregate stability after burning were found by Delač et al. [25]. Indeed, both properties, MWD and WSA, were altered with fire impact (Table 2). At the last sampling date (6MAF), they showed values similar to unburned soil. It is stated that soil aggregates undergo modifications after a fire occurs due to various factors such as vegetation growth and meteorological conditions. For example, according to Andreu et al. [28], the development of soil aggregates in the post-fire period usually reduces soil size aggregates. In our study, hydrophobic compounds were present throughout most of the study period. It was also noted that the highest precipitation, 4MAF (70 mm), did not remove the hydrophobic compounds from the soil surface. Hydrophobic substances seemed to condense and coated the mineral soil particles.
The pH in the burned soil was not significantly different at the first sampling dates (IAF and 1MAF). However, higher values were identified in burned soil. During the sampling, the ash was removed from the soil surface. However, some particles were adsorbed into the soil surface due to the high mobility of ash. It is believed that ash and burned particles containing soluble salts were released during the combustion of organic matter, stored into the soil at 2MAF, and continued to clog soil pores during the soil campaign process. The following rainfall events contributed to the ash influx in the soil, which was evident at 2, 4, and 6MAF in the F treatment which showed an increase in pH values. Delač et al. [25] and Oswald et al. [29] found similar results. Shortly after the fire, soil pH did not show significant differences, after which an increase was observed in a burned area. The combustion of organic matter slightly influenced soil pH in the first few months because base cations are released during combustion and deposited onto the soil surface. The increase in soil pH is usually temporary, depending upon the original soil pH, the amount of ash released, the ash’s chemical composition, and the climate’s moisture levels [30]. Regarding the EC values at each sampling time, F had significantly higher values than C. The combustion process influenced the higher content of inorganic ions on the soil surface [1]. The increase in EC can also be attributed to the oxide formation and release of soluble salt during the combustion of organic matter. The return of the soil pH and EC values to the initial ones are controlled by various factors: meteorological conditions, vegetation recuperation, and soil type [6].
TC and TN showed lower values under the F treatment than C at two sampling dates, which was expected due to the ash layer’s removal and high temperatures. Carbon and nitrogen have relatively low volatilisation temperatures, ~100 °C and ~200 °C, respectively [31]. It is assumed that the heat pulse in the soil caused the reduction of TC and TN at the first sampling dates, as was found in other studies [32,33]. The lack of significant differences at 2 and 4MAF for both TN and TC can result from increased soil microbial activity after the fire, which caused a slight increase in TN and TC. However, 6MAF, the C treatment had a higher stock of TN and TC. The burned area at 6MAF was still not covered with vegetation, as is expected in grassland ecosystems in the Mediterranean [34]. It was assumed that the erosion process and leaching after major rainfall events contributed to the reduction of the values. Our results align with the findings of other studies [35]. Considering the absence of vegetation cover, we can justify the lack of significantly higher values of TN and TC in burned soil at 6MAF. The lack of significant differences could be due to the supplement of carbon in the soil from the decomposition and activity of soil microorganisms. The reduced levels of litter decomposition caused a lower amount of carbon and nitrogen in the soil. This indicated that the fire reduced TC and TN in the soil.
The C/N ratio was significantly different IAF between treatments. This observation is attributed to the effect of volatilisation, i.e., reduction of nitrogen and carbon levels in the soil. In the F treatment, the C/N ratio showed a decrease in the post-burn period. This observation was attributed to the mineralisation effects of burning. It is believed that the storage of burned materials in the soil reduced the C/N ratio, and in the fire-affected soils, this reduction is due to immobilisation of N (in contrast to C) in recalcitrant heterocyclic structures [36]. Organic fractions with a low degree of humification increase their relative N content when heated, and this may contribute to the reduction of significant differences between burned and unburned plots. In comparison to C and N, sulphur has a higher volatilisation temperature (~800 °C). TS was significantly higher in the F than C treatment in the first two sampling dates. This observation can be explained by the mineralisation and oxidation of soil organic matter [1], which showed greater values in the F compared to C treatment in the first two sampling dates.
Previous studies show that, generally, the concentration of THB increases following wildfires. This mainly occurs as a consequence of increased soluble carbon and nutrients in the soil after the wildfire [37]. Our study found a significantly lower concentration of THB IAF compared to unburned soil. The temperature during the fire was sufficiently high to reduce THB. At 2MAF, the fire’s negative influence on THB was no longer evident, and the population had recovered when compared to unburned soil. The increase in THB is likely caused by the high rainfall events between 4 and 6MAF. In addition, THB are known to have a higher heat resistance than other types of bacteria. Vázquez et al. [38] showed that the number of THB in the soil increased within the first month after the wildfire but stabilised one year later. Using experimental heating treatments on grassland soil, Grassol et al. (1996) [39] found that the number of THB were increased on the tenth day after the heating treatment, and were 2.7-fold higher than that of unburned soil. However, their number decreased 30 days after the heating treatment. Therefore, the successful post-fire growth of the THB population observed in the present study was most likely a consequence of increased nutrient contents appearing in an easily available form for bacterial metabolism and due to markedly high resistance of THB to the high temperatures induced by the fire compared to that of other microbial groups [40,41]. In conclusion, it seems that the positive effect of fire on soil THB survival can be considered a general trend in soil post-fire dynamics.
The concentration of SB followed a similar trend as THB, which is explained by the fact that SB are a fraction of THB. Our results were consistent with those of Bárcenas-Moreno et al. [42] and Vázquez et al. [38], who showed that the SB population remains dormant immediately after the fire and the growth of the population markedly increases in the following months. The SB have a better survival rate following a wildfire due to the high resistance of their endospores to physical or chemical stresses [43]. Only Gram-positive bacteria possess the ability for endospore formation. Thus, their survival rate following a wildfire is higher than that of non-sporogenic bacteria. Their survival success following wildfire events have been studied but often within different sampling periods [3,38,42,44]. Bárcenas-Moreno et al. [42] showed that immediately after the wildfire, the SB group was the lowest among all investigated bacterial groups. However, eight months following the wildfire, their number was the greatest, 50 times greater than that in unburned control plots. In addition, their number remained the highest even 32 months after the wildfire, 20 times higher than that of unburned control plots. In a Mediterranean Pinus pinaster Aiton forest, Vázquez et al. [38] showed that the number of SB greatly increased one month after the wildfire compared to unburned control plots. Their increase was present even one year afterward, whereas the number of THB was lower than that of unburned control plots.
Phosphate-solubilising bacteria followed a similar trend of starting at lower counts than control in the first month after the fire before recovering completely by the second month. However, the population of PSB was not higher than the control, even six months after fire. Manian et al. [45] reported the opposite findings, showing that burned soil after a wildfire in natural grasslands favoured P-solubilizing bacterial populations.
The CRB are the main focus of bio-medical scientists due to the emergence of these bacteria as human pathogens. However, new research focuses are arising concerning their distribution within soil and water environments [46,47,48], as well as in waste-treatment plants [49]. Reports of CRB in soil are relatively scarce [47], but to our knowledge, no studies exist that focused on their survival rate in the soil following wildfires. The concentration of 3–4 log CFU/g of CRB in the control soil suggests that soil could be the source of these emerging pathogens in sporadic human infections. The fire caused the complete removal of CRB from the soil (below 1 CFU/g), and the effect lasted until 1MAF. After 2MAF, the population of CRB started to recover, and at 6MAF the effect of fire was no longer visible. The possible explanation is that the higher rainfall created favourable conditions in the soil to allow the CRB to recuperate.
Considerable evidence exists regarding the behaviour of soil enzymes following wildfires, especially that of dehydrogenases. They are the major oxidoreductase enzymes involved in the biological oxidation of soil organic matter [50,51,52]. In our study, significant differences were only observed 1MAF, with higher values in the C treatment. Singh et al. [52] found that following a wildfire in tropical dry forests, there was an increase in soil dehydrogenase activity, and the effect was most prominent one month after the wildfire. Regardless, they showed that the effect of wildfires on soil dehydrogenases lasted as long as 13 months. The increased soil dehydrogenase activity following a wildfire was also observed in another study conducted by the same authors in the Himalayan oak and pine forests [52]. On the other hand, some studies showed no changes in the activity of soil dehydrogenases following a wildfire [50]. Other studies reported that the activity of dehydrogenases following wildfire decreases [51,53]. In general, contrasting results for dehydrogenase activities following wildfires may result from different sampling periods and environments in which the studies were conducted. This indicates that their activity in association with wildfires should be studied in more depth and specifically with respect to different biomes, vegetation types, and wildfire severity levels.
Many physical, chemical, and biological soil properties affected by fires are related to their severity [54]. Fire can substantially alter soil characteristics directly during burning and indirectly during the post-fire recovery period [55]. Soil microbial communities are mainly affected by the direct effect of soil heating but also, indirectly, by fire-induced changes in the soil environment, especially in soil properties such as pH, the quantity and quality of organic matter, nutrient availability, structure, and porosity [1]. This study monitored the immediate (direct) and indirect effects for six months. The experiment was designed to study the recurrent effect of fire. The experiment enabled us to sample the soil with a determined fire severity and in controlled conditions immediately after the fire. Immediately after wildfires in natural conditions, there is not enough time and it is not safe to sample soil in burned areas. IMAF and at 1, 2, and 6MAF, there were clear differences regarding the treatments. However, at 4MAF, the treatment effect was slightly overlapped. This can be explained due to the highest rainfall that occurred in that period. As for the soil properties, IAF and 1MAF showed the apparent effect of the experimental bonfire. The soil microbial properties (THB, SB, PSB, CRB, DA), TC, and TN had the highest values in the unburned treatment, which was expected due to the high temperature. The soil’s biological properties are well known to be altered by fire occurrence [55]. The soil’s chemical and physical properties showed higher values in the burned soil. The high temperatures influenced the increase in MWD, WSA, pH, EC, and SWR (composite, <0.25, 0.25–0.5, 0.5–1, 1–2).

5. Conclusions

The results revealed that the application of experimental fire to stimulate recurrent fires was sufficient to observe effects on the soil. Soil water repellency increased immediately and remained high until six months in the smallest soil fractions. Soil aggregates were altered only in the initial post-fire period, after which they were re-established after six months. Increases in pH and EC due to the release of cations were still observed six months post-fire. A moderate- to high-severity fire on Cambisol decreased the content of nitrogen and carbon which did not recuperate during the study period. The physiological groups of bacteria and dehydrogenase activity were reduced due to the high temperatures during the fire, but their contents increased due to natural soil regeneration and rainfall. Even though Cambisol showed some resilience to fire and its properties mostly returned to normal by the sixth month, full recovery is expected to occur later, as vegetation returns.

Author Contributions

Conceptualization, I.K., G.D. and D.D.; methodology, I.K., G.D. and D.D.; validation, J.H., D.D. and I.B.; formal analysis, D.D. and I.K.; investigation, I.K. and M.M.; writing—original draft preparation, J.H. and D.D.; writing—review and editing, J.H., D.D., I.K., G.D., P.P., I.B. and M.M.; visualization, D.D.; supervision, I.K. and P.P.; project administration, I.K. and D.D. All authors have read and agreed to the published version of the manuscript.

Funding

The work was supported by the Croatian Science Foundation under the project “Influence of Summer Fire on Soil and Water Quality” (IP-2018-01-1645).

Institutional Review Board Statement

Not applicable.

Informed Consent Statement

Not applicable.

Data Availability Statement

Data are available upon request.

Conflicts of Interest

The authors declare no conflict of interest.

Appendix A

Figure A1. Numbers of (a) total heterotrophic bacteria, (b) sporogenic bacteria, (c) phosphate-solubilising bacteria, (d) carbapenem-resistant bacteria, and (e) dehydrogenase activity (mean values and standard deviations) in the control and fire treatments during the study period (IAF, immediately after fire; MAF, months after fire).
Fire 06 00155 g0a1

References

  1. Certini, G. Effects of fire on properties of forest soils: A review. Oecologia 2005, 143, 1–10. [Google Scholar] [CrossRef]
  2. Moghli, A.; Santana, V.M.; Baeza, M.J.; Pastor, E.; Soliveres, S. Fire Recurrence and Time Since Last Fire Interact to Determine the Supply of Multiple Ecosystem Services by Mediterranean Forests. Ecosystems 2022, 25, 1358–1370. [Google Scholar] [CrossRef]
  3. Sáenz de Miera, L.E.; Pinto, R.; Gutierrez-Gonzalez, J.J.; Calvo, L.; Ansola, G. Wildfire effects on diversity and composition in soil bacterial communities. Sci. Total Environ. 2020, 726, 138636. [Google Scholar] [CrossRef] [PubMed]
  4. Ferran, A.; Delitti, W.; Vallejo, V.R.; De Estudios, C.; Darwin, C.C.R.; Tecnologic, P. Effects of Fire Recurrence in Quercus coccifera L. Shrublands of the Valencia Region (Spain): II. Plant and Soil Nutrients. Plant Ecol. 2017, 177, 71–83. [Google Scholar] [CrossRef]
  5. Clarke, P.J.; Lawes, M.J.; Midgley, J.J.; Lamont, B.B.; Ojeda, F.; Burrows, G.E.; Enright, N.J.; Knox, K.J.E. Resprouting as a key functional trait: How buds, protection and resources drive persistence after fire. New Phytol. 2013, 197, 19–35. [Google Scholar] [CrossRef] [Green Version]
  6. Muñoz-Rojas, M.; Erickson, T.E.; Martini, D.; Dixon, K.W.; Merritt, D.J. Soil physicochemical and microbiological indicators of short, medium and long term post-fire recovery in semi-arid ecosystems. Ecol. Indic. 2016, 63, 14–22. [Google Scholar] [CrossRef]
  7. Pausas, J.G.; Fernández-Muñoz, S. Fire regime changes in the Western Mediterranean Basin: From fuel-limited to drought-driven fire regime. Clim. Chang. 2012, 110, 215–226. [Google Scholar] [CrossRef] [Green Version]
  8. Knicker, H. How does fire affect the nature and stability of soil organic nitrogen and carbon? A review. Biogeochemistry 2007, 85, 91–118. [Google Scholar] [CrossRef]
  9. Reich, P.B.; Peterson, D.W.; Wedin, D.A.; Wrage, K. Fire and vegetation effects on productivity and nitrogen cycling across a forest-grassland continuum. Ecology 2001, 82, 1703–1719. [Google Scholar] [CrossRef]
  10. Guénon, R.; Vennetier, M.; Dupuy, N.; Roussos, S.; Pailler, A.; Gros, R. Trends in recovery of mediterranean soil chemical properties and microbial activities after infrequent and frequent wildfires. Land Degrad. Dev. 2013, 24, 115–128. [Google Scholar] [CrossRef] [Green Version]
  11. Trasar-Cepeda, C.; Leirós, M.C.; Gil-Sotres, F. Hydrolytic enzyme activities in agricultural and forest soils. Some implications for their use as indicators of soil quality. Soil Biol. Biochem. 2008, 40, 2146–2155. [Google Scholar] [CrossRef] [Green Version]
  12. Nannipieri, P.; Ascher, J.; Ceccherini, M.T.; Landi, L.; Pietramellara, G.; Renella, G. Microbial diversity and soil functions. Eur. J. Soil Sci. 2003, 54, 655–670. [Google Scholar] [CrossRef]
  13. Nelson, A.R.; Narrowe, A.B.; Rhoades, C.C.; Fegel, T.S.; Daly, R.A.; Roth, H.K.; Chu, R.K.; Amundson, K.K.; Geonczy, S.E.; Emerson, J.B.; et al. Playing with FiRE: A genome resolved view of the soil microbiome responses to high severity forest wildfire. biorXiv 2021, 8. [Google Scholar] [CrossRef]
  14. Lombao, A.; Barreiro, A.; Fontúrbel, M.T.; Martín, A.; Carballas, T.; Díaz-Raviña, M. Key factors controlling microbial community responses after a fire: Importance of severity and recurrence. Sci. Total Environ. 2020, 741, 140363. [Google Scholar] [CrossRef]
  15. Kottek, M.; Grieser, J.; Beck, C.; Rudolf, B.; Rubel, F. World map of the Köppen-Geiger climate classification updated. Meteorol. Z. 2006, 15, 259–263. [Google Scholar] [CrossRef]
  16. IUSS-WRB. World Reference Base for Soil Resources 2014, Update 2015: International Soil Classification System for Naming Soils and Creating Legends for Soil Maps; World Soil Resources Reports No. 106; Food and Agriculture Organization of the United Nations: Rome, Italy, 2015. [Google Scholar]
  17. Doerr, S.H.; Blake, W.H.; Shakesby, R.A.; Stagnitti, F.; Vuurens, S.H.; Humphreys, G.S.; Wallbrink, P. Heating effects on water repellency in Australian eucalypt forest soils and their value in estimating wildfire soil temperatures. Int. J. Wildland Fire 2004, 13, 157–163. [Google Scholar] [CrossRef]
  18. Kemper, W.D.; Rosenau, R.C. Aggregate stability and size distribution. Methods Soil Anal. Part A Phys. Mineral. Methods 1986, 5, 425–442. [Google Scholar]
  19. Walkley, A.; Black, I.A. An examination of the Degtjareff method for determining soil organic matter, and a proposed modification of the chromic acid titration method. Soil Sci. 1934, 37, 29–38. [Google Scholar] [CrossRef]
  20. Mehra, O.P.; Jackson, M.L. Iron oxides removal from soils and clays by a dithionite–citrate–bicarbonate system buffered with sodium bicarbonate. In Proceedings of the 7th National Conference on Clays and Clay Minerals, Washington, DC, USA, 20–23 October 1958; pp. 317–327. [Google Scholar]
  21. Schwertmann, U. Differenzierung der Eisenoxide des Bodens durch Extraktion mit saurer Ammoniumoxalat-Lösung. Z. Pflanz. Dung. Bodenkd. 1964, 105, 194–202. [Google Scholar] [CrossRef]
  22. Norouz, M.; Ramezanpour, H. Effect of Fire on Chemical Forms of Iron and Manganese in Forest Soils of Iran. Environ. Forensics 2013, 14, 169–177. [Google Scholar] [CrossRef]
  23. Casida, L.E.; Klein, D.A.; Thomas, S. Soil dehydrogenase activity. Soil Sci. 1964, 98, 371–376. [Google Scholar] [CrossRef]
  24. Arcenegui, V.; Mataix-Solera, J.; Guerrero, C.; Zornoza, R.; Mataix-Beneyto, J.; García-Orenes, F. Immediate effects of wildfires on water repellency and aggregate stability in Mediterranean calcareous soils. Catena 2008, 74, 219–226. [Google Scholar] [CrossRef]
  25. Delač, D.; Kisić, I.; Bogunović, I.; Pereira, P. Temporal impacts of pile burning on vegetation regrowth and soil properties in a Mediterranean environment (Croatia). Sci. Total Environ. 2021, 799, 149318. [Google Scholar] [CrossRef] [PubMed]
  26. de Jonge, L.W.; Jacobsen, O.H.; Moldrup, P. Soil Water Repellency: Effects of Water Content, Temperature, and Particle Size. Soil Sci. Soc. Am. J. 1999, 63, 437–442. [Google Scholar] [CrossRef]
  27. Giovannini, G.; Lucchesi, S. Modifications Induced in Soil Physico-Chemical Parameters by Experimental Fires at Different Intensities. Soil Sci. 1997, 162, 479–486. [Google Scholar] [CrossRef]
  28. Andreu, V.; Imeson, A.C.; Rubio, J.L. Temporal changes in soil aggregates and water erosion after a wildfire in a Mediterranean pine forest. Catena 2001, 44, 69–84. [Google Scholar] [CrossRef] [Green Version]
  29. Oswald, B.P.; Davenport, D.; Neuenschwander, L.F. Effects of slash pile burning on the physical and chemical soil properties of Vassar soils. J. Sustain. For. 1999, 8, 75–86. [Google Scholar] [CrossRef]
  30. Neary, D.G.; Ryan, K.C.; DeBano, L.F. Wildland Fire in Ecosystems: Effects of Fire on Soils and Water; Gen Tech Rep RMRS-GTR-42-vol.4; US Department of Agriculture, Forest Service, Rocky Mountain Research Station: Ogden, UT, USA, 2005; 250p. [Google Scholar] [CrossRef] [Green Version]
  31. Pereira, P.; Brevik, E.; Bogunović, I.; Ferran, E.-S. Ash and Soils: A Close Relationship in Fire-Affected Areas. In Fire Effects on Soil Properties; Pereira, P., Mataix-Solera, J., Úbeda, X., Rein, G., Cerdà, A., Eds.; CSIRO Publishing: Clayton South, VIC, Australia, 2019. [Google Scholar] [CrossRef]
  32. Francos, M.; Úbeda, X.; Pereira, P.; Alcañiz, M. Long-term impact of wildfire on soils exposed to different fire severities. A case study in Cadiretes Massif (NE Iberian Peninsula). Sci. Total Environ. 2018, 615, 664–671. [Google Scholar] [CrossRef] [PubMed]
  33. Murphy, J.D.; Johnson, D.W.; Miller, W.W.; Walker, R.F.; Carroll, E.F.; Blank, R.R. Wildfire Effects on Soil Nutrients and Leaching in a Tahoe Basin Watershed. J. Environ. Qual. 2006, 35, 479–489. [Google Scholar] [CrossRef] [Green Version]
  34. Rossetti, I.; Cogoni, D.; Calderisi, G.; Fenu, G. Short-Term Effects and Vegetation Response after a Megafire in a Mediterranean Area. Land 2022, 11, 2328. [Google Scholar] [CrossRef]
  35. Caon, L.; Vallejo, V.R.; Coen, R.J.; Geissen, V. Effects of wildfire on soil nutrients in Mediterranean ecosystems. Earth Sci. Rev. 2014, 139, 47–58. [Google Scholar] [CrossRef]
  36. Pereira, P.; Úbeda, X.; Martin, D.; Mataix-Solera, J.; Guerrero, C. Effects of a low severity prescribed fire on water-soluble elements in ash from a cork oak (Quercus suber) forest located in the northeast of the Iberian Peninsula. Environ. Res. 2011, 111, 237–247. [Google Scholar] [CrossRef] [PubMed]
  37. Mataix-Solera, J.; Guerrero, C.; García-Orenes, F.; Bárcenas, G.M.; Torres, M.P. Forest Fire Effects on Soil Microbiology. In Fire Effects on Soils and Restoration Strategies; CRC Press: Boca Raton, FL, USA, 2009; pp. 149–192. [Google Scholar] [CrossRef]
  38. Vázquez, F.J.; Acea, M.J.; Carballas, T. Soil microbial populations after wildfire. FEMS Microbiol. Ecol. 1993, 13, 93–103. [Google Scholar] [CrossRef] [Green Version]
  39. Grassol, G.M.; Ripabellil, G.; Sammarcol, M.L.; Mazzoleni, S. Effects of Heating on the Microbial Populations of a Grassland Soil. Int. J. Wildl. Fire 1996, 6, 67–70. [Google Scholar] [CrossRef]
  40. Dunn, P.H.; Barro, S.C.; Poth, M. Soil moisture affects survival of microorganisms in heated chaparral soil. Soil Biol. Biochem. 1985, 17, 143–148. [Google Scholar] [CrossRef]
  41. Dunn, P.H.; DeBano, L.F.; Eberlein, G.E. Effects of burning on chaparral soils: II. Soil microbes and nitrogen mineralisation. Soil Sci. Soc. Am. J. 1979, 43, 509–514. [Google Scholar] [CrossRef]
  42. Bárcenas-Moreno, G.; García-Orenes, F.; Mataix-Solera, J.; Mataix-Beneyto, J.; Bååth, E. Soil microbial recolonization after a fire in a Mediterranean forest. Biol. Fertil. Soils 2011, 47, 261–272. [Google Scholar] [CrossRef]
  43. Paul, C.; Filippidou, S.; Jamil, I.; Kooli, W.; House, G.L.; Estoppey, A.; Hayoz, M.; Junier, T.; Palmieri, F.; Wunderlin, T.; et al. Bacterial Spores, from Ecology to Biotechnology, 1st ed.; Advances in Applied Microbiology; Elsevier Inc.: Amsterdam, The Netherlands, 2019. [Google Scholar] [CrossRef]
  44. Smith, N.R.; Kishchuk, B.E.; Mohn, W.W. Effects of wildfire and harvest disturbances on forest soil bacterial communities. Appl. Environ. Microbiol. 2008, 74, 216–224. [Google Scholar] [CrossRef] [PubMed] [Green Version]
  45. Manian, S.; Paulsamy, S.; Senthilkumar, K.; Kil, B.-S. Impact of Surface Fire on the Dynamics of N 2—Fixing and P—Solubilizing Microbial Population in Natural Grassland Soils, Southern India. Korean J. Ecol. 2002, 25, 227–234. [Google Scholar] [CrossRef] [Green Version]
  46. Djenadi, K.; Zhang, L.; Murray, A.K.; Gaze, W.H. Carbapenem resistance in bacteria isolated from soil and water environments in Algeria. J. Glob. Antimicrob. Resist. 2018, 15, 262–267. [Google Scholar] [CrossRef]
  47. Hrenovic, J.; Ivankovic, T.; Durn, G.; Dekic, S.; Kazazic, S.; Kisic, I. Presence of carbapenem-resistant bacteria in soils affected by illegal waste dumps. Int. J. Environ. Health Res. 2019, 29, 154–163. [Google Scholar] [CrossRef] [PubMed] [Green Version]
  48. Lopez, N.V.; Farsar, C.J.; Harmon, D.E.; Ruiz, C. Urban and agricultural soils in Southern California are a reservoir of carbapenem-resistant bacteria. Microbiologyopen 2020, 9, 1247–1263. [Google Scholar] [CrossRef] [PubMed] [Green Version]
  49. Hrenovic, J.; Ganjto, M.; Goic-Barisic, I. Carbapenem-resistant bacteria in a secondary wastewater treatment plant. Water SA 2017, 43, 186–191. [Google Scholar] [CrossRef] [Green Version]
  50. Lucas-Borja, M.E.; Ortega, R.; Miralles, I.; Plaza-Álvarez, P.A.; González-Romero, J.; Peña-Molina, E.; Moya, D.; Zema, D.A.; Wagenbrenner, J.W.; de las Heras, J. Effects of wildfire and logging on soil functionality in the short-term in Pinus halepensis M. forests. Eur. J. For. Res. 2020, 139, 935–945. [Google Scholar] [CrossRef]
  51. Memoli, V.; Panico, S.C.; Santorufo, L.; Barile, R.; Di Natale, G.; Di Nunzio, A.; Toscanesi, M.; Trifuoggi, M.; De Marco, A.; Maisto, G. Do wildfires cause changes in soil quality in the short term? Int. J. Environ. Res. Public Health 2020, 17, 5343. [Google Scholar] [CrossRef] [PubMed]
  52. Singh, D.; Sharma, P.; Kumar, U.; Daverey, A.; Arunachalam, K. Effect of forest fire on soil microbial biomass and enzymatic activity in oak and pine forests of Uttarakhand Himalaya, India. Ecol. Process. 2021, 10, 29. [Google Scholar] [CrossRef]
  53. Plaza-Álvarez, P.A.; Moya, D.; Lucas-Borja, M.E.; García-Orenes, F.; González-Romero, J.; Rossa, C.; Peña, E.; De las Heras, J. Early spring prescribed burning in mixed Pinus halepensis Mill. and Pinus pinaster Ait. stands reduced biological soil functionality in the short term. Land Degrad. Dev. 2021, 32, 1312–1324. [Google Scholar] [CrossRef]
  54. Moya, D.; González-De Vega, S.; García-Orenes, F.; Morugán-Coronado, A.; Arcenegui, V.; Mataix-Solera, J.; Lucas-Borja, M.E.; De las Heras, J. Temporal characterisation of soil-plant natural recovery related to fire severity in burned Pinus halepensis Mill. forests. Sci. Total Environ. 2018, 640–641, 42–51. [Google Scholar] [CrossRef] [PubMed]
  55. Santín, C.; Doerr, S.H. Fire effects on soils: The human dimension. Philos. Trans. R. Soc. B Biol. Sci. 2016, 371, 20150171. [Google Scholar] [CrossRef] [Green Version]
Figure 1. Study area (red dot show experimental location).
Fire 06 00155 g001
Figure 2. (a) Burn experiment, (b) immediately after the fire, (c) one month after the fire, (d) six months after fire.
Fire 06 00155 g002
Figure 3. (a) Colonies of carbapenem-resistant bacteria (CRB) grown on CHROMagar Acinetobacter; (b) in some cases, colonies of fungi grew on CHROMagar Acinetobacter after two days of incubation, but they did not hinder the enumeration of CRB.
Fire 06 00155 g003
Figure 4. Monthly precipitation throughout the study period when sampling was maintained. Immediately after fire: IAF, months after fire: MAF.
Fire 06 00155 g004
Figure 5. Principal component analysis for the relationship between factor 1 and 2. Soil water repellency (SWR; fraction values are expressed in mm), electrical conductivity (EC), total carbon (TC), total nitrogen (TN), total sulphur (TS), carbon–nitrogen ratio (C/N), mean weight diameter (MWD), water-stable aggregates (WSA), soil total heterotrophic bacteria (THB), sporogenic bacteria (SB), phosphate-solubilising bacteria (PSB), carbapenem-resistant bacteria (CRB), and dehydrogenase activity (DA) in control (C), and fire (F) treatments (a) immediately after the fire (IAF), (b) 1 month after fire (MAF), (c) 2MAF, (d) 4MAB, and (e) 6MAF.
Fire 06 00155 g005
Table 1. Soil water repellency measured with water drop penetration time (s) on different soil fractions in control (C) and fire (F) treatments (T) during the studied period (IAF, immediately after fire; MAF, months after fire) (mean ± standard deviation). Different letters indicate significant differences between sampling dates (uppercase letters) and treatments (lowercase letters). Kruskal–Wallis (K–W) (* p < 0.05, ** p < 0.01, *** p < 0.001, and n.s. non-significant at p < 0.05) results are shown for each comparison between treatments, and Friedman ANOVA between sampling dates.
Soil FractionTSampling OccasionFriedman
IAF1MAF2MAF4MAF6MAFp
CompositeC2.22 ± 0.46 b2.33 ± 1.09 b2.25 ± 0.492.31 ± 0.412.67 ± 1.18n.s.
F13.39 ± 5.12 Aa7.22 ± 2.02 Ba2.22 ± 0.47 B2.87 ± 0.39 B3.17 ± 0.9 B***
K–W p*****n.s.n.s.n.s.
1–2 mmC2.33 ± 0.431.08 ± 0.072.42 ± 0.281.99 ± 0.251.05 ± 0.87 bn.s.
F2.28 ± 0.622.89 ± 0.632.01 ± 0.242.31 ± 0.232.75 ± 0.64 an.s.
K–W pn.s.***n.s.n.s.*
0.5–1 mmC3.44 ± 0.371.06 ± 0.08 b2.42 ± 0.432.01 ± 0.011.2 ± 0.07 bn.s.
F3.78 ± 1.26 A2.5 ± 0.92 Ba2.01 ± 0.33 B2.11 ± 0.02 B2.08 ± 0.83 Ba*
K–W pn.s.***n.s.n.s.*
0.25–0.5 mmC3.08 ± 0.4 Ab1.04 ± 0.02 Cb2.42 ± 0.14 B2.31 ± 0.13 B1.02 ± 0.03 Cb***
F5.06 ± 1.75 Aa2.78 ± 1.31 Ba2.17 ± 0.29 B2.16 ± 0.11 B2.33 ± 0.78 Ba*
K–W p*****n.s.n.s.*
<0.25 mmC3.09 ± 0.6 Ab1.01 ± 0.03 Bb2.83 ± 0.69 A2.67 ± 0.8 A1.03 ± 0.03 Bb**
F14.22 ± 1.47 Aa7.44 ± 1.15 Ba3.42 ± 0.86 C2.55 ± 0.72 C3.02 ± 0.41 Ca*
K–W p******n.s.n.s.***
Table 2. Mean weight diameter (MWD) and water stable aggregates (WSA) of the soil in control (C) and fire (F) treatments (T) during the studied period (IAF, immediately after fire; MAF, months after fire) (mean ± standard deviation). Different letters indicate significant differences between sampling dates (uppercase letters) and treatments (lowercase letters). Kruskal–Wallis (K–W) (* p < 0.05, ** p < 0.01, *** p < 0.001, and n.s. non-significant at p < 0.05) results are shown for each comparison between treatments, and Friedman ANOVA between sampling dates.
VariableTSampling OccasionFriedman
IAF1MAF2MAF4MAF6MAFp
MWD
(mm)
C1.56 ± 0.09 Bb1.52 ± 0.15 Bb1.68 ± 0.16 ABb1.71 ± 0.15 ABb1.95 ± 0.1 A**
F2.37 ± 0.27 Aa2.50 ± 0.23 Aa2.17 ± 0.11 ABa2.19 ± 0.17 ABa1.87 ± 0.23 B***
K–W p******n.s.
WSA
(%)
C61.8 ± 2.57 ABb57.07 ± 4.08 Bb66.88 ± 8.13 AB67.87 ± 7.61 AB71.06 ± 1.19 A**
F83.52 ± 4.91 Aa75.72 ± 8.99 ABa76.28 ± 4.56 AB72.03 ± 6.71 AB68.38 ± 5.88 B*
K–W p****n.s.n.s.n.s.
Table 3. Soil pH, electrical conductivity (EC), total nitrogen (TN), total carbon (TC), carbon–nitrogen ratio (C/N), and total sulphur (TS) in control (C) and fire (F) treatments (T) during the studied period (IAF, immediately after fire; MAF, months after fire) (mean ± standard deviation). Different letters indicate significant differences between sampling dates (uppercase letters) and treatments (lowercase letters). Kruskal–Wallis (K-W) (* p < 0.05, ** p < 0.01, *** p < 0.001, and n.s. non-significant at p < 0.05) results are shown for each comparison between treatments, and Friedman (F) ANOVA between sampling dates.
VariableTSampling OccasionF
IAF1MAF2MAF4MAF6MAFp
pHC6.59 ± 0.14 B6.93 ± 0.16 A6.83 ± 0.13 ABb6.73 ± 0.11 ABb6.70 ± 0.05 ABb**
F6.62 ± 0.27 C7.19 ± 0.07 B7.53 ± 0.13 ABa7.51 ± 0.11 ABa7.68 ± 0.06 Aa***
K–W pn.s.n.s.*****
EC
(μS cm−1)
C107.6 ± 6.27 Ab146.3 ± 10.3 Ab81.18 ± 7.03 Bb82.1 ± 6.71 Bb86.38 ± 8.22 Bb***
F176.65 ± 36.5 Ba291.33 ± 60.3 Aa194.3 ± 14.14 ABa198 ± 5.31 Aa194.9 ± 13.9 ABa***
K–W p*************
TC (%)C4.21 ± 0.55 Ba5.93 ± 0.66 Aa4.18 ± 0.45 B4.11 ± 0.31 B4.61 ± 0.36 Ba***
F4 ± 0.23 Ab3.91 ± 0.33 Ab3.63 ± 0.31 AB3.51 ± 0.29 AB3.31 ± 0.22 Bb*
K–W p****n.s.n.s.*
TN (%)C0.42 ± 0.04 Ba0.5 ± 0.07 Aa0.37 ± 0.04 B0.36 ± 0.01 B0.38 ± 0.02 Ba*
F0.31 ± 0.2 Ab0.34 ± 0.03 Ab0.32 ± 0.03 AB0.31 ± 0.01 B0.28 ± 0.02 Bb*
K–W p*****n.s.n.s.**
C/NC10.02 ± 0.37 Bb11.88 ± 0.33 A11.41 ± 0.1 AB11.43 ± 0.1 AB12.11 ± 0.59 A***
F12.09 ± 0.18 Aa11.55 ± 0.24 A11.47 ± 0.47 A11.45 ± 0.3 A11.61 ± 0.29 An.s.
K–W p**n.s.n.s.n.s.n.s.
TS (%)C0.10 ± 0.01 Bb0.12 ± 0.01 Aa0.10 ± 0.01 B0.10 ± 0.02 B0.10 ± 0.01 Ba**
F0.11 ± 0.13 Aa0.10 ± 0.01 ABb0.11 ± 0.01 A0.10 ± 0.01 AB0.08 ± 0.01 Bb**
K–W p***n.s.n.s.**
Table 4. Soil total heterotrophic bacteria (THB), sporogenic bacteria (SB), phosphate-solubilising bacteria (PSB), carbapenem-resistant bacteria (CRB), and dehydrogenase activity (DA) in control (C), and fire (F) treatments (T) during the studied period (IAF, immediately after fire; MAF, months after fire) (mean values). Different letters indicate significant differences between sampling dates (uppercase letters) and treatments (lowercase letters). Kruskal–Wallis (K-W) (* p < 0.05, ** p < 0.01, *** p < 0.001, and n.s. non-significant at p < 0.05) results are shown for each comparison between treatments, and Friedman ANOVA between sampling dates.
VariableTSampling OccasionFriedman
IAF1MAF2MAF4MAF6MAFp
THB
(CFU/g)
C7.5 × 106 Ba1.8 × 107 ABa2.4 × 107 ABa3.4 × 107 A3.0 × 107 Ab**
F9.9 × 105 Bb2.9 × 106 Bb1.1 × 107 Bb4.9 × 107 A6.1 × 107 Aa***
K–W p********n.s.**
SB
(CFU/g)
C2.0 × 106 Ba4.9 × 106 Aa3.8 × 106 AB2.2 × 106 Bb2.3 × 106 Bb**
F5.8 × 105 Cb1.1 × 106 BCb4.3 × 106 AB5.4 × 106 Aa6.0 × 106 Aa***
K–W p****n.s.**
PSB
(CFU/g)
C7.4 × 105 Ba1.7 × 106 Ba5.0 × 106 A5.4 × 106 A6.3 × 106 A***
F3.2 × 104 Bb3.6 × 105 Bb5.4 × 106 A5.7 × 106 A6.4 × 106 A**
K–W p******n.s.n.s.n.s.
CB
(CFU/g)
C2.5 × 103 Ba1.5 × 104 Aa3.2 × 103 ABa2.3 × 103 B1.1 × 104 B***
F˂1 Cb˂1 Cb5.5 × 102 Bb1.3 × 103 A2.9 × 103 A***
K–W p***n.s.n.s.
DA
(A485nm)
C0.1570.283 a0.270.2090.113n.s.
F0.079 B0.145 ABb0.107 AB0.196 A0.127 AB*
K–W pn.s.*n.s.n.s.n.s.
Disclaimer/Publisher’s Note: The statements, opinions and data contained in all publications are solely those of the individual author(s) and contributor(s) and not of MDPI and/or the editor(s). MDPI and/or the editor(s) disclaim responsibility for any injury to people or property resulting from any ideas, methods, instructions or products referred to in the content.

