
Tissue-Level Flammability Testing: A Review of Existing Methods and a Comparison of a Novel Hot Plate Design to an Epiradiator Design

Abstract
:1. Introduction
2. Materials and Methods
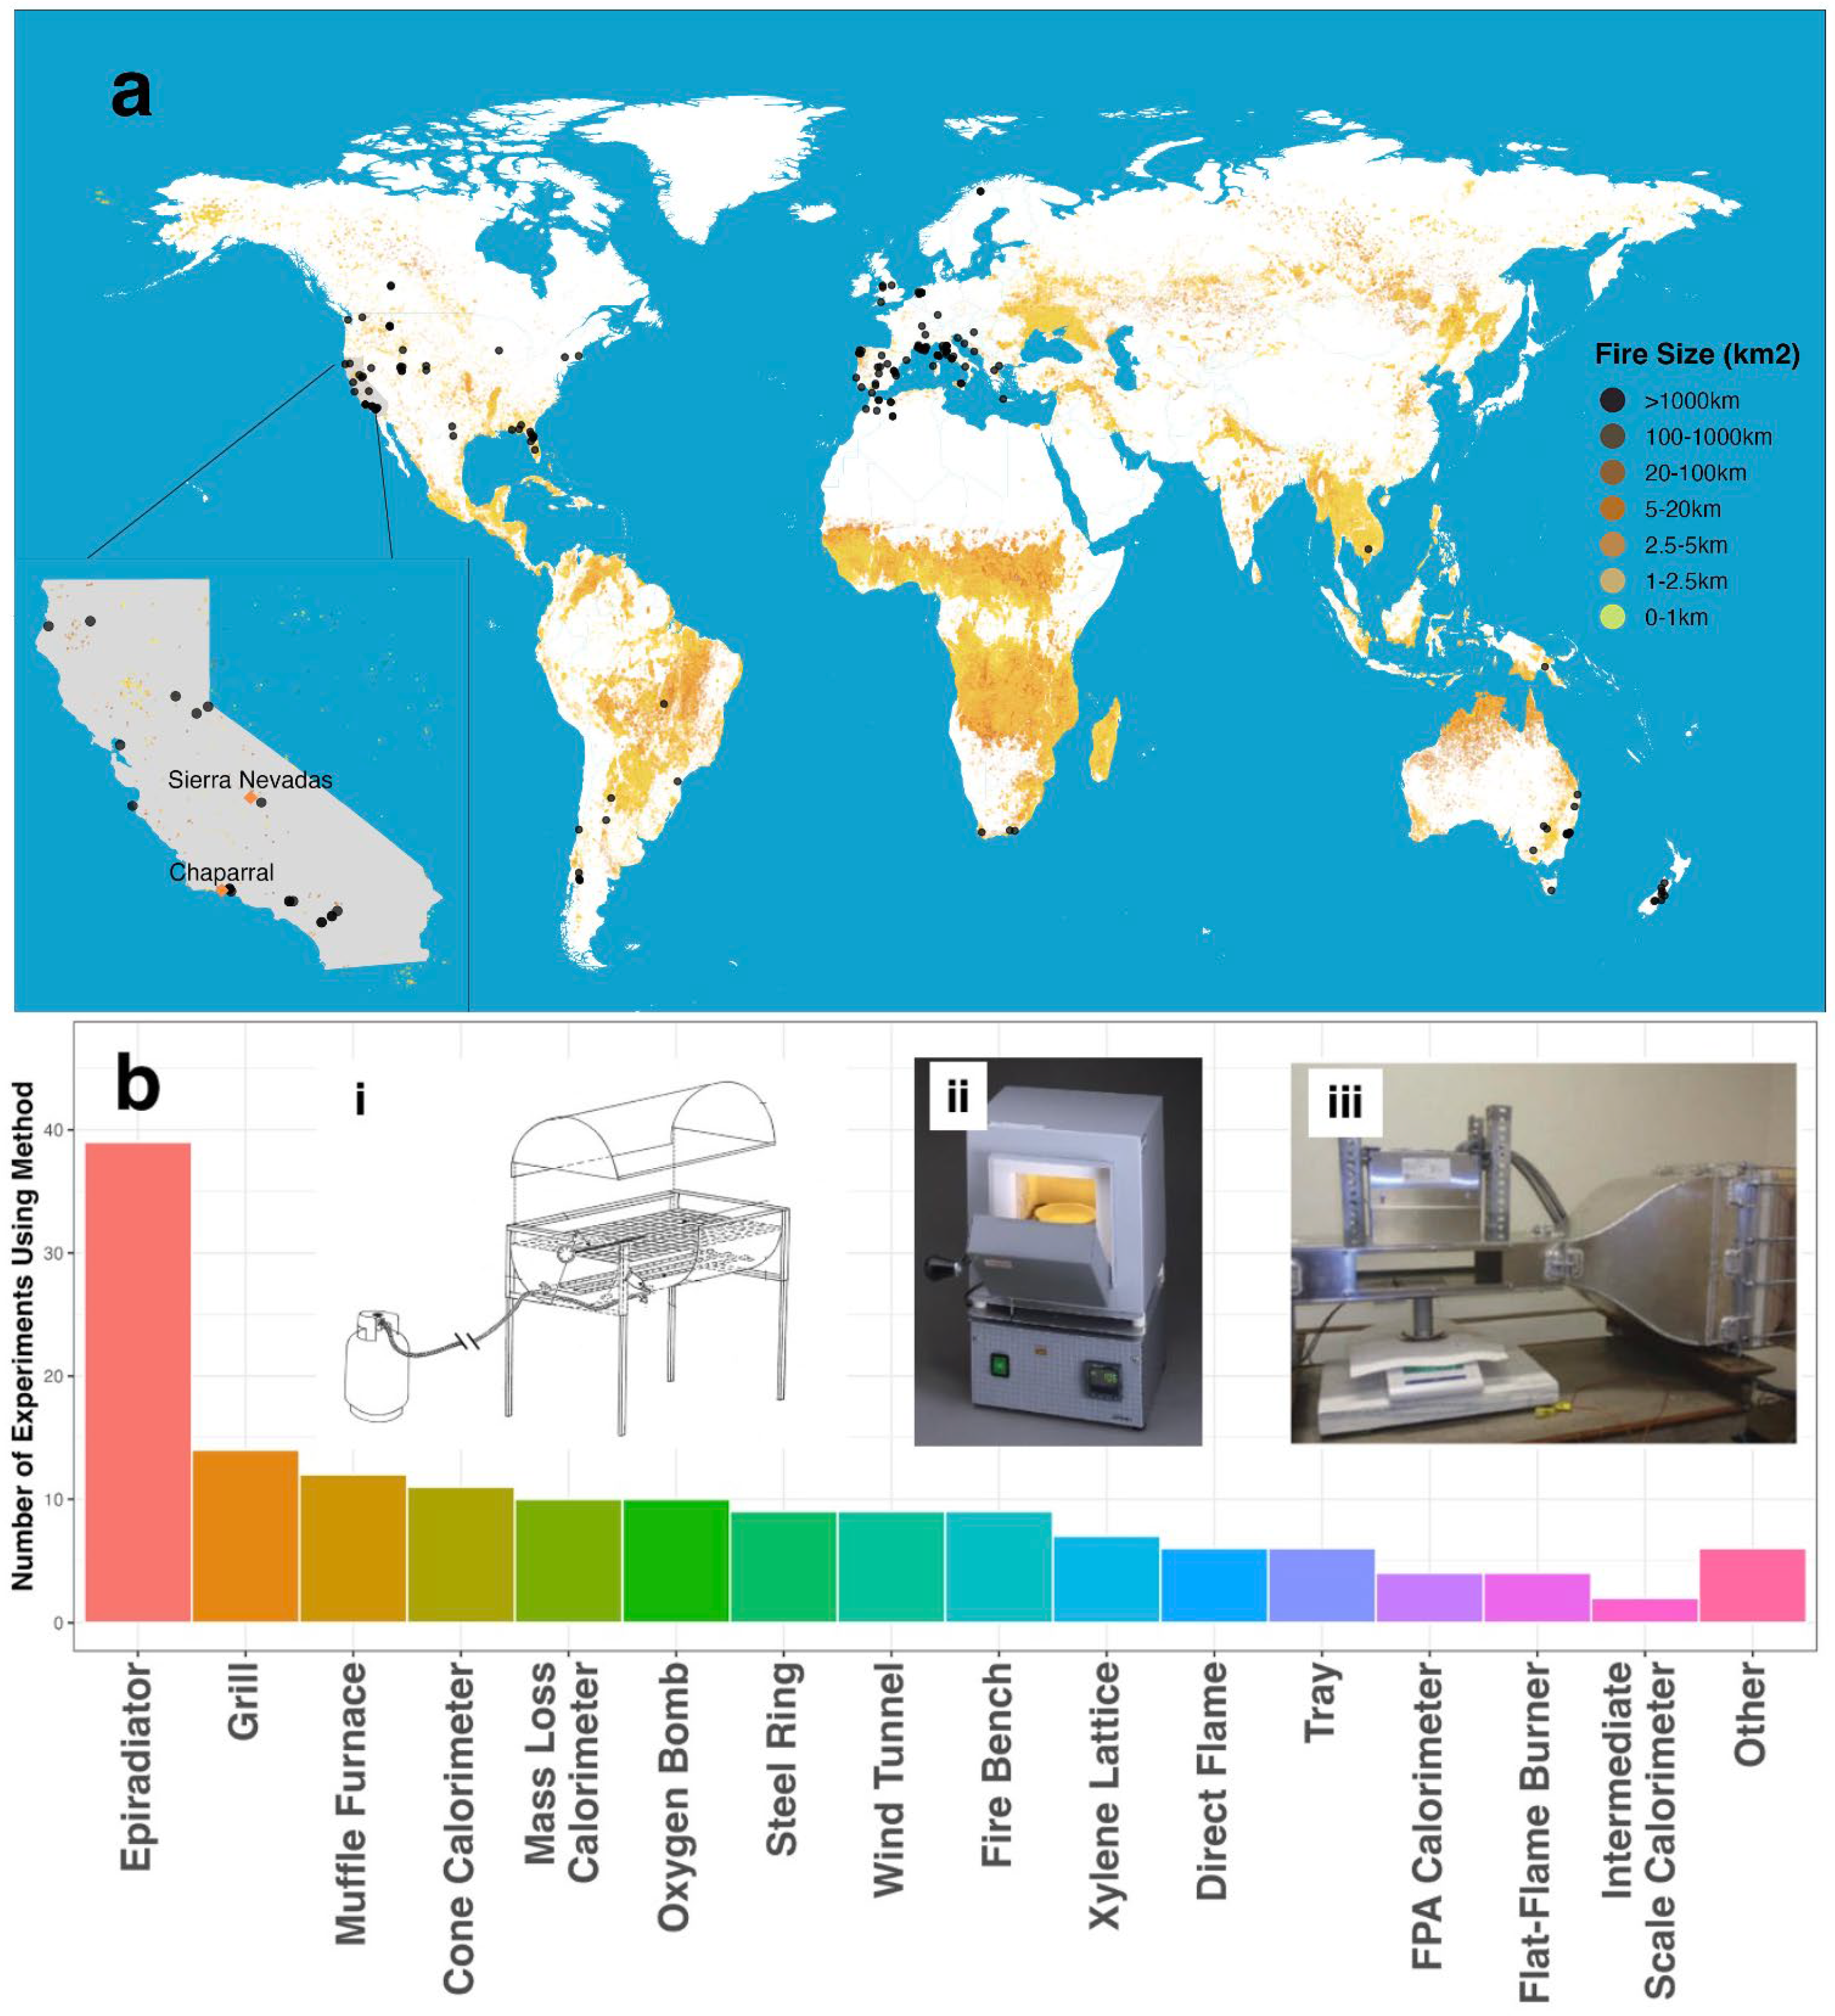
2.1. Literature Review
2.2. Laboratory Flammability Tests
2.2.1. Species-of-Interest and Sampling Sites
2.2.2. Sample Collection
2.2.3. Plant Hydration Measurements and Laboratory Benchtop Drydown
2.2.4. Flammability Testing
Epiradiator Design
Hot Plate Design
2.3. Statistical Analyses
2.3.1. Linear Mixed Effects Models
2.3.2. Removal of Partial Effects Using Remef
2.3.3. Principal Component Analyses
3. Results
3.1. Literature Review
3.2. Laboratory Flammability Tests
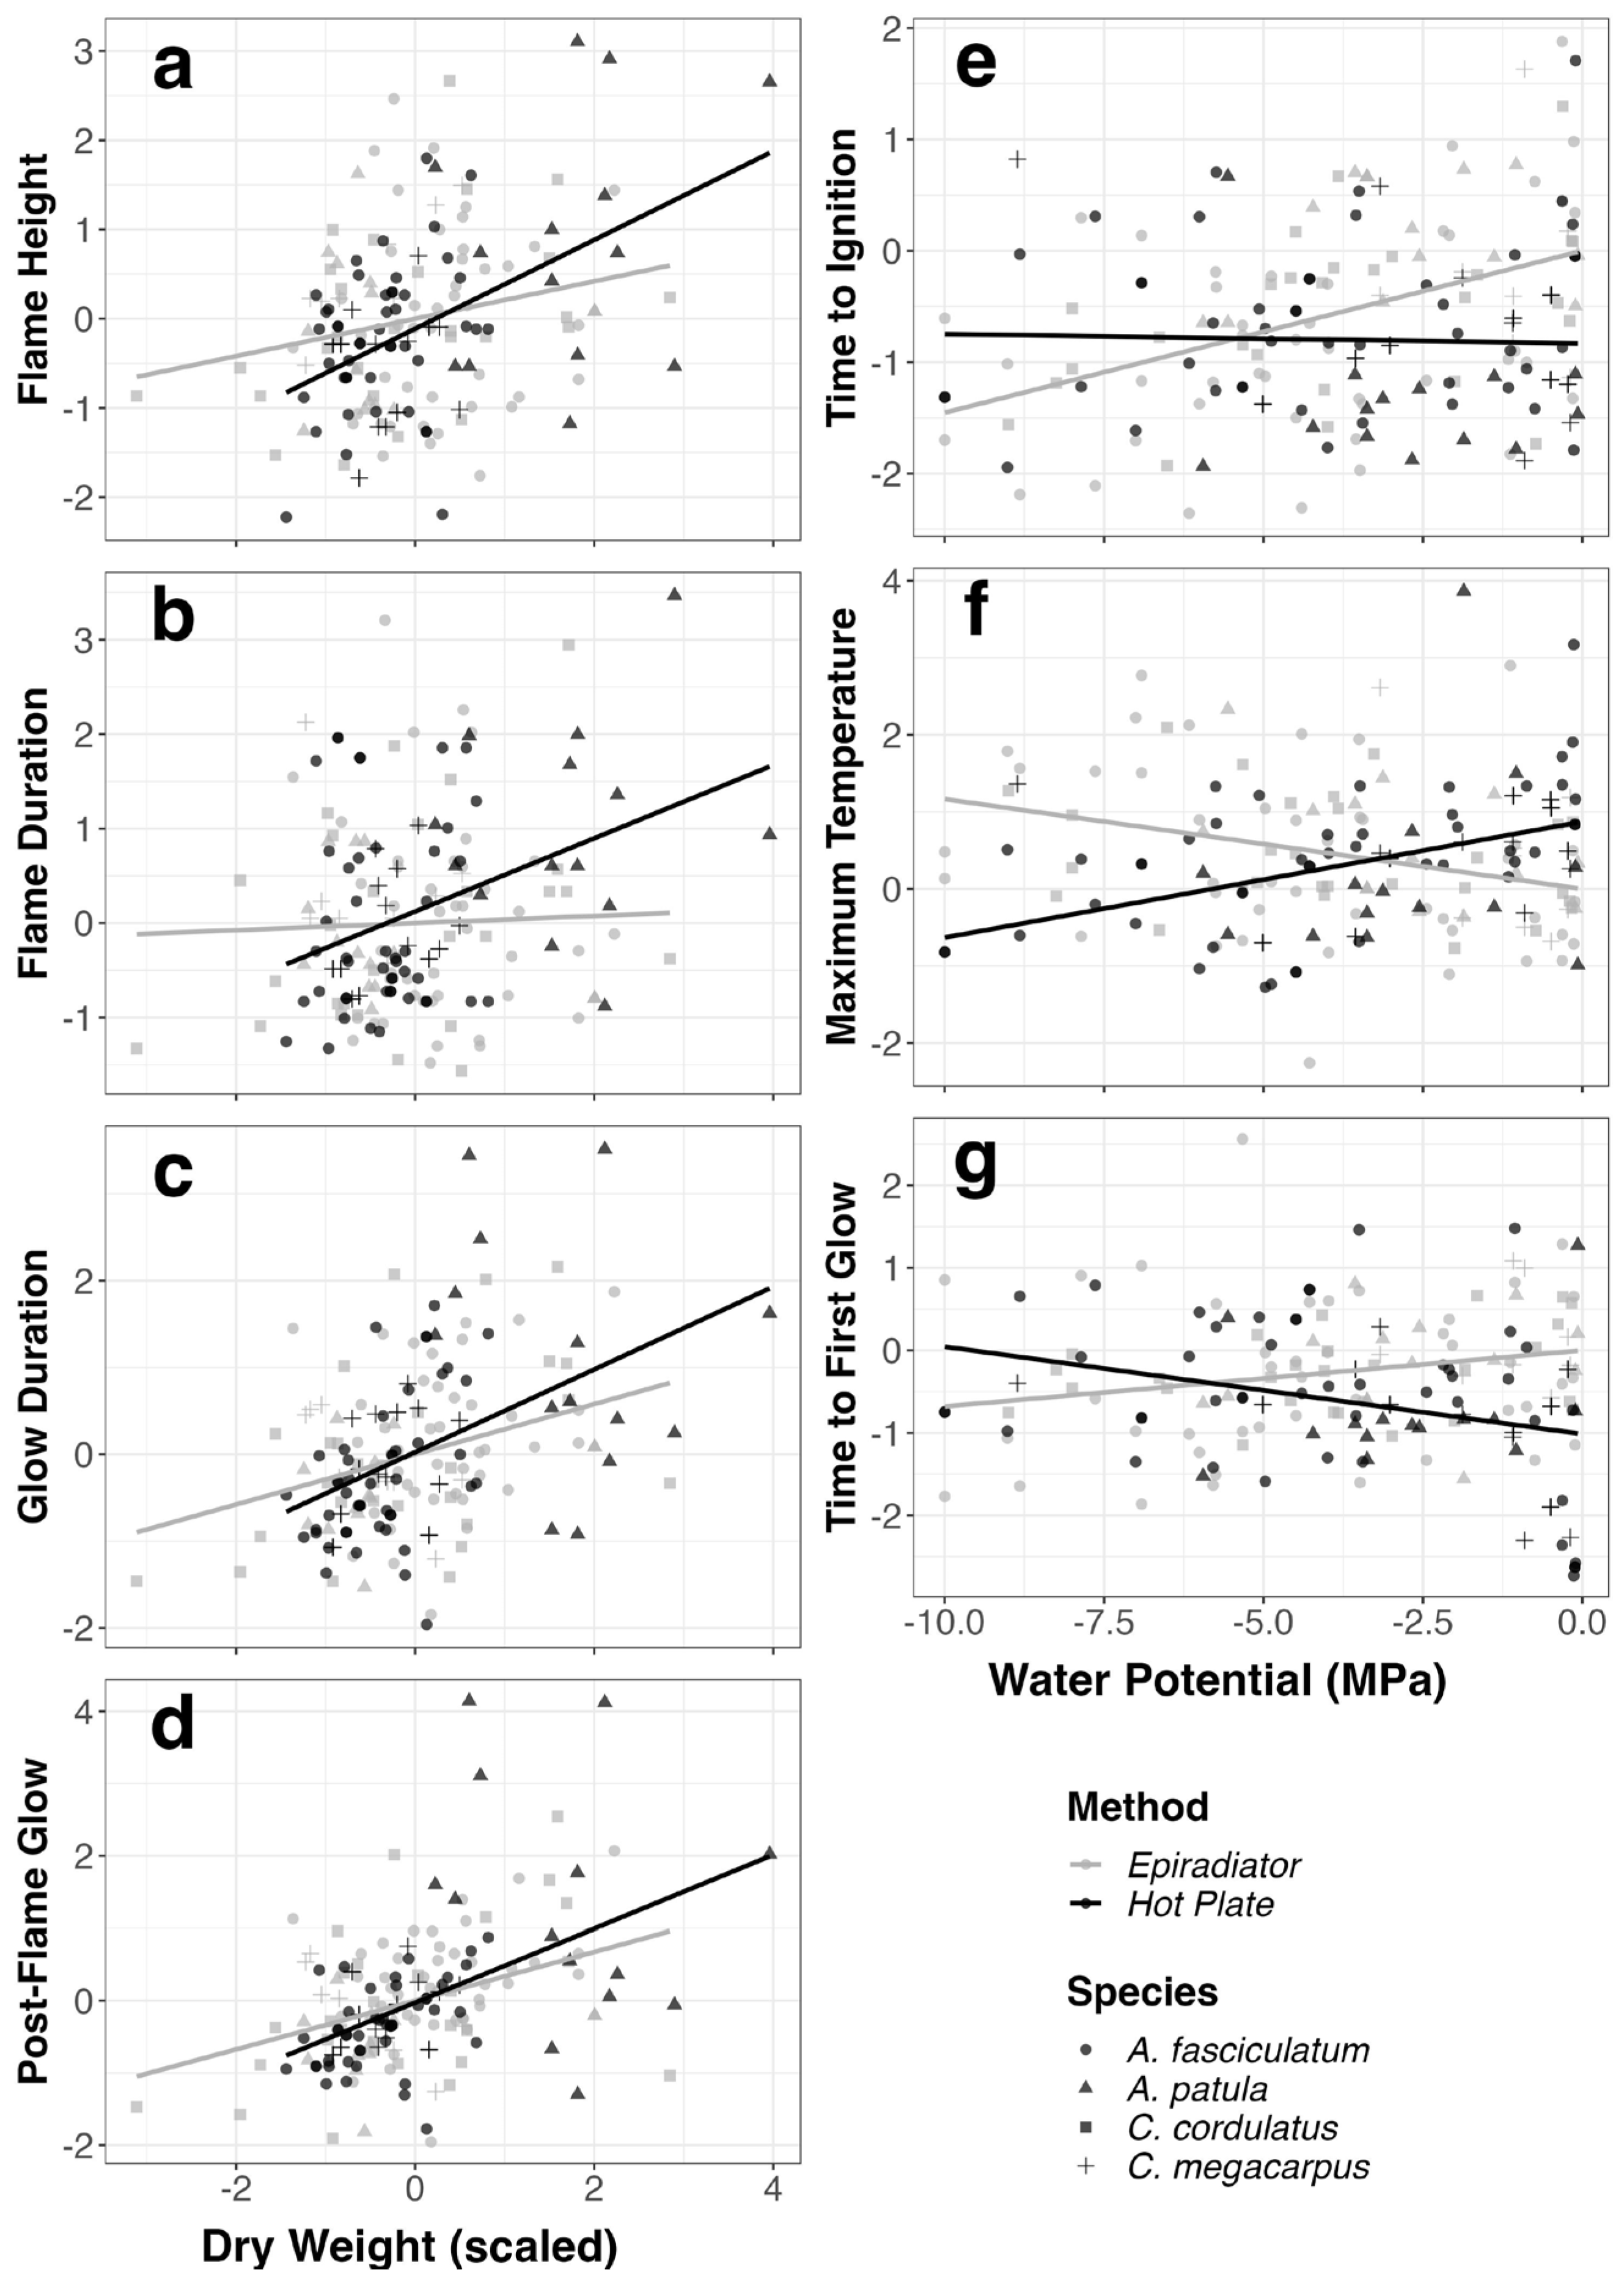
3.2.1. Flammability Versus Hydration and Dry Weight
3.2.2. Relationships between Flammability Metrics
4. Discussion
4.1. Methods of Testing Tissue-Level Flammability
4.2. How Do the Methods Compare When Analyzing the Relationships between Plant Hydration, Sample Dry Weight, and Flammability?
4.3. How Do the Methods Compare When Looking at the Relationships in a Suite of Flammability Metrics?
4.4. How Does the Hot Plate Method Compare to the Epiradiator Method?
5. Conclusions
Supplementary Materials
Author Contributions
Funding
Institutional Review Board Statement
Informed Consent Statement
Data Availability Statement
Acknowledgments
Conflicts of Interest
Appendix A

| Method | Description | Studies |
|---|---|---|
| Epiradiator | This method is defined by a Quartzalliance epiradiator as the primary heating source. Suspension methods (i.e., wire mesh), inclusion of a pilot flame, sample weights, heat flux, starting temperature, locations of thermocouples vary across different studies. Studies investigating bark flammability (e.g., [67]) have the surface of the epiradiator in a vertical orientation; however, the epiradiator is typically in a horizontal orientation, as most studies using this method investigate either live vegetation or litter layers. | [5,6],[16,17], [27],[33], [35],[48], [67,68,69,70,71,72,73,74,75,76,77,78,79,80,81,82,83,84,85,86,87,88,89,90,91], [15,18,34, 36,37] * |
| Grill | The grill apparatus was designed and described in detail in [11] In this case, it involves an 85x60cm metal barrel cut in half, a metal grill placed in between each half with propane-powered burners below the grill as heat source, a blow torch as an ignition source, and removable wind protection in an attempt to control the environment between burns. In some other cases, a manufactured BBQ grill was used in place of the barrel-based grill, as they are more easily accessible. | [11], [92,93,94,95,96,97,98,99,100,101,102,103,104] |
| Muffle Furnace | This method consists of placing a sample inside a muffle furnace and measuring flammability parameters such as time to ignition. Samples are often individual leaf specimens. Temperature of the muffle furnace varied between studies from 400-700°C. The door of the muffle furnace is kept open during tests to allow for the measurement of flammability metrics. | [8],[49], [55,56], [100], [105,106,107,108,109,110,111] |
| Cone Calorimeter | This calorimetry method measures heat release rate by measuring the consumption of oxygen resulting from combustion. It consists of a conical heater with a fixed heat flux to heat samples. The ignition source varies between tests with the more common ones including a spark ignitor and a pilot flame. Tests are typically performed in accordance with ATSM E 1354 standards [112]. | [113] *, [114,115,116,117,118,119,120,121], [51,122] ** |
| Mass Loss Calorimeter (MLC) | This is a specific type of calorimeter, manufactured by Fire Testing Technology Limited (FTT®), which is very similar to a cone calorimeter, but with adjustments to specialize in full fires and to measure smaller changes in mass loss. It also looks at heat release and heat flux. The MLC involves a conical heater, a 500g-capacity load cell, a spark ignition source, a chimney with a thermopile. Tests were most commonly conducted at 50 kW/m2. | [9],[12,13], [50],[59], [67], [123,124,125,126] |
| Oxygen Bomb | This is a calorimetry method commonly used to measure gross energy content and heat of combustion. It operates by having a reaction occur in a container (referred to as the ‘bomb’) with a fixed volume, so that changes in temperature can be attributed to the energy flux of the reaction rather to any changes in volume. In this review, it was always paired with other methods. | [6],[8,9], [12],[75], [79],[89], [93], [127,128] |
| Steel Ring | This is similar to the ‘tray’ method, but it involves a more sophisticated setup to maximize airflow and can incorporate both leaf litter and/or vegetation samples. It involves a steel mesh ring with samples loaded into it. Often, it also has a fireproof base, such as one made from a hardiflex cement fiber board. Ignition sources vary, including a paper towel soaked in isopropyl alcohol and a cotton ball soaked in ethanol. | [129,130,131,132,133,134,135,136,137] |
| Wind Tunnel | This group consists of any method that has a wind tunnel directing wind towards the samples emulating winds that play a key role during wildfires. Sample size and composition varies across the studies, from looking at full, reconstructed shrubs and litter layers to looking at 4g samples. A heat source, such as an infrared panel, is often utilized and usually located above a sample. An ignition source is typically present and varies by study, with the most common sources including a firebrand and a coiled wire igniter. | [12,13],[23], [57], [138,139,140,141,142] |
| Fire Bench | 'This method involves a large flat surface in which large plant samples or, more commonly, litter beds are tested for flammability. Ignition sources vary for the different studies and include ‘firebrands’ (usually a small block of wood, ignited by means of an epiradiator), cotton wicks soaked in a flammable liquid such as ethanol, and a propane torch. | [17],[54], [125], [143,144,145,146,147,148] |
| Xylene Lattice | 'This is another commonly used method to test litter bed flammability. It involves placing litter beds atop a lattice of cotton strings soaked in xylene, a flammable liquid, and then igniting the lattice of strings from one or multiple points leading to rapid ignition and combustion of the litter bed. | [20], [149,150,151,152,153,154] |
| Direct Flame | Samples are directly ignited by an open flame without any other heat source present. The open flame varies across studies from a Bunsen burner to a larger U-shaped gas burner. | [19], [127,128], [132], [155,156] |
| Tray | This is yet another method to test litter bed flammability. It involves placing litter beds in a metal tray with limited airflow from the sides or bottom. An ignition source, typically a firebrand, is placed in the center or edge of the litter bed to cause ignition and combustion of the litter bed. | [27],[139], [157,158,159,160] |
| FPA Calorimeter | This method is similar to the cone calorimeter, but the combustion chamber allows for a more controlled environment with less stochasticity in gas flow rate and composition. | [161,162,163,164] |
| Flat-Flame Burner | This method was designed to emulate a moving flame front. Small samples (typically, individual leaves) are suspended and a flat flame burner moves towards the sample by route of a small motor. Sometimes, a 6000 W radiative panel (Omega) is also included as a radiative heat source. | [7],[58], [165,166] |
| Intermediate Scale Calorimeter | This is also similar to a cone calorimeter, but it is designed for larger scale samples, typically burning full plants. It consists of equipment to measure gaseous concentrations, a propane line burner to create a vertical ‘wall of flame’, three wooden walls lined with ceramic fibreboard, and a plant rack in the middle of the three wooden walls. | [23],[116] |
| Other | (1) Litter was placed in a cubic basket which was then loaded into a recirculating air oven which sustained temperatures up to 250 °C, while thermocouples placed in the middle of the litter took temperature readings. (2) This is a specialized experiment investigating the propagation of flames from litter layers to shrub canopies. 20 × 20 cm litter samples were dried and then ignited 10cm below a steel wire netting holding a variety of shrub samples representative of the shrublands of SE France to emulate litter-to-shrub fire spread. (3) Litter was placed in a cubic cage which was loaded atop a sand surface into a 1.09m-tall chamber made of vermiculite insulation board. Inside the chamber, the sample was heated using an IR lamp and a handheld spark generator was used as an ignition source. (4) Leaf-level flammability was measured using a Federal Aviation Administration (FAA, USA) microcalorimeter using 10-15 mg samples. (5) Shoot-level flammability was measured using a horizontal 4 kW radiant panel located 1 cm beneath the shoot sample which was suspended by a specialized holder, with a heat flux sensor measuring heat flux and a scale beneath the sample holder measuring weight consumed during burning. (6) Full-plant flammability was measured using potted plants. Aluminum discs were located at soil level and 50 cm above soil level to estimate heat release. The plant was ignited by a burning cotton ball, soaked in 10 mL of ethanol. | (1) [167] (2) [160] (3) [168] (4) [51] (5) [30] (6) [169] |
References
- Jolly, W.M.; Cochrane, M.A.; Freeborn, P.H.; Holden, Z.A.; Brown, T.J.; Williamson, G.J.; Bowman, D.M.J.S. Climate-induced variations in global wildfire danger from 1979 to 2013. Nat. Commun. 2015, 6, 7537. [Google Scholar] [CrossRef] [Green Version]
- Abatzoglou, J.T. Williams AP Impact of anthropogenic climate change on wildfire across western US forests. Proc. Natl. Acad. Sci. USA 2016, 113, 11770–11775. [Google Scholar] [CrossRef] [Green Version]
- Moritz, M.A.; Hazard, R.; Johnston, K.; Mayes, M.; Mowery, M.; Oran, K.; Parkinson, A.-M.; Schmidt, D.A.; Wesolowski, G. Beyond a Focus on Fuel Reduction in the WUI: The Need for Regional Wildfire Mitigation to Address Multiple Risks. Front. For. Glob. Change 2022, 5, 848254. [Google Scholar] [CrossRef]
- Jolly, W.; Johnson, D. Pyro-Ecophysiology: Shifting the Paradigm of Live Wildland Fuel Research. Fire 2018, 1, 8. [Google Scholar] [CrossRef] [Green Version]
- Valette, J.-C. Inflammabilities of Mediterranean Species. In Forest Fire Risk and Management: European School of Climatology and Natural Hazards Course; Halkidiki, Greece; European Comission: Brussels, Belgium, 1992; pp. 51–64. Available online: https://scholar.google.com/scholar_lookup?title=Inflammabilities+of+Mediterranean+Species&author=Valette,+J.C.&publication_year=1992 (accessed on 9 August 2022).
- Ormeño, E.; Ruffault, J.; Gutigny, C.; Madrigal, J.; Guijarro, M.; Hernando, C.; Ballini, C. Increasing cuticular wax concentrations in a drier climate promote litter flammability. For. Ecol. Manag. 2020, 473, 118242. [Google Scholar] [CrossRef]
- Fletcher, T.H.; Pickett, B.M.; Smith, S.G.; Spittle, G.S.; Woodhouse, M.M.; Haake, E.; Weise, D.R. Effects of moisture on ignition behavior of moist California chapparal and Utah leaves. Combust. Sci. Technol. 2007, 179, 1183–1203. [Google Scholar] [CrossRef] [Green Version]
- Behm, A.L.; Duryea, M.L.; Long, A.J.; Zipperer, W.C. Flammability of native understory species in pine flatwood and hardwood hammock ecosystems and implications for the wildland-urban interface. Int. J. Wildland Fire 2004, 13, 355. [Google Scholar] [CrossRef] [Green Version]
- Della Rocca, G.; Hernando, C.; Madrigal, J.; Danti, R.; Moya, J.; Guijarro, M.; Pecchioli, A.; Moya, B. Possible land management uses of common cypress to reduce wildfire initiation risk: A laboratory study. J. Environ. Manag. 2015, 159, 68–77. [Google Scholar] [CrossRef]
- Fernandes, P.M. Cruz MG Plant flammability experiments offer limited insight into vegetation–fire dynamics interactions. New Phytol. 2012, 194, 606–609. [Google Scholar] [CrossRef]
- Jaureguiberry, P.; Bertone, G.; Díaz, S. Device for the standard measurement of shoot flammability in the field. Austral Ecol. 2011, 36, 821–829. [Google Scholar] [CrossRef]
- Madrigal, J.; Marino, E.; Guijarro, M.; Hernando, C.; Díez, C. Evaluation of the flammability of gorse (Ulex europaeus L.) managed by prescribed burning. Ann. For. Sci. 2012, 69, 387–397. [Google Scholar] [CrossRef] [Green Version]
- Madrigal, J.; Hernando, C.; Guijarro, M. A new bench-scale methodology for evaluating the flammability of live forest fuels. J. Fire Sci. 2013, 31, 131–142. [Google Scholar] [CrossRef]
- Xanthopoulos, G.; Wakimoto, R. A time to ignition-temperature-moisture relationship for branches of three western conifers. Can. J. For. Res. 1993, 23, 253–258. [Google Scholar] [CrossRef]
- Hachmi, M.; Sesbou, A.; Benjelloun, H.; El Handouz, N.; Bouanane, F. A Simple Technique to Estimate the Flammability Index of Moroccan Forest Fuels. J. Combust. 2011, 2011, 263531. [Google Scholar] [CrossRef]
- Alessio, G.A.; Peñuelas, J.; De Lillis, M.; Llusià, J. Implications of foliar terpene content and hydration on leaf flammability of Quercus ilex and Pinus halepensis: Foliar terpene content and leaf flammability. Plant Biol. 2008, 10, 123–128. [Google Scholar] [CrossRef] [PubMed]
- Ormeño, E.; Céspedes, B.; Sánchez, I.A.; Velasco-García, A.; Moreno, J.M.; Fernandez, C.; Baldy, V. The relationship between terpenes and flammability of leaf litter. For. Ecol. Manag. 2009, 257, 471–482. [Google Scholar] [CrossRef]
- Della Rocca, G.; Madrigal, J.; Marchi, E.; Michelozzi, M.; Moya, B.; Danti, R. Relevance of terpenoids on flammability of Mediterranean species: An experimental approach at a low radiant heat flux. iForest-Biogeosci. For. 2017, 10, 766–775. [Google Scholar] [CrossRef] [Green Version]
- Scarff, F.R.; Westoby, M. Leaf litter flammability in some semi-arid Australian woodlands. Funct. Ecol. 2006, 20, 745–752. [Google Scholar] [CrossRef]
- Kane, J.M.; Varner, J.M.; Hiers, J.K. The burning characteristics of southeastern oaks: Discriminating fire facilitators from fire impeders. For. Ecol. Manag. 2008, 256, 2039–2045. [Google Scholar] [CrossRef]
- Popović, Z.; Bojović, S.; Marković, M.; Cerdà, A. Tree species flammability based on plant traits: A synthesis. Sci. Total Environ. 2021, 800, 149625. [Google Scholar] [CrossRef]
- VWR Barnstead/Thermolyne Small Benchtop Muffle Furnaces, Type 1300 and 1400, Thermo Scientific [Photograph]. Available online: https://us.vwr.com/stibo/low_res/std.lang.all/82/86/4698286.jpg (accessed on 20 September 2022).
- McAllister, S.; Weise, D.R. Effects of Season on Ignition of Live Wildland Fuels Using the Forced Ignition and Flame Spread Test Apparatus. Combust. Sci. Technol. 2017, 189, 231–247. [Google Scholar] [CrossRef]
- Kauf, Z. Testing Vegetation Flammability: Examining Seasonal and Local Differences in Six Mediterranean Species. Ph.D. Thesis, University of Hohenheim, Stuttgart, Germany, 2022; 161. Available online: https://d-nb.info/1113686766/34 (accessed on 30 June 2016).
- White, R.H.; Zipperer, W.C. Testing and classification of individual plants for fire behaviour: Plant selection for the wildland-urban interface. Int. J. Wildland Fire 2010, 19, 213. [Google Scholar] [CrossRef]
- Fares, S.; Bajocco, S.; Salvati, L.; Camarretta, N.; Dupuy, J.-L.; Xanthopoulos, G.; Guijarro, M.; Madrigal, J.; Hernando, C.; Corona, P. Characterizing potential wildland fire fuel in live vegetation in the Mediterranean region. Ann. For. Sci. 2017, 74, 1. [Google Scholar] [CrossRef] [Green Version]
- Romero, B.; Ganteaume, A. Effect of Fire Frequency on the Flammability of Two Mediterranean Pines: Link with Needle Terpene Content. Plants 2021, 10, 2164. [Google Scholar] [CrossRef]
- University of California, Davis, California Soil Resource Lab; University of California, Division of Agriculture and Natural Resources; Natural Resources Conservation Service. SoilWeb. University of California; USDA-NRCS; Berkeley, CA, USA, 2019. Available online: https://data.nal.usda.gov/dataset/soilweb (accessed on 8 December 2021).
- Meinzer, F.C.; Woodruff, D.R.; Marias, D.E.; Mcculloh, K.A.; Sevanto, S. Dynamics of leaf water relations components in co-occurring iso- and anisohydric conifer species: Dynamics of leaf water relations components. Plant Cell Environ. 2014, 37, 2577–2586. [Google Scholar] [CrossRef]
- Weise, D.R.; Hartford, R.A.; Mahaffey, L. Assessing Live Fuel Moisture for Fire Management Applications. In Proceedings of the Tall Timbers Fire Ecology Conference, presented by Tall Timbers Research Station: Tallahassee, FL, USA, 1998. Boise Convention Centre on the Grove, Boise, ID, USA, 7–10 May 1996; presente, 1998; pp. 7–10. [Google Scholar]
- Haase, S.M.; Sánchez, J.; Weise, D.R. Evaluation of Standard Methods for Collecting and Processing Fuel Moisture Samples; Department of Agriculture, Forest Service, Pacific Southwest Research Station: Albany, CA, USA, 2016; PSW-RP-268. [Google Scholar] [CrossRef]
- Fulton, A.; Grant, J.; Buchner, R.; Connell, J. Using the Pressure Chamber for Irrigation Management in Walnut, Almond and Prune. ANR Publication 8503. University of California, Agriculture and Natural Resources: Oakland, CA, USA, 2014. Available online: https://doi.org/10.3733/ucanr.8503 (accessed on 26 October 2022).
- Ganteaume, A.; Jappiot, M.; Lampin, C.; Guijarro, M.; Hernando, C. Flammability of Some Ornamental Species in Wildland–Urban Interfaces in Southeastern France: Laboratory Assessment at Particle Level. Environ. Manag. 2013, 52, 467–480. [Google Scholar] [CrossRef] [PubMed] [Green Version]
- Essaghi, S.; Hachmi, M.; Yessef, M.; Dehhaoui, M.; El Amarty, F. Assessment of Flammability of Moroccan Forest Fuels: New Approach to Estimate the Flammability Index. Forests 2017, 8, 443. [Google Scholar] [CrossRef] [Green Version]
- Batista, A.C.; Biondi, D.; França, A.; de Assunção, R.; Tres, A.; Costa, R.; Travenisk, C.; Kovalsyki, B. Evaluation of the Flammability of Trees and Shrubs Used in the Implementation of Green Barriers in Southern Brazil. In Proceedings of the International Symposium on Fire, Economics, Planning, and Policy: Climate Change and Wildfires, Mexico City, Mexico, 5–11 November 2012; pp. 256–264. [Google Scholar]
- Pausas, J.G.; Alessio, G.A.; Moreira, B.; Corcobado, G. Fires enhance flammability in Ulex parviflorus. New Phytol. 2012, 193, 18–23. [Google Scholar] [CrossRef] [PubMed] [Green Version]
- Pausas, J.G.; Alessio, G.A.; Moreira, B.; Segarra-Moragues, J.G. Secondary compounds enhance flammability in a Mediterranean plant. Oecologia 2016, 180, 103–110. [Google Scholar] [CrossRef]
- Daoud, J.I. Multicollinearity and Regression Analysis. J. Phys. Conf. Ser. 2017, 949, 012009. [Google Scholar] [CrossRef]
- Kim, J.H. Multicollinearity and misleading statistical results. Korean J. Anesthesiol. 2019, 72, 558–569. [Google Scholar] [CrossRef] [Green Version]
- Akaike, H. A new look at the statistical model identification. IEEE Trans. Autom. Control. 1974, 19, 716–723. [Google Scholar] [CrossRef]
- Kuznetsova, A.; Brockhoff, P.B.; Christensen, R.H.B. Lmertest Package: Tests in Linear Mixed Effects Models. J. Stat. Softw. 2017, 82, 1–26. [Google Scholar] [CrossRef] [Green Version]
- Luke, S.G. Evaluating significance in linear mixed-effects models in R. Behav. Res. Methods 2017, 49, 1494–1502. [Google Scholar] [CrossRef] [Green Version]
- Nakagawa, S.; Schielzeth, H. A general and simple method for obtaining R2 from generalized linear mixed-effects models. Methods Ecol. Evol. 2013, 4, 133–142. [Google Scholar] [CrossRef]
- Hohenstein, S.; Kliegl, R. Remef: Remove Partial Effects, R package version 1.0.7. 2022. Available online: https://github.com/hohenstein/remef/ (accessed on 29 March 2023).
- Prior, L.; Murphy, B.; Bowman, D. Conceptualizing Ecological Flammability: An Experimental Test of Three Frameworks Using Various Types and Loads of Surface Fuels. Fire 2018, 1, 14. [Google Scholar] [CrossRef] [Green Version]
- Anderson, H.E. Forest fuel ignitibility. Fire Technol. 1970, 6, 312–319. [Google Scholar] [CrossRef]
- Martin, R.E.; Gordon, D.A.; Gutierrez, M.E.; Lee, D.S.; Molina, D.M.; Schroeder, R.A.; Sapsis, D.B.; Stephens, S.L.; Chambers, M. Assessing the Flammability of Domestic and Wildland Vegetation. In Proceedings of the 12th Conference on Fire and Forest Meteorology, Bethesda, Rockville, MD, USA, 26–28 October 1993; pp. 130–137. [Google Scholar]
- Molina, J.R.; Lora, A.; Prades, C.; Silva, F.R.Y. Roadside vegetation planning and conservation: New approach to prevent and mitigate wildfires based on fire ignition potential. For. Ecol. Manag. 2019, 444, 163–173. [Google Scholar] [CrossRef]
- Montgomery, K.R.; Cheo, P.C. Moisture and salt effects on fire retardance in plants. Am. J. Bot. 1969, 56, 1028–1032. [Google Scholar] [CrossRef]
- Campos-Ruiz, R.; Parisien, M.-A.; Flannigan, M.D. Physicochemical characteristics controlling the flammability of live Pinus banksiana needles in central Alberta, Canada. Int. J. Wildland Fire 2022, 31, 857–870. [Google Scholar] [CrossRef]
- Dewhirst, R.A.; Smirnoff, N.; Belcher, C.M. Pine Species That Support Crown Fire Regimes Have Lower Leaf-Level Terpene Contents Than Those Native to Surface Fire Regimes. Fire 2020, 3, 17. [Google Scholar] [CrossRef]
- Quinn, G.P.; Keough, M.J. Experimental Design and Data Analysis for Biologists; Cambridge University Press: Cambridge, UK, 2002. [Google Scholar]
- Etlinger, M.G.; Beall, F.C. Development of a laboratory protocol for fire performance of landscape plants. Int. J. Wildland Fire 2004, 13, 479. [Google Scholar] [CrossRef]
- De Magalhães, R.M.Q.; Schwilk, D.W. Leaf traits and litter flammability: Evidence for non-additive mixture effects in a temperate forest. J. Ecol. 2012, 100, 1153–1163. [Google Scholar] [CrossRef]
- Grootemaat, S.; Wright, I.J.; Bodegom, P.M.; Cornelissen, J.H.C.; Cornwell, W.K. Burn or rot: Leaf traits explain why flammability and decomposability are decoupled across species. Funct. Ecol. 2015, 29, 1486–1497. [Google Scholar] [CrossRef] [Green Version]
- Krix, D.W.; Murray, B.R. Landscape variation in plant leaf flammability is driven by leaf traits responding to environmental gradients. Ecosphere 2018, 9, 2. [Google Scholar] [CrossRef]
- Mendes-Lopes, J.M.C.; Ventura, J.M.P.; Amaral, J.M.P. Flame characteristics, temperature-time curves, and rate of spread in fires propagating in a bed of Pinus pinaster needles. Int. J. Wildland Fire 2003, 12, 67. [Google Scholar] [CrossRef]
- Engstrom, J.D.; Butler, J.K.; Smith, S.G.; Baxter, L.L.; Fletcher, T.H.; Weise, D.R. Ignition behavior of live California chaparral leaves. Combust. Sci. Technol. 2004, 176, 1577–1591. [Google Scholar] [CrossRef]
- Madrigal, J.; Souto-García, J.; Calama, R.; Guijarro, M.; Picos, J.; Hernando, C. Resistance of Pinus pinea L. bark to fire. Int. J. Wildland Fire 2019, 28, 342. [Google Scholar] [CrossRef]
- Nuñez, M.A.; Chiuffo, M.C.; Pauchard, A.; Zenni, R.D. Making ecology really global. Trends Ecol. Evol. 2021, 36, 766–769. [Google Scholar] [CrossRef] [PubMed]
- Doerr, S.H.; Santín, C. Global trends in wildfire and its impacts: Perceptions versus realities in a changing world. Philos. Trans. R. Soc. B Biol. Sci. 2016, 371, 20150345. [Google Scholar] [CrossRef] [Green Version]
- Van der Werf, G.R.; Randerson, J.T.; Giglio, L.; van Leeuwen, T.T.; Chen, Y.; Rogers, B.M.; Mu, M.; van Marle, M.J.E.; Morton, D.C.; Collatz, G.J.; et al. Global fire emissions estimates during 1997–2016. Earth Syst. Sci. Data 2017, 9, 697–720. [Google Scholar] [CrossRef] [Green Version]
- D’Auria, M.; Racioppi, R. The Effect of Drying of the Composition of Volatile Organic Compounds in Rosmarinus officinalis, Laurus nobilis, Salvia officinalis and Thymus serpyllum: A HS-SPME-GC-MS Study. J. Essent. Oil Bear. Plants 2015, 18, 1209–1223. [Google Scholar] [CrossRef]
- Sellami, I.H.; Wannes, W.A.; Bettaieb, I.; Berrima, S.; Chahed, T.; Marzouk, B.; Limam, F. Qualitative and quantitative changes in the essential oil of Laurus nobilis L. leaves as affected by different drying methods. Food Chem. 2011, 126, 691–697. [Google Scholar] [CrossRef]
- De Gouw, J.A.; Howard, C.J.; Custer, T.G.; Fall, R. Emissions of volatile organic compounds from cut grass and clover are enhanced during the drying process. Geophys. Res. Lett. 1999, 26, 811–814. [Google Scholar] [CrossRef]
- Steckel, V.; Welling, J.; Ohlmeyer, M. Product emissions of volatile organic compounds from convection dried Norway spruce (Picea abies (L.) H. Karst.) timber. Int. Wood Prod. J. 2011, 2, 75–80. [Google Scholar] [CrossRef]
- Dehane, B.; Madrigal, J.; Hernando, C.; Bouhraoua, R.; Guijarro, M. New bench-scale protocols for characterizing bark flammability and fire resistance in trees: Application to Algerian cork. J. Fire Sci. 2015, 33, 202–217. [Google Scholar] [CrossRef]
- Delabraze, P.; Valette, J.-C. Inflammabilité et combustibilité de la végétation forestière méditerranéenne. Rev. For. Française 1974, 26, 171–177. [Google Scholar] [CrossRef] [Green Version]
- Massari, G.; Leopaldi, A. Leaf flammability in Mediterranean species. Plant Biosyst. 1998, 132, 29–38. [Google Scholar] [CrossRef]
- Petriccione, M.; Moro, C.; Rutigliano, F.A. Preliminary studies on litter flammability in Mediterranean region. For. Ecol. Manag. 2006, 234, S128. [Google Scholar] [CrossRef]
- Pellizzaro, G.; Duce, P.; Ventura, A.; Zara, P. Seasonal variations of live moisture content and ignitability in shrubs of the Mediterranean Basin. Int. J. Wildland Fire 2007, 16, 633. [Google Scholar] [CrossRef]
- De Lillis, M.; Bianco, P.M.; Loreto, F. The influence of leaf water content and isoprenoids on flammability of some Mediterranean woody species. Int. J. Wildland Fire 2009, 18, 203. [Google Scholar] [CrossRef]
- Saura-Mas, S.; Paula, S.; Pausas, J.G.; Lloret, F. Fuel loading and flammability in the Mediterranean Basin woody species with different post-fire regenerative strategies. Int. J. Wildland Fire 2010, 19, 783. [Google Scholar] [CrossRef] [Green Version]
- Blackhall, M.; Raffaele, E.; Veblen, T.T. Is foliar flammability of woody species related to time since fire and herbivory in northwest Patagonia, Argentina? J. Veg. Sci. 2012, 23, 931–941. [Google Scholar] [CrossRef]
- Page, W.G.; Jenkins, M.J.; Runyon, J.B. Mountain pine beetle attack alters the chemistry and flammability of lodgepole pine foliage. Can. J. For. Res. 2012, 42, 1631–1647. [Google Scholar] [CrossRef] [Green Version]
- Frejaville, T.; Curt, T.; Carcaillet, C. Bark flammability as a fire-response trait for subalpine trees. Front. Plant Sci. 2013, 4, 466. [Google Scholar] [CrossRef] [Green Version]
- Kauf, Z.; Fangmeier, A.; Rosavec, R.; Španjol, Ž. Testing Vegetation Flammability: The Problem of Extremely Low Ignition Frequency and Overall Flammability Score. J. Combust. 2014, 2014, 970218. [Google Scholar] [CrossRef]
- Moreira, B.; Castellanos, M.C.; Pausas, J.G. Genetic component of flammability variation in a Mediterranean shrub. Mol. Ecol. 2014, 23, 1213–1223. [Google Scholar] [CrossRef] [PubMed] [Green Version]
- Page, W.G.; Jenkins, M.J.; Runyon, J.B. Spruce Beetle-Induced Changes to Engelmann Spruce Foliage Flammability. For. Sci. 2014, 60, 691–702. [Google Scholar] [CrossRef] [Green Version]
- Kauf, Z.; Fangmeier, A.; Rosavec, R.; Španjol, Ž. Seasonal and Local Differences in Leaf Litter Flammability of Six Mediterranean Tree Species. Environ. Manag. 2015, 55, 687–701. [Google Scholar] [CrossRef]
- Fenesi, A.; Saura-Mas, S.; Blank, R.R.; Kozma, A.; Lózer, B.-M.; Ruprecht, E. Enhanced Fire-Related Traits May Contribute to the Invasiveness of Downy Brome (Bromus tectorum). Invasive Plant Sci. Manag. 2016, 9, 182–194. [Google Scholar] [CrossRef] [Green Version]
- Ghermandi, L.; Beletzky, N.A.; de Torres Curth, M.I.; Oddi, F.J. From leaves to landscape: A multiscale approach to assess fire hazard in wildland-urban interface areas. J. Environ. Manag. 2016, 183, 925–937. [Google Scholar] [CrossRef] [PubMed]
- Simpson, K.J.; Ripley, B.S.; Christin, P.; Belcher, C.M.; Lehmann, C.E.R.; Thomas, G.H.; Osborne, C.P. Determinants of flammability in savanna grass species. J. Ecol. 2016, 104, 138–148. [Google Scholar] [CrossRef] [PubMed] [Green Version]
- Molina, J.R.; Martín, T.; Rodríguez y Silva, F.; Herrera, M.Á. The ignition index based on flammability of vegetation improves planning in the wildland-urban interface: A case study in Southern Spain. Landsc. Urban Plan. 2017, 158, 129–138. [Google Scholar] [CrossRef]
- Molina, J.R.; Prades, C.; Lora, Á.; Silva, F.R.Y. Quercus suber cork as a keystone trait for fire response: A flammability analysis using bench and field scales. For. Ecol. Manag. 2018, 429, 384–393. [Google Scholar] [CrossRef]
- Bianchi, L.O.; Oddi, F.J.; Muñoz, M.; Defossé, G.E. Comparison of Leaf Moisture Content and Ignition Characteristics among Native Species and Exotic Conifers in Northwestern Patagonia, Argentina. For. Sci. 2019, 65, 375–386. [Google Scholar] [CrossRef]
- Romero, B.; Fernandez, C.; Lecareux, C.; Ormeño, E.; Ganteaume, A. How terpene content affects fuel flammability of wildland–urban interface vegetation. Int. J. Wildland Fire 2019, 28, 614–627. [Google Scholar] [CrossRef] [Green Version]
- Ganteaume, A.; Romero, B.; Ormeño, E.; Lecareux, C.; Fernandez, C. Does Seasonality of Leaf Terpene Content and Moisture Content Trigger Leaf Flammability Seasonal Variation? 2021; in review, preprint. [Google Scholar] [CrossRef]
- Guerrero, F.; Hernández, C.; Toledo, M.; Espinoza, L.; Carrasco, Y.; Arriagada, A.; Muñoz, A.; Taborga, L.; Bergmann, J.; Carmona, C. Leaf Thermal and Chemical Properties as Natural Drivers of Plant Flammability of Native and Exotic Tree Species of the Valparaíso Region, Chile. Int. J. Environ. Res. Public Health 2021, 18, 7191. [Google Scholar] [CrossRef]
- Gowda, J.H.; Blackhall, M.; Shipley, L.; Kitzberger, T.; Tiribelli, F. Are digestibility and flammability related? Two variables shaping landscape dynamics of Northwestern Patagonian forests. For. Ecol. Manag. 2022, 503, 119810. [Google Scholar] [CrossRef]
- Núñez-Regueira, L.; Rodríguez Añón, J.A.; Castiñeiras, J.P. Calorific values and flammability of forest species in Galicia. Coastal and hillside zones. Bioresour. Technol. 1996, 57, 283–289. [Google Scholar] [CrossRef]
- Burger, N.; Bond, W.J. Flammability traits of Cape shrubland species with different post-fire recruitment strategies. S. Afr. J. Bot. 2015, 101, 40–48. [Google Scholar] [CrossRef]
- Calitz, W.; Potts, A.J.; Cowling, R.M. Investigating species-level flammability across five biomes in the Eastern Cape, South Africa. S. Afr. J. Bot. 2015, 101, 32–39. [Google Scholar] [CrossRef]
- Wyse, S.V.; Perry, G.L.W.; O’Connell, D.M.; Holland, P.S.; Wright, M.J.; Hosted, C.L.; Whitelock, S.L.; Geary, I.J.; Maurin, K.J.L.; Curran, T.J. A quantitative assessment of shoot flammability for 60 tree and shrub species supports rankings based on expert opinion. Int. J. Wildland Fire 2016, 25, 466. [Google Scholar] [CrossRef] [Green Version]
- Battersby, P.F.; Wilmshurst, J.M.; Curran, T.J.; McGlone, M.S.; Perry, G.L.W. Exploring fire adaptation in a land with little fire: Serotiny in Leptospermum scoparium (Myrtaceae). J. Biogeogr. 2017, 44, 1306–1318. [Google Scholar] [CrossRef]
- Padullés Cubino, J.; Buckley, H.L.; Day, N.J.; Pieper, R.; Curran, T.J. Community-level flammability declines over 25 years of plant invasion in grasslands. J. Ecol. 2018, 106, 1582–1594. [Google Scholar] [CrossRef] [Green Version]
- Wyse, S.V.; Perry, G.L.W.; Curran, T.J. Shoot-Level Flammability of Species Mixtures is Driven by the Most Flammable Species: Implications for Vegetation-Fire Feedbacks Favouring Invasive Species. Ecosystems 2018, 21, 886–900. [Google Scholar] [CrossRef] [Green Version]
- Dent, J.; Buckley, H.; Lustig, A.; Curran, T. Flame Temperatures Saturate with Increasing Dead Material in Ulex europaeus, but Flame Duration, Fuel Consumption and Overall Flammability Continue to Increase. Fire 2019, 2, 6. [Google Scholar] [CrossRef] [Green Version]
- Santacruz-García, A.C.; Bravo, S.; del Corro, F.; Ojeda, F. A comparative assessment of plant flammability through a functional approach: The case of woody species from Argentine Chaco region: A comparative assessment of plant flammability. Austral Ecol. 2019, 44, 1416–1429. [Google Scholar] [CrossRef]
- Alam, M.A.; Wyse, S.V.; Buckley, H.L.; Perry, G.L.W.; Sullivan, J.J.; Mason, N.W.H.; Buxton, R.; Richardson, S.J.; Curran, T.J. Shoot flammability is decoupled from leaf flammability, but controlled by leaf functional traits. J. Ecol. 2020, 108, 641–653. [Google Scholar] [CrossRef]
- Cui, X.; Paterson, A.M.; Wyse, S.V.; Alam, A.; Maurin, K.J.L.; Pieper, R.; Cubino, J.P.; O’Connell, D.M.; Donkers, D.; Bréda, J.; et al. Shoot flammability of vascular plants is phylogenetically conserved and related to habitat fire-proneness and growth form. Nat. Plants 2020, 6, 355–359. [Google Scholar] [CrossRef]
- Hawthorne, T. Patterns in Plant Flammability at a Fire-Prone Wildland-Urban Interface in Eastern Australia. Ph.D. Thesis, University of Technology Sydney, Ultimo, Australia, 2020. [Google Scholar]
- Cui, X.; Paterson, A.M.; Perry, G.L.; Wyse, S.V.; Alam, A.; Huang, C.; Zhou, S.; Xiao, L.; Lai, C.; He, F.; et al. Intraspecific variation in shoot flammability in Dracophyllum rosmarinifolium is not predicted by habitat environmental conditions. For. Ecosyst. 2022, 9, 100017. [Google Scholar] [CrossRef]
- Potts, E.; Tng, D.; Apgaua, D.; Curran, T.J.; Engert, J.; Laurance, S.G.W. Growth form and functional traits influence the shoot flammability of tropical rainforest species. For. Ecol. Manag. 2022, 522, 120485. [Google Scholar] [CrossRef]
- Gill, M.; Moore, P. Ignitability of Leaves of Australian Plants; CSIRO: Canberra, Australia, 1996; Volume 34. [Google Scholar]
- Murray, B.R.; Hardstaff, L.K.; Phillips, M.L. Differences in Leaf Flammability, Leaf Traits and Flammability-Trait Relationships between Native and Exotic Plant Species of Dry Sclerophyll Forest. PLoS ONE 2013, 8, e79205. [Google Scholar] [CrossRef] [PubMed] [Green Version]
- Manea, A.; Grootemaat, S.; Leishman, M.R. Leaf flammability and fuel load increase under elevated CO2 levels in a model grassland. Int. J. Wildland Fire 2015, 24, 819. [Google Scholar] [CrossRef]
- Mason, N.W.H.; Frazao, C.; Buxton, R.P.; Richardson, S.J. Fire form and function: Evidence for exaptive flammability in the New Zealand flora. Plant Ecol. 2016, 217, 645–659. [Google Scholar] [CrossRef]
- Grootemaat, S.; Wright, I.J.; van Bodegom, P.M.; Cornelissen, J.H.C.; Shaw, V. Bark traits, decomposition and flammability of Australian forest trees. Aust. J. Bot. 2017, 65, 327. [Google Scholar] [CrossRef]
- Krix, D.W.; Phillips, M.L.; Murray, B.R. Relationships among leaf flammability attributes and identifying low-leaf-flammability species at the wildland–urban interface. Int. J. Wildland Fire 2019, 28, 295. [Google Scholar] [CrossRef]
- Michelaki, C.; Fyllas, N.M.; Galanidis, A.; Aloupi, M.; Evangelou, E.; Arianoutsou, M.; Dimitrakopoulos, P.G. Adaptive flammability syndromes in thermo-Mediterranean vegetation, captured by alternative resource-use strategies. Sci. Total Environ. 2020, 718, 137437. [Google Scholar] [CrossRef] [PubMed]
- ASTM International. E1354 Standard Test Method for Heat and Visible Smoke Release Rates for Materials and Products Using an Oxygen Consumption Calorimeter; ASTM International: West Conshohocken, PA, USA, 2016; Available online: https://www.astm.org/e1354-22b.html (accessed on 20 November 2022).
- Dimitrakopoulos, A.P.; Papaioannou, K.K. Flammability Assessment of Mediterranean Forest Fuels. Fire Technol. 2001, 37, 143–152. [Google Scholar] [CrossRef]
- White, R.H.; Weise, D.R.; Frommer, S. Preliminary Evaluation of the Flammability of Native and Ornamental Plants with the Cone Calorimeter. In Proceedings of the International Conference on Fire Safety, Clarion Hotel, Millbrae, CA, USA, 8–12 January 1996. [Google Scholar]
- White, R.H.; Weise, D.R.; Mackes, K.; Dibble, A.C. Cone Calorimeter Testing of Vegetation: An Update. In Proceedings of the Thirty-Fifth International Conference on Fire Safety, Ramada Plaza Hotel, Colombus, OH, USA, 22–24 July 2002; pp. 1–12. [Google Scholar]
- Weise, D.R.; White, R.H.; Beall, F.C.; Etlinger, M. Use of the cone calorimeter to detect seasonal differences in selected combustion characteristics of ornamental vegetation. Int. J. Wildland Fire 2005, 14, 321. [Google Scholar] [CrossRef] [Green Version]
- Blank, R.R.; White, R.H.; Ziska, L.H. Combustion properties of Bromus tectorum L.: Influence of ecotype and growth under four CO2 concentrations. Int. J. Wildland Fire 2006, 15, 227. [Google Scholar] [CrossRef]
- Dibble, A.C.; White, R.H.; Lebow, P.K. Combustion characteristics of north-eastern USA vegetation tested in the cone calorimeter: Invasive versus non-invasive plants. Int. J. Wildland Fire 2007, 16, 426. [Google Scholar] [CrossRef]
- Belcher, C.M. The influence of leaf morphology on litter flammability and its utility for interpreting palaeofire. Philos. Trans. R. Soc. B Biol. Sci. 2016, 371, 20150163. [Google Scholar] [CrossRef] [PubMed] [Green Version]
- Melnik, O.M.; Paskaluk, S.A.; Ackerman, M.Y.; Melnik, K.O.; Thompson, D.K.; McAllister, S.S.; Flannigan, M.D. New In-Flame Flammability Testing Method Applied to Monitor Seasonal Changes in Live Fuel. Fire 2021, 5, 1. [Google Scholar] [CrossRef]
- Ramadhan, M.L.; Zarate, S.; Carrascal, J.; Osorio, A.F.; Hidalgo, J.P. Effect of fuel bed size and moisture on the flammability of Eucalyptus saligna leaves in cone calorimeter testing. Fire Saf. J. 2020, 120, 103016. [Google Scholar] [CrossRef]
- Belcher, C.M.; Hudspith, V.A. Changes to Cretaceous surface fire behaviour influenced the spread of the early angiosperms. New Phytol. 2017, 213, 1521–1532. [Google Scholar] [CrossRef] [Green Version]
- Madrigal, J.; Hernando, C.; Guijarro, M.; Díez, C.; Marino, E.; De Castro, A.J. Evaluation of Forest Fuel Flammability and Combustion Properties with an Adapted Mass Loss Calorimeter Device. J. Fire Sci. 2009, 27, 323–342. [Google Scholar] [CrossRef]
- Dehane, B.; Hernando, C.; Guijarro, M.; Madrigal, J. Flammability of some companion species in cork oak (Quercus suber L.) forests. Ann. For. Sci. 2017, 74, 60. [Google Scholar] [CrossRef] [Green Version]
- Della Rocca, G.; Danti, R.; Hernando, C.; Guijarro, M.; Madrigal, J. Flammability of Two Mediterranean Mixed Forests: Study of the Non-additive Effect of Fuel Mixtures in Laboratory. Front. Plant Sci. 2018, 9, 825. [Google Scholar] [CrossRef] [PubMed]
- Della Rocca, G.; Danti, R.; Hernando, C.; Guijarro, M.; Michelozzi, M.; Carrillo, C.; Madrigal, J. Terpenoid Accumulation Links Plant Health and Flammability in the Cypress-Bark Canker Pathosystem. Forests 2020, 11, 651. [Google Scholar] [CrossRef]
- Dickinson, K.J.M.; Kirkpatrick, J.B. The Flammability and Energy Content of Some Important Plant Species and Fuel Components in the Forests of Southeastern Tasmania. J. Biogeogr. 1985, 12, 121. [Google Scholar] [CrossRef]
- Owens, M.K.; Lin, C.-D.; Taylor, C.A.; Whisenant, S.G. Seasonal patterns of plant flammability and monoterpenoid content in Juniperus ashei. J. Chem. Ecol. 1998, 24, 2115–2129. [Google Scholar] [CrossRef]
- Sun, L.; Zhou, X.; Mahalingam, S.; Weise, D.R. Comparison of burning characteristics of live and dead chaparral fuels. Combust. Flame 2006, 144, 349–359. [Google Scholar] [CrossRef]
- Plucinski, M.P.; Anderson, W.R. Laboratory determination of factors influencing successful point ignition in the litter layer of shrubland vegetation. Int. J. Wildland Fire 2008, 17, 628. [Google Scholar] [CrossRef]
- Van Altena, C.; van Logtestijn, R.S.P.; Cornwell, W.K.; Cornelissen, J.H.C. Species composition and fire: Non-additive mixture effects on ground fuel flammability. Front. Plant Sci. 2012, 3, 63. [Google Scholar] [CrossRef] [Green Version]
- Clarke, P.J.; Prior, L.D.; French, B.J.; Vincent, B.; Knox, K.J.E.; Bowman, D.M.J.S. Using a rainforest-flame forest mosaic to test the hypothesis that leaf and litter fuel flammability is under natural selection. Oecologia 2014, 176, 1123–1133. [Google Scholar] [CrossRef] [PubMed]
- Santana, V.M.; Marrs, R.H. Flammability properties of British heathland and moorland vegetation: Models for predicting fire ignition. J. Environ. Manag. 2014, 139, 88–96. [Google Scholar] [CrossRef] [Green Version]
- Blauw, L.G.; Wensink, N.; Bakker, L.; Logtestijn, R.S.P.; Aerts, R.; Soudzilovskaia, N.A.; Cornelissen, J.H.C. Fuel moisture content enhances nonadditive effects of plant mixtures on flammability and fire behavior. Ecol. Evol. 2015, 5, 3830–3841. [Google Scholar] [CrossRef] [PubMed]
- Cornwell, W.K.; Elvira, A.; Kempen, L.; Logtestijn, R.S.P.; Aptroot, A.; Cornelissen, J.H.C. Flammability across the gymnosperm phylogeny: The importance of litter particle size. New Phytol. 2015, 206, 672–681. [Google Scholar] [CrossRef]
- Zhao, W.; Cornwell, W.K.; van Pomeren, M.; van Logtestijn, R.S.P.; Cornelissen, J.H.C. Species mixture effects on flammability across plant phylogeny: The importance of litter particle size and the special role for non-Pinus Pinaceae. Ecol. Evol. 2016, 6, 8223–8234. [Google Scholar] [CrossRef] [Green Version]
- Zhao, W.; van Logtestijn, R.S.P.; van Hal, J.R.; Dong, M.; Cornelissen, J.H.C. Non-additive effects of leaf and twig mixtures from different tree species on experimental litter-bed flammability. Plant Soil 2019, 436, 311–324. [Google Scholar] [CrossRef]
- Ellis, P.F. The Aerodynamic and Combustion Characteristics of Eucalypt Bark: A Firebrand Study. Ph.D. Thesis, Australian National University, Canberra, Australia, 2000. [Google Scholar]
- Marino, E.; Guijarro, M.; Hernando, C.; Madrigal, J.; Díez, C. Fire hazard after prescribed burning in a gorse shrubland: Implications for fuel management. J. Environ. Manag. 2011, 92, 1003–1011. [Google Scholar] [CrossRef]
- Jolly, W.M.; Parsons, R.A.; Hadlow, A.M.; Cohn, G.M.; McAllister, S.S.; Popp, J.B.; Hubbard, R.M.; Negron, J.F. Relationships between moisture, chemistry, and ignition of Pinus contorta needles during the early stages of mountain pine beetle attack. For. Ecol. Manag. 2012, 269, 52–59. [Google Scholar] [CrossRef]
- McAllister, S.; Grenfell, I.; Hadlow, A.; Jolly, W.M.; Finney, M.; Cohen, J. Piloted ignition of live forest fuels. Fire Saf. J. 2012, 51, 133–142. [Google Scholar] [CrossRef]
- Sanpakit, C.; Omodan, S.; Weise, D.D.; Princevac, D.M. Laboratory Fire Behavior Measurements of Chaparral Crown Fire. UC Riverside Undergrad J. 2013, 9, 123–129. [Google Scholar]
- Stephens, S.; Gordon, D.; Martin, R. Combustibility of Selected Domestic Vegetation Subjected to Desiccation. In Proceedings of the 12th Conference on Fire and Fire Meteorology, Jekyll Island, GA, USA, 26–28 October 1993; pp. 26–28. [Google Scholar]
- Morandini, F.; Santoni, P.A.; Balbi, J.H. The contribution of radiant heat transfer to laboratory-scale fire spread under the influences of wind and slope. Fire Saf. J. 2001, 36, 519–543. [Google Scholar] [CrossRef]
- Guijarro, M.; Hernando, C.; Díez, C.; Martínez, E.; Madrigal, J.; Cabaret, C.L.; Blanc, L.; Colin, P.Y.; Pérez-Gorostiaga, P.; Vega, J.A.; et al. Flammability of Some Fuel Beds Common in the South-European Ecosystems. In Proceedings of the IV International Conference on Forest Fire Research and Wildland Fire Safety Summit, Luso Coimbra, Portugal, 18–23 November 2002; Volume 9, pp. 152–161. [Google Scholar]
- Ganteaume, A.; Marielle, J.; Corinne, L.-M.; Thomas, C.; Laurent, B. Effects of vegetation type and fire regime on flammability of undisturbed litter in Southeastern France. For. Ecol. Manag. 2011, 261, 2223–2231. [Google Scholar] [CrossRef]
- Ganteaume, A.; Jappiot, M.; Lampin, C. Assessing the flammability of surface fuels beneath ornamental vegetation in wildland–urban interfaces in Provence (south-eastern France). Int. J. Wildland Fire 2012, 22, 333. [Google Scholar] [CrossRef] [Green Version]
- Parsons, A.L.; Balch, J.K.; de Andrade, R.B.; Brando, P.M. The role of leaf traits in determining litter flammability of south-eastern Amazon tree species. Int. J. Wildland Fire 2015, 24, 1143–1153. [Google Scholar] [CrossRef]
- Mutch, R.W. Wildland Fires and Ecosystems—A Hypothesis. Ecology 1970, 51, 1046–1051. [Google Scholar] [CrossRef]
- Taylor, K.L.; Fonda, R.W. Woody fuel structure and fire in subalpine fir forests, Olympic National Park, Washington. Can. J. For. Res. 1990, 20, 193–199. [Google Scholar] [CrossRef]
- Fonda, R.W. Burning Characteristics of Needles from Eight Pine Species. For. Sci. 2001, 47, 390–396. [Google Scholar]
- Engber, E.A.; Varner, J.M. Patterns of flammability of the California oaks: The role of leaf traits. Can. J. For. Res. 2012, 42, 1965–1975. [Google Scholar] [CrossRef]
- Mola, J.M.; Varner, J.M.; Jules, E.S.; Spector, T. Altered Community Flammability in Florida’s Apalachicola Ravines and Implications for the Persistence of the Endangered Conifer Torreya taxifolia. PLoS ONE 2014, 9, e103933. [Google Scholar] [CrossRef] [PubMed] [Green Version]
- Varner, J.M.; Kuljian, H.G.; Kreye, J.K. Fires without tanoak: The effects of a non-native disease on future community flammability. Biol. Invasions 2017, 19, 2307–2317. [Google Scholar] [CrossRef] [Green Version]
- Long, A.J.; Behm, A.; Zipperer, W.C.; Hermansen, A.; Maranghides, A.; Mell, W. Quantifying and Ranking the Flammability of Ornamental Shrubs in the Southern United States. In Proceedings of the 2006 Fire Ecology and Management Congress Proceedings, San Diego, CA, USA, 13–17 November 2006; pp. 13–17. [Google Scholar]
- Zhao, W.; Blauw, L.; van Logtestijn, R.; Cornwell, W.; Cornelissen, J. Interactions between Fine Wood Decomposition and Flammability. Forests 2014, 5, 827–846. [Google Scholar] [CrossRef] [Green Version]
- Plucinski, M. The Investigation of Factors Governing Ignition and Development of Fires in Heathland Vegetation. Ph.D. Thesis, The University of New South Wales, Sydney, Australia, 2003. Available online: https://linkinghub.elsevier.com/retrieve/pii/S096098229770976X (accessed on 24 August 2022).
- Manzello, S.L.; Cleary, T.G.; Shields, J.R.; Yang, J.C. Ignition of mulch and grasses by firebrands in wildland-urban interface fires. Int. J. Wildland Fire 2006, 15, 427. [Google Scholar] [CrossRef] [Green Version]
- Marino, E.; Madrigal, J.; Guijarro, M.; Hernando, C.; Díez, C.; Fernández, C. Flammability descriptors of fine dead fuels resulting from two mechanical treatments in shrubland: A comparative laboratory study. Int. J. Wildland Fire 2010, 19, 314. [Google Scholar] [CrossRef]
- Curt, T.; Schaffhauser, A.; Borgniet, L.; Dumas, C.; Estève, R.; Ganteaume, A.; Jappiot, M.; Martin, W.; N’Diaye, A.; Poilvet, B. Litter flammability in oak woodlands and shrublands of southeastern France. For. Ecol. Manag. 2011, 261, 2214–2222. [Google Scholar] [CrossRef]
- Schemel, C.F.; Simeoni, A.; Biteau, H.; Rivera, J.D.; Torero, J.L. A calorimetric study of wildland fuels. Exp. Therm. Fluid Sci. 2008, 32, 1381–1389. [Google Scholar] [CrossRef] [Green Version]
- Bartoli, P.; Simeoni, A.; Biteau, H.; Torero, J.L.; Santoni, P.A. Determination of the main parameters influencing forest fuel combustion dynamics. Fire Saf. J. 2011, 46, 27–33. [Google Scholar] [CrossRef] [Green Version]
- Simeoni, A.; Thomas, J.C.; Bartoli, P.; Borowieck, P.; Reszka, P.; Colella, F.; Santoni, P.A.; Torero, J.L. Flammability studies for wildland and wildland–urban interface fires applied to pine needles and solid polymers. Fire Saf. J. 2012, 54, 203–217. [Google Scholar] [CrossRef] [Green Version]
- Jervis, F.X.; Rein, G. Experimental study on the burning behaviour of Pinus halepensis needles using small-scale fire calorimetry of live, aged and dead samples. Fire Mater. 2016, 40, 385–395. [Google Scholar] [CrossRef] [Green Version]
- Smith, S. Effects of Moisture on Combustion Characteristics of Live California Chapparal and Utah Foliage. Master’s Thesis, Brigham Young University, Provo, UT, USA, 2005. [Google Scholar]
- Pickett, B.M.; Isackson, C.; Wunder, R.; Fletcher, T.H.; Butler, B.W.; Weise, D.R. Experimental measurements during combustion of moist individual foliage samples. Int. J. Wildland Fire 2010, 19, 153. [Google Scholar] [CrossRef]
- Jones, J.C.; Rahmati, H. The self-heating and ignition of vegetation debris 2. Authentic litter samples. Fuel 1990, 69, 253–255. [Google Scholar] [CrossRef]
- Kauf, Z.; Damsohn, W.; Fangmeier, A. Do relationships between leaf traits and fire behaviour of leaf litter beds persist in time? PLoS ONE 2018, 13, e0209780. [Google Scholar] [CrossRef] [Green Version]
- Gao, X.; Schwilk, D.W. Burn hot or tolerate trees: Flammability decreases with shade tolerance in grasses. Oikos 2022, 2022, e08930. [Google Scholar] [CrossRef]


| Flammability Metric | Top Model(s) | AIC | Marginal R2/ Conditional R2 | |||
|---|---|---|---|---|---|---|
| Epiradiator | Hot Plate | Epi. | Hot Plate | Epiradiator | Hot Plate | |
| Time to Ignition | MPa *** + DW * × sp. | MPa + DW ** × sp. | 651.189 | 723.571 | 0.345/0.420 | 0.482/NA |
| Flame Duration | DW × sp. | DW × sp. | 513.814 | 572.756 | 0.126/0.137 | 0.184/0.335 |
| WW × sp. | WW × sp. | 515.805 | 573.224 | 0.098/NA | 0.192/0.307 | |
| MPa + DW × sp. | 573.969 | 0.192/0.326 | ||||
| Flame Height | MPa + DW × sp. | DW × sp. | 522.753 | 477.555 | 0.187/NA | 0.277/NA |
| DW × sp. | 523.215 | 0.157/NA | ||||
| Glow Duration | MPa + LFM + DW × sp. | MPa + LFM* + DW ** × sp. | 860.247 | 842.114 | 0.322/0.405 | 0.290/0.343 |
| DW × sp. | 860.494 | 0.325/0.402 | ||||
| LFM + DW × sp. | 862.221 | 0.333/0.339 | ||||
| Maximum Temperature | MPa *** + LFM + DW × sp. | MPa *** + DW × sp. | 884.899 | 737.287 | 0.224/NA | 0.404/0.603 |
| MPa ** + DW × sp. | 886.737 | 0.193/NA | ||||
| Post-Flame Glow | MPa + DW × sp. | MPa + DW * × sp. | 828.631 | 809.005 | 0.343/0.419 | 0.289/0.345 |
| Glow to Ignition | MPa + DW × sp. | MPa + LFM + DW ** × sp. | 653.906 | 737.883 | 0.164/NA | 0.256/0.349 |
| LFM + DW ** × sp. | 739.439 | 0.254/0.355 | ||||
| Time to First Glow | WW *** × sp. | MPa ** + DW × sp. | 576.627 | 752.668 | 0.419/0.423 | 0.185/0.287 |
| Epiradiator | Hot Plate | |||||
|---|---|---|---|---|---|---|
| PC1 | PC2 | PC3 | PC1 | PC2 | PC3 | |
| Flame Duration | −0.44 | −0.62 | 0.14 | 0.02 | −0.76 | 0.05 |
| Flame Height | 0.03 | −0.68 | −0.26 | 0.57 | −0.15 | −0.31 |
| Post-flame Glow | −0.90 | −0.08 | −0.10 | 0.09 | 0.07 | −0.94 |
| Time to Ignition | −0.44 | 0.59 | 0.52 | −0.41 | 0.81 | −0.08 |
| Max. Temp. | −0.08 | −0.72 | 0.15 | −0.64 | −0.06 | −0.12 |
| Glow Duration | −0.97 | 0.06 | 0 | −0.34 | −0.02 | −0.89 |
| Glow to Ignition | −0.51 | 0.70 | 0.11 | −0.83 | 0.21 | −0.24 |
| Time to First Glow | 0.01 | −0.06 | −0.96 | −0.54 | 0.62 | 0.19 |
| Proportion of Variance | 33.19% | 25.09% | 16.04% | 30.72% | 21.54% | 17.94% |
| Cumulative Proportion | 33.19% | 58.28% | 74.31% | 30.72% | 52.26% | 70.19% |
Disclaimer/Publisher’s Note: The statements, opinions and data contained in all publications are solely those of the individual author(s) and contributor(s) and not of MDPI and/or the editor(s). MDPI and/or the editor(s) disclaim responsibility for any injury to people or property resulting from any ideas, methods, instructions or products referred to in the content. |
© 2023 by the authors. Licensee MDPI, Basel, Switzerland. This article is an open access article distributed under the terms and conditions of the Creative Commons Attribution (CC BY) license (https://creativecommons.org/licenses/by/4.0/).
Share and Cite
Celebrezze, J.V.; Boving, I.; Moritz, M.A. Tissue-Level Flammability Testing: A Review of Existing Methods and a Comparison of a Novel Hot Plate Design to an Epiradiator Design. Fire 2023, 6, 149. https://doi.org/10.3390/fire6040149
Celebrezze JV, Boving I, Moritz MA. Tissue-Level Flammability Testing: A Review of Existing Methods and a Comparison of a Novel Hot Plate Design to an Epiradiator Design. Fire. 2023; 6(4):149. https://doi.org/10.3390/fire6040149
Chicago/Turabian StyleCelebrezze, Joe V., Indra Boving, and Max A. Moritz. 2023. "Tissue-Level Flammability Testing: A Review of Existing Methods and a Comparison of a Novel Hot Plate Design to an Epiradiator Design" Fire 6, no. 4: 149. https://doi.org/10.3390/fire6040149