Article

Fire Characterization by Using an Original RST-Based Approach for Fire Radiative Power (FRP) Computation

1
Institute of Methodologies for Environmental Analysis, National Research Council, 85050 Tito Scalo, Italy
2
School of Engineering, University of Basilicata, 85100 Potenza, Italy
3
Satellite Technologies Applications Centre (STAC), 85100 Potenza, Italy
*
Author to whom correspondence should be addressed.
Submission received: 23 December 2022 / Revised: 23 January 2023 / Accepted: 25 January 2023 / Published: 26 January 2023
(This article belongs to the Special Issue Remotely Sensed Estimates of Fire Radiative Energy)

Abstract

:
Fire radiative power (FRP) is a basic parameter for fire characterization since it represents the heat emission rate of fires. Moreover, its temporal integration (fire radiative energy, FRE) is used as a proxy for estimating biomass burning and emissions. From satellite, FRP is generally computed by comparing the Medium InfraRed (MIR) signal of the fire pixel with the background value on the event image. Such an approach is possibly affected by some issues due to fire extent, clouds and smoke over the event area. The enlargement of the background window is the commonly used gimmick to face these issues. However, it may include unrepresentative signals of the fire pixel because of very different land use/cover. In this paper, the alternative Background Radiance Estimator by a Multi-temporal Approach (BREMA), based on the Robust Satellite Technique (RST), is proposed to characterize background and compute FRP. The approach is presented using data from the Spinning Enhanced Visible and InfraRed Imager (SEVIRI) onboard the Meteosat Second Generation (MSG) platform. Moreover, BREMA is here combined with the RST-FIRES (RST for FIRES detection) technique for fire pixel identification and the σ-SEVIRI retrieval algorithm for transmittance evaluation. Results compared to the operational SEVIRI-based FRP-PIXEL product, although highly correlated in terms of background radiance (r2 = 0.95) and FRP values (r2 = 0.96), demonstrated a major capability of BREMA to estimate background radiances regardless of cloudiness or smoke presence during the event and independently on fire extent. The possible impact of the proposed approach on the estimates of CO2 emissions was also evaluated for comparison with the Global Fire Emissions Database (GFED4s).

Graphical Abstract

1. Introduction

For decades, satellite remote sensing has been used to characterize fire properties such as temperature, area, biomass burning, and atmospheric emissions (e.g., [1,2,3,4,5]). Indeed, the fire-emitted radiation rate is expected to be related to the rate of biomass consumption and gases, aerosols, and volatile organic compound (VOC) emissions [3]. The first methods used to characterize fires in terms of temperature and fire area (e.g., [1,6]) were based on the differences in brightness temperature in the medium (MIR) and infrared (TIR) bands [7]. However, this bi-spectral method suffers from the effects caused by band-to-band co-registration errors [8] and the uncertain characterization of TIR signals, which is more significant in larger pixels [9]. Errors up to 100 K in temperature and up to 50% in area can occur in the case of a fire occupying a pixel fraction > 0.005; larger errors are expected for smaller fires [10].
Nowadays, based only on the MIR signal, single-band approaches seem to be preferred to characterize fires in terms of fire radiative power (FRP). In fact, FRP has shown great potential for emission modeling applications since it was found to be well correlated with biomass consumed in a fire (e.g., [11]). New methods have been introduced to estimate FRP through an empirical relation (in W/m2 [3]) or an approximation of the Planck function (in W [11,12]). In particular, the latter formulation has become the most widely used approach both for polar (e.g., [9,13,14]) and geostationary (e.g., [15,16,17,18,19]) satellite data. In both these approaches, a background reference signal is required for estimating the rate of the radiative energy emitted from the burning area; it is usually computed considering the radiance measured within spatial windows around the fire pixel(s). In such a computation, signals from cloudy/smoky/water pixels and other hotspots within the selected window are excluded. Therefore, in the case of many excluded pixels, the window size is enlarged to have significant statistics (e.g., up to 15 × 15 for data from the Spinning Enhanced Visible and InfraRed Imager–SEVIRI–on the Meteosat Second Generation–MSG–satellites [20]; rarely up to 50 × 50 pixels for data from the Sea and Land Surface Temperature Radiometer–SLSTR–on Sentinel-3 [9]). Differences in satellite spatial resolution (e.g., typically between instruments on geostationary and polar platforms) may lead to significantly different background characterization when the incremental window is enlarged to search for valid statistics to estimate background [21]. In fact, uncertainty in the background signal may impact FRP calculation and the variability recorded when near-simultaneous FRP from MSG/SEVIRI and the Moderate Resolution Imaging Spectroradiometer (MODIS) on the Earth Observing System (EOS) platforms are compared [22]. However, too large windows may include background signal values that are unrepresentative of the fire pixel area. For example, some authors [23] consider a maximum window of ∼20 km, i.e., “a scale found empirically to be appropriate for preventing false alarms induced by an unrepresentative selection of background pixels.” Inappropriate background characterization may produce significant errors in FRP estimates, particularly in low spatial resolution sensors. Assuming a 10 K colder background, some authors [21] record FRP overestimation up to 80% using data from the Imager on the Geostationary Operational Environmental Satellite (GOES). Vegetation cover differences between the fire pixel and surrounding areas may affect background characterization [21]. Moreover, background characterization depends on fire size and temperature: inaccuracy is more significant when fire size and temperature decrease [11,24].
FRP accurate estimates are critical since FRP temporal integration, i.e., the fire radiative energy (FRE), is considered a valid proxy for atmospheric fire emissions. However, cloud/smoke interference is among the primary sources of error in biomass burning emission estimates [25]. The most drastic situation happens when fires are not detected, occurring under thick clouds and/or smoke; therefore, the FRP value is not computed at all. Although it is impossible to avoid fires being undetected under such circumstances, it is possible to minimize the influence of clouds/smoke in the computation of the reference radiance when fires are still detected, even if under partly smoky/cloudy conditions. An attempt to use a different approach, as compared with the background value from the image of the event, is made by Engel et al. [19]. They propose as background radiance the 99th percentile of MIR current-day data after filtering them to cloud and fire contamination based on information at the same time of day (current day and previous 28 days). However, prolonged cloud coverage over the area of interest could strongly affect such an approach. Although in a different application, the multitemporal method used by Wright and Pilger [26] to quantify the heat flux from an erupting volcano using the Wooster et al. [12] formulation is worth mentioning. Background radiance is selected for each volcano and month of the year using the lowest value of TIR radiance based on a long time series of MODVOLC hotspots after eliminating anomalously low (cloud-contaminated) values. This month-based scheme takes into account seasonal variations in the background signal, even if the radiance of a hotspot cannot be rigorously considered a non-lava-contaminated value.
In this paper, we present an alternative approach, the Background Radiance Estimator by a Multi-temporal Approach (BREMA), based on the Robust Satellite Technique (RST [27,28]). It is proposed to characterize reference radiance for computing FRP, regardless of cloudiness during the event, fire extent, smoke/gas presence, proximity to water bodies, elevation and land cover of the fire area. It may be implemented independently from the specific fire detection algorithm and data used. However, the results presented in this paper were achieved using the Wooster et al. [12] formulation, MSG/SEVIRI data, the RST-FIRES [29] fire detection algorithm, and the σ-SEVIRI forward model [30] for atmospheric transmittance calculation.

2. Materials and Methods
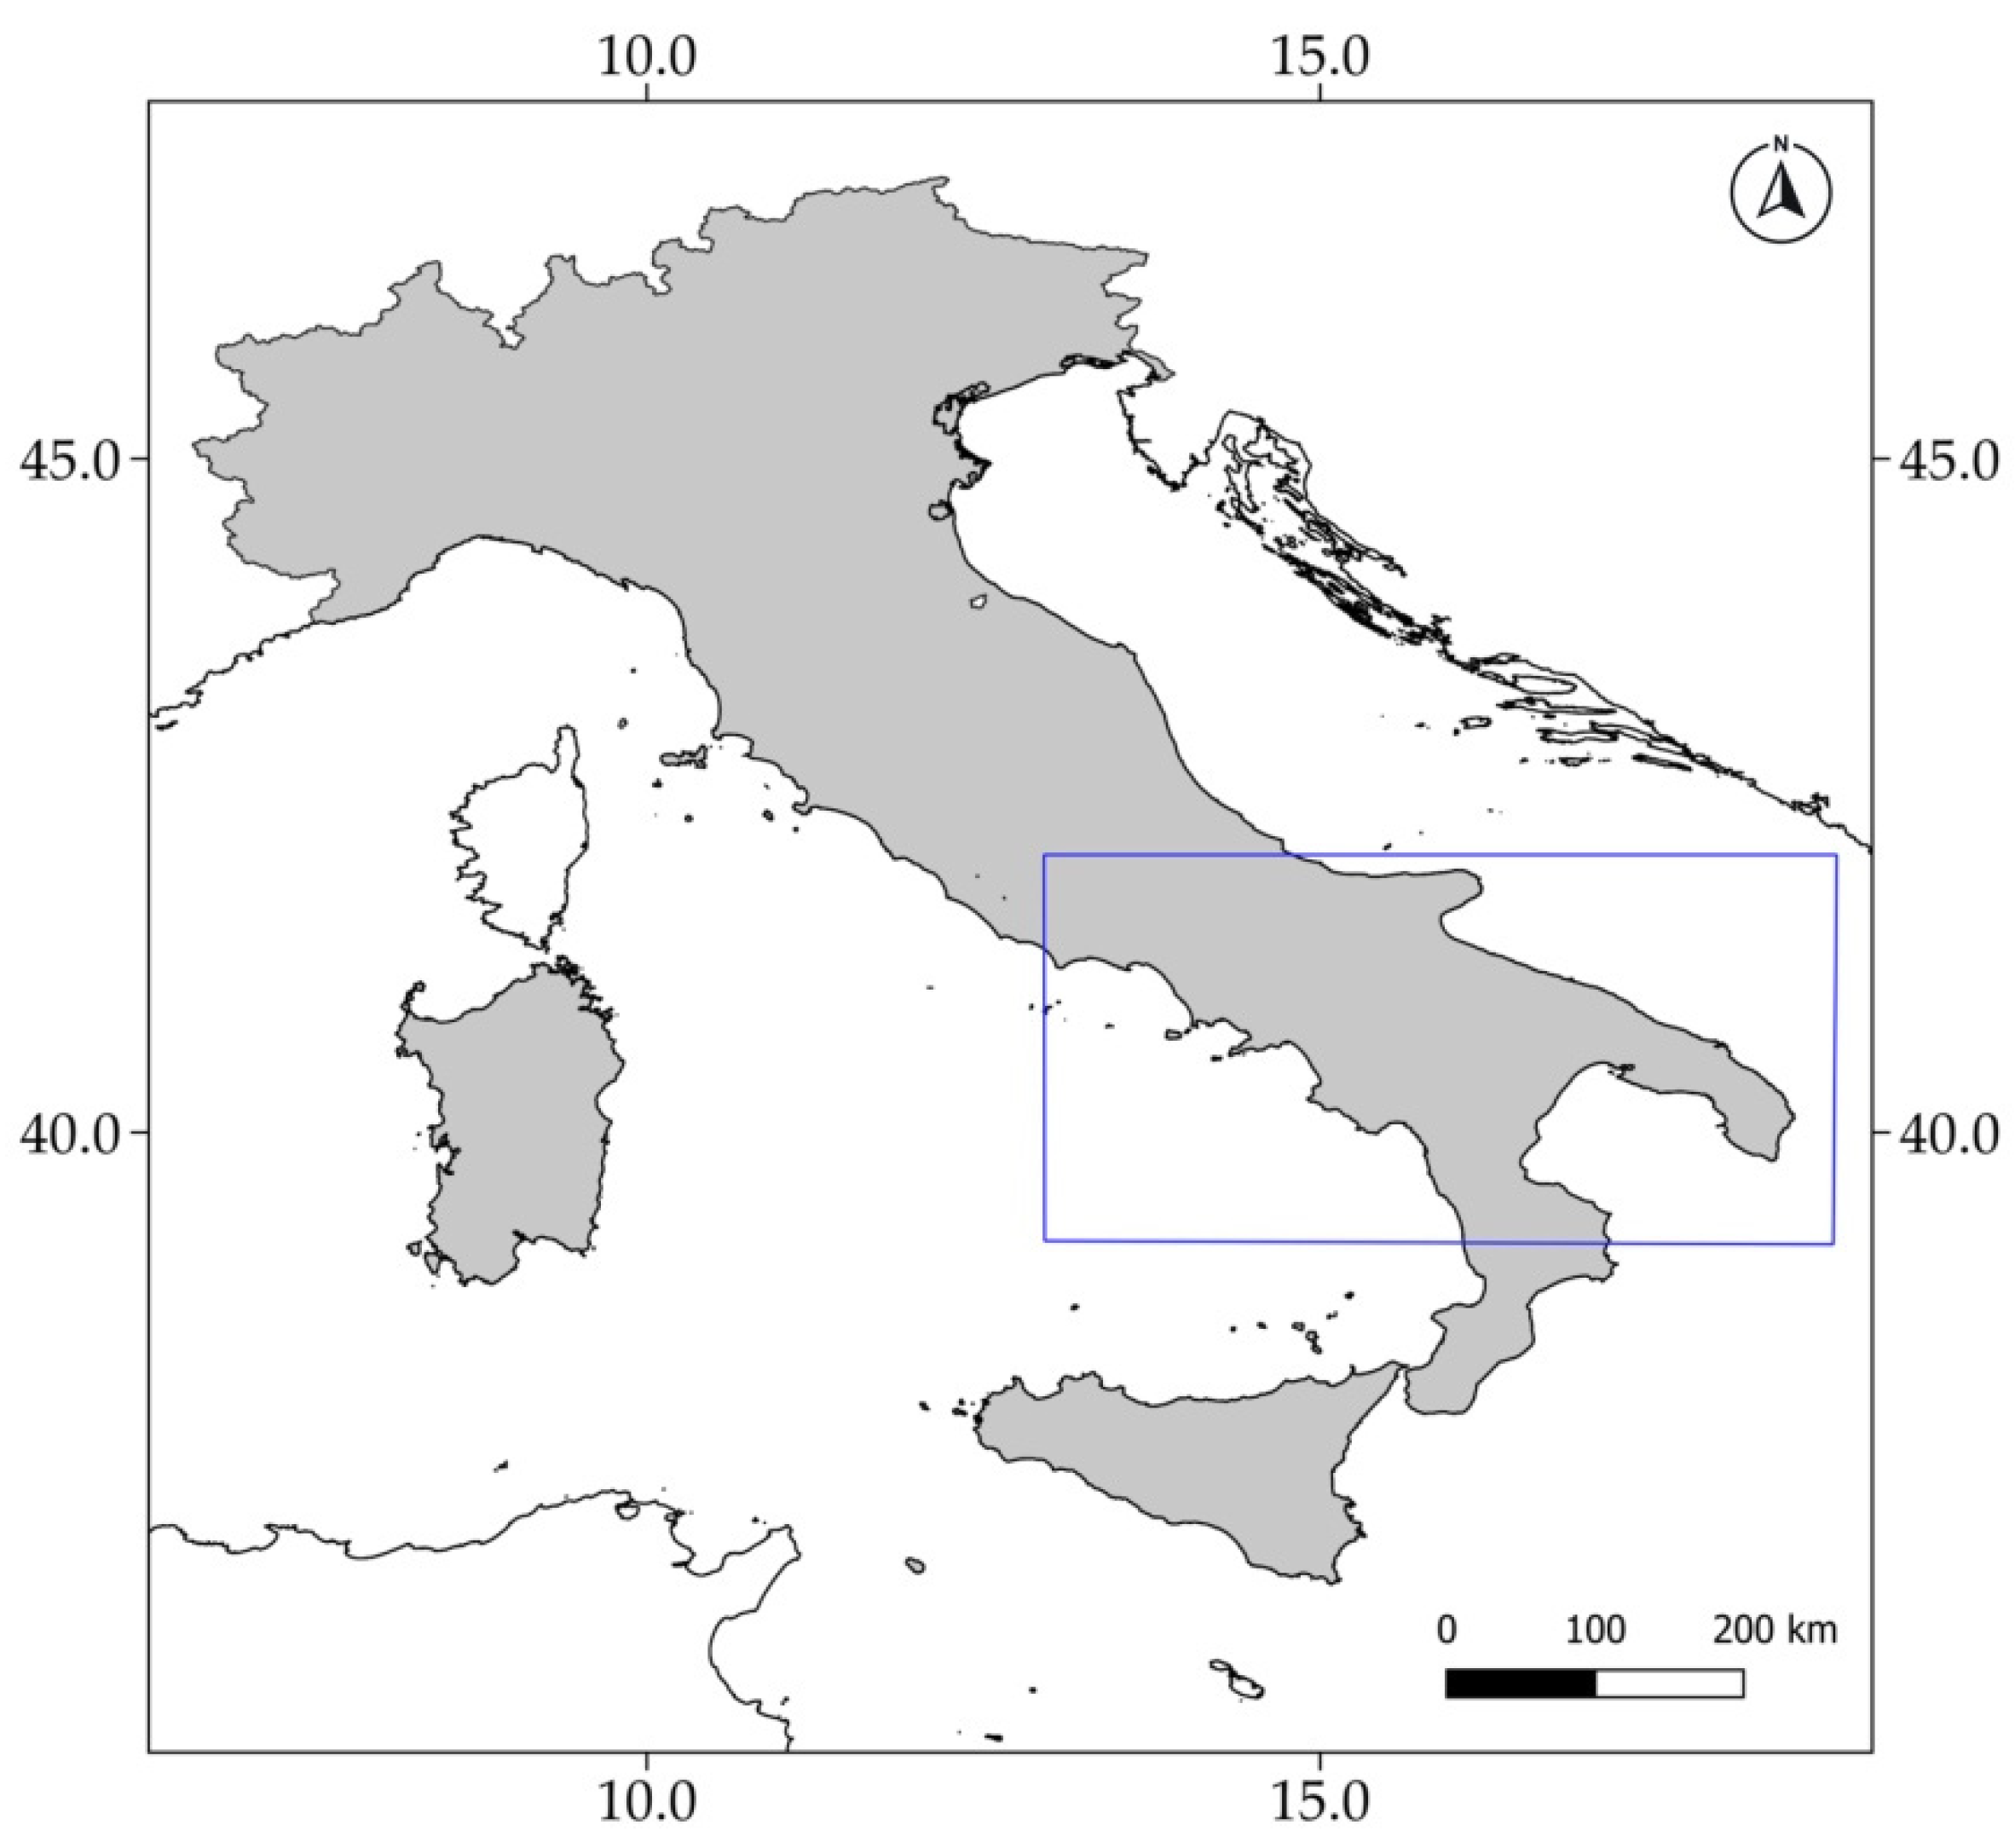
2.1. Study Area

Every year, Italy is greatly affected by fires. Indeed, it is in third place among the European Union countries in terms of burned area, according to the European Forest Fire Information System’s (EFFIS) estimates for 2006–2021 [31]. Southern regions, including Sicily, turned out to be the most affected areas, reporting more than 70% of the burned area in Italy in the period of 2008–2021 [32]. The most significant number of fires occurs in the summer season. For example, 84% of the burned area has been recorded from 2002 to 2019, from June to September [33].
Analyses described in this paper refer to two different areas. A comparison in terms of background radiance was performed over the whole Italian territory, while analyses in terms of FRP and emissions were carried out within a smaller area of interest, which hereafter is indicated as AoI (Figure 1).

2.2. Data

2.2.1. Satellite Data

The analyses were performed using MSG/SEVIRI geostationary satellite data acquired at the EUMETCast reception station of the University of Basilicata. SEVIRI is equipped with twelve channels, from visible to thermal infrared, acquiring every 15 minutes. Apart from the High Resolution Visible (HRV) channel with a sampling distance of 1 km at the nadir, all other SEVIRI channels are acquired at a 3 km spatial sampling distance. SEVIRI is presently flying on two main MSG platforms: Meteosat-11 is the prime service, scanning the full disk, which includes Europe, the Atlantic Ocean, and Africa; Meteosat-9 guarantees the Indian Ocean Data Coverage (IODC) service. A third platform (Meteosat-10) accommodates SEVIRI for the rapid scanning service, which scans a third of Meteosat-11′s full disk every five minutes.
We used SEVIRI Medium InfraRed (MIR, channel 4, centered at 3.9 μm) for fire identification, Visible (VIS, channel 1, centered at 0.6 μm) and Thermal InfraRed (TIR, channel 9, centered at 10.8 μm) for cloud detection.

2.2.2. FRP-PIXEL Product

The FRP-PIXEL product [20,24,34] was used for comparison, being based on MSG/SEVIRI data as well. It is produced by the Satellite Application Facility on Land Surface Analysis (LSA SAF), which is part of the distributed European Organization for the Exploitation of Meteorological Satellites (EUMETSAT) application ground segment. Therefore, FRP-PIXEL may be directly received by the EUMETSAT delivery system (EUMETCast) or downloaded from the LSA SAF website [34]. Although the acquiring station at the University of Basilicata can receive such a product together with raw MSG/SEVIRI data, we preferred to download the product from the LSA SAF website to analyze all available files.
FRP-PIXEL provides information on fire pixels (i.e., pixels associated with the presence of fires) detected every 15 minutes across the full Meteosat disk at the native spatial resolution of the SEVIRI sensor. Fire pixels are identified on the basis of the Fire Thermal Anomaly (FTA) active fire detection scheme [16,24]. Background radiance is computed considering that the closest pixels are the most similar to the “potential” fire in the absence of the fire. A variable window, from 5 × 5 to 15 × 15 pixels, is used to have sufficient samples to estimate background radiance. Within the window, the potential fire pixel and the eight nearest pixels are excluded because they could be affected by the fire radiance. Moreover, a set of conditions is applied to brightness temperature and radiance to exclude land pixels affected by other phenomena (e.g., cloudiness and point spread function effects). When the number of valid land pixels in the background window is less than the minimum percentage (65%), the status flag of the potential fire is “NOBCK” (no background).
The FRP-PIXEL product consists of two hdf5 files: “List Product” and “Quality Product” [20]. The former contains fire radiative power values (“FRP” in MW) of fire pixels together with other information such as the latitude (“LATITUDE”) and longitude (“LONGITUDE”) of the fire pixel center, the column (“ABS_PIXEL”) and line (“ABS_LINE”) number in the SEVIRI native image, the total atmospheric transmittance (“PIXEL ATM TRANS”), the number of valid pixels in the background (“BW_NUMPIX”), the size of the background window (“BW_SIZE”), and the mean radiance of the background window (“RAD_BCK” in mW/(m2 sr cm−1)). The “Quality Product” file records the processing status of all pixels in the full SEVIRI imaging disk.

2.2.3. GFED4.1s

In order to evaluate the impact of different FRP computations on the estimate of fire emissions, the Global Fire Emissions Database (GFED, [35]) was used. It is well known that biomass-burning emission datasets broadly differ from one another [36], but up to now, GFED has been the most used by modeling communities [36]. In particular, we considered Version 4 [37] based both on standard GFED4 burned areas [38] and burned areas boosted by small fires [39], hence the “s” in the GFED4.s’s name. The database provides monthly dry matter (DM) emissions, daily fractions [40], and the contribution of different fire types (e.g., temperate forest fires and agricultural waste burning) to these emissions. They are used to compute trace gas and aerosol emissions using emission factors [41]. Data are distributed as annual hdf5 files [42] from 1997, containing information on the global scale at the spatial resolution of 0.25 degrees.

2.3. Methodology

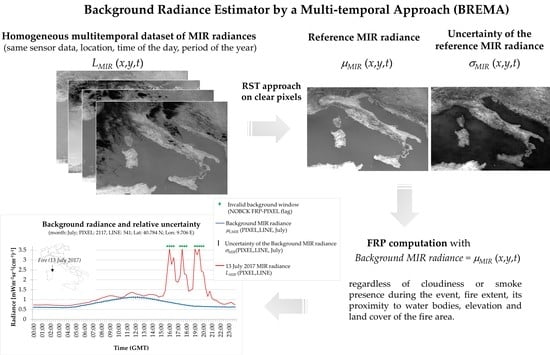
2.3.1. The RST Approach and RST-FIRES

The Robust Satellite Technique (RST, [27,28]) is a change detection scheme based on a multi-temporal analysis of co-located satellite images. This approach identifies as “anomalous” the signal that deviates significantly from its behavior in the normal conditions of the specific place and time of observation and relies on the Absolutely Local Index of Change of the Environment (ALICE):
V ( x , y , t ) = V ( x , y , t ) μ V ( x , y ) σ V ( x , y )
where V(x,y,t) is the value of the V signal, measured at the place with coordinates (x,y) and at the time t. μV(x,y) and σV(x,y) are the temporal mean and standard deviation, respectively, and represent the expected value and the normal variability of the signal V(x,y,t) itself. Henceforth, we will refer to them as “reference fields”. They are computed based on a pluriannual time series of co-located cloud-free satellite records, which are collected following specific homogeneity criteria (i.e., under the same observational conditions such as same platform, time of day, month/season of the year) as the image to be processed. As underlined by independent studies (e.g., [43]), 80 images per month, selected in different years, are sufficient to generate significant and converging statistics for computing RST reference fields.
The RST approach has been applied and validated in different fields of application such as seismic (e.g., [44]), volcanic (e.g., [45]), and hydrological [46] risks, as well as in the context of cloudy-radiance detection [47], Saharan dust (e.g., [48]), gas flaring (e.g., [49]), seawater quality (e.g., [50]), and climate-driven vegetation stress [51] monitoring. Both polar (e.g., EOS/MODIS, The Advanced Very High Resolution Radiometer–AVHRR–onboard the National Oceanic and Atmospheric Administration–NOAA, the Enhanced Thematic Mapper Plus–ETM+–on Landsat7) and geostationary satellite (e.g., the Meteosat Visible and Infrared Imager–MVIRI–onboard the Meteosat First Generation–MFG, the Japanese Advanced meteorological Imager–JAMI–on the Multifunctional Transport Satellites–MTSAT, MSG/SEVIRI) data have been used.
When the RST approach is applied to fire detection and monitoring (RST-FIRES), thermal anomalies are detected using a “thermal” variable as V(x,y,t). It is usually represented by different combinations (in time and space domains) of brightness temperature measures in the MIR channel to highlight both starting fires and ongoing events of different intensity and extent (see [29] for details). RST-FIRES has been applied to detect both winter (e.g., [52,53]) and summer fires (e.g., [29,54,55,56,57]), in different operational contexts, and recently proposed within an integrated satellite system for fire prioritization [58].

2.3.2. Fire Radiative Power Estimate

To compute FRP, we used the formulation proposed in previous studies to characterize active fires with temperatures between ~600 and 1500 K [12]. Indeed, such a formulation has been applied to different satellite sensor data such as EOS/MODIS [14], Sentinel-3/SLSTR [9], the Visible Infrared Imaging Radiometer Suite (VIIRS) on the Suomi National Polar-orbiting Partnership (S-NPP) platform [13] and NOAA-20 [59], the Imager [15] and the Advanced Baseline Imager (ABI) [18] on GOES platforms, the Advanced Himawari Imager (AHI) on the Himawari platform [17,19], the FengYun-2 (FY-2) Stretched Visible and Infrared Spin Scan Radiometer (S-VISSR) [17], the MTSAT imager [17], and MSG/SEVIRI [16]. Therefore, FRP is so computed:
F R P = A p i x e l τ M I R ( σ ε f a ε f , M I R ) ( L M I R L b , M I R )
In Equation (2), Apixel is the pixel area (km2), τMIR is the atmospheric transmittance in the MIR band, σ is the Stefan–Boltzmann constant, εf is the hotspot emissivity over all wavelengths, εf,MIR is the hotspot emissivity in the MIR band, LMIR is the MIR spectral radiance from the hot target, Lb,MIR is the background radiance, and a is a sensor-dependent constant [11,20]. Since the a constant is expressed in Wm−2sr−1µm−1K−4, a preliminary conversion of SEVIRI radiances (expressed in mWm−2sr−1(cm−1)−1) is needed. Moreover, by assuming εf = εf,MIR (gray body), the above-mentioned equation may be simplified [11].
In this work, atmospheric transmittances in MIR are calculated with the radiative transfer model σ-SEVIRI [30]. The methodology in the forward model is based on the one that has been developed for hyperspectral sensors such as the Infrared Atmospheric Sounder Interferometer (IASI [60]), i.e., σ-IASI [61,62,63]. This radiative transfer model has been validated with upwelling and downwelling radiances in the spectral range between 100 to 3000 cm−1 (e.g., see [64,65,66,67,68,69]). σ-IASI is a pseudo-monochromatic radiative transfer model that takes into account both specular and Lambertian reflections. The code is based on an optical depths look-up table and an interpolation procedure. With instruments like SEVIRI, due to the coarser spectral resolution, it is possible to strongly reduce the dimensionality of the data space [70] based on the assumption that any given SEVIRI radiance can be represented as a function of only a few monochromatic quantities or predictors. This assumption saves storage and computational time, making this methodology ready for real-time applications.
To retrieve Lb,MIR, we used an RST-based approach (Background Radiance Estimator by a Multi-temporal Approach—BREMA) with V(x,y,t) ≡ LMIR(x,y,t). First, for each observation time t, the monthly temporal mean of the MIR radiance, μLMIR(x,y,t), and corresponding standard deviation, σLMIR(x,y,t), are computed for each pixel of the scene. This computation is carried out by analyzing a long-term time series of cloud-free LMIR data, selected following the RST homogeneity criteria. Therefore, the background radiance Lb,MIR of the fire pixel centered at (xf,yf), at the time of observation tf, is represented by the mean value, μLMIR(xf,yf,tf), which is historically computed for the specific pixel and time of observation. σLMIR(xf,yf,tf) is the uncertainty associated with μLMIR(xf,yf,tf), and it may be used to evaluate the uncertainty of the FRP estimate. Similarly to the case of reference fields used in other applications, μLMIR(x,y,t) and σLMIR(x,y,t) are computed once and for all, although periodic updates are recommended to take account of possible climate-change-related effects. This approach allows us to calculate background radiance in any conditions, avoiding the enlargement of the window around the fire pixel when the scene is particularly cloudy/smoky or in case of large fires. In this way, BREMA does not need to include radiances from areas that are very different (e.g., in elevation and land cover/use) from the fire pixel. Moreover, unlike the approach based on the event image, there is no risk of underestimating background radiance in case of low values (surrounding the fire pixel) due to specific conditions (e.g., escaped clouds).

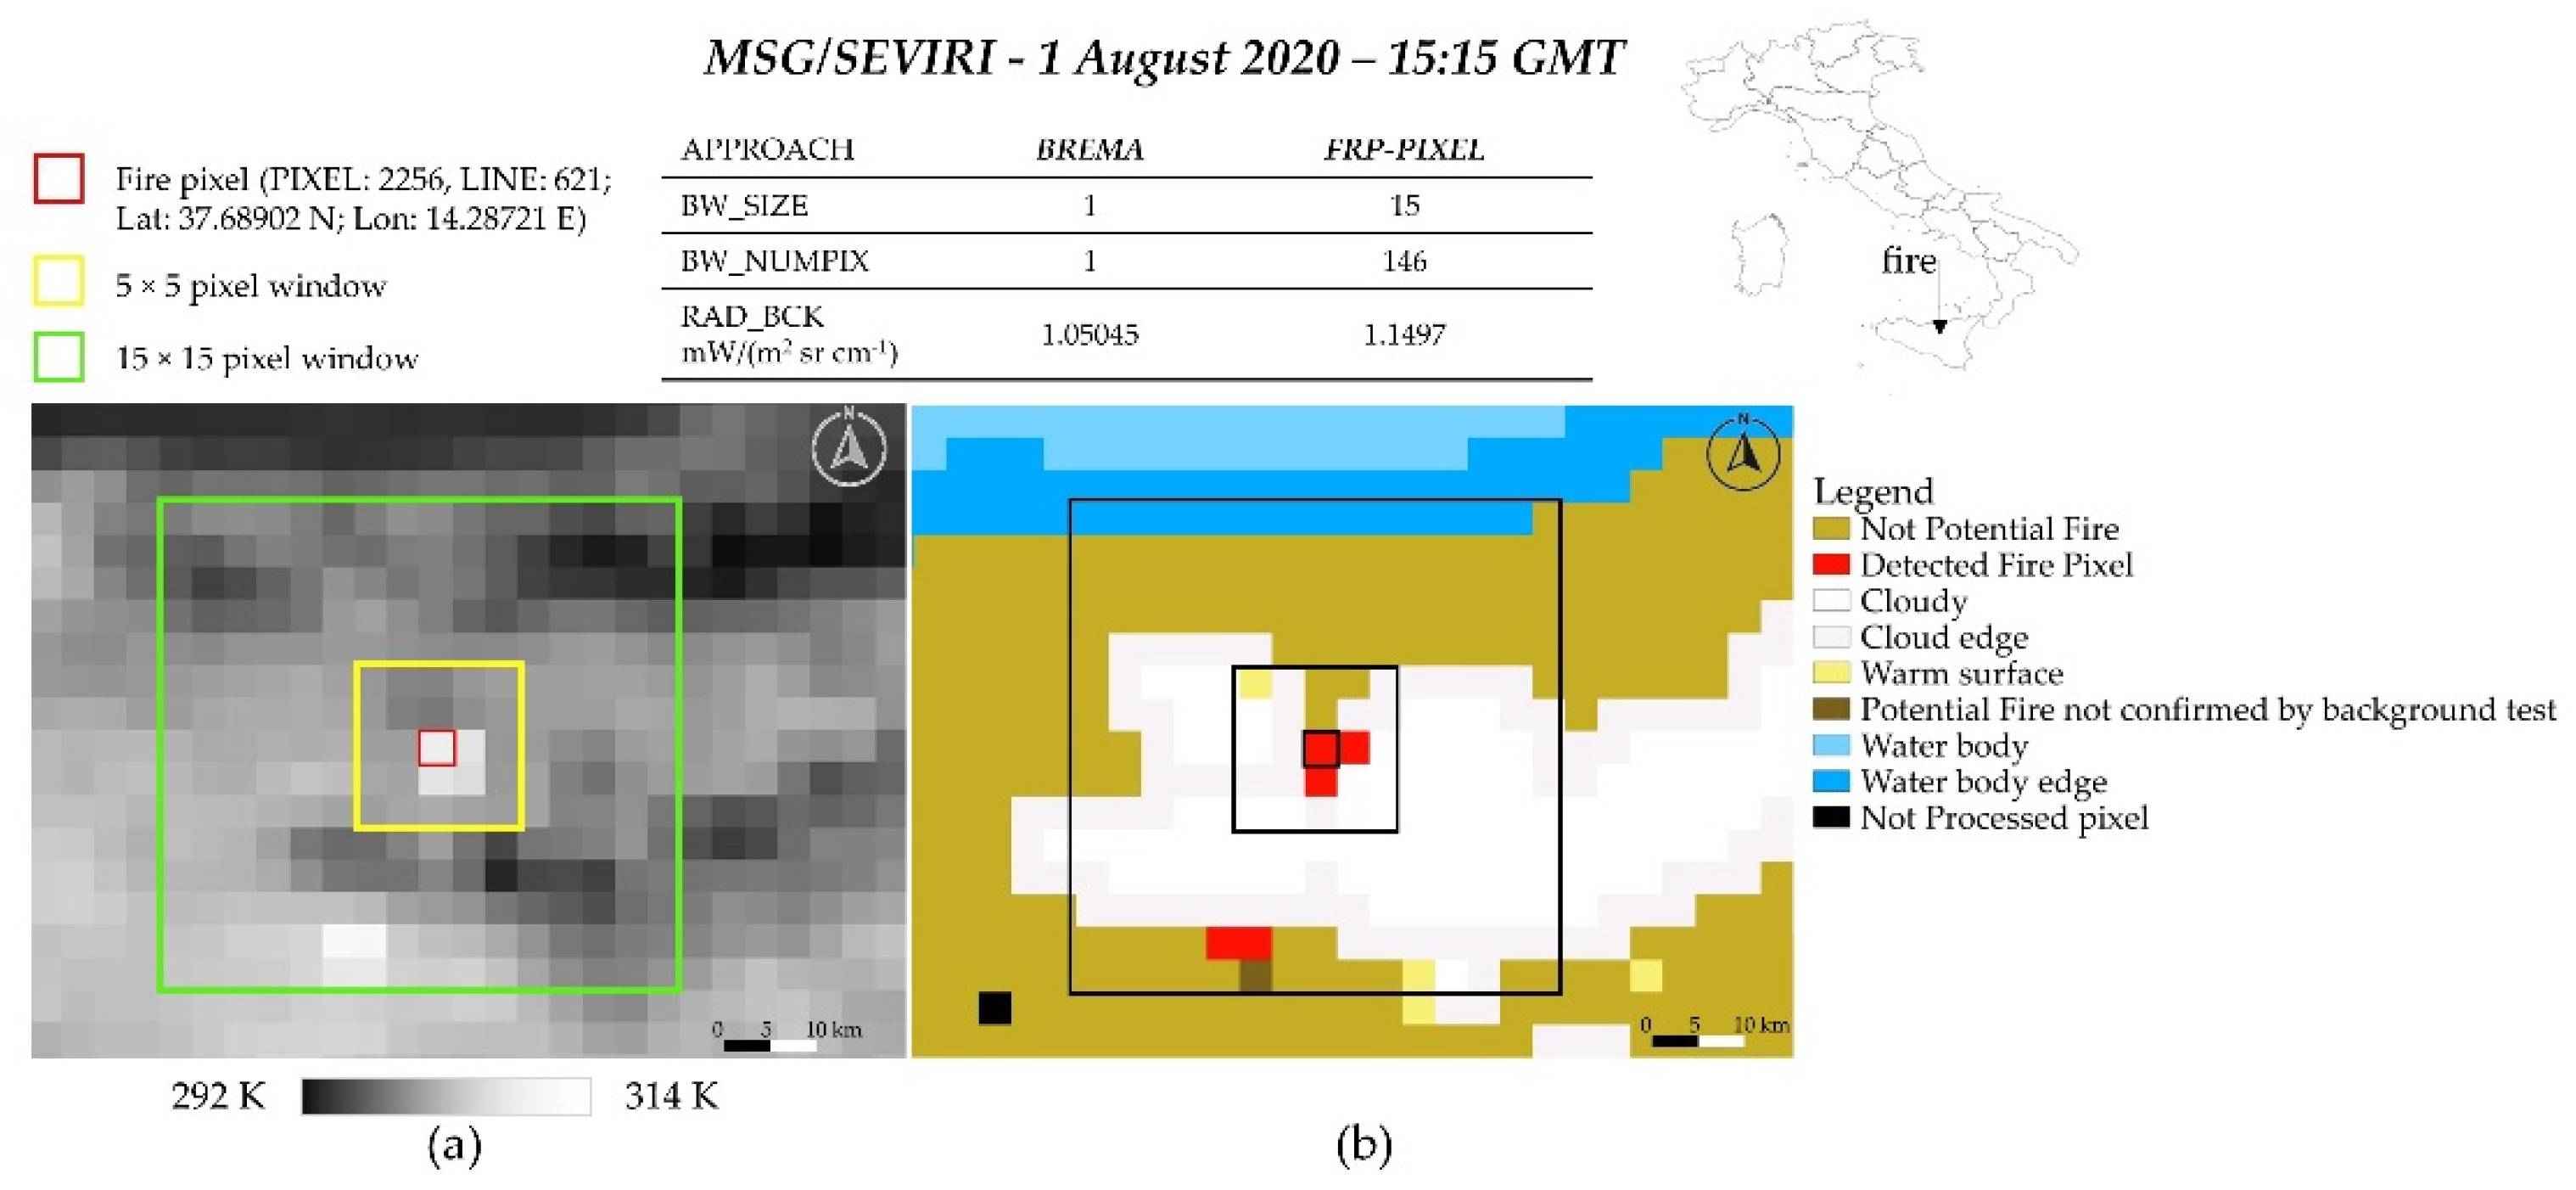
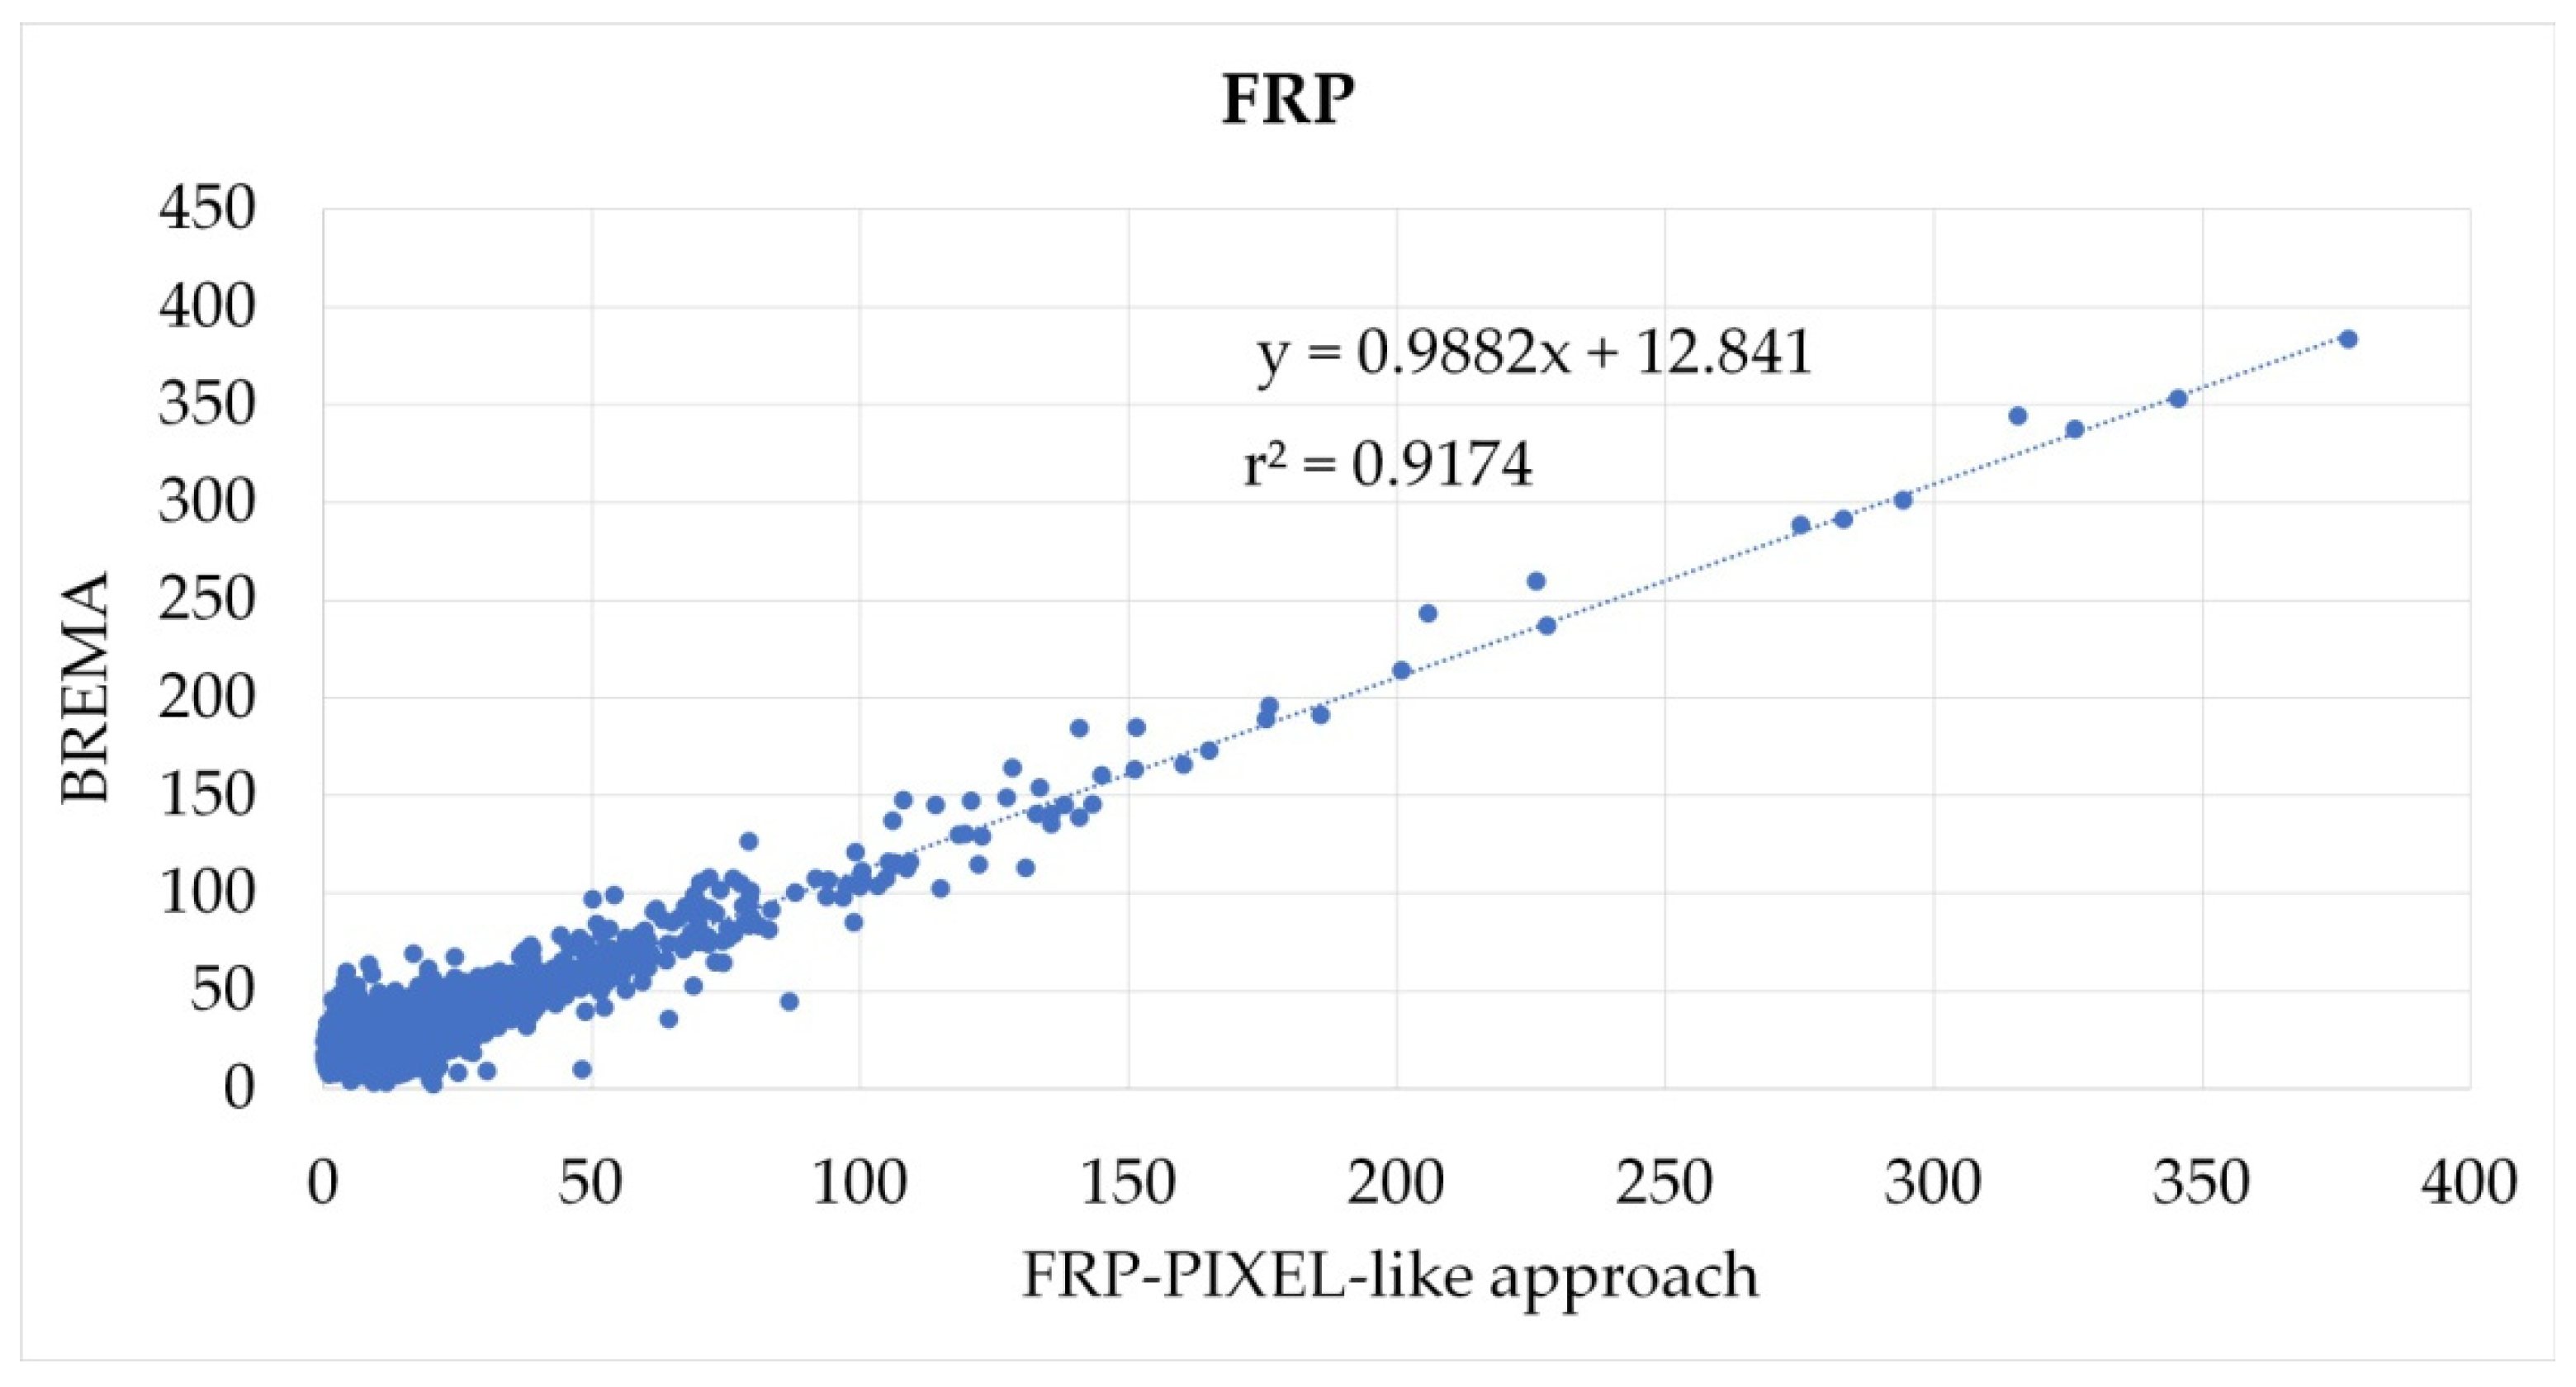
3. Results and Discussions

On the basis of MSG/SEVIRI images from 2004 to 2019, RST-based radiance reference fields, μLMIR(x,y,t), were computed for June, July, August, and September, for each SEVIRI observation time (96 time slots). During their computation, cloudy pixels were excluded using a combination of the One-channel Cloudy-radiance-detection Approach (OCA [47]) and the EUMETSAT CLoud Mask (CLM) product [71]. Specifically, only pixels that were cloud-free for OCA and CLM (or just for OCA, in case of lacking CLM product) were saved for the following processing phases. The iterative kσ clipping procedure described in [27], with k = 2, was applied to exclude anomalously high (e.g., escaped high reflecting clouds and fires) or low (e.g., escaped cold clouds) MIR radiances.
In Equation (2), τMIR was retrieved by using the approach described in Section 2.3.2. In particular, for the AoI in Figure 1, MIR atmospheric transmittances were calculated at SEVIRI spatial resolution for the summer months (June to September) from 2012 to 2020. The calculation was performed for the SEVIRI Vertical Zenith Angle (VZA) using the Operational Analysis of the European Centre for Middle Term Weather Forecast (ECMWF) as the atmospheric state vector. ECMWF operational analysis provides the vertical distribution of temperature, water vapor, and the ozone every 6 hours (00, 06, 12, and 18 UTC). For CO2, a constant mixing ratio value of 405 ppmv was used. τMIR values were selected considering the first available information that immediately precedes the thermal anomaly acquisition time. Spatially, the automatic selection was made considering the SEVIRI pixel center of the thermal anomaly and the nearest available σ-SEVIRI transmittance value on the basis of the haversine formula.
The RST-FIRES methodology was applied to identify thermal anomalies on MSG/SEVIRI images during nine days, from 2012 to 2020, in the summer fire season over the whole Italian territory: 27 June 2012, 30 July 2012, 10 July 2017, 13 July 2017, 16 August 2017, 14 September 2019, 15 September 2019, 1 August 2020, 13 September 2020. FRP was computed for each detected thermal anomaly using Equation (2) and the above-described BREMA scheme. Results were compared with the operational EUMETSAT product FRP-PIXEL [24] based on MSG/SEVIRI as well. For this reason, no corrections/adjustments were necessary differently from evaluations that are carried out with different satellite data (e.g., [16,72]).
A first comparison was carried out over the whole Italian territory in terms of background radiance (BREMA versus the FRP-PIXEL approach), considering space/time corresponding fire pixels detected by both RST-FIRES and FTA schemes. A total of 1078 fire pixels were compared, and a very good correlation (r2 = 0.95) was found (Figure 2).
However, the comparison highlighted that, due to the exclusion of cloudy/hot pixels surrounding the fire pixel, FRP-PIXEL must consider a lower number of valid pixels than the maximum achievable number by the selected window (e.g., Figure 3b) or a larger window when the condition of the minimum pixel number is not verified (e.g., Figure 3a).
Valid pixels corresponding or close to the minimum allowed by the selected window (e.g., 10 pixels if BW_SIZE is 5) is used in the case of huge fires (Figure 4), also to avoid background radiance underestimation, which may derive from low radiance values of surrounding pixels. This effect is due to the digital filter applied to SEVIRI data, which leads to imaging artifacts such as negative lobes of the point spread function (PSF) around the fire pixel [24,73]. A specific test is considered in the FRP-PIXEL background pixel identification to exclude low radiances due to this PSF-negative lobe effect [24]. Due to its construction, BREMA is not affected by this effect.
As mentioned before, in the case of cloudy/smoky conditions, the window size needs to be enlarged when background radiance is computed on the event image. Figure 5 shows an example of the maximum FRP-PIXEL window size during a fire in Sicily (southern Italy) on 1 August 2020.
As already highlighted in Figure 3, Figure 4 and Figure 5, FRP-PIXEL background values are generally greater than BREMA radiances. Considering all 1078 spatially/temporally coincident fire pixels, just in a few cases (4%) their percentage difference (i.e., BREMA minus FRP-PIXEL values, as compared with the FRP-PIXEL value) is negligible (< 1% in absolute value). In more than 90% of cases, the percentage difference is negative and even achieves -30%. Moreover, for all 1078 fire pixels the standard deviation that is associated with each fire pixel, σLMIR(xf,yf,tf), is lower than the difference between the fire pixel radiance, LMIR(xf,yf,tf), and the BREMA reference, μLMIR(xf,yf,tf). In particular, σLMIR(xf,yf,tf) is less than 20% in 89% of cases (Figure 6). This highlights that the uncertainty associated with μLMIR(xf,yf,tf) is quite low.
Figure 7 shows three examples of BREMA background radiances and relative uncertainties corresponding to MSG/SEVIRI pixels affected by fires on 27 June 2012 (Figure 7a), 13 July 2017 (Figure 7b), and 16 August 2017 (Figure 7c). The red line represents the MIR radiance over the fire pixel from 00:00 to 23:45 GMT of the fire day. The abrupt increases in radiance (evident in the first two cases) highlight the fire start and following fresh outbreaks. For each SEVIRI time slot, the MIR radiance is shown together with the corresponding BREMA background radiance (blue line) and relative uncertainty (vertical black bar), which are unique to the specific location and period of the year. Green diamonds indicate time slots when the FRP-PIXEL “Quality Product” flags the SEVIRI pixel as “NOBCK”, i.e., “it was not possible to define the background temperature of the candidate potential fire pixel” [20]. These examples highlight the BREMA capability to provide a background radiance during the whole fire duration, regardless of the presence of clouds around the fire pixel, even in the case of large fires, or when the events occur close to water bodies. By looking at the plots, it is worth noting that missed background radiance computations from FRP-PIXEL occur often during the fire evolution, sometimes with a significant frequency (e.g., 13 times in Figure 7b), with an evident impact on the accuracy of total FRP (i.e., FRE) estimation.
A second analysis was carried out in terms of FRP over the selected AoI (Figure 1). The FRP-PIXEL product was compared on 223 spatially/temporally coincident fire pixels; a very good agreement (r2 = 0.96, Figure 8) was found. However, the FRP values of the EUMETSAT product were higher than FRP RST-FIRES in 94% of fire pixels. This mainly results from the combination of two factors: transmittance value and background radiance computation. The FRP-PIXEL transmittance, linearly interpolated from a predefined look-up table according to the actual water vapor concentration UH2O taken from ECMWF [24], is systematically lower than the transmittance retrieved by σ-SEVIRI. On the other hand, the FRP-PIXEL background radiance is influenced by the used window, size as well as the pixels excluded within such a window during the computation of mean radiance. Excluded pixels, in their turn, depend on the specific fire detection methodology (FTA algorithm) used to identify fire pixels and the cloud detection algorithm (optimization of the MeteoFrance cloud product [24,74]) to identify cloudy pixels. Moreover, the proximity to water further affects the number of valid land pixels used to compute background radiance. Larger differences (even > 360 MW, difference percentages up to 52% in absolute value) are registered by comparing the two products for high FRP values, and specifically due to the presence of saturated pixels. To such pixels, a default radiance value (4.08 mWm−2sr−1(cm−1)−1) is assigned by the FTA algorithm [24], while RST-FIRES simply uses the MIR channel nominal maximum value (i.e., 3.55656 mWm−2sr−1(cm−1)−1). For all these reasons, although the comparison in terms of FRP between RST-FIRES and the EUMETSAT operational product is reported, it may be of little significance. In order to highlight actual differences just depending on the reduction in the number of pixels within the window and/or its possible enlargement due to smoke/clouds/water/hot pixels, a comparison was made using RST-FIRES [29] for fire detection, σ-SEVIRI transmittance [30], and same values for all other parameters in Equation (2) except background radiance value. An approach similar to FRP-PIXEL (hereafter, “FRP-PIXEL-like”) was then simulated, which differs from BREMA just for the background radiance computation. The FRP-PIXEL-like background radiance was calculated on the event image, enlarging the window size from 5 × 5 to 15 × 15, depending on valid land pixels. FRP was computed if at least 65% of pixels were valid after excluding the central thermal anomaly, its eight first neighbor pixels, cloudy pixels, water pixels, and other RST-FIRES thermal anomalies within the window.
The comparison was made over the same area test (AoI), considering all RST-FIRES detections (1210). FRP values are highly correlated (r2 = 0.92, Figure 9).
Differences become more evident when the daily sum of FRP over fires detected within the AoI is considered (Table 1). The comparison with the EUMETSAT operational algorithm is reported as well, even if the differences with the FRP products (BREMA and FRP-PIXEL-like) based on the RST-FIRES algorithm are due to the above-discussed issues. Percentage increase (Column 5) of the FRP calculated with the BREMA scheme (Column 2) with respect to values computed using the FRP-PIXEL-like approach (Column 3) largely varies, from 16% (15 September 2019) to 148% (13 September 2020). Considering all days together, the percentage increase continues to be remarkable (44%). This result would indicate a general underestimation of FRP when the background is computed using the event image.
FRP temporal sum (even if always lower due to possible observational gaps) is proportional to FRE and, consequently, to emissions e.g., [72]. Although out of the scope of the paper, results in Table 1 were compared against CO2 emission estimates to provide a preliminary evaluation of BREMA’s possible impact. The analysis was carried out using the GFED4s database. It was selected because, among the existing biomass burning emission datasets, it “has hitherto been the most widely used by modeling communities”, according to [36]. Moreover, although GFED4s partially depends on MODIS active fire products to derive burned areas for small fires [36], it is a bottom-up approach (i.e., based on burned area) and, therefore, less dependent on FRP as compared with top-down approaches (i.e., derived from FRP values), which are at the base of other fire emission databases such as GFAS [5] and QFED [75]. This makes GFED4s emissions particularly suitable to be used in comparison with the results of the BREMA in the framework of a top-down approach.
Daily BREMA FRP sums (Figure 10) are in good agreement with GFED4 CO2 emissions (r2 = 0.61) and better correlated than values based on the FRP-PIXEL-like approach (r2 = 0.53), which (as already shown in Table 1) seems to systematically underestimate FRP sums due to the “contextual” scheme used for background radiance estimation.

4. Conclusions

In this paper, we presented an innovative approach, named BREMA, to compute the reference radiance to be used for estimating FRP as an alternative to the background value obtained by a “contextual” approach, i.e., from a spatial window around the fire pixel on the same image of the event. BREMA is based on the RST scheme [27,28], which is here used to completely characterize each satellite image pixel in terms of MIR radiance. By construction, the RST approach allows us to take into account the elevation and seasonal land cover of the fire area without using any additional external data. The pixel-based radiance characterization allows us to have a reference radiance for each pixel without taking care of surrounding pixels, even when the scene is particularly cloudy/smoky, in case of large fires or when events occur close to the sea or lakes. Moreover, we do not risk underestimating background radiance, as the approach based on the event image does, in case of low anomalous values due to specific conditions (e.g., escaped clouds) or sensor data (e.g., negative lobes around hot pixels over SEVIRI images). In addition, the proposed approach permits us to avoid enlarging the background window and including radiances from areas that are very different from (and thus, not representative of) the fire pixel. Moreover, the proposed approach represents a significant simplification in FRP computation, as the background radiance is preliminarily retrieved and does not need to be calculated each time a new FRP value is required. A possible limitation of the proposed methodology could be related to very rare and uncommon meteorological conditions, making the multitemporal background radiance not fully representative of the fire image characteristics. However, the periodic and systematic update of RST-based reference fields, including the most recent (often warmest) years, may take into account these possible climate change effects.
We presented results using MSG/SEVIRI data over the whole Italian territory and a smaller area in southern Italy (AoI, Figure 1), analyzing thermal anomalies detected by RST-FIRES and FTA (by means of the operational FRP-PIXEL product) during nine days, from 2012 to 2020, from June to September.
The comparison, in terms of background radiance, over the whole Italian territory, between the proposed approach and that used in the EUMETSAT FRP-PIXEL product highlighted a high correlation (r2 = 0.95). The comparison in terms of FRP values was presented over the AoI, and newly a strong correlation was found (r2 = 0.96). However, differences in the parameters used in Eq. 2 (e.g., transmittance and saturated pixel radiance), in addition to the dissimilar background radiance computation, do not allow the extraction of specific information from FRP value comparison. For these reasons, the actual difference in FRP values just due to the different background radiance computation was highlighted using RST-FIRES (as a fire detection method [29]); transmittance values computed with σ-SEVIRI [30], BREMA and an FRP-PIXEL-like approach for background radiance estimate. Notwithstanding the high correlation (r2 = 0.92) between FRP values derived from the two different approaches, large percentage increases (up to 148%) were registered considering the FRP daily sum for each analyzed day. Even considering all nine analyzed days together, we recorded an increase of 44% when BREMA reference radiance, in place of the FRP-PIXEL-like approach, was used. This would indicate an underestimation of FRP in the case of background radiance computed by a contextual method like FRP-PIXEL. This underestimation can affect fire emission estimates based on FRE, as shown by comparing the daily sum of FRP based on BREMA and the FRP-PIXEL-like approach with corresponding GFED4s daily CO2 emission estimates.
Finally, some considerations should be made about the portability of the proposed approach. It was tested considering the Wooster et al. [12] formulation since it is more widely used, although it may be exploited, for example, in the Kaufman et al. [3] formulation. In the latter case, MIR brightness temperature, rather than radiance, should be spatially and temporally characterized following RST rules [27,28]. Moreover, we presented results based on MSG/SEVIRI geostationary data. Still, the approach may be easily applied to data from polar satellites, thanks to the intrinsic (and already tested) exportability of the RST methodology regarding different sensors. This could allow us to use the same approach for FRP estimates and then use one of the proposed methodologies to integrate polar-orbiting and geostationary-derived FRP (e.g., [72]). Such a fusion could indeed be important in improving estimates of fire emissions [25], in addition to an FRP computation that is less dependent on clouds, smoke, and fire extent.

Author Contributions

Conceptualization, C.F. and C.P.; methodology, C.F., G.M. (Guido Masiello), G.M. (Giuseppe Mazzeo) and V.T.; software, C.P.; validation, A.F. and C.F.; formal analysis, T.L., F.M. and G.M. (Giuseppe Mazzeo); writing—original draft preparation, C.F. and C.P.; writing—review and editing, N.P. and G.M. (Guido Masiello); supervision, C.S., V.T. and N.P.; funding acquisition, N.P. All authors have read and agreed to the published version of the manuscript.

Funding

This research was carried out in the framework of the project ‘OT4CLIMA’, which was funded by the Italian Ministry of Education, University and Research (D.D. 2261 del 6.9.2018, PON R&I 2014–2020 and FSC). Project cod. ARS01_00405.

Institutional Review Board Statement

Not applicable.

Informed Consent Statement

Not applicable.

Data Availability Statement

Emission data from GFED4s are available at https://www.geo.vu.nl/~gwerf/GFED/GFED4/ (accessed on 22 December 2022). LANDSAF FRP-PIXEL product is available at https://landsaf.ipma.pt/en/products/fire-products/frppixel/ (accessed on 22 December 2022).

Acknowledgments

This research was carried out in the framework of the project ‘OT4CLIMA’, which was funded by the Italian Ministry of Education, University and Research (D.D. 2261 del 6.9.2018, PON R&I 2014–2020 and FSC). The authors wish to thank EUMETSAT and the Aeronautica Militare Italiana for their support in having access to the MSG/SEVIRI data used in this work. Access to the ECMWF database was obtained with the ECMWF Meteorological Archival and Retrieval System (MARS).

Conflicts of Interest

The authors declare no conflict of interest.

References

  1. Matson, M.; Holben, B. Satellite detection of tropical burning in Brazil. Int. J. Remote Sens. 1987, 8, 509–516. [Google Scholar] [CrossRef]
  2. Kaufman, Y.J.; Tucker, C.J.; Fung, I. Remote sensing of biomass burning in the tropics. J. Geophys. Res. 1990, 95, 9927–9939. [Google Scholar] [CrossRef]
  3. Kaufman, Y.J.; Justice, C.O.; Flynn, L.P.; Kendall, J.D.; Prins, E.M.; Giglio, L.; Ward, D.E.; Menzel, W.P.; Setzer, A.W. Potential global fire monitoring from EOS-MODIS. J. Geophys. Res. 1998, 103, 32215–32238. [Google Scholar] [CrossRef]
  4. Setzer, A.W.; Pereira, M.C. Amazon biomass burnings in 1987 and an estimate of their tropospheric emissions. Ambio 1991, 20, 19–22. [Google Scholar]
  5. Kaiser, J.W.; Heil, A.; Andreae, M.O.; Benedetti, A.; Chubarova, N.; Jones, L.; Morcrette, J.-J.; Razinger, M.; Schultz, M.G.; Suttie, M.; et al. Biomass burning emissions estimated with a global fire assimilation system based on observed fire radiative power. Biogeosciences 2012, 9, 527–554. [Google Scholar] [CrossRef] [Green Version]
  6. Prins, E.M.; Menzel, W.P. Geostationary satellite detection of biomass burning in South America. Int. J. Remote Sens. 1992, 13, 2783–2799. [Google Scholar] [CrossRef]
  7. Dozier, J. A method for satellite identification of surface temperature fields of subpixel resolution. Remote Sens. Environ. 1981, 11, 221–229. [Google Scholar] [CrossRef]
  8. Shephard, M.W.; Kennelly, E.J. Effect of band-to-band coregistration on fire property retrievals. IEEE Trans. Geosci. Remote Sens. 2003, 41, 2648–2661. [Google Scholar] [CrossRef]
  9. Wooster, M.J.; Xu, W. Sentinel-3 Optical Products and Algorithm Definition SLSTR ATBD Fire Product; Version 3.2, Ref: S3-L2-Sd-03-T04-Kcl-Atbd, 10 October 2012; King’s College: London, UK, 2012. [Google Scholar]
  10. Giglio, L.; Kendall, J.D. Application of the Dozier retrieval to wildfire characterization. A sensitivity analysis. Remote Sens. Environ. 2001, 77, 34–49. [Google Scholar] [CrossRef]
  11. Wooster, M.J.; Roberts, G.; Perry, G.L.W.; Kaufman, Y.J. Retrieval of biomass combustion rates and totals from fire radiative power observations: FRP derivation and calibration relationships between biomass consumption and fire radiative energy release. J. Geophys. Res. 2005, 110, D24311. [Google Scholar] [CrossRef]
  12. Wooster, M.J.; Zhukov, B.; Oertel, D. Fire radiative energy for quantitative study of biomass burning: Derivation from the BIRD experimental satellite and comparison to MODIS fire products. Remote Sens. Environ. 2003, 86, 83–107. [Google Scholar] [CrossRef]
  13. Csiszar, I.; Schroeder, W.; Giglio, L.; Mikles, V.; Tsidulko, M. The NOAA Active Fire EDR External Users Manual, Version 1.6, Date: 6 October 2016. Available online: https://www.star.nesdis.noaa.gov/jpss/documents/UserGuides/VIIRS_ActiveFire_EUM.pdf (accessed on 15 July 2022).
  14. Giglio, L.; Schroeder, W.; Justice, C.O. The collection 6 MODIS active fire detection algorithm and fire products. Remote Sens. Environ. 2016, 178, 31–41. [Google Scholar] [CrossRef] [PubMed] [Green Version]
  15. Xu, W.; Wooster, M.J.; Roberts, G.; Freeborn, P. New GOES imager algorithms for cloud and active fire detection and fire radiative power assessment across North, South and Central America. Remote Sens. Environ. 2010, 114, 1876–1895. [Google Scholar] [CrossRef]
  16. Wooster, M.J.; Roberts, G.; Freeborn, P.H.; Xu, W.; Govaerts, Y.; Beeby, R.; He, J.; Lattanzio, A.; Fisher, D.; Mullen, R. LSA SAF Meteosat FRP products–Part 1: Algorithms, product contents, and analysis. Atmos. Chem. Phys. 2015, 15, 13217–13239. [Google Scholar] [CrossRef] [Green Version]
  17. Xu, W.; Wooster, M.J.; Kaneko, T.; He, J.; Zhang, T.; Fisher, D. Major advances in geostationary fire radiative power (FRP) retrieval over Asia and Australia stemming from use of Himarawi-8 AHI. Remote Sens. Environ. 2017, 193, 138–149. [Google Scholar] [CrossRef] [Green Version]
  18. Xu, W.; Wooster, M.J.; He, J.; Zhang, T. Improvements in high-temporal resolution active fire detection and FRP retrieval over the Americas using GOES-16 ABI with the geostationary Fire Thermal Anomaly (FTA) algorithm. Sci. Remote Sens. 2021, 3, 100016. [Google Scholar] [CrossRef]
  19. Engel, C.B.; Jones, S.D.; Reinke, K.J. Fire Radiative Power (FRP) Values for Biogeographical Region and Individual Geostionary HHMMSS Threshold (BRIGHT) Hotspots Derived from the Advanced Himawari Imager (AHI). Remote Sens. 2022, 14, 2540. [Google Scholar] [CrossRef]
  20. EUMETSAT—LSASAF. Product User Manual—Fire Radiative Power (FRP) (LSA-502 and LSA-503)–FRP Climate Data Records (LSA-550 and LSA-551). 2019. Available online: https://nextcloud.lsasvcs.ipma.pt/s/pnDEepeq8zqRyrq (accessed on 22 December 2022).
  21. Schroeder, W.; Csiszar, I.; Giglio, L.; Schmidt, C.C. On the use of fire radiative power, area, and temperature estimates to characterize biomass burning via moderate to coarse spatial resolution remote sensing data in the Brazilian Amazon. J. Geophys. Res. 2010, 115, D21121. [Google Scholar] [CrossRef] [Green Version]
  22. Roberts, G.; Wooster, M.J.; Xu, W.; Freeborn, P.H.; Morcrette, J.-J.; Jones, L.; Benedetti, A.; Jiangping, H.; Fisher, D.; Kaiser, J.W. LSA SAF Meteosat FRP products–Part 2: Evaluation and demonstration for use in the Copernicus Atmosphere Monitoring Service (CAMS). Atmos. Chem. Phys. 2015, 15, 13241–13267. [Google Scholar] [CrossRef] [Green Version]
  23. Giglio, L.; Descloitres, J.; Justice, C.O.; Kaufman, Y.J. An enhanced contextual fire detection algorithm for MODIS. Remote Sens. Environ. 2003, 87, 273–282. [Google Scholar] [CrossRef]
  24. Govaerts, Y.; Wooster, M.; Roberts, G.; Freeborn, P.; Xu, W.; He, J.; Lattanzio, A. Algorithm Theoretical Basis Document for MSG SEVIRI FIRE RADIATIVE POWER (FRP) Characterisation; FRP: LSA-502 (FRP-PIXEL), LSA-503 (FRP-GRID), LSA-550(FRP-PIXEL-R), LSA-551 (FRP-GRID-R); EUM/MET/SPE/06/0398; EUMESTAT: Darmstadt, Germany, 2015. [Google Scholar]
  25. Pereira, G.; Longo, K.M.; Freitas, S.R.; Mataveli, G.; Oliveira, V.J.; Santos, P.R.; Rodrigues, L.F.; Cardozo, F.S. Improving the south America wildfires smoke estimates: Integration of polar-orbiting and geostationary satellite fire products in the Brazilian biomass burning emission model (3BEM). Atmos. Environ. 2022, 273, 118954. [Google Scholar] [CrossRef]
  26. Wright, R.; Pilger, E. Radiant flux from Earth’s subaerially erupting volcanoes. Int. J. Remote Sens. 2008, 29, 6443–6466. [Google Scholar] [CrossRef]
  27. Tramutoli, V. Robust AVHRR Techniques (RAT) for Environmental Monitoring: Theory and Applications. In Proceedings of the SPIE 3496, Earth Surface Remote Sensing II, Barcelona, Spain, 11 December 1998; pp. 101–113. [Google Scholar]
  28. Tramutoli, V. Robust Satellite Techniques (RST) for Natural and Environmental Hazards Monitoring and Mitigation: Theory and Applications. In Proceedings of the 2007 International Workshop on the Analysis of Multi-Temporal Remote Sensing Images, Leuven, Belgium, 18–20 July 2007. [Google Scholar]
  29. Filizzola, C.; Corrado, R.; Marchese, F.; Mazzeo, G.; Paciello, R.; Pergola, N.; Tramutoli, V. RST-FIRES, an exportable algorithm for early-fire detection and monitoring: Description, implementation, and field validation in the case of the MSG-SEVIRI sensor. Remote Sens. Environ. 2017, 192, e2–e25. [Google Scholar] [CrossRef]
  30. Masiello, G.; Serio, C.; Venafra, S.; Poutier, L.; Göttsche, F.-M. SEVIRI Hyper-Fast Forward Model with Application to Emissivity Retrieval. Sensors 2019, 19, 1532. [Google Scholar] [CrossRef] [PubMed] [Green Version]
  31. EFFIS Estimates for European Union. Available online: https://effis.jrc.ec.europa.eu/apps/effis.statistics/estimates/EU/2022/2006/2021 (accessed on 7 November 2022).
  32. Report Incendi, Italia in Fumo. Available online: https://www.legambiente.it/rapporti/report-incendi-italia-in-fumo/ (accessed on 7 November 2022).
  33. GWIS Country Profile. Available online: https://gwis.jrc.ec.europa.eu/apps/country.profile/chartsba (accessed on 7 November 2022).
  34. Fire Radiative Power Pixel (FRP-PIXEL). Available online: https://landsaf.ipma.pt/en/products/fire-products/frppixel/ (accessed on 23 November 2022).
  35. Global Fire Emissions Database (GFED). Available online: http://www.globalfiredata.org/ (accessed on 19 September 2022).
  36. Pan, X.; Ichoku, C.; Chin, M.; Bian, H.; Darmenov, A.; Colarco, P.; Ellison, L.; Kucsera, T.; da Silva, A.; Wang, J.; et al. Six global biomass burning emission datasets: Intercomparison and application in one global aerosol model. Atmos. Chem. Phys. 2020, 20, 969–994. [Google Scholar] [CrossRef] [Green Version]
  37. Van der Werf, G.R.; Randerson, J.T.; Giglio, L.; van Leeuwen, T.T.; Chen, Y.; Rogers, B.M.; Mu, M.; van Marle, M.J.E.; Morton, D.C.; Collatz, G.J.; et al. Global fire emissions estimates during 1997–2016. Earth Syst. Sci. Data 2017, 9, 697–720. [Google Scholar] [CrossRef] [Green Version]
  38. Giglio, L.; Randerson, J.T.; van der werf, G.R. Analysis of daily, monthly, and annual burned area using the fourth-generation global fire emissions database (GFED4). J. Geophys. Res. Biogeosci. 2013, 118, 317–328. [Google Scholar] [CrossRef] [Green Version]
  39. Randerson, J.T.; Chen, Y.; van der Werf, G.R.; Rogers, B.M.; Morton, D.C. Global burned area and biomass burning emissions from small fires. J. Geophys. Res. Biogeosci. 2012, 117, G04012. [Google Scholar] [CrossRef] [Green Version]
  40. Mu, M.; Randerson, J.T.; van der Werf, G.R.; Giglio, L.; Kasibhatla, P.; Morton, D.; Collatz, G.J.; Defries, R.S.; Hyer, E.J.; Prins, E.M.; et al. Daily and 3-hourly variability in global fire emissions and consequences for atmospheric model predictions of carbon monoxide. J. Geophys. Res. Biogeosci. 2011, 116, D24303. [Google Scholar] [CrossRef]
  41. GFED Emission Factors. Available online: https://www.geo.vu.nl/~gwerf/GFED/GFED4/ancill/GFED4_Emission_Factors.txt (accessed on 26 October 2022).
  42. GFED Data. Available online: https://www.geo.vu.nl/~gwerf/GFED/GFED4/ (accessed on 26 October 2022).
  43. Koeppen, W.C.; Pilger, E.; Wright, R. Time series analysis of infrared satellite data for detecting thermal anomalies: A hybrid approach. Bull. Volcanol. 2011, 73, 577–593. [Google Scholar] [CrossRef]
  44. Filizzola, C.; Corrado, A.; Genzano, N.; Lisi, M.; Pergola, N.; Colonna, R.; Tramutoli, V. RST Analysis of Anomalous TIR Sequences in Relation with Earthquakes Occurred in Turkey in the Period 2004–2015. Remote Sens. 2022, 14, 381. [Google Scholar] [CrossRef]
  45. Marchese, F.; Lacava, T.; Pergola, N.; Katsumi, H.; Miraglia, E.; Tramutoli, V. Inferring phases of thermal unrest at Mt. Asama (Japan) from infrared satellite observations. J. Volcanol. Geotherm. Res. 2012, 237–238, 10–18. [Google Scholar] [CrossRef]
  46. Lacava, T.; Filizzola, C.; Pergola, N.; Sannazzaro, F.; Tramutoli, V. Improving flood monitoring by the Robust AVHRR technique (RAT) approach: The case of the April 2000 Hungary flood. Int. J. Remote Sens. 2010, 31, 2043–2062. [Google Scholar] [CrossRef]
  47. Cuomo, V.; Filizzola, C.; Pergola, N.; Pietrapertosa, C.; Tramutoli, V. A self-sufficient approach for cloudy radiances detection. Atmos. Res. 2004, 72, 39–56. [Google Scholar] [CrossRef]
  48. Marchese, F.; Sannazzaro, F.; Falconieri, A.; Filizzola, C.; Pergola, N.; Tramutoli, V. An Enhanced Satellite-Based Algorithm for Detecting and Tracking Dust Outbreaks by Means of SEVIRI Data. Remote Sens. 2017, 9, 537. [Google Scholar] [CrossRef] [Green Version]
  49. Faruolo, M.; Coviello, I.; Filizzola, C.; Lacava, T.; Pergola, N.; Tramutoli, V. A satellite-based analysis of the Val d’Agri Oil Center (southern Italy) gas flaring emissions. Nat. Hazards Earth Syst. Sci. 2014, 14, 2783–2793. [Google Scholar] [CrossRef] [Green Version]
  50. Lacava, T.; Ciancia, E.; Coviello, I.; Di Polito, C.; Grimaldi, C.S.L.; Pergola, N.; Satriano, V.; Temimi, M.; Zhao, J.; Tramutoli, V. A MODIS-based robust satellite technique (RST) for timely detection of oil spilled areas. Remote Sens. 2017, 9, 128. [Google Scholar] [CrossRef] [Green Version]
  51. Filizzola, C.; Carlucci, M.A.; Genzano, N.; Ciancia, E.; Lisi, M.; Pergola, N.; Ripullone, F.; Tramutoli, V. Robust Satellite-Based Identification and Monitoring of Forests Having Undergone Climate-Change-Related Stress. Land 2022, 11, 825. [Google Scholar] [CrossRef]
  52. Mazzeo, G.; Marchese, F.; Filizzola, C.; Pergola, N.; Tramutoli, V. A Multi-Temporal Robust Satellite Technique (RST) for Forest Fire Detection. In Proceedings of the 2007 International Workshop on the Analysis of Multi-temporal Remote Sensing Images, Leuven, Belgium, 18–20 July 2007; IEEE: New York, NY, USA, 2007. [Google Scholar] [CrossRef]
  53. Marchese, F.; Mazzeo, G.; Filizzola, C.; Coviello, I.; Falconieri, A.; Lacava, T.; Paciello, R.; Pergola, N.; Tramutoli, V. Issues and Possible Improvements in Winter Fires Detection by Satellite Radiances Analysis: Lesson Learned in Two Regions of Northern Italy. IEEE J. Sel. Top. Appl. Earth Obs. Remote Sens. 2017, 10, 3297–3313. [Google Scholar] [CrossRef]
  54. Baldassarre, G.; Benigno, G.; Corrado, R.; Coviello, I.; Filizzola, C.; Lacava, T.; Marchese, F.; Mazzeo, G.; Paciello, R.; Pergola, N.; et al. Assessment of the Robust Satellite Technique (RST) in Real Time Detection of Summer Fires. In Proceedings of the Fifth International Workshop on the Analysis of Multitemporal Remote Sensing Images, Groton, CT, USA, 28–30 July 2009; Civco, D.L., Ed.; pp. 216–223. [Google Scholar]
  55. Mazzeo, G.; Baldassarre, G.; Corrado, R.; Filizzola, C.; Genzano, N.; Marchese, F.; Paciello, R.; Pergola, N.; Tramutoli, V. Assessment of a Robust Satellite Technique for Forest Fire Detection and Monitoring by Using a Total Validation Approach. In Proceedings of the 33rd International Symposium on Remote Sensing of Environment (ISRSE33), Stresa, Italy, 4–8 May 2009; pp. 607–610. [Google Scholar]
  56. Filizzola, C.; Baldassarre, G.; Benigno, G.; Corrado, R.; Coviello, I.; Lacava, T.; Marchese, F.; Mazzeo, G.; Paciello, R.; Pergola, N.; et al. Automatic RST-Based System for a Rapid Detection of Fires. In Proceedings of the VI International Conference on Forest Fire Research (ICFFR), Coimbra, Portugal, 15–18 November 2010. [Google Scholar]
  57. Marchese, F.; Corrado, R.; Filizzola, C.; Mazzeo, G.; Paciello, R.; Pergola, N.; Tramutoli, V. On the Potential of Robust Satellite Techniques (RST-FIRES) for Forest Fire Detection and Monitoring. In Proceedings of the VI International Conference on Forest Fire Research (ICFFR), Coimbra, Portugal, 15–18 November 2010. [Google Scholar]
  58. Mazzeo, G.; De Santis, F.; Falconieri, A.; Filizzola, C.; Lacava, T.; Lanorte, A.; Marchese, F.; Nolè, G.; Pergola, N.; Pietrapertosa, C.; et al. Integrated Satellite System for Fire Detection and Prioritization. Remote Sens. 2022, 14, 335. [Google Scholar] [CrossRef]
  59. Schroeder, W.; Giglio, L.; Csiszar, I.; Tsidulko, M. Algorithm Theoretical Basis Document for NOAA NDE VIIRS I-band (375m) Active Fire; National Oceanic and Atmospheric Administration: Washington, DC, USA, 2020. [Google Scholar]
  60. Hilton, F.; Armante, R.; August, T.; Barnet, C.; Bouchard, A.; Camy-Peyret, C.; Capelle, V.; Clarisse, L.; Clerbaux, C.; Coheur, P.-F.; et al. Hyperspectral Earth Observation from IASI: Five Years of Accomplishments. Bull. Amer. Meteor. 2012, 93, 347–370. [Google Scholar] [CrossRef]
  61. Amato, U.; Masiello, G.; Serio, C.; Viggiano, M. The σ-IASI Code for the Calculation of Infrared Atmospheric Radiance and Its Derivatives. Environ. Model. Softw. 2002, 17, 651–667. [Google Scholar] [CrossRef]
  62. Liuzzi, G.; Masiello, G.; Serio, C.; Meloni, D.; Di Biagio, C.; Formenti, P. Consistency of Dimensional Distributions and Refractive Indices of Desert Dust Measured over Lampedusa with IASI Radiances. Atmos. Meas. Tech. 2017, 10, 599–615. [Google Scholar] [CrossRef] [Green Version]
  63. Martinazzo, M.; Magurno, D.; Cossich, W.; Serio, C.; Masiello, G.; Maestri, T. Assessment of the Accuracy of Scaling Methods for Radiance Simulations at Far and Mid Infrared Wavelengths. J. Quant. Spectrosc. Radiat. Transf. 2021, 271, 107739. [Google Scholar] [CrossRef]
  64. Masiello, G.; Serio, C.; Carissimo, A.; Grieco, G.; Matricardi, M. Application of φ-IASI to IASI: Retrieval Products Evaluation and Radiative Transfer Consistency. Atmos. Chem. Phys. 2009, 9, 8771–8783. [Google Scholar] [CrossRef] [Green Version]
  65. Masiello, G.; Matricardi, M.; Serio, C. The Use of IASI Data to Identify Systematic Errors in the ECMWF Forecasts of Temperature in the Upper Stratosphere. Atmos. Chem. Phys. 2011, 11, 1009–1021. [Google Scholar] [CrossRef] [Green Version]
  66. Masiello, G.; Serio, C.; Esposito, F.; Palchetti, L. Validation of Line and Continuum Spectroscopic Parameters with Measurements of Atmospheric Emitted Spectral Radiance from Far to Mid Infrared Wave Number Range. J. Quant. Spectrosc. Radiat. Transf. 2012, 113, 1286–1299. [Google Scholar] [CrossRef]
  67. Liuzzi, G.; Masiello, G.; Serio, C.; Palchetti, L.; Bianchini, G. Validation of H2O Continuum Absorption Models in the Wave Number Range 180–600 cm−1 with Atmospheric Emitted Spectral Radiance Measured at the Antarctica Dome-C Site. Opt. Express 2014, 22, 16784. [Google Scholar] [CrossRef]
  68. Aumann, H.H.; Chen, X.; Fishbein, E.; Geer, A.; Havemann, S.; Huang, X.; Liu, X.; Liuzzi, G.; DeSouza-Machado, S.; Manning, E.M.; et al. Evaluation of Radiative Transfer Models With Clouds. J. Geophys. Res. Atmos. 2018, 123, 6142–6157. [Google Scholar] [CrossRef] [Green Version]
  69. Serio, C.; Masiello, G.; Camy-Peyret, C.; Liuzzi, G. CO2 Spectroscopy and Forward/Inverse Radiative Transfer Modelling in the Thermal Band Using IASI Spectra. J. Quant. Spectrosc. Radiat. Transf. 2019, 222–223, 65–83. [Google Scholar] [CrossRef]
  70. Liuzzi, G.; Masiello, G.; Serio, C.; Blasi, M.G.; Venafra, S. Hyper Fast Radiative Transfer for the Physical Retrieval of Surface Parameters from SEVIRI Observations. J. Phys. Conf. Ser. 2015, 633, 012059. [Google Scholar] [CrossRef] [Green Version]
  71. EUMETSAT–MSG Meteorological Products Extraction Facility Algorithm Specification Document; v7B e-signed. EUM/MSG/SPE/022; EUMESTAT: Darmstadt, Germany, 2015.
  72. Li, F.; Zhang, X.; Roy, D.P.; Kondragunta, S. Estimation of biomass-burning emissions by fusing the fire radiative power retrievals from polar-orbiting and geostationary satellites across the conterminous United States. Atmos. Environ. 2019, 211, 274–287. [Google Scholar] [CrossRef]
  73. SAF for Land Surface Analysis (LSA SAF)–Validation Report Fire Radiative Power (LSA-502 and LSA-503); SAF/LAND/IM/VR_FRP/V_10; EUMETSAT: Darmstadt, Germany, 2015.
  74. MeteoFrance. Algorithm Theoretical Basis Document for Cloud Products; Technical Report SAF/NWC/CDOP/MFL/SCI/ATBD/01; MeteoFrance: Lannion., France, 2007. [Google Scholar]
  75. Darmenov, A.; da Silva, A. The Quick Fire Emissions Dataset (QFED)–Documentation of Versions 2.1, 2.2 and 2.4. NASA//TM-2015-104606; NASA Global Modeling and Assimilation Office: Greenbelt, MD 20771, USA, 2015; Volume 38. [Google Scholar]
Figure 1. Test areas: the whole Italian territory (grey area) and the smaller area of interest (AoI), i.e., the portion within the blue box (down-left: 12.95 E, 39.17 N; upper-right: 18.83 E, 42.06 N).
Fire 06 00048 g001
Figure 2. Background radiance comparison between BREMA and the FRP-PIXEL approach (radiance unit: mW/(m2 sr cm−1)).
Fire 06 00048 g002
Figure 3. Comparison between BREMA and FRP-PIXEL background radiances corresponding to a fire on 19 July 2017. MIR SEVIRI images at 12:15 (a), 12:30 (b), and 16:00 (c) GMT.
Fire 06 00048 g003
Figure 4. Comparison between BREMA and FRP-PIXEL background radiances corresponding to a large fire on 13 July 2017. Darker pixels represent imaging artifacts. (a) One (red square) of the fire pixels together with the corresponding 5 × 5 pixel window (yellow square), overlaid with MIR channel, at 16:30 GMT. (b) Same fire, at 18:30 GMT, but another fire pixel together with the corresponding 5 × 5 pixel window (yellow square), overlaid with the MIR channel.
Fire 06 00048 g004
Figure 5. Background window size under cloudy conditions during a fire in Sicily on 1 August 2020. (a) One (red box) of the fire pixels together with the corresponding 5 × 5 pixel window (yellow box), and 15 ×15 pixel window (green box), overlaid with MIR channel; (b) Corresponding FRP-PIXEL quality flag map. Black boxes, from the smallest to the largest, correspond to the red, yellow, and green boxes of (a), respectively; the legend of the colors is reported on the right side.
Fire 06 00048 g005
Figure 6. Histogram and cumulative frequency of the standard deviation associated with fire pixels, σLMIR(xf,yf,tf), related to the difference between the fire pixel radiance, LMIR(xf,yf,tf), and the BREMA reference, μLMIR(xf,yf,tf). Such a ratio is expressed in percentages.
Fire 06 00048 g006
Figure 7. Plots corresponding to three fires occurred (a) near the Basilicata Ionian coast on 27 June 2012, (b) close to the eastern Sardinia coast on 13 July 2017, and (c) in the southern Lazio on 16 August 2017. They show the MIR radiances of the fire day (red line), BREMA background radiances (μLMIR(x,y,t), blue line) with relative uncertainties (σLMIR(x,y,t), vertical black bars), and the time slots with FRP-PIXEL invalid background window (green diamonds).
Fire 06 00048 g007
Figure 8. FRP comparison, on 223 spatially/temporally coincident fire pixels detected by both FTA and RST-FIRES, between the FRP-PIXEL product and BREMA values [FRP unit: MW].
Fire 06 00048 g008
Figure 9. FRP comparison, on 1201 fire pixels detected by RST-FIRES, between FRP values computed considering two approaches (FRP-PIXEL-like and BREMA) [FRP unit: MW].
Fire 06 00048 g009
Figure 10. Daily FRP sum vs. daily GFED CO2 emissions.
Fire 06 00048 g009
Table 1. Daily FRP sum over all fires detected by RST-FIRES and FTA within the AoI. Background radiances are computed by using BREMA and FRP-PIXEL-like approach on fires detected by the RST-FIRES algorithm and by using the FRP-PIXEL approach on fires detected by FTA.
Fire Detection AlgorithmRST-FIRESRST-FIRESFTA
Background Computation ApproachBREMAFRP-PIXEL-likeFRP-PIXEL
∑FRP [MW] [A]∑FRP [MW] [B]∑FRP [MW] Percentage Increase [C = (A − B)/B]
Date27 June 20122814.261354.421594.60108%
30 July 20123003.192048.995571.2047%
10 July 201712,577.958299.1013,317.3052%
13 July 201710,118.787720.1219,990.0031%
16 August 201710,476.028450.0211,173.5024%
14 September 20191383.101079.17393.4028%
15 September 20192851.212462.25611.2016%
1 August 2020771.06528.67199.7046%
13 September 20205162.532077.72555.10148%
All days49,158.1034,020.4753,406.0044%
Disclaimer/Publisher’s Note: The statements, opinions and data contained in all publications are solely those of the individual author(s) and contributor(s) and not of MDPI and/or the editor(s). MDPI and/or the editor(s) disclaim responsibility for any injury to people or property resulting from any ideas, methods, instructions or products referred to in the content.

