Article

Intense Wildfires in Russia over a 22-Year Period According to Satellite Data

by
Valery G. Bondur
*,
Kristina A. Gordo
,
Olga S. Voronova
*,
Alla L. Zima
and
Natalya V. Feoktistova
Institute for Scientific Research of Aerospace Monitoring “AEROCOSMOS”, 105064 Moscow, Russia
*
Authors to whom correspondence should be addressed.
Submission received: 25 December 2022 / Revised: 3 February 2023 / Accepted: 28 February 2023 / Published: 2 March 2023
(This article belongs to the Special Issue Remotely Sensed Estimates of Fire Radiative Energy)

Abstract

:
The spatiotemporal distributions of wildfire areas and FRP values for the territory of Russia and its large regions (the European part of Russia, as well as the Ural, Siberian, and Far Eastern Federal Districts) during 2001–2022 were analyzed using satellite data. For the territory of Russia, there was a decreasing trend in annual burned areas and a small increase in average hotspot FRP. At the same time, the largest annual burned areas in the territory of Russia were recorded in 2008 (295.2 thous. km2), 2002 (272.4 thous. km2), 2006 (261.2 thous. km2), and in 2012 (258.4 thous. km2). It was found that during the studied period, 90% of fire hotspots in Russia had a maximum FRP < 100 MW. The most intense wildfires (FRP > 1500 MW) amounted to only 0.1% and were detected mainly in the Siberian and Far Eastern Federal Districts. Interconnections between large wildfires and meteorological factors, including blocking activity in the atmosphere, were revealed.

1. Introduction

Currently, wildfires and their effects are widely studied in many countries of the world, including Russia [1,2,3,4,5,6]. The seasons for wildfires in various regions of our planet have become longer, and their frequency, coverage, and severity have increased [7]. These trends are mostly caused by the influence of various meteorological factors. An increase in temperature and a decrease in precipitation contribute to arid conditions, which significantly increase the likelihood of intense wildfires and their rapid propagation [1,3,8,9,10,11,12,13,14,15]. At the same time, these meteorological anomalies are directly related to blocking anticyclones in the troposphere. Blocking anticyclones that obstruct the passage of other air masses contributes to the rise in temperature while reducing the overall amount of precipitation [16].
It should be pointed out that global warming can significantly increase the duration of the atmospheric blockings that contribute to wildfire conditions [13,17].
In a changing climate, monitoring long-term fire activity is important for assessing the spatial distribution of burned areas and wildfire intensity over the past few decades, as well as for revealing the links between their occurrence and meteorological factors [18].
In recent years, many studies of the spatiotemporal characteristics of wildfires and their global and regional effects have been conducted using satellite monitoring data for the territories of various countries, e.g., Russia [1,2,3,4,5,10,11,12,13,19,20,21], China [22,23], USA [24,25], Canada [26], Iran [27], Australia [19,28,29], Brazil [30], the countries of South and South-East Asia [31,32], Africa [33,34], and Europe [35].
The use of satellite data for wildfire monitoring enables the daily and repeated study of greater areas, which improves the efficiency of the detection of these phenomena. Satellite data in various regions of the infrared range of the electromagnetic spectrum (3–4 µm MidIR and 10–12 µm far IR) allow us not only to reveal fire hotspots [1,2,12,13,36] but also to assess their fire radiative power (FRP) [37]. The FRP values are related to the intensity of burning [38,39].
In this paper, burned areas were assessed according to Terra and Aqua (MODIS) satellite data for the territory of Russia and its regions for the period 2001–2022. The FRP values recorded during the studied period were also analyzed, as well as FRP dependence on physical, geographical, and meteorological conditions specific to the territory of Russia. Moreover, the relationships between intense wildfires in various regions and meteorological conditions were revealed according to Aqua (AIRS) data.

2. Materials and Methods

To analyze the dynamics of wildfire areas in Russia during 2001–2022, we processed satellite monitoring data according to the approach described in [1,10,11,12,19,20,36]. MOD14/MYD14 products (1 km resolution) containing information on thermal anomalies obtained by the MODIS instrument (Terra and Aqua satellites) were taken as a base. To detect thermal anomalies caused by wildfires (fire pixels), threshold levels were set in the algorithm of this product in the spectral ranges of 4 µm and 11 µm. False fires were filtered through the comparative analysis of the brightness temperatures of a fire pixel and surrounding pixels, as well as through the analysis of changes in brightness temperatures of a fire pixel in the mid- and far-infrared ranges [40]. Fire pixels with fire-detection confidence of no less than 80% were used in this work.
An assessment of the burned areas during the fire season (from April to October) from 2001 to 2022 was carried out for the territory of Russia and its large regions based on the spatial analysis of daily data generated using the MOD14/MYD14 product. In this case, the total area burned in a year was considered, without taking into account the repeated burning of the same site during the fire season. In addition, a number of detected fire pixels and their maximum FRP in the studied period were analyzed according to this information product. The values of FRP were registered while the satellite was passing over the active fires, and these values are directly related to fire intensity [38,39].
The types of land cover and their characteristics were identified using the annual product MCD12Q1 (MODIS Land Cover Type 500 m), obtained by the MODIS instrument (Terra and Aqua satellites), based on the classification of the International Geosphere-Biosphere Programme (IGBP) [41], which contains 17 classes of land cover and has a thematic accuracy of 70–75% on average. According to this classification, for the territory of the Russian Federation, five classes were assigned to forest cover, two to shrublands, and three to meadow steppe [42].
In this research, the following information parameters of the 3rd-level AIRS3STD thematic product from AIRS data with a spatial resolution of 1° × 1° were analyzed to assess meteorological conditions during the studied period [43]:
  • Surface air temperature;
  • Relative humidity;
  • Geopotential height at 500 hPa.
The impact of blocking anticyclones during severe wildfires in Russia was analyzed using the daily values of geopotential heights (analogs of the upper levels of surface cyclones and anticyclones) [13,16]. The used AIRS3STD product [44] contains daily geopotential heights measured at the 500-hPa pressure level in which the meteorological situation is formed. Maps of geopotential height changes were created for each month in which large fires occurred in the studied area. Every day of the selected period was analyzed.
Based on the results of this analysis, the time periods when blocking anticyclones largely prevailed were identified.
To assess surface air temperature, the AIRS3STD thematic product was used; it contains day- and nighttime temperature values [44]. Calculation of daily average temperatures in the selected periods was carried out using this thematic product.
Detection of areas of extremely low relative humidity was performed using AIRS3STD data that include day- and nighttime values [44]. This product was used to estimate daily average relative humidity values for selected periods.
The use of satellite data obtained from the same instrument allowed us to avoid errors associated with the use of various satellite instruments.

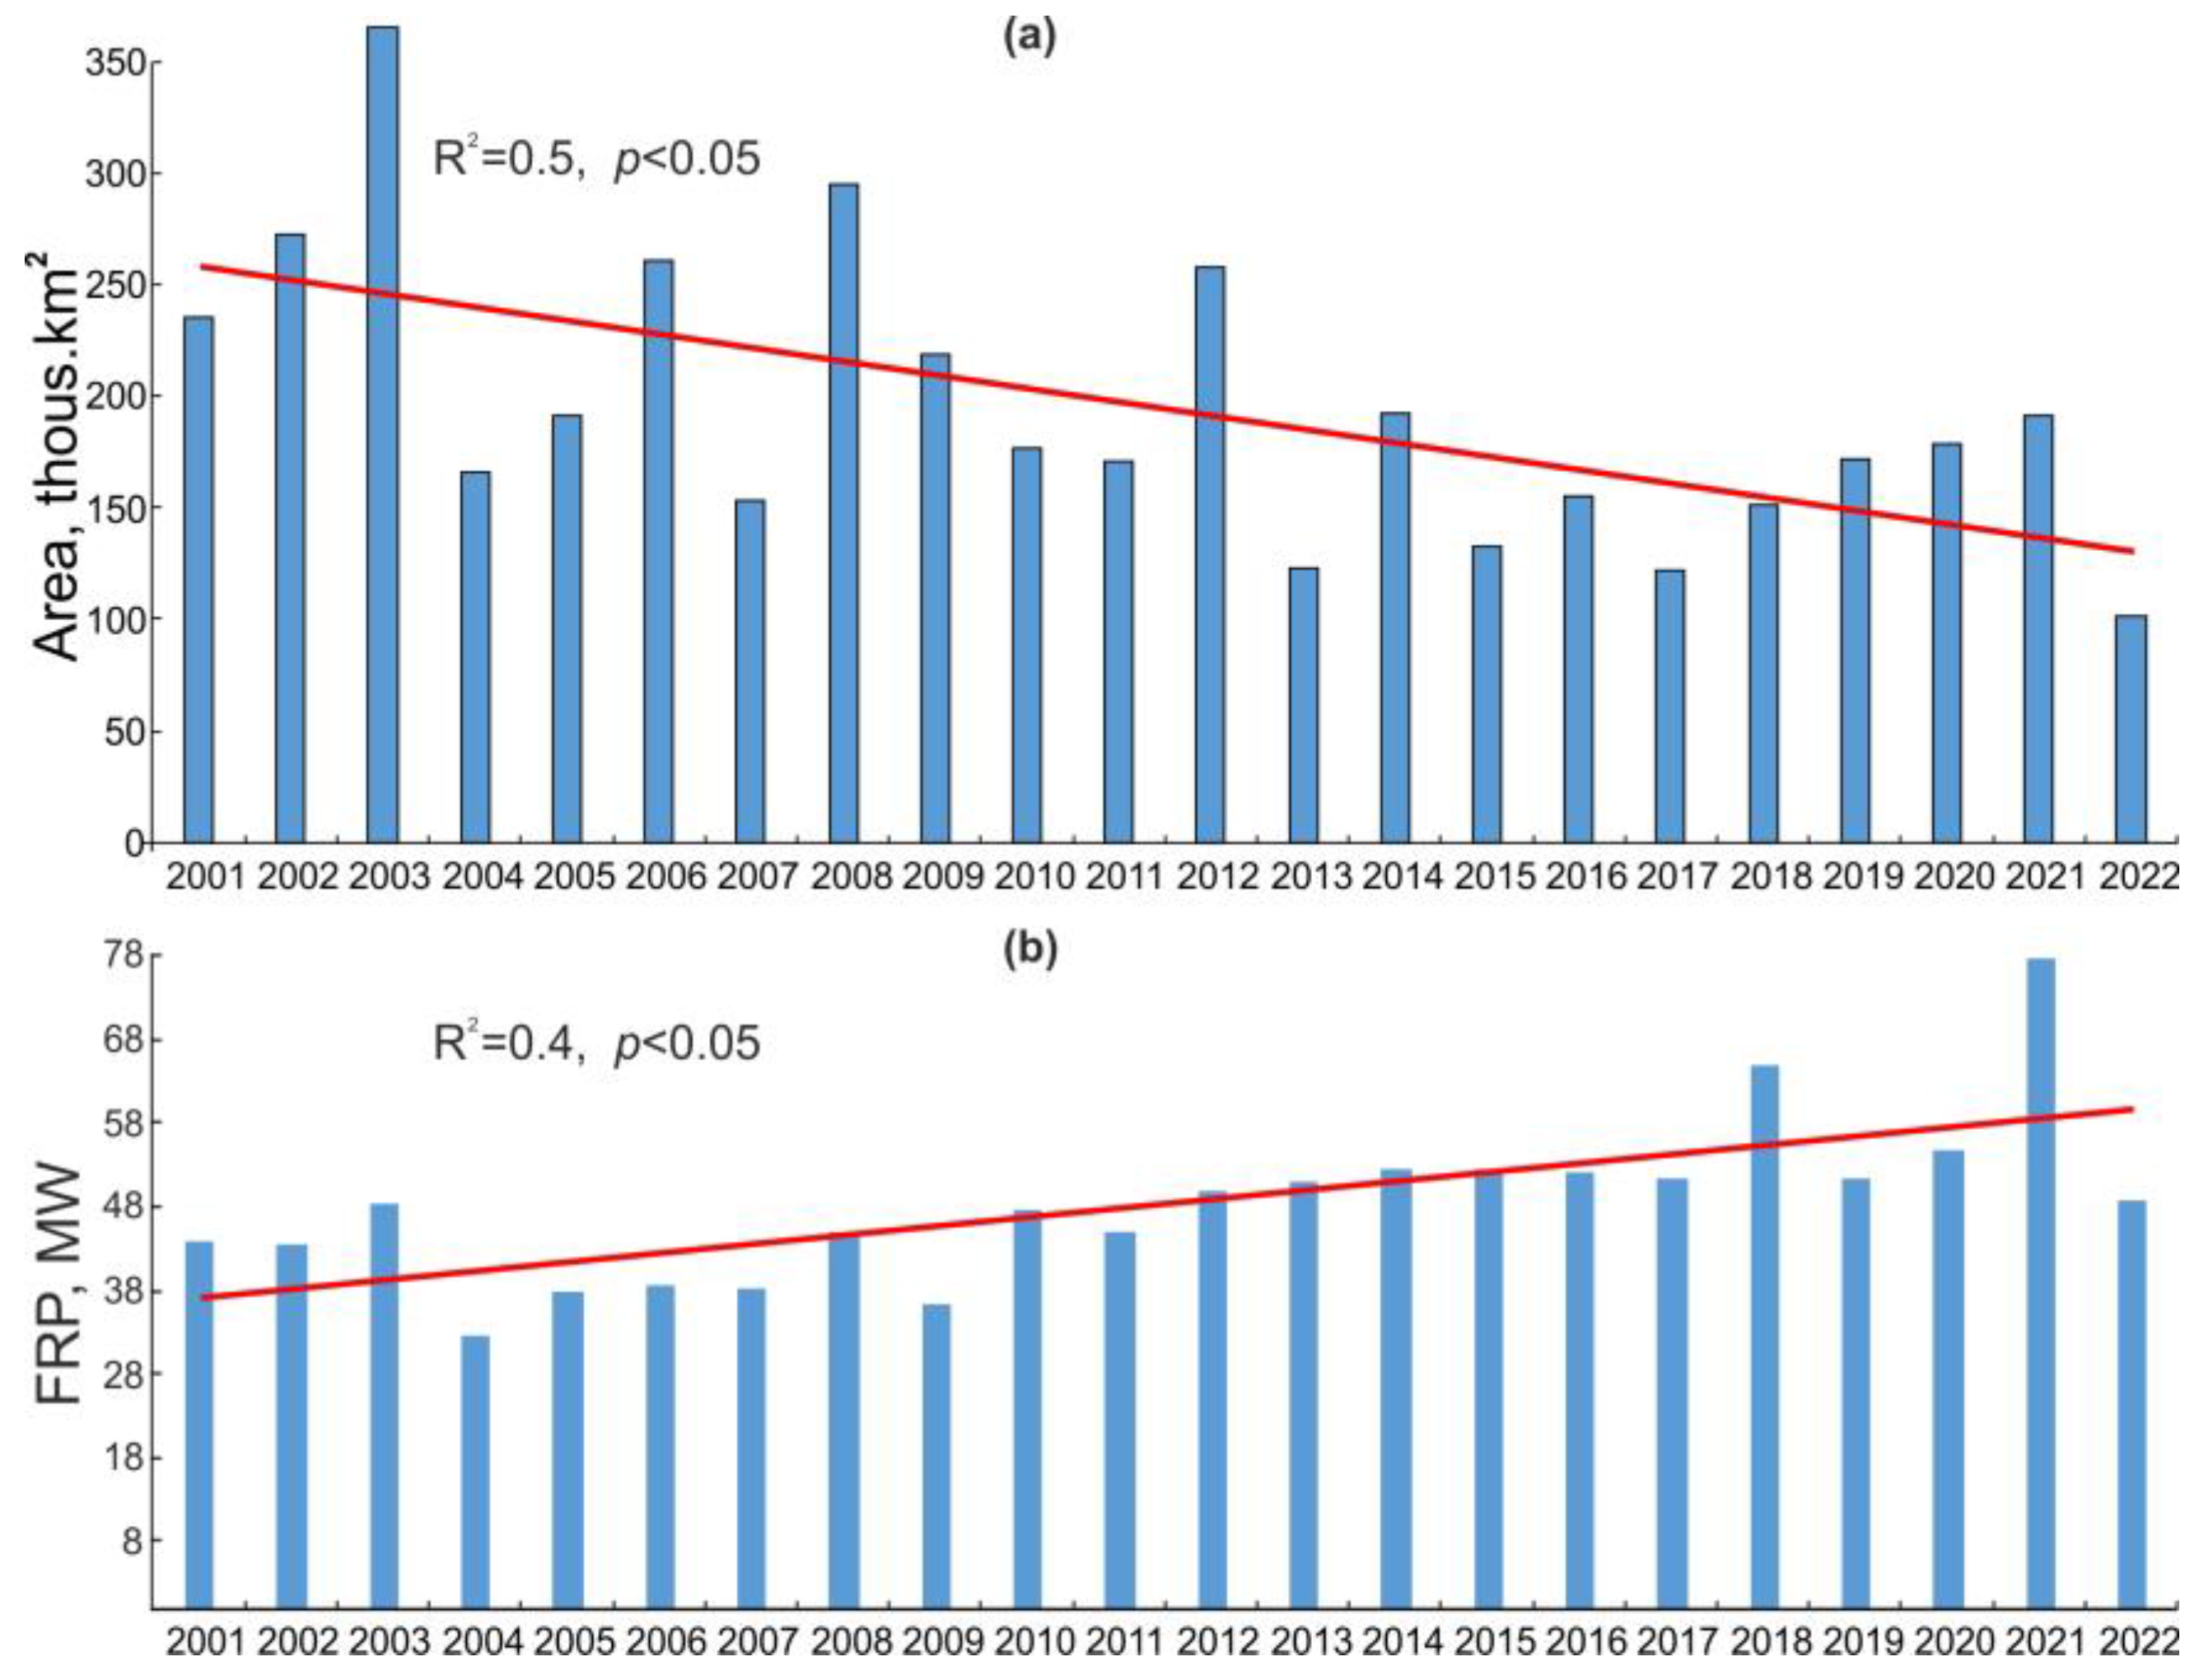
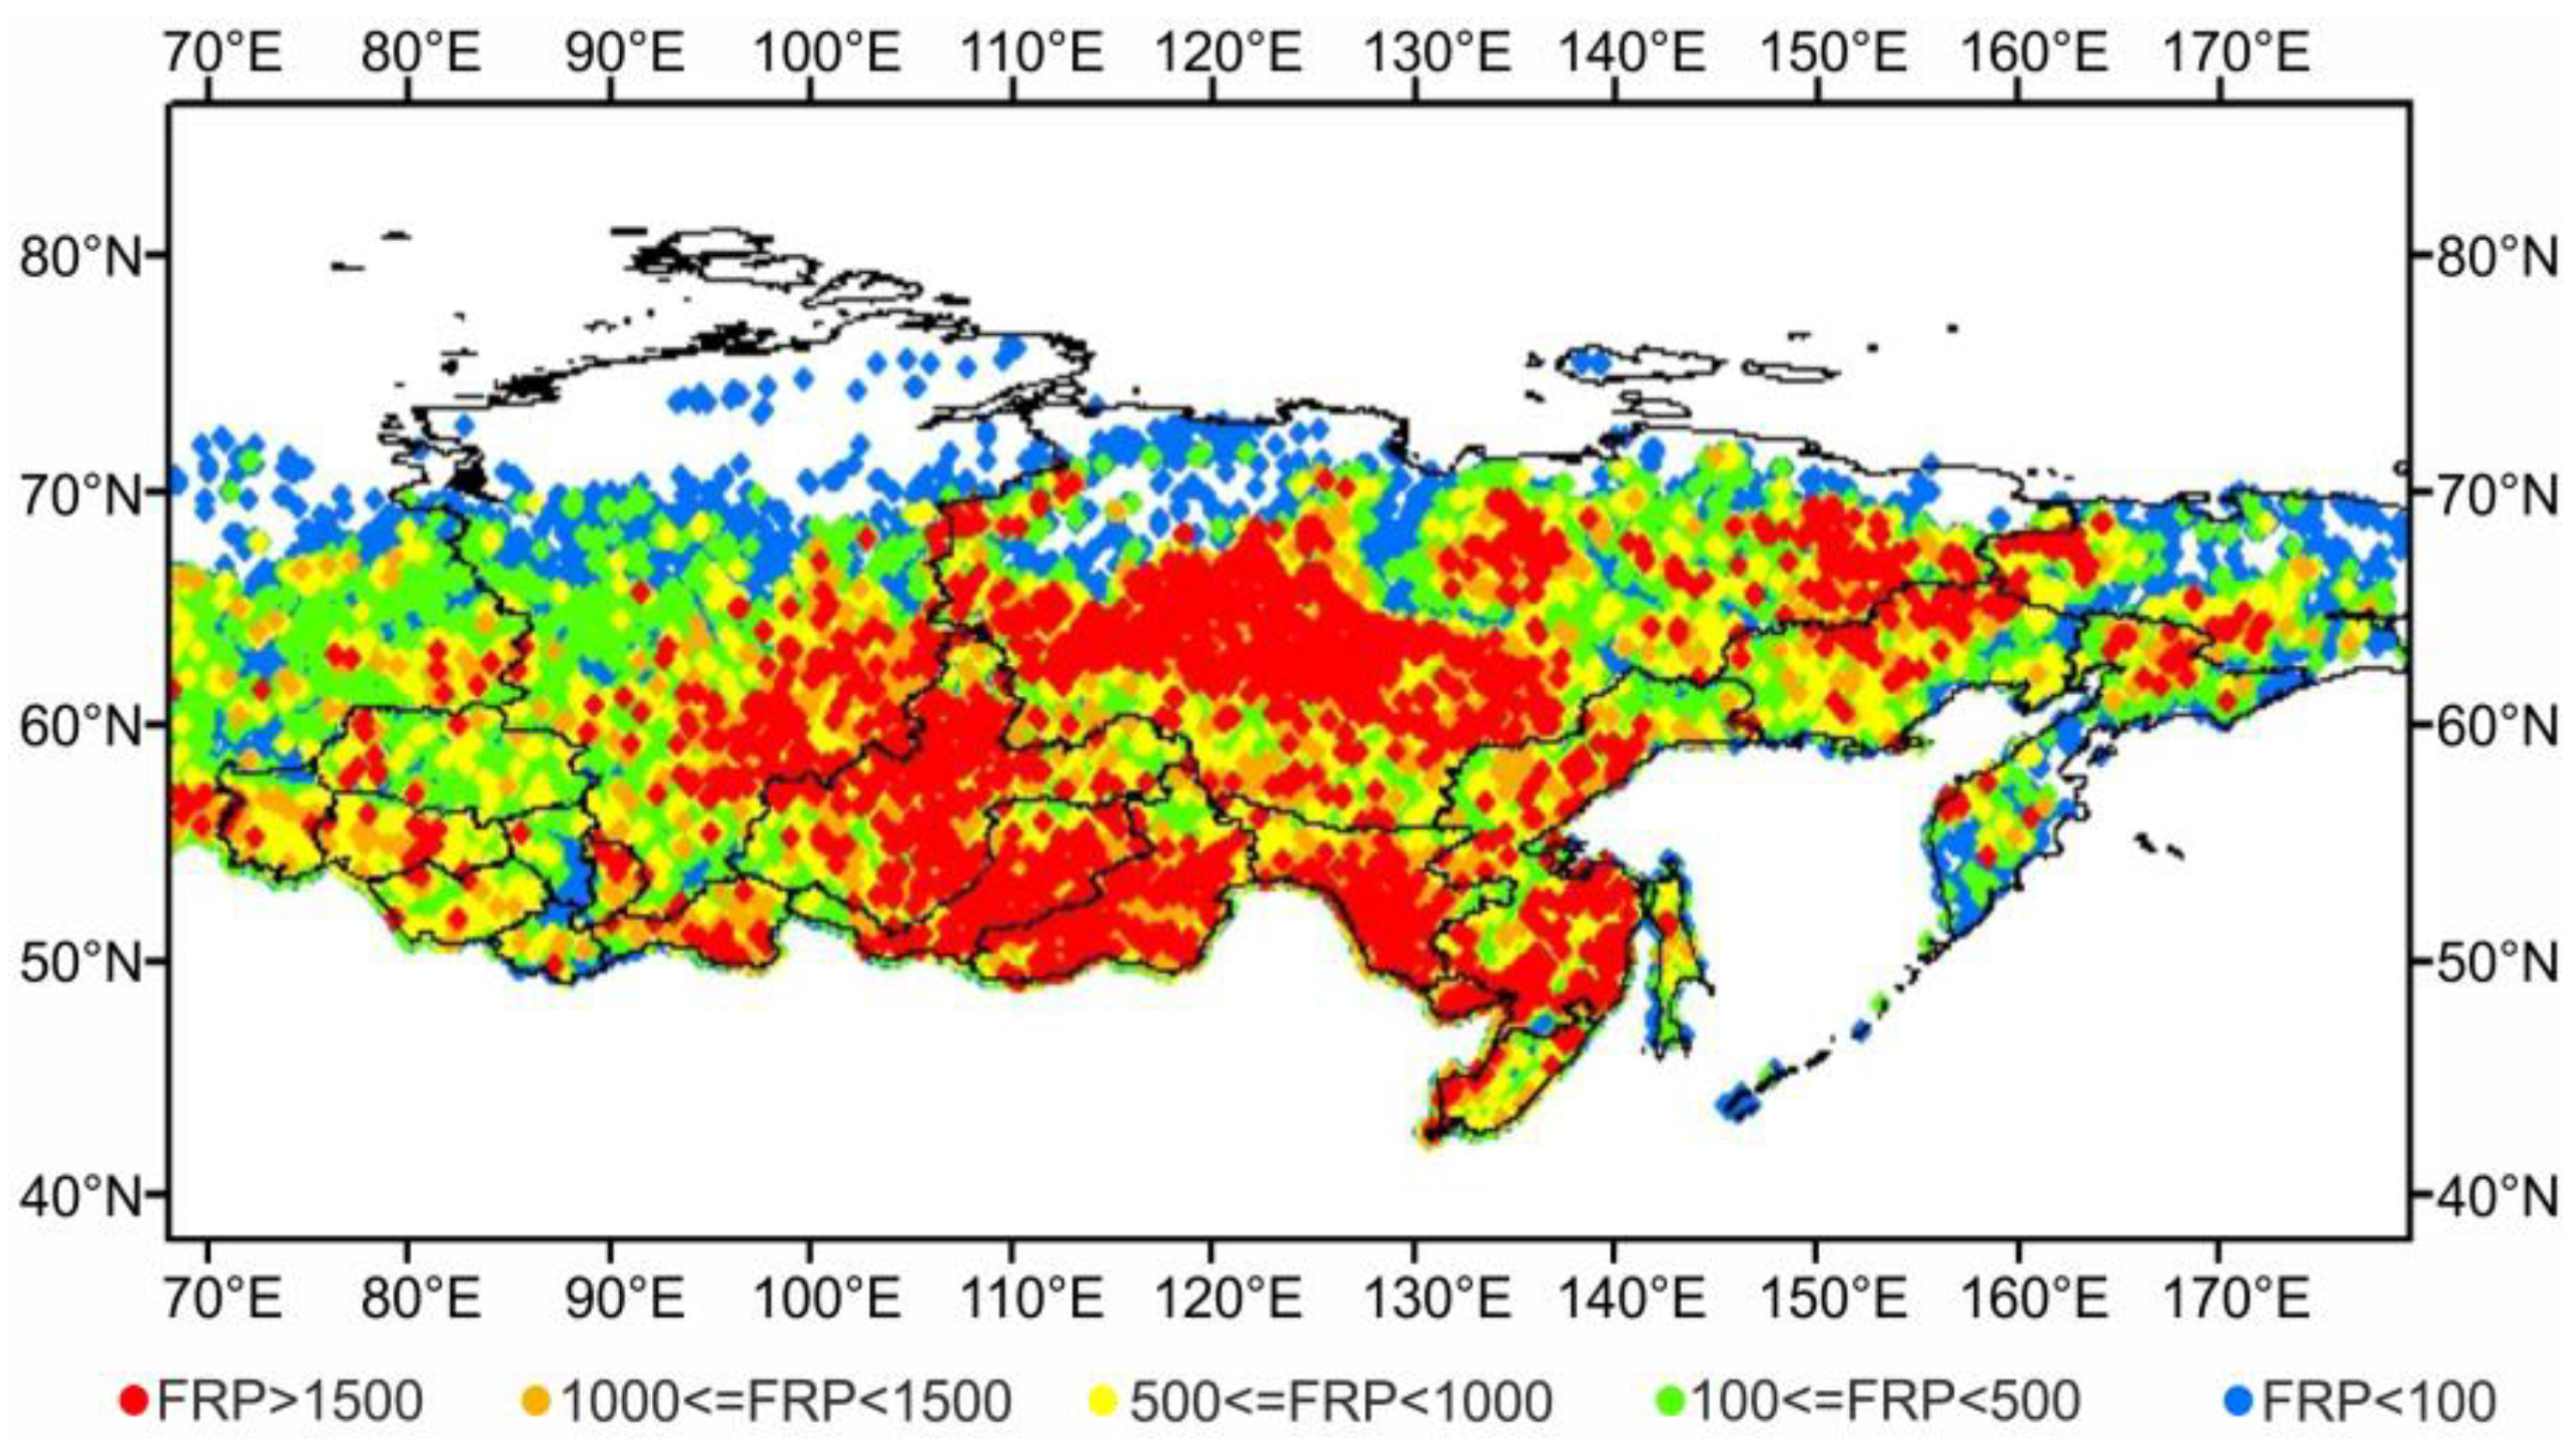
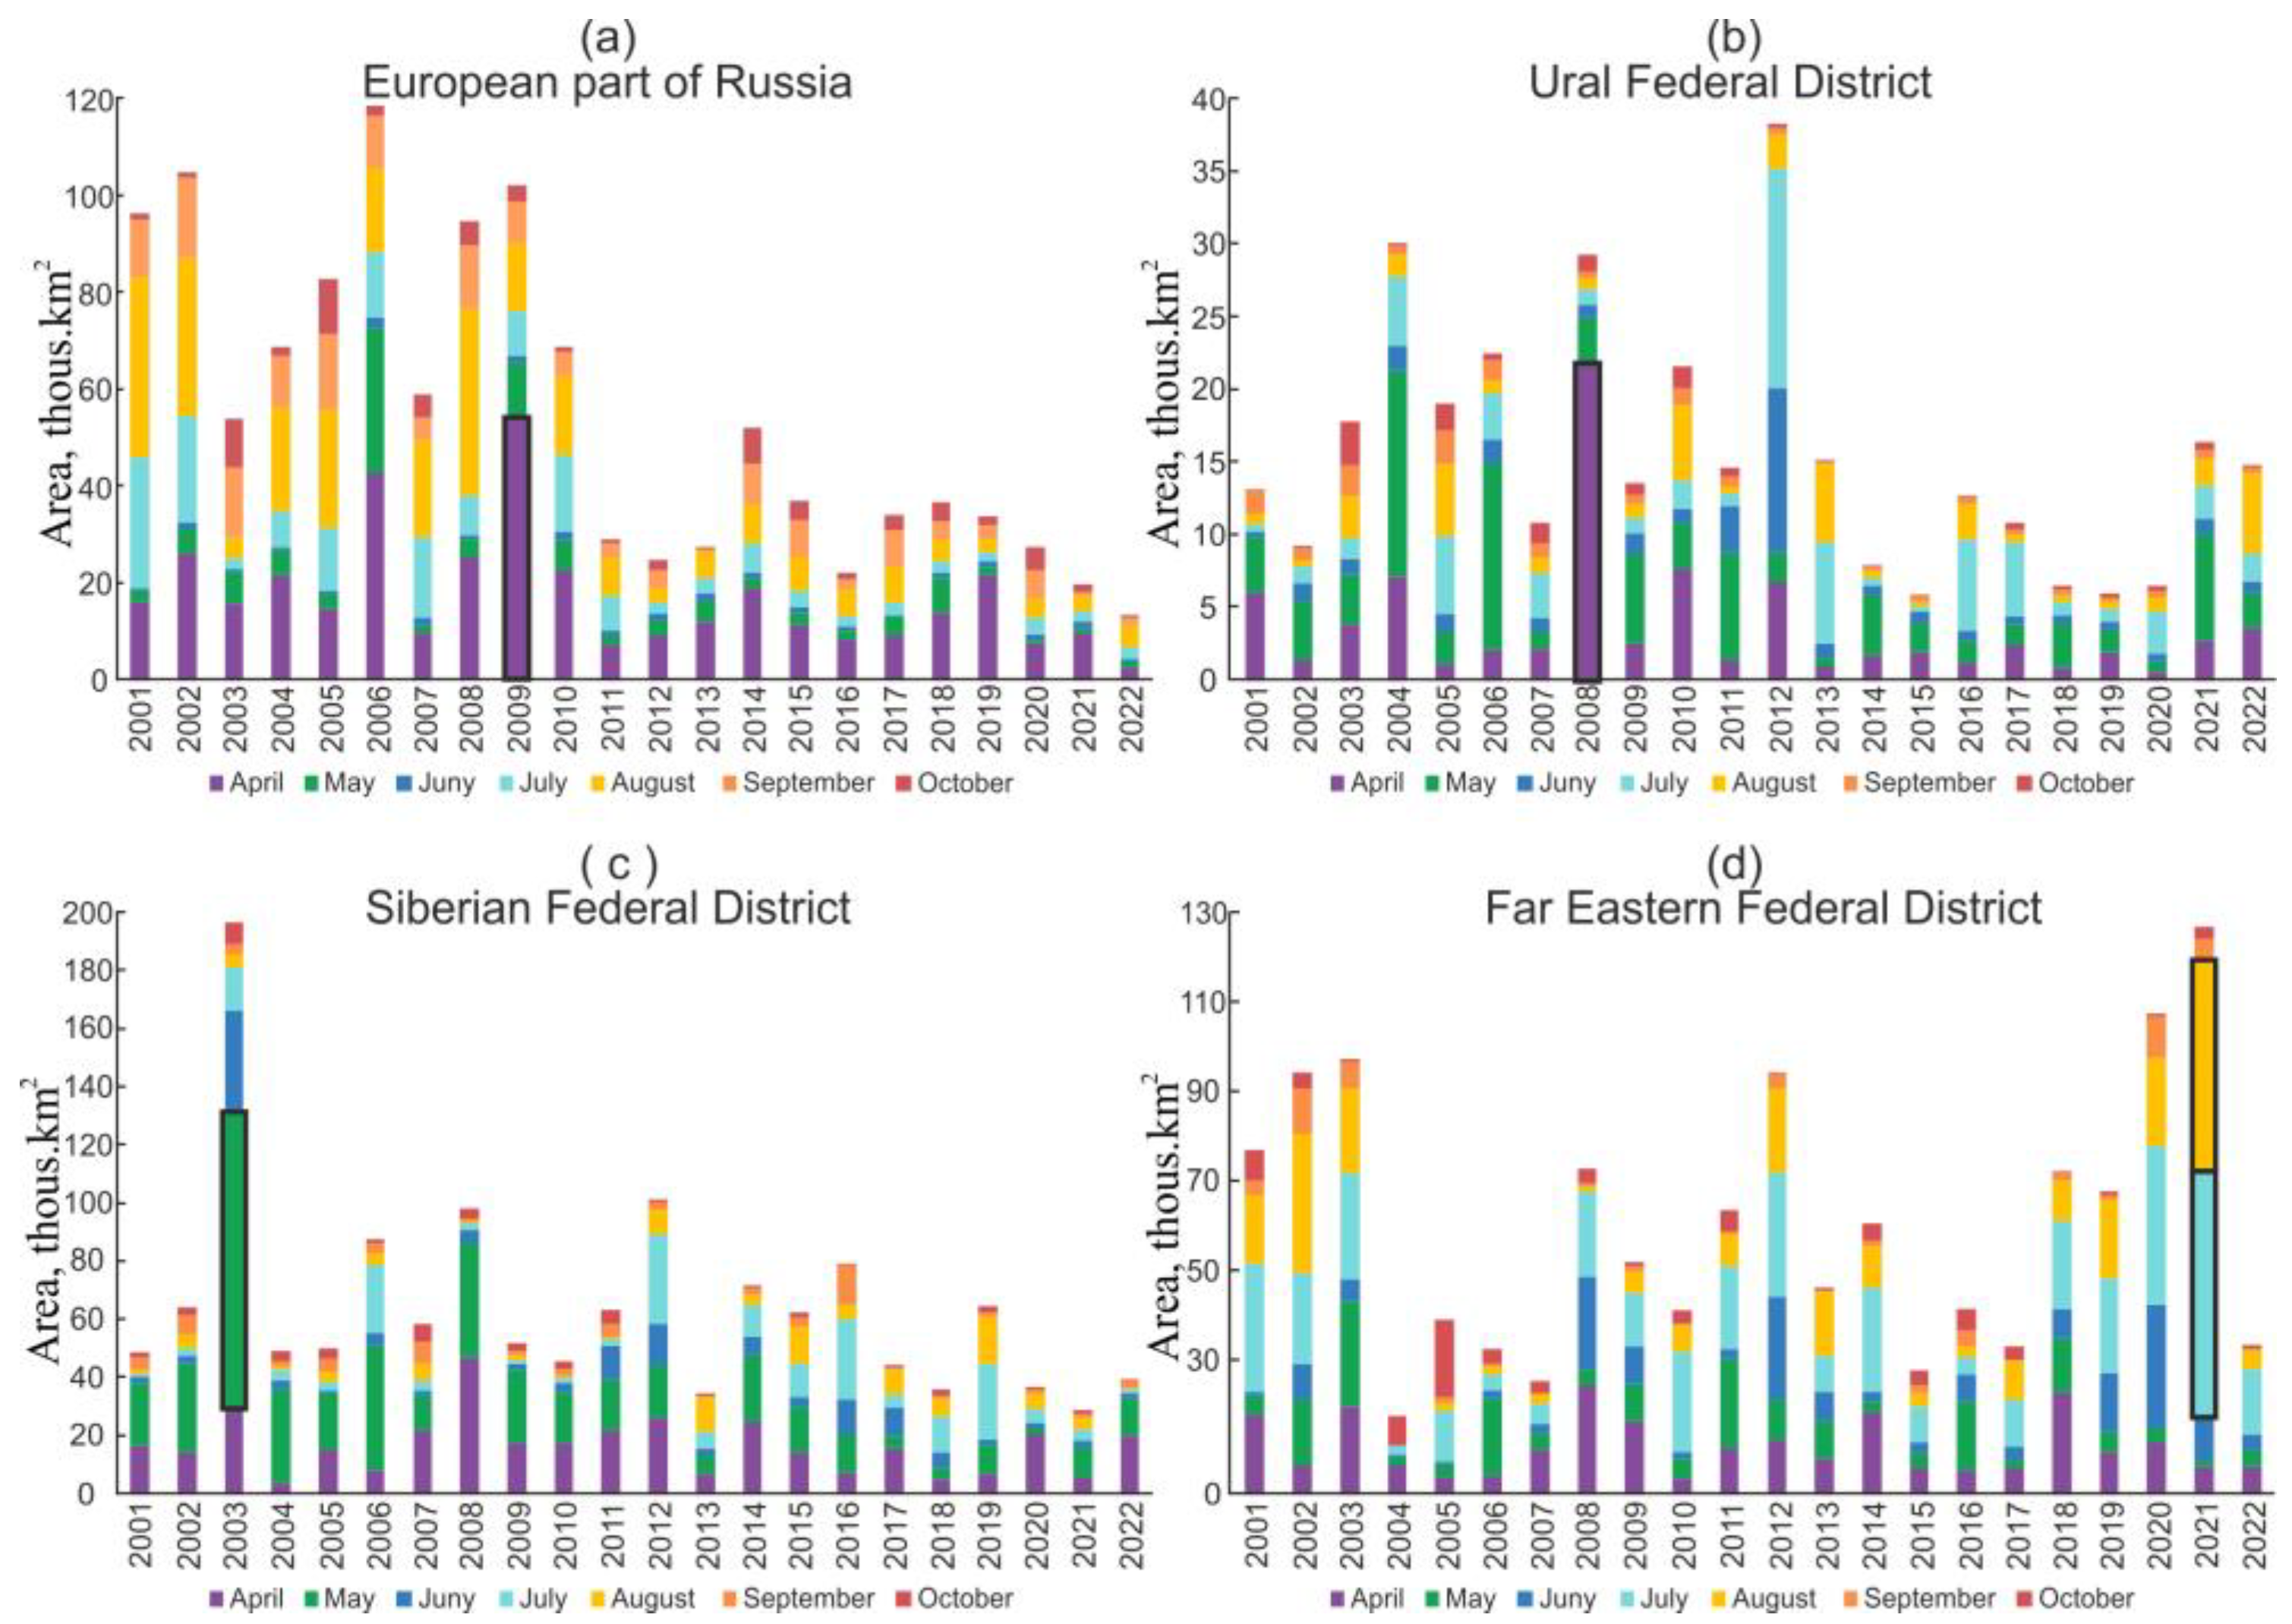
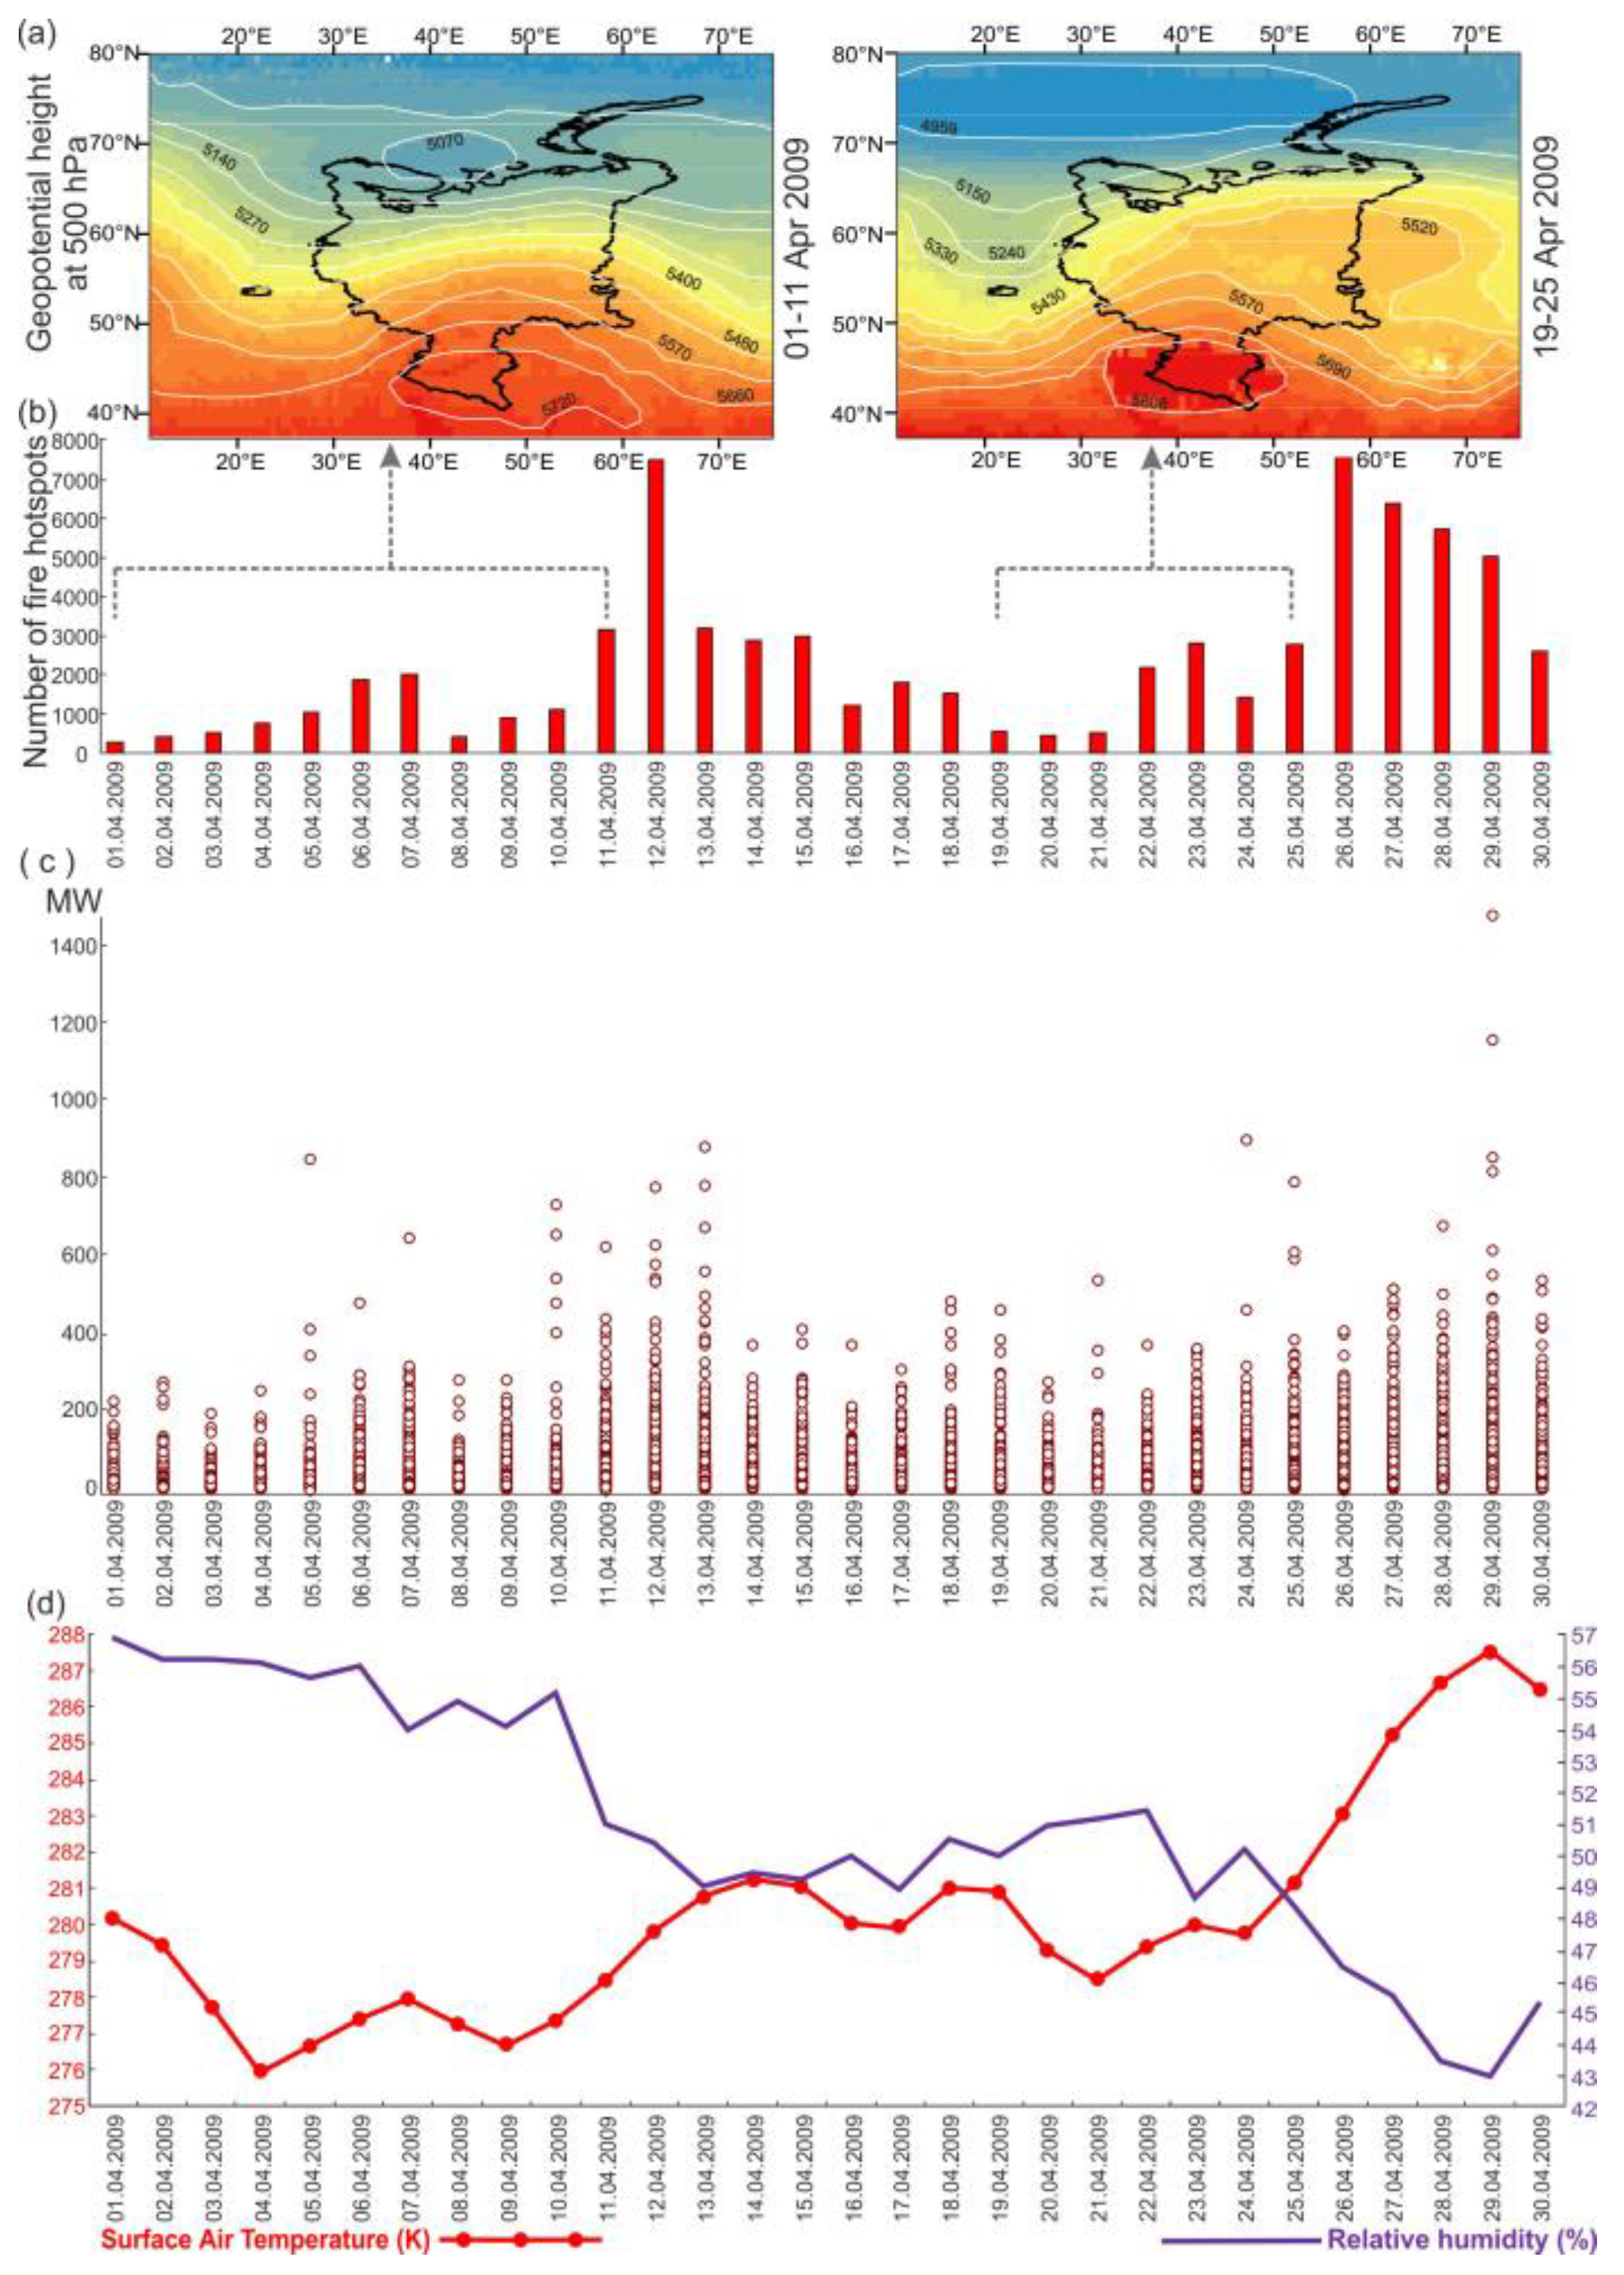
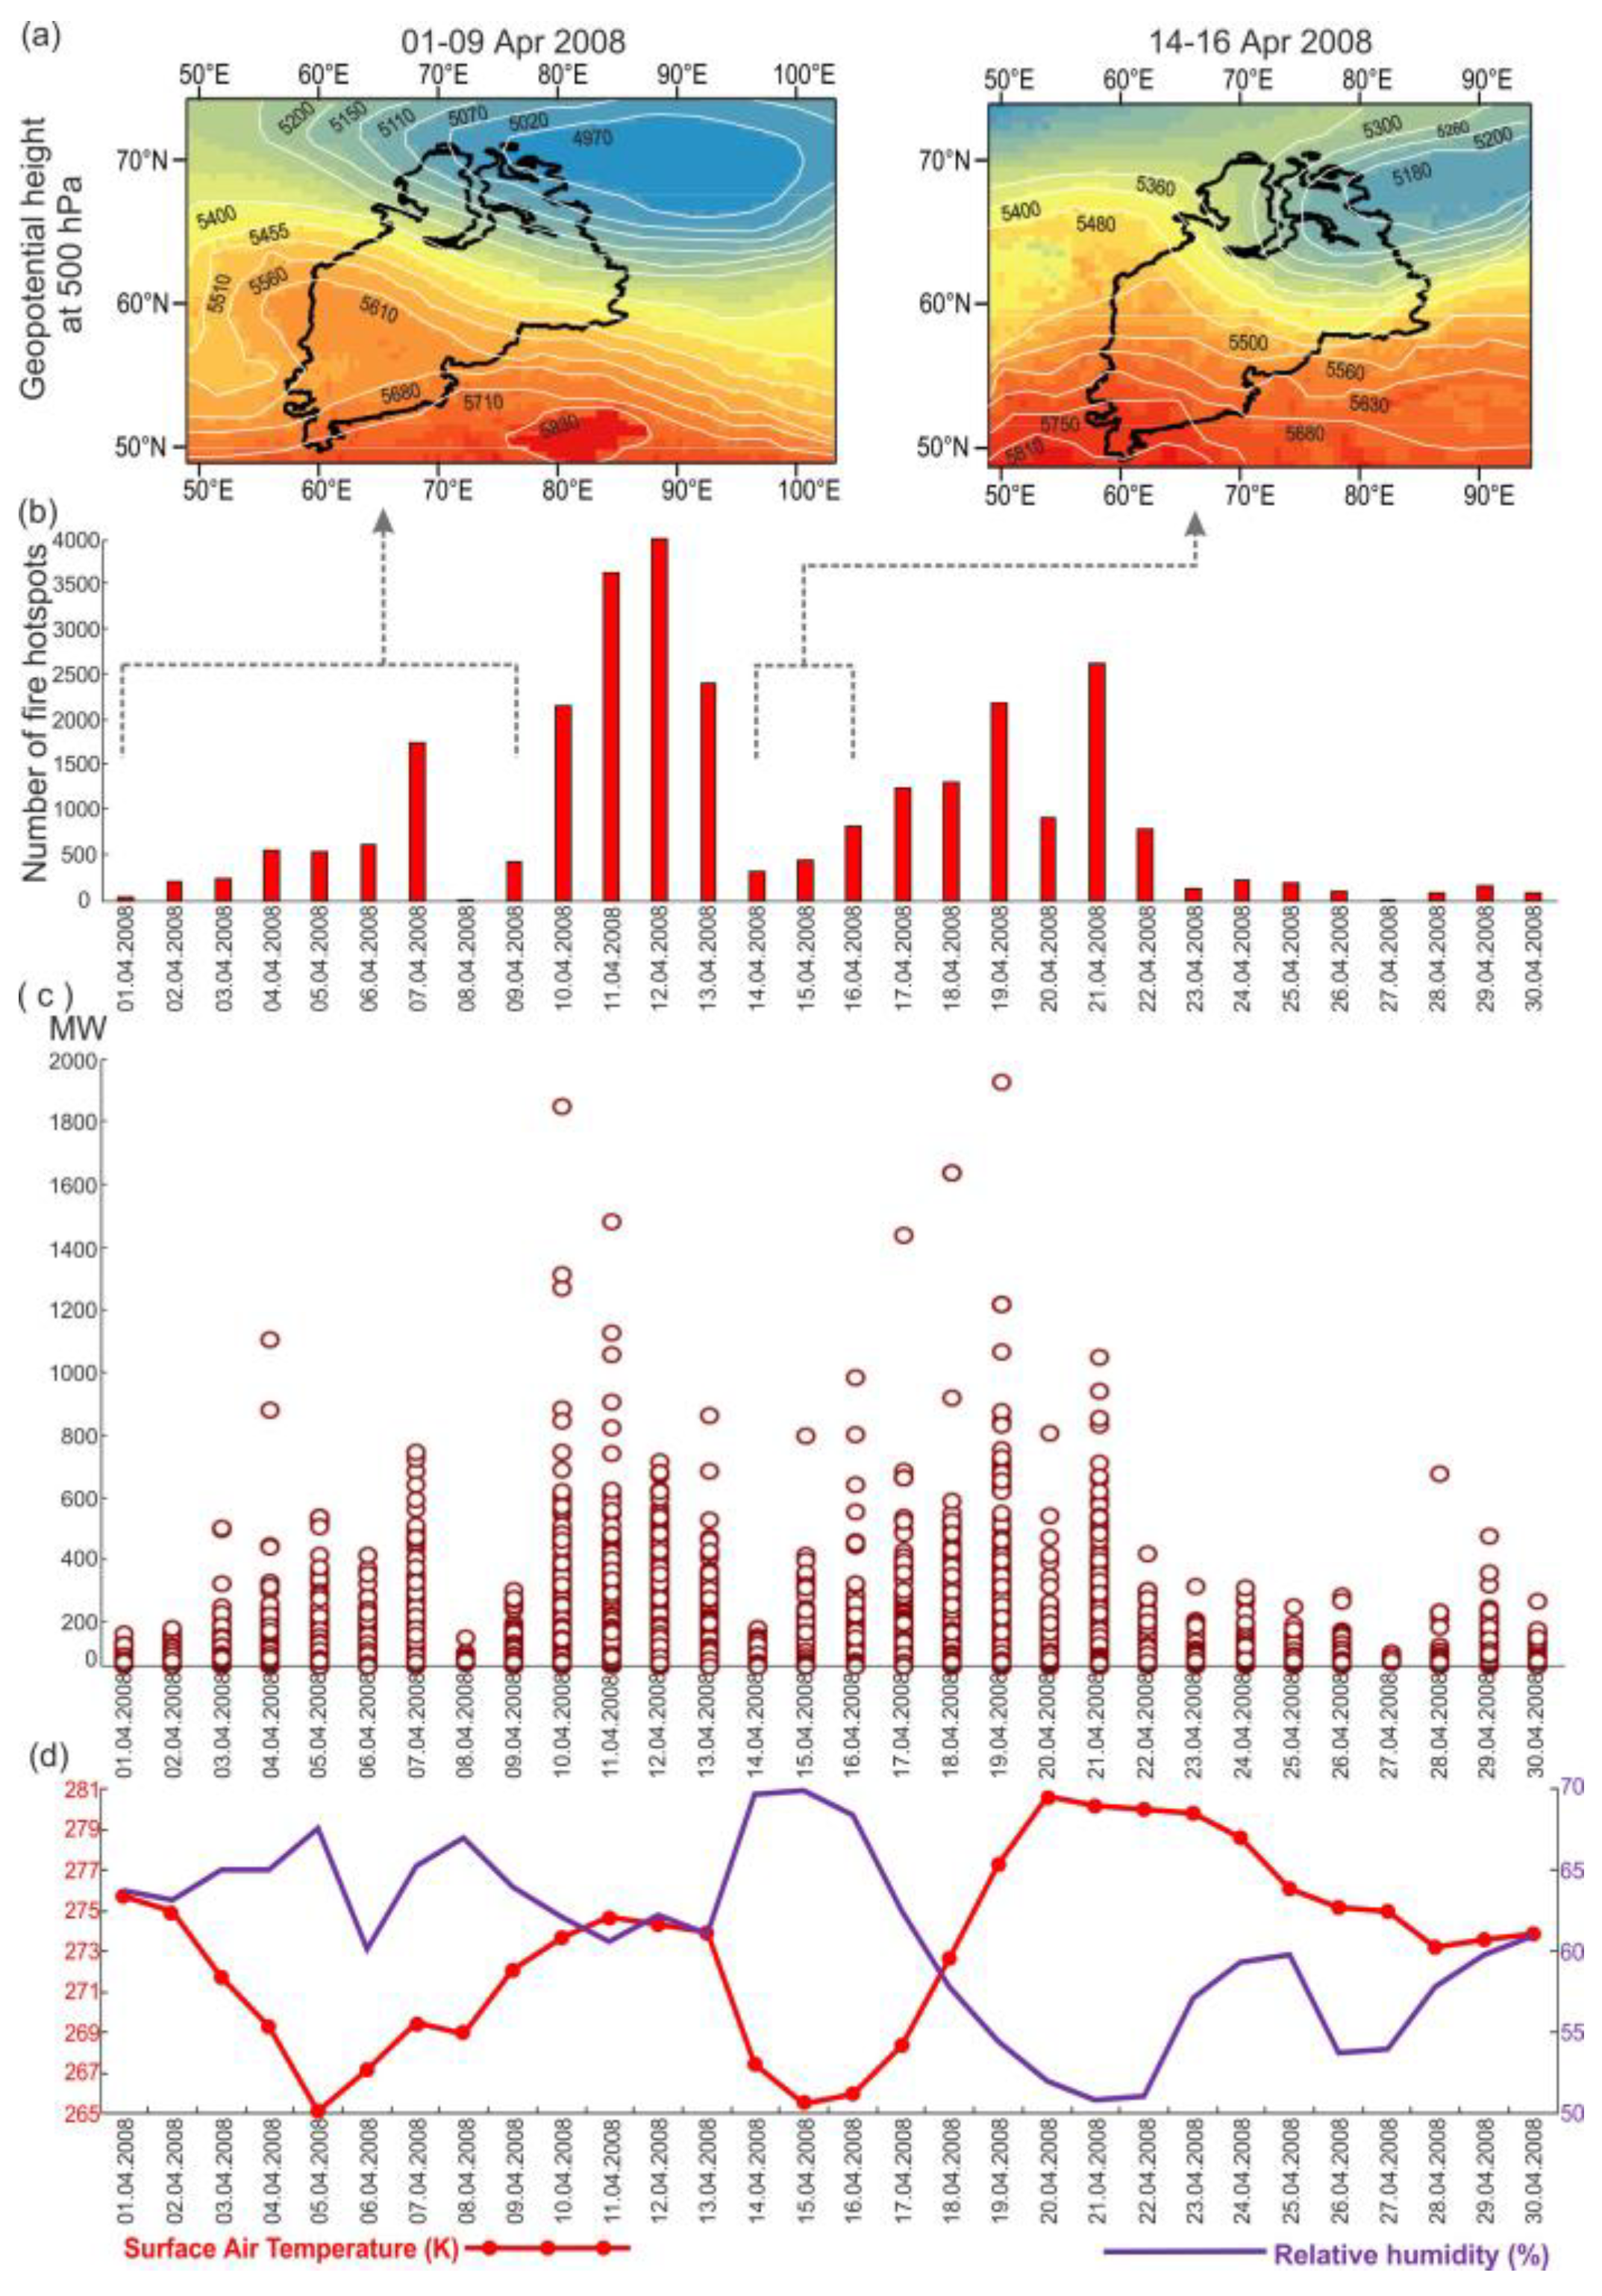
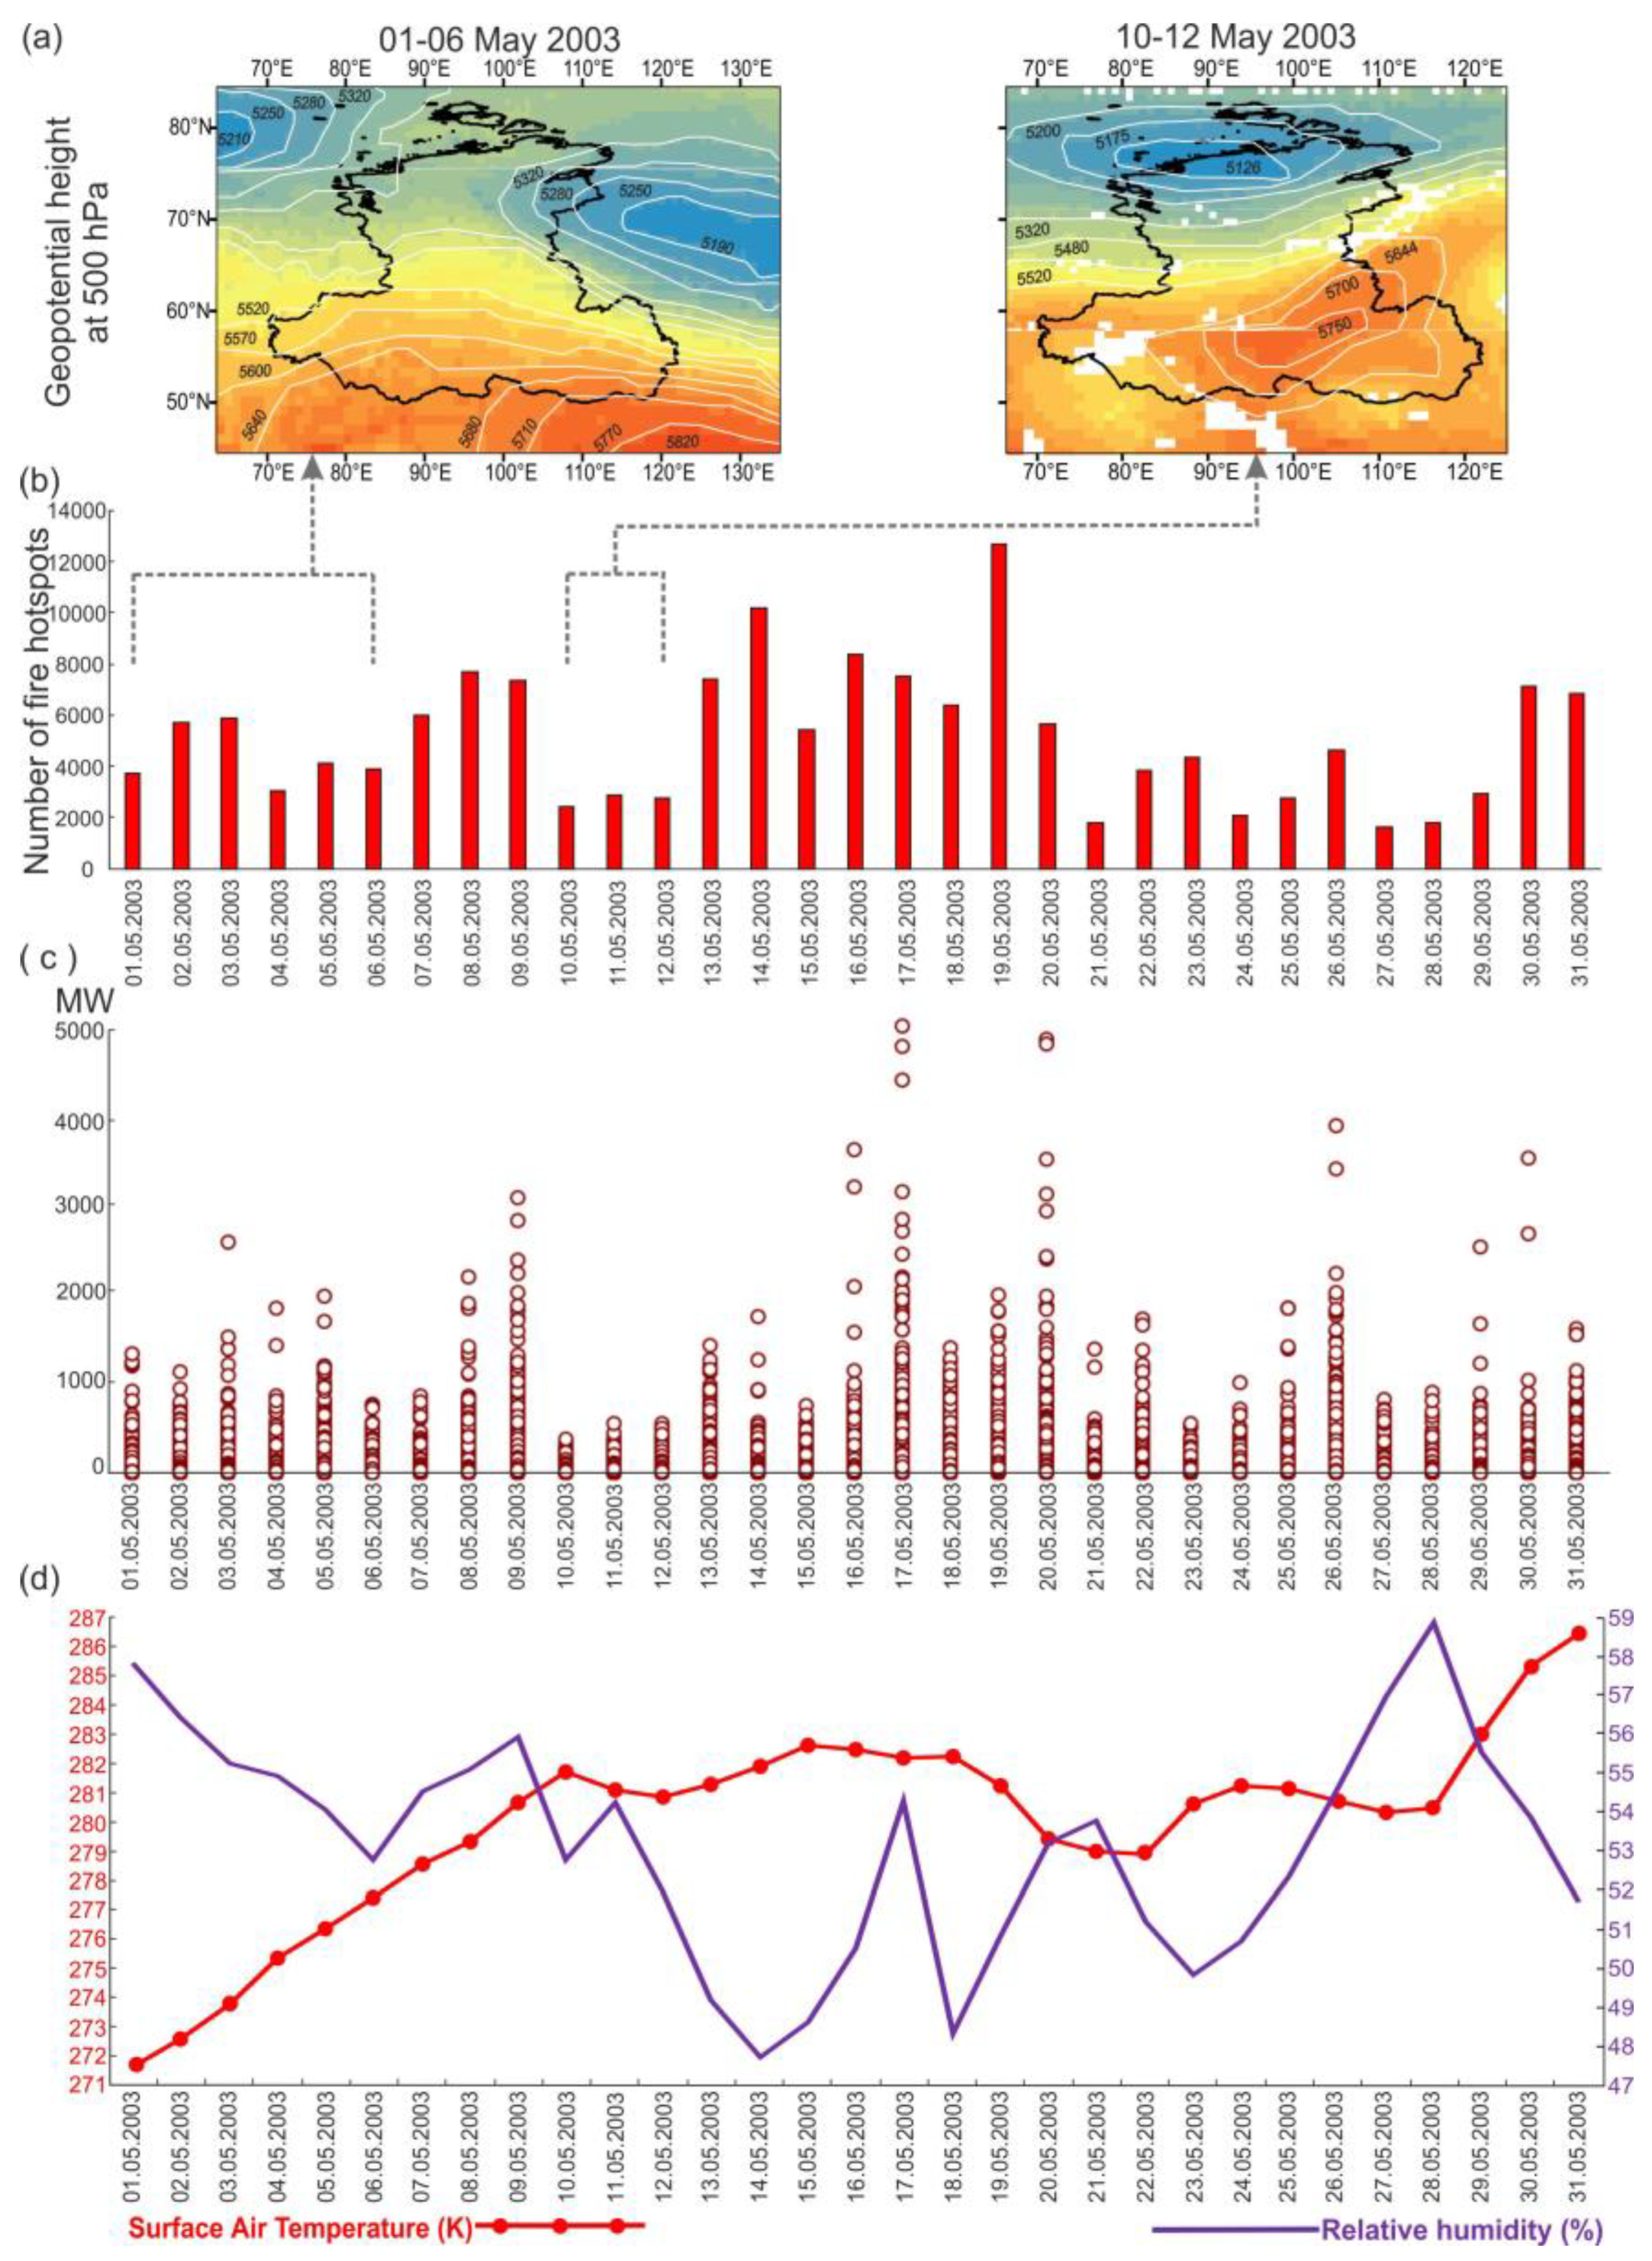
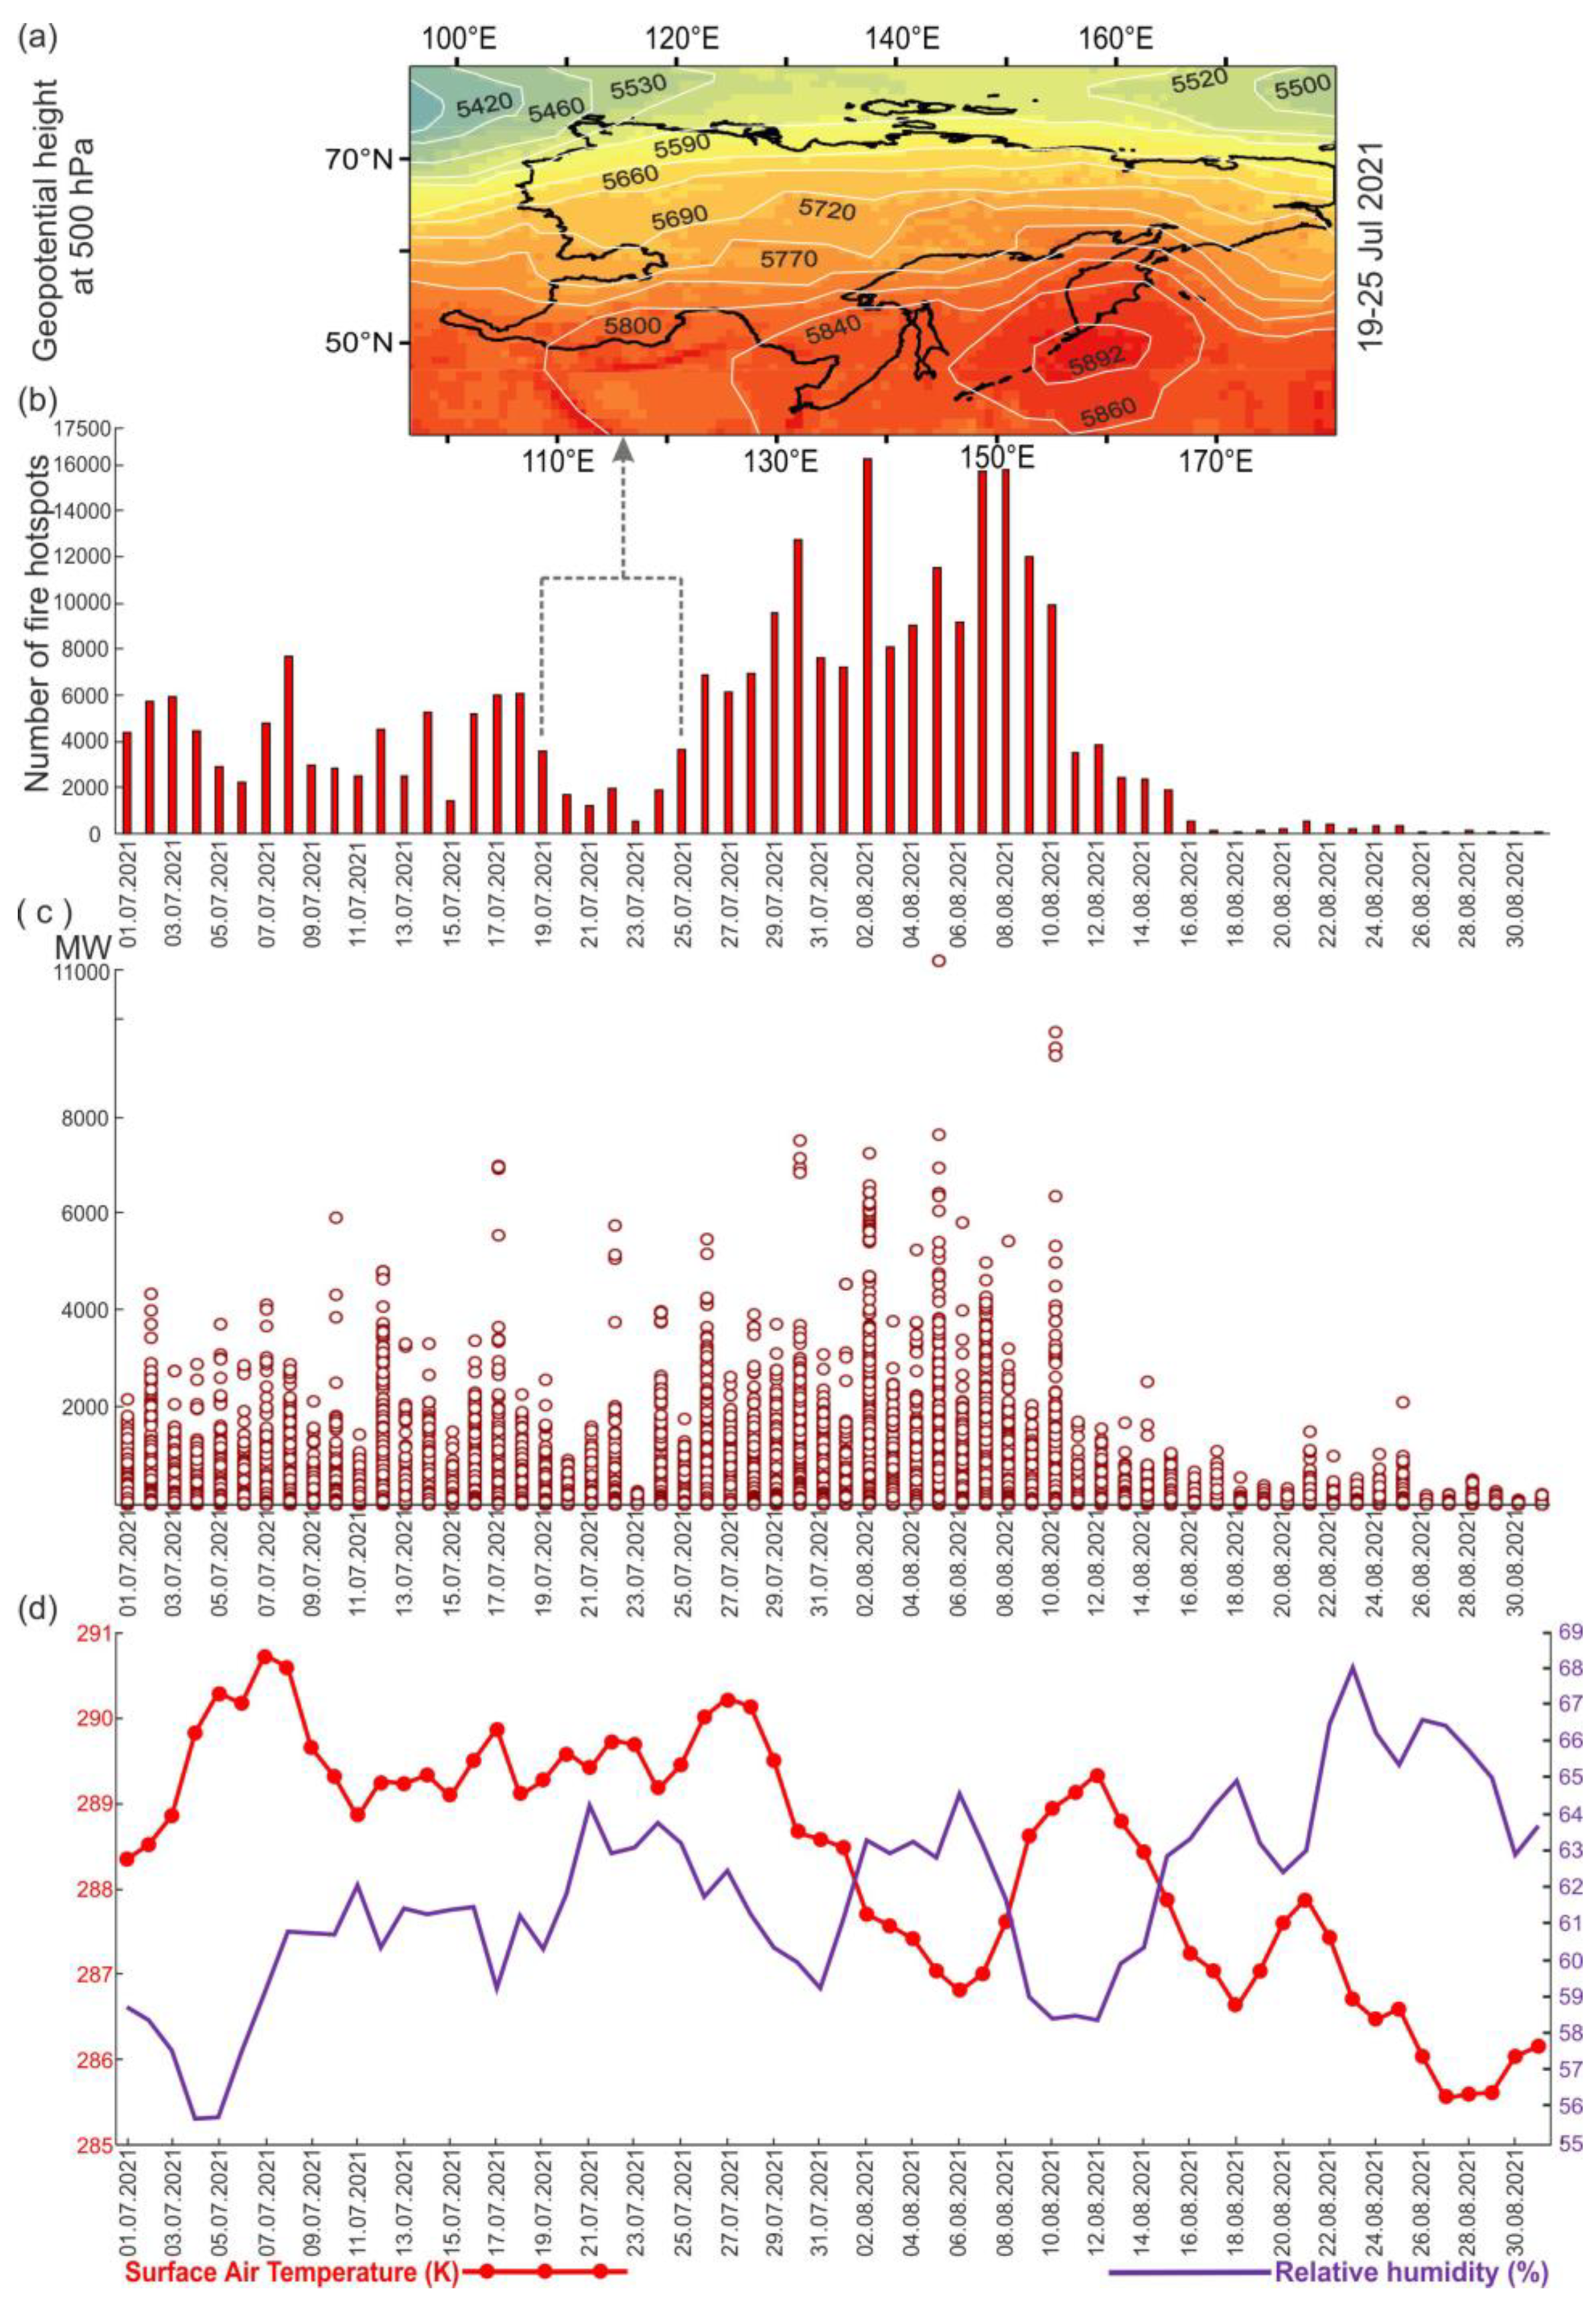
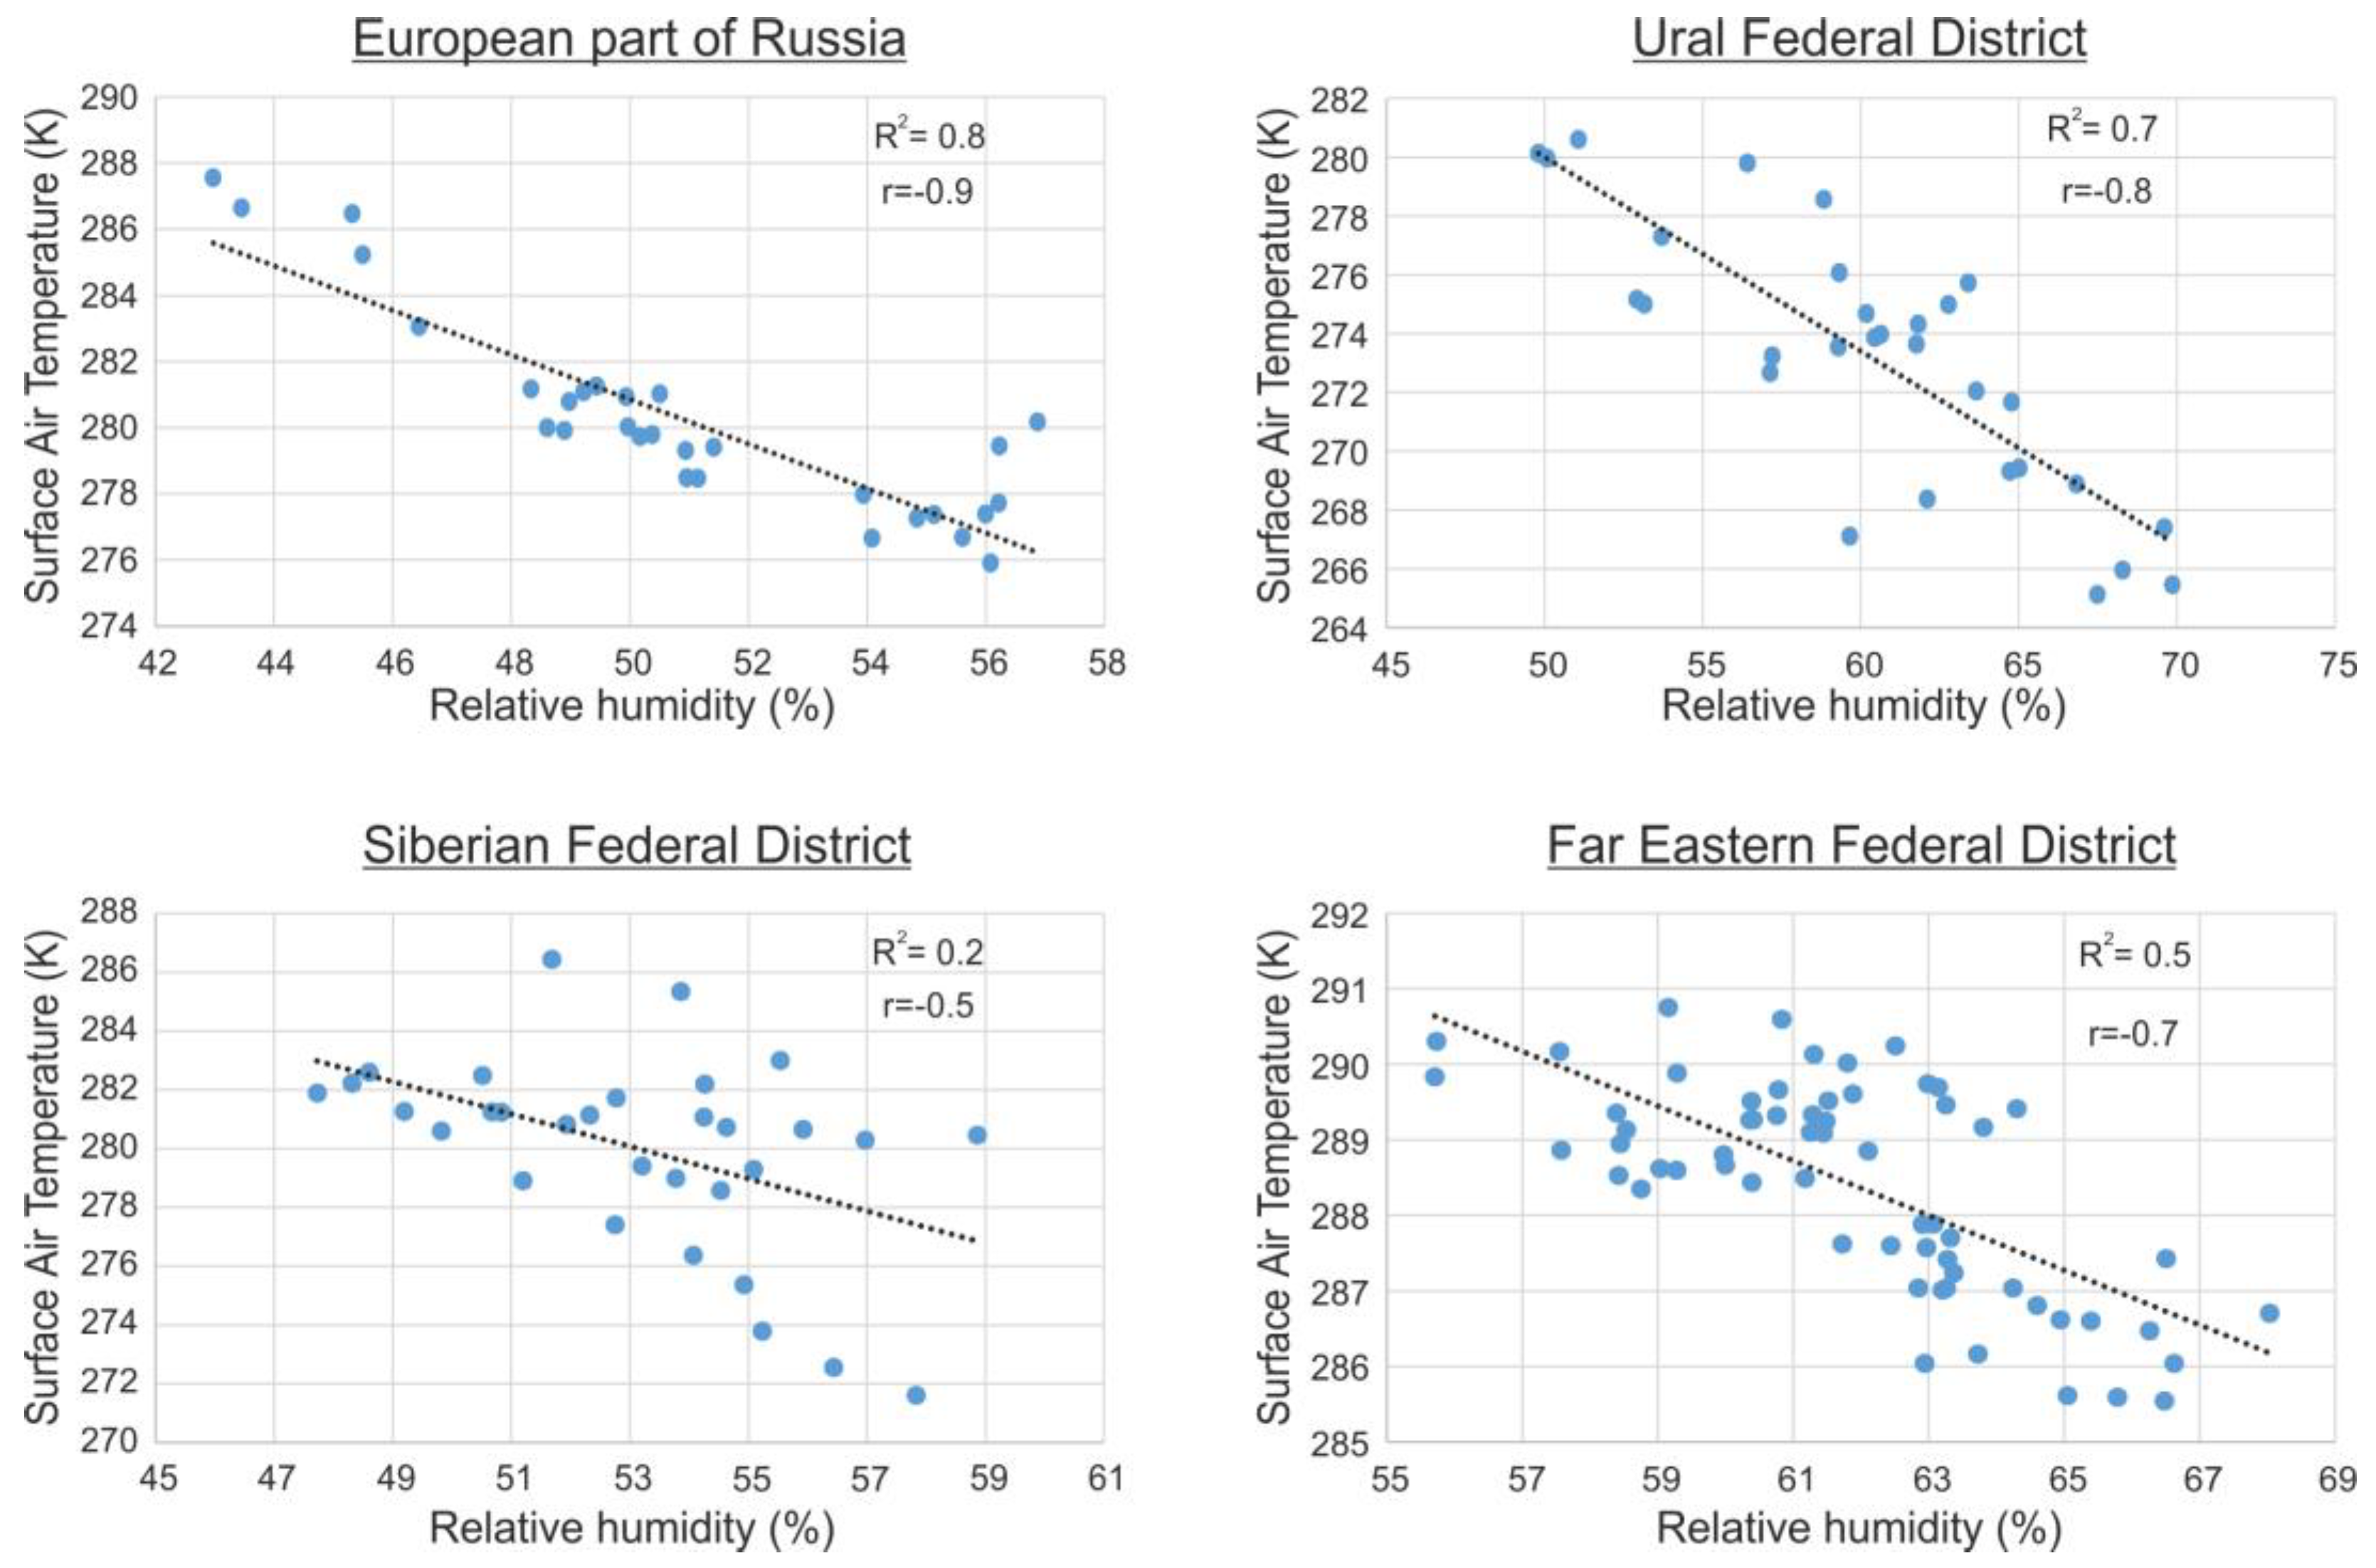
3. Results and Discussion

Figure 1 shows the results of satellite monitoring of wildfire hotspots registered in the territory of the Russian Federation from April to October 2001–2022.
The results of the annual values of burned areas in the territory of Russia during the studied period are presented in Figure 1a. Analyzing it allows us to reveal the years when maximum burned areas were observed, as well as general trends of changes in these areas. The analysis of Figure 1a indicates that the total area of wildfires in Russia in 2003 was 365.5 thous. km2, which is significantly higher than in other years during the studied period. Large burned areas (over 250 thous. km2) were also recorded in 2008 (295.2 thous. km2), 2002 (272.4 thous. km2), 2006 (261.2 thous. km2), and in 2012 (258.4 thous. km2). In 2022, the total area burned by wildfires was minimal for the whole studied period and amounted to 101.3 thous. km2.
The analysis of Figure 1a indicates that there was a trend of decrease in areas burned by wildfires in the territory of Russia over the period from 2001 to 2022.
Figure 1b shows the average annual FRP values of fire pixels detected in Russia in the period from April to October during 2001–2022. The analysis of Figure 1b indicates that there is a quite uniform distribution of average FRP values with a characteristic, growing trend over the 22-year period. At the same time, slight excesses beyond the average FRP level were detected in 2018 (65.1 MW) and in 2021 (77.6 MW).
A comprehensive analysis of Figure 1 shows that the burned areas in Russia were decreasing from 2001 to 2022, while the average annual values of FRP increased. The decrease in annual burned areas is related to improved fire-fighting measures (https://aviales.ru/popup.aspx?news=7642 (accessed on 1 October 2022)), and the increase in the annual average values of FRP is probably associated with global changes in the meteorological situation, characterized by the predominance of more arid conditions, which is confirmed in [13].
Despite the quite uniform distribution of average annual FRP values, statistical analysis of the daily FRP values of all fire pixels detected from 2001 to 2022 revealed high rates of coefficient of excess (239) and asymmetry (10), indicating that the distribution of daily FRP values over the studied period was characterized by significant spikes.
For a more detailed analysis of daily FRP values, five categories of wildfire hotspots of various intensities were identified according to the classification suggested in [45]. The number of wildfires and statistical characteristics of FRP values for these wildfire classes are given in Table 1.
Analysis of Table 1 shows that low-intensity fire pixels with FRP < 100 MW prevailed in Russia during the studied period. Their number was 6,391,961, i.e., about 90% of the total number of registered wildfire hotspots, while the average FRP in this category was 26.7 MW.
The number of high-intensity fire pixels with FRP ≥ 1500 MW was the lowest (7158); the average hotspot FRP in this wildfire category was 2226.6 MW. It should also be pointed out that the most intense fires were characteristic of forest cover (average hotspot FRP value of 2287 MW), which is also consistent with studies [25,31], followed by fires in areas covered with shrub vegetation (average hotspot FRP value of 2229 MW), and then meadow-steppe fires (average hotspot FRP value of 2192 MW).
Figure 2 presents the distribution of wildfire hotspots of various intensities detected by the MODIS instrument during fire seasons (April–October) for the period from 2001 to 2022 in the territories of the Siberian and Far Eastern Federal Districts, which are the most exposed to fire threats [3,12,20,36].
Figure 3 shows monthly wildfire area distributions, based on the results of satellite monitoring of wildfires, for the European part of Russia and three large federal districts: the Ural, Siberian, and Far Eastern, during fire seasons (April–October) for 22 years.
The analysis of Figure 2 and Figure 3 shows that high-intensity fire pixels (FRP ≥ 1500 MW) are distributed the most densely in the Siberian and Far Eastern Federal Districts, where forests and shrubs predominate [11,42].
The analysis of the satellite monitoring results presented in Figure 3 shows that in various regions of Russia, the largest areas of wildfires within a month were recorded: in the European part of Russia in April 2009 (54.27 thous. km2), in the Ural Federal District in April 2009 (21.71 thous. km2), in the Siberian Federal District in May 2003 (100.28 thous. km2), and in the Far Eastern Federal District in July and August 2021 (54.12 thous. km2 and 46.46 thous. km2, respectively).
It should be pointed out that in [46], significant annual burned areas in Siberia were also identified in 2003, 2012, and 2019. However, there are differences in the trend of annual burned areas that are explained by the mismatch of the boundaries of the studied region. We consider this region within the borders of the Siberian Federal District.
A more detailed analysis of the links between the intensity of wildfires and meteorological conditions was carried out for the months with the greatest areas burned by wildfires that occurred in various regions of Russia. These months are highlighted in Figure 3.
For the territory of Russia, a link between large wildfires and atmospheric blocking was found in a number of works [13,16,47,48]. Under conditions of general warming, the role of atmospheric blocking, which contributes to wildfire occurrence, largely increases [49].
Blocking anticyclones are those with areas of surface heights of 500 hPa that obstruct the passage of air masses from west to east in the middle latitudes [50,51,52]. Dipole blocks consisting of an anticyclone and a cyclone, as well as Omega blocks characterized by a large anticyclone surrounded by cyclones, are also considered to be blocking anticyclones [53]. Amplified ridges without any closed contours (e.g., 500 hPa geopotential height) are also able to block the zonal flow and to lead to a dominating meridional flow component, especially in the summer [54,55,56].
Meteorological situations were studied using AIRS (Aqua) data. Geopotential height changes at a level of 500 hPa were mapped, and the graphs of surface air temperature and relative humidity were built using these data.
Figure 4a–d show these characteristics obtained for fires in April 2009 in the European part of Russia.
Using the values for geopotential heights (Figure 4a), the time periods (1–11 April and 19–25 April 2009) were revealed as dates when the presence of a blocking anticyclone was detected in the southern part of the studied area.
A high-pressure field settled in the European part of Russia during the period of 1–11 April 2009 (Figure 4a) and caused dry and hot weather in this region. In the period from 9 April to 13 April 2009, there was an increase in temperature by ~6 K, and a decrease in relative humidity by ~7% (Figure 4d), and that contributed to an increase in the number of wildfires on 12 April 2009 (Figure 4b).
The blocking anticyclone (Figure 4a) in the south of the European part of Russia during 19–25 April 2009 caused a sharp increase in temperature by ~8 K and a humidity decrease by ~7% after 25 April 2009 that contributed to the increased number of wildfires (Figure 4b) and increased FRP. The maximum FRP values for some fire hotspots reached almost 1600 MW on 29 April 2009 (Figure 4c).
The maximum burned area in the Ural Federal District for the period from 2001 to 2022 was in April 2008 (21.71 thous. km2) (Figure 3). Figure 5 provides a detailed analysis of wildfire hotspots detected in this region in April 2008 and background meteorological conditions.
According to the results of a detailed analysis carried out using MODIS (Terra/Aqua satellites) data, the days (10–13, 19, and 21 April 2008) were identified when the number of detected fire pixels exceeded 2000 per day, and their FRP exceeded 1800 MW.
The analysis of meteorological features for the period from 1 to 9 April 2008 allowed us to register an anticyclone in the Ural Federal District (Figure 5a). It contributed to an increased number of wildfires in the period from 10 to 13 April 2008, with the highest on 12 April 2008 (Figure 5b). At the same time, very high humidity on 4–5 April, 7–9 April 2008, and on 14–16 April 2008 (Figure 5d), as well as the decrease in temperature from 13 to 17 April 2008, led to a slowdown in the growth of the number of wildfires in the Ural Federal District. However, a sharp increase in temperature (by ~11 K) that started on 17 April 2008 (Figure 5d), as well as the presence of a blocking anticyclone in the south of the studied region from 14 to 16 April 2008 (Figure 5a), contributed to an increase in the intensity (Figure 5c) and the number of wildfire hotspots that occurred on 19 and 21 April 2008 (Figure 5b).
A decrease in the surface layer temperature and increased humidity during the period from 22 April to 30 April 2008 (Figure 5d) led to a sharp decrease in the number of detected fire hotspots (Figure 5b) and FRP values in this region (Figure 5c).
It should be pointed out that the daily values of the surface layer temperature and relative humidity were negatively correlated (Appendix A, Figure A1); the correlation coefficient between these indicators is quite high and amounted to −0.88. At the same time, the value of p < 0.05 indicates the statistical significance of the correlation coefficient.
The Siberian Federal District is exposed the most frequently to intense wildfires [3,12,21,36], which arise from the interaction of meteorological factors, vegetation, and biogeochemical cycles [46]. The number of fires associated with temperature anomalies has increased over the past decades, and an almost exponential relationship between these factors and annual burned areas was revealed [46,57,58,59].
According to the results of satellite monitoring conducted in the period from 2001 to 2022, the highest recorded value of wildfire areas (100.28 thous. km2) in this region was detected in May 2003 (Figure 3).
Figure 6 presents maps of changes in geopotential heights at a level of 500 hPa (Figure 6a), the number of fire hotspots (Figure 6b), and FRP values (Figure 6c) on various days, as well as graphs of changes in the surface air temperature and relative humidity (Figure 6d) for wildfires in May 2003 in the Siberian Federal District. Dashed line arrows in Figure 6b mark the time periods when blocking anticyclones were observed.
Due to high-pressure areas identified over the southern part of the Siberian Federal District (Figure 6a), as well as a quite high surface air temperature (8–13 K) and low humidity (Figure 6d), a large number of wildfire hotspots, reaching 2000 or more almost every day, was detected using satellite data; on 19 May 2003, the number exceeded 12,000 (Figure 6b).
Between 13 and 20 May 2003, this region experienced an extreme decrease (up to 48%) in relative humidity, with the exception of a surge in its value that occurred on 17 May 2003 (Figure 6d), which also contributed to a significant increase in FRP (Figure 6c) and an increase in the number of wildfire hotspots during these days (Figure 6b).
At the same time, it should be pointed out that the correlation coefficient between the daily values of the surface layer temperature and relative humidity is −0.8, which indicates a strong negative correlation (Figure A1). The value of p < 0.05 allows us to reject the null hypothesis; therefore, the correlation coefficient is statistically significant.
During the periods of increased relative humidity observed from 15 to 17 May and from 20 to 22 May 2003 (Figure 6d), the number of wildfire hotspots and their FRP decreased (Figure 6b,c).
During the period from 25 to 29 May 2003, there was a significant increase in relative humidity (Figure 6d), which slowed down the growth of wildfire numbers in the studied area. Then on 30 and 31 May 2003, there was an increase in temperature (by ~6 K) and a decrease in relative humidity (up to 52%) (Figure 6d), which again led to an increase in the number of wildfire hotspots (Figure 6b) and their FRP (Figure 6c). Despite this, over the studied period, the correlation coefficient between daily surface temperature and relative humidity was −0.47, which reveals a weak negative correlation (Figure A1), and a value of p < 0.05 indicates its statistical significance.
Figure 7 shows the characteristics of meteorological conditions and fire activity in the Far Eastern Federal District in July and August 2021. Anomalously high temperatures contributed to the intensification of the fire hazard situation in these months (Figure 3). The temperatures in June 2021 were ~6.5 K higher than those in 2003–2020, which also follows from [21].
A blocking anticyclone was observed over the territory of the Far Eastern Federal District during the period from 19 July to 25 July 2021 (Figure 7a). It was identified using geopotential heights at the level of 500 hPa. During these days, there were minor changes in temperature and relative humidity. The blocking anticyclone contributed to the increase in intensity (Figure 7c) and in the number of wildfire hotspots, reaching more than 6,000 per day (Figure 7b) from 26 July to 10 August 2021. During this period, sharp fluctuations in temperature (by ~4 K) and relative humidity (from 58% to 64%) were observed (Figure 7d). In general, for the specified period, the daily values of the surface layer temperature and relative humidity were negatively correlated (correlation coefficient is −0.7) with a value of p < 0.05.
From 12 August 2021 to the end of the month, a high-pressure area (Figure 7a) with high humidity (up to 68%) and a temperature drop by ~4 K (Figure 7d) settled over the territory of the Far Eastern Federal District (predominantly over its southern forest part), it contributed to a significant decrease in the intensity (Figure 7c) and in the number of wildfire hotspots (Figure 7b).

4. Conclusions

The results of satellite monitoring of wildfires in Russia and in the territories of its large regions over 22 years are presented in this paper, they allowed us to reveal some patterns in the spatiotemporal distribution of areas and FRP.
Based on the analysis, it was found that there was a trend towards a decrease in the burned areas with a slight increase in the average FRP of hotspots in the territory of Russia during the period from April to October 2001–2022.
It was shown that low-intensity fire pixels (FRP < 100 MW) prevailed in Russia during the studied period. Their number amounted to about 90% of the total number of registered wildfire hotspots. High-intensity fire pixels with FRP ≥ 1500 MW were typical for the Siberian and Far Eastern Federal Districts, whose territories are mostly covered with dense forests and shrubs.
Based on the results of the studies, it was shown that there is a link between intense wildfires and the presence of large stationary anticyclones over the studied territories, which obstructed the normal for middle latitudes passage of air masses from west to east for a long time. They create meteorological conditions resulting in abnormally hot and dry weather that contribute to the occurrence and rapid propagation of wildfires. This is also consistent with [16,46,49]. For much of the globe, burned areas increase when periods of heightened fire weather compound with dry antecedent conditions. Regions associated with wildfire disasters, such as southern Australia and the western USA, are prone to experiencing years of compound drought and fire weather [50].
The obtained results confirm the high efficiency of satellite monitoring data use for the assessment of the spatiotemporal distribution of burned areas and hotspot FRP.
This study can be developed further into a more detailed analysis of regional and intra-seasonal features of the link between the occurrence of intense wildfires, their effects, and blocking activity in the atmosphere, as well as identification of the correlation between FRP and the extent of damage to various types of vegetation cover. Moreover, in the future, it is advisable to use information obtained from satellites of higher spatial resolution to get vegetation cover characteristics. Future studies will include the dynamics of fires of different intensities, as well as longer periods of meteorological situations during and after wildfires, including comparison with data from past years.

Author Contributions

V.G.B., K.A.G. and O.S.V. chose the topic of the research, test sites, and satellite data used for the research. V.G.B. and K.A.G. proposed a method used to estimate wildfire areas. A.L.Z., K.A.G. and N.V.F. performed calculations and statistical analyses of the obtained results. O.S.V. assessed the daily average values of the surface temperature and relative humidity and also analyzed the change in geopotential heights for the studied areas. All authors have read and agreed to the published version of the manuscript.

Funding

The work was carried out with the financial support of the project by the Ministry of Science and Higher Education of the Russian Federation, the Agreement No. 075-15-2020-776.

Institutional Review Board Statement

Not Applicable.

Informed Consent Statement

We confirm that neither the manuscript nor any parts of its content are currently under consideration or published in another journal. All authors have approved the manuscript and agree with its submission to Fire. We have no conflicts of interest to disclose.

Data Availability Statement

Publicly available datasets were analyzed in this study. These datacan be found here: https://ladsweb.modaps.eosdis.nasa.gov (accessed on 1 October 2022), https://firms.modaps.eosdis.nasa.gov (accessed on 1 October 2022).

Conflicts of Interest

The authors declare that the research was conducted in the absence of any commercial or financial relationships that could be construed as a potential conflict of interest.

Appendix A

Figure A1. Graphs of correlation between surface air temperature and relative humidity.
Fire 06 00099 g0a1

References

  1. Bondur, V.G. Satellite monitoring of wildfires during the anomalous heat wave of 2010 in Russia. Izv. Atmos. Ocean. Phys. 2011, 47, 1039–1048. [Google Scholar] [CrossRef]
  2. Bondur, V.G. Satellite monitoring of trace gas and aerosol emissions during wildfires in Russia. Izv. Atmos. Ocean. Phys. 2016, 52, 1078–1091. [Google Scholar] [CrossRef]
  3. Bondur, V.G.; Gordo, K.A.; Kladov, V.L. Spacetime distributions of wildfire areas and emissions of carboncontaining gases and aerosols in northern Eurasia according to satellite-monitoring data. Izv. Atmos. Ocean. Phys. 2017, 53, 859–874. [Google Scholar] [CrossRef]
  4. Shvidenko, A.Z.; Shchepashchenko, D.G.; Vaganov, E.A.; Sukhinin, A.I.; Maksyutov, S.S.; McCallum, I.; Lakyda, I.P. Impact of Wildfire in Russia between 1998–2010 on Ecosystems and the Global Carbon Budget. Dokl. Earth Sci. 2011, 441, 1678–1682. [Google Scholar] [CrossRef]
  5. Bartalev, S.A.; Egorov, V.A.; Efremov, V.Y.; Loupian, E.A.; Stytsenko, F.V.; Flitman, E.V. Integrated burnt area assessment based on combine use of multi-resolution MODIS and Landsat-TM/ETM+ satellite data. Sovrem. Probl. Distantsionnogo Zondirovaniya Zemli Kosm. 2012, 9, 9–26. (In Russian) [Google Scholar]
  6. Tomshin, O.A.; Solovyev, V.S. Features of forest fire activity in boreal forests of the permafrost region of Eastern Siberia. Sovrem. Probl. Distantsionnogo Zondirovaniya Zemli Kosm. 2018, 15, 261–271. (In Russian) [Google Scholar] [CrossRef]
  7. Jolly, W.M.; Cochrane, M.A.; Freeborn, P.H.; Holden, Z.A.; Brown, T.J.; Williamson, G.J.; Bowman, D.M. Climate-induced variations in global wildfire danger from 1979 to 2013. Nat. Commun. 2015, 6, 7537. [Google Scholar] [CrossRef] [Green Version]
  8. Crockett, J.L.; Westerling, A.L. Greater temperature and precipitation extremes intensify Western, U.S. droughts, wildfire severity, and sierra Nevada tree mortality. J. Clim. 2018, 31, 341–354. [Google Scholar] [CrossRef]
  9. Trauernicht, C. Vegetation-Rainfall interactions reveal how climate variability and climate change alter spatial patterns of wildland fire probability on Big Island, Hawaii. Sci. Total Environ. 2019, 650, 459–469. [Google Scholar] [CrossRef]
  10. Bondur, V.G.; Tsidilina, M.N.; Kladov, V.L.; Gordo, K.A. Irregular variability of spatiotemporal distributions of wildfires and emissions of harmful trace gases in Europe based on satellite monitoring data. Dokl. Earth Sci. 2019, 485, 461–464. [Google Scholar] [CrossRef]
  11. Bondur, V.G.; Tsidilina, M.N.; Cherepanova, E.V. Satellite monitoring of wildfire impacts on the conditions of various types of vegetation cover in the federal districts of the Russian Federation. Izv. Atmos. Ocean. Phys. 2019, 55, 1238–1253. [Google Scholar] [CrossRef]
  12. Bondur, V.G.; Voronova, O.S.; Cherepanova, E.V.; Tsidilina, M.N.; Zima, A.L. Spatiotemporal Analysis of Multi-Year Wildfires and Emissions of Trace Gases and Aerosols in Russia Based on Satellite Data. Izv. Atmos. Ocean. Phys. 2020, 56, 1457–1469. [Google Scholar] [CrossRef]
  13. Bondur, V.G.; Mokhov, I.I.; Voronova, O.S.; Sitnov, S.A. Satellite monitoring of Siberian wildfires and their effects: Features of 2019 anomalies and trends of 20-year changes. Dokl. Earth Sci. 2020, 492, 370–375. [Google Scholar] [CrossRef]
  14. Mokhov, I.I.; Semenov, V.A.; Khon, V.C. Estimates of possible regional hydrologic regime changes in the 21st century based on global climate models. Izv. Atmos. Ocean. Phys. 2003, 39, 130–144. [Google Scholar]
  15. Zhong, S.; Yu, L.; Heilman, W.E.; Bian, X.; Fromm, H. Synoptic weather patterns for large wildfires in the northwestern United States—A climatological analysis using three classification methods. Theor. Appl. Climatol. 2020, 141, 1057–1073. [Google Scholar] [CrossRef]
  16. Mokhov, I.I.; Bondur, V.G.; Sitnov, S.A.; Voronova, O.S. Satellite Monitoring of Wildfires and Emissions into the Atmosphere of Combustion Products in Russia: Relation to Atmospheric Blockings. Dokl. Earth Sci. 2020, 495, 921–924. [Google Scholar] [CrossRef]
  17. Mokhov, I.I. Russian climate research in 2015–2018. Izv. Atmos. Ocean. Phys. 2020, 56, 325–343. [Google Scholar] [CrossRef]
  18. Earl, N.; Simmonds, I. Spatial and temporal variability and trends in 2001–2016 global fire activity. J. Geophys. Res. Atmos. 2018, 123, 2524–2536. [Google Scholar] [CrossRef]
  19. Bondur, V.G.; Gordo, K.A.; Voronova, O.S.; Zima, A.L. Satellite Monitoring of Anomalous Wildfires in Australia. Front. Earth Sci. 2021, 8, 617252. [Google Scholar] [CrossRef]
  20. Bondur, V.G.; Voronova, O.S.; Gordo, K.A.; Zima, A.L. Satellite Monitoring of the Variability of Wildfire Areas and Emissions of Harmful Gas Components into the Atmosphere for Various Regions of Russia over a 20-Year Period. Dokl. Earth Sci. 2021, 500, 890–894. [Google Scholar] [CrossRef]
  21. Voronova, O.S.; Gordo, K.A.; Zima, A.L.; Feoktistova, N.V. Strong Natural Fires in the Russian Federation in 2021 Detected Using Satellite Data. Izv. Atmos. Ocean. Phys. 2022, 58, 1065–1076. [Google Scholar] [CrossRef]
  22. Chen, D.; Pereira, J.M.C.; Masiero, A.; Pirotti, F. Mapping fire regimes in China using MODIS active fire and burned area data. Appl. Geogr. 2017, 85, 14–26. [Google Scholar] [CrossRef]
  23. Wei, X.; Wang, G.; Chen, T.; Hagan, D.F.T.; Ullah, W. A Spatio-Temporal Analysis of Active Fires over China during 2003–2016. Remote Sens. 2020, 12, 1787. [Google Scholar] [CrossRef]
  24. Cattau, M.E.; Wessman, C.; Mahood, A.; Balch, J.K. Anthropogenic and lightning-started fires are becoming larger and more frequent over a longer season length in the U.S.A. Glob. Ecol. Biogeogr. 2020, 29, 668–681. [Google Scholar] [CrossRef]
  25. Kganyago, M.; Shikwambana, L. Assessment of the Characteristics of Recent Major Wildfires in the USA, Australia and Brazil in 2018–2019 Using Multi-Source Satellite Products. Remote Sens. 2020, 12, 1803. [Google Scholar] [CrossRef]
  26. Hall, R.J.; Skakun, R.S.; Metsaranta, J.M.; Landry, R.; Fraser, R.H.; Raymond, D.; Gartrell, M.; Decker, V.; Little, J. Generating Annual Estimates of Forest Fire Disturbance in Canada: The National Burned Area Composite. Int. J. Wildland Fire. 2020, 29, 878–891. [Google Scholar] [CrossRef]
  27. Ardakani, A.S.; Valadan Zoej, M.J.; Mohammadzadeh, A.; Mansourian, A. Spatial and temporal analysis of fires detected by MODIS data in northern iran from 2001 to 2008. IEEE J. Sel. Top. Appl. Earth Obs. Remote Sens. 2011, 4, 216–225. [Google Scholar] [CrossRef]
  28. Filkov, A.; Ngo, T.; Matthews, S.; Telfer, S.; Penman, T. Impact of Australia’s catastrophic 2019/20 bushfire season on communities and environment. Retrospective analysis and current trends. J. Saf. Sci. Resil. 2020, 1, 44–56. [Google Scholar] [CrossRef]
  29. Desservettaz, M.; Paton-Walsh, C.; Griffith, D.W.; Kettlewell, G.; Keywood, M.D.; Vanderschoot, M.V.; Ward, J.; Mallet, M.D.; Milic, A.; Miljevic, B.; et al. Emission factors of trace gases and particles from tropical savanna fires in Australia. J. Geophys. Res. Atmos. 2017, 122, 6059–6074. [Google Scholar] [CrossRef]
  30. Silva, C.V.; Aragão, L.E.; Barlow, J.; Espirito-Santo, F.; Young, P.J.; Anderson, L.O.; Farias, R. Drought-induced Amazonian wildfires instigate a decadal-scale disruption of forest carbon dynamics. Philos. Trans. R. Soc. B Biol. Sci. 2018, 373, 20180043. [Google Scholar] [CrossRef] [Green Version]
  31. Vadrevu, K.; Csiszar, I.; Ellicott, E.A.; Giglio, L.; Badarinath, K.V.S.; Vermote, E.; Justice, C. Hotspot Analysis of Vegetation Fires and Intensity in the Indian Region. IEEE J. Sel. Top. Appl. Earth Obs. Remote Sens. 2012, 6, 224–238. [Google Scholar] [CrossRef]
  32. Vadrevu, K.P.; Lasko, K.; Giglio, L.; Schroeder, W.; Biswas, S.; Justice, C. Trends in Vegetation fires in South and Southeast Asian Countries. Sci. Rep. 2019, 9, 7422. [Google Scholar] [CrossRef] [Green Version]
  33. Palumbo, I.; Grégoire, J.; Simonetti, D.; Punga, M. Spatio-temp oral distribution of fire activity in protected areas of Sub-Saharan Africa derived from MODIS data. Procedia Environ. Sci. 2011, 7, 26–31. [Google Scholar] [CrossRef]
  34. Molinario, G.; Davies, D.K.; Schroeder, W.; Justice, C.O. Characterizing the spatio-temporal fire regime in Ethiopia using the MODIS-active fire product: A replicable methodology for country-level fire reporting. Afr. Geogr. Rev. 2014, 33, 99–123. [Google Scholar] [CrossRef]
  35. Heisig, J.; Olson, E.; Pebesma, E. Predicting Wildfire Fuels and Hazard in a Central European Temperate Forest Using Active and Passive. Fire 2022, 5, 29. [Google Scholar] [CrossRef]
  36. Bondur, V.G.; Gordo, K.A. Satellite monitoring of burnt-out areas and emissions of harmful contaminants due to forest and other wildfires in Russia. Izv. Atmos. Ocean. Phys. 2018, 54, 955–965. [Google Scholar] [CrossRef]
  37. Justice, C.O.; Giglio, L.; Korontzi, S.; Owens, J.; Morisette, J.T.; Roy, D.; Descloitres, J.; Alleaume, S.; Petitcolin, F.; Kaufman, Y. The Modis fire products. Remote Sens. Environ. 2002, 83, 244–262. [Google Scholar] [CrossRef]
  38. Kaufman, Y.; Remen, L.; Ottmar, R.; Ward, D.; Rong, R.L.; Kleifman, R.; Fraser, R.; Flynn, L.; McDougal, D.; Shelton, G. Relationship between remotely sensed fire intensity and rate of emission of smoke: SCAR-C experiment. In Global Biomass Burning; Levine, J., Ed.; MIT Press: Cambridge, MA, USA, 1996; pp. 685–696. [Google Scholar]
  39. Wooster, M.J. Small-scale experimental testing of fire radiative energy for quantifying mass combusted in natural vegetation fires. Geophys. Res. Lett. 2002, 29, 2027. [Google Scholar] [CrossRef]
  40. Giglio, L.; Schroeder, W.; Justice, C.O. The collection 6 MODIS active fire detection algorithm and fire products. Remote Sens. Environ. 2016, 178, 31–41. [Google Scholar] [CrossRef] [Green Version]
  41. Friedl, M.A.; Sulla-Menashe, D.; Tan, B.; Schneider, A.; Ramankutty, N.; Sibley, A.; Huang, X. MODIS Collection 5 global land cover: Algorithm refinements and characterization of new datasets. Remote Sens. Environ. 2010, 114, 168–182. [Google Scholar] [CrossRef]
  42. Bondur, V.G.; Gordo, K.A.; Zima, A.L. Satellite research of wildfire effects on the territory of Russia for various types of vegetation cover. Issled. Zemli Kosm. 2022, 74–86. (In Russian) [Google Scholar] [CrossRef]
  43. Heward, H.; Smith, A.M.S.; Roy, D.P.; Tinkham, W.T.; Hoffman, C.M.; Morgan, P.; Lannom, K.O. Is burn severity related to fire intensity? Observations from landscape scale remote sensing. Intern. J. Wildland Fire. 2013, 22, 910–918. [Google Scholar] [CrossRef]
  44. Tian, B.; Manning, E.; Fetzer, E.; Olsen, E.; Wong, S.; Susskind, J.; Iredell, L. AIRS/AMSU/HSB Version 6 Level 3 Product User Guide; Tech Rep; Jet Propulsion Laboratory: Pasadena, CA, USA, 2013. [Google Scholar]
  45. Ichoku, C.; Giglio, L.; Wooster, M.J.; Remer, L.A. Global characterization of biomass-burning patterns using satellite measurements of fire radiative energy. Remote Sens. Environ. 2008, 112, 2950–2962. [Google Scholar] [CrossRef]
  46. Kharuk, V.I.; Ponomarev, E.I.; Ivanova, G.A.; Dvinskaya, M.L.; Coogan, S.C.P.; Flannigan, M.D. Wildfires in the Siberian taiga. Ambio 2021, 50, 1953–1974. [Google Scholar] [CrossRef]
  47. Mokhov, I.I.; Timazhev, A.V. Atmospheric Blocking and Changes in Its Frequency in the 21st Century Simulated with the Ensemble of Climate Models. Russ. Meteorol. Hydrol. 2019, 44, 369–377. [Google Scholar] [CrossRef]
  48. Mokhov, I.I.; Sitnov, S.A.; Tsidilina, M.N.; Voronova, O.S. Relation between pyrogenic NO2 emissions from wildfires in Russia and atmospheric blocking events. Atmos. Ocean. Opt. 2021, 34, 503–506. [Google Scholar] [CrossRef]
  49. Mokhov, I.I.; Timazhev, A.V. Assessing the probability of El Niño-related weather and climate anomalies in Russian regions. Russ. Meteorol. Hydrol. 2017, 42, 635–643. [Google Scholar] [CrossRef]
  50. Lupo, A.R.; Smith, P.J. Climatological features of blocking anticyclones in the Northern Hemisphere. Tellus A Dyn. Meteorol. Oceanogr. 1995, 47, 439–456. [Google Scholar] [CrossRef] [Green Version]
  51. Pelly, J.L.; Hoskins, B.J. A New Perspective on Blocking. J. Atmos. Sci. 2003, 60, 743–755. [Google Scholar] [CrossRef]
  52. Sitnov, S.A.; Mokhov, I.I. Anomalous transboundary transport of the products of biomass burning from North American wildfires to Northern Eurasia. Dokl. Earth Sci. 2017, 475, 832–835. [Google Scholar] [CrossRef]
  53. Ser-Giacomi, E.; Vasile, R.; Recuerda, I.; HernándezGarcía, E.; López, C. Dominant transport pathways in an atmospheric blocking event. Chaos 2015, 25, 087413. [Google Scholar] [CrossRef] [PubMed] [Green Version]
  54. Sousa, P.M.; Trigo, R.M.; Barriopedro, D.; Soares, P.M.M.; Santos, J.A. European temperature responses to blocking and ridge regional patterns. Clim. Dynam. 2018, 50, 457–477. [Google Scholar] [CrossRef]
  55. Woollings, T.; Barriopedro, D.; Methven, J.; Son, S.-W.; Martius, O.; Harvey, B.; Sillmann, J.; Lupo, A.R.; Seneviratne, S. Blocking and its response to climate change. Curr. Clim. Chang. Rep. 2018, 4, 287–300. [Google Scholar] [CrossRef] [PubMed] [Green Version]
  56. Kautz, L.-A.; Martius, O.; Pfahl, S.; Pinto, J.G.; Ramos, A.M.; Sousa, P.M.; Woolling, T. Atmospheric blocking and weather extremes over the Euro-Atlantic sector—A review. Weather Clim. Dynam. 2022, 3, 305–336. [Google Scholar] [CrossRef]
  57. Descals, A.; Gaveau, D.L.A.; Verger, A.; Sheil, D.; Naito, D.; Peñuelas, J. Unprecedented fire activity above the Arctic Circle linked to rising temperatures. Science 2022, 378, 532–537. [Google Scholar] [CrossRef]
  58. Voronova, O.S.; Zima, A.L.; Kladov, V.L.; Cherepanova, E.V. Anomalous Wildfires in Siberia in Summer 2019. Izv. Atmos. Ocean. Phys. 2020, 56, 1042–1052. [Google Scholar] [CrossRef]
  59. Richardson, D.; Black, A.S.; Irving, D.; Matear, R.J.; Monselesan, D.P.; Risbey, J.S.; Squire, D.T.; Tozer, C.R. Global increase in wildfire potential from compound fire weather and drought. NPJ Clim. Atmos. Sci. 2022, 5, 23. [Google Scholar] [CrossRef]
Figure 1. Results of satellite monitoring of wildfire hotspots in Russia from April to October 2001–2022: annual burned areas with a linear trend (a); average annual FRP with a linear trend (b).
Fire 06 00099 g001
Figure 2. Spatial distribution of wildfire hotspots of various intensities for the territories of the Siberian and Far Eastern Federal Districts detected by the MODIS instrument during fire seasons (April–October) in 2001–2022.
Fire 06 00099 g002
Figure 3. Monthly distribution of wildfire areas with highlighted maximum values during fire seasons (April–October) in 2001–2022 in the European part of Russia (a), as well as in three large Federal Districts: Ural (b), Siberian (c), and Far Eastern (d) during fire seasons (April–October) in 2001–2022.
Fire 06 00099 g003
Figure 4. Changes in meteorological conditions and fire activity in the European part of Russia in April 2009: maps of geopotential height changes (a); distribution of the daily number of wildfire hotspots (b); distribution of daily FRP values (c); changes in the surface air temperature and relative humidity (d).
Fire 06 00099 g004
Figure 5. Changes in meteorological conditions and fire activity in the Ural Federal District in April 2008: maps of geopotential height changes (a); distribution of the daily number of wildfire hotspots (b); distribution of daily FRP values (c); changes in the surface air temperature and relative humidity (d).
Fire 06 00099 g005
Figure 6. Changes in meteorological conditions and fire activity in the Siberian Federal District in May 2003: maps of geopotential height changes (a); distribution of the daily number of wildfire hotspots (b); distribution of daily FRP values (c); changes in the surface air temperature and relative humidity (d).
Fire 06 00099 g006
Figure 7. Changes in meteorological conditions and fire activity in the Far Eastern Federal District in July and August 2021: maps of geopotential height changes (a); distribution of the daily number of wildfire hotspots (b); distribution of daily FRP values (c); changes in the surface air temperature and relative humidity (d).
Fire 06 00099 g007
Table 1. Classification and statistics of wildfire hotspots detected in Russia during the 2001–2022 fire seasons based on FRP values.
MWNumber of HotspotsAverage Value, MWStandard Deviation
FRP < 1006,391,96126.721.2
100 ≤ FRP < 500622,583187.489.1
500 ≤ FRP < 100042,382675.8135.1
1000 ≤ FRP < 150090501198.4139.3
FRP ≥ 150071582226.6921
Disclaimer/Publisher’s Note: The statements, opinions and data contained in all publications are solely those of the individual author(s) and contributor(s) and not of MDPI and/or the editor(s). MDPI and/or the editor(s) disclaim responsibility for any injury to people or property resulting from any ideas, methods, instructions or products referred to in the content.

