Article

Assessing the Fire-Modified Meteorology of the Grassland and Forest Intersection Zone in Mongolia Using the WRF-Fire Model

National Institute of Natural Hazards, Ministry of Emergency Management of China, Beijing 100085, China
*
Author to whom correspondence should be addressed.
Fire 2023, 6(11), 443; https://doi.org/10.3390/fire6110443
Submission received: 20 October 2023 / Revised: 9 November 2023 / Accepted: 10 November 2023 / Published: 18 November 2023
(This article belongs to the Special Issue Vegetation Fires and Biomass Burning in Asia)

Abstract

:
Climate change is already significantly affecting the frequency of wildfires in most regions of the world, and the risk of wildfires is expected to amplify further with global warming. Accordingly, there is growing concern about the mechanisms and impacts of extreme fires. In this study, a coupling of the Weather Research and Forecasting model and the Rothermel Fire model (WRF-Fire) is employed to reproduce the spread of fire within the national boundary of inner Mongolia from 21 to 27 May 2009. Simulations were run with or without feedback from fire-to-atmosphere models, and the study focused on how the energy flux of simulated fires changes the local meteorological environment. The coupled simulation could reproduce the burned area well, and the wind speed was the dominant factor in the fire spread, with a maximum value no more than 6.4 m/s, when the terrain height changes little and the proportion of grassland is low. After the feedback, the propagation speed of the fire accelerated, accompanying the release of latent and sensible heat, and local circulation formed near the front of the fire, leading to a convergence and divergence zone in the downwind area. It is worth noting that during a period of more than 140 h of simulation, the area of the fire field increased by 17% from ignition time. Therefore, considering the fire–atmosphere interaction is necessary for accurately predicting fire behavior.

1. Introduction

Climate change has been a key factor in the increasing risk and scope of wildfires worldwide [1]. The risk of wildfires depends on many factors, including synoptic conditions (wind speed, precipitation, temperature, etc.), background climate (soil moisture, drought, etc.) and vegetation type (trees, shrubs, and others). All of these factors are closely linked, directly or indirectly, to climate internal variability and climate change. For example, the drying of organic matter in forests (fuels that burn and spread wildfires) has been exacerbated by climate change, doubling the number of fires in the western United States between 1984 and 2015 [2]. Variations in weather and climate affect wildfire activity by regulating vegetation production and the moisture content of fuels. Insufficient precipitation can cause water shortages and increase the flammability of fuel [3]. As global warming continues, the severity of wildfire occurrence will be further enhanced. This is derived from the overlap of the long-term effects of climate change on fuel types with the short-term effects of weather pattern change on fire risk and fire behavior [4]. Wildfires are highly complex physicochemical phenomena on Earth that involve the combustion process, the local atmospheric environment, and the interaction between topographic and vegetative features. Although wildfires in the steppe appear to be relatively mild compared to devastating high-intensity fires—which are also a special case which has generated great interest—they not only contribute to a large proportion of wildfires worldwide, but the fires from fine fuels, such as grass, are also highly sensitive to wind. Changes in wind speed or direction can lead to rapid changes in fire behavior, which can pose a potential threat to firefighting operations [5].
Wind accelerates the evaporation of fuels and makes them dry and flammable; at the same time, it continuously replenishes oxygen, improves the combustion conditions in the combustion area, and ultimately accelerates the combustion process [6]. In addition, stronger wind may result in stronger atmospheric turbulence, which often produces “flying fires”, generating new fire sources outside the fire front and forming new fire spots. In the empirical-based fire spread model, environmental conditions are assumed to remain static, and the rate and behavior of spread are related to the conditions at observation stations near to where the fire is occurring. These environmental conditions include weather, fuel type, fuel moisture, and local topography [7,8]. When the local conditions are accurately described and do not vary much in time or space, i.e., have long-term stability, the fire prediction produced by empirical models is sufficient for forecasting. However, when fuels are particularly dry and the moisture in the atmosphere is low, atmospheric conditions change rapidly, and fires severely affect the local circulation; as such, in the case of intense fires on steep terrain, an empirical-based model may not be able to perform well based on the nearly observational data. For example, when the 2003 Canberra (Australia) fires broke out, strong winds and steep terrain drove the fires laterally, resulting in at least one fire tornado [9,10]. Therefore, the influence of complex local circulation on fire behavior and spread should be fully considered.
As the driving force of meteorological conditions, provided the combustion model is in an offline form, it is impossible to characterize the feedback mechanism between the fire and the environmental field, which directly limits the application of these models in the prediction of fire front propagation. The coupling of the mesoscale numerical weather model with the physical or empirical-based fire field spread model provides an effective way to solve this problem.
Work on the coupling of atmosphere and fire models began in the mid-1990s [11], which presented numerical models of the atmosphere that can be fully combined with the empirical-based fire field spread model. The research simulation reproduces many characteristics of the observed fire, including the convection caused by the fire interacting with the wind speed at the fire front to form a parabolic shape, addressing that the interactions between the atmosphere and the fire play a crucial role in determining the behavior and spread of fire. In addition, the fire-generated heat flux changes the surrounding atmospheric circulation (plume-dominated fires) and exerts a small-scale dynamic effect on the fire front itself. More complex combustion parameterizations and simulations for comparison with observational data are discussed in the following referenced studies [12,13].
After the models are coupled, as outlined above, the atmosphere–fire model develops in two different directions. In the first direction, turbulent airflows within the atmosphere are reproduced in a relatively small area at a very high resolution (in the order of 1 m), including detailed parameterization of the chemical and physical combustion processes of the fuels, such as FIRETEC [7], the wildland fire dynamics simulator [14], the FARSITE system developed by the US Forest Service at their Rocky Mountain Research Workstation, and the MesoNH-ForeFire model, which was developed in France [15]. The second direction taken is to combine highly simplified, empirical- or semi-empirical-based fire models with relatively complete numerical weather prediction models with resolutions of several hundred meters or higher. One of the most prominent examples is the Weather and Research Forecast model known as WRF-Fire [16], which needs fine terrain and fuel types as input and is applied in various countries around the world [17,18,19].
Studying fire–atmospheric feedback through observational data is challenging, and it has been difficult to conduct comprehensive meteorological observations and controlled experiments on fires in China. However, an alternative approach is to analyze the results of high-resolution coupled fire–atmosphere simulations, which provide an opportunity to study how fires change the structure of the surrounding atmosphere. The aim of the current study is to use numerical simulations to better understand fire–atmosphere interactions in the context of fire by employing the coupled WRF and FIRE model.

2. Materials and Methods

2.1. Study Area

The Inner Mongolian grassland is an important ecological barrier in the north of China and has been the foundation for the development of animal husbandry. This environment is central to the survival of herders, is an essential gene pool for maintaining biodiversity in China, and is an important material base for maintaining the national ecosystem and promoting sustainable socioeconomic development. The grassland area in Inner Mongolia is geographically connected to the forest; as such, the forest undergrowth accounts for a large proportion of grassland. Thus, once the grassland is on fire, it easily moves into the forest area, resulting in forest fires and posing a significant threat to the forest. The area used for our study includes arid and semi-arid areas, which are ecologically fragile and sensitive to climate change, and the grassland fires here are numerous and scattered. Eastern Mongolia is a vast and sparsely populated region with abundant forest and grass resources and is an extremely active area for wildfires, putting greater pressure on forest and grassland fire prevention in neighboring regions of China.

2.2. The Fire Situation

The Hinggan League in Inner Mongolia is in the transition zone from the Greater Khingan to the Songnen Plain, and most of the forest resources are distributed in the Arxan region on the border with Mongolia. The main vegetation includes the larch, the birch, and the mountain poplar, and more than 90% of the fuel load is miscellaneous multiyear wood and weeds. At 16:00 on 20 May 2009, a forest and grassland fire was found in Mongolia; the fire continued to develop and spread to the border areas of Arxan and the Hinggan League in Inner Mongolia, posing a significant threat to forest resources. The temperature in the fire area reached 27 °C in the first few days, and the northwest wind was 4–5 m/s, with gusts reaching 6–7 m/s, which made blocking and fighting the fire very difficult. Under the joint action of the fire separation belt and manual firefighting, the grassland fire was successfully stopped near the border and put out at 08:00 on the 26th (UTC, universal time, the same below), having lasted for 6 days or 144 h.
The meteorological conditions during the fire can be divided into four stages according to changes in the wind field based on the NCEP FNL reanalysis (https://rda.ucar.edu/datasets/ds083.2/, accessed on 1 November 2023). At 12:00 on 21 May, the fire area was at the front of the surface high pressure, and the wind direction was northwesterly. Then, the surface high pressure moved to the southwest and gradually weakened, and the wind direction changed to a southerly wind at 18:00 on May 21. At 06:00 on the 22nd, a cyclone moving from Lake Baikal gradually approached. At 18:00 on the 23rd, the cyclone split into two parts. The southern cyclone was in Hulun Lake, and the wind direction of the fire domain turned to the southeast; on the 24th, the fire area was covered by clouds all day. At 00:00 on the 25th, affected by the development of a high-altitude trough, the split cyclones merged, and the cyclones strengthened. After that, the cyclone moved to the northeast, and the wind direction changed to the northwest at 06:00. On May 22 and 23, the fire region was affected by high pressure, and the wind speed was low, representing a good time to put out the fire (Figure 1).

2.3. WRF-Fire

The WRF is widely used in regional and global climate or weather simulation studies after WRFV3.2, which is coupled with a fire spread model to achieve two-way feedback between the fire and meteorological fields. The properties of surface fuels, local terrain height, and wind speed determine the speed and direction of fire spread; at the same time, the combustion releases heat and water vapor to the surrounding atmosphere, which in turn changes the meteorological conditions in the near-surface layer [20].

2.4. Fuel Description

Different fuel types have different combustibility and forest fire behavior. Accurate description of the spatial distribution of fuel types provides basic data for forest fire forecasting [21], and are also necessary to predict forest fire behavior. However, we still lack a basic database for the classification of fuels in China. Therefore, in this paper land cover data from the FROM–GLC (Finer Resolution Observation Monitoring of Global Land Cover), with a 30 m resolution, are used to determine the fuel types (
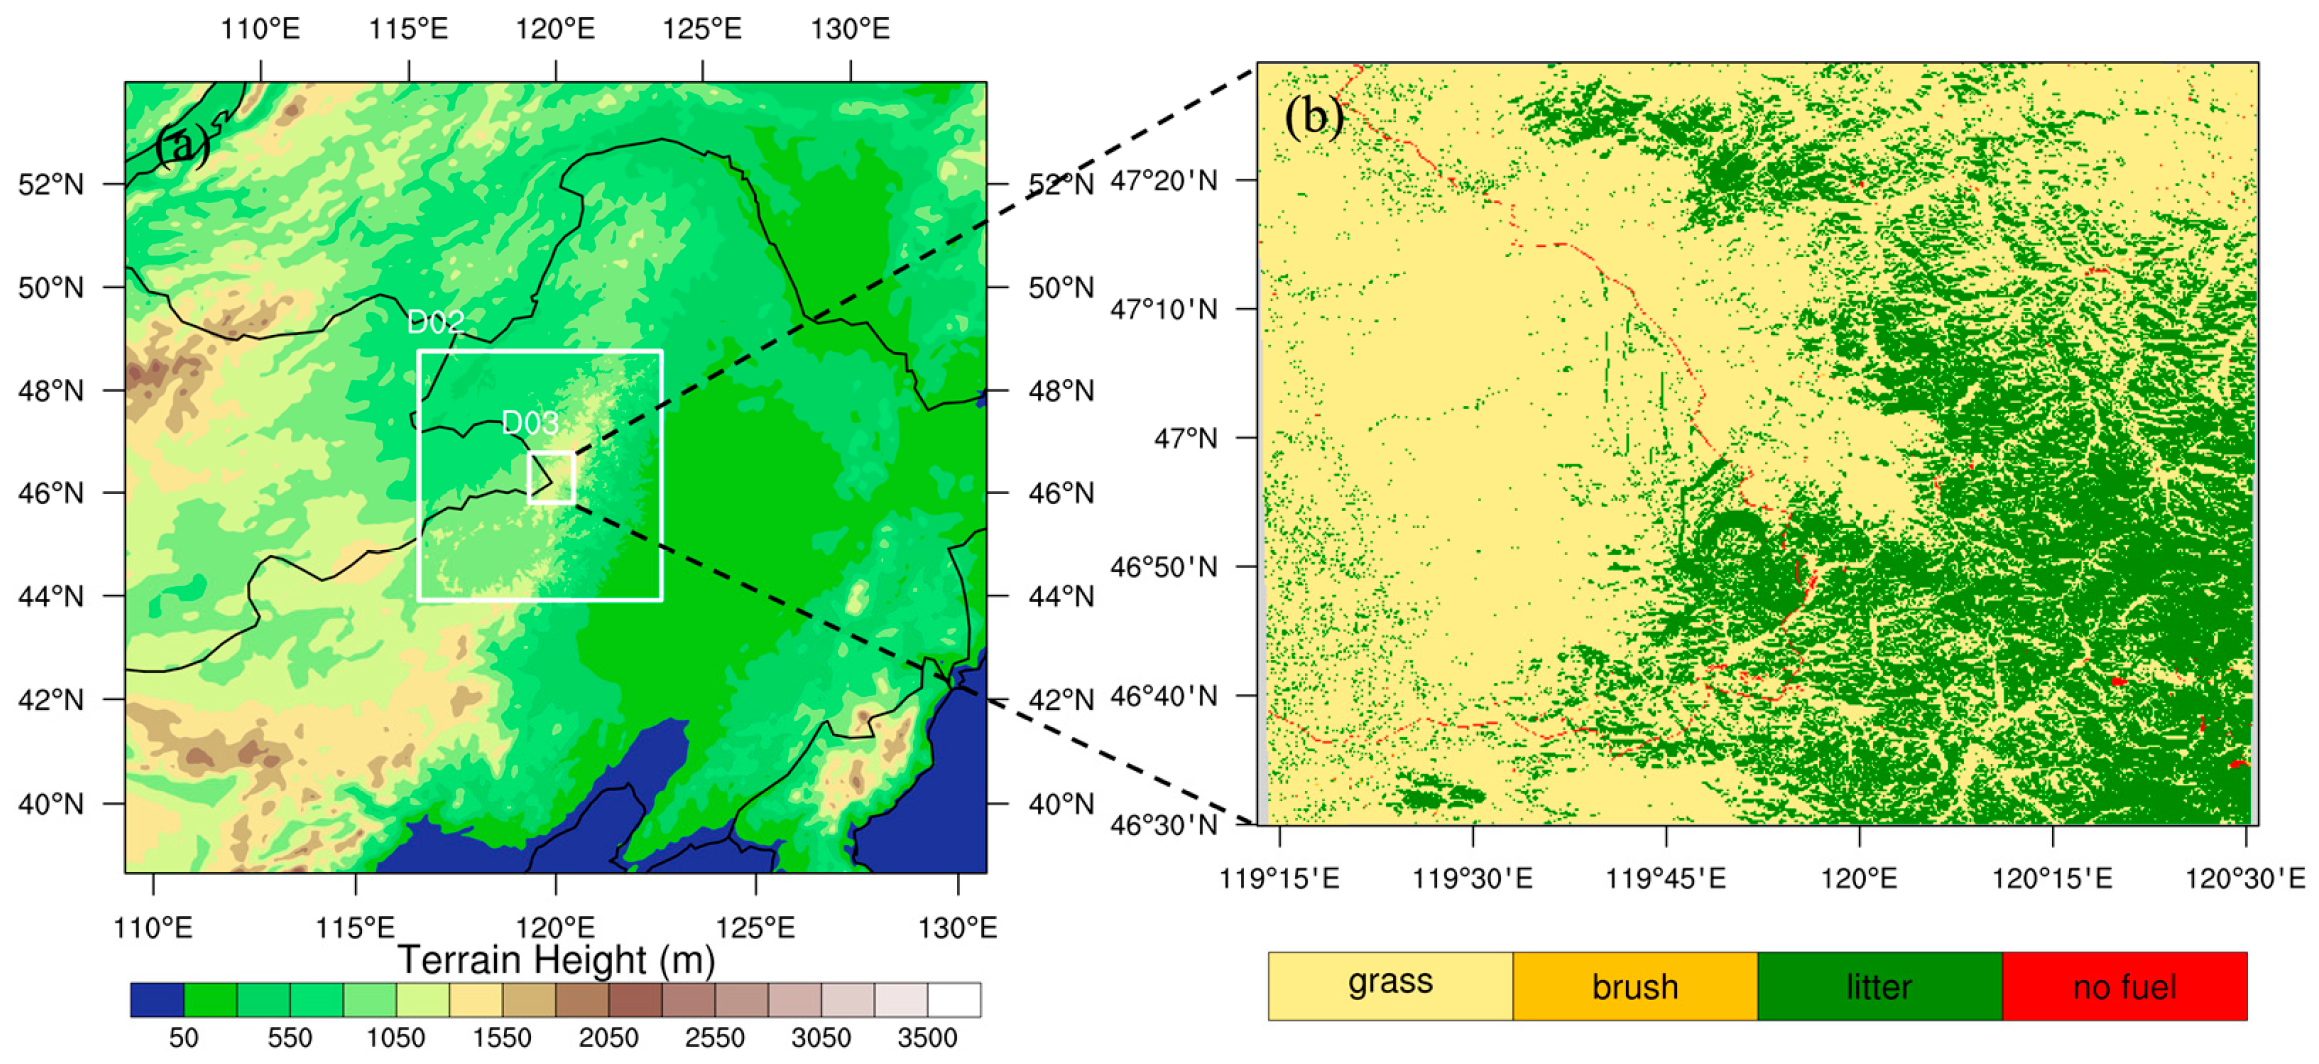
https://www.dess.tsinghua.edu.cn/info/1120/1418.htm, accessed on 1 November 2023). In the innermost domain, the grass species is mainly sheep spear, corresponding to the short grass according to the WRF Anderson classification, while the forest is mainly larch and other tall tree species, which are divided into closed timber litter according to the WRF Anderson classification (Figure 2b); therefore, bare land, water bodies, sand and gravel, factory buildings, etc. are classified as non-combustible substances. Fuel is the material basis of forest fires, and the fuel load and combustibility of different forest types determine the characteristics of forest fire behavior. The WRF-Fire generates fixed values for different fuels from the prescribed table. The primary types of fuel in the innermost domain are short grass and closed timber litter, and it is noted that each fuel load value is the same in each grid.

2.5. Model Detail and Experiment Design

To simulate the interaction between the fire system and atmosphere with the evolution of the fire, the Weather Research and Forecasting (WRF) model with Advanced Research WRF (ARW) dynamic core version 4.1 is used in this study (Skamarock et al., 2008) [22]. In terms of physical options, we use the Contiguous United States (CONUS) physics suite, which includes the following: the Thompson microphysics scheme [23], the Mellor–Yamada–Jancic planetary boundary layer scheme [24], the Noah land surface scheme [25], and the Rapid Radiative Transfer Model longwave and shortwave radiative transfer schemes [26].
Initial and boundary conditions (ICBCs) for the large-scale atmospheric fields, sea surface temperature (SST), and initial soil parameters (i.e., soil water, moisture, and temperature) are given by the ERA5 6-h interval reanalysis data. The model domain is centered at 47° N, 120° E, using 3 nested domains with horizontal grid spacing of 7.5 km (D01), 1.5 km (D02), and 300 m (D03), respectively, as shown in Figure 2a. With respect to the vertical coordinates, 45 terrain-following eta levels from the surface to 50 mb are used. The actual fuel types are derived from the Tsinghua University 30 m resolution land cover data. The simulation period is from 20 May 2009 to 27 May 2009. The model generates a result every 1 h.
Two separate experiments that use the same WRF-Fire setup but differ in their representation of the influence of the fire model are included. The first experiment has the interaction between the atmosphere and fire, referred to as the control run (two-way); the second experiment is carried out by turning off the feedback from the fire model (one-way).
One-way coupled models are essential when studying the effects of forcing on a fire model and atmospheric model in a separate way. The atmosphere-to-fire model provides insight into the influence of atmospheric conditions on fire spread without the need to account for fire feedback to the atmosphere. A two-way coupled model is used to investigate the effects of fire-induced weather on wildland fire behavior.

3. Results

3.1. Validation of the Burned Area

The data obtained using MODIS have characteristics such as long monitoring time, wide spectral range, strong adaptability, and stability, making it one of the most suitable sensors for fire monitoring at present. Taking the burned area from the fire in Mongolia as an example, the two-way simulation of the WRF-Fire can be verified by comparison with the MODIS. Figure 3 shows the burned area from 21 to 26 May 2009 from the MODIS observation and the WRF-Fire simulation. Firstly, it can be seen from the observation that there is no fire point at 0300 UTC on 21 May. Secondly, after 48 h, the fire mainly spread 10 km to the north and south. And finally, the fire continued to spread 30 km to the north and south at 0300 UTC on 26 May while at the same time there were no active fire points. In general, the simulation of the occurrence and development of the fire generated using the WRF-Fire model is in agreement with the MODIS observation of the fire area. The fire initially expands eastward under the influence of the westerly wind, but, due to the influence of the isolation belt, it is not allowed to continue to expand to the east; then, due to the greater influence of the southwest or northeast wind, the fire mainly expands to the north and south.

3.2. The Domain Factors in the Stage of the Fire Spread

The occurrence and spread of fire are closely related to three elements: fuel, meteorological conditions, and topography. Therefore, Figure 4 links the rate of fire spread with wind speed, slope, and fuel type to discuss the role of each factor at different stages in the process of fire spread. The correlation coefficients between fire spread rate and wind speed, and fuel type and terrain height passed the 99% confidence level.
The development of the fire can be divided into four stages according to Figure 4. The first stage is within 20 h of the fire’s ignition, the fuel type is mainly forest, the proportion of grassland is below 20%, and the terrain and wind speed are consistent with the fire spread rate. The second stage is 20–50 h after the fire’s ignition; the proportion of the grassland changes a little; the wind speed and the rate of fire spread demonstrate a positive feedback relationship; at the same time, the terrain and the rate of fire spread present a negative feedback relationship. The third stage is 50–120 h after the fire’s ignition; at this stage, the proportion of grassland increases from 20% to 40%, and the rate of spread rate changes with three peaks. The first largest peak is related to the increase in wind speed and the decrease in terrain height; however, when the wind speed increases to more than 6.4 m/s, the wind speed is so large that the fire spread rate decreases, while the terrain height on the second and third peaks does not change much, indicating that the fire spread rate is related to the increase in wind speed and the proportion of grassland. The fourth stage is 120–133 h after the fire’s ignition. The fire spread rate is a composite of the effects of the following three factors: the wind speed increases to no more than 6.4 m/s, the proportion of grassland exceeds 40%, and the terrain height decreases sharply.

3.3. Simulation Differences between Coupled and Uncoupled Experiments

The heat released by forest fires causes a change in the temperature gradient of the surrounding atmosphere. Under the influence of wind speed, slope, terrain, etc., the fire forms a microclimate inside and outside itself, which would also affect the development of the fire itself. In the case of an area with a complex terrain, the shape of the fire field is extremely irregular, which will make extinguishing the fire particularly difficult. From the results of the two simulation experiments (one-way and two-way) (Figure 5), it can be seen that the fire area and the wind speed in the nesting simulation with feedback is larger than in the one-way nesting (no feedback) simulation, which confirms that a fire in the process of spreading will form an independent system and interacts with the surrounding atmosphere. After about 130 h of fire development, the difference in the fire area between the two groups of experiments can reach 17% (Figure 5b).

3.4. Changes in the Weather Pattern Caused by the Fire

Excluding the fuel from consideration, the speed of forest fire spread is mainly determined by wind and terrain. When the terrain is flat and windless, the fire spreads at a constant speed in all directions, and its shape is approximately circular. When the wind direction is more stable, the spread shape is an ellipse. When the wind direction is unstable, it swings at a small angle, and the spread shape is mostly fan-shaped. When encountering a varied terrain, the fire spreads slowly between the valleys and spreads quickly on the side ridges of the mountains, forming a “V” shape. From the differences in the simulated spatial potential temperature and divergence field of the two sets of experiments (Figure 6), it could be judged that the occurrence of forest fires leads to an increase in the potential temperature and wind speed in the downwind region and finally to the formation of three convergent belts distributed in three different directions.
The most common considerations when assessing fire hazards are surface wind and the accompanying temperature and humidity. It is worth noting that vertical motion also affects wildfires in many different ways. From the difference in the profile of the two groups of experiments, it can be seen that the fire induced an increase in temperature within the first 2 km above the ground (Figure 7a), and the change in buoyancy caused by the energy release near the fire front generated horizontal and vertical movement in the atmosphere, which in turn produced vertical circulation near the front of the fire. In addition, from the difference in vertical velocity in Figure 7b, it can be seen that a relatively strong upward movement occurred within the first 2 km above the surface, but unlike the change in temperature, the height of vertical movement could even reach over 5 km above the ground.

4. Discussion

Reproducing fire–atmosphere interactions using the WRF-Fire model provides an opportunity for fire behavior forecasting in China. The results of these simulations have important implications for fire management; however, these simulations represent only one simple fuel and topography scenario; therefore, the study has certain limitations. Since weather forecasting and fire simulation models are key tools for predicting fire behavior, it is important to optimize the physical parameters and computational efficiency of the weather forecasting models as well as the key parameters in the fire behavior models. A better understanding of fire–atmosphere interactions will help improve the accuracy of fire behavior forecasts.
The use of FROM–GLC surface land cover data to map the fuel present in each domain has an uncertain impact on the accuracy of forecasting fire behavior; therefore, the development of a basic Chinese database of fuels corresponding to the WRF catalogue will promote further simulation and research and improve the business of forecasting fire spread.
Due to the diversity and complexity of and significant regional differences between forest communities, there is significant spatial and temporal variability in fuel load, and the distribution of fuel load is the result of interactions between environmental factors such as meteorology, vegetation, and topography. The impact factor of the fuel load is not only a direct relationship but also an interaction between environmental factors, forming a direct and indirect impact on the fuel load. Climate change is thought to play a dominant role at the regional scale, while vegetation, topography, etc. are thought to play a role at the landscape scale or stand scale. Future research should consider the spatial distribution of the fuel data to better reflect the actual distribution of fuel loads.
Owing to policies regarding management of the environment and seasonal climatic conditions, such as dry, windy days and long sunshine hours in spring and low rainfall in the study area, the vegetation dries out rapidly and the amount of fuel rises sharply, providing sufficient fuel for the development of grassland fires and leading to an increase in wildfire risk. The number and probability of wildfires are greatly increased due to the increase in ritual activities in April, such as the Qingming Festival in China. In autumn, the herdsmen prepare for the winter snow or spring lambing season and cut grass to feed their livestock, and as such there are more frequent field activities, so fires occur more often and more intensively.

5. Conclusions

In this study, we created a coupled fire–atmosphere model using WRF and FIRE. We used the model to simulate the process of a wildfire to examine possible fire–atmosphere interactions at the border of Inner Mongolia in May 2009. Two sets of simulations were performed using high-resolution ERA5 data as the initial and boundary conditions: one experiment with feedback from the fire to the atmosphere, and the other with no feedback. The result shows that the WRF-Fire could accurately reproduce the burned area compared to the MODIS. It should be addressed that from the development stage of fire propagation, wind speed is the main positive feedback factor, but the maximum wind speed cannot exceed 6.4 m/s, and a large change in terrain height and the high proportion of grassland also increase the rate of fire propagation. Compared with the simulation results of one-way coupling, after 130 h of propagation, the fire area reproduced by the coupling mode was increased by 17%. The occurrence of wildfire will change the local circulation around the fire front by releasing sensible heat and latent heat. The energy released by the fire changes the surrounding atmosphere, forming a convergence and divergence zone in the downwind region, resulting in a significant change in the vertical movement of the atmosphere to the potential temperature. The interaction between the fire and atmosphere created longer active fire wings and, therefore, a larger burning area, while vortices caused by the interaction provided mechanisms to increase the intensity of the fire. Understanding these atmospheric features will enhance efforts to predict fire behavior. The results of these simulations suggest that the evolution of fires depends on the atmosphere and ignoring the role of the atmosphere in the evolution of fires could introduce significant errors.

Author Contributions

Conceptualization, Q.Y. and L.Z.; methodology, Y.W.; software, Z.S.; validation, Y.W. and L.S.; formal analysis, Z.W. and Y.W.; investigation, L.S.; resources, Y.W.; data curation, Z.S.; writing—original draft preparation, Y.W. and L.S.; writing—review and editing, Y.W. and L.S.; visualization, Z.S. and Z.W.; supervision, Q.Y. and L.Z.; project administration, Q.Y. and L.Z.; funding acquisition, Q.Y. and L.Z. All authors have read and agreed to the published version of the manuscript.

Funding

This research was funded by the National Key Research and Development Plan, grant number 2022YFC3003004.

Institutional Review Board Statement

Not applicable.

Informed Consent Statement

Not applicable.

Data Availability Statement

ERA5 reanalysis products are available from the Climate Data Store, (https://cds.climate.copernicus.eu/cdsapp#!/dataset/reanalysis-era5-land-monthly-means?tab=form accessed on 17 November 2023). The fire burned area is available from the website https://modis.gsfc.nasa.gov/data/, accessed on 1 November 2023.

Acknowledgments

Simulations were run on the supercomputer of Beijing Super Cloud Computing Center; fuel type data were derived from the FROM–GLC of Tsinghua University.

Conflicts of Interest

The authors declare no conflict of interest.

References

  1. Running, S.W. Is Global Warming Causing More, Larger Wildfires? Science 2006, 313, 927–928. [Google Scholar] [CrossRef] [PubMed]
  2. Abatzoglou, J.T.; Williams, A.P. Impact of Anthropogenic Climate Change on Wildfire across Western US Forests. Proc. Natl. Acad. Sci. USA 2016, 113, 11770–11775. [Google Scholar] [CrossRef] [PubMed]
  3. Richardson, D.; Black, A.S.; Irving, D.; Matear, R.J.; Monselesan, D.P.; Risbey, J.S.; Squire, D.T.; Tozer, C.R. Global Increase in Wildfire Potential from Compound Fire Weather and Drought. NPJ Clim. Atmos. Sci. 2022, 5, 23. [Google Scholar] [CrossRef]
  4. Senande-Rivera, M.; Insua-Costa, D.; Miguez-Macho, G. Spatial and Temporal Expansion of Global Wildland Fire Activity in Response to Climate Change. Nat. Commun. 2022, 13, 1208. [Google Scholar] [CrossRef]
  5. Linn, R.R. Numerical Simulations of Grass Fires Using a Coupled Atmosphere–Fire Model: Basic Fire Behavior and Dependence on Wind Speed. J. Geophys. Res. 2005, 110, D13107. [Google Scholar] [CrossRef]
  6. Bessie, W.C.; Johnson, E.A. The Relative Importance of Fuels and Weather on Fire Behavior in Subalpine Forests. Ecology 1995, 76, 747–762. [Google Scholar] [CrossRef]
  7. Linn, R.; Reisner, J.; Colman, J.J.; Winterkamp, J. Studying Wildfire Behavior Using FIRETEC. Int. J. Wildland Fire 2002, 11, 233. [Google Scholar] [CrossRef]
  8. Mueller, E.V.; Skowronski, N.; Clark, K.; Gallagher, M.; Kremens, R.; Thomas, J.C.; El Houssami, M.; Filkov, A.; Hadden, R.M.; Mell, W.; et al. Utilization of Remote Sensing Techniques for the Quantification of Fire Behavior in Two Pine Stands. Fire Saf. J. 2017, 91, 845–854. [Google Scholar] [CrossRef]
  9. Simpson, C.C.; Sharples, J.J.; Evans, J.P. Resolving Vorticity-Driven Lateral Fire Spread Using the WRF-Fire Coupled Atmosphere–Fire Numerical Model. Nat. Hazards Earth Syst. Sci. 2014, 14, 2359–2371. [Google Scholar] [CrossRef]
  10. Simpson, C.C.; Sharples, J.J.; Evans, J.P. Sensitivity of Atypical Lateral Fire Spread to Wind and Slope. Geophys. Res. Lett. 2016, 43, 1744–1751. [Google Scholar] [CrossRef]
  11. Clark, T.; Jenkins, M.A.; Coen, J.; Packham, D. A Coupled Atmospheric-Fire Model: Convective Feedback on Fire-Line Dynamics. J. Appl. Meteorol. Climatol. 1996, 35, 875–901. [Google Scholar] [CrossRef]
  12. Clark, T.L. Numerical Simulations of Grassland Fires in the Northern Territory, Australia: A New Subgrid-Scale Fire Parameterization. J. Geophys. Res. 2003, 108, 4589. [Google Scholar] [CrossRef]
  13. Clark, T.L.; Coen, J.; Latham, D. Description of a Coupled Atmosphere—Fire Model. Int. J. Wildland Fire 2004, 13, 49. [Google Scholar] [CrossRef]
  14. Mell, W.; Maranghides, A.; McDermott, R.; Manzello, S.L. Numerical Simulation and Experiments of Burning Douglas Fir Trees. Combust. Flame 2009, 156, 2023–2041. [Google Scholar] [CrossRef]
  15. Filippi, J.B.; Bosseur, F.; Mari, C.; Lac, C.; Le Moigne, P.; Cuenot, B.; Veynante, D.; Cariolle, D.; Balbi, J.-H. Coupled Atmosphere–Wildland Fire Modelling. J. Adv. Model. Earth Syst. 2009, 2, 11. [Google Scholar] [CrossRef]
  16. Coen, J.L.; Cameron, M.; Michalakes, J.; Patton, E.G.; Riggan, P.J.; Yedinak, K.M. WRF-Fire: Coupled Weather–Wildland Fire Modeling with the Weather Research and Forecasting Model. J. Appl. Meteorol. Climatol. 2013, 52, 16–38. [Google Scholar] [CrossRef]
  17. Michael, Y.; Kozokaro, G.; Brenner, S.; Lensky, I.M. Improving WRF-Fire Wildfire Simulation Accuracy Using SAR and Time Series of Satellite-Based Vegetation Indices. Remote Sens. 2022, 14, 2941. [Google Scholar] [CrossRef]
  18. Shamsaei, K.; Juliano, T.W.; Roberts, M.; Ebrahimian, H.; Kosovic, B.; Lareau, N.P.; Taciroglu, E. Coupled Fire-Atmosphere Simulation of the 2018 Camp Fire Using WRF-Fire. Int. J. Wildland Fire 2023, 32, 195–221. [Google Scholar] [CrossRef]
  19. Lai, S.; Chen, H.; He, F.; Wu, W. Sensitivity Experiments of the Local Wildland Fire with WRF-Fire Module. Asia-Pacific J. Atmos. Sci. 2020, 56, 533–547. [Google Scholar] [CrossRef]
  20. Mandel, J.; Beezley, J.D.; Kochanski, A.K. Coupled Atmosphere-Wildland Fire Modeling with WRF 3.3 and SFIRE 2011. Geosci. Model. Dev. 2011, 4, 591–610. [Google Scholar] [CrossRef]
  21. DeCastro, A.L.; Juliano, T.W.; Kosović, B.; Ebrahimian, H.; Balch, J.K. A Computationally Efficient Method for Updating Fuel Inputs for Wildfire Behavior Models Using Sentinel Imagery and Random Forest Classification. Remote Sens. 2022, 14, 1447. [Google Scholar] [CrossRef]
  22. Skamarock, W.C.; Klemp, J.B.; Dudhia, J.; Gill, D.O.; Liu, Z.; Berner, J.; Wang, W.; Powers, J.G.; Duda, M.G.; Barker, D.M.; et al. A Description of the Advanced Research WRF Model Version 4.1. NCAR Tech. Notes 2021, 162. [Google Scholar] [CrossRef]
  23. Thompson, G.; Rasmussen, R.M.; Manning, K. Explicit Forecasts of Winter Precipitation Using an Improved Bulk Microphysics Scheme. Part I: Description and Sensitivity Analysis. Mon. Wea. Rev. 2004, 132, 519–542. [Google Scholar] [CrossRef]
  24. Mellor, G.L.; Yamada, T. Development of a Turbulence Closure Model for Geophysical Fluid Problems. Rev. Geophys. 1982, 20, 851. [Google Scholar] [CrossRef]
  25. Campbell, P.C.; Bash, J.O.; Spero, T.L. Updates to the Noah Land Surface Model in WRF-CMAQ to Improve Simulated Meteorology, Air Quality, and Deposition. J. Adv. Model. Earth Syst. 2019, 11, 231–256. [Google Scholar] [CrossRef] [PubMed]
  26. Iacono, M.J.; Delamere, J.S.; Mlawer, E.J.; Shephard, M.W.; Clough, S.A.; Collins, W.D. Radiative Forcing by Long-Lived Greenhouse Gases: Calculations with the AER Radiative Transfer Models. J. Geophys. Res. 2008, 113, D13103. [Google Scholar] [CrossRef]
Figure 1. Relative humidity and wind speed at 10 m above ground from the NCEP at (a) 12 UTC (20:00 LST) 21 May 2009—the white box is the study area; (b) 12 UTC (20:00 LST) 22 May 2009; (c) 12 UTC (20:00 LST) 23 May 2009; (d) 12 UTC (20:00 LST) 24 May 2009.
Fire 06 00443 g001
Figure 2. (a) Domain 1 (7.5 km grid spacing) with boxes marking the locations of domain 2 (1.5 km grid spacing; D02) and domain 3 (300 m grid spacing; D03). (b) Fuel distribution in domain 3 (30 m grid spacing; red line is the separation zone).
Fire 06 00443 g002
Figure 3. MODIS 7, 6, 5 band synthetic image (a) 0330 UTC 21; (b) 0320 UTC 23; (c) 0350 UTC 26 (dark red area: burned area). Simulated fire area and wind field: (d) 0400 UTC 22; (e) 0400 UTC 23; (f) 0400 UTC 26 (the shaded contour is the terrain height).
Fire 06 00443 g003
Figure 4. (a) The rate of spread at fire front (black line), terrain height (red line), wind speed (blue line) for each hour from 00 UTC (08:00 LST) 21 May 2009 to 00 UTC 27 May 2009; the dotted lines are the dividing lines between the different stages. (b) The rate of spread at fire front (black line), grass percentage (red line), and slope (blue line) for each hour from 00 UTC (08:00 LST) 21 May 2009 to 00 UTC 27 May 2009.
Fire 06 00443 g004
Figure 5. (a) The rate of spread in coupled simulation (black line) and uncoupled simulation (blue line) for each hour from 00 UTC (08:00 LST) 21 May 2009 to 00 UTC 27 May 2009; the dotted line is the turning point impacted by the wind speed. (b) Same as (a) but for burned area; (c) same as (a) but for wind speed.
Fire 06 00443 g005
Figure 6. The difference between coupled and uncoupled simulation for domain 3 at 23:00 local standard time. (a) The spatial distribution of the potential temperature (unit: °C) and horizontal wind (unit: m/s) at 10 m above the ground. Vectors represent the horizontal wind (unit: m/s) at 10 m; the contour is the potential temperature; gray line marks the separation zone. (b) The contour is the divergence (s–1) (the green line is the cross line used by Figure 7).
Fire 06 00443 g006
Figure 7. The differences between coupled and uncoupled simulation of domain 3 at UTC 15:00 (23:00 local standard time). (a) Cross section of the potential temperature (unit: °C) along the green line in Figure 6b. (b) Cross section of the vertical component of velocity (unit: m/s) along the green line in Figure 6b.
Fire 06 00443 g007
Disclaimer/Publisher’s Note: The statements, opinions and data contained in all publications are solely those of the individual author(s) and contributor(s) and not of MDPI and/or the editor(s). MDPI and/or the editor(s) disclaim responsibility for any injury to people or property resulting from any ideas, methods, instructions or products referred to in the content.

